tree growth dynamics, fire history, and fire-climate...
TRANSCRIPT

Tree Growth Dynamics, Fire History, and Fire-Climate Relationships in Pine
Rocklands of the Florida Keys, U.S.A.
A Dissertation
Presented for the
Doctor of Philosophy
Degree
The University of Tennessee, Knoxville
Grant Logan Harley
May 2012

ii
Copyright © 2012 by Grant L. Harley
All rights reserved.

iii
DEDICATION
This dissertation is dedicated to my wife, Mandi, for her unconditional love and
support; to my parents for instilling in me a strong work ethic and commitment to my
passion; and to my friends for their love, support, and humor.

iv
ACKNOWLEDGEMENTS
I want to thank my advisor, Henri D. Grissino-Mayer, for his guidance and
support during the pursuit of my degree. After coming to the University of Tennessee
in 2008, I was excited to work with Dr. Grissino-Mayer because of his scientific integrity
and his passion for the natural environment. I am thankful for each day spent in the
Laboratory of Tree-Ring Science and for the many opportunities that were presented to
me during my graduate tenure. I also want to thank my dissertation committee
members, Sally Horn, Carol Harden, and Jennifer Franklin, for their encouragement
and guidance.
My dissertation research in the Florida Keys developed out of work on sediment
records of fire and vegetation history initiated by Sally Horn and Chris Bergh of The
Nature Conservancy (TNC), and funded by the United States Fish and Wildlife Service
(USFWS) and TNC. In 2009, Sally Horn and Henri Grissino-Mayer received a second
grant from the USFWS for tree-ring as well as sediment sampling that funded my initial
collection and preparation of increment cores and cross-sections. In 2010, I was
awarded a National Science Foundation Doctoral Dissertation Research Improvement
Grant (BCS-1002479 to G. Harley and H. Grissino-Mayer). This grant, together with
support from the University of Tennessee NSF GK-12 Earth Project (DGE-0538420),
funded the rest of my field and laboratory analyses. Additional support for my
dissertation work was provided by the Department of Geography and by a Yates

v
Dissertation Fellowship from the Graduate School at the University of Tennessee. I
gratefully acknowledge the support provided by these organizations.
I am grateful also for my colleagues and support group in the Laboratory of
Tree-Ring Science: Lisa La Forest, John Sakulich, Mark Spond, Monica Rother, Christine
Biermann, Ian Feathers, Nancy Li, Sarah Jones, Niki Garland, Alex Pilote, Alex Dye,
Dorothy Rosene, and Dr. Nesibe Kose (University of Istanbul). For assistance in the
field, I thank John Sakulich, Desiree Kocis, Douglas Heruska, Joshua Albritton, Rebecca
Stratton, Kody Honeyman, Ann McGhee, Niki Garland, and Alex Pilote. For laboratory
assistance, I thank Kody Honeyman, Joshua Turner, and Christopher Petruccelli. Chad
Anderson provided valuable assistance with data collection in the National Key Deer
Refuge, and Anne Morkill, Dana Cohen, and Chad Anderson provided access to the
refuge. I thank Chris Bergh of The Nature Conservancy for sharing fire-scarred tree
samples that improved this research. I thank Jennifer Adams at the National Park
Service for providing climate data for the Florida Keys region.

vi
ABSTRACT
Pine rocklands are globally endangered, fire-maintained communities currently
restricted to small habitat areas in southern Florida, Cuba, and the Bahamas. The
purpose of this dissertation research was to identify the long-term ecological
disturbance regimes and climatic trends responsible for the persistence of pine
rocklands, and examine how human-induced changes during the 20th century
contributed to decline of these communities. This research applied techniques of
dendrochronology in extreme southern Florida, in a subtropical region where tree‐ring
science has never been applied, to increase the understanding of how anthropogenic
and natural disturbance events have decreased the spatial distribution of South Florida
slash pine (Pinus elliottii Engelm. var. densa Little and Dorman; hereafter slash pine), the
foundation species of pine rocklands.
To investigate the complex dynamics of declining pine rockland communities, I
analyzed (1) the dendrochronological potential and climate response of slash pine, (2)
the intra-annual ring formation characteristics and relationships to monthly climatic
conditions, (3) the influence of historical fire regimes and varied fire management
practices since the 1950s on the structure of slash pine savannas on adjacent islands in
the Lower Florida Keys, and (4) the control of global-scale oceanic/atmospheric
oscillations on historical wildfire occurrence.

vii
The analyses presented here demonstrate that slash pine forms anatomically
distinct, annual growth rings with the consistent year-to-year variability necessary for
rigorous dendrochronological studies. Annual radial growth of slash pine is primarily
influenced by water availability during the growing season; however intra-annual
cellular growth is driven by daily insolation. In the Lower Florida Keys, the growing
season of slash pine occurs between February and November, with trees experiencing
dormancy between November and January. Reconstructions of fire history and savanna
structure revealed that, over the past 150 years, frequent fires occurring every ca. 6 years
promoted pine recruitment and ensured the persistence of pine rockland habitat.
However, the recent lack of fire in some areas could result in the loss of pine rockland
habitat, as pine savannas are currently succeeding to tropical hardwood hammock.
Over the past several centuries, interacting effects of two Pacific climatic forcing
mechanisms (El Niño-Southern Oscillation, Pacific Decadal Oscillation) drove wildfire
occurrence in the Lower Florida Keys.

viii
TABLE OF CONTENTS
Chapter Page
1. Introduction ............................................................................................................... 2
1.1 Purpose......................................................................................................... 2
1.2 Pine rocklands ............................................................................................. 3
1.3 Ecology of pine rockland savannas ........................................................... 4
1.3.1 Fire regimes in pine rocklands ................................................................. 8
1.3.1.1 Fire season ......................................................................................... 8
1.3.1.2 Fire frequency ................................................................................. 11
1.3.1.3 Fire ecology ..................................................................................... 13
1.4 Dendrochronology in the subtropics and tropics ................................... 16
1.5 Motivation for the research ...................................................................... 18
1.6 Objectives ................................................................................................... 20
1.7 Organization of the dissertation............................................................... 21
References .................................................................................................. 24
2. The Dendrochronology of Pinus elliottii in the Lower Florida Keys:
Chronology Development and Climate Response ............................................. 28
2.1 Abstract ...................................................................................................... 29
2.2 Introduction ............................................................................................... 30
2.2.1 Previous research on South Florida slash pine .................................. 33
2.3 Materials and methods ............................................................................. 36
2.3.1 Study area ................................................................................................... 36
2.3.2 Sampling design........................................................................................ 37
2.3.3 Laboratory methods ................................................................................. 40
2.3.4 Influences of regional climate on tree growth .................................... 41
2.3.5 Response function and correlation analysis ....................................... 43
2.4 Results ........................................................................................................ 44
2.4.1 Growth ring anatomy of slash pine ...................................................... 44
2.4.2 Annual ring assessment and chronology development ................... 45
2.4.3 Influence of climatic variables on tree growth ................................... 49
2.5 Discussion .................................................................................................. 52
2.6 Conclusions ................................................................................................ 55
2.7 Acknowledgements ................................................................................... 56
References .................................................................................................. 58

ix
3. Cambial Activity of Pinus elliottii var. densa Reveals Influence of
Seasonal Insolation on Growth Dynamics in the Florida Keys ....................... 63
3.1 Abstract ...................................................................................................... 64
3.2 Introduction ............................................................................................... 65
3.3 Methods...................................................................................................... 69
3.3.1 Ecological setting ...................................................................................... 69
3.3.2 Micro-core sampling and preparation ................................................. 71
3.2.3 Cell analysis ............................................................................................... 72
3.2.4 Cell standardization ................................................................................. 74
3.2.5 Cell production-climate relationships .................................................. 75
3.3 Results ........................................................................................................ 76
3.3.1 Intra-annual cambial activity ................................................................. 76
3.3.2 Association between cambial activity and climatic factors ............. 81
3.4 Discussion .................................................................................................. 84
3.5 Conclusions ................................................................................................ 89
3.6 Acknowledgments .................................................................................... 90
References .................................................................................................. 91
4. Effects of Historical Fire on Structure of Globally Endangered Pine
Rockland Ecosystems in the Florida Keys ........................................................... 96
4.1 Abstract ...................................................................................................... 97
4.2 Introduction ............................................................................................... 98
4.3. Methods ................................................................................................... 102
4.3.1 Study Sites ................................................................................................ 102
4.3.2 Fire history ............................................................................................... 105
4.3.3 Stand structure ........................................................................................ 106
4.4 Results ...................................................................................................... 108
4.4.1 Fire history at Boneyard Ridge ............................................................ 108
4.4.2 Stand structure at Boneyard Ridge ..................................................... 110
4.4.3 Fire history at No Name Key ............................................................... 116
4.4.4 Stand structure at No Name Key ........................................................ 118
4.5 Discussion ................................................................................................ 119
4.5.1 Historical fire regimes of the LFK ....................................................... 119
4.5.2 Influence of fire on savanna structure ................................................ 122
4.6 Conclusions .............................................................................................. 125
4.7 Acknowledgements ................................................................................. 127
References ................................................................................................ 128

x
5. Pacific Climate Forcing of Historical Fire Regimes in an Endangered
Subtropical Ecosystem of the Florida Keys ....................................................... 135
5.1 Abstract .................................................................................................... 136
5.2 Introduction ............................................................................................. 137
5.3 Methods.................................................................................................... 141
5.3.1 Study Area................................................................................................ 141
5.3.2 Fire history ............................................................................................... 142
5.3.3 Fire-climate relationships ...................................................................... 146
5.4 Results ...................................................................................................... 149
5.4.1 Fire history ............................................................................................... 149
5.4.2 Fire-climate relationships ...................................................................... 151
5.5 Discussion ................................................................................................ 151
5.5.1 What were the characteristics of the fire regime on BPK? ............. 151
5.5.2 Did the historical fire regime change in the 20th century? ............. 156
5.5.3 What are the effects of ENSO and PDO on fires in the
Florida Keys? ..................................................................................................... 157
5.5 Conclusions .............................................................................................. 159
5.6 Acknowledgements ................................................................................. 160
References ................................................................................................ 161
6. Summary and Conclusions .................................................................................. 167
6.1 Recommendations for future research .................................................. 172
6.2 Conceptual ecological model and desired future conditions .............. 173
References ................................................................................................ 176
Appendices........................................................................................................................... 177
Appendix 1. COFECHA program output for Boneyard Ridge site
chronology, Big Pine Key, Lower Florida Keys. .......................................... 178
Appendix 2. COFECHA program output for No Name Key site
chronology, No Name Key, lower Florida Keys. ......................................... 196
Appendix 3. COFECHA program output for North Big Pine Key site
chronology, Big Pine Key, lower Florida Keys. ........................................... 208
Appendix 4. COFECHA program output for Terrestris Preserve site
chronology, Big Pine Key, lower Florida Keys. ........................................... 223
VITA ...................................................................................................................................... 232

xi
LIST OF TABLES
Table 1.1. Description of pine rockland successional (seral) stages .....................................7
Table 2.1. Ring count results for NBP samples. ................................................................... 46
Table 2.2. Descriptive statistics from COFECHA ................................................................ 50
Table 3.1. Parameters of principal component analysis and Pearson correlations. .......... 82
Table 4.1. Statistical characteristics of composite fire return intervals ............................ 111
Table 4.2. Composite fire return interval statistics ............................................................ 112
Table 4.3. Structural measures of slash pine trees ............................................................. 113
Table 5.1. Site characteristics on Big Pine Key, Florida Keys, USA.................................. 147
Table 5.2. Composite fire interval statistics for Big Pine Key ........................................... 152
Table 5.3. Composite fire statistics for settlement and fire-management periods .......... 153

xii
LIST OF FIGURES
Figure 1.1. Conceptual ecological model for pine rocklands. ............................................... 6
Figure 2.1. Current distribution of pine rocklands. ............................................................. 38
Figure 2.2. Monthly mean temperature (line) and monthly total precipitation (bars)
for Florida Climate Division 7 for the period 1895–2009. ................................ 39
Figure 2.3. Annual growth rings in slash pine. .................................................................... 47
Figure 2.4. ARSTAN chronology and sample depth for slash pine. .................................. 48
Figure 2.5. Annual growth response for the NBP chronology ........................................... 51
Figure 3.1. Map of current pine rockland distribution and study site location ................ 70
Figure 3.2. Climograph recorded by the USFWS weather station on Big Pine Key. ........ 73
Figure 3.3. Transverse sections of samples under visible light microscopy...................... 77
Figure 3.5. Temporal variations of cambial activity. ........................................................... 79
Figure 3.6. Pearson product-moment correlations between PC1 (n = 6 trees) and
climate parameters .............................................................................................. 83
Figure 3.7. Visual correspondence between climate parameters and IADFs .................... 85
Figure 4.1. Map of study site locations and current distribution of pine rocklands ...... 103
Figure 4.2. Fire history and age structure for No Name Key and Boneyard Ridge ....... 109
Figure 4.3. Size class distributions of live and dead slash pine trees ............................... 114
Figure 4.4. Decay class distributions for coarse wood debris. .......................................... 115
Figure 4.5. Diameter-age relationships for all trees cored ................................................ 117
Figure 4.6. Photographs showing differences in understory density. ............................. 124
Figure 5.1. Map of study site locations. .............................................................................. 143
Figure 5.2. Climograph for Big Pine Key from 1895 to 2010............................................. 144
Figure 5.3. Fire history chart for the four study sites in the NKDR ................................. 150
Figure 5.4. Superposed epoch analysis during years containing a widespread fire
that scarred ≥ 50% of recorder trees from all four sites. ................................. 154
Figure 6.1. Revised conceptual ecological model for pine rocklands .............................. 174

1
Chapter 1
Introduction

2
Chapter 1
Introduction
1.1 Purpose
The purpose of this dissertation research was to investigate the structure and fire
disturbance history of declining pine rockland communities in the Lower Florida Keys.
The ecological and climatological factors contributing to the distribution of South
Florida slash pine (Pinus elliottii Engelm. var. densa Little and Dorman; hereafter slash
pine) at the southern extent of its range were also examined because slash pine is the
foundation species of endangered pine rockland communities. Information generated
by this research will aid local and regional officials in efforts to maintain pine rocklands
in South Florida, where fire suppression and urbanization have led to widespread
succession from pine rockland communities to tropical hardwood hammock.
Additionally, I examined the interactions between climate mechanisms (e.g. El Niño-
Southern Oscillation and Pacific Decadal Oscillation) and wildfire, and determined how
these interactions affected the current distribution of pine rocklands. An interest in the
vegetation history and structure of pine rockland communities by local officials, along
with the need to understand how slash pine responds to regional variations in climate,
serve as the impetus for this research.
Pine rockland communities are globally endangered (Noss et al. 1995). These
communities are fire-maintained and provide important habitats for several federal and

3
state-listed endangered species, such as the Key deer (Odocoileus virginianus clavium
Barbour and Allen) and Florida leafwing butterfly (Anaea troglodyta floridalis Johnson &
Comstock). The following research increases the understanding of how anthropogenic
and natural disturbance events have decreased the distribution of slash pine, the
foundation species of pine rockland communities. This research is novel because it
applies techniques of dendrochronology in southern Florida, which is located in a
subtropical region where tree-ring science has never been applied. This research
produces climate proxy datasets that add to the growing global network of low-latitude
climate proxy data.
1.2 Pine rocklands
Pine rockland vegetation communities contain savanna-like structure and are
located on karstic areas where thin to nonexistent soils overlie limestone substrate in
southern Florida, Cuba, and The Bahamas. In the United States, these communities are
unique to three areas in South Florida: Everglades National Park, Big Cypress National
Preserve, and the Lower Florida Keys (Snyder et al. 1990). Pine rocklands are
characterized by a single canopy species, slash pine, a diverse subcanopy of West
Indian hardwoods and palms, and a variety of endemic herbs (Sah et al. 2004). Pine
rocklands once covered a vast contiguous area of South Florida of over 75,000 ha, but
fire suppression and agricultural and residential development during the 20th century
have fragmented and reduced the original range by 90% (Doren et al. 1993, O’Brien

4
1998). Hence, these vegetation communities are considered globally endangered (Noss
et al. 1995).
Slash pine is the foundation species in pine rockland communities. In the Lower
Florida Keys, pine rocklands provide an important habitat for several federal and state
listed endangered species, including the Key deer (Odocoileus virginianus clavium),
Kirtland’s warbler (Dendroica kirtlandii Baird), Florida atala butterfly (Eumaus atala
Aloy), and Florida leafwing butterfly (Anaea troglodyta floridalis) (Snyder et al. 1990).
Frequent burning maintains food resources for Key deer and prevents succession of
pine rocklands to tropical hardwood hammocks. However, urbanization and fire
suppression during the 20th century have led to widespread loss of habitat.
1.3 Ecology of pine rockland savannas
Fire is an important process in pine rocklands as it prevents the invasion of
hardwoods, maintains the presence of endemic herbs, and ensures the continuance of
Key deer habitat (Robertson 1953; Alexander 1967; Wade et al. 1980; Snyder et al. 1990).
Wildfires have been suppressed as a fire management practice in the Lower Florida
Keys since the 1950s (Bergh and Wisby 1996), and some disagreement exists regarding
the natural fire regime in these communities. Most studies have suggested that pine
rocklands experienced low-intensity surface fires about once every decade (Craighead
1971; Wade et al. 1980; Snyder 1986). However, Snyder et al. (1990) argued that surface
fires occurred within the range of once every 3 to 7 years, the maximum of which is in

5
agreement with the 8-year fire interval argued by Taylor (1981). Low-intensity/severity
fires early in the growing season promote height growth in slash pine seedlings, and
encourage recruitment to canopy. These fires also synchronize the flowering of many
herbaceous plants. Frequent fire tends to discourage broadleaved woody vegetation
and favors a rich assortment of plant life on the savanna floor, including nitrogen-fixing
legumes, low shrubs, and soil organisms (Landers and Boyer 1999).
Microscopic and macroscopic charcoal fragments in sediment cores from small
ponds in the Florida Keys demonstrate repeated fire during the late Holocene (Albritton
2009, Kocis 2012, Horn unpublished data). High percentages of pine pollen at Key Deer
Pond (Albritton 2009), and macroscopic charcoal identified as pine charcoal at Blue
Hole Wetland (Horn unpublished data), demonstrate a long relationship between fire and
pines in the Florida Keys.
Myers (2010) provided a conceptual ecological model for pine rocklands in the
NKDR that included three seral, or successional, stages: early-seral, mid-seral, and late-
seral (Figure 1.1). In this model, each seral stage represents the degree of change in
vegetation structure, development, or composition in the absence of fire. Myers (2010)
classified each stage based on differences in fire frequency, mid-story vegetation cover
and height, herbaceous layer abundance and diversity, pine regeneration, and duff
layer (Table 1.1). Although the conceptual ecological model presented by Myers (2010)

6
Figure 1.1. Conceptual ecological model for pine rockland ecosystems in the National
Key Deer Refuge, Lower Florida Keys (redrawn from Myers 2010).

7
Table 1.1. Description of the successional (seral) stages identified for pine rockland
ecosystems in the National Key Deer Refuge, Lower Florida Keys (from Myers 2010).
Stage Description
Early-seral
Mid-seral
Late-seral
Minimal mid-story (shrub layer). Woody shrubs compose >20%
cover; average shrub height >1.6 m; highly diverse herbaceous layer
(<20 species). Palm species present but widely scattered with some
regeneration. Pine stands are open and multi-aged with density and
age structure that vary widely; scattered pine regeneration of varying
density primarily in gaps and other open areas. Little or no duff
accumulation. Fire regime: frequent 3–7 years; low intensity/low
severity surface fires; variability in season of burn.
Woody shrubs and palms compose between 20–80% cover; average
shrub/palm height 1.6–3 m. Pine stands open and multi-aged with
limited regeneration. Duff accumulating. Fire history: unburned for
more than 7 years, but less than 15 years. Probably can be maintained
with a fire return interval of 7–15 years, but may require a return to
early-seral stage through a period of frequent burning, especially if
the interval has been in the upper end of that range for an extended
period.
Tall broadleaf and palm component compose >80% cover; average
shrub/palm height 2–3 m. Lower diversity ground cover than early-
and mid-seral stages. Not sufficient pine regeneration to replace older
trees; pine regeneration might be lacking altogether. Most herbaceous
species will be absent. Little exposed rock. A transitional stage
hammock. Fire history: unburned for more than 15 years. There is
probably not a fire regime that can maintain the late-seral stage with
pine at a particular place on the landscape. To maintain this stage in
the landscape, the site would need to return to an earlier successional
stage to allow pine establishment (i.e. to have this stage always
present, it may need to move around the landscape).

8
is important for deciding desired future conditions in NKDR, fire return intervals were
not based on quantitative fire history or stand structure data.
Dendroecological techniques can be used to provide accurate information
regarding the disturbance history during the development of a stand, including the
spatial and temporal variability of past fires (Abrams et al. 1997; Druckenbrod 2005).
Since the inception of the National Key Deer Refuge on Big Pine Key in 1957, prescribed
burning has been applied inconsistently (Bergh and Wisby 1996). This has resulted in a
variety of stand structures in various stages of development (Sah et al. 2004). To my
knowledge, no published study has applied techniques of dendroecology in the Lower
Florida Keys; hence, the age structure and patterns of tree growth related to fire
disturbance events are unknown and the natural fire regime prior to the 1950s is
unclear due to a lack of historic documentation or high-resolution, tree-ring based
reconstructions of past fire.
1.3.1 Fire regimes in pine rocklands
1.3.1.1 Fire season
The wet/lightning season in South Florida exists between the months of May and
October. In the Lower Keys, convective thunderstorms are most common during this
period, with an average peak of 14.5 thunderstorm days in August (Bergh and Wisby
1996). Taylor (1981) found that in Everglades National Park, lightning-caused fires

9
burned the greatest number of acres in May, June, and July, when convective
thunderstorms were most common, yet standing water and fuel moisture content were
still low due to evaporation.
On average, the Lower Keys receive less precipitation than mainland Florida.
During the period 1895–2009, average annual precipitation was 990 mm for the Lower
Keys and 1397 mm for the South Florida mainland (NCDC 2009). As a result, lower fuel
production may result in both a slower rate of hardwood succession (Alexander and
Dickson 1972) and longer fire return interval (Snyder et al. 1990). Karl et al. (1983)
reported that extreme to severe droughts (Palmer Drought Severity Index and Palmer
Hydrological Drought Index values < –3) affected both the Lower Keys and Everglades
in 1971 and 1974/1975. These droughts corresponded to extreme fire years in the
Everglades (Taylor 1981) but did not have the same effect in the Lower Keys (see Bergh
and Wisby 1996). It is possible that the differences in acreage burned per fire season
between the Lower Keys and the Everglades were due to the fragmented condition and
sparse distribution (limited area) of slash pine forests on islands of the Lower Keys.
The only long-term weather data readily available for the Lower Keys region are
collected at Key West. This is a problem because precipitation varies greatly from the
southern portion of peninsular Florida to Key West. Hence, not all storms recorded at
Key West are experienced on other islands, and an individual storm often affects areas
of a particular island differently, especially on large islands such as Big Pine Key.

10
However, if an equal number of storm days per island in the Lower Keys is assumed,
Big Pine Key might have a higher frequency of lightning strikes, and hence fires, than
any other island in the area simply because it has the largest land mass.
Sah et al. (2006) conducted a burning experiment in six blocks in the pine forests
of National Key Deer Refuge, Big Pine Key, Lower Florida Keys to examine the
distribution of fuel components before fire, their effects on fire behavior and
seasonality, and the dynamics associated with fuel recovery following fire. Within each
of the blocks, they subjected 1-ha plots to three treatments over a 4-year period from
1998 to 2001: control, summer, and winter burning. They used path analysis to model
the effects of fuel type and char height, an indicator of fire intensity, on fuel
consumption. They found that fire intensity increased with surface fuel loads, but was
negatively related to the quantity of hardwood shrub fuels, probably because these
fuels were associated with a moist microenvironment within hardwood patches, and
therefore tended to resist fire. Winter fires were milder than summer fires and were less
effective at controlling the encroachment of hardwoods, a finding that agreed with the
findings of Snyder et al. (1990). The authors suggested a mixed seasonal burning
regiment for fire management, with burns applied opportunistically under a range of
winter and summer conditions.
A similar study was conducted by Menges and Deyrup (2001) in South Florida
on ways in which the dynamics of fire seasonality, regime, and intensity affect the

11
distribution of slash pine. They examined the post-fire survival of slash pine by
considering the interacting factors of bark beetle outbreaks, fire seasonality, fire
intensity, acres burned, and vegetation structure and composition. Slash pines were
sampled in 24 burned areas for three years following each fire. Season of burn most
affected the survival of pines; fall burns resulted in the highest mortality because fires
tended to be more intense during this time.
1.3.1.2 Fire frequency
In the Lower Florida Keys, wildfires have been suppressed as a fire management
practice since the 1950s (Bergh and Wisby 1996), and previous investigations report a
variety of historical wildfire frequencies. Most studies suggested that pine rocklands
experienced low-intensity surface fires about once every decade (Craighead 1971; Wade
et al. 1980; Snyder 1986), which is in agreement with Snyder et al. (1990), who argued
that surface fires occurred about once every 3 to 7 years, and with the 8-year fire
interval argued by Taylor (1981). Currently, the natural fire regime prior to the 1950s is
unknown due to a lack of historical records and a lack of tree-ring based fire
reconstruction research.
Bergh and Wisby (1996) represented the most comprehensive report to date on
fire history in the Lower Keys pine rocklands. Their report was based on GIS-based
images and data, and was intended to help plan prescribed burning activities in the
Lower Keys. Their fire history data derived from several sources, including historical
12
fire reports and descriptions noted in the Annual Narrative Reports of the United States
Fish and Wildlife Service’s (USFWS) Florida Keys Refuges, Key West Citizen
newspaper articles, and reports from volunteer fire departments in the Lower Keys.
Once fire dates and respective areas were analyzed, images were digitized in GIS and
georeferenced with coinciding aerial photographs. The resulting GIS files demonstrated
that 58 fires occurred in the Lower Keys between 1961 and 1996. Of these, 27 were
wildfires and 31 were prescribed burns. In addition to the 58 well-documented fires, 21
fires were mentioned between 1944 and 1980 in reports that could not be corroborated
or documented. Of the 58 documented fires in the Lower Keys, Bergh and Wisby (1996)
found that six were clearly started by lightning and occurred between April–September,
with the greatest number of fires (3) occurring in July. Bergh and Wisby (1996)
mentioned that an unknown, and possibly large, number of fires went unreported or
undetected. Therefore, a tree-ring based fire history study would be beneficial to efforts
to compile a complete fire history in the Lower Keys.
Beckage and Platt (2003) demonstrated linkages between fire regimes and the El
Niño-Southern Oscillation (ENSO) in pine rocklands of the Florida Everglades. Using
historical fire data from 1948 to 1999, they found that the El Niño phase was associated
with increased dry-season rainfall, higher surface water levels, decreased lightning
strikes, fewer fires, and smaller areas burned. Conversely, the La Niña phase of ENSO
was associated with decreased dry-season precipitation, lower surface water levels,

13
increased lightning strikes, more fires, and larger areas burned. They hypothesized that
frequent shifts between ENSO phases influenced vegetation through periodic large-
scale fires and resulted in a widespread occurrence of fire-influenced communities in
the Everglades landscape; however, their results were based solely on historically
documented fires and assumptions of how fire behaved during ENSO phases without
having tree-ring data to support claims.
1.3.1.3 Fire ecology
Fire is required for the maintenance and persistence of pine rockland
communities. Robertson (1954) and Wade et al. (1980) reviewed fire effects in these
communities and reported that fires usually occurred as low-intensity surface fires that
consumed only litter and some understory vegetation. The pine stem density was
usually too sparse and the canopy too open to support stand-replacing crown fires.
Fires that carried across pine rocklands usually burned out when they encountered a
hardwood hammock margin, yet soil fires smoldered in hammocks, especially during
drought conditions (Wade et al. 1980). Snyder et al. (1990) stated that fuel conditions
favored frequent fire in rockland communities. The herbaceous layer acted to carry
surface fires across the landscape. Pine needles accumulated as a duff layer and
decomposed slowly, as did other fuels (e.g. snags, stump, logs) because of rapid drying
due to open canopy conditions. In contrast, hammocks contained broadleaf litter lying
directly on moist organic soil and sparse herbaceous fuel. Fuels did not dry as rapidly

14
under shaded hammocks, and the humid microclimate did not favor spreading fire
(Snyder et al. 1990).
South Florida slash pine has evolved certain characteristics that are fire adaptive.
Like its sister taxon longleaf pine (Pinus palustris Mill.), slash pine establishes in a “grass
stage,” with long needles that shield apical buds and a thick insulating bark that shields
the vascular cambium from fires. Following fire during the grass stage, seedlings grow
rapidly to establish a height above normal surface fires (sapling stage). Typically, pine
seedling establishment is increased when fires occur before seed release (Snyder 1986).
Within the rockland community, fire commonly kills the aboveground portion of
hardwood shrubs, but all species typically resprout from below ground (Robertson
1953). Shrub layer palms (mostly Sabal palmetto and Serenoa repens) have a similar fire
adaptation, as fire kills aboveground biomass, but sub-surface apical buds are
unharmed and protected on the stem, allowing them to quickly resprout (Snyder et al.
1990).
When native species, as mentioned above, have positive fire feedback
mechanisms, the result is a healthy community. However, some non-native species
were shown to facilitate their own invasions in rockland communities. Stevens and
Beckage (2009) considered the invasive species Brazilian pepper (Schinus terebinthifolius)
growing in the rockland communities on Long Pine Key (Upper Florida Keys) and
investigated whether this invasive shrub initiated a fire-suppression feedback that

15
ultimately resulted in the conversion of pine rockland savanna to tropical hardwood
hammock. By applying controlled burns to selected plots, they found that prescribed
burns caused significant mortality of Brazilian pepper at low densities and that
savannas with more frequent fires contained less Brazilian pepper. However, high
densities of Brazilian pepper reduced fire temperature by up to 200 °C, and under these
conditions the plant experienced mortality as much as 80%. Stevens and Beckage (2009)
used a cellular automaton model to show that frequent fire may control low-density
populations, but that Brazilian pepper may reach a sufficient density during fire-free
periods to initiate a positive feedback that reduces the frequency of fire and converts
savannas to an invasive-dominated forest.
Platt et al. (2002) demonstrated that certain fire regimes strongly influenced the
number of pines killed by hurricanes. In remnant pine savannas of the Everglades, the
authors measured direct mortality of slash pines during Hurricane Andrew in 1992 and
extended mortality over the following 24–30 months. To study possible effects of prior
fire regimes on subsequent hurricane-related mortality in pine savannas, they examined
savannas that were unburned, burned during the wet (lightning fire) season, or burned
during the dry (anthropogenic fire) season in the decade before Andrew. Doren et al.
(1993) found that anthropogenic changes to dry-season fires strongly influenced the
effects of hurricanes on the mortality of pines in the Everglades.

16
Savannas dominated by slash pine are one of the most threatened habitats in
Florida. Doren et al. (1993) measured pine density and size-class distribution in three
slash pines stands in Everglades National Park and Big Cypress National Preserve to
gain an understanding of the effects of how these were affected by past fire
management practices. All three stands differed in fire management and logging
history. Doren et al. (1993) found that even in the absence of logging, past fire
management practices converted an uneven sized, variable density stand to an even-
sized, uniform density stand. Intense dry-season fires, caused by long-term fire
suppression, were probably responsible for the loss of large individual trees in non-
logged stands. Furthermore, they proposed that restoration of second-growth stands to
uneven-sized, variable density states would require reintroduction of fires more
characteristic of those in presettlement environments. Intense and numerous early wet
season fires (April–June) were probably the only fires that thinned established trees and
opened space for recruitment into populations.
1.4 Dendrochronology in the subtropics and tropics
Dendrochronology has a wide range of applications and is used to reconstruct
both environmental and anthropogenic histories (Fritts 1976; Dean et al. 1996). Most
studies that involve dendrochronology are conducted in temperate regions, where the
majority of tree species produce a single and explicit growth ring each year (Speer et al.
2004, Speer 2010). Most species located in tropical and subtropical areas do not
17
experience strong enough seasonality in temperature or precipitation to cause tree
growth to enter dormancy each year. The lack of seasonality prevents trees from
entering into a dormant state, which results in the production of growth rings with
diffuse and indistinct boundaries. However, recent studies show that certain tree
species located in tropical and subtropical regions produce annual rings (Speer et al.
2004; Brienen and Zuidema 2006; Buckley et al. 2007; Baker et al. 2008). Tree-ring records
from these regions are important because the tropics are the center of action for many
broad-scale climate phenomena (e.g. ENSO; D’Arrigo et al. 2006) and these data provide
rare opportunities for understanding the ecological dynamics of tropical and
subtropical communities (Brienen et al. 2009).
South Florida remains a substantially under-represented region for
dendrochronological research due to the difficulty of finding species with annual
growth rings. To study the growth patterns of slash pine, Langdon (1963) installed
dendrometer bands on 10 mature individuals in the Corkscrew Experimental Forest,
Fort Meyers, Florida, and measured incremental radial growth for four years. Langdon
found that, for the growing season, cambial activity first occurred in early February,
and 37% of the annual growth occurred from February to April, 35% from May to
August, 25% from September to November, and 3% from December to January.
Tomlinson and Craighead (1972) conducted visual observations of wood
anatomy of many plant species found in South Florida. They reported a small number

18
of species possessed anatomically distinct growth rings, including slash pine, which
they mentioned as the clearest example of annual growth rings of any species observed.
Yet, neither Langdon (1963) nor Tomlinson and Craighead (1972) offered any evidence
(e.g. ring counts between known events, crossdating) to show that growth rings in this
species are truly annual, which cannot be assumed given its subtropical location.
Slash pine persists on a surface of exposed limestone with poorly developed
soils, and the study area experiences a distinct summer-wet and winter-dry season,
with an average of 80% of the precipitation occurring in the summer (Winsberg 2003).
These factors are imperative for successful subtropical tree-ring studies (Speer et al.
2004; Baker et al. 2008; Heinrich et al. 2008; Sano et al. 2009). Data generated by this
research will be used to determine the structure and dynamics of pine rockland
communities.
1.5 Motivation for the research
I had several reasons for conducting research in Florida Keys pine rocklands.
First, slash pine is the southernmost distributed native conifer in the United States, and
slash pine located in the Lower Florida Keys exists at the southernmost limit of its
geographical distribution. Moreover, the Lower Florida Keys have a unique geography,
located along the Florida Straits between the Gulf of Mexico and Atlantic Ocean, so old-
growth slash pines here could potentially reveal climate information about various

19
oceanic/atmospheric climate phenomena (e.g. ENSO, Pacific Decadal Oscillation
(PDO)), and add a much needed data point within the network of climate proxies.
Previous investigations have shown that various climate-forcing mechanisms
(such as ENSO and PDO) influence Florida weather and climate, and control the
occurrence of wildfire, which is a major disturbance in pine rocklands. Wildfires in the
Lower Florida Keys (LFK) have been suppressed since the 1950s, and a considerable
amount of dead material has accumulated on the ground. To complicate matters,
inhabitants in the LFK have built their houses adjacent to slash pine trees that contain
many fire scars, which is direct evidence that fires once burned frequently on the
islands. Hence, the combination of prolonged drought and lightning is all it would take
to potentially result in widespread loss of property and endangered wildlife species.
Finally, the ca. 100,000 people living in the Florida Keys receive their drinking water
through the Florida Keys Aqueduct Authority (FKAA), which pumps freshwater all the
way from Miami to Key West (ca. 650 km). The source of this freshwater comes from
groundwater aquifers, which are vulnerable to over-pumping and saltwater intrusion
during periods of drought. From 2005 to 2008, the Florida Keys experienced one of the
most severe droughts in recorded history. Yet, without the knowledge of drought
severity before the 1900s, it is impossible to know the historical connotation of this most
recent drought. As we head into an era of uncertain climatic conditions and
unprecedented warming, reconstructions of regional precipitation using slash pines

20
could help reveal the historical context of this most recent drought and aid the FKAA in
refining its water-use policies to be better suited for dealing with future droughts.
1.6 Objectives
Knowledge of the long-term patterns of ecological disturbance and climatic
trends responsible for the persistence of pine rocklands and how human-induced
changes during the 20th century are currently contributing to their decline is crucial to
the management and conservation of these globally endangered communities. The
primary objectives of my research are to:
1. Determine if slash pine at its southern range limit forms anatomically distinct
growth rings (Chapter 2).
2. Establish whether growth rings are consistently annual throughout the life of
trees (Chapter 2).
3. Verify if crossdating is possible within and among trees (Chapter 2).
4. Examine which climatic factors influence slash pine radial growth in the Lower
Florida Keys (Chapter 2).
5. Examine the timing of growth ring formation in slash pine using anatomical
evidence (Chapter 3).
6. Investigate the relationship between climatic variables and intra-annual xylem
differentiation at the southernmost range limit of slash pine (Chapter 3).

21
7. Describe the characteristics of the historical fire regimes in the pine rocklands
of the Lower Florida Keys and determine whether fire regimes differed across
islands (Chapter 4).
8. Determine whether fire regimes changed during the 20th century after the
establishment of the National Key Deer Refuge (NKDR) (Chapter 4).
8. Investigate how historical fire regimes and varied fire management practices
since establishment of the NKDR affected the stand structure of the two
islands (Chapter 4).
9. Provide pine rockland management suggestions based on historical fire
history and stand structure data (Chapter 4).
10. Characterize the historical fire regime in slash pine savannas on Big Pine Key,
including return interval, fire season, and relative spatial extent (Chapter 5).
11. Determine whether detectable fire years were associated with El Niño-
Southern Oscillation and/or Pacific Decadal Oscillation (Chapter 5).
1.7 Organization of the dissertation
My dissertation consists of five chapters. Chapters 2–5 are included as stand-
alone manuscripts that are either already published or in review at an ISI peer-viewed
journal. In Chapter 2, I tested the hypothesis that slash pine produces annual growth
rings in the Lower Florida Keys by counting the number of rings on samples that
contained a fire scar from a known wildfire and a known date for hurricane-induced

22
tree mortality. In addition, a crossdated tree-ring chronology (1871–2009) was
developed from living trees and remnant wood and compared to divisional climate
data to determine how the regional climate regime influences radial growth. The goal of
this chapter was to reveal the potential of producing high-quality dendrochronological
data in southern Florida from slash pine. This should prove useful in further studies on
fire history and tree phenology, and for assessing the projected impacts of impending
climate change on the pine rockland community.
In Chapter 3, I determine the temporal and seasonal dynamics of intra-annual
cell formation of slash pine in the Florida Keys, and examine possible relationships
between monthly cell production and climatic factors, such as temperature,
precipitation, solar radiation, potential evapotranspiration, and day length. During the
period March 2010 to March 2011, wood micro-cores containing the outermost layers of
bark, phloem, vascular cambium, and xylem were extracted monthly from six trees and
used to identify the growing season of slash pine in the Florida Keys.
Chapter 4 explores how historical fire disturbance and varied fire management
practices influenced pine rockland structure in habitat areas on adjacent islands. I
reconstructed fire history in two stands from fire scars on slash pine that were
accurately dated using dendrochronology, and quantified stand structure to infer
successional trajectories on both islands.

23
In Chapter 5, I investigate relationships between climatic variability and
historical wildfires in pine rockland communities in the Florida Keys. Using the
dominant tree, slash pine, I developed a new set of crossdated fire-scar chronologies
spanning 1707–2010 from four sites on Big Pine Key and compared the fire chronology
to measured values of the ENSO (NIÑO3.4 region), PDO, and divisional temperature
and precipitation. This chapter adds much needed data for analyzing fire-climate
relationships within the network of fire history sites in the southeastern United States,
and results have implications for other pine rockland communities in southern Florida
and the Bahamas. I summarize the major findings of my dissertation work in the
Florida Keys and suggest recommendations for future research. The Appendices
contains details of the slash pine chronologies developed from my work.

24
References
Abrams, M. D., D.A. Orwig, and M.J. Dockry. 1997. Dendroecological analysis of
successional dynamics for a presettlement origin white pine–mixed oak forest in
the southern Appalachians, USA. Journal of Ecology 83:123–133.
Albritton, J.W. 2009. A 1700-year history of fire and vegetation in Pine Rocklands of
National Key Deer Refuge, Big Pine Key, Florida: Charcoal and pollen evidence
from Key Deer Pond. M.S. Thesis, Department of Geography, University of
Tennessee, Knoxville.
Alexander, T.R. 1967. A tropical hammock in the Miami (Florida) limestone: a twenty–
five year study. Ecology 48: 863–867.
Alexander, T.R., and J.H. Dickson. 1972. Vegetational changes in the National Key Deer
Refuge-11. Quarterly Journal of the Florida Academy of Sciences 35(2): 85–96.
Baker, P., J. Palmer, and R.D’Arrigo. 2008. The dendrochronology of Callitris intratropica
in northern Australia: annual ring structure, chronology development and
climate correlations. Australian Journal of Botany 56:311–320.
Beckage, B. and W.J. Platt. 2003. Predicting severe wildfire years in the Florida
Everglades. Frontiers in Ecology and the Environment 1: 235–239.
Bergh, C. and J. Wisby. 1996. Fire History of the Lower Keys Pine Rocklands. The
Nature Conservancy, Key West.
Brienen, R.J.W. and P.A. Zuidema. 2006. The use of tree rings in tropical forest
management: projecting timber yields of four Bolivian tree species. Forest Ecology
and Management 226:256–267.
Brienen, R.J.W., E. Lebrija-Trejos, M. van Breugel, E.A. Perez-Garcia, F. Bongers, J.A.
Meave, and M. Martinez-Ramos. 2009. The potential of tree rings for the study of
forest succession in southern Mexico. Biotropica 41:186–195.
Buckley, B.M., K. Palakit, K. Duangsathaporn, P. Sanguantham, and P. Prasomsin. 2007.
Decadal scale droughts over northwestern Thailand over the past 448 years: links
to the tropical Pacific and Indian Ocean sectors. Climate Dynamics 29:63–71.

25
Craighead, F.C. 1971. The trees of south Florida, Volume I, the natural environments
and their succession. University of Miami Press, Coral Gables, Florida, USA.
D’Arrigo, R.D., R.J. Wilson, J. Palmer, P.J. Krusic, A. Curtis, J. Sakulich, S. Bijaksana, S.
Zulaikah, and L.O. Ngkoimani. 2006. Monsoon drought over Java, Indonesia,
during the past two centuries. Geophysical Research Letters 33:L04709.
Dean, J.S., D.M. Meko, and T.W. Swetnam, editors. 1996. Tree Rings, Environment and
Humanity, Proceedings of the International Conference, Tucson, Arizona, 17–21
May 1994, University of Arizona, Radiocarbon, Department of Geosciences.
Doren, R.F., W.J. Platt, and L.D. Whiteaker. 1993. Density and size structure of pine
stands in the everglades region of south Florida. Forest Ecology and
Management 59: 295–311.
Druckenbrod, D.L. 2005. Dendroecological reconstructions of forest disturbance history
using time-series analysis with intervention detection. Canadian Journal of Forest
Research 35:868–876.
Fritts, H.C. 1976. Tree Rings and Climate. Academic Press, New York, NY.
Heinrich, I., K. Weidner, G. Helle, H. Vos, and J.C.G. Banks. 2008. Hydroclimatic
variation in Far North Queensland since 1860 inferred from tree rings.
Palaeogeography, Palaeoclimatology, Palaeoecology 270:116–127.
Karl, Thomas R., L.K. Metcalf, M.L. Nicodemus, and R.G. Quayle. 1983. Statewide
average climatic history, Florida 1981–1982. National Climatic Data Center,
Historical Climatology Series 6-1.
Kocis, D.L. 2012. Reconstruction of fire history in the National Key Deer Refuge,
Monroe County, Florida: The Palmetto Pond macroscopic charcoal record. M.S.
Thesis, Department of Geography, University of Tennessee, Knoxville.
Landers, J.L. and W.D. Boyer. 1999. An old-growth definition for upland longleaf and
South Florida slash pine forests, woodlands, and savannas. U.S. Department of
Agriculture, Forest Service Southern Research Station.
Langdon, O.G. 1963. Growth patterns of Pinus elliottii var. densa. Ecology 44: 825–827.

26
Menges, E.S., and M.A. Deyrup. 2001. Postfire survival in south Florida slash pine:
interacting fire season, vegetation, burn size, and bark beetles. International
Journal of Wildland Fire 10: 53–63.
Myers, R.L. 2010. Pine rockland fire management decision-making workshop: a
synopsis. Pine Rockland Working Group. http://fl.biology.usgs.gov/pineland/
pdf/Pine_Rocklands_Fire_Workshop_Synopsis.pdf
National Climatic Data Center (NCDC). 2009. Asheville, North Carolina.
www.ncdc.noaa.gov, accessed 17 September 2009.
Noss, R.F., E.T. LaRoe, and J.M. Scott. 1995. Endangered ecosystems of the United
States: A preliminary assessment of loss and degradation. USDI Biological
Report 28, Washington D.C.
O’Brien, J.J. 1998. The distribution and habitat preferences of rare Galactia species
(Fabaceae) and Chamaesyce deltoidea subspecies (Euphorbiaceae) native to
southern Florida pine rockland. Natural Areas Journal 18:209–222.
Platt, W.J., Beckage, B., Doren, R.F. and H.H. Slater. 2002. Interactions of large-scale
disturbances: Prior fire regimes and hurricane mortality of savanna pines.
Ecology 83: 1566–1572.
Robertson, W.B. 1953. A survey of the effects of fire in Everglades National Park. U.S.
Department of the Interior, National Park Service, Everglades National Park.
Homestead, Florida, USA.
Robertson, W.B. 1954. Everglades fire—past, present, and future. Everglades Natural
History 2: 10–16.
Sah, J.P., M.S. Ross, S. Koptur, and J.R. Snyder. 2004. Estimating aboveground biomass
of broadleaved woody plants in the understory of Florida Keys pine forests.
Forest Ecology and Management 203:319–329.
Sah J.P., M.S. Ross , J.R. Snyder, S. Koptur, and H.C. Cooley. 2006. Fuel loads, fire
regimes, and post-fire fuel dynamics in Florida Keys pine forests. International
Journal of Wildland Fire 15:463–478.

27
Sano, M., B.M. Buckley, and T. Sweda. 2009. Tree-ring based hydroclimate
reconstruction over northern Vietnam from Fokienia hodginsii: eighteenth century
mega-drought and tropical Pacific influence. Climate Dynamics 33:331–340.
Snyder, J.R. 1986. The impact of wet season and dry season prescribed fires on Miami
Rock Ridge Pineland, Everglades National Park. National Park Service, South
Florida Research Center Report 86/06.
Snyder, J.R., A. Herndon, and W.B. Robertson Jr. 1990. South Florida Rocklands. Pages
230–277 in R.L. Myers and J.J. Ewel, editors. Ecosystems of Florida. University of
Central Florida Press, Orlando, Florida, USA.
Speer, J.H., 2010. Fundamentals of Tree-Ring Research. University of Arizona Press,
Tucson.
Speer, J.H., K. H. Orvis, H.D. Grissino-Mayer, L.M. Kennedy, and S.P. Horn. 2004.
Assessing the dendrochronological potential of Pinus occidentalis Swartz in the
Cordillera Central of the Dominican Republic. The Holocene 14:563–569.
Stevens, J.T. and B. Beckage. 2009. Fire feedbacks facilitate invasion of pine savannas by
Brazilian pepper (Schinus terebinthifolius). New Phytologist 184: 365–375.
Taylor, D. 1981. Fire history and fire records for Everglades National Park 1948–1979.
South Florida Research Center Report T-169.
Tomlinson, P.B., and F.C. Craighead, 1972. Growth ring studies on the native trees of
subtropical Florida. In Research Trends in Plant Anatomy, edited by A.K.M.
Ghouse and M. Yunus, pp. 39–51. Tata McGraw-Hill, Bombay.
Wade D., J. Ewel, and R. Hofstetter. 1980. Fire in south Florida ecosystems. United
States Department of Agriculture Forest Service, Southeast Forest Experiment
Station General Technical Report SE-17.
Winsberg, M.D. 2003. Florida Weather. University Press of Florida, Gainesville, FL.

28
Chapter 2
The Dendrochronology of Pinus elliottii in the Lower Florida Keys: Chronology
Development and Climate Response

29
Chapter 2
The Dendrochronology of Pinus elliottii in the Lower Florida Keys: Chronology
Development and Climate Response
This chapter is a slightly revised version of a paper published in a peer-reviewed
journal: Grant L. Harley, Henri D. Grissino-Mayer, and Sally P. Horn (2011). The
Dendrochronology of Pinus elliottii in the Lower Florida Keys: Chronology
development and climate response. Tree-Ring Research, 67(1): 39–50. The revisions
follow suggestions made be members of my dissertation committee. The use of “we” in
this chapter refers to my co-authors and myself. As the first author, I was lead on
designing the study, obtaining the data, performing analyses, and writing the
manuscript.
2.1 Abstract
South Florida slash pine (Pinus elliottii var. densa) is the southernmost pine
species in the United States and the foundation species of the globally endangered pine
rockland communities in South Florida. To test if slash pine produces annual growth
rings in the Lower Florida Keys, we counted the number of rings on samples collected
from the North Big Pine Key site (NBP) that contained a fire scar from a known
wildfire and a known date for hurricane-induced tree mortality (2006 or 2007). In
addition, a crossdated tree-ring chronology (1871–2009) was developed from living
trees and remnant wood found at the site and compared to divisional climate data to
determine how the regional climate regime influences radial growth. Our analyses
demonstrated that slash pine forms anatomically distinct, annual growth rings with
the consistent year-to-year variability necessary for rigorous dendrochronological

30
studies. Response function and correlation analysis showed that annual growth of
slash pine at NBP is primarily influenced by water availability during the growing
season. However, no significant correlations were found between tree growth and the
Atlantic Multidecadal Oscillation or the El Niño-Southern Oscillation. Our study
reveals the potential of producing high-quality dendrochronological data in southern
Florida from slash pine that should prove useful in further studies on fire history and
tree phenology, and for assessing the projected impacts of impending climate change
on the fragile pine rockland community. Keywords: dendrochronology, Pinus elliottii,
Florida, response function analysis, pine rocklands
2.2 Introduction
The science of dendrochronology relies on precision during the tree-ring dating
process to ensure that each growth ring is correctly assigned to the exact calendar year
in which it formed (Douglass 1934, 1941). This required precision creates challenges
when working in tropical and subtropical regions. Most studies that involve
dendrochronology are conducted in temperate regions, where the majority of tree
species produce a single and explicit growth ring each year (Fritts 1976; Speer 2010).
Many species located in tropical and subtropical regions do not experience strong
seasonality in temperature or precipitation that can cause tree growth to cease,
resulting in the formation of a well-defined ring. However, recent studies show that
certain tree species located in these regions produce annual rings (Speer et al. 2004;

31
Brienen and Zuidema 2006; Buckley et al. 2007; Baker et al. 2008). Tree-ring records
from the tropics and subtropics are important because the tropics are relatively under-
represented by proxy data that can be used to infer many broad-scale climate
phenomena in the past (e.g. El Niño-Southern Oscillation; D’Arrigo et al. 2006). These
tree-ring data provide rare opportunities for understanding the ecological dynamics of
tropical and subtropical communities (Brienen et al. 2009).
Pine rockland communities are considered globally endangered because 98% of
these communities have been lost worldwide due to land-use conversion and
ecological degradation (Noss et al. 1995). In the United States, pine rockland
communities are unique to three areas in southern Florida: Everglades National Park,
Big Cypress National Preserve, and the Lower Florida Keys (Snyder et al. 1990). South
Florida slash pine (Pinus elliottii Engelm. var. densa Little and Dorman) is the dominant
woody species and sole canopy tree in pine rocklands of the Lower Florida Keys.
These communities support a diverse subcanopy of West Indian hardwoods and
palms, and a variety of endemic herbs that are alternately encouraged or inhibited by
fire (Noss et al. 1995; Sah et al. 2004). Pine rocklands once covered a vast contiguous
area of southern Florida of over 75,000 ha, but fire suppression and urbanization
during the 20th century have fragmented and reduced the original range by 90%
(Doren et al. 1993, O’Brien 1998).

32
Slash pine is the foundation species in pine rockland communities. This species
is the southernmost native pine in the United States (Little and Dorman 1954). In the
Lower Florida Keys, pine rocklands provide an important habitat for several federal
and state listed endangered animal and plant species, including the Key deer
(Odocoileus virginianus clavium Barbour & Allen), the Lower Keys marsh rabbit
(Sylvilagus palustris hefneri Lazell), Kirtland’s warbler (Dendroica kirtlandii Baird),
Garber’s spurge (Chamaesyce garberi (Engelm. ex Chapm.) Small), tiny polygala
(Polygala smallii R.R. Sm. & Ward), the Big Pine Key ringneck snake (Diadophis
punctatus acricus Paulson), the Florida atala butterfly (Eumaeus atala Röber), and the
Florida leafwing butterfly (Anaea troglodyta floridalis Johnson & Comstock) (Snyder et
al. 1990). Frequent burning maintains the associated vegetation of pine rockland
communities and prevents succession to tropical hardwood hammocks.
The objectives of this study were to (1) determine if slash pine at its southern
range limit forms anatomically distinct growth rings; (2) establish if these growth rings
are consistently annual; (3) verify if crossdating is possible within and among trees;
and, (4) examine which climatic factors influence slash pine growth in the Lower
Florida Keys. Our goal is to provide insights into the potential use of slash pine for
future dendrochronological studies in southern Florida that will serve two primary
purposes. First, can South Florida slash pine provide useful information on past
climate in subtropical locations? Our study reveals which climate variables (such as

33
mean monthly temperature, total monthly precipitation, Atlantic Multidecadal
Oscillation (AMO), and El Niño-Southern Oscillation (ENSO)) are important for
growth of slash pine. Any statistically significant relationships between climate and
pine growth offer the potential for climate reconstruction in a subtropical location.
Second, can slash pine yield important information on past fire activity via tree-ring
based fire-scar analyses, similar to studies conducted in locations farther north and
west in the U.S.? Slash pine is a fire-adapted species, and we discovered hundreds of
fire-scarred pines that could provide valuable information on the range of historical
variation in fire regimes of the Lower Florida Keys. Should slash pine prove to be a
dendrochronologically viable species, reconstructions of fire history would
complement ongoing studies on the role of fire in pine rockland ecosystems (Sah et al.
2010).
2.2.1 Previous research on South Florida slash pine
Southern Florida remains a substantially under-represented area for
dendrochronological research due to the difficulty of finding species with annual
growth rings. Langdon (1963), who first attempted to study the growth patterns of
slash pine, installed dendrometer bands on 10 mature trees in the Corkscrew
Experimental Forest near Naples, Florida (26.4° N, 81.6° W) and measured incremental
radial growth during the period 1956–1959. Langdon also monitored groundwater
level and soil moisture, and compared radial growth to environmental conditions.
34
Langdon found that the first spring flush of growth occurred in early February, and
37% of the annual growth occurred from February to April, 35% from May to August,
25% from September to November, and 3% from December to January. Diameter
growth had two peaks, one in spring centered on March and another in the fall
centered on September; however, radial growth in this study was not separated from
seasonal of short-duration shrink-swell cycles.. Langdon found that the 10-month long
growing season (February to November) contributed to a high percentage of latewood
and therefore high wood density (the specific gravity of South Florida slash pine is
0.845 (Olson 1952), the highest of all pine species in the U.S. (Forest Products
Laboratory 1974)). He further discovered that the lack of moisture during drought
conditions in 1956 did not affect radial growth considerably, which he attributed to the
fact that the wilting point was not reached in the lower soil depths where moisture
was still available to trees. Although his study did not specifically correlate radial
growth with climate factors, Langdon (1963) was the first to present a basic
understanding of the slash pine growing season in South Florida.
Tomlinson and Craighead (1972) made observations of wood anatomy of
several tree species found in southern Florida. They speculated that several species
form annual growth rings, including slash pine, which they mention as the clearest
example of annual growth rings of any species observed. They also noted that the high
proportion of latewood to earlywood might be a result of the long growing season that
35
slash pine experiences. Using the results of Langdon (1963) and their own
observations, they speculated that the annual reactivation of the cambium corresponds
with the first flush of growth during February, at which time the male and female
strobili expand. Neither Langdon (1963) nor Tomlinson and Craighead (1972),
however, offered any evidence (e.g. ring counts between known stand-wide events) to
demonstrate that growth rings in this species are annual, which cannot be assumed
given its subtropical location.
Specimens of slash pine in Myakka River State Park, Florida (27.2° N, 82.3° W)
were successfully crossdated by Ford and Brooks (2002) and used to investigate
whether increased levels of the Myakka River, caused by damming, amplified forest
stress and decline. Their primary objective was to determine the relationship between
historical and present river levels and growth of actively managed forested stands
located above and below a dam located within the park. Tree growth and river levels
were positively correlated before and after flow increased, suggesting that increased
river levels may indirectly cause stress and mortality through increased competition in
wet-mesic pine flatwoods. In forested wetland stands, however, Ford and Brooks
concluded that increased river levels were the direct cause of extensive mortality
upstream from the dam.
Additionally, Ford and Brooks (2003) used tree-ring analyses on slash pine to
examine the relationship between radial growth, precipitation minus potential

36
evapotranspiration (P-PET, indicating water availability during times of high
demand), and runoff (R, indicating access to groundwater) along a hydrologic gradient
at Myakka River State Park. The oldest individual pine established in 1888, but most
individuals established in the early decades of active fire suppression (ca. 1930 to
1950). The common period of their three slash pine chronologies spanned 1936–1997
and had interseries correlations of 0.45 (n = 7; p < 0.001), 0.56 (n = 3l p < 0.001), and 0.57
(n = 18; p < 0.001), indicating response within each site to a common climate signal.
Tree growth was significantly correlated with current year’s spring R and with the
current year’s spring, summer, and fall P-PET at all three sites.
2.3 Materials and methods
2.3.1 Study area
Big Pine Key (24.6° N, 81.3° W) is the largest of the islands that make up the
Lower Florida Keys, and contains the most extensive area of contiguous pine rockland
and slash pine habitat (920 ha; Figure 2.1). The pine rocklands on Big Pine Key are
located within the National Key Deer Refuge (NKDR), which is managed by the
United States Fish and Wildlife Service (USFWS). The tropical savanna climate of the
Lower Florida Keys is characterized by hot summers (average maximum August
temperature 32.8 °C), cool winters (average minimum January temperature 19.4 °C),
and a distinct summer-wet, winter-dry season. The average annual precipitation is 980

37
mm, with 80% occurring from May to November (NOAA 2010; Figure 2.2). On the
rocklands, soil is thin to non-existent and Pleistocene-aged Miami limestone is exposed
at the surface (Snyder et al. 1990).
2.3.2 Sampling design
To assess the potential of slash pine for dendrochronological research, we
conducted a specific sampling design aimed at first determining whether trees on Big
Pine Key produce a single and explicit growth ring each year. In August 2009, 36 fire-
scarred cross sections from dead and living slash pine trees were collected from a
prescribed burn site on North Big Pine Key. The North Big Pine (NBP) site is located
on a 25-ha tract of land that last burned on 30 September 1988. According to Bergh and
Wisby (1996), this burn was a high-intensity prescribed burn. To determine if slash
pine produces a single growth ring each year, we extracted partial sections from dead
fire-scarred trees that experienced mortality caused by the 2005 storm surge of
Hurricane Wilma and subsequent saltwater impoundment in low-lying areas of the
key. The outermost growth ring for these hurricane-killed pines should coincide with
calendar year 2006 or 2007. The variability in outermost ring dates occurs because
flooding effects from the storm surge (depth and duration) were variable across the
island. To test the annual nature of growth rings, a ring count was first conducted with
a microscope on samples from the most recent fire scar (1988) to the outermost ring
(2006 or 2007).

38
Figure 2.1. Current distribution of pine rocklands and slash pine in the National Key
Deer Refuge, Lower Florida Keys.

39
Figure 2.2. Monthly mean temperature (line) and monthly total precipitation (bars) for
Florida Climate Division 7 for the period 1895–2009.

40
A second sampling effort in March 2010 focused on developing a long slash
pine chronology for comparison with regional climate variables. A total of 60 slash
pine core samples (from 23 trees) were collected from NBP. The cores were taken with
a 5.15 mm diameter Haglof increment borer, with 2–4 radii extracted from each tree.
Because of the Hurricane Wilma storm surge in 2005, only 23 living trees existed at
NBP, all of which had no visible fire injuries. Four radii were necessary on larger trees
because the growth rings of older slash pine display poor circuit uniformity. Tree
diameters at breast height ranged from 11.7 to 31.5 cm, and increment cores were
extracted at 30 cm above ground level.
2.3.3 Laboratory methods
Cores and cross sections were dried then mounted (Stokes and Smiley 1996),
then sanded using progressively finer sandpaper, beginning with ANSI 100‐grit (125–
149 μm) and ending with ANSI 400‐grit (20.6–23.6 μm) (Orvis and Grissino‐Mayer
2002). The NBP samples were scanned with a high-resolution digital scanner (EPSON,
Expression 10000XL) at 1200 dpi and measured and visually crossdated using the
WinDENDRO ™ system (version 2009C, Canada). Visual crossdating was confirmed
statistically with COFECHA (Holmes 1983; Grissino-Mayer 2001). We used the
computer program ARSTAN to standardize tree-ring series to remove the age trend
and to minimize effects of autocorrelation in the time series (Cook 1985). Each tree-ring
series was detrended with fitted negative exponential curves. Three types of index

41
chronologies were created using the program ARSTAN: standard, residual, and
ARSTAN. To determine which chronology best suited our study, we conducted a
preliminary correlation analysis between climatic variables (monthly temperature and
precipitation from Florida Climate Division 7) and each index chronology. All three
index chronologies returned similar results such that the interpretation of the
influences of regional climate on tree growth was the same for all chronologies (e.g.
Gou et al. 2007). The ARSTAN (ARS) chronology, however, showed the highest
correlations between tree growth and climatic variables and therefore was used in all
further analyses.
2.3.4 Influences of regional climate on tree growth
To assess the relationship between climate and radial growth of slash pine, we
compared the NBP chronology to regional climate data. National Oceanic and
Atmospheric Administration (NOAA) divisional data average observations from all
climate stations within each division of a state and assign equal weight to each station
so that divisional data reduce the effects of micro-site climate variation. We selected
monthly mean temperature and monthly total precipitation as variables for analysis.
Temperature and precipitation data were obtained for the period 1895–2009 from the
National Climatic Data Center (NOAA 2010) for Florida Climate Division 7, which
includes the southernmost portion of the peninsula.
42
Broad-scale atmospheric and oceanic oscillations (such as the El Niño-Southern
Oscillation (ENSO) and Atlantic Multidecadal Oscillation (AMO)) can have an effect
on the climate of South Florida (Ropelewski and Halpert 1986, 1996; Enfield et al. 2001;
Schmidt et al. 2001; Beckage et al. 2003; Laing et al. 2008). ENSO cycles are
characterized by alternating periods of warm (El Niño) and cold (La Niña) sea surface
temperatures in the central and eastern Pacific and occur with a periodicity of three to
seven years (Tudhope et al. 2001). In general, winters in the southeastern United States
are cooler and wetter during El Niño periods and warmer and drier during La Niña
periods (Ropelewski and Halpert 1986, 1996).
However, because of the latitudinal extent of Florida, the southernmost regions
and the rest of the state experience different effects of ENSO (Ropelewski and Halpert
1986, 1996; Laing et al. 2008). In the Everglades of South Florida, Beckage et al. (2003)
found that the La Niña phase was correlated with increased winter precipitation and
surface water levels. In contrast, the El Niño phase was associated with decreased
winter precipitation and surface water levels.
The AMO is a 65–80 year cycle of changes in sea surface temperature anomalies
(SSTAs) in the North Atlantic Ocean (Gray et al. 2004). This oscillation is characterized
by alternating warm and cool phases, each lasting 20–40 years. Warm AMO phases
generally coincide with increased precipitation in Florida and decreased precipitation
in the rest of the continental United States. Cool AMO phases correspond with

43
decreased precipitation (drought conditions) in Florida and increased precipitation
elsewhere in the U.S. (Enfield et al. 2001).
To determine the effects that ENSO and AMO cycles may have on tree growth
in the Lower Florida Keys, we compared the NBP chronology with (1) ENSO: mean
monthly SSTAs from the Niño-3.4 Region, east central Tropical Pacific (5° N–5° S, 170–
120° W), available from 1871 to 2007 (Trenberth and Stephaniak 2000); and (2) AMO:
North Atlantic SSTAs, based on a 5° latitude by 5° longitude global SST grid,
unsmoothed, available from 1856 to 2009 (Kaplan et al. 1998).
2.3.5 Response function and correlation analysis
We used response function (RFA) and correlation analysis to examine how
regional climatic variables (monthly mean temperature and monthly total
precipitation) influence radial growth of slash pine (Fritts et al. 1971; Fritts and
Xiangding 1986). RFA is a multiple regression technique that estimates indexed values
of ring-width using the principal components of monthly climatic data. Correlation
analysis produced coefficients that were univariate estimates of Pearson’s product-
moment correlation (Biondi and Waikul 2004). Similar to the response functions,
correlation coefficients were calculated with bootstrapped confidence intervals to
reduce potential error and obtain more accurate results (Biondi 1997). We conducted
these analyses using climate variables covering a 23-month period (February of the
previous year to December of the current year of radial growth). This period was

44
selected because conditions during the previous and current year growing season can
affect the amount of carbon fixed and allocated to tree growth (Grissino-Mayer and
Butler 1993; Foster and Brooks 2001). Response function and correlation coefficients
were produced using the program DENDROCLIM2002, which uses bootstrapping to
yield more accurate confidence levels (Biondi 1997; Biondi and Waikul 2004).
Coefficients that equaled or exceeded the 95% confidence level were identified by the
program. To determine the influence that cycles of ENSO and AMO have on tree
growth, correlation coefficients were produced using DENDROCLIM2002.
2.4 Results
2.4.1 Growth ring anatomy of slash pine
In the Lower Florida Keys, slash pine forms anatomically distinct growth rings
(Figure 2.3). The growth ring boundaries contain tracheid cells that have thicker cell
walls and smaller cell lumen, similar to the latewood cells of the other southern yellow
pines (e.g. Pinus elliottii Engelm. var. elliottii, Pinus palustris Mill., Pinus echinata Mill.,
Pinus taeda L.). The latewood zone in growth rings occurs when earlywood cells with
thin cell walls rapidly transition to latewood cells with thick cell walls. Often,
variations in cell dimensions within annual growth rings, generally in the later
portions of earlywood zones, occur in which a thin band of tracheid cells with thicker
cell walls forms. These variations are numerous and give the appearance of a false
45
ring, but these were easily identified by the gradual transition from latewood to
earlywood cells as described by Speer (2010).
2.4.2 Annual ring assessment and chronology development
Samples from NBP demonstrate that the anatomically distinct growth rings
formed by slash pine are annual. First, our ring count on samples that contain the 1988
fire scar and then experienced mortality shortly after the 2005 Hurricane Wilma storm
surge reveal that these individuals formed a single and explicit growth ring each year
from 1988 to 2006/2007 (Table 2.1). Furthermore, we were able to successfully crossdate
tree rings from both increment cores and sections from NBP and develop a tree-ring
chronology for this site (Figure 2.4). Of the 60 slash pine tree cores that were collected,
24 cores from eight trees could not be crossdated with the master chronology (60%
success rate). Fifteen of the 36 fire-scarred cross sections collected from NBP were
crossdated against the master chronology, although this process is ongoing and we
expect to eventually crossdate tree rings from most cross sections. The 53 dated series
(from 31 trees) from NBP produced a 139-year chronology (1871–2009) with a high
interseries correlation (0.52) and mean sensitivity (0.39), and only 13 segments were
flagged by COFECHA as problematic (8%; Table 2.2). Among the crossdated trees, five
distinct marker years were prominent: 1892, 1916, 1942, 1992, and 2003. All five were >
2 standard deviations narrower than the mean ring-width value. Overall, most series

46
Table 2.1. Ring count results for NBP samples from the most recent fire date at the site
(1988; Bergh and Wisby 1996) to the tree death date (2006 or 2007; Morkill 2009).
Sample ID Most recent fire
date Outermost ring
# rings between fire
scar and outermost
ring
NBP501 1988 2006 18
NBP503 1988 2007 19
NBP514 1988 2006 18
NBP515 1988 2006 18
NBP516 1988 2006 18
NBP531 1988 2007 19
NBP534 1988 2006 18
NBP538 1988 2006 18
NBP543 1988 2007 19

47
Figure 2.3. Annual growth rings in slash pine (cross section). In many growth rings, a
false ring occurred in the late portion of earlywood growth (shown by arrows).

48
Figure 2.4. ARSTAN chronology and sample depth for slash pine from the NBP
site on Big Pine Key.

49
did not contain locally absent rings, although the 1943 growth ring was missing in
several series.
2.4.3 Influence of climatic variables on tree growth
The slash pine chronology from NBP correlated with climate data from Florida
Climate Division 7, indicating that regional climate influences radial growth. Annual
growth of slash pine at NBP is primarily influenced by precipitation and available
moisture during the growing season. RFA indicated that radial growth at NBP
responded positively to current September precipitation and negatively to both
previous November and current September temperature (Figure 2.5).
Correlation analysis between monthly mean temperature and the NBP
chronology resulted in significant negative correlations between radial growth and
current September and previous September and November temperature (Figure 2.5).
We also found a significant negative correlation with current May precipitation and a
significant positive correlation with current September precipitation. The comparison
between the NBP chronology and the Niño 3.4 and AMO indices (not shown) showed
a weak response of tree growth to North Atlantic conditions and no relationship with
ENSO in slash pine. The NBP chronology is significantly and positively correlated
with the AMO index only during current April, but the association is quite weak (r =
0.17, p < 0.05).

50
Table 2.2. Descriptive statistics from COFECHA for NBP
(1871–2009).
Number of trees 32
Number of dated series 1 53
Master series time span (yrs) 139
Total rings 2747
Interseries correlation 2 0.520
Mean sensitivity 3 0.399
Chronology start date 4 1886
Percent flags 5 12 1 Dated series are individual radii that were crossdated 2 Interseries correlation is a measure of the stand-level signal 3 Mean sensitivity is a measure of the year-to-year ring-
width variability in the master chronology 4 Chronology year with 2 or more dated series 5 Flags represent a segment of a dated series that contains possible problem

51
Figure 2.5. Annual growth response to monthly mean temperature and monthly total
precipitation for the NBP chronology from previous February (pFEB) to current
December (DEC) for the period 1895–2009. Response coefficients between NBP and
climatic variables are shown in the left column and correlation coefficients are shown
in the right column. Dashed lines indicate 95% confidence limits and asterisks indicate
statistically significant months.

52
2.5 Discussion
The foundation species slash pine provides an opportunity to investigate the
historical variation in regional climate and vegetation dynamics of pine rockland
communities in the Lower Florida Keys. The presence of anatomically distinct and
annual growth rings, high-quality crossdating (as shown by a high interseries
correlation), and statistically significant correlations and RFA coefficients with climate
makes slash pine a useful candidate for dendrochronological, ecological, and
biogeographical studies in southern Florida. Langdon (1963) and Tomlinson and
Craighead (1972) suggested that slash pine forms annual rings, but ours is the first
study to confirm the annual nature of its growth rings, assess its crossdating potential,
develop a chronology, and identify statistically significant relationships between radial
growth and climate at its southern range limit.
Although slash pine produces annual rings, crossdating was challenging. False
rings were problematic in many samples, as were a few locally absent growth rings.
Five cross sections contained locally absent rings that occurred after the very narrow
1942 growth ring. This suggests that a long-term physiological growth decline in slash
pine, ultimately resulting in an absence of xylogenesis during 1943, may have been
initiated by adverse environmental conditions the previous year. False rings generally
occurred just before the earlywood/latewood transition zone, suggesting that
unusually low rainfall during earlywood growth might cause individuals to

53
prematurely form tracheids with thicker cell walls, causing a false ring to appear
before the formation of latewood cells.
Response function and correlation analysis revealed significant relationships
between radial growth and precipitation and indicate that annual growth of slash pine
at the NBP site is primarily influenced by water availability during the growing
season. This corroborates the findings of Ford and Brooks (2003), who found slash pine
at its northern range limit in central Florida to be sensitive to water availability during
times of high demand. RFA indicated that previous November and current September
temperature and current September precipitation are the most important predictors of
radial growth at NBP. The response functions between tree growth and climatic
variables suggests that warmer temperatures towards the end of the growing season
result in less radial growth, likely due to increased moisture stress from higher
temperatures. Additionally, increased late-season rainfall during September results in
prolonged growth before dormancy occurs, thus producing a wider than average
growth ring. Significant negative correlations between tree growth and late summer
temperatures and May precipitation also support the argument that these relationships
are likely a signal of moisture stress, as higher temperatures result in higher rates of
evapotranspiration.
We did not find significant results between tree growth and the Palmer drought
indices (Palmer Drought Severity Index (PDSI) and Palmer Hydrological Drought

54
Index (PHDI)). This was not a surprising result for several reasons. First, the closest
PDSI grid point to the NBP chronology is located in central Florida (82.5° W, 27.5° N;
Cook et al. 2004). The highly variable weather experienced from mainland Florida
southward to the Lower Florida Keys might explain the lack of statistically significant
response of slash pine to PDSI and PHDI (Winsberg 2003). Second, the Palmer drought
indices are derived from measurements of precipitation, air temperature, and local soil
moisture. The poor to non-existent soil development on Big Pine Key might also partly
explain the lack of result.
The lack of a statistically significant response of slash pine to AMO was
unexpected because the geographic proximity of our site to the influence of this
oscillation suggested a significant climate response would be found. Our site is located
on a small (25.8 km2) island. Surrounded by vast expanses of ocean (tropical Atlantic to
the east and Gulf of Mexico to the west), trees at the NBP site were strong candidates
for picking up a signal from the North Atlantic ocean-atmospheric oscillations. Warm
phases of the AMO correspond with increased precipitation and increased landfalling
tropical storms in southern Florida. However, the response likely was instead manifest
in the positive correlation and RFA coefficients found with September precipitation.
On the other hand, ENSO SSTAs usually reach their peak and maximum aerial extent
in the tropical Pacific during the winter months (Laing et al. 2008). Our RFA indicated

55
that winter precipitation (December–February) is not an important component of
annual tree growth, so the lack of an ENSO signal in the NBP pines is understandable.
Interpreting relationships between regional climate and tree growth at the NBP
site, however, is limited by the lack of detailed information regarding the phenological
properties of slash pine, such as when cambial reactivation, earlywood growth,
latewood growth, and dormancy occur, and which environmental factors cause these
changes in xylogenesis. These data are needed before more detailed interpretations of
climate-tree growth relationships can be made. Consequently, we have initiated a
long-term study on Big Pine Key aimed at providing detailed phenological data that
will help further define the length of the growing season and determine which climate
factors cause slash pine to form false and locally absent growth rings. This study will
examine growth of six pines on a biweekly to monthly basis by extracting and
preserving small punch cores and observing the amount and types of cells produced
between intervals.
2.6 Conclusions
Tree-ring analysis in Florida has primarily been limited to species located in
central–northern regions of the state (Foster and Brooks 2001; Ford and Brooks 2002,
2003; Henderson et al. 2009). The majority of tree species in South Florida fail to
produce annual rings (Tomlinson and Craighead 1972), yet our research demonstrates
that slash pine is a species of dendrochronological value. Multidecadal, and possibly

56
multi-centennial, chronologies can be developed and used to provide more detailed
information regarding the structure and dynamics of endangered pine rockland
communities and how disturbance regimes (e.g. hurricanes and wildfires) have shaped
the current distribution of slash pine in the Lower Florida Keys. Furthermore, slash
pine is the southernmost pine species in the United States and the only pine to inhabit
the lower third of peninsular Florida (Little and Dorman 1954). Because slash pine in
the Lower Florida Keys exists at its southern range limit, the species could prove vital
for understanding the possible effects of future climate change on range distributions
of species in habitats that could be especially vulnerable to increasing global
temperatures. The expected higher temperatures could reduce growth rates of these
pines as indicated by the correlation and RFA results, leading to moisture stress that
could lead to increased mortality of pines that survived the effects of Hurricane
Wilma. Warmer temperatures, rising seas levels, and increased incidence of salt-water
intrusion may render other studies of slash pine in the Lower Florida Keys impossible,
creating the need for a better understanding of pine rockland dynamics while they still
exist.
2.7 Acknowledgements
This research was funded by the United States Fish and Wildlife Service and we
thank Anne Morkill, Chad Anderson, and Phillip Hughes for access to the National
Key Deer Refuge. We thank John Sakulich and Desiree Ketteringham for field

57
assistance and Kody Honeyman for laboratory assistance. G.L. Harley was supported
by National Science Foundation grant number DGE-0538420.

58
References
Baker, P., J. Palmer, and R. D’Arrigo, 2008. The dendrochronology of Callitris
intratropica in northern Australia: annual ring structure, chronology development
and climate correlations. Australian Journal of Botany 56: 311–320.
Beckage, B., W.J. Platt, M.G. Slocum, and B. Panko, 2003. Influence of the El Niño-
Southern Oscillation on fire regimes in the Florida Everglades. Ecology 84: 3124–
3130.
Bergh, C., and J. Wisby, 1996. Fire History of the Lower Keys Pine Rocklands. The Nature
Conservancy Special Report, 38 pp.
Biondi, F., 1997. Evolutionary and moving response functions in dendroclimatology.
Dendrochronologia 15: 139–150.
Biondi, F., and K. Waikul, 2004. DENDROCLIM2002: A C++ program for statistical
calibration of climate signals in tree-ring chronologies. Computers & Geosciences 30:
303–311.
Brienen, R.J.W., and P.A. Zuidema, 2006. The use of tree rings in tropical forest
management: projecting timber yields of four Bolivian tree species. Forest Ecology
and Management 226: 256–267.
Buckley, B.M., K. Palakit, K. Duangsathaporn, P. Sanguantham, and P. Prasomsin,
2007. Decadal scale droughts over northwestern Thailand over the past 448 years:
links to the tropical Pacific and Indian Ocean sectors. Climate Dynamics 29: 63–71.
Cook, E.R., 1985. A Time Series Analysis Approach to Tree Ring Standardization. Ph.D.
dissertation, University of Arizona, Tucson.
Cook, E.R., C.A. Woodhouse, C.M. Eakin, D.M. Meko, and D.W. Stahle, 2004. Long-
Term Aridity Changes in the Western United States. Science 306(5698): 1015–1018.
D’Arrigo, R.D., R.J. Wilson, J. Palmer, P.J . Krusic, A. Curtis, J. Sakulich, S. Bijaksana, S.
Zulaikah, and L.O. Ngkoimani, 2006. Monsoon drought over Java, Indonesia,
during the past two centuries. Geophysical Research Letters 33: L04709,
doi:10.1029/2005GL025465.
Doren, R.F., W.J. Platt, and L.D. Whiteaker, 1993. Density and size structure of pine
stands in the everglades region of south Florida. Forest Ecology and Management 59:
295–311.

59
Douglass, A.E., 1934. Editorial. Tree-Ring Bulletin 1: 2–3.
Douglass, A.E., 1941. Notes on the technique of tree-ring analysis, II: Cell illumination.
Tree-Ring Bulletin 7: 28–34.
Enfield, D.B., A.M. Mestas-Nuñez, and P.J. Trimble, 2001. The Atlantic Multidecadal
oscillation and its relation to rainfall and river flows in the continental U.S.
Geophysical Research Letters 28: 2077–2080.
Ford, C.R., and J.R. Brooks, 2002. Detecting forest stress and decline in response to
increasing river flow in southwest Florida, USA. Forest Ecology and Management 160:
45–64.
Ford, C.R., and J.R. Brooks, 2003. Hydrological and climatic responses of Pinus elliottii
var. densa in mesic pine flatwoods Florida, USA. Annals of Forest Science 60: 385–392.
Forest Products Laboratory, 1974. Wood Handbook: Wood as an Engineering Material.
USDA Forest Service. Agricultural Handbook 72.
Foster, T.E., and J.R. Brooks, 2001. Long-term trends in growth of Pinus palustris
and Pinus elliottii along a hydrological gradient in central Florida. Canadian Journal
of Forest Research 31: 1661–1670.
Fritts, H.C., 1976. Tree Rings and Climate. Academic Press, New York.
Fritts, H.C., and W. Xiangding, 1986. A comparison between response-function
analysis and other regression techniques. Tree-Ring Bulletin 46: 31–46.
Fritts, H.C., T.J. Blasing, B.P. Hayden, and J.E. Kutzbach, 1971. Multivariate techniques
for specifying tree-growth and climate relationships and for reconstructing
anomalies in paleoclimate. Journal of Applied Meteorology 10: 845–864.
Gou, X., F. Chen, G. Jacoby, E.R. Cook, M. Yang, J. Peng, and Y. Zhang, 2007. Rapid
tree growth with respect to the last 400 years in response to climate warming,
northeastern Tibetan Plateau. International Journal of Climatology 27: 1497–1503.
Gray, S.T., L.J. Graumlich, J.L. Betancourt, and G.T. Pederson, 2004. A tree-ring based
reconstruction of the Atlantic Multidecadal Oscillation since 1567 A.D. Geophysical
Research Letters 31: L12205, doi:10.1029/2004GL019932.
Grissino-Mayer, H.D., 2001. Evaluating crossdating accuracy: a manual for the
program COFECHA. Tree-Ring Research 57: 205–219.

60
Grissino-Mayer, H.D., and D.R. Butler, 1993. Effects of climate on growth of shortleaf
pine (Pinus echinata Mill.) in northern Georgia: A dendroclimatic study. Southeastern
Geographer 33: 65–81.
Henderson, J.P., and H.D. Grissino-Mayer, 2009. Climate-tree growth relationships of
longleaf pine (Pinus palustris Mill.) in the southeastern Coastal Plain, USA.
Dendrochronologia: 27: 31–43.
Holmes, R.L., 1983. Computer-assisted quality control in tree-ring dating and
measurement. Tree-Ring Bulletin 43: 69–78.
Kaplan, A., M. Cane, Y. Kushnir, A. Clement, M. Blumenthal, and B. Rajagopalan,
1998. Analyses of global sea surface temperature 1856–1991. Journal of Geophysical
Research 103: 18567–18589.
Langdon, O.G., 1963. Growth patterns of Pinus elliottii var. densa. Ecology 44: 825–827.
Laing, A., M. LaJoie, S. Reader, and K. Pfeiffer, 2008. The influence of the El Nino-
Southern Oscillation on cloud-to-ground lightning activity along the Gulf Coast.
Part II: Monthly Correlations. Monthly Weather Review 136: 2544–2556.
Little, E.L. and K.W. Dorman, 1954. Slash pine (Pinus elliottii), including South Florida
slash pine, nomenclature and description. U. S. Forest Service Southeast Forest
Experimental Station Paper 36, 82 pp.
National Oceanic and Atmospheric Administration (NOAA), 2010. Website: www.
ncdc.noaa.gov/oa/ncdc.html. National Climatic Data Center, US Department of
Commerce. Accessed 15 March 2010.
Noss, R.F., E.T. LaRoe, and J.M. Scott, 1995. Endangered Ecosystems of the United States:
A Preliminary Assessment of Loss and Degradation. U.S. Department of the Interior,
Biological Report 28, Washington D.C.
O’Brien, J.J., 1998. The distribution and habitat preferences of rare Galactia species
(Fabaceae) and Chamaesyce deltoidea subspecies (Euphorbiaceae) native to southern
Florida pine rockland. Natural Areas Journal 18: 209–222.
Olson, Jr., D.F., 1952. Regeneration of south Florida slash pine is subject of new
research. U.S. Forest Service, Southeastern Forest Experiment Station, Research Note
18.

61
Orvis, K.H., and H.D. Grissino-Mayer, 2002. Standardizing the reporting of abrasive
papers used to surface tree-ring samples. Tree-Ring Research 58: 47–50.
Palmer, W.C., 1965. Meteorological drought. U.S. Weather Bureau Research Paper No.
45.
Ropelewski, C.F., and M.S. Halpert, 1986. North American precipitation and
temperature patterns associated with the El Niño Southern Oscillation (ENSO).
Monthly Weather Review 114: 2352–2362.
Ropelewski, C.F., and M.S. Halpert, 1996. Quantifying Southern Oscillation-
precipitation relationships. Journal of Climate 9: 1043–1059.
Sah, J.P., M.S. Ross, S. Koptur, and J.R . Snyder, 2004. Estimating aboveground
biomass of broadleaved woody plants in the understory of Florida Keys pine
forests. Forest Ecology and Management 203: 319–329.
Sah, J.P., M.S. Ross, J.R. Snyder, and D.E. Ogurcak, 2010. Tree mortality following
prescribed fire and a storm surge event in slash pine (Pinus elliottii var. densa)
forests in the Florida Keys, USA. International Journal of Forestry Research, Art.
204795, doi:10.1155/2010/204795.
Schmidt, N., E.K. Lipp, J.B. Rose, and M.E. Luther, 2001. ENSO influences on seasonal
rainfall and river discharge in Florida. Journal of Climate 14: 614–628.
Snyder, J.R., A. Herndon, and W.B. Robertson Jr., 1990. South Florida Rocklands. In
Ecosystems of Florida, edited by R.L. Myers and J.J. Ewel, pp. 230–277. University of
Central Florida Press, Orlando, Florida.
Speer, J.H., 2010. Fundamentals of Tree-Ring Research. University of Arizona Press,
Tucson.
Speer, J.H., K.H. Orvis, H.D. Grissino-Mayer, L.M. Kennedy, and S.P. Horn, 2004.
Assessing the dendrochronological potential of Pinus occidentalis Swartz in the
Cordillera Central of the Dominican Republic. The Holocene 14: 563–569.
Stokes, M.A., and T.L. Smiley, 1996. An Introduction to Tree-Ring Dating. University of
Arizona Press, Tucson, AZ (originally pub. 1968 by U. of Chicago Press).

62
Tomlinson, P.B., and F.C. Craighead, 1972. Growth ring studies on the native trees of
subtropical Florida. In Research Trends in Plant Anatomy, edited by A.K.M. Ghouse
and M. Yunus, pp. 39–51. Tata McGraw-Hill, Bombay.
Trenberth, K.E., and D.P. Stephaniak, 2000. Indices of the El Niño evolution. Journal of
Climate 14: 1697–1701.
Tudhope, A.W., C.P. Chilcott, M.T. McCulloch, E.R. Cook, J. Chappell, R.M. Ellam,
D.W. Lea, J.M. Lough, and G.B. Shimmield, 2001. Variability in the El Nino-
Southern Oscillation through a glacial-interglacial cycle. Science 291: 1511–1517.
Winsberg, M.D. 2003. Florida Weather. University Press of Florida, Gainesville, FL.

63
Chapter 3
Cambial Activity of Pinus elliottii var. densa Reveals Influence of Seasonal
Insolation on Growth Dynamics in the Florida Keys

64
Chapter 3
Cambial Activity of Pinus elliottii var. densa Reveals Influence of Seasonal
Insolation on Growth Dynamics in the Florida Keys
This chapter represents a slightly revised version of a manuscript that was accepted for
publication by a peer-reviewed journal as: Grant L. Harley, Henri D. Grissino-Mayer,
Jennifer A. Franklin, Chad Anderson, and Nesibe Köse (2012). Cambial activity of Pinus
elliottii var. densa reveals influence of seasonal insolation on growth dynamics in the
Florida Keys. Trees–Structure and Function, In Press. The final publication is available at
springerlink.com. The revisions follow suggestions made by members of my
dissertation committee. The use of “we” in this chapter refers to my co-authors and
myself. As the first author, I was lead on designing the study, obtaining the data,
performing analyses, and writing the manuscript.
3.1 Abstract
We determined the temporal and seasonal dynamics of intra-annual cell
formation of south Florida slash pine (Pinus elliottii Engelm. var. densa Little & Dor.), the
southernmost native pine in the United States and the foundation species of globally
endangered pine rockland ecosystems. To assess intra-annual cambial activity and
identify possible relationships between cell production and climatic factors, wood
micro-cores were extracted monthly from six trees during the period March 2010 to
March 2011. The results confirmed annual growth ring formation in P. elliottii var. densa
and indicated that its growing season extends from February to December, with a short
period of dormancy that varied little between individuals. Within the growing season,
earlywood cells were produced from February to July and latewood cells were
produced from July to December. Intra-annual density fluctuations (IADFs) occurred in

65
the growth rings of four of six trees between July and August. A principal component
analysis indicated a homogeneous response of cambial activity among trees to site-
specific climatic factors. The first principal component axis explained 71% of the total
variance in cell production during the study period. Our results indicated that the
dynamics of seasonal cambial activity of P. elliottii var. densa are controlled by solar
radiation (r = 0.51, p < 0.10) in the Florida Keys. The nature of our data allow us to only
speculate on the ecophysiological processes responsible for IADFs in P. elliottii var.
densa, and additional research is needed to better understand the relationship between
their formation and the environment in the Lower Florida Keys.
3.2 Introduction
The science of dendrochronology has traditionally been restricted to temperate
regions, where the majority of tree species produce a single and explicit growth ring
each year in response to seasonal changes in temperature or precipitation (Speer et al.
2004, Speer 2010). However, a recent surge of dendrochronology into the tropics and
subtropics continues to reveal the occurrence of annual growth rings in areas
previously thought unsuitable for the science (Speer et al. 2004; Brienen and Zuidema
2006; Buckley et al. 2007; Baker et al. 2008). Tree-ring records from these areas are
important because the tropics are the center of action for many broad-scale climate
phenomena (e.g. El Niño-Southern Oscillation; D’Arrigo et al. 2006) and these data
provide rare opportunities for understanding the ecological dynamics of tropical and

66
subtropical communities (Brienen et al. 2009). Because dendrochronology relies on
precise tree-ring dating procedures to ensure that each growth ring is correctly assigned
to the exact calendar year in which it formed, new dendrochronological studies in the
tropics and subtropics should first verify the annual nature of cambial activity and
investigate climatic triggers responsible for this phenomenon. Intra-annual cambial
activity data provide a greater confidence in the growth ring chronologies that are
developed for these areas (Stahle 1999; Worbes 1995, 2002).
South Florida slash pine (Pinus elliottii Engelm. var. densa Little & Dor.; hereafter
slash pine) is the southernmost native and the only subtropical pine in the United States
(Little and Dorman 1954). The native range of slash pine is limited to the southern half
of peninsular Florida, with a few small disjunct populations located in the Lower
Florida Keys (LFK). We recently discovered that slash pine produces consistently
annual growth rings in the LFK and can be a useful species for various
dendrochronological applications (Harley et al. 2011). However, little is known about
the seasonal wood formation dynamics of the species (e.g. timing of cambial
reactivation, dormancy, earlywood formation, and latewood formation) or what
climatic factors are responsible for variations in intra-annual radial growth. A better
understanding of the intra-annual radial growth of slash pine not only contributes to a
deeper knowledge of its growth dynamics, but also has ecological and climatic
implications. As the foundation species for globally-endangered pine rockland

67
communities, the ecological status of slash pine is important for the long-term
persistence of these communities. Furthermore, slash pines in the LFK are uniquely
positioned between the Gulf of Mexico and Atlantic Ocean, and could possibly reveal
long-term ocean-climate interactions as well as hurricane activity.
In the LFK, slash pine forms anatomically distinct growth rings with boundaries
marked by tracheid cells that have thicker cell walls and small cell lumens, similar to
the latewood cells of the other southern yellow pines (e.g. Pinus elliottii Engelm. var.
elliottii, Pinus palustris Mill., Pinus echinata Mill., Pinus taeda L.) (Harley et al. 2011).
Previous investigations provided evidence in support for the formation of annual
growth rings in slash pine located in south Florida. By measuring the incremental radial
growth of 10 mature trees near Naples, Florida (26° 24’ N, 81° 36’ W) during the period
1956–1959, Langdon (1963) found that the first spring flush of growth occurred in early
February, and 37% of the annual growth occurred from February to April, 35% from
May to August, 25% from September to November, and 3% from December to January
(no dormancy period). Diameter growth had two peaks; one in spring, centered on
March, and another in the fall, centered on September. Langdon found that the 10-
month period during which most radial growth occurred (February to November)
contributed to a high percentage of latewood and therefore high wood density. The
specific gravity of slash pine is 0.845 (Olson 1952), the highest of all pine species in the
United States (Forest Products Laboratory 1974). He further discovered that the lack of

68
moisture during drought conditions in 1956 did not affect radial growth considerably,
which he attributed to the fact that the wilting point was not reached in the lower soil
depths, where he postulated moisture was still available to trees. Although his study
was not conducted at the cellular scale and did not specifically correlate radial growth
with climate factors, Langdon was the first to present a basic understanding of the slash
pine growing season in south Florida. Because changes in diameter can also be due to
shrinking and swelling of the stem as water content changes (Klepper et al. 1971),
measures of diameter growth may provide an accurate estimate of cambial activity over
seasons or years, but may not have a high level of precision over shorter intervals such
as weeks or months.
Recently, Harley et al. (2011) described the growth ring anatomy of slash pine
and provided evidence that the species forms consistently annual growth rings at its
southernmost range limit in the LFK. We were able to crossdate living trees and
remnant wood and developed a tree-ring chronology for the period 1871–2009.
Comparisons of our tree-ring chronology to divisional climate data suggested a weak,
albeit statistically significant (p < 0.05), relationship between annual radial growth (total
ring width) and water availability during the later months of the growing season.
Correlation analysis produced significant negative correlations between radial growth
and current September and previous September and November temperature, and a
significant positive correlation with current September precipitation. The weak inter-

69
annual climate signal found in slash pine indicated the need to better understand the
influences of climate on intra-annual radial growth.
Despite several indications of seasonal cambial activity in slash pine (Langdon
1963; Harley et al. 2011), the timing and climatic factors responsible for the occurrence
of anatomically distinct growth rings are unclear. In this study, we use anatomical
evidence to examine the timing of growth ring formation in slash pine, and investigate
relationships between climatic variables and intra-annual xylem differentiation at the
southernmost distribution limit of this species during the period March 2010–March
2011.
3.3 Methods
3.3.1 Ecological setting
The island of Big Pine Key (24° 42’ N, 81° 22’ W) contains the largest contiguous
area (920 ha) of pine rockland habitat that remains at the southernmost extent of its
range in the United States (Figure 3.1). Slash pine stands are characterized by a
monospecific overstory, a diverse subcanopy of West Indian shrubs and palms, and a
variety of endemic herbs (Sah et al. 2004). The pine rocklands on Big Pine Key are
located within the National Key Deer Refuge (NKDR), which is managed by the United
States Fish and Wildlife Service (USFWS).

70
Figure 3.1. Map of current pine rockland distribution (black) and study site location
(hatched area) in the National Key Deer Refuge, Lower Florida Keys, USA.

71
During the period 1895–2011, the tropical savanna climate of the LFK was
characterized by hot summers (average maximum August temperature < 32 °C), cool
winters (average minimum January temperature > 19 °C), and summer-wet, winter-dry
seasons. The average annual precipitation was 980 mm, with ca. 70% occurring from
May to November (NCDC 2011; Figure 3.2). On the rocklands, soil is thin to non-
existent and Pleistocene-aged Miami limestone is exposed at the surface (Snyder et al.
1990).
3.3.2 Micro-core sampling and preparation
To better understand the annual growth patterns of slash pine in the LFK,
seasonal cambial activity of slash pine was monitored for 13 months (March 2010–
March 2011). Within the pine rocklands of the NKDR, six mature trees were selected
and tissue samples extracted by taking shallow micro-cores (4 mm diameter and 10 mm
length) containing phloem, cambium, and outer xylem with an increment hammer
(Haglöf Inc., Madison, MS, USA). Monthly samples were extracted starting 15 March
2010 and occurred on day 15±2 of each subsequent month during the study period.
Selected trees were approximately the same age (80 years) and were first assessed for
presence of compression wood/symmetrical growth. To minimize effects of wounding
and subsequent effects on our analyses, micro-cores were taken in a zigzag pattern from
an area 30 cm above and below breast height (Rossi et al. 2007; Gruber et al. 2009;
Begum et al. 2010), and at least 5 cm apart to avoid the interference of resin ducts on

72
adjacent cores, which is a common reaction to disturbance in conifers (Deslauriers et al.
2003).
Samples were immediately placed in vials containing a preservative solution and
stored at 5° C overnight to avoid any tissue deterioration (Rossi et al. 2007). The
preservative solution contained a mixture of 1.6–2% paraformaldehyde and 2–2.5%
glutaraldehyde in a 0.05 M phosphate buffer at pH 6.8 (Yeung 1999). After being fixed
in preservative solution, samples were dehydrated in a graded ethanol series (70%,
80%, 90%, 100%), embedded in glycolmethacrylate (Technovit 7100), and polymerized
by adding an accelerator. Transverse sections of c. 6 µm thickness were cut with a rotary
microtome using a tungsten-carbide blade and placed on glass slides. Slides were dried
at 40 °C overnight, stained with safranin (0.5% in 95% ethanol), and permanently fixed
with Permount®.
3.2.3 Cell analysis
A Nikon Eclipse 800 light microscope (bright field and polarized light) and the
NIS Elements image analysis system were used for observations of cells at various
stages of development. On each sample, we counted the number of cells in the radial
enlargement (Re), wall thickening (Wt), and mature (Mt) phase along three radial files
(Figure 3.3). The location of the cambium at the end of the previous growing season was
easily identified by two to three radially flattened fusiform cells (Riding and Little
1984). Cells from both the cambial zone and in the radial enlargement phase (xylem)

73
Figure 3.2. Climograph showing the average monthly day length (hours), precipitation
(mm), potential evapotranspiration (POTET; cm), temperature (°C), and solar radiation
(W/m-2) recorded by the USFWS weather station on Big Pine Key from January 2010 to
March 2011.

74
had thin primary walls that were light pink in color. Cells in the cambial zone and
radial enlargement phase were easily identifiable and characterized by only primary
walls, while tracheids in the wall thickening phase had secondary walls that displayed
strong bi-refringence in polarized light (Zimmermann 1964; Riding and Little 1984).
These cells changed from light pink in the beginning of the process to dark red near the
mature cell state. Xylem cells were considered mature or entirely lignified when they
were completely dark red (Figure 3.3). The number of cells along each of the radial files
was averaged for each sample.
3.2.4 Cell standardization
Cell number varies within tree circumference and height along the stem, and
thus requires standardization between samples (Creber and Chaloner 1984; Rossi et al.
2003). For each sample, the total cell number of the previous growth ring (2009) was
recorded and used to correct the cell number for each month. The cell number in each j-
sample (i.e. monthly throughout 2010 growing season) and by each i-phase (i.e. Re, Wt,
Mt) was corrected as follows:
ncij = nij x nm/ns
Here ncij is corrected cell number, nij is the counted cell number, nm is mean cell number
of the previous growth ring of all j-samples, and ns is the cell number of the previous
growth ring for each j-sample.

75
3.2.5 Cell production-climate relationships
Exploratory methods were used to investigate potential climatic controls on seasonal
wood formation dynamics. Climatic factors influencing growth were described as
monthly (from March 2010 to March 2011) series of mean day length (hours), total
potential evapotranspiration (cm; calculated using Thornthwaite’s method), mean solar
radiation (W/m-2), total precipitation (mm), and mean air temperature (°C). Day length
was calculated for the study site, while microclimate data for the remaining variables
were gathered from the USFWS weather station on Big Pine Key. The weather station
included a sensor that recorded solar radiation (i.e. insolation), which was measured as
the instantaneous solar energy flow received at the station. Based on initial correlations
between climatic variables and individual trees, we used principal component analysis
(PCA) to assess the homogeneity of intra-annual tracheid production between all six
individuals. Monthly cell numbers were used to calculate principal components (PCs),
such that PCs indicated the common variance in tracheid production between trees (e.g.
Oliveira et al. 2009). To assess the possible relationships between tracheid production
and climatic factors, Pearson product-moment correlation analysis (r) was used to
identify relationships between PC axes and climatic variables.

76
3.3 Results
3.3.1 Intra-annual cambial activity
Cambial activity started prior to the first sampling on 15 March 2010 in all six
trees. At that time, the average cambial zone was already six cell-layers wide and
consisted of cells in the Re and Wt phase (Figs. 4 and 5). This prevented a precise
determination of cambial reactivation for the 2010 growing season. During the study
period, the cambial zone consisted of 2–4 Re cells and 1–3 Wt cells each month, and this
was consistent among trees (Figure 3.4). Although the total number of tracheids
produced from March 2010–March 2011 ranged from 12 to 40, the timing of radial
growth was fairly consistent among trees during the study period; however, the
monthly production of tracheids varied markedly during this time (i.e. high variation in
cell production between months) (Figure 3.5). During 2010, the greatest variance in
tracheid production occurred from June to August. As expected, when cambial activity
started for the new growing season in February 2011, variance was the highest among
trees.
Although the monthly and annual production of cells was highly variable
between individuals, there was little variation in the timing of earlywood and latewood
tracheid formation (Figure 3.5). For most trees, earlywood cells were produced from
March to June. On average, we observed two rows of Mt latewood tracheids in June;
therefore the earlywood/latewood transition occurred shortly before the June sampling
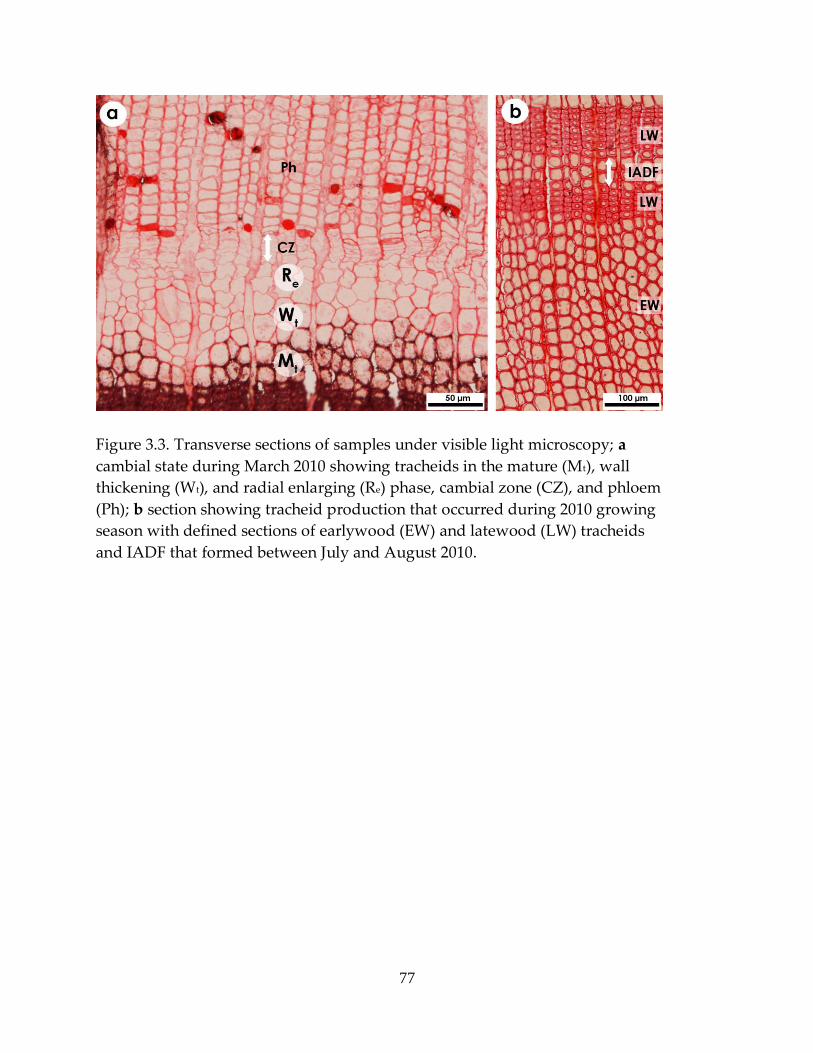
77
Figure 3.3. Transverse sections of samples under visible light microscopy; a
cambial state during March 2010 showing tracheids in the mature (Mt), wall
thickening (Wt), and radial enlarging (Re) phase, cambial zone (CZ), and phloem
(Ph); b section showing tracheid production that occurred during 2010 growing
season with defined sections of earlywood (EW) and latewood (LW) tracheids
and IADF that formed between July and August 2010.

78
Figure 3.4. Number of cells (standardized) in radial enlargement phase, wall
thickening phase, mature cells, and total number in the six sampled slash pine trees
on Big Pine Key, Lower Florida Keys. Note that y-axes differ.

79
Figure 3.5. Temporal variations of cambial activity; a timing of earlywood-
latewood production, cambial dormancy, and IADF (Intra-annual density
fluctuation) formation in the six sampled trees; b monthly mean number
of cells formed among all trees (black dots with bars) plotted with
monthly mean values of temperature (°C; dashed black), solar radiation
(W/m-2; solid black), and day length (hours; solid gray). Bars represent
variance.

80
effort in four trees. The earlywood/latewood transition was not observed for the
remaining two trees until July. The timing of latewood tracheid production was slightly
more variable among trees than earlywood production. We observed latewood cells
from June/July to December for three trees, and from June/July to January for the
remaining trees.
The dormant cambium consisted of 2–3 cells positioned adjacent to Mt latewood
tracheids when there was no cambial activity. A dormant cambium was observed for
three trees during December indicating that the radial growth of those individuals
ceased sometime between our November and December sampling efforts. However, a
dormant cambium was observed for all trees in January. The cambial zone was active
by February 2011 in all trees, indicating that cambial reactivation occurred between our
January and February sampling efforts, and the production of tracheids was highly
variable at this time (Figure 3.5).
Intra-annual density fluctuations (IADFs) are a common occurrence within the
annual growth rings of slash pine in the LFK, and likewise we observed them in the
majority of sampled trees during the study period. IADFs consisted of radially enlarged
tracheids (larger cell lumen) that were 2–4 cell layers wide and positioned within the
latewood zone of the annual growth ring (Figure 3.3). More specifically, IADFs were
characterized by increased production of cells in the radial enlargement phase in Trees
1, 2, 5, and 6 (Figure 3.4). The timing of IADF formation in all four trees was consistent
81
and occurred between the July 15th and August 15th sampling efforts (Figure 3.5). We
did not notice any apparent differences in total cell number, earlywood/latewood
timing, or climate response between the four individuals that contained IADFs and the
two without.
3.3.2 Association between cambial activity and climatic factors
PCA indicated a homogeneous response of cambial activity among trees to site-
specific climatic factors. Of the six PCs, most of the common variance in tracheid
production during the 2010 growing season was explained by PC1 and PC2 with 71%
(eigenvalue = 4.23) and 18% (eigenvalue = 1.03), respectively (Table 1). We found a
statistically significant positive correlation between PC1 and mean monthly solar
radiation (r = 0.51; p < 0.10; n = 13; Figure 3.6). A visual assessment of monthly mean
solar radiation values and cell production during the study period was convincing
(Figure 3.5). Cambial dormancy in all six individuals occurred during the same time as
the solar minimum, suggesting that dormancy was induced by decreased levels of
insolation or short day length. Furthermore, the correlation between PC1 and day length
was noteworthy (r = 0.28, p > 0.10), but not surprising, given the close relationship
between solar radiation and day length throughout the year. Although not statistically
significant (p > 0.10), the highest correlation between PC2 and our climate variables was
with POTET (r = 0.28). We also found statistically significant correlations (p < 0.10)
between PC5 and day length, precipitation, temperature, and POTET; however this axis

82
Table 3.1. Parameters of principal component analysis (PCA) and Pearson correlations
between PC axes and site-specific climatic variables.
PCA Parameters Correlations with climatic variables
Eigenvalue
Variance
explained (%)
Solar
radiation
Day
length Precipitation Temperature POTET
PC1
PC2
PC3
PC4
PC5
PC6
4.23
1.08
0.32
0.18
0.12
0.07
71
18
5
3
2
1
0.51*
0.09
0.16
–0.15
–0.40*
–0.20
0.28
0.02
–0.16
–0.20
–0.54*
–0.11
–0.20
0.05
0.08
–0.14
–0.56*
0.01
0.13
0.24
0.05
–0.21
–0.69*
–0.01
0.10
0.28
0.00
–0.02
–0.74*
–0.02

83
Figure 3.6. Pearson product-moment correlations between PC1 (n = 6 trees) and climate
parameters. POTET potential evapotranspiration.

84
explained little of the variance in tracheid production throughout the growing season
(Table 1). Although our study design was not devised to specifically test the
relationship between IADFs and climatic variables, there was a visual correspondence
between the timing of IADFs and a period of increased solar radiation during August
2010 (Figure 3.7).
3.4 Discussion
Based on previous investigations by Langdon (1963) and Harley et al. (2011), we
expected to find that slash pine forms earlywood tracheids from February to July,
latewood tracheids from July to February, and the cambium has no period of rest (e.g.
activity in the cambial zone during December and January slows considerably). Our
data supported the assumption that most trees formed earlywood tracheids from March
to June and then latewood tracheids until December. However, we did not expect to
find that all trees experienced a period of cambial dormancy. Yet, this explains the
anatomically distinct and clear boundaries, rather than diffuse boundaries, found
between growth rings of slash pine at the study site.
The dendroclimatological analyses of Harley et al. (2011) revealed that inter-
annual radial growth was positively correlated with current year September
precipitation, indicating that increased late-season rainfall during September yields a
longer growing season, thus producing a wider-than-average growth ring. We,
however, found no evidence that precipitation was an important component of the

85
Figure 3.7. Visual correspondence between climate parameters of precipitation (mm), solar radiation (W/m-2), temperature
(C), and POTET (potential evapotranspiration; cm) from June 2008 to March 2011 and IADFs that occurred in four of six
trees (grey hashed bar).

86
intra-annual growth dynamics of slash pine in the LFK. The difference in results might
be explained by that fact that Harley et al. (2011) tested the relationships between tree
growth and monthly climatic variables (temperature and precipitation) from 1895 to
2009, and our study, which had fewer replicates, produced climate-growth relationships
at a much finer scale and for only the 2010 growing season.
We provided evidence that suggests the seasonal variation of solar radiation (i.e.
insolation) is one of the primary controls of the intra-annual growth dynamics of slash
pine in the LFK. Photoperiodism has long been recognized to control the seasonal
growth dynamics of temperate plant species (Garner and Allard 1920; Downs and
Borthwick 1956; Wareing 1956; Thomas and Vince-Prue 1997). However, the
photoperiodic induction of phenological changes in temperate trees is generally masked
by the low winter temperatures experienced at higher latitudes (e.g. rising temperatures
in the spring induce cambial reactivation; Calle et al. 2010). Because all previous
investigations were focused on plant species living in temperate and subpolar regions,
only recently has the importance of seasonal insolation on tree phenology been revealed
in subtropical/tropical environments (Borchert and Rivera 2001; Rivera and Borchert
2001).
Our results agree with several studies that recently recognized the seasonal
variation of insolation, although too small to be identified by humans, controls tree
growth dynamics in many tropical and subtropical locations (Yeang 2007; Calle et al.

87
2009, 2010). Between the winter and summer solstices, day length in the LFK ranges
from 10.5 h to 13.25 h (ca. 165 min), which is much greater than any of the
aforementioned studies. At ca. 24° N latitude, the geography of slash pines in the LFK
and the associated climate regime (warm temperatures, adequate annual rainfall)
possibly explain seasonal variations in daily insolation as one of the primary drivers of
tracheid production. Although the LFK experiences distinct summer-wet, winter-dry
seasons, correlation data between climate and tracheid production do not support the
notion that precipitation has a major influence on seasonal slash pine radial growth
dynamics. Given that Harley et al. (2011) found inter-annual climate-tree growth
correlations with the month of September, Langdon (1963) found that drought
conditions during 1956 did not affect radial growth considerably, and the compelling
association between intra-annual tracheid production and climate found by this study,
we propose that seasonal variations in tracheid production of slash pines are controlled
primarily by insolation.
For the 2010 growing season, the majority of our sampled trees contained IADFs,
which consisted of thin bands of radially enlarged tracheids positioned within the
latewood zones of annual growth rings. In all four trees, which had similar growth
dynamics, IADFs occurred between July and August. The relationship between IADFs
and climate has been studied in various temperate species (e.g. Wimmer et al. 2000;
Rigling et al. 2001, 2002; Masiokas and Villalba 2004;) and Mediterranean species (e.g.

88
Cherubini et al. 2003; De Micco and Arrone 2009; Copenheaver et al. 2010; Campelo et
al. 2006, 2007; de Luis et al. 2011; Battipaglia et al. 2010), and the ecophysiological
processes responsible for their formation can be difficult to interpret (De Micco et al.
2011). The majority of the aforementioned studies, which defined IADFs as being thin
bands of radially flattened tracheids, found drought stress to cause IADFs during the
growing season. However, the IADFs we observed in slash pine were characterized by
thin bands of radially enlarged tracheids (larger cell lumen), which indicated a growth
increase between our July 15th and August 15th sampling efforts. This growth increase
was characterized by the increased production of cells in the radial enlarging (Re) phase,
as seen in the four individuals that contained IADFs (Trees 1, 2, 5, 6; Figure 3.4).
We noticed a visual correspondence between the timing of IADFs and a period of
increased solar radiation during August 2010 (Figure 3.7). As in 2009, solar radiation
during 2010 started to decrease in May. However, unlike 2009 solar radiation during
August 2010 was marked by a rapid increase, with values similar to those recorded
during the annual peak in May. A similar period of fluctuating solar radiation
resembling that between June and August 2010 was not recorded in 2009. The solar
radiation sensor was installed at the Big Pine Key weather station in June 2008, and this
timing precluded a comparison of IADFs and solar radiation before 2009. Moreover, we
were unable to determine whether the period of increased solar radiation from July
through August was anomalous given our sample depth (n = 2). Nonetheless, although

89
IADFs are prevalent in slash pine at this location (Harley et al. 2011), the 2008 and 2009
growth rings did not contain them. Given the relationship between seasonal insolation
and tracheid production shown by the PCA results, it is possible that amplified solar
radiation from July through August augmented photosynthate production in trees and
resulted in increased xylem production, as seen in the properties of the IADFs.
As De Micco et al. (2011) highlighted, specific and robust methodologies are
necessary to avoid misleading interpretations of IADFs in tree rings. Hence, our data
are not appropriate for making strong suggestions on the relationships between IADFs
and climatic factors in slash pine given our study design. We here highlight the
possibility that changes in solar radiation might be responsible for the occurrence of
IADFs. Additional research that includes more trees and an appropriate study design
(longer term with higher resolution) is needed to better understand the relationships
between IADFs and the environment in the LFK.
3.5 Conclusions
We demonstrated that the growing season of slash pine, the southernmost native
and only subtropical pine in the United States, was characterized by a short but
consistent period of dormancy from December to January, the formation of earlywood
tracheids from February to June, and the formation of latewood tracheids from June to
December. Based on our present results, we propose that the initiation of cambial
activity, production of tracheids throughout the growing season, and cambial
90
dormancy are controlled primarily by seasonal insolation. We noticed a visual
correspondence between the timing and occurrence of IADFs and increased solar
radiation from July through August. Given the characteristics of the IADFs (radially
enlarged tracheids, increased production of cells in the radial enlargement phase) and
the coupled timing of their occurrence with a period of solar radiation increase, this
visual comparison suggests that IADFs during the 2011 growing season were caused by
increased solar radiation. However, because IADFs can be caused by various factors (i.e.
drought, wind stress), more research is needed to better understand their occurrence in
LFK slash pine environments.
3.6 Acknowledgments
This research was funded by National Science Foundation grant BCS-1002479
and the United States Fish and Wildlife Service. G.L. Harley was partially supported by
the National Science Foundation under grant DGE-0538420 and the University of
Tennessee Yates Dissertation Fellowship. We thank Anne Morkill for access to the
National Key Deer Refuge; Jennifer Adams at Everglades National Park for climate
data; Katherine Perry and Joshua Albritton for field assistance; Zheng-Hua Li, Qunkang
Cheng, Lisa Vito, and Mark Windham for laboratory assistance; and two anonymous
reviewers for comments that improved earlier drafts of this manuscript.

91
References
Baker PJ, Palmer JG, D’Arrigo R (2008) The dendrochronology of Callitris intratropica in
northern Australia: annual ring structure chronology development and climate
correlations. Aust J Bot 56:311–320
Battipaglia G, De Micco V, Brand WA, Linke P, Aronne G, Saurer M, Cherubini P (2010)
Variations of vessel diameter and δ13C in false rings of Arbutus unedo L. reflect
different environmental conditions. New Phytol 188:1099–111
Begum S, Nakaba S, Oribe Y, Kubo T, Funada R (2010) Cambial sensitivity to rising
temperatures by natural condition and artificial heating from late winter to early
spring in the evergreen conifer Cryptomeria japonica. Trees 24:43–52
Borchert R, Rivera G (2001) Photoperiodic control of seasonal development and
dormancy in tropical stem-succulent trees. Tree Physiol 21:213–221
Brienen RJW, Zuidema PA (2006) The use of tree rings in tropical forest management:
projecting timber yields of four Bolivian tree species. For Ecol Manage 226:256–267
Brienen RJW, Lebrija-Trejos E, Van Breugel M, Pérez-García EA, Bongers F, Meave JA,
Martínez-Ramos M (2009) The potential of tree rings for the study of forest
succession in southern Mexico. Biotropica 41:186–195. doi: 101111/j1744-
7429200800462x
Buckley BM, Palakit K, Duangsathaporn K, Sanguantham P, Prasomsin P (2007)
Decadal-scale droughts over northwestern Thailand over the past 448 years: links
to the tropical Pacific and Indian Ocean sectors. Clim Dynam 29:63–71
Calle Z, Strahler AH, Borchert R (2009) Daily insolation induces synchronous flowering
of Montanoa and Simsia (Asteraceae) between Mexico and the Equator. Trees
23:1247–1254
Calle Z, Schlumpberger BO, Piedrahita L, Leftin A, Hammer SA, Tye A, Borchert R
(2010) Seasonal variation in daily insolation induces synchronous bud break and
flowering in the tropics. Trees 24:865–877

92
Campelo F, Gutierrez E, Ribas M, Nabais C, Freitas H (2007) Relationships between
climate and double rings in Quercus ilex from northeast Spain. Can J For Res 37
1915–1923
Campelo F, Nabais C, Freitas H, Gutierrez E (2006) Climatic significance of tree-ring
width and intra-annual density fluctuations in Pinus pinea from a dry Mediterranean
area in Portugal. Ann For Sci 64 229–238
Cherubini P, Gartner BL, Tognetti R, Bra¨ker OU, Schoch W, Innes JL (2003)
Identification, measurement and interpretation of tree rings in woody species from
Mediterranean climates. Biol Rev 78:119–14
Copenheaver CA, Gartner H, Schafer I, Vaccari FP, Cherubini P (2010) Drought-
triggered false ring formation in a Mediterranean shrub. Botany 88:545–555
Creber GT, Chaloner WO (1984) Influence of environmental factors on the wood
structure of living and fossil trees. Bot Rev 50:357–448
D’Arrigo RD, Wilson RJ, Palmer J, Krusic PJ, Curtis A, Sakulich J, Bijaksana S, Zulaikah
S, Ngkoimani LO (2006) Monsoon drought over Java Indonesia during the past two
centuries. Geophys Res Lett 33:L04709. doi:101029/2005GL025465
de Luis M, Novak K, Raventos J, Gricar J, Prislan P, Cufar K (2011) Climate factors
promoting intra-annual density fluctuations in Aleppo pine (Pinus halapensis) from
semiarid sites. Dendrochronologia 29:163–169
De Micco V, Aronne G (2009) Seasonal dimorphism in wood anatomy of the
Mediterranean Cistus incanus L subsp incanus Trees 23:981–989
De Micco V, Battipaglia G, Brand WA, Linke P, Saurer M, Aronne G, Cherubini P (2011)
Discrete versus continuous analysis and of anatomical and δ13C variability in tree
rings with intra-annual density fluctuations. Trees doi:10.1007/s00468-011-0612-4
Deslauriers A, Morin H, Begin Y (2003) Cellular phenology of annual ring formation of
Abies balsamea in the Quebec boreal forest (Canada). Can J For Res 33:190–200
Downs RJ, Borthwick HA (1956) Effects of photoperiod upon the growth of trees. Bot
Gaz 117:310–326

93
Forest Products Laboratory (1974) Wood Handbook: Wood as an Engineering Material.
USDA Forest Service Agricultural Handbook 72
Garner WW, Allard HA (1920) Effect of the relative length of day and night and other
factors of the environmental on growth and reproduction of plants. J Agric Res
18:553–606
Gruber A, Zimmermann J, Wieser G, Oberhuber W (2009) Effects of climate variables on
intra-annual stem radial increment in Pinus cembra (L) along the alpine treeline
ecotone. Ann For Sci 66:503–512
Harley GL, Grissino-Mayer HD, Horn SP (2011) The dendrochronology of Pinus elliottii
var. densa in the Lower Florida Keys: Chronology development and climate
response. Tree-Ring Res 67:39–50
Klepper B, Browning VD, Taylor HM (1971) Stem diameter in relation to plant water
status. Plant Physiol 48:683–685
Langdon OG (1963) Growth patterns of Pinus elliottii var. densa. Ecology 44:825–827
Little EL, Dorman KW (1954) Slash pine (Pinus elliottii) including South Florida slash
pine nomenclature and description. US Forest Service Southeast Forest Experimental
Station Paper 36, 82 pp
Masiokas M, Villalba R (2004) Climatic significance of intra-annual bands in the wood
of Nothofagus pumilio in southern Patagonia. Trees 18:696–704
National Climatic Data Center (NCDC) (2011) Asheville North Carolina.
www.ncdc.noaa.gov. Accessed 12 June 2011
Oliveira JM, Santarosa E, Pillar VD, Roig FA (2009) Seasonal cambium activity in the
subtropical rain forest tree Araucaria angustifolia. Trees 23:107–115
Olson Jr, DF (1952) Regeneration of south Florida slash pine is subject of new research.
United States Forest Service Southeastern Forest Experiment Station, Research Note
18
Riding RT, Little CHA (1984) Anatomy and histochemistry of Abies balsamea cambial
zone cells during the onset and breaking of dormancy. Can J Bot 62:2570–2579

94
Rigling A, Braker OU, Schneiter G, Schweingruber FH (2002) Intra-annual tree-ring
parameters indicating differences in drought stress of Pinus sylvestris forests within
the Erico Pinion in the Valais (Switzerland). Plant Ecol 163:105–121
Rigling A, Waldner PO, Forster T, Braker OU, Pouttu A (2001) Ecological interpretation
of tree-ring width and intra-annual density fluctuations in Pinus sylvestris on dry
sites in the central Alps and Siberia. Can J For Res 31:18–31
Rivera G, Borchert R (2001) Induction of flowering in tropical trees by a 30-min
reduction in photoperiod: evidence from field observations and herbarium
specimens. Tree Physiol 21:201–212
Rossi S, Deslauriers A, Morin H (2003) Application of the Gompertz equation for the
study of xylem cell development. Dendrochronologia 21:33–39
Rossi S, Deslauriers A, Anfodillo T, Carraro V (2007) Evidence of threshold
temperatures for xylogenesis in conifers at high altitudes. Oecologia 152:1–12
Sah JP, Ross MS, Koptur S, Snyder JR (2004) Estimating aboveground biomass of
broadleaved woody plants in the understory of Florida Keys pine forests. For Ecol
Manage 203:319–329
Snyder JR, Herndon A, Robertson Jr WB (1990) South Florida Rocklands. In: Myers RL,
Ewel JJ (ed) Ecosystems of Florida, University of Central Florida Press, Orlando, pp
230–277
Speer JH (2010) Fundamentals of Tree-Ring Research, University of Arizona Press,
Tucson
Speer JH, Orvis KH, Grissino-Mayer HD, Kennedy LM, Horn SP (2004) Assessing the
dendrochronological potential of Pinus occidentalis Swartz in the Cordillera Central
of the Dominican Republic. The Holocene 14:563–569
Stahle DW (1999) Useful strategies for the development of tropical tree-ring
chronologies. IAWA J 20:249–253
Thomas B, Vince-Prue D (1997) Photoperiodism in plants. Academic Press, San Diego
Wareing PF (1956) Photoperiodism in woody plants. Ann Rev Plant Pysiol 7:191–214

95
Wimmer R, Strumia G, Holawe F (2000) Use of false rings in Austrian pine to
reconstruct early growing season precipitation. Can J For Res 30:1691–1697
Worbes M (1995) How to measure growth dynamics in tropical trees―A review. IAWA
J 16:337–352
Worbes M (2002) One hundred years of tree ring research in the tropics―A brief history
and an outlook to future challenges. Dendrochronologia 20:217–231
Yeang HY (2007) Synchronous flowering of the rubber tree (Hevea brasiliensis) induced
by high solar intensity. New Phytol 175:283–289
Yeung EC (1999) The use of histology in the study of plant tissue culture systems: Some
practical comments. In Vitro Cell Develop Biol-Plant 35:137–143
Zimmermann MH (1964) The formation of wood in forest trees. Academic Press,
London

96
Chapter 4
Effects of Historical Fire on Structure of Globally Endangered Pine Rockland
Ecosystems in the Florida Keys

97
Chapter 4
Effects of Historical Fire on Structure of Globally Endangered Pine Rockland
Ecosystems in the Florida Keys
This chapter is a slightly revised version of a paper that was submitted to a peer-
reviewed journal as: Grant L. Harley, Henri D. Grissino-Mayer, Sally P. Horn (2012).
Effects of Historical Fire on Structure of Globally Endangered Pine Rockland
Ecosystems in the Florida Keys. International Journal of Wildland Fire. The revisions
follow suggestions made by members of my dissertation committee. The use of “we” in
this chapter refers to my co-authors and myself. As the first author, I was lead on
designing the study, obtaining the data, performing analyses, and writing the
manuscript.
4.1 Abstract
Fire is believed to influence the structure and dynamics of nearly all plant
communities in North America, but historical fire patterns and their consequences are
unknown for many community types. Here, we focus on the influence of historical fire
disturbance and varied fire management practices on structure and dynamics in
globally-endangered pine rockland savannas on Big Pine Key and No Name Key in the
Florida Keys. We reconstructed fire history in two stands from fire scars on South
Florida slash pines (Pinus elliottii Engelm. var. densa Little & Dor.) that were accurately
dated using dendrochronology, and quantified stand structure to infer successional
trajectories. Fire regimes on Big Pine and No Name Keys over the past 150 years
differed in fire return interval and relative spatial extent. Composite fire scar analysis
indicated that fires burned at intervals of 6 and 9 years (Weibull median probability
interval) on Big Pine Key and No Name Key, respectively, with the majority of fires

98
occurring late in the growing season. On Big Pine Key, fires were significantly fewer
after the National Key Deer Refuge was established in 1957, but pine recruitment was
widespread, likely due to multiple, widespread prescribed burns conducted since 2000.
No Name Key experienced fewer fires than Big Pine Key, but pines recruited at the site
from at least the 1890s through the 1970s. Today, pine recruitment is nearly absent on
No Name Key, where fire management practices since 1957 could inhibit the persistence
of pine rockland. The re-introduction of fire could help prevent the loss of these
endangered habitats by restoring and sustaining structural features (e.g. pine stand
density, basal area, and fuel loads) resembling those of settlement-period rockland
savannas. Keywords: Pinus elliottii var densa, dendrochronology, fire effects, National
Key Deer Refuge, subtropical ecosystem, slash pine.
4.2 Introduction
Recurring fire has long been recognized as a key influence on the structure and
dynamics of North American plant communities (Harper 1911; Chapman 1932; White
1979; Wright and Bailey 1982). Across the continent, fire regimes range between two
extremes: low severity surface fires that occur every few years (e.g. Swetnam and others
1999; Grissino-Mayer and Swetnam 2000; Heyerdahl and others 2001) and high severity
crown fires that occur on multi-decadal to century time scales (e.g. Romme 1982; Veblen
and others 1991; Kipfmueller and Baker 2000; Weir and others 2000). In many boreal
and western forest communities, infrequent high severity fires are stand-replacing

99
events that initiate succession (Oliver 1981; Pickett and White 1985). Many plant
communities in the southeastern United States, however, developed with frequent
wildfire, and secondary succession occurs in the absence of this disturbance (Garren
1943; Wade and others 1980; Snyder 1991; Gilliam and Platt 1999).
Pine rocklands are globally endangered ecosystems unique to the Bahamas and
South Florida, U.S.A. (Noss and others 1995). Within South Florida, they occur in three
areas: Everglades National Park, Big Cypress National Preserve, and the Lower Florida
Keys (LFK). These subtropical pine savannas, dominated by South Florida slash pine
(Pinus elliottii Engelm. var. densa Little & Dorman.; hereafter slash pine), once covered a
vast contiguous area of over 75,000 ha, but fire suppression and agricultural and
residential development during the 20th century have fragmented and reduced the
original range by 90 % (Snyder and others 1990). The southernmost extent of pine
rockland is in the LFK, where the combined effects of sea-level rise (Ross and others
1994) and residential development over the last century have restricted its distribution
to less than 1000 ha scattered over four islands.
In the LFK, most pine rocklands are located within the National Key Deer Refuge
(NKDR), which is managed by the United States Fish and Wildlife Service (USFWS).
Fire is an important component in these communities as it prevents the invasion of
hardwoods, maintains the presence of endemic herbaceous flora, and maintains habitat
for the endangered Key deer (Odocoileus virginianus clavium Barbour & Allen)

100
(Alexander 1967; Snyder and others 1990). The documented successional pattern in pine
rocklands in the absence of fire is a transition from an open pine savanna to a closed
canopy, tropical hardwood forest (Simpson 1920; Alexander 1967; Alexander and
Dickson 1972). Recurring fires help maintain pine rockland habitat by creating
conditions that favor establishment and persistence of slash pines over tropical
hardwood species (Menges and Deyrup 2001; O’Brien and others 2008).
Dendroecological techniques can reveal the disturbance history of a forest stand,
including the spatial and temporal variability of past fires (Abrams and others 1997;
Drunkenbrod 2005). Extensive dendroecological and related research has shown that
old-growth longleaf pine (Pinus palustris P. Miller) savannas of the southeastern U.S.
developed under frequent, low-intensity surface fires (Frost 1993; Platt and others 1988;
Platt and Rathburn 1993). However, the historical role of fire in the development of pine
rocklands of South Florida has yet to be documented, in part because the suitability of
slash pine as a viable species for dendroecological studies here has only recently been
established (Harley and others 2011).
Since the establishment of the NKDR in 1957, management has included the
suppression of all wildfires (Bergh and Wisby 1996), and the characteristics of the
historical fire regimes in these communities are unclear. Taylor (1981) and Snyder
(1986) suggested, based on observations and written fire reports, that pine rocklands
experienced low-severity surface fires about once every decade, and Snyder and others

101
(1990) suggested the average interval between historical fires ranged from 2 to 15 years.
Currently, fire regimes prior to the 1950s are undocumented (Bergh and Wisby 1996).
Since the establishment of the NKDR, prescribed fire in the LFK was applied
periodically, with fire sizes and return intervals that vary across islands (Bergh and
Wisby 1996), resulting in a diversity of stand structures reflecting different stages of
development (Sah and others 2004). Here, the effects of historical fire and varied fire
management practices on the age structure and patterns of tree growth are uncertain.
We recently discovered that slash pine, the southernmost native pine in the
United States and the foundation species of pine rockland communities, produces
consistently annual growth rings in the LFK (Harley and others 2011), making possible
a detailed dendroecological study of stand age structures and disturbance history.
While several endogenous and exogenous disturbances potentially affect pine stand age
structure in rocklands, including tropical cyclones (Platt and others 2000; 2002; Beckage
and others 2006) and sea-level rise (Ross and others 1994; 2009), our focus in this paper
is fire. Our goal was to determine how historical fire disturbance and varied fire
management practices influenced stand structure and dynamics in pine rockland
communities on two islands in the LFK: Big Pine Key and No Name Key. We addressed
four primary questions: (1) What were the characteristics of the historical fire regimes in
the LFK, and did they differ across islands? We were specifically interested in analyzing
differences in fire return interval, fire season, and relative spatial extent between study

102
sites on Big Pine Key and No Name Key and, because Big Pine Key is the larger of the
two islands, we expected to find a higher frequency of fires. (2) Were fire regimes
interrupted during the 20th century after the establishment of the NKDR? We expected
to find that fires occurred more frequently and were more widespread prior to the
establishment of the NKDR in 1957. (3) How have the historical fire regimes and varied
fire management practices since establishment of the NKDR affected the stand structure
of the two islands? We expected to find that tree age structures show evidence that
recruitment is periodic and related to fire-prone and fire-free periods. (4) Finally, how
might information from these stands assist in the development of management
practices?
4.3. Methods
4.3.1 Study Sites
The islands of Big Pine Key (24.70° N, 81.37° W) and No Name Key (24.69° N,
81.32° W) contain the largest areas of pine rockland habitat in the Florida Keys (Figure
4.1). On Big Pine Key, the Boneyard Ridge (BYR) site is a 75 ha tract of land that last
burned in a prescribed fire in 2009 and the No Name Key (NNK) site is a 75 ha area that
last burned in a small wildfire in 2003 (Dana Cohen 2011, personal communication).
Earlier prescribed burns since the establishment of the NKDR were conducted at BYR in
1977, 1990, 2000, 2004, and 2009, and at NNK in 1992 (Bergh and Wisby 1996).

103
Figure 4.1. Map of study site locations (hatched areas) and current distribution of pine
rocklands (black) in the National Key Deer Refuge, Lower Florida Keys, USA. BYR
Boneyard Ridge and NNK No Name Key.

104
Slash pine stands in LFK rocklands are characterized by a monospecific pine
overstory, a diverse subcanopy of West Indian shrubs and palms, and a variety of
endemic herbs (Sah and others 2004). Pine rocklands provide an important habitat for
several federal and state listed endangered species such as the Key deer, the Lower
Keys marsh rabbit (Sylvilagus palustris hefneri Lazell), Kirtland’s warbler (Dendroica
kirtlandii Baird), and the Florida leafwing butterfly (Anaea troglodyta floridalis Johnson &
Comstock) (Snyder and others 1990).
The LFK region experiences a tropical savanna climate with hot summers (mean
maximum August temperature < 32 °C), cool winters (mean minimum January
temperature > 19 °C), and consistent summer-wet, winter-dry seasons. Mean annual
precipitation of the LFK is 980 mm, with 80% occurring from May to November (NCDC
2010). On the rocklands, Pleistocene-aged Miami limestone is exposed at the surface
and soil is thin to non-existent. The topography of Big Pine Key and No Name Key is
relatively uniform and flat, and the elevation at both sites is approximately 2.4 m above
sea-level. Old-growth slash pine stands still exist in the LFK because land development
and logging were minimal in the early 20th century, due to the rugged terrain of the
rocklands and the difficulty of transporting timber from the islands to the mainland.
Protection of pine rocklands began in the 1957 with the establishment of the NKDR.

105
4.3.2 Fire history
Crossdated fire scars identified in living trees and remnant woody material
(snags and logs) were used to reconstruct fire history (return interval, fire season,
relative spatial extent) in slash pine stands at the BYR and NNK sites. We used a
targeted sampling design to sample trees that contained the greatest number of well-
preserved fire scars distributed as broadly as possible over each site (Guyette and
Stambaugh 2004). This sampling technique is intended to establish the most
comprehensive record of fire dates over the longest possible period, and has been
shown to produce a valid representation of local fire regimes (Van Horne and Fulé
2006). We used a chainsaw to remove partial cross-sections from living trees and full
cross-sections from remnant material (Arno and Sneck 1977).
In the laboratory, standard dendrochronological methods were used to sand each
fire-scarred sample to a high polish (Orvis and Grissino-Mayer 2002), then crossdate the
annual growth rings of each fire-scarred sample against reference chronologies
developed at each site (Stokes and Smiley 1968). Accuracy of crossdating was verified
using the computer program COFECHA (Holmes 1983; Grissino-Mayer 2001a). The
calendar year of each ring that contained a fire scar was recorded as the fire date and
the season of each fire occurrence was estimated by examining the intra-ring position of
each scar. The seasonal intra-annual growth dynamics of slash pine in the LFK is
different than defined for the pine species first used to classify fire scar seasonality in

106
the southwestern United States (e.g. Baisan and Swetnam 1990). Therefore, fire scar
positions were classified as: (1) early (earlywood); (2) transition (earlywood/latewood
transition zone); (3) latewood (in latewood); and (4) dormant (ring boundary). We
based this classification on results from Langdon (1963) and a recent study of cambial
phenology that suggests slash pine forms earlywood from February through June,
latewood from July through November, and is dormant during December and January
(Harley and others in press).
Estimates of relative fire extent were based on the percentage of samples that
recorded a fire. Composite fire scar chronologies were used to calculate fire return
intervals for fire years recorded by any sample, ≥ 25% of samples, and ≥ 50% of samples.
We used FHX2 software to generate Weibull median probability intervals (WMPI) and
mean fire interval (MFI) statistics (Grissino-Mayer 2001b), and Student’s t-tests to
compare the MFI statistics for the settlement and fire-management periods at each site.
We considered the settlement period to extend from European-American settlement of
the Florida Keys until the establishment of the NKDR (ca. 1840–1956) (Williams 1991).
The fire-management period, characterized by wildfire suppression and prescribed
burning by NKDR personnel, extended from 1957 to 2010.
4.3.3 Stand structure
We randomly established 20 0.04 ha circular plots (radius = 11.25 m) at each site
to document stand structure. In each plot, we recorded diameter at breast height (dbh;

107
ca. 1.4 m above the surface) for all stems ≥ 5 cm dbh, and tallied all slash pine seedlings
(< 1 m ht) and saplings (> 1 m ht and < 5 cm dbh) to quantify stand size structure. All
living slash pines in the plots were cored at a height of 30 cm to evaluate stand age,
recruitment, and radial growth patterns. The cores were taken with a 5.15 mm diameter
Haglöf increment borer, with two radii extracted from each tree. In each plot, we also
recorded dbh and decay class for all snags and logs to quantify the abundance of coarse
woody debris and decay dynamics. Snags and logs were placed into one of four decay
classes (1–4, with 4 being the most decayed) based on categories adapted from Maser
and others (1979).
In the pine rockland savannas of the LFK, tree canopies are low in height and
have simple vertical structure. Therefore, it was difficult to distinguish the canopy class
of each pine tree. To characterize the density and openness of the overstory tree canopy
and understory vegetation layer at each site, we used a spherical densitometer
(Lemmon 1956), a concave spherical mirror engraved with a grid of squares. At each
plot center, we determined the number of squares not occupied by vegetation, which
resulted in the percentage of overhead area not occupied by canopy (which included
both overstory pines and understory shrubs and palms). To further describe the
understory vegetation layer, which was dominated by thatch palm (Thrinax morissii H.
Wendl.) and silver palm (Coccothrinax argentata (Jacq.) L.H. Bailey), we used a 10-factor
wedge prism to estimate the basal area of palm stems (ht ≥ 1.4 m) at each site.
108
Tree cores were dried, mounted, and sanded to a high polish (Stokes and Smiley
1968; Orvis and Grissino‐Mayer 2002), and tree age was assigned based on the
innermost growth ring for cores that contained the pith. Because the annual growth
rings of slash pine often contain intra-annual density fluctuations (false rings) (Harley
and others 2011), we selected 30 random cores at each site to statistically crossdate
against the reference site chronologies (Grissino-Mayer 2001a). We used these
chronologies to assist in visually crossdating each core using the list method
(Yamaguchi 1991). We applied an age correction to cores that missed the pith based on
the curvature of the innermost rings with pith estimators that represented different
growth rates (Applequist 1958). Slash pine seedlings undergo a tussock-like (“grass”)
stage for 2–5 years (Menges and Deyrup 2001); hence, these data should not be
considered the absolute establishment year of trees. To control for the potential
imprecision in establishment dates, we constructed age structure graphs using 10-year
bins (Villalba and Veblen 1997, Wong and Lertzman 2000).
4.4 Results
4.4.1 Fire history at Boneyard Ridge
Our fire reconstruction at BYR spanned 1707–2010 (Figure 4.2). We were able to
crossdate 36 of 50 fire-scarred samples collected, and identified 224 fire scars recorded
in the growth rings of the samples that represented 45 unique fire events. During the

109
Figure 4.2. Fire history and age structure by decade for No Name Key (NNK; top) and Boneyard
Ridge (BYR; bottom). Each horizontal line (solid line = recorder years; dotted line = non-recorder
years) represents a fire-scarred sample; vertical bars denote fire events; P represents prescribed
burns. Establishment per decade for all trees (stems ≥ 5 cm dbh) is plotted with total seedling (< 1
m ht) and sapling (> 1 m ht, < 5 cm dbh) density ha–1.

110
period 1707–1851, 14 fires occurred at BYR, but the number of samples was low (< 10).
Hence, the period of reliability for our fire reconstruction spanned ca. 1850 to 2010.
During this period, our reconstruction revealed eight widespread fires (≥ 50 % scarred)
at BYR, of which five occurred before the NKDR was established. After 1957, the three
widespread fires that were recorded were prescribed burns conducted by fire
management personnel.
The interval distributions for all fires at the site were positively skewed, with
more short intervals (3–6 years) between fires, and the Weibull median probability
interval (WMPI) was shorter than the MFI (Table 1). Although the MFIs during the
settlement and fire-management periods were relatively similar, temporal differences
between them were statistically significant (P < 0.05, t-test; Table 2). We were able to
classify fire seasonality for 98% (n = 219) of the fire scars; 68% (n = 149) of fires occurred
in the latewood, and 32% (n = 70) at the transition between earlywood and latewood.
4.4.2 Stand structure at Boneyard Ridge
We inventoried 158 trees in the 20 BYR plots. We applied an age correction to
27% of plot cores at BYR. The average age correction for cores that did not contain pith
was 5–6 years, with a maximum correction of 9 years on three samples. Density of trees
≥ 5 cm dbh was 395 stems ha—1 and total basal area was 8 m2 ha—1 (Table 3). The total
basal area of palm stems at BYR was lower (459 m2 ha—1) compared to NNK (1836 m2
ha—1); hence, the understory vegetation was less dense than at NNK, and the

111
Table 4.1. Statistical Characteristics of Composite Fire
Return Intervals (years) for Pine Rockland Communities
in the LFK.
MFI WMPI Range SD
BYR (n = 36)
All scarred
> 25%
> 50%
NNK (n = 32)
All scarred
> 25%
> 50%
6.55
8.47
14.00
9.79
10.94
14.23
5.83
7.91
14.27
9.14
10.32
13.92
2–26
2–26
5–33
2–24
2–24
2–24
4.68
4.88
8.45
5.56
5.91
5.56
MFI = mean fire interval; WMPI = Weibull median
probability interval; SD = standard deviation

112
Table 4.2. Composite Fire Return Interval Statistics for
Settlement (ca. 1840–1956) and Fire-management (1957–
2010) Periods in Pine Rockland Communities in the LFK.
Time period n Mean SE SD
BYR
Interval (years)
1840–1956
1957–2010
Percent Scarred
1840–1956
1957–2010
NNK
Interval (years)
1840–1956
1957–2010
Percent Scarred
1840–1956
1957–2010
23
8
24
9
11
6
12
7
4.57*
7.25*
32.56*
56.83*
9.73
7.67
66.85
50.61
0.57
1.15
3.68
10.71
1.63
1.09
7.97
7.49
2.74
3.24
18.03
32.14
5.41
2.66
27.60
19.83
Mean values with an asterisk are statistically different (P <
0.05, t-test); n = number of observations; SE = standard
error; SD = standard deviation.

113
Table 4.3. Structural Measures of Slash Pine
Trees, Seedlings, Saplings, and Understory
Vegetation in Pine Rockland Communities
in the LFK.
BYR NNK
Total density (ha—1)
Live trees
Snags
Logs
Basal area (m2 ha—1)
Live trees
Snags
Logs
Palms
Seedlings (ha—1)
Saplings (ha—1)
Understory
Vegetation
Mean/plot (%)
Range (%)
395
280
213
8
2
3
459
710
185
65
39–87
195
79
136
6
3
4
1836
46
6
40
5–61
Understory vegetation data derive from
spherical densiometer readings: mean
percentage (per plot) of overhead area not
occupied by vegetation, and site range.

114
Figure 4.3. Size class distributions of live and dead (snags and logs) slash pine
trees stems ≥ 5 cm dbh) in 40 plots (BYR, n = 20; NNK, n = 20) in pine rockland
communities in the Lower Keys. Each dbh interval includes all stems ± 2.5 cm
of the stated value. Note that the vertical axis is different for each site.

115
Figure 4.4. Decay class distributions for coarse wood debris in 40 plots (BYR, n = 20;
NNK, n = 20) in pine rockland communities in the Lower Keys. Categories were
adapted from Maser and others (1979). Decay class categories ranged from the least
decayed (1) to the most decayed (4).

116
canopy was more open. Densities of snags and logs were similar, with 280 and 213
stems ha—1, respectively. Snag and log densities were relatively similar to densities of
live trees; however the total basal area of snags and logs was markedly lower (Figure
4.3; Table 3). Most coarse woody debris was in an advanced state of decay (Figure 4.4).
The oldest trees established ca. 1870, and recruitment continued through the history of
the stand with pulses ca. 1910–1930 and ca. 1950–1960 bracketing an interval of low
recruitment during the 1940s. Although recruitment was low during the 1940s, it was
higher than before 1910 and during the period 1980–2000. Seedlings and saplings were
ubiquitous at BYR (Figure 4.2; Table 3).
We found a strong relationship between diameter and age (R2 = 0.77, P < 0.0001;
Figure 4.5) and a reverse J-shaped diameter structure (Figure 4.3) typical of a stand
regenerating following disturbance. The two largest diameter individuals recorded
were 28.0 cm and 28.4 cm dbh, and established in 1887 and 1891, respectively. The two
oldest trees, which established in 1878, had diameters of 21.0 and 26.0 cm. We found
many young trees (stems ≥ 5 cm dbh) that established since ca. 1990 (Figure 4.5).
4.4.3 Fire history at No Name Key
Our fire reconstruction at NNK spanned 1779–2010 (Figure 4.2). We were able to
crossdate 32 of 52 fire-scarred samples collected from NNK, identifying 105 scars that
represented 20 unique fire events. The NNK fire reconstruction period of reliability
spanned ca. 1850 to 2010 due to low sample depth before this period. After the 1850s,
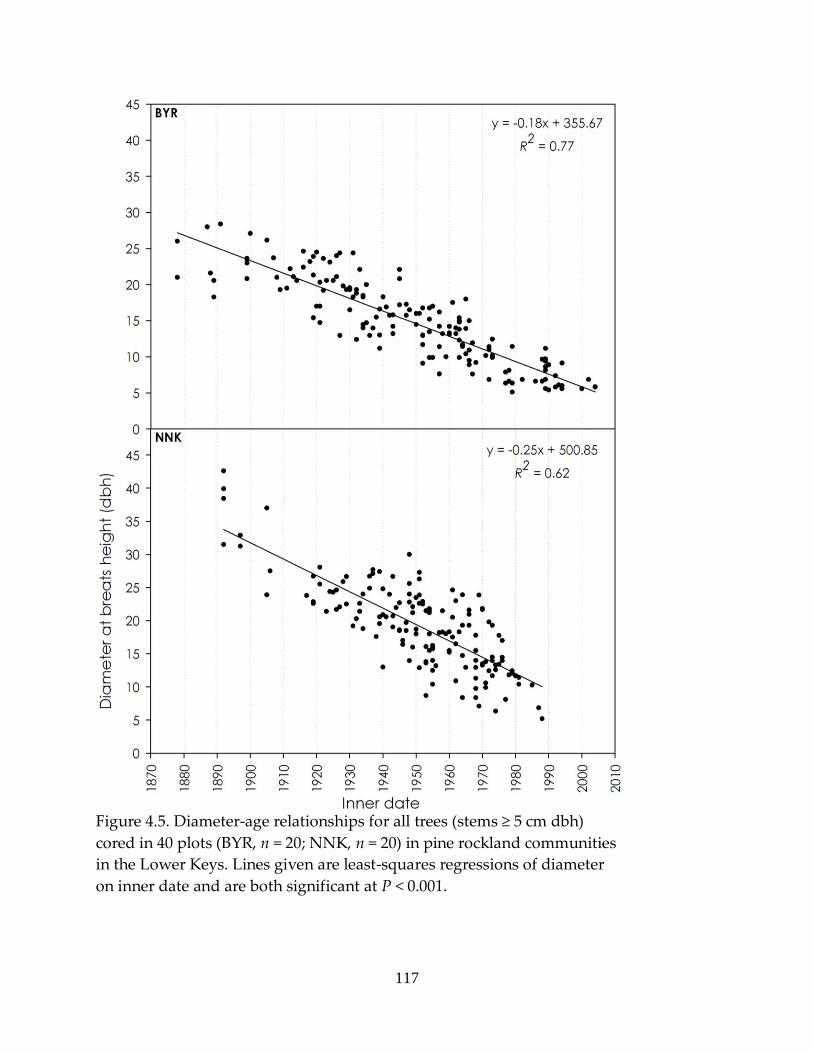
117
Figure 4.5. Diameter-age relationships for all trees (stems ≥ 5 cm dbh)
cored in 40 plots (BYR, n = 20; NNK, n = 20) in pine rockland communities
in the Lower Keys. Lines given are least-squares regressions of diameter
on inner date and are both significant at P < 0.001.

118
the majority of fires included in our reconstruction scarred over 50% of trees. Since the
NKDR was established, we documented the prescribed burn that was conducted at
NNK in 1992 (Bergh and Wisby 1996).
The MFI for fires of different extents varied less at NNK than at BYR, indicating
that fires were more consistently widespread. The interval distributions for all fires at
NNK were less positively skewed than at BYR, with longer intervals (9–11 years) at
NNK between fires. The MFI for small to intermediate-sized fires (9 years) was shorter
than for widespread fires (11 years), and the WMPI was shorter than the MFI (Table 1).
We found no significant difference in MFI between the settlement and fire-management
periods (P > 0.05, t-test) for this site (Table 2). We classified seasonality for 90% (n = 94)
of the fire scars; 75% (n = 70) occurred in the latewood and 25 % (n = 24) at the transition
between earlywood and latewood.
4.4.4 Stand structure at No Name Key
At NNK, we inventoried 156 trees in 20 plots. We applied an age correction to
31% of plot cores at NNK. The average age correction for cores that did not contain pith
was 5–6 years, with a maximum correction of eight years on one sample. Density of
trees ≥ 5 cm dbh was 195 stems ha—1 and total basal area was 6 m2 ha—1 (Table 3). The
diameter structure at NNK was unimodal, and not indicative of a regenerating stand
(Figure 4.3). The understory vegetation was more dense and the canopy was less open
than at BYR. Palms occupied 1836 m2 ha—1 and on average, only 40% of the overhead

119
area was not occupied by understory shrubs and palms (Table 3). Density of snags was
lower than density of logs, and densities of live trees and logs were similar. Total basal
area of snags was markedly lower than that of live trees, but logs and live trees
occupied relatively similar areas (Table 3). Compared to BYR, coarse woody debris was
more abundant and less decayed (Figure 4.4).
The oldest trees established ca. 1890, with recruitment per decade that gradually
increased from 1900 to the 1950s, then decreased markedly in the 1980s (Figure 4.5).
Seedlings and saplings were nearly absent at NNK (Table 4). The relationship between
diameter and age was less pronounced than at BYR, but still statistically significant (R2 =
0.62, P < 0.001). Among the two sites, the largest diameter trees were found at NNK,
with two individuals measured at ≥ 40.0 cm dbh. Although these trees were large, they
were younger than individuals at BYR. The four oldest trees in the stand, all established
by 1892, ranged in size from 32.0 to 42.6 cm dbh (Figure 4.5).
4.5 Discussion
4.5.1 Historical fire regimes of the LFK
Low sample depth and scarcity of fire scars precluded any conclusions regarding
the fire regimes at the two sites before the 1850s. Our reconstructions indicated that the
historical fire regimes in the LFK were characterized by relatively frequent surface fires
that ranged between 6 and 9 years (MFI at BYR and NNK, respectively), which was

120
within the speculations of previous studies (i.e. Taylor 1981; Snyder 1986; Snyder and
others 1990). We also found a noticeable difference in fire regimes between islands.
Although similar in season, fire frequency and spatial extent varied over time between
BYR and NNK. During the settlement period, BYR burned more often and fire events
had more spatial variability (i.e. fires that were mixed patchy, with low scarring
percentage, and widespread, with high scarring percentage) compared to NNK. Fire
history data from NNK revealed that, in general, fires burned less often and over larger
areas, as indicated by the amount of fires that scarred ≥ 50% of sampled trees. Bergh
and Wisby (1996) hypothesized that Big Pine Key was historically the most fire-prone
island in the LFK because it has the largest land area; a similar island-size effect has
been shown by several other studies (e.g. Bergeron 1991; Niklasson and others 2010).
The larger land area of Big Pine Key might have resulted in a higher frequency of
lightning strikes per thunderstorm during the summer wet season and lends a possible
explanation to the varied fire frequency and spatial extent found between our study
sites.
The intra-annual positions of fire scars in our reconstructions were most
commonly in the latewood zones of annual growth rings, but some occurred at the
transition between earlywood and latewood zones. A contemporary study of cambial
phenology indicated that, on Big Pine Key, slash pines form earlywood from February
through June, latewood from July through November, and are dormant during

121
December and January (Harley and others, in press). These data suggest that fires at
both sites were most common later in the growing season. In South Florida, the majority
of thunderstorms and lightning strikes occur from May to October, and previous
studies from the Everglades found that the largest lightning-caused fires occur during
this time (Taylor 1981; Duever and others 1994; Beckage and others 2003). The influence
of humans on fire regimes is largely unknown because archaeological evidence from the
Lower Florida Keys is limited, and the initial timing of human arrival and patterns of
movement between and around islands is not well understood (Worth 1995). Based on
the similarities between fire history data presented by previous studies and the
abundance of mid- to late-season fires found at both sites, we propose that the majority
of historical fires were most likely ignited by lightning.
Despite the increased use of prescribed fire over the past decade by NKDR
personnel at BYR, we found a significant difference in the MFI and mean percentage of
trees scarred between the settlement period and the fire-management period. Prior to
the establishment of the NKDR, fires occurred more often and were more patchy at
BYR, while the fire-management period was defined by less frequent fires that burned
larger areas. Although the MFI of the settlement period (5 years) was similar to the fire-
management period (7 years), the difference between means was statistically significant.
More convincing, however, was the difference in percentage of trees scarred per fire
between periods. We attribute the increase in scarring percentage to the prescribed

122
burns that were conducted at BYR in 1977, 1990, 2000, 2004, and 2009, as these events
account for nearly all the fire activity since 1957 at the site. The prescribed burns
conducted at BYR during the fire-management period, especially within the last decade,
resulted from NKDR efforts to increase fire activity at the site. The infrequency of
prescribed fire at NNK, however, resulted in vastly different structural conditions
compared to BYR.
4.5.2 Influence of fire on savanna structure
The frequency and spatial extent of fire at both BYR and NNK differed markedly
over the past ca. 150 years, and the age structures of trees at both sites show periods of
high and low recruitment that appear to be controlled by fire occurrence. At BYR, high
fire frequency in the period 1870s–1920s likely explains the steady increase in
recruitment through the 1930s. The decrease in recruitment during the 1940s was likely
associated with the documented decrease in fire frequency during the 1930s, or with a
prolonged drought that occurred from 1942 to 1946 (NCDC 2010). Palmer Drought
Severity Index values for the Florida Keys climate division (Florida climate division 7)
were consistently negative, indicating prolonged dryness during the period 1942–1946
(data not shown). During the 1970s and 1980s, wildfires were suppressed and only one
prescribed burn was conducted at BYR (1977; Bergh and Wisby 1996), decreasing
recruitment. The prescribed burns during the 2000s facilitated the ample recruitment
seen today at the site, a structural component that was nearly absent at NNK. Different

123
historic fire return intervals on the two islands produced distinct structural differences
likely caused by inconsistence of fire management practices since the establishment of
the NKDR. Since 1957, one prescribed burn was conducted at NNK, while five occurred
at BYR, most of which took place since 2000. In comparison to NNK, the renewed
prevalence of fire at BYR resulted in more regeneration and recruitment and less fuel
(coarse woody debris).
The structural conditions found today at BYR might be similar to conditions that
existed during the settlement period (1840–1956). Although we lack comparative
structural data for this period, an historical photograph from Big Pine Key hints at
structural conditions during the 1910s, when our data show recruitment at BYR began
to increase and fires were patchy and frequent (Figure 4.6). The 1915 photograph from
Big Pine Key is similar to a 2010 photograph of the island, with both showing lower and
less dense vegetation than today found at NNK (2010 photograph). The absence of
recurring fire at NNK has allowed the development of a dense layer of shrubs and
palms that prevented pine recruitment, as pines in general are intolerant of shade. Our
results agree with those of Gilliam and Platt (1999), who studied the effects of fire on the
structure of old-growth longleaf pine savannas. They concluded that excluding fire
altered structural conditions by allowing hardwoods to occupy the gaps between
longleaf stems that are normally maintained by recurring fire. Because of the lack of
frequent fire, the pine rockland habitat at NNK is similarly being taken over by tropical

124
Figure 4.6. Photographs showing differences in understory density in pine rockland communities in the Lower Keys.
Photograph 1 was taken on Big Pine Key in 1915 by John Kunkel Small (used with permission from Florida Photographic
Collection, State Library and Archives of Florida). Photograph 2 was taken at BYR in 2010 and photograph 3 was taken at
NNK in 2010 (photographs taken by the authors).

125
hardwood species, as indicated by our understory density data. The successional
pathway of an open pine savanna to a closed canopy hardwood forest is a process
estimated to take 50 years in the LFK (Alexander and Dickson 1972).
Snyder and others (1990) commented previously on the variation in understory
density between Big Pine and No Name Keys. They reported that the majority of
rocklands on Big Pine contained a sparse understory layer of shrubs and palms low in
height, and a surface scantly covered with grasses. In contrast, the rockland areas of No
Name Key were composed of a dense, nearly continuous hardwood understory 6 m or
more high. Our data suggest that even though NNK has experienced historically less
fire than BYR, pines were recruiting since at least the 1890s until the 1980s. However,
since the comparison presented by Snyder and others (1990) 20 years ago, lack of recent
fire at NNK has likely further increased the density of understory vegetation and
prevented regeneration and recruitment. Given the successional trajectory presented by
Alexander and Dickson (1972), the current density of understory vegetation, and the
lack of recent recruitment, pine stands in rockland habitat at NNK are likely to succeed
to hardwood hammock, if fire is not reintroduced. However, the amount of fuel
amassed in the absence of fire might present a quandary for land managers.
4.6 Conclusions
We demonstrated that dendroecological analyses of slash pines can reveal both
natural processes and management practices responsible for the documented

126
successional pattern in pine rockland ecosystems in southern Florida, especially during
the late 20th century. The goal of our study was to determine how historical fire
disturbance and varied fire management practices influenced stand structure and
dynamics in globally endangered, old-growth pine rockland communities in the LFK.
We found that the fire regimes of two adjacent islands differed in return interval,
frequency, and relative spatial extent, but were similar in fire season. At BYR, fire
frequency dropped with the establishment of the NKDR, but recruitment was
ubiquitous, likely due to multiple, widespread prescribed burns conducted in recent
years. Although NNK experienced fewer fires altogether than BYR, pines recruited at
the site from at least the 1890s until the 1980s. The near absence of recruitment at NNK
currently suggests that the infrequency of fire since the 1990s might result in the loss of
pine rockland habitat in the future. The structure of the BYR stand demonstrates that
prescribed fire can be used to restore and sustain structural features (density, basal area,
fuel loads) resembling those of the settlement period. However, re-introducing
prescribed fire on NNK will be complicated by the density of understory vegetation and
the amount of course woody debris. Implementing prescribed fires that do not become
crown fires that kill overstory pines will be a daunting task for land managers, perhaps
requiring initial manual clearing of understory fuels. The fire history and stand
structure characterizations we produced for Big Pine and No Name Keys testify to both

127
the past success of prescribed fire as a management tool and the difficulty of initiating
this management tool in long-unburned pine rocklands stands of the Florida Keys.
4.7 Acknowledgements
This research was supported by the National Science Foundation under Grant
Nos. 1002479 and 0538420, and by the United States Fish and Wildlife Service. G.L.
Harley was also supported by a Yates Dissertation Fellowship from the University of
Tennessee Graduate School. We thank Anne Morkill, Chad Anderson, and Dana Cohen
for access to the National Key Deer Refuge; Douglas Heruska, Kody Honeyman, Niki
Garland, Desiree Kocis, Ann McGhee, Alex Pilote, John Sakulich, and Rebecca Stratton
for field assistance; and Kody Honeyman, Joshua Turner, and Christopher Petruccelli
for laboratory assistance.

128
References
Abrams MD, Orwig DA, Dockry MJ. 1997. Dendroecological analysis of successional
dynamics for a presettlement origin white pine–mixed oak forest in the southern
Appalachians, USA. Journal of Ecology 83:123–133.
Alexander TR. 1967. A tropical hammock in the Miami (Florida) limestone: a twenty–
five year study. Ecology 48:863–867.
Alexander TR, Dickson III JD. 1972. Vegetational changes in the National Key Deer
Refuge-II. Quarterly Journal of the Florida Academy of Sciences 35:85–96.
Applequist MB. 1958. A simple pith locator for use with off-center increment cores.
Journal of Forestry 56:141.
Arno SF, Sneck KM. 1977. A method for determining fire history in coniferous forests of
the mountain west. USDA Forest Service Intermountain Forest and Range
Experiment Station, General Technical Report, INT-42.
Baisan CH, Swetnam TW. 1990. Fire history on a desert mountain range: Rincon
Mountain Wilderness, Arizona, U.S.A. Canadian Journal of Forest Research 20:1559–
1569.
Beckage B, Gross LJ, Platt WJ. 2006. Modeling responses of pine savannas to climate
change and large-scale disturbance. Applied Vegetation Science 9:75–82.
Bergeron Y. 1991. The influence of island and mainland lakeshore landscapes on boreal
forest fire regimes. Ecology 72:1980–1992.
Bergh C, Wisby J. 1996. Fire History of the Lower Keys Pine Rocklands. The Nature
Conservancy Special Report, 38 pp.
Chapman HH 1932. Is the longleaf type a climax? Ecology 13:328–334.
Doren RF, Platt WJ, Whiteaker LD. 1993. Density and size structure of pine stands in
the everglades region of south Florida. Forest Ecology and Management 59:295–311.

129
Druckenbrod DL 2005. Dendroecological reconstructions of forest disturbance history
using time-series analysis with intervention detection. Canadian Journal of Forest
Research 35:868–876.
Duever MJ, Meeder JF, Meeder LC, McCollum JM. 1994. The climate of South Florida
and its role in shaping the Everglades ecosystem. In: Davis SM, Ogden JC, Eds.
Everglades: The System and its Restoration. St. Lucie Press, Delray Beach, Florida,
USA. p 225–248.
Frost CC. 1993. Four centuries of changing landscape patterns in the longleaf pine
ecosystem. Proceedings of the Tall Timbers Fire Ecology Conference 19:17–43.
Garren KH. 1943. Effects of fire on the vegetation of the southeastern United States.
Botanical Review 9:617–654.
Gilliam FS, Platt WJ. 1999. Effects of long-term fire exclusion on tree species
composition and stand structure in an old-growth Pinus palustris (longleaf pine)
forest. Plant Ecology 140:15–26.
Goggin JM. 1950. The Indians and the history of the Matecumbe Region. Tequesta
10:13–24.
Grissino-Mayer HD. 2001a. Evaluating crossdating accuracy: a manual for the program
COFECHA. Tree-Ring Research 57:205–219.
Grissino-Mayer HD. 2001b. FHX2–software for analyzing temporal and spatial patterns
in fire regimes from tree rings. Tree-Ring Research 57:115–124.
Grissino-Mayer HD, Swetnam TW. 2000. Century-scale climate forcing of fire regimes
in the American Southwest. Holocene 10:213–220.
Guyette RP, Stambaugh MC. 2004. Post oak fire scars as a function of diameter, growth,
and tree age. Forest Ecology and Management 198:183–192.
Harley GL, Grissino-Mayer HD, Horn SP. 2011. The dendrochronology of Pinus elliottii
var. densa in the Lower Florida Keys: Chronology development and climate
response. Tree-Ring Research 67:39–50.

130
Harley, GL, Grissino-Mayer HD, Franklin JA, Anderson C, Kose N. 2012. Cambial
activity of Pinus elliottii var. densa reveals influence of seasonal insolation on growth
dynamics in the Florida Keys. Trees–Structure and Function, In Press.
Harper RM. 1911. The relation of climax vegetation to islands and peninsulas. Bulletin
of the Torrey Botanical Club 38:515–525.
Heyerdahl EK, Brubaker LB, Agee JK. 2001. Spatial controls of historical fire regimes: A
multiscale example from the interior West, USA. Ecology 82:660–678.
Holmes RL. 1983. Computer assisted quality control in tree-ring dating and
measurement. Tree-Ring Bulletin 43:69–78.
Kipfmueller KF, Baker WL. 2000. A fire history of a subalpine forest in south-eastern
Wyoming, USA. Journal of Biogeography 27:71–85.
Langdon OG. 1963. Growth patterns of Pinus elliottii var. densa. Ecology 44:825–827.
Lemmon PE. 1956. A spherical densiometer for estimating forest overstory density.
Forest Science 2:314–320.
Liu H, Menges ES. 2005. Winter fires promote greater vital rates in the Florida Keys
than summer fires. Ecology 86:1483–1495.
Liu H, Menges ES, Quintana-Ascencio PF. 2005. Population viability analysis of
Chamaecrista keyensis: Effects of fire season and frequency. Ecological Applications
15:210–221.
Maser C, Anderson RG, Cromack Jr K, Williams JT, Martin RE. 1979. Dead and down
woody material. In: Thomas JW, Ed. Wildlife habitats in managed forests: the Blue
Mountains of Oregon and Washington. USDA Forest Service Agricultural
Handbook No. 553. p 78–95.
Menges ES, Deyrup MA. 2001. Postfire survival in south Florida slash pine: interacting
fire season, vegetation, burn size, and bark beetles. International Journal of Wildland
Fire 10:53–63.
National Climatic Data Center (NCDC). 2010. Asheville, North Carolina.
www.ncdc.noaa.gov, accessed 19 October 2010.

131
Niklasson M, Drobyshev I, Zielonka T. 2010. A 400-year history of fires on lake islands
in south-east Sweden. International Journal of Wildland Fire 19:1050–1058.
Noss RF, LaRoe ET, Scott JM. 1995. Endangered Ecosystems of the United States: A
Preliminary Assessment of Loss and Degradation. U.S. Department of the Interior,
Biological Report 28, Washington D.C.
O’Brien JJ, Hiers JK, Callaham Jr MA, Mitchell RJ, Jack SB. 2008. Interactions among
overstory structure, seedling life-history traits, and fire in frequently burned
neotropical pine forests. Ambio 37:542–547.
Oliver CD. 1981. Forest development in North America following major disturbances.
Forest Ecology and Management 3:153–168.
Orvis KH, Grissino-Mayer HD. 2002. Standardizing the reporting of abrasive papers
used to surface tree-ring samples. Tree-Ring Research 58:47–50.
Pickett STA, White PS, Eds. 1985. The Ecology of Natural Disturbance. New York, USA:
Academic Press.
Platt WJ. 1999. Southeastern pine savannas. In: Anderson RC, Fralish JS, Baskin J, Eds.
The Savanna, Barren, and Rock Outcrop Communities of North America.
Cambridge University Press, Cambridge. p 23–51.
Platt WJ, Evans GW, Rathburn SL. 1988. The population dynamics of a long lived
conifer (Pinus palustris). American Midland Naturalist 131:491–525.
Platt WJ, Rathbun SL. 1993. Population dynamics of an old-growth longleaf pine
population. Proceedings of the Tall Timbers Fire Ecology Conference 19:275–298.
Platt WJ, Doren RF, Armentano TV. 2000. Effects of Hurricane Andrew on stands of
slash pine (Pinus elliottii var. densa) in the Everglades region of south Florida (USA).
Plant Ecology 146:43–60.
Platt WJ, Beckage B, Doren RF, Slater HH. 2002. Interactions of large-scale disturbances:
prior fire regimes and hurricane mortality of savanna pines. Ecology 83:1566–1572.
Robertson WB. 1953. A survey of the effects of fire in Everglades National Park. Mimeo.
Report, United States Department of Agriculture, National Park Service, 169 pp.

132
Romme WH. 1982. Fire and landscape diversity in subalpine forests of Yellowstone
National Park, Wyoming. Ecological Monographs 52:199–221.
Ross MS, O'Brien JJ, Sternberg LDSL. 1994. Sea-level rise and the reduction of pine
forests in the Florida Keys. Ecological Applications 4:144–156.
Ross MS, O’Brien JJ, Ford RG, Zhang K, Morkill A. 2009. Disturbance and the rising
tide: the challenge of biodiversity management on low-island ecosystems. Frontiers
in Ecology and the Environment 7:471–478.
Sah JP, Ross MS, Koptur S, Snyder JR. 2004. Estimating aboveground biomass of
broadleaved woody plants in the understory of Florida Keys pine forests. Forest
Ecology and Management 203:319–329.
Sah JP, Ross MS, Snyder JR, Koptur S, Cooley HC. 2006. Fuel loads, fire regimes, and
post-fire fuel dynamics in Florida Keys pine forests. International Journal of
Wildland Fire 15:463–478.
Sah JP, Ross MS, Snyder JR, Ogurcak DE. 2010. Tree mortality following prescribed fire
and a storm surge event in slash pine (Pinus elliottii var. densa) forests in the Florida
Keys, USA. International Journal of Forest Research, Article ID 204795,
doi:10.1155/2010/204795.
Simpson CT. 1920. In the Florida Wilds. Putnam, New York.
Snyder JR. 1986. The impact of wet season and dry season prescribed fires on Miami
Rock Ridge Pineland, Everglades National Park. National Park Service, South
Florida Research Center Report 86/06.
Snyder JR, Herndon A, Robertson Jr WB. 1990. South Florida Rocklands. In: Myers RL,
Ewel JJ, Eds. Ecosystems of Florida. University of Central Florida Press, Orlando,
Florida. p 230–277.
Snyder JR. 1991. Fire regimes in subtropical south Florida. Proceedings of the Tall
Timbers Fire Ecology Conference 17:303–319.
Snyder JR, Ross MS, Koptur S, Sah JP. 2005. Developing ecological criteria for
prescribed fire in south Florida pine rockland ecosystems. United States Geological
Survey Open File Report 1006–1062.

133
Spier LP, Snyder JR. 1998. Effects of wet- and dry-season fires on Jacquemontia curtisii, a
South Florida pine forest endemic. Natural Areas Journal 18:350–357.
Stokes MA, Smiley TL. 1968. An Introduction to Tree‐Ring Dating. University of
Chicago Press. Chicago, Illinois.
Swetnam TW, Allen CD, Betancourt JL. 1999. Applied historical ecology: Using the past
to manage for the future. Ecological Applications 9:1189–1206.
Taylor DL. 1981. Fire history and fire records for Everglades National Park, 1948–1979.
Everglades National Park, South Florida Research Center Report No. T-619.
Taylor DL, Herndon A. 1981. Impact of 22 years of fire on understory hardwood shrubs
in slash pine communities within Everglades National Park. Everglades National
Park, South Florida Research Center Report No. T-640.
Van Horne ML, Fulé PZ. 2006. Comparing methods of reconstructing fire history using
fire scars in a southwestern United States ponderosa pine forest. Canadian Journal of
Forest Research 36:855–867.
Veblen TT, Hadley KS, Reid MS. 1991. Disturbance and stand development of a
Colorado subalpine forest. Journal of Biogeography 18:707–716.
Villalba R, Veblen TT. 1997. Improving estimates of total tree ages based on increment
core samples. Ecoscience 4:534–542.
Wade D, Ewel J, Hofstetter R. 1980. Fire in south Florida ecosystems. United States
Forest Service General Technical Report SE-17.
Weir, JMH, Johnson EA, Miyanishi K. 2000. Fire frequency and the spatial age mosaic of
the mixed-wood boreal forest in western Canada. Ecological Applications 10:1162–
1177.
White PS. 1979. Pattern, process, and natural disturbance in vegetation. Botanical
Review 45:229–299.
Wright HA, Bailey AW. 1982. Fire ecology. John Wiley and Sons, New York, New York,
USA.
134
Williams L. 1991. Lower Keys pioneers and settlements. In : Gato J, Ed. The Monroe
County Environmental Story, Gemini Printing, Marathon, Florida. p 75–78.
Wong CM, Lertzman KP. 2000. Errors in estimating tree age: Implications for studies of
stand dynamics. Canadian Journal of Forest Research 31:1262–1271.
Worth JE. 1995. Fontaneda revisted: Five descriptions of sixteenth-century Florida. The
Florida Historical Quarterly 73:339–352.
Yamaguchi DK. 1991. A simple method for cross-dating increment cores from living
trees. Canadian Journal of Forest Research 21:414–416.

135
Chapter 5
Pacific Climate Forcing of Historical Fire Regimes in an Endangered Subtropical
Ecosystem of the Florida Keys

136
Chapter 5
Pacific Climate Forcing of Historical Fire Regimes in an Endangered Subtropical
Ecosystem of the Florida Keys
This chapter is a slightly revised version of a paper that was submitted to a peer-
reviewed journal as: Grant L. Harley, Henri D. Grissino-Mayer, Sally P. Horn, and Chris
Bergh (2012). Pacific Climate Forcing of Historical Fire Regimes in an Endangered
Subtropical Ecosystem of the Florida Keys. The Professional Geographer, in review. The
revisions follow suggestions made by members of my dissertation committee. The use
of “we” in this chapter refers to my co-authors and myself. As the first author, I was
lead on designing the study, obtaining the data, performing analyses, and writing the
manuscript.
5.1 Abstract
We investigated the relationships between climatic variability and historical
wildfires in globally endangered pine rockland communities in the Florida Keys, U.S.A,
using tree-ring samples from the canopy dominant Pinus elliottii var. densa (South
Florida slash pine), the southernmost native pine in the United States. We compared a
new set of crossdated fire-scar chronologies spanning the period AD 1707–2010 from
four sites on Big Pine Key to measured values of the El Niño-Southern Oscillation
(NIÑO3.4), Pacific Decadal Oscillation (PDO), and divisional temperature and
precipitation. Historical fires (scarring ≥ 50% of samples collected) occurred during
years that were drier than average, and NIÑO3.4 values were significantly lower than
average one year prior to these fires (La Niñas; P < 0.01). We found evidence that
suggests linkages between the El Niño Decadal Modulation (ENDM) and wildfire, with
antecedent years wetter than average combining with the effects of El Niño and PDO
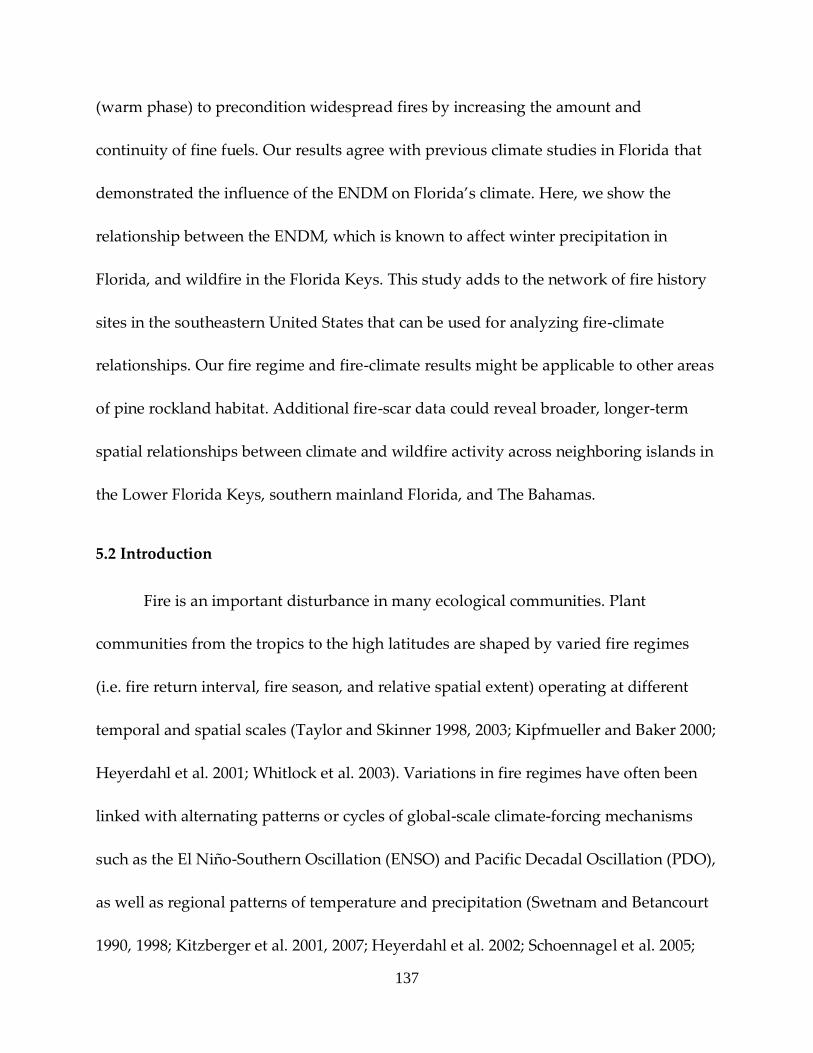
137
(warm phase) to precondition widespread fires by increasing the amount and
continuity of fine fuels. Our results agree with previous climate studies in Florida that
demonstrated the influence of the ENDM on Florida’s climate. Here, we show the
relationship between the ENDM, which is known to affect winter precipitation in
Florida, and wildfire in the Florida Keys. This study adds to the network of fire history
sites in the southeastern United States that can be used for analyzing fire-climate
relationships. Our fire regime and fire-climate results might be applicable to other areas
of pine rockland habitat. Additional fire-scar data could reveal broader, longer-term
spatial relationships between climate and wildfire activity across neighboring islands in
the Lower Florida Keys, southern mainland Florida, and The Bahamas.
5.2 Introduction
Fire is an important disturbance in many ecological communities. Plant
communities from the tropics to the high latitudes are shaped by varied fire regimes
(i.e. fire return interval, fire season, and relative spatial extent) operating at different
temporal and spatial scales (Taylor and Skinner 1998, 2003; Kipfmueller and Baker 2000;
Heyerdahl et al. 2001; Whitlock et al. 2003). Variations in fire regimes have often been
linked with alternating patterns or cycles of global-scale climate-forcing mechanisms
such as the El Niño-Southern Oscillation (ENSO) and Pacific Decadal Oscillation (PDO),
as well as regional patterns of temperature and precipitation (Swetnam and Betancourt
1990, 1998; Kitzberger et al. 2001, 2007; Heyerdahl et al. 2002; Schoennagel et al. 2005;

138
Taylor and Beaty 2005). For example, ENSO is a complex, climate-forcing phenomenon
that has been shown to affect global temperature and rainfall patterns (Ropelewski and
Halpert 1986, 1987; Allan et al. 1996). Relationships between ENSO and fire occurrence
have long been recognized in western North America at scales ranging from regional
(Swetnam 1990; Heyerdahl and Alvarado 2003; Brown and Wu 2005; Fule et al. 2005;
Skinner et al. 2008) to subcontinental (Swetnam and Betancourt 1990; Brenner 1991;
Veblen and Kitzberger 2002; Kitzberger et al. 2007).
Previous investigations of fire-climate relationships in western North America
revealed interactions between ENSO and PDO cycles (variations in sea surface
temperatures between the northeastern and tropical Pacific Ocean; Mantua et al. 1997).
Climate effects of PDO are often defined similarly to those of ENSO because the two
mechanisms often operate in tandem (Kaplan et al. 1998). Respective climate conditions
are intensified (constructive) when both mechanisms are in phase and weakened
(destructive) when out of phase (Biondi et al. 2001; Mote et al. 2003). Amplified fire
weather is often linked with interactions between phasing of ENSO and PDO in
western North America (Norman and Taylor 2003; Taylor and Beaty 2005; Schoennagel
et al. 2005).
Most studies of climate drivers of fire have been conducted in western North
America and have focused on the influences of climate variability in the central and
eastern Pacific region. In recent decades, this variability was shown to also influence

139
wildfires on mainland Florida (e.g. Brenner 1991; Jones et al. 1999; Harrison and Meindl
2001; Beckage and Platt 2003; Beckage et al. 2003; Goodrick and Hanley 2009; Slocum et
al. 2010). Studies based on instrumental records from the 1950s onward demonstrated
that El Niño is associated with increased precipitation during the winter dry season,
and results in lower wildfire activity. Conversely, decreased dry season precipitation
during La Niña exacerbates the severity of winter droughts and is associated with lower
surface water levels, more lightning strikes, heightened fire weather, and higher
wildfire activity.
Recent investigations showed that combined effects of ENSO and PDO can
modify winter precipitation in southern Florida. Kurtzman and Scanlon (2007) provided
evidence that phase cycles of PDO can strengthen or weaken El Niño/La Niña effects, in
processes termed El Niño Decadal Modulation (ENDM) and La Niña Decadal
Modulation (LNDM). In South Florida, for example, positive anomalies of El Niño are
strengthened during warm phases of PDO. Although relationships between ENSO,
PDO, and winter precipitation are known, associations between the ENDM, LNDM,
and wildfire are unknown. Here, we use new tree-ring records to improve
understanding of the temporal and spatial relationships between ENSO, PDO, and
wildfire at the centennial-scale. Such understanding is of critical importance in helping
land managers better plan the application of fire management resources in plant

140
communities on islands in the Florida Keys, especially during this time of uncertain
climate change.
Pine rocklands are globally endangered, pyrogenic plant communities restricted
in the United States to small areas in mainland South Florida and the Lower Florida
Keys (Noss et al. 1995). Fire is an important disturbance in these communities as it
encourages persistence of the foundation pine species (South Florida slash pine, Pinus
elliottii Engelm. var. densa Little & Dorman, hereafter slash pine), and discourages
invasion by tropical hardwood species. In the absence of fire, open-canopy pine
savannas with diverse herbaceous and graminoid floral assemblages succeed to dense
tropical hardwood hammock with depauperate herbaceous and graminoid
assemblages. We selected pine rocklands on Big Pine Key (BPK) in the Lower Florida
Keys to quantify the potential influence of climate on the fire regime for several reasons.
The island of BPK contains the largest contiguous areas of pine rockland habitat in the
Florida Keys. While previous investigations of the effects of climate on fires in Florida
focused on the past ca. 60 years, the abundance of old-growth, fire-scarred slash pines
with demonstrated annual ring formation (Harley et al. 2011) on Big Pine Key offered
the opportunity to characterize the fire regime on the island over a longer interval of
time. Slash pine reaches the southern limit of its natural distribution in this area, and
historical fire information from the species would add a much needed data point for
analyzing fire-climate relationships within the network of fire history sites in the

141
southeastern United States. Finally, the geographic location of BPK, situated along the
Florida Straits between the Gulf of Mexico and Atlantic Ocean, suggested potential for
identifying the effects of multiple oceanic-atmospheric climate-forcing mechanisms on
fire occurrence in pine rockland communities.
The objectives of this study were (1) to characterize the historical fire regime in
slash pine savannas on BPK, including return interval, fire season, and relative spatial
extent, and (2) to determine whether fire years were associated with ENSO and PDO.
Specific questions included: What were the characteristics of the fire regime on BPK?
Did the historical fire regime change in the 20th century, when study sites came under
management with the establishment of the National Key Deer Refuge? What are the
effects of ENSO and PDO on fires in the Florida Keys?
5.3 Methods
5.3.1 Study Area
Big Pine Key (24.70° N, 81.37° W) is the largest of the islands that make up the
Lower Florida Keys (Figure 5.1). On BPK, pine rocklands are characterized by a
monospecific pine overstory, a diverse subcanopy of West Indian shrubs and palms,
and a diverse assemblage of herbaceous and graminoid species including a variety of
endemic herbs (Sah et al. 2004). Pine rocklands provide an important habitat for several
state and federally listed endangered species such as the Key deer (Odocoileus

142
virginianus clavium), the Lower Keys marsh rabbit (Sylvilagus palustris hefneri Lazell),
Kirtland’s warbler (Dendroica kirtlandii Baird), and the Florida leafwing butterfly (Anaea
troglodyta floridalis Johnson & Comstock) (Snyder et al. 1990).
Climate on BPK is defined as tropical savanna, with hot summers (mean
maximum August temperature < 32 °C), cool winters (mean minimum January
temperature > 19 °C), and a consistent summer-wet, winter-dry season. Mean annual
precipitation in the region is 980 mm, with 80% occurring from May to November
(NCDC 2011; Figure 5.2). On the rocklands, Pleistocene-aged Miami limestone is
exposed at the surface and soil is thin to non-existent. Elevation on BPK ranges from
sea-level to ca. 2.4 m, with old-growth slash pine savannas inhabiting the highest
elevations. Old-growth pines remain on the island because land development and
logging were minimal in the early 20th century. Logging was minimal in the region
because of the rugged terrain of the rocklands, low commercial value of the timber, and
difficulty of transporting timber from the islands to the mainland. Protection of pine
rockland habitat began in 1957 with the establishment of the National Key Deer Refuge
(NKDR).
5.3.2 Fire history
Crossdated fire scars identified in living trees and remnant woody material
(snags and logs) were used to reconstruct the fire regime in slash pine stands at sites on
BPK. Samples were collected from four sites: Boneyard Ridge (BYR), North Big Pine

143
Figure 5.1. Map of study site locations (hatched areas) in the National Key Deer Refuge,
Big Pine Key, Florida Keys, USA. Site codes are given in Table 1.

144
Figure 5.2. Climograph showing the average monthly precipitation (bars) and average
monthly temperature (dashed line) for Big Pine Key from 1895 to 2010 (NCDC 2011).

145
(NBP), Blue Hole South (BHS), and Terrestris Preserve (TPS) (Table 1). At each site, we
used a targeted sampling design to sample trees that contained the greatest number of
well-preserved fire scars distributed as broadly as possible over the site (Guyette and
Stambaugh 2004; Van Horne and Fulé 2006). We used a chainsaw to remove partial
cross-sections from living trees and full cross-sections from remnant material (Arno and
Sneck 1977). At BYR and NBP, we recorded the location of each sampled tree, stump, or
log with a GPS.
In the laboratory, standard dendrochronological methods were used to sand each
fire-scarred sample to a high polish (Orvis and Grissino-Mayer 2002), then crossdate the
annual growth rings of each fire-scarred sample against reference chronologies
developed at each site (Stokes and Smiley 1968). Accuracy of crossdating was verified
using the computer program COFECHA (Holmes 1983, Grissino-Mayer 2001a). The
calendar year of each ring that contained a fire scar was recorded as the fire date and
the season of each fire event was estimated by examining the intra-ring position of each
scar. The seasonal intra-annual growth dynamics of slash pine in the study area are
different than defined for the pine species first used to classify fire scar seasonality in
the southwestern United States (e.g. Baisan and Swetnam 1990). Therefore, fire scar
positions were classified as: (1) early (earlywood); (2) transition (earlywood/latewood
transition zone); (3) latewood (in latewood); and (4) dormant (ring boundary). We
based this classification on research that indicates that slash pines form earlywood from

146
February through June, latewood from July through November, and are dormant
during December and January (Langdon 1963, Harley et al. in press).
The relative extent of each fire was estimated using an index based on the
percentage of samples that recorded the fire. Composite fire scar chronologies were
used to calculate fire return intervals for fire years recorded by: (1) any sample, (2) ≥
25%, and (3) ≥ 50% of samples. We used FHX2 software to generate Weibull median
probability intervals (WMPI) and mean fire interval (MFI) statistics (Grissino-Mayer
2001b), and Student’s t-tests to compare the MFI statistics for the settlement and fire-
management periods. We considered the settlement period to extend from European-
American settlement of the Lower Keys until the establishment of the NKDR (ca. 1840–
1956) (Williams 1991). The fire-management period, characterized by prescribed
burning by NKDR personnel and wildfire suppression by Florida Division of Forestry
and Monroe County (Florida Keys) Fire Department, extended from 1957 to 2010.
5.3.3 Fire-climate relationships
To evaluate climate conditions related to historical (pre-management period) fire
occurrence in our study area, we used superposed epoch analysis (SEA) to compare
indices of ENSO and PDO with fire years with the computer program FHX2 (Baisan
and Swetnam 1990; Swetnam 1993; Grissino-Mayer 2001b). SEA is a technique that
identifies statistical, non-linear relationships between climate indices and fire dates by
superimposing windows of concurrent and lagged climate conditions on each fire event

147
Table 5.1. Site characteristics on Big Pine Key, Florida Keys, USA.
Study Sites
Site Characteristics
North Big
Pine
(NBP)
Boneyard
Ridge
(BYR)
Blue Hole
South
(BHS)
Terrestris
Preserve
(TPS)
Big Pine
Key*
(BPK)
Years of analysis
Samples collected (n)
Area (ha)
1860–2010
37
20
1707–2010
50
40
1854–2002
10
8
1842–2009
13
20
1707–2010
110
88
*BPK represents the composite of all four sites on the island: NBP, BYR, BHS,
and TPS.

148
(year). To test for possible preconditioning affects of climate on fire activity we chose a
3:1 window (3 years before, 1 year after fire events) in our SEA, and Monte Carlo
simulations were used (n = 1000) to develop bootstrapped confidence intervals to
determine whether climate was significantly different from average in years before,
during, and after fire events (Swetnam and Baison 2003). To represent years of more
extensive and widespread fire activity, we conducted SEA using years in which ≥ 50%
of sampled trees were scarred.
To assess potential climate forcing of wildfires, we compared our fire
chronologies with global- and regional-scale climate variables: (1) sea surface
temperature (SST) anomalies monitored in the equatorial Pacific Ocean from the
Niño3.4 region (1856–2010; 5°N to 5°S, 120°W to 170°W); (2) PDO values in the form of
SST anomalies in the North Pacific Ocean (1900–2010 ; poleward of 20°N; Mantua et al.
1997; Mantua and Hare 2002); (3) divisional precipitation and (4) temperature data from
Florida Climatic Division 7 (1895–2010; NCDC 2011). We chose to use SST data from the
Niño3.4 region, rather than other regions, as recent studies found this region to provide
a more discerning index for examining ENSO impacts (Hanley et al. 2003; Larkin and
Harrison 2005).

149
5.4 Results
5.4.1 Fire history
We collected 110 fire-scarred samples from the four study sites on BPK, of which
71 were successfully crossdated. We identified 373 fire scars recorded in the annual
growth rings of the samples that represented 57 unique fire events during the period
1707–2010 (Figure 5.3). The interval distributions for all fires were positively skewed,
with more short intervals (2–6 years) between fires. Although similar, the Weibull
median probability interval (4 years; WMPI) was shorter than the mean fire interval (5
years; MFI; Table 2). We were able to classify fire seasonality for 95% (n = 355) of the fire
scars; 30% of fires occurred at the transition between earlywood and latewood, and 70%
were positioned in the latewood. Although the MFI during the settlement and fire-
management periods were relatively similar, differences between them were significant
(P < 0.05; t-test; Table 3). The mean percentages of trees scarred per fire during the two
periods were markedly different, however. The percentage of scarred trees during the
settlement period was significantly higher than during the fire-management period (P <
0.05, t-test).
Ten widespread (≥ 50% scarred) fires occurred during the period 1707–1851, but
sample depth was low during this period. The period of reliability (at least 10 recorder
trees) for our fire reconstruction spanned 1852–2010. During this period, our
reconstruction revealed 13 widespread fires on BPK. Of these 13 fires, 10 occurred

150
Figure 5.3. Fire history chart (1707–2010) for the four study sites in the National Key
Deer Refuge, Big Pine Key, Florida Keys, USA. Top: Solid black line is the number of
samples (n) plotted with the percentage of trees that recorded each fire, represented by
black bars. Bottom: Each horizontal line represents a sample and vertical tick marks
represent fires. The composite record below the chart includes all fires.

151
before the establishment of the NKDR in 1957. After the establishment of the NKDR, the
three widespread fires that were recorded were prescribed burns conducted by fire
management personnel (Bergh and Wisby 1996).
5.4.2 Fire-climate relationships
Given our objective of testing historical fire-climate relationships, we included
widespread fires that burned between 1852 and 1956 in our climate analyses (pre-
management period). SEA indicated that widespread fires before the establishment of
the NKDR were likely to occur during years of low precipitation, and one year
following strong La Niña events (precipitation and Niño3.4 values significantly below
average; Figure 5.4). Antecedent climate conditions forced by both ENSO and PDO
were also important for widespread fire years. Three years prior to fire events, Niño3.4
and PDO values were significantly above average (wet conditions). Although
temperature was above average during fire years, results were not statistically
significant (P > 0.05).
5.5 Discussion
5.5.1 What were the characteristics of the fire regime on BPK?
Low sample depth and scarcity of fire scars and recorder years precluded
characterization of the fire regime before 1852. Our fire history reconstruction indicated
that the fire regime on BPK was defined by relatively frequent surface fires from the

152
Table 5.2. Composite fire interval
statistics (years) for Big Pine Key,
Florida Keys, USA.
Characteristics
Composite
Fire
Record
Samples (n)
Total fires
MFI
All fires
≥25% scarred
≥50 % scarred
WMPI
All fires
≥25% scarred
≥50% scarred
Range
SD
71
57
5.14
8.23
12.52
4.39
7.54
11.92
1–26
4.33
MFI = mean fire interval; WMPI =
Weibull median probability interval;
SD = standard deviation

153
Table 5.3. Composite fire statistics (years) for settlement
(ca. 1840–1956) and fire-management (1957–2010) periods
on Big Pine Key, Florida Keys, USA.
Period n Mean SE SD
MFI
1840–1956
1957–2010
Percent Scarred
1840–1956
1957–2010
25
18
26
19
4.40*
2.78*
38.74*
26.58*
0.48
0.29
3.41
6.22
2.40
1.22
17.37
27.10
Mean values with an asterisk are statistically different (P <
0.05, t-test); n = number of observations; SE = standard
error; SD = standard deviation; MFI = mean fire interval

154
Figure 5.4. Superposed epoch analysis showing departures from mean annual NIÑO3.4, PDO,
temperature (°C), and precipitation (mm) during years containing a widespread fire that scarred ≥ 50%
of recorder trees from all four sites. The horizontal lines are the 95% (dashed) and 99% (solid)
confidence intervals derived from 1000 Monte Carlo simulations performed on the entire data sets.
Solid black and crosshatched bars represent departures that exceeded confidence limits.
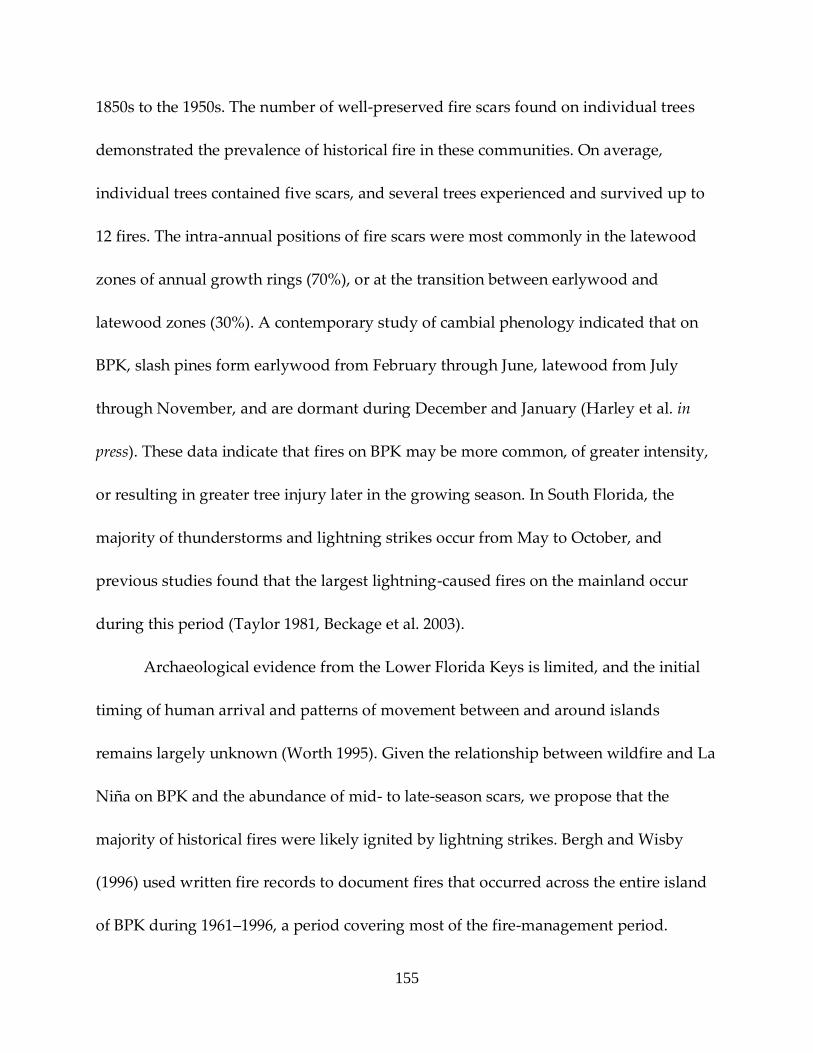
155
1850s to the 1950s. The number of well-preserved fire scars found on individual trees
demonstrated the prevalence of historical fire in these communities. On average,
individual trees contained five scars, and several trees experienced and survived up to
12 fires. The intra-annual positions of fire scars were most commonly in the latewood
zones of annual growth rings (70%), or at the transition between earlywood and
latewood zones (30%). A contemporary study of cambial phenology indicated that on
BPK, slash pines form earlywood from February through June, latewood from July
through November, and are dormant during December and January (Harley et al. in
press). These data indicate that fires on BPK may be more common, of greater intensity,
or resulting in greater tree injury later in the growing season. In South Florida, the
majority of thunderstorms and lightning strikes occur from May to October, and
previous studies found that the largest lightning-caused fires on the mainland occur
during this period (Taylor 1981, Beckage et al. 2003).
Archaeological evidence from the Lower Florida Keys is limited, and the initial
timing of human arrival and patterns of movement between and around islands
remains largely unknown (Worth 1995). Given the relationship between wildfire and La
Niña on BPK and the abundance of mid- to late-season scars, we propose that the
majority of historical fires were likely ignited by lightning strikes. Bergh and Wisby
(1996) used written fire records to document fires that occurred across the entire island
of BPK during 1961–1996, a period covering most of the fire-management period.

156
During this time, they documented 58 fires, of which 27 were wildfires, and 31 were
prescribed burns. Of the documented wildfire, 6 were known to be caused by lightning
and occurred between April and September.
5.5.2 Did the historical fire regime change in the 20th century?
The frequency and spatial extent of fire events were significantly different
between the settlement period (ca. 1840–1956) and the fire-management period (1957–
2010). Although the MFI values during settlement and fire-management periods were
relatively similar, the difference between them was statistically significant (P < 0.05; t-
test). During the settlement period, fires on BPK burned about every four years and
were spatially extensive, possibly burning large areas of the island. As the human
population on BPK slowly increased from the early to middle 1900s, fires became more
frequent and less widespread. After the establishment of the NKDR in 1957, fires
occurred nearly twice as often as during the settlement period and were spatially
restricted, likely due to an increase in roads, active fire management policies, and more
incendiary fires due to increased population.
The locations of the four study sites on BPK made possible an analysis of the
spatial extent of fires across much of the island. The periods of reliability for the fire
records from BHS and TPS were not similar to those from NBP and BYR. Nonetheless,
an analysis of the spatial extent of fires across BPK suggests that before the 1950s,
wildfires burned large areas of the island. Beginning in the 1960s, however, fires at each

157
site became less frequent and more patchy, scarring fewer trees. Several widespread
fires within sites did occur during the fire-management period, but these were
prescribed burns conducted by NKDR personnel in 1977, 1990, and 2004. Habitat
fragmentation and active fire management were likely causes of the change in spatial
extent of fire between the settlement and fire-management periods documented by the
difference between percentages of trees scarred during these two intervals.
5.5.3 What are the effects of ENSO and PDO on fires in the Florida Keys?
Our analyses of fire and climate revealed that the historical fire regime on BPK
was influenced by years of low precipitation in combination with cycles of ENSO and
PDO. Beckage et al. (2003) discovered that El Niño/La Niña phase cycles influenced fire
regimes in the Everglades from 1948 to 1999. They proposed that increased winter (dry-
season) rainfall associated with El Niño increased plant growth and preconditioned fire
activity. In contrast, the decreased winter rainfall associated with La Niña resulted in
lowered surface water levels in the Everglades, increased the spatial continuity of fine
fuels, and allowed fires to spread over larger areas. The ENSO portion of our results
agrees with the findings of Beckage et al. (2003), and we suggest that the same
interacting effects of El Niño/La Niña, in part, influence fire occurrence on BPK. In
addition to the interacting effects of ENSO on fires, we suggest that modulation of El
Niño/La Niña phases by PDO may influence fires on BPK.

158
Although weakly significant, we found that El Niño conditions (wet) occur three
years prior to fire events and could produce increased growth of fine fuels (grasses,
shrubs, palms), just as Beckage et al. (2003) proposed in the Everglades of southern
Florida. In addition to El Niño conditions, we found evidence that suggests the ENDM,
which is known to intensify winter precipitation anomalies in southern Florida
(Kurtzman and Scanlon 2007), was responsible for increased fire activity on BPK. Our
results suggest that positive anomalies of El Niño were strengthened by PDO warm
phases, which could cause increased growth of fine fuels. In congruence with dry years,
strong La Niña conditions one year before fire years seem to be responsible for
escalating the probability of fire weather that supports the frequent and widespread
wildfires on which the pyrogenic pine rocklands depended prior to the advent of
intentional human ignitions.
We did not find convincing evidence for an association between the LNDM and
wildfires. Although PDO values one year prior to fire events were generally negative,
departures from mean were not significant. This result was not surprising given that
Kurtzman and Scanlon (2007) found that the PDO modulation was more related to El
Niño than La Niña in southern Florida. They found the effect of PDO on La Niña winter
precipitation to be negligible, in keeping with our results relative to climate drivers of
wildfire activity in the Lower Florida Keys.

159
Because we hypothesized that a relationship exists between the ENDM and fire,
we expected to find significant departures (higher) from mean precipitation three years
prior to fire events. Although values were not statistically significant, precipitation was
generally above normal during this time. An explanation of this result could be the
unknown error associated with using precipitation data averaged over Florida Climate
Division 7, which can vary drastically between the southern portion of peninsular
Florida and the Lower Florida Keys; rainfall totals may not be representative of what
was actually experienced on BPK. Regardless, we have shown that antecedent phase
patterns of ENSO and PDO, combined with drier than normal years, might result in
widespread fire on BPK. In the past, these fires likely burned large areas and
contributed to the long-term persistence of pine rockland communities in the Lower
Florida Keys.
5.5 Conclusions
Pine rocklands are globally endangered, pyrogenic plant communities restricted
to The Bahamas and small areas in southern Florida. On BPK, we suggest linkages
between climatic variability in the equatorial Pacific and historical wildfire occurrence,
and given the co-development of pine rocklands with fire, these processes have likely
operated for thousands of years across the Lower Florida Keys region (Tudhope et al.
2001). Our results are applicable to other areas of pine rockland habitat. Additional fire-
scar data (including increased sample depth during the 18th and 19th centuries) from

160
neighboring islands in the Lower Florida Keys, southern mainland Florida, and The
Bahamas could reveal broader, longer-term spatial relationships between climate and
wildfire activity.
5.6 Acknowledgements
This research was supported by the U.S. Fish and Wildlife Service, and by the
National Science Foundation under Grant Nos. 1002479 and 0538420. G.L. Harley was
also supported by a Yates Dissertation Fellowship from the University of Tennessee. We
thank Anne Morkill, Chad Anderson, and Dana Cohen for access to the National Key
Deer Refuge; Kody Honeyman, John Sakulich, and Douglass Heruska for field
assistance; and Kody Honeyman, Joshua Turner, and Christopher Petruccelli for
preparing fire-scarred samples for analyses.

161
References
Allan, R. J., J. Lindesay, and D. E. Parker. 1996. El Niño Southern Oscillation and
climatic variability. CSIRO Publishing, Collingwood, Victoria, Australia.
Arno, S. F., and K. M. Sneck. 1977. A method for determining fire history in coniferous
forests of the mountain west. USDA Forest Service Intermountain Forest and Range
Experiment Station, General Technical Report, INT-42.
Baisan, C. H., and T. W. Swetnam. 1990. Fire history on a desert mountain range:
Rincon Mountain Wilderness, Arizona, U.S.A. Canadian Journal of Forest Research 20,
1559–1569.
Beckage, B., and W. J. Platt. 2003. Predicting severe wildfire years in the Florida
Everglades. Frontiers in Ecology and the Environment 1, 235–239.
Beckage, B., W. J. Platt, M. G. Slocum, and B. Panko.2003. Influence of the El Niño
Southern Oscillation on fire regimes in the Florida Everglades. Ecology 84, 3124–3130.
Bergh, C., and J. Wisby. 1996. Fire History of the Lower Keys Pine Rocklands. The
Nature Conservancy Special Report, 38 pp.
Biondi, F., A. Gershunov, and D. R. Cayan. 2001. North Pacific decadal climate
variability since 1661. Journal of Climate 14, 5–10.
Brenner, J. 1991. Southern Oscillation anomalies and their relation to Florida wildfires.
International Journal of Wildland Fire 1, 73–78.
Brown, P. M., and R. Wu. 2005. Climate and disturbance forcing of episodic tree
recruitment in a southwestern ponderosa pine landscape. Ecology 86, 3030–3038.
Fulé, P. Z., J. Villanueva-Diaz, and M. Ramos-Gomez. 2005. Fire regime in a
conservation reserve in Chihuahua, Mexico. Canadian Journal of Forest Research 35,
320–330.
Goodrick, S. L., and D. E. Hanley. 2009. Florida wildfire activity and atmospheric
teleconnections. International Journal of Wildland Fire 18, 476–482.

162
Grissino-Mayer, H. D. 2001a. Evaluating crossdating accuracy: a manual for the
program COFECHA. Tree-Ring Research 57, 205–219.
Grissino-Mayer, H. D. 2001b. FHX2–software for analyzing temporal and spatial
patterns in fire regimes from tree rings. Tree-Ring Research 57, 115–124.
Guyette, R. P., and M. C. Stambaugh. 2004. Post oak fire scars as a function of diameter,
growth, and tree age. Forest Ecology and Management 198, 183–192.
Hanley, D. E., M. A. Bourassa, J. J. O’Brien, S. R. Smith, and E. R. Spade. 2003. A
quantitative evaluation of ENSO indices. Journal of Climate 16, 1249–1258.
doi:10.1175/1520-0442200316<1249:AQ EOEI>2.0.CO;2
Harley, G. L., H. D. Grissino-Mayer, and S. P. Horn. 2011. The dendrochronology of
Pinus elliottii var. densa in the Lower Florida Keys: Chronology development and
climate response. Tree-Ring Research 67, 39–50.
Harley, GL, Grissino-Mayer HD, Franklin JA, Anderson C, Kose N. 2012. Cambial
activity of Pinus elliottii var. densa reveals influence of seasonal insolation on growth
dynamics in the Florida Keys. Trees–Structure and Function, In Press.
Harrison, M., and C. E. Meindl. 2001. A statistical relationship between El Niño-
Southern Oscillation and Florida wildfire occurrence. Physical Geography 22, 187–203.
Heyerdahl, E. K., L. B. Brubaker, and J. K. Agee. 2001. Spatial controls of historical fire
regimes: a multiscale example from the Interior West, USA. Ecology 82, 660–678.
Heyerdahl, E. K., L. B. Brubaker, and J. K. Agee. 2002. Annual and decadal climate
forcing of historical fire regimes in the interior Pacific Northwest, USA. The Holocene
12, 597–604.
Heyerdahl, E. K., and E. Alvarado. 2003. Influence of climate and land use on historical
surface fires in pine-oak forests, Sierra Madre Occidental, Mexico. Fire and climatic
change in temperate ecosystems of the western Americas ed. by T. T. Veblen, W. L.
Baker, G. Montenegro and T. W. Swetnam, pp. 196–217. Springer-Verlag, New York.
Holmes, R. L. 1983. Computer assisted quality control in tree-ring dating and
measurement. Tree-Ring Bulletin 43, 69–78.

163
Jones, C. S., J. F. Shriver, and J. J. O’Brien. 1999. The effects of El Niño on rainfall and
fire in Florida. The Florida Geographer 30, 55–69.
Kaplan, A., M. A. Cane, Y. Kushnir, A. C. Clement, M. B. Blumenthal, and B.
Rajagopalan. 1998. Analyses of global sea surface temperature 1856–1991. Journal of
Geophysical Research-Oceans, 103(C9), 18567–18589.
Kipfmueller, K. F., and J. A. Kupfer. 2005. Complexity of successional pathways in
subalpine forests of the Selway-Bitterroot Wilderness Area, USA. Annals of the
Association of American Geographers 95, 495–510.
Kitzberger, T., T. W. Swetnam, and T. T. Veblen. 2001. Inter-hemispheric synchrony of
forest fires and the El Niño-Southern Oscillation. Global Ecology and Biogeography 10,
315–326.
Kitzberger, T., P. M. Brown, E. K. Heyerdahl, T. W. Swetnam, and T. T. Veblen. 2007.
Contingent Pacific-Atlantic Ocean influence on multi-century wildfire synchrony
over western North America. Proceedings of the National Academy of Sciences 104, 543–
548.
Kurtzman, D., and B. R. Scanlon. 2007. El Niño-Southern Oscillation and Pacific Decadal
Oscillation impacts on precipitation in the southern and central United States:
Evaluation of spatial distribution and predictions. Water Resources Research 43,
W10427, doi: 10.1029/2007WR005863.
Langdon, O.G. 1963. Growth patterns of Pinus elliottii var. densa. Ecology 44, 825–827.
Larkin, N. K., and D. E. Harrison. 2005. On the definition of El Niño and associated
seasonal average US weather anomalies. Geophysical Research Letters 32, L13705.
doi:10.1029/2005GL022738
Mantua, N. J., S. R. Hare, Y. Zhang, J. M. Wallace, and R. C. Francis. 1997. A Pacific
interdecadal climate oscillation with impacts on salmon production. Bulletin of the
American Meteorological Society 78, 1069–1079.
Mantua, N. J., and S. R. Hare. 2002. The Pacific decadal oscillation. Journal of
Oceanography 58, 35–44.
Mote, P. W., E. A. Parson, A. F. Hamlet, W. S. Keeton, D. Lettenmaier, N. Mantua, E. L.
Miles, D. W. Peterson, D. L. Peterson, R. Slaughter, and A. K. Snover. 2003.

164
Preparing for climatic change: the water, salmon, and forests of the Pacific
Northwest. Climatic Change 61, 45–88.
National Climatic Data Center (NCDC). 2011. Asheville, North Carolina.
www.ncdc.noaa.gov, accessed 23 July 2011.
Norman, S. P., and A. H. Taylor. 2003. Tropical and north Pacific teleconnections
influence fire regimes in pine-dominated forests of north-eastern California, USA.
Journal of Biogeography 30, 1081–1092.
Noss, R. F., E. T. LaRoe, and J. M. Scott. 1995. Endangered Ecosystems of the United
States: A Preliminary Assessment of Loss and Degradation. U.S. Department of the
Interior, Biological Report 28, Washington D.C.
Orvis, K. H., and H. D. Grissino-Mayer. 2002. Standardizing the reporting of abrasive
papers used to surface tree-ring samples. Tree-Ring Research 58, 47–50.
Ropelewski, C. F., and M. S. Halpert. 1986. North American precipitation and
temperature patterns associated with the El Niño/Southern Oscillation (ENSO).
Monthly Weather Review 114, 2352–2362.
Ropelewski, C. F., and M. S. Halpert. 1987. Global and regional scale precipitation
patterns associated with El Niño-Southern Oscillation. Monthly Weather Review 115,
1606–1626.
Sah, J. P., M. S. Ross, S. Koptur, and J. R. Snyder. 2004. Estimating aboveground biomass
of broadleaved woody plants in the understory of Florida Keys pine forests. Forest
Ecology and Management 203, 319–329.
Schoennagel, T., T. T. Veblen, W. H. Romme, J. S. Sibold, and E. R. Cook. 2005. ENSO
and PDO variability affect drought-induced fire occurrence in Rocky Mountain
subalpine forests. Ecological Applications 15, 2000–2014.
Skinner, C. N., J. H. Burk, M. G. Barbour, E. Franco-Vizcaino, and S. L. Stephens. 2008.
Influences of climate on fire regimes in montane forests of north-western Mexico.
Journal of Biogeography 3, 1436–1451.
Slocum, M. G., W. J. Platt, B. Beckage, S. L. Orzell, and W. Taylor. 2010. Accurate
quantification of seasonal rainfall and associated climate-wildfire relationships.
Journal of Applied Meteorology and Climatology 49, 2559–2573.

165
Snyder, J. R., A. Herndon, and W. B. Robertson Jr. 1990. South Florida Rocklands. Pages
230–277 in R. L. Myers and J. J. Ewel, editors. Ecosystems of Florida. University of
Central Florida Press, Orlando, Florida.
Stokes, M. A., and T. A. Smiley. 1968. An Introduction to Tree‐Ring Dating. University
of Chicago Press. Chicago, Illinois.
Swetnam, T. W. 1990. Fire history and climate in the southwestern United States. Pages
6–17 in Proceedings of the Symposium Effects of fire management of southwestern
natural resources. USDA Forest Service General Technical Report RM-191, Tucson,
Arizona, USA.
Swetnam, T. W., ad J. L. Betancourt. 1990. Fire–Southern Oscillation relations in the
southwestern United States. Science 249, 1017–1020.
Swetnam, T. W., and J. L. Betancourt. 1998. Mesoscale disturbance and ecological
response to decadal climatic variability in the American Southwest. Journal of Climate
11, 3128–3147.
Swetnam, T. W., and C. H. Baisan. 2003. Tree-ring reconstructions of fire and climate
history in the Sierra Nevada and southwestern United States. Fire and climatic
change in temperate ecosystems of the western Americas ed. by T. T. Veblen, W. L.
Baker, G. Montenegro, and T.W. Swetnam., pp. 158–195. Springer, New York.
Taylor, A. H., and C. N. Skinner. 1998. Fire history and landscape dynamics in a late-
successional reserve, Klamath Mountains, California, USA. Forest Ecology and
Management 111, 285–301.
Taylor, A. H., and C. N. Skinner. 2003. Spatial and temporal patterns of historic fire
regimes and forest structure as a reference for restoration of fire in the Klamath
Mountains. Ecological Applications 13, 704–719.
Taylor, A. H., and R. M. Beaty. 2005. Climatic influences on fire regimes in the Carson
Range, Lake Tahoe Basin, Nevada, U.S.A. Journal of Biogeography 32, 425–438.
Taylor, D. L. 1981. Fire history and fire records for Everglades National Park, 1948–1979.
Everglades National Park, South Florida Research Center Report No. T-619.

166
Tudhope, A. W., C. P. Chilcott, M. T. McCulloch, E. R. Cook, J. Chappell, R. M. Ellam,
D. W. Lea, J. M. Lough, and G. B. Shimmield. 2001. Variability in the El Niño-
Southern Oscillation through a glacial–interglacial cycle. Science 291, 1511–1517.
Van Horne, M. L., and P. Z. Fulé. 2006. Comparing methods of reconstructing fire
history using fire scars in a southwestern United States ponderosa pine forest.
Canadian Journal of Forest Research 36, 855–867.
Veblen, T. T., and T. Kitzberger. 2002. Inter-hemispheric comparison of fire history: The
Colorado Front Range, U.S.A. and the Northern Patagonian Andes, Argentina. Plant
Ecology 163, 187–207.
Whitlock, C., S. L. Shafer, and J. Marlon. 2003. The role of climate and vegetation change
in shaping past and future fire regimes in the northwestern US and the implications
for ecosystem management. Forest Ecology and Management 178, 5–21.
Williams, L. 1991. Lower Keys pioneers and settlements. Pages 75–78 in J. Gato, editor.
The Monroe County Environmental Story, Gemini Printing, Marathon, Florida.
Worth, J. E. 1995. Fontaneda revisted: Five descriptions of sixteenth-century Florida. The
Florida Historical Quarterly 73, 339–352.

167
Chapter 6
Summary and Conclusions

168
Chapter 6
Summary and Conclusions
The purpose of this dissertation research was to identify the ecological and
climatic processes responsible for the long-term persistence of pine rocklands in the
Florida Keys and investigate how human-induced changes during the past several
centuries contributed to the decline of these endangered communities. Additionally,
this research fills a void in our knowledge of how global-scale climate dynamics and
natural and human-induced disturbances shape the distribution of pine rocklands. This
chapter summarizes the major findings of my research.
Tree-ring analysis in Florida has primarily been limited to species located in
central and northern regions of the state. Although the majority of tree species in South
Florida fail to produce annual rings, my research demonstrated that South Florida slash
pine is a species of dendrochronological value. Multi-centennial chronologies can be
developed and used to provide more detailed information regarding the structure and
dynamics of endangered pine rockland communities and how fire disturbance has
shaped the current distribution of slash pine in the Lower Florida Keys. Slash pine is the
southernmost pine species in the United States and the only pine to inhabit the lower
third of peninsular Florida. Hence, because slash pine in the Lower Florida Keys exists
at its southern range limit, the species could prove vital for understanding the possible
effects of future climate change on range distributions of species in habitats that could
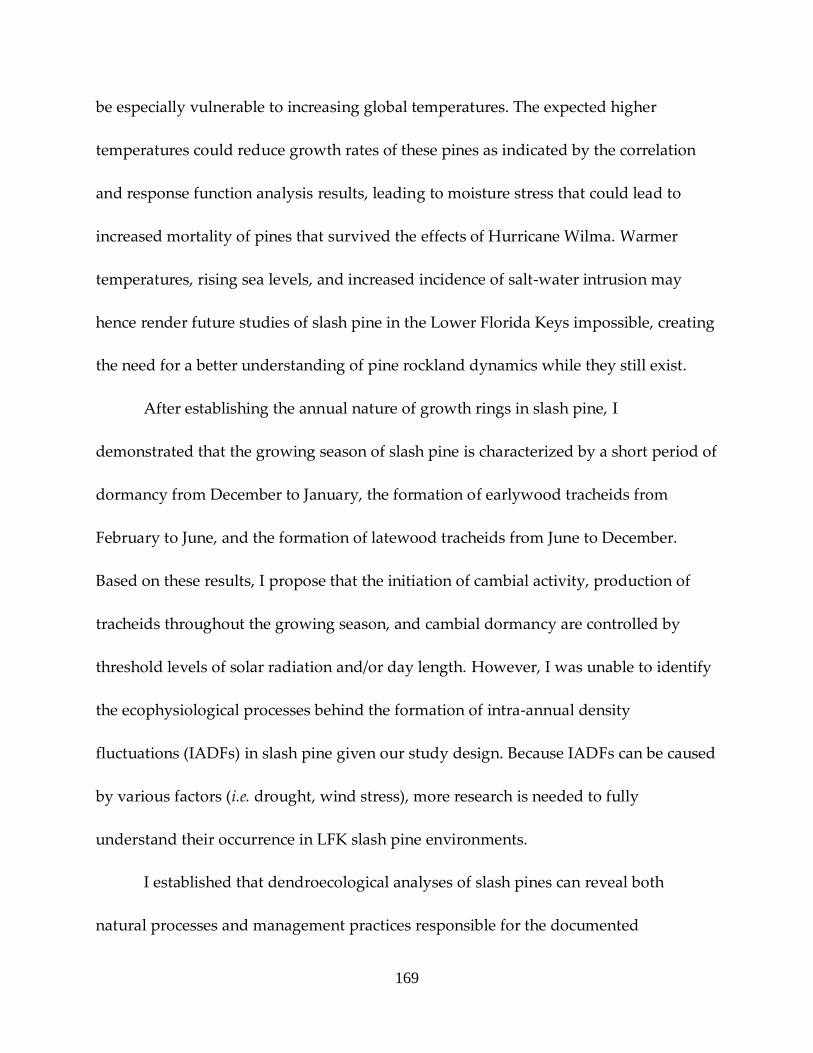
169
be especially vulnerable to increasing global temperatures. The expected higher
temperatures could reduce growth rates of these pines as indicated by the correlation
and response function analysis results, leading to moisture stress that could lead to
increased mortality of pines that survived the effects of Hurricane Wilma. Warmer
temperatures, rising sea levels, and increased incidence of salt-water intrusion may
hence render future studies of slash pine in the Lower Florida Keys impossible, creating
the need for a better understanding of pine rockland dynamics while they still exist.
After establishing the annual nature of growth rings in slash pine, I
demonstrated that the growing season of slash pine is characterized by a short period of
dormancy from December to January, the formation of earlywood tracheids from
February to June, and the formation of latewood tracheids from June to December.
Based on these results, I propose that the initiation of cambial activity, production of
tracheids throughout the growing season, and cambial dormancy are controlled by
threshold levels of solar radiation and/or day length. However, I was unable to identify
the ecophysiological processes behind the formation of intra-annual density
fluctuations (IADFs) in slash pine given our study design. Because IADFs can be caused
by various factors (i.e. drought, wind stress), more research is needed to fully
understand their occurrence in LFK slash pine environments.
I established that dendroecological analyses of slash pines can reveal both
natural processes and management practices responsible for the documented

170
successional pattern in pine rockland ecosystems in southern Florida, especially during
the late 20th century. I found that the fire regimes of two adjacent islands differed in
return interval, frequency, and relative spatial extent, but were similar in fire season. At
the Boneyard Ridge site (BYR), fire activity decreased with the establishment of the
NKDR, but recruitment was ubiquitous, likely due to multiple, widespread prescribed
burns conducted in recent years. Although the No Name Key site (NNK) experienced
fewer fires altogether than BYR, pines recruited at the site from at least the 1890s until
the 1980s. The near absence of recruitment at NNK currently suggests that the lack of
fire since the 1990s might result in the loss of pine rockland habitat in the future.
The structure of the BYR stand demonstrates that prescribed fire can be used to
restore and sustain structural features (density, basal area, fuel loads) resembling those
that existed before the 1950s (fire-management period). However, re-introducing
prescribed fire on NNK will be complicated by the density of understory vegetation and
the amount of course woody debris. Implementing prescribed fires that do not become
crown fires that kill overstory pines will be a daunting task for land managers, perhaps
requiring initial manual clearing of understory fuels. The fire history and stand
structure characterizations we produced for Big Pine and No Name Keys testify to both
the past success of prescribed fire as a management tool and the difficulty of initiating
this management tool in long-unburned pine rocklands stands of the Florida Keys.

171
Fire is a primary disturbance that shapes the distribution of slash pine on islands
in the Lower Florida Keys. Microscopic and macroscopic charcoal in sediment cores
from small ponds on Big Pine and No Name Keys demonstrate repeated fire through
the late Holocene (Albritton 2009, Kocis 2012, Horn unpublished data). However,
archaeological evidence on the timing and movement of people in the Florida Keys is
scarce, resulting in some uncertainty over ignition sources (e.g. anthropogenic versus
climate) of historic and prehistoric wildfires recorded by tree rings and sedimentary
charcoal. Based on my tree-ring chronologies, I suggest linkages between climatic
variability in the equatorial Pacific and historical wildfire occurrence on BPK, the
largest island in the Lower Florida Keys. The fire-climate relationship data suggest that
antecedent phase patterns of ENSO and PDO, combined with drier than normal years,
might result in widespread fire on BPK. In the past, these fires likely burned large areas
and contributed to the long-term persistence of pine rockland communities in the
Lower Florida Keys. Given the co-development of pine rocklands with fire, these
processes have likely operated for thousands of years across the Lower Florida Keys
region. The fire regime and fire-climate results are applicable to other areas of pine
rockland habitat. Additional fire-scar data from neighboring islands, as well as
increased sample depth during the 18th and 19th centuries, could reveal broader, longer-
term spatial relationships between climate and wildfire occurrence in the Lower Florida
Keys.

172
6.1 Recommendations for future research
This research demonstrated that the southernmost native distributed conifer in
the United States forms consistently annual growth rings and is a useful species for
ecological and climatic studies. Although I was able to show that late season moisture
availability is an important climatic variable for annual slash pine radial growth, the
overall climate signal found using total annual ring width was weak. In addition to
considering total ring-width chronologies, future dendroclimatological research in this
area should investigate a slash pine climate signal using earlywood/latewood tree-ring
chronologies and stable oxygen isotopic ratios within annual growth rings. Analysis of
stable oxygen isotopic ratios within annual growth rings also provides the opportunity
to potentially reconstruct drought and tropical cyclone occurrence for the Lower Florida
Keys region.
The research outlined in this dissertation was conducted on two of the five
islands that contain pine rockland savanna habitat in the Florida Keys. To test whether
the relationships between historical wildfires and ocean/atmosphere oscillations found
in pine rocklands of the Lower Florida Keys exist at broader spatial scales, future
research projects should investigate these potential relationships in other pine rockland
areas. To broaden the fire history network in the Southeast United States and the
Caribbean Basin, fire history chronologies should be developed from habitat areas on
other islands in the Lower Florida Keys, mainland southern Florida, and The Bahamas.

173
6.2 Conceptual ecological model and desired future conditions
On February 12, 2010, the Pine Rocklands Working Group held a workshop in
Coral Gables, Florida. One of the primary results from this workshop was a customized
conceptual ecological model for pine rockland in the National Key Deer Refuge
(NKDR), Lower Florida Keys (Myers 2010; Figure 1.1). The ecological model for the
NKDR pine rocklands incorporates the desired future condition preferences of land
managers and agencies. Current and future management decisions in the NKDR will be
made based on the desire to have 70% of pine rockland habitat characterized at the
early-seral stage, 20% at the mid-seral stage, and 10% at the late-seral stage.
I incorporated data from Chapter 4 into the original model and these data agree
with some of the model parameters, but revise others. The fire history reconstruction
from the Boneyard Ridge site (BYR; early-seral stage) revealed a fire return interval of 6
years, which is within the 2–7 year maintenance fire interval range, but greater than the
upper end of the preferred interval (5 years). Structural data from BYR revealed the
stand to be at the early-seral stage (as defined by Myers 2010), which is the most desired
successional stage for habitat in the NKDR (70%). The fire history reconstruction from
the No Name Key site (NNK; late-seral stage) revealed a fire return interval of 10 years,
which is more frequent than the later-seral stage fire return interval range proposed in
the model (16–25+). Rather, the 10-year fire return interval found in the late-seral habitat
at NNK was within the fire return interval range for the mid-seral stage (8–15 years).
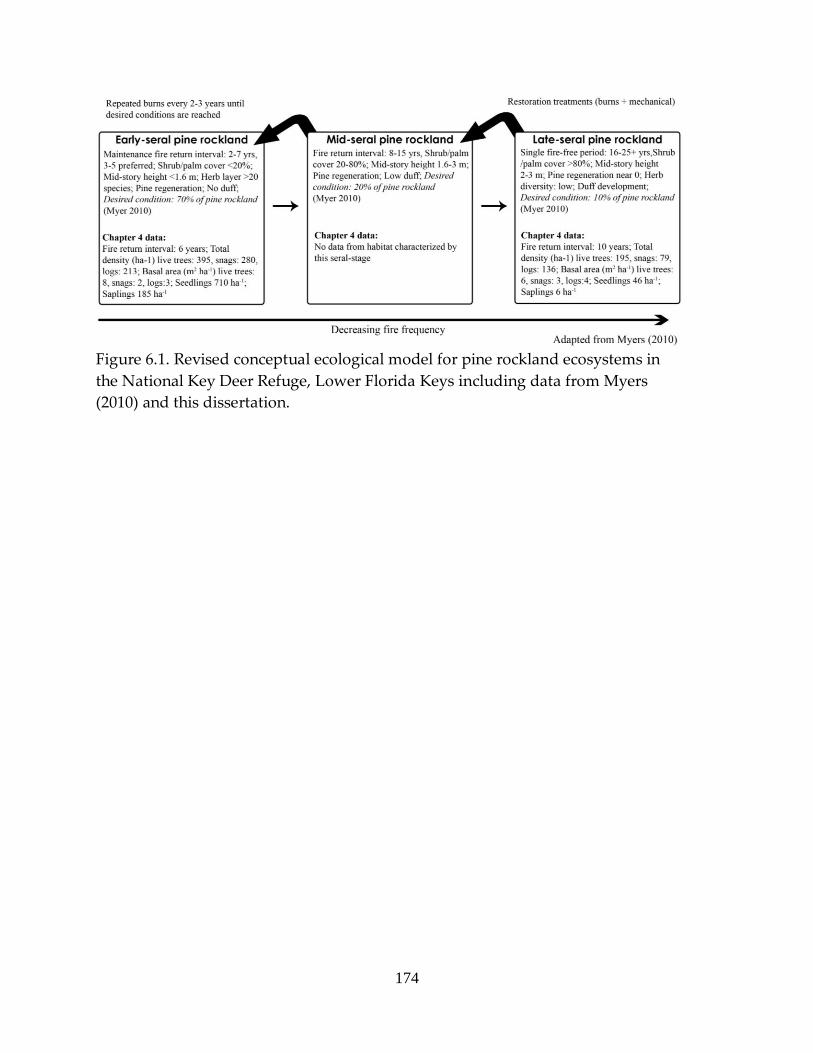
174
Figure 6.1. Revised conceptual ecological model for pine rockland ecosystems in
the National Key Deer Refuge, Lower Florida Keys including data from Myers
(2010) and this dissertation.

175
Fire history and stand structure data from NNK demonstrate that pine rockland habitat
can progress to the late-seral stage with a fire return interval of 10 years.
The inclusion of tree-ring based fire history and stand structure data from early-
and late-seral habitat areas in the NKDR suggests the need to revise the current
conceptual ecological model proposed by Myers (2010). More data on the historical fire
frequency, vegetation structure, and fire effects on vegetation, especially from mid-seral
pine rockland, are needed to better refine model parameters in the NKDR. A revised
ecological model will aid land managers in implementing the desired future conditions
of NKDR pine rocklands.

176
References
Albritton, J.W. 2009. A 1700-year history of fire and vegetation in Pine Rocklands of
National Key Deer Refuge, Big Pine Key, Florida: Charcoal and pollen evidence
from Key Deer Pond. M.S. Thesis, Department of Geography, University of
Tennessee, Knoxville.
Kocis, D.L. 2012. Reconstruction of fire history in the National Key Deer Refuge,
Monroe County, Florida: The Palmetto Pond macroscopic charcoal record. M.S.
Thesis, Department of Geography, University of Tennessee, Knoxville.
Myers, R.L. 2010. Pine rockland fire management decision-making workshop: a
synopsis. Pine Rockland Working Group. http://fl.biology.usgs.gov/pineland/
pdf/Pine_Rocklands_Fire_Workshop_Synopsis.pdf

177
Appendices

178
Appendix 1. COFECHA program output for Boneyard Ridge site chronology, Big Pine Key, Lower Florida Keys.
P R O G R A M C O F E C H A Version 6.06P 27843
------------------------------------------------------------------------------------------------------------------------------------
QUALITY CONTROL AND DATING CHECK OF TREE-RING MEASUREMENTS
File of DATED series: BYR.TXT
Time span of Master dating series is 1707 to 2009 303 years
Continuous time span is 1707 to 2009 303 years
Portion with two or more series is 1721 to 2009 289 years
****************************************
*C* Number of dated series 63 *C*
*O* Master series 1707 2009 303 yrs *O*
*F* Total rings in all series 7367 *F*
*E* Total dated rings checked 7353 *E*
*C* Series intercorrelation .576 *C*
*H* Average mean sensitivity .461 *H*
*A* Segments, possible problems 5 *A*
*** Mean length of series 116.9 ***
****************************************
ABSENT RINGS listed by SERIES: (See Master Dating Series for absent rings listed by year)
BYR31x A 1 absent rings: 1992
BYR31axA 2 absent rings: 1853 1930
BYR35x A 1 absent rings: 1766
BYR42x A 1 absent rings: 1882
BYR48x A 1 absent rings: 1942
BYR112xA 1 absent rings: 1845
BYR505xA 1 absent rings: 1838
8 absent rings .109%

179
PART 2: TIME PLOT OF TREE-RING SERIES
1050 1100 1150 1200 1250 1300 1350 1400 1450 1500 1550 1600 1650 1700 1750 1800 1850 1900 1950 2000 2050 Ident Seq Time-span Yrs
. . . . . . . . . . . . . . . . . <===========> . BYR60 B 1 1886 2009 124
. . . . . . . . . . . . . . . . . . <======> . BYR61 A 2 1933 2009 77
. . . . . . . . . . . . . . . . . . <=======> . BYR62 B 3 1924 2009 86
. . . . . . . . . . . . . . . . . . <======> . BYR601 B 4 1935 2008 74
. . . . . . . . . . . . . . . . . . <====> . BYR602 B 5 1954 2009 56
. . . . . . . . . . . . . . . . . . <======> . BYR603 D 6 1933 2009 77
. . . . . . . . . . . . . . . . . . <=====> . BYR604 D 7 1943 2009 67
. . . . . . . . . . . . . . . . . . <======> . BYR605 D 8 1935 2009 75
. . . . . . . . . . . . . . . . . . <=====> . BYR606 D 9 1946 2009 64
. . . . . . . . . . . . . . . . . . .<===> . BYR607 D 10 1969 2009 41
. . . . . . . . . . . . . . . . . .<========> . BYR608 C 11 1916 2009 94
. . . . . . . . . . . . . . . . . <=========> . BYR609 C 12 1908 2009 102
. . . . . . . . . . . . . . . . . <=========> . BYR610 D 13 1907 2009 103
. . . . . . . . . . . . . . . . .<=============> . BYR612 D 14 1867 2009 143
. . . . . . . . . . . . . . . . . <=========> . BYR614 D 15 1904 2008 105
. . . . . . . . . . . . . . . . .<=============> . BYR615 C 16 1867 2009 143
. . . . . . . . . . . . . . . . . . <====> . BYR616 E 17 1958 2009 52
. . . . . . . . . . . . . . . . . . <====> . BYR617 A 18 1954 2009 56
. . . . . . . . . . . . . . . . . .<========> . BYR620 B 19 1919 2009 91
. . . . . . . . . . . . . . . . . . <=====> . BYR621 C 20 1948 2009 62
. . . . . . . . . . . . . . . . . . <=======> . BYR622 D 21 1921 2009 89
. . . . . . . . . . . . . . . . . . <=======> . BYR623 B 22 1922 2009 88
. . . . . . . . . . . . . . . . . . . <==> . BYR625 C 23 1977 2009 33
. . . . . . . . . . . . . . . . . . . <==> . BYR626 A 24 1977 2009 33
. . . . . . . . . . . . . . . . . <===========> . BYR627 B 25 1884 2008 125
. . . . . . . . . . . . . . . . <==========>. . . BYR001 A 26 1835 1944 110
. . . . . . . . . . . . . . . . .<=============> . BYR30x A 27 1869 2008 140
. . . . . . . . . . . . . . . . <================> . BYR31x A 28 1839 2009 171
. . . . . . . . . . . . . . .<=================>. . . BYR31axA 29 1763 1942 180
. . . . . . . . . . . . . . <============> . . . . BYR35x A 30 1721 1851 131
. . . . . . . . . . . . . . . <=====================> . BYR36x C 31 1785 2008 224
. . . . . . . . . . . . . . . .<==================> . BYR40x A 32 1810 2008 199
. . . . . . . . . . . . . . . . <==============> . . BYR42x A 33 1822 1979 158
. . . . . . . . . . . . . . <===============> . . . BYR43x B 34 1750 1910 161
. . . . . . . . . . . . . . <==============>. . . . BYR44x A 35 1747 1897 151
. . . . . . . . . . . . . . . . <==============> . BYR45x A 36 1858 2008 151
. . . . . . . . . . . . . . . <===============> . . . BYR46x A 37 1779 1933 155
. . . . . . . . . . . . . . .<=======================> . BYR48x A 38 1767 2008 242
. . . . . . . . . . . . . . . . <===============> . BYR49x A 39 1846 2008 163
. . . . . . . . . . . . . . . <=====================> . BYR50x C 40 1789 2008 220
. . . . . . . . . . . . . . <=================> . . . BYR112xA 41 1747 1924 178
. . . . . . . . . . . . . . . . . <===========> . BYR501xA 42 1880 2008 129
. . . . . . . . . . . . . . . . . <==========> . BYR502xB 43 1898 2008 111
. . . . . . . . . . . . . . . . . . <=======> . BYR503xA 44 1929 2008 80
. . . . . . . . . . . . . . <=======> . . . . . BYR504xA 45 1747 1824 78
. . . . . . . . . . . . . . <===========> . . . . BYR505xA 46 1756 1870 115
. . . . . . . . . . . . . . . . . .<=======>. . BYR507xA 47 1913 1997 85
. . . . . . . . . . . . . . . . . <=========> . BYR510xB 48 1902 2008 107
. . . . . . . . . . . . . . . . .<=============> . BYR511xC 49 1867 2008 142
. . . . . . . . . . . . . . . . . <============> . BYR512xA 50 1873 2008 136
. . . . . . . . . . . . . . . . . .<========> . BYR513xA 51 1911 2008 98
. . . . . . . . . . . . . . . . . . <======> . BYR514xB 52 1932 2008 77
. . . . . . . . . . . . . . . . . <===========> . BYR515xB 53 1885 2008 124
. . . . . . . . . . . . . . . .<==================> . BYR516xB 54 1815 2008 194
. . . . . . . . . . . . . . . .<==================> . BYR518xA 55 1811 2008 198
. . . . . . . . . . . . . . . .<==================> . BYR519xA 56 1814 2008 195
. . . . . . . . . . . . . . . . <===========> . . BYR520xA 57 1838 1950 113

180
PART 2: TIME PLOT OF TREE-RING SERIES (CONT)
. . . . . . . . . . . . . . . <==========> . . . BYR521xB 58 1799 1904 106
. . . . . . . . . . . . . . . . <=======> . . . BYR600xA 59 1855 1932 78
. . . . . . . . . . . . . <===========> . . . . . BYR700AA 60 1707 1829 123
. . . . . . . . . . . . . . . . . <=====>. . . BYR701xB 61 1882 1945 64
. . . . . . . . . . . . . . . . .<=============> . BYR702xD 62 1861 2009 149
. . . . . . . . . . . . . . . . <======> . . . BYR703xB 63 1840 1910 71

181
PART 3: Master Dating Series:
------------------------------------------------------------------------------------------------------------------------------------
Year Value No Ab Year Value No Ab Year Value No Ab Year Value No Ab Year Value No Ab Year Value No Ab
------------------ ------------------ ------------------ ------------------ ------------------ ------------------
1750 .823 6 1800 .271 13 1850 -.699 21 1900 -1.373 32 1950 -.221 43
1751 -.201 6 1801 -.419 13 1851 1.142 21 1901 .685 32 1951 -2.302 42
1752 -2.673 6 1802 -.208 13 1852 -.145 20 1902 .689 33 1952 .222 42
1753 -.351 6 1803 .592 13 1853 -2.606 20 1 1903 .219 33 1953 .749 42
1754 .871 6 1804 .202 13 1854 .486 20 1904 -2.285 34 1954 .355 44
1755 .745 6 1805 -.102 13 1855 .029 21 1905 .463 33 1955 .352 44
1756 -.253 7 1806 -1.423 13 1856 .973 21 1906 .523 33 1956 .492 44
1707 -.682 1 1757 -.444 7 1807 1.285 13 1857 -.316 21 1907 .190 34 1957 .960 44
1708 .221 1 1758 -.489 7 1808 -.689 13 1858 .407 22 1908 .143 35 1958 .135 45
1709 .811 1 1759 -.767 7 1809 .089 13 1859 -1.705 22 1909 .350 35 1959 -2.601 45
1710 -2.678 1 1760 .188 7 1810 1.348 14 1860 -1.102 22 1910 .894 35 1960 -.990 45
1711 1.027 1 1761 .696 7 1811 -.135 15 1861 -.656 23 1911 .862 34 1961 -.064 45
1712 -2.115 1 1762 .871 7 1812 1.689 15 1862 .310 23 1912 -.577 34 1962 .376 45
1713 2.486 1 1763 .973 8 1813 -.624 15 1863 .723 23 1913 .875 35 1963 .600 45
1714 -.718 1 1764 1.090 8 1814 .324 16 1864 .979 23 1914 .112 35 1964 -.301 45
1715 .174 1 1765 -.404 8 1815 .183 17 1865 .956 23 1915 .297 35 1965 .757 45
1716 .849 1 1766 -2.405 8 1 1816 .687 17 1866 .874 23 1916 -2.144 36 1966 .772 45
1717 -.190 1 1767 .670 9 1817 -1.551 17 1867 .308 26 1917 -.691 36 1967 .544 45
1718 -.708 1 1768 .149 9 1818 -.158 17 1868 -1.569 26 1918 -.754 36 1968 .606 45
1719 -.555 1 1769 -.207 9 1819 .443 17 1869 .721 27 1919 -.428 37 1969 .817 46
1720 1.555 1 1770 -.397 9 1820 .645 17 1870 .202 27 1920 .420 37 1970 .419 46
1721 2.077 2 1771 .474 9 1821 -1.034 17 1871 -1.709 26 1921 .214 38 1971 .294 46
1722 1.028 2 1772 .422 9 1822 -1.554 18 1872 .348 26 1922 .762 39 1972 .464 46
1723 -.048 2 1773 -.620 9 1823 -.829 18 1873 .734 27 1923 .857 39 1973 .302 46
1724 -.261 2 1774 1.664 9 1824 .429 18 1874 .162 27 1924 .614 40 1974 -.869 46
1725 -3.208 2 1775 .324 9 1825 -.213 17 1875 -1.829 27 1925 -1.351 39 1975 -3.135 46
1726 -.850 2 1776 -2.329 9 1826 .940 17 1876 .277 27 1926 .685 39 1976 -.087 46
1727 1.091 2 1777 -.693 9 1827 1.101 17 1877 .527 27 1927 .375 39 1977 -.490 48
1728 .476 2 1778 -.290 9 1828 -.722 17 1878 .945 27 1928 .536 39 1978 -.591 48
1729 .059 2 1779 .321 10 1829 .853 17 1879 1.555 27 1929 -.115 40 1979 -.248 48
1730 -1.997 2 1780 .870 10 1830 1.047 16 1880 .541 28 1930 -2.283 40 1 1980 .242 47
1731 .955 2 1781 -1.156 10 1831 -.432 16 1881 .035 28 1931 .260 40 1981 .075 47
1732 -1.234 2 1782 .982 10 1832 -1.590 16 1882 -1.789 29 1 1932 -1.123 41 1982 .549 47
1733 .030 2 1783 .599 10 1833 .178 16 1883 .223 29 1933 .538 42 1983 .530 47
1734 -.001 2 1784 .727 10 1834 1.075 16 1884 .118 30 1934 .561 41 1984 .638 47
1735 .810 2 1785 .779 11 1835 .323 17 1885 -.284 31 1935 .909 43 1985 .632 47
1736 .016 2 1786 -2.475 11 1836 1.437 17 1886 .831 32 1936 .361 43 1986 .750 47
1737 .868 2 1787 -.007 11 1837 .601 17 1887 .012 32 1937 .435 43 1987 .513 47
1738 .801 2 1788 .708 11 1838 -1.571 18 1 1888 -1.636 32 1938 .721 43 1988 -.255 47
1739 .055 2 1789 -.327 12 1839 .284 19 1889 .395 32 1939 .433 43 1989 -.454 47
1740 -.593 2 1790 -1.655 12 1840 -.817 20 1890 1.128 32 1940 .682 43 1990 -.322 47
1741 1.124 2 1791 .857 12 1841 .160 20 1891 .548 32 1941 -.178 43 1991 -.133 47
1742 1.467 2 1792 1.085 12 1842 1.139 20 1892 -2.783 32 1942 -2.938 43 1 1992 -2.999 47 1
1743 -2.227 2 1793 1.158 12 1843 .733 20 1893 -.036 32 1943 -.009 43 1993 .241 47
1744 -2.264 2 1794 .890 12 1844 -1.225 20 1894 .658 32 1944 -.406 43 1994 .252 47
1745 .490 2 1795 -.645 12 1845 -2.061 20 1 1895 .572 32 1945 .315 42 1995 .098 47
1746 -1.197 2 1796 .574 12 1846 .233 21 1896 -.185 32 1946 .675 42 1996 .281 47
1747 1.250 5 1797 .501 12 1847 1.196 21 1897 .416 32 1947 -.242 42 1997 .842 47
1748 .817 5 1798 -.952 12 1848 1.058 21 1898 .424 32 1948 .732 43 1998 .313 46
1749 .610 5 1799 -2.172 13 1849 .392 21 1899 -.165 32 1949 -.303 43 1999 -.142 46

182
PART 3: Master Dating Series (CONT)
2000 .293 46
2001 .593 46
2002 -.028 46
2003 -.775 46
2004 -.060 46
2005 .468 46
2006 .632 46
2007 -.505 46
2008 .543 46
2009 -.961 24
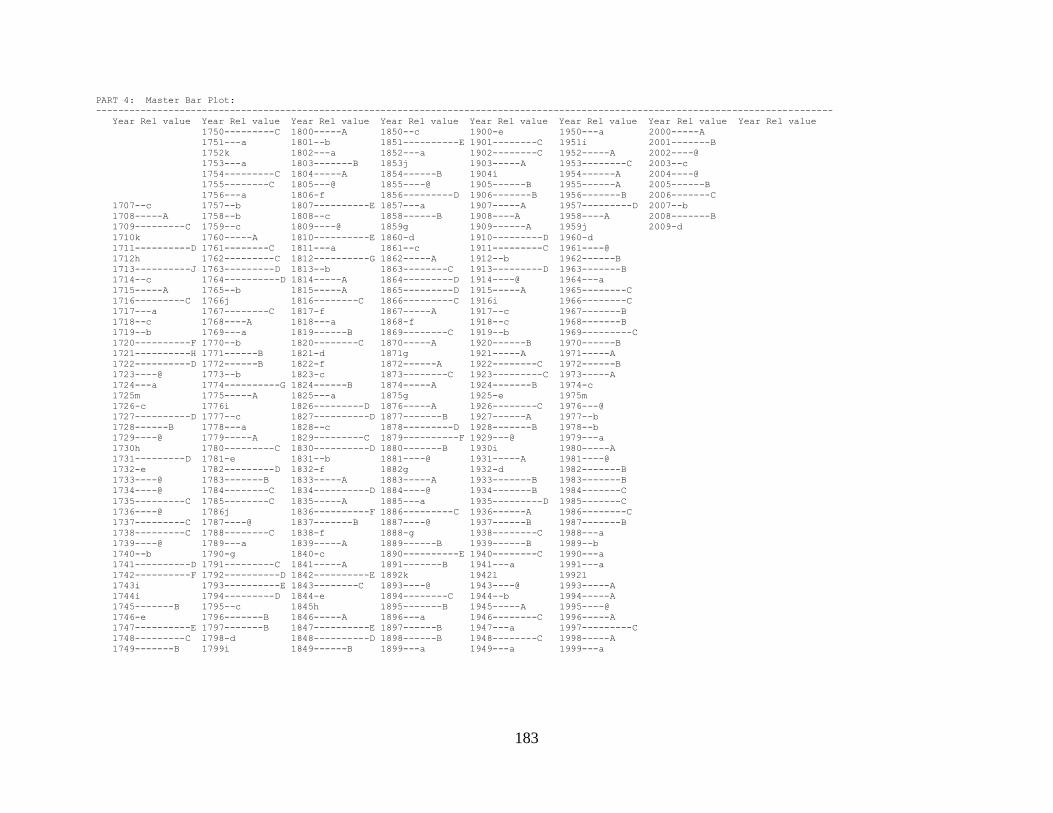
183
PART 4: Master Bar Plot:
------------------------------------------------------------------------------------------------------------------------------------
Year Rel value Year Rel value Year Rel value Year Rel value Year Rel value Year Rel value Year Rel value Year Rel value
1750---------C 1800-----A 1850--c 1900-e 1950---a 2000-----A
1751---a 1801--b 1851----------E 1901--------C 1951i 2001-------B
1752k 1802---a 1852---a 1902--------C 1952-----A 2002----@
1753---a 1803-------B 1853j 1903-----A 1953--------C 2003--c
1754---------C 1804-----A 1854------B 1904i 1954------A 2004----@
1755--------C 1805---@ 1855----@ 1905------B 1955------A 2005------B
1756---a 1806-f 1856---------D 1906-------B 1956-------B 2006-------C
1707--c 1757--b 1807----------E 1857---a 1907-----A 1957---------D 2007--b
1708-----A 1758--b 1808--c 1858------B 1908----A 1958----A 2008-------B
1709---------C 1759--c 1809----@ 1859g 1909------A 1959j 2009-d
1710k 1760-----A 1810----------E 1860-d 1910---------D 1960-d
1711----------D 1761--------C 1811---a 1861--c 1911---------C 1961----@
1712h 1762---------C 1812----------G 1862-----A 1912--b 1962------B
1713----------J 1763---------D 1813--b 1863--------C 1913---------D 1963-------B
1714--c 1764----------D 1814-----A 1864---------D 1914----@ 1964---a
1715-----A 1765--b 1815-----A 1865---------D 1915-----A 1965--------C
1716---------C 1766j 1816--------C 1866---------C 1916i 1966--------C
1717---a 1767--------C 1817-f 1867-----A 1917--c 1967-------B
1718--c 1768----A 1818---a 1868-f 1918--c 1968-------B
1719--b 1769---a 1819------B 1869--------C 1919--b 1969---------C
1720----------F 1770--b 1820--------C 1870-----A 1920------B 1970------B
1721----------H 1771------B 1821-d 1871g 1921-----A 1971-----A
1722----------D 1772------B 1822-f 1872------A 1922--------C 1972------B
1723----@ 1773--b 1823-c 1873--------C 1923---------C 1973-----A
1724---a 1774----------G 1824------B 1874-----A 1924-------B 1974-c
1725m 1775-----A 1825---a 1875g 1925-e 1975m
1726-c 1776i 1826---------D 1876-----A 1926--------C 1976---@
1727----------D 1777--c 1827----------D 1877-------B 1927------A 1977--b
1728------B 1778---a 1828--c 1878---------D 1928-------B 1978--b
1729----@ 1779-----A 1829---------C 1879----------F 1929---@ 1979---a
1730h 1780---------C 1830----------D 1880-------B 1930i 1980-----A
1731---------D 1781-e 1831--b 1881----@ 1931-----A 1981----@
1732-e 1782---------D 1832-f 1882g 1932-d 1982-------B
1733----@ 1783-------B 1833-----A 1883-----A 1933-------B 1983-------B
1734----@ 1784--------C 1834----------D 1884----@ 1934-------B 1984-------C
1735---------C 1785--------C 1835-----A 1885---a 1935---------D 1985-------C
1736----@ 1786j 1836----------F 1886---------C 1936------A 1986--------C
1737---------C 1787----@ 1837-------B 1887----@ 1937------B 1987-------B
1738---------C 1788--------C 1838-f 1888-g 1938--------C 1988---a
1739----@ 1789---a 1839-----A 1889------B 1939------B 1989--b
1740--b 1790-g 1840-c 1890----------E 1940--------C 1990---a
1741----------D 1791---------C 1841-----A 1891-------B 1941---a 1991---a
1742----------F 1792----------D 1842----------E 1892k 1942l 1992l
1743i 1793----------E 1843--------C 1893----@ 1943----@ 1993-----A
1744i 1794---------D 1844-e 1894--------C 1944--b 1994-----A
1745-------B 1795--c 1845h 1895-------B 1945-----A 1995----@
1746-e 1796-------B 1846-----A 1896---a 1946--------C 1996-----A
1747----------E 1797-------B 1847----------E 1897------B 1947---a 1997---------C
1748---------C 1798-d 1848----------D 1898------B 1948--------C 1998-----A
1749-------B 1799i 1849------B 1899---a 1949---a 1999---a

184
PART 5: CORRELATION OF SERIES BY SEGMENTS
------------------------------------------------------------------------------------------------------------------------------------
Correlations of 50-year dated segments, lagged 25 years
Flags: A = correlation under .3281 but highest as dated; B = correlation higher at other than dated position
Seq Series Time_span 1700 1725 1750 1775 1800 1825 1850 1875 1900 1925 1950 1975
1749 1774 1799 1824 1849 1874 1899 1924 1949 1974 1999 2024
--- -------- --------- ---- ---- ---- ---- ---- ---- ---- ---- ---- ---- ---- ---- ---- ---- ---- ---- ---- ---- ---- ----
1 BYR60 B 1886 2009 .71 .64 .41 .47 .53
2 BYR61 A 1933 2009 .63 .54 .50
3 BYR62 B 1924 2009 .78 .76 .62 .45
4 BYR601 B 1935 2008 .64 .68 .64
5 BYR602 B 1954 2009 .52 .41
6 BYR603 D 1933 2009 .48 .50 .45
7 BYR604 D 1943 2009 .66 .64 .58
8 BYR605 D 1935 2009 .50 .50 .50
9 BYR606 D 1946 2009 .52 .55 .56
10 BYR607 D 1969 2009 .67
11 BYR608 C 1916 2009 .75 .69 .65 .59
12 BYR609 C 1908 2009 .40 .52 .60 .54
13 BYR610 D 1907 2009 .61 .62 .66 .58
14 BYR612 D 1867 2009 .63 .65 .55 .67 .66 .54
15 BYR614 D 1904 2008 .59 .65 .57 .57
16 BYR615 C 1867 2009 .72 .66 .48 .43 .31A .19B
17 BYR616 E 1958 2009 .67 .58
18 BYR617 A 1954 2009 .65 .60
19 BYR620 B 1919 2009 .66 .65 .64 .61
20 BYR621 C 1948 2009 .55 .55 .54
21 BYR622 D 1921 2009 .76 .75 .64 .54
22 BYR623 B 1922 2009 .49 .49 .36 .24A
23 BYR625 C 1977 2009 .43
24 BYR626 A 1977 2009 .47
25 BYR627 B 1884 2008 .61 .54 .64 .57 .48
26 BYR001 A 1835 1944 .63 .59 .41 .50
27 BYR30x A 1869 2008 .63 .56 .45 .49 .61 .60
28 BYR31x A 1839 2009 .71 .72 .72 .63 .51 .50 .41
29 BYR31axA 1763 1942 .73 .69 .68 .59 .60 .66 .63
30 BYR35x A 1721 1851 .53 .54 .61 .63 .50 .56
31 BYR36x C 1785 2008 .57 .66 .62 .59 .64 .61 .58 .61 .50
32 BYR40x A 1810 2008 .72 .71 .65 .67 .68 .60 .42 .36
33 BYR42x A 1822 1979 .65 .68 .63 .63 .72 .74 .76
34 BYR43x B 1750 1910 .63 .70 .69 .68 .53 .51
35 BYR44x A 1747 1897 .35 .41 .42 .41 .54 .56
36 BYR45x A 1858 2008 .62 .51 .25B .41 .62 .56
37 BYR46x A 1779 1933 .68 .65 .69 .68 .55 .56
38 BYR48x A 1767 2008 .59 .52 .65 .72 .42 .37 .59 .56 .61 .59
39 BYR49x A 1846 2008 .81 .82 .71 .50 .45 .56 .60
40 BYR50x C 1789 2008 .45 .47 .41 .51 .47 .55 .58 .45 .32A
41 BYR112xA 1747 1924 .60 .63 .71 .62 .61 .67 .62
42 BYR501xA 1880 2008 .69 .78 .76 .63 .58
43 BYR502xB 1898 2008 .67 .65 .71 .61 .57
44 BYR503xA 1929 2008 .56 .43 .41
45 BYR504xA 1747 1824 .45 .46 .53
46 BYR505xA 1756 1870 .48 .57 .65 .69
47 BYR507xA 1913 1997 .63 .62 .68
48 BYR510xB 1902 2008 .54 .52 .48 .42
49 BYR511xC 1867 2008 .54 .64 .64 .49 .51 .51
50 BYR512xA 1873 2008 .63 .61 .61 .53 .65 .50
51 BYR513xA 1911 2008 .52 .43 .61 .54

185
PART 5: CORRELATION OF SERIES BY SEGMENTS (CONT)
52 BYR514xB 1932 2008 .62 .64 .58
53 BYR515xB 1885 2008 .70 .69 .67 .66 .70
54 BYR516xB 1815 2008 .68 .69 .59 .65 .74 .65 .52 .37
55 BYR518xA 1811 2008 .61 .63 .53 .53 .57 .44 .44 .36
56 BYR519xA 1814 2008 .67 .68 .80 .68 .61 .70 .61 .56
57 BYR520xA 1838 1950 .74 .78 .66 .57 .55
58 BYR521xB 1799 1904 .53 .60 .52 .36 .42
59 BYR600xA 1855 1932 .48 .38 .49
60 BYR700AA 1707 1829 .60 .62 .69 .64 .60
61 BYR701xB 1882 1945 .34 .39
62 BYR702xD 1861 2009 .40 .48 .46 .55 .63 .60
63 BYR703xB 1840 1910 .61 .65 .67
Av segment correlation .56 .51 .58 .59 .62 .64 .60 .59 .58 .58 .58 .51
PART 6: POTENTIAL PROBLEMS:
------------------------------------------------------------------------------------------------------------------------------------
For each series with potential problems the following diagnostics may appear:
[A] Correlations with master dating series of flagged 50-year segments of series filtered with 32-year spline,
at every point from ten years earlier (-10) to ten years later (+10) than dated
[B] Effect of those data values which most lower or raise correlation with master series
Symbol following year indicates value in series is greater (>) or lesser (<) than master series value
[C] Year-to-year changes very different from the mean change in other series
[D] Absent rings (zero values)
[E] Values which are statistical outliers from mean for the year
====================================================================================================================================
BYR60 B 1886 to 2009 124 years Series 1
[B] Entire series, effect on correlation ( .556) is:
Lower 1969< -.018 1952< -.016 1942> -.015 1955< -.012 1978> -.012 1896> -.011 Higher 1992 .063 1892 .014
====================================================================================================================================
BYR61 A 1933 to 2009 77 years Series 2
[B] Entire series, effect on correlation ( .572) is:
Lower 1954< -.036 1941< -.024 1985< -.014 1996< -.014 1975> -.013 1992> -.011 Higher 1942 .053 1959 .018
====================================================================================================================================
BYR62 B 1924 to 2009 86 years Series 3
[B] Entire series, effect on correlation ( .654) is:
Lower 1974> -.015 1984< -.012 2005< -.011 1986< -.010 1989> -.009 1999> -.009 Higher 1942 .049 1959 .029
====================================================================================================================================
BYR601 B 1935 to 2008 74 years Series 4
[B] Entire series, effect on correlation ( .620) is:
Lower 1936< -.028 1947> -.021 1988< -.019 2005< -.015 1986< -.014 1965< -.010 Higher 1992 .069 1959 .024

186
====================================================================================================================================
BYR602 B 1954 to 2009 56 years Series 5
[B] Entire series, effect on correlation ( .460) is:
Lower 1997< -.048 2005< -.022 1978> -.020 1963< -.016 1983< -.016 1958< -.015 Higher 1992 .159 1959 .049
====================================================================================================================================
BYR603 D 1933 to 2009 77 years Series 6
[B] Entire series, effect on correlation ( .453) is:
Lower 2009> -.026 1983< -.021 2001< -.018 1998< -.017 1959> -.017 1933< -.013 Higher 1992 .109 1975 .025
====================================================================================================================================
BYR604 D 1943 to 2009 67 years Series 7
[B] Entire series, effect on correlation ( .635) is:
Lower 1951> -.027 2007> -.024 1999< -.023 1977> -.011 1991< -.010 1987< -.009 Higher 1959 .082 1975 .024
====================================================================================================================================
BYR605 D 1935 to 2009 75 years Series 8
[B] Entire series, effect on correlation ( .550) is:
Lower 1994< -.019 1974> -.016 1973> -.016 1997< -.014 1985< -.014 1995< -.012 Higher 1992 .116 1942 .042
[E] Outliers 1 3.0 SD above or -4.5 SD below mean for year
1973 +3.3 SD
====================================================================================================================================
BYR606 D 1946 to 2009 64 years Series 9
[B] Entire series, effect on correlation ( .538) is:
Lower 1957< -.032 1983< -.028 1971< -.027 2001< -.025 1977> -.020 1988> -.016 Higher 1992 .064 1975 .040
====================================================================================================================================
BYR607 D 1969 to 2009 41 years Series 10
[B] Entire series, effect on correlation ( .673) is:
Lower 1992> -.063 2000< -.025 1971< -.019 1986< -.019 1999> -.012 1978> -.010 Higher 1975 .159 2009 .017
====================================================================================================================================
BYR608 C 1916 to 2009 94 years Series 11
[B] Entire series, effect on correlation ( .685) is:
Lower 1991< -.010 1938< -.009 1973< -.009 1941> -.009 1993< -.008 1939< -.008 Higher 1942 .034 1951 .025
====================================================================================================================================
BYR609 C 1908 to 2009 102 years Series 12
[B] Entire series, effect on correlation ( .488) is:
Lower 1924< -.061 1913< -.036 1939< -.015 1969< -.014 1934< -.010 1937< -.010 Higher 1959 .041 1916 .040
[E] Outliers 1 3.0 SD above or -4.5 SD below mean for year

187
====================================================================================================================================
BYR610 D 1907 to 2009 103 years Series 13
[B] Entire series, effect on correlation ( .609) is:
Lower 2002< -.018 2009> -.014 1912> -.012 1923< -.008 1952< -.008 1940< -.008 Higher 1916 .033 1992 .029
====================================================================================================================================
BYR612 D 1867 to 2009 143 years Series 14
[B] Entire series, effect on correlation ( .636) is:
Lower 1925> -.010 1986< -.010 1877< -.008 1940< -.007 1989> -.007 1873< -.007 Higher 1892 .031 1959 .024
====================================================================================================================================
BYR614 D 1904 to 2008 105 years Series 15
[B] Entire series, effect on correlation ( .574) is:
Lower 1940< -.017 1953< -.017 1971> -.012 1975> -.010 1994> -.009 1909< -.009 Higher 1959 .055 1951 .021
[E] Outliers 1 3.0 SD above or -4.5 SD below mean for year
1971 +3.0 SD
====================================================================================================================================
BYR615 C 1867 to 2009 143 years Series 16
[A] Segment High -10 -9 -8 -7 -6 -5 -4 -3 -2 -1 +0 +1 +2 +3 +4 +5 +6 +7 +8 +9 +10
--------- ---- --- --- --- --- --- --- --- --- --- --- --- --- --- --- --- --- --- --- --- --- ---
1950 1999 0 .22 .18 .18 -.17 -.09 -.04 .05 -.20 .02 -.08 .31*-.35 -.29 -.08 .17 .08 .01 .25 .11 .19 -.14
1960 2009 -10 .33*-.09 .13 -.08 -.02 -.04 .03 -.21 -.03 -.10 .19| - - - - - - - - - -
[B] Entire series, effect on correlation ( .466) is:
Lower 1985< -.034 1983< -.022 1935< -.016 1970< -.014 1978> -.012 1940< -.011 Higher 1942 .021 1904 .020
1950 to 1999 segment:
Lower 1985< -.081 1983< -.051 1970< -.032 1978> -.028 1958> -.021 1974> -.013 Higher 1951 .058 1959 .054
1960 to 2009 segment:
Lower 1985< -.072 1983< -.046 1978> -.031 1970< -.027 2007> -.018 1974> -.016 Higher 1992 .066 1975 .063
[E] Outliers 3 3.0 SD above or -4.5 SD below mean for year
1958 +3.3 SD; 1978 +3.0 SD; 1985 -5.3 SD
====================================================================================================================================
BYR616 E 1958 to 2009 52 years Series 17
[B] Entire series, effect on correlation ( .654) is:
Lower 1973< -.022 2001< -.021 1980< -.018 1997< -.017 2008< -.016 1989> -.008 Higher 1992 .119 1959 .079
====================================================================================================================================
BYR617 A 1954 to 2009 56 years Series 18
[B] Entire series, effect on correlation ( .645) is:
Lower 1998< -.022 1986< -.020 1993< -.014 1973< -.014 1975> -.013 1962< -.012 Higher 1992 .119 1959 .045
====================================================================================================================================
BYR620 B 1919 to 2009 91 years Series 19

188
[B] Entire series, effect on correlation ( .643) is:
Lower 1974> -.023 1920< -.018 1992> -.011 1993< -.009 1995> -.008 1941> -.008 Higher 1975 .044 1942 .024
====================================================================================================================================
BYR621 C 1948 to 2009 62 years Series 20
[B] Entire series, effect on correlation ( .564) is:
Lower 1965< -.026 1992> -.023 1961< -.020 1953< -.015 2000< -.015 1974> -.015 Higher 1975 .056 1951 .030
====================================================================================================================================
BYR622 D 1921 to 2009 89 years Series 21
[B] Entire series, effect on correlation ( .660) is:
Lower 1988< -.014 1982< -.014 1926< -.012 1936< -.011 1999> -.009 1928< -.009 Higher 1942 .051 1959 .026
====================================================================================================================================
BYR623 B 1922 to 2009 88 years Series 22
[A] Segment High -10 -9 -8 -7 -6 -5 -4 -3 -2 -1 +0 +1 +2 +3 +4 +5 +6 +7 +8 +9 +10
--------- ---- --- --- --- --- --- --- --- --- --- --- --- --- --- --- --- --- --- --- --- --- ---
1960 2009 0 -.14 .11 -.09 -.09 .00 .12 .07 -.09 -.29 -.20 .24* - - - - - - - - - -
[B] Entire series, effect on correlation ( .408) is:
Lower 1997< -.035 1978> -.019 1952< -.017 1963< -.014 1984< -.013 2008< -.012 Higher 1951 .052 1975 .026
1960 to 2009 segment:
Lower 1997< -.060 1978> -.034 1963< -.024 1984< -.023 2008< -.021 1960> -.019 Higher 1975 .080 1992 .057
[E] Outliers 2 3.0 SD above or -4.5 SD below mean for year
1978 +3.3 SD; 2004 +3.1 SD
====================================================================================================================================
BYR625 C 1977 to 2009 33 years Series 23
[B] Entire series, effect on correlation ( .433) is:
Lower 1977> -.067 1985< -.038 1988> -.030 1997< -.024 1987< -.023 2003> -.022 Higher 1992 .249 2007 .021
[E] Outliers 1 3.0 SD above or -4.5 SD below mean for year
1977 +3.1 SD
====================================================================================================================================
BYR626 A 1977 to 2009 33 years Series 24
[B] Entire series, effect on correlation ( .471) is:
Lower 2009> -.069 1980< -.057 1978> -.039 1987< -.032 2000< -.026 2003> -.019 Higher 1992 .498 2007 .016
====================================================================================================================================
BYR627 B 1884 to 2008 125 years Series 25
[B] Entire series, effect on correlation ( .573) is:
Lower 1984< -.011 1990> -.011 1905< -.009 1926< -.008 2002> -.008 1902< -.008 Higher 1892 .024 1992 .019
[E] Outliers 1 3.0 SD above or -4.5 SD below mean for year
1888 -5.3 SD
====================================================================================================================================

189
BYR001 A 1835 to 1944 110 years Series 26
[B] Entire series, effect on correlation ( .549) is:
Lower 1907< -.056 1889< -.026 1918> -.011 1861> -.011 1876< -.010 1843< -.007 Higher 1942 .028 1892 .017
[C] Year-to-year changes diverging by over 4.0 std deviations:
1906 1907 -4.1 SD
[E] Outliers 1 3.0 SD above or -4.5 SD below mean for year
1907 -6.4 SD
====================================================================================================================================
BYR30x A 1869 to 2008 140 years Series 27
[B] Entire series, effect on correlation ( .558) is:
Lower 1930> -.030 1957< -.014 1901< -.013 1919> -.009 1926< -.009 1981< -.008 Higher 1975 .038 1904 .021
[E] Outliers 1 3.0 SD above or -4.5 SD below mean for year
1930 +3.2 SD
====================================================================================================================================
BYR31x A 1839 to 2009 171 years Series 28
[B] Entire series, effect on correlation ( .645) is:
Lower 2005< -.009 2003> -.008 1994< -.008 1951> -.007 1972< -.007 1957< -.007 Higher 1992 .032 1975 .019
[D] 1 Absent rings: Year Master N series Absent
1992 -2.999 47 1
====================================================================================================================================
BYR31axA 1763 to 1942 180 years Series 29
[B] Entire series, effect on correlation ( .677) is:
Lower 1776> -.009 1816< -.007 1834< -.007 1859> -.006 1797< -.006 1867< -.004 Higher 1853 .015 1786 .011
[D] 2 Absent rings: Year Master N series Absent
1853 -2.606 20 1
1930 -2.283 40 1
====================================================================================================================================
BYR35x A 1721 to 1851 131 years Series 30
[B] Entire series, effect on correlation ( .561) is:
Lower 1736< -.017 1846< -.016 1845> -.016 1734> -.013 1801> -.013 1757> -.012 Higher 1752 .016 1725 .013
[D] 1 Absent rings: Year Master N series Absent
1766 -2.405 8 1
[E] Outliers 2 3.0 SD above or -4.5 SD below mean for year
1766 -5.9 SD; 1845 +3.0 SD
====================================================================================================================================
BYR36x C 1785 to 2008 224 years Series 31
[B] Entire series, effect on correlation ( .591) is:
Lower 1860> -.010 2008< -.010 1794< -.009 1855< -.007 1986< -.007 1824< -.006 Higher 1951 .014 1992 .013

190
====================================================================================================================================
BYR40x A 1810 to 2008 199 years Series 32
[B] Entire series, effect on correlation ( .599) is:
Lower 1992> -.037 1832> -.008 2006< -.007 1826< -.007 1896< -.007 1824< -.007 Higher 1959 .014 1904 .011
[E] Outliers 1 3.0 SD above or -4.5 SD below mean for year
1992 +4.2 SD
====================================================================================================================================
BYR42x A 1822 to 1979 158 years Series 33
[B] Entire series, effect on correlation ( .693) is:
Lower 1961< -.008 1859> -.008 1917> -.007 1910< -.006 1856< -.006 1857> -.005 Higher 1975 .019 1853 .013
[D] 1 Absent rings: Year Master N series Absent
1882 -1.789 29 1
====================================================================================================================================
BYR43x B 1750 to 1910 161 years Series 34
[B] Entire series, effect on correlation ( .622) is:
Lower 1768> -.020 1890< -.018 1758< -.010 1811> -.008 1870> -.008 1850> -.007 Higher 1853 .019 1859 .012
[E] Outliers 1 3.0 SD above or -4.5 SD below mean for year
1768 +3.6 SD
====================================================================================================================================
BYR44x A 1747 to 1897 151 years Series 35
[B] Entire series, effect on correlation ( .445) is:
Lower 1834< -.020 1888> -.015 1808< -.014 1788< -.014 1767< -.013 1803< -.012 Higher 1799 .013 1892 .012
[E] Outliers 1 3.0 SD above or -4.5 SD below mean for year
1808 -4.7 SD
====================================================================================================================================
BYR45x A 1858 to 2008 151 years Series 36
[A] Segment High -10 -9 -8 -7 -6 -5 -4 -3 -2 -1 +0 +1 +2 +3 +4 +5 +6 +7 +8 +9 +10
--------- ---- --- --- --- --- --- --- --- --- --- --- --- --- --- --- --- --- --- --- --- --- ---
1900 1949 -4 -.07 -.02 .02 -.14 -.24 .06 .31* .06 -.06 -.18 .25|-.10 .15 -.17 -.04 .03 -.03 .08 -.03 .15 -.31
[B] Entire series, effect on correlation ( .506) is:
Lower 1942> -.023 1932> -.016 1918> -.014 1946< -.011 1972< -.011 1923< -.009 Higher 1892 .038 1959 .015
1900 to 1949 segment:
Lower 1932> -.043 1942> -.042 1918> -.036 1946< -.032 1923< -.027 1940< -.024 Higher 1930 .072 1904 .041
[E] Outliers 1 3.0 SD above or -4.5 SD below mean for year
1942 +3.6 SD
====================================================================================================================================
BYR46x A 1779 to 1933 155 years Series 37
[B] Entire series, effect on correlation ( .636) is:
Lower 1918< -.022 1900> -.015 1844> -.011 1883< -.010 1838> -.007 1913< -.007 Higher 1916 .015 1853 .012

191
====================================================================================================================================
BYR48x A 1767 to 2008 242 years Series 38
[B] Entire series, effect on correlation ( .590) is:
Lower 1916> -.013 1882> -.011 1895< -.008 1864< -.008 1799> -.007 1959> -.006 Higher 1942 .023 1975 .015
[D] 1 Absent rings: Year Master N series Absent
1942 -2.938 43 1
====================================================================================================================================
BYR49x A 1846 to 2008 163 years Series 39
[B] Entire series, effect on correlation ( .607) is:
Lower 1946< -.020 1934< -.012 1993< -.011 1952< -.011 1951> -.010 2004< -.009 Higher 1892 .026 1975 .018
====================================================================================================================================
BYR50x C 1789 to 2008 220 years Series 40
[A] Segment High -10 -9 -8 -7 -6 -5 -4 -3 -2 -1 +0 +1 +2 +3 +4 +5 +6 +7 +8 +9 +10
--------- ---- --- --- --- --- --- --- --- --- --- --- --- --- --- --- --- --- --- --- --- --- ---
1959 2008 0 .01 .08 .03 .10 -.03 -.15 -.25 -.22 -.16 .02 .32* .04 - - - - - - - - -
[B] Entire series, effect on correlation ( .465) is:
Lower 1790> -.015 1859> -.015 1854< -.012 1836< -.010 1840> -.009 1957< -.008 Higher 1942 .025 1930 .015
1959 to 2008 segment:
Lower 1965< -.039 2001< -.036 2008< -.030 2000< -.022 1969< -.021 1966< -.019 Higher 1992 .077 1975 .073
[E] Outliers 1 3.0 SD above or -4.5 SD below mean for year
1790 +3.0 SD
====================================================================================================================================
BYR112xA 1747 to 1924 178 years Series 41
[B] Entire series, effect on correlation ( .632) is:
Lower 1757> -.012 1811> -.009 1870> -.007 1775> -.007 1764< -.006 1748< -.006 Higher 1786 .013 1752 .010
[D] 1 Absent rings: Year Master N series Absent
1845 -2.061 20 1
====================================================================================================================================
BYR501xA 1880 to 2008 129 years Series 42
[B] Entire series, effect on correlation ( .700) is:
Lower 1921< -.015 1992> -.012 1893< -.008 1991> -.007 1959> -.007 1885> -.005 Higher 1942 .029 1892 .023
====================================================================================================================================
BYR502xB 1898 to 2008 111 years Series 43
[B] Entire series, effect on correlation ( .591) is:
Lower 1949> -.017 1951> -.015 1901< -.011 2004< -.009 1902< -.009 2008< -.009 Higher 1959 .039 1942 .038
====================================================================================================================================
BYR503xA 1929 to 2008 80 years Series 44

192
[B] Entire series, effect on correlation ( .502) is:
Lower 1952< -.026 1941< -.019 1992> -.017 1979> -.015 1987< -.011 1959> -.010 Higher 1951 .036 1930 .027
====================================================================================================================================
BYR504xA 1747 to 1824 78 years Series 45
[B] Entire series, effect on correlation ( .412) is:
Lower 1750< -.054 1761< -.021 1769> -.020 1803< -.015 1770< -.012 1823> -.012 Higher 1776 .043 1786 .028
====================================================================================================================================
BYR505xA 1756 to 1870 115 years Series 46
[B] Entire series, effect on correlation ( .616) is:
Lower 1757< -.030 1848< -.012 1844> -.012 1794< -.011 1787> -.007 1854< -.006 Higher 1766 .014 1859 .014
[D] 1 Absent rings: Year Master N series Absent
1838 -1.571 18 1
====================================================================================================================================
BYR507xA 1913 to 1997 85 years Series 47
[B] Entire series, effect on correlation ( .626) is:
Lower 1935< -.019 1932> -.016 1940< -.014 1988< -.011 1956< -.010 1928< -.010 Higher 1959 .035 1930 .030
====================================================================================================================================
BYR510xB 1902 to 2008 107 years Series 48
[B] Entire series, effect on correlation ( .455) is:
Lower 1955< -.030 1910< -.027 2006< -.025 1998< -.022 1973< -.019 1927< -.011 Higher 1959 .036 1975 .028
====================================================================================================================================
BYR511xC 1867 to 2008 142 years Series 49
[B] Entire series, effect on correlation ( .521) is:
Lower 1949> -.013 1974> -.012 1931< -.011 1871> -.010 1962< -.009 1872< -.009 Higher 1975 .041 1942 .039
====================================================================================================================================
BYR512xA 1873 to 2008 136 years Series 50
[B] Entire series, effect on correlation ( .555) is:
Lower 2000< -.042 1888> -.015 1973< -.015 1879< -.013 1900> -.010 2003> -.010 Higher 1892 .044 1992 .027
[E] Outliers 1 3.0 SD above or -4.5 SD below mean for year
2000 -4.9 SD
====================================================================================================================================
BYR513xA 1911 to 2008 98 years Series 51
[B] Entire series, effect on correlation ( .497) is:
Lower 1925> -.051 1926< -.032 2003> -.019 1970< -.012 1972< -.012 1997< -.012 Higher 1992 .057 1959 .041
[E] Outliers 1 3.0 SD above or -4.5 SD below mean for year

193
1925 +4.0 SD
====================================================================================================================================
BYR514xB 1932 to 2008 77 years Series 52
[B] Entire series, effect on correlation ( .579) is:
Lower 1941< -.014 1947> -.013 2006< -.011 1937< -.011 1952< -.011 1994< -.010 Higher 1951 .047 1975 .046
====================================================================================================================================
BYR515xB 1885 to 2008 124 years Series 53
[B] Entire series, effect on correlation ( .659) is:
Lower 1906< -.019 1949> -.017 1894< -.011 1952< -.010 1976< -.008 1981> -.006 Higher 1975 .034 1959 .025
====================================================================================================================================
BYR516xB 1815 to 2008 194 years Series 54
[B] Entire series, effect on correlation ( .615) is:
Lower 2003> -.008 2005< -.008 1975> -.007 1949< -.006 1967< -.005 1884> -.005 Higher 1942 .024 1951 .013
====================================================================================================================================
BYR518xA 1811 to 2008 198 years Series 55
[B] Entire series, effect on correlation ( .533) is:
Lower 1859> -.033 1978< -.018 1974> -.012 1968< -.009 1960> -.008 1932> -.008 Higher 1992 .029 1951 .014
[E] Outliers 4 3.0 SD above or -4.5 SD below mean for year
1859 +4.2 SD; 1960 +3.2 SD; 1974 +3.0 SD; 1978 -5.6 SD
====================================================================================================================================
BYR519xA 1814 to 2008 195 years Series 56
[B] Entire series, effect on correlation ( .644) is:
Lower 1910< -.007 1937< -.007 1936< -.006 1912> -.006 1820< -.006 1834< -.006 Higher 1942 .023 1959 .013
====================================================================================================================================
BYR520xA 1838 to 1950 113 years Series 57
[B] Entire series, effect on correlation ( .686) is:
Lower 1946< -.023 1918> -.022 1948< -.010 1913< -.009 1838> -.007 1924< -.007 Higher 1942 .023 1892 .020
====================================================================================================================================
BYR521xB 1799 to 1904 106 years Series 58
[B] Entire series, effect on correlation ( .478) is:
Lower 1888> -.029 1799> -.028 1894< -.022 1801> -.015 1842< -.013 1813> -.012 Higher 1904 .021 1859 .021
[E] Outliers 2 3.0 SD above or -4.5 SD below mean for year
1799 +3.5 SD; 1888 +3.5 SD
====================================================================================================================================
BYR600xA 1855 to 1932 78 years Series 59
[B] Entire series, effect on correlation ( .489) is:
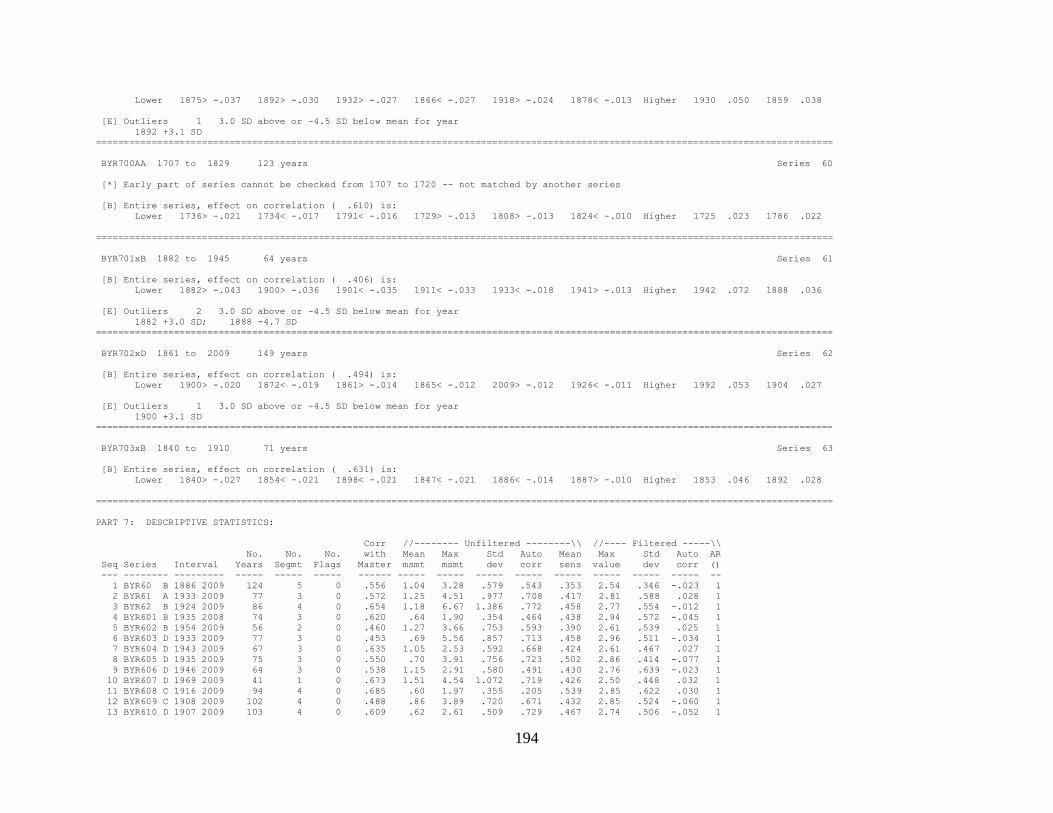
194
Lower 1875> -.037 1892> -.030 1932> -.027 1866< -.027 1918> -.024 1878< -.013 Higher 1930 .050 1859 .038
[E] Outliers 1 3.0 SD above or -4.5 SD below mean for year
1892 +3.1 SD
====================================================================================================================================
BYR700AA 1707 to 1829 123 years Series 60
[*] Early part of series cannot be checked from 1707 to 1720 -- not matched by another series
[B] Entire series, effect on correlation ( .610) is:
Lower 1736> -.021 1734< -.017 1791< -.016 1729> -.013 1808> -.013 1824< -.010 Higher 1725 .023 1786 .022
====================================================================================================================================
BYR701xB 1882 to 1945 64 years Series 61
[B] Entire series, effect on correlation ( .406) is:
Lower 1882> -.043 1900> -.036 1901< -.035 1911< -.033 1933< -.018 1941> -.013 Higher 1942 .072 1888 .036
[E] Outliers 2 3.0 SD above or -4.5 SD below mean for year
1882 +3.0 SD; 1888 -4.7 SD
====================================================================================================================================
BYR702xD 1861 to 2009 149 years Series 62
[B] Entire series, effect on correlation ( .494) is:
Lower 1900> -.020 1872< -.019 1861> -.014 1865< -.012 2009> -.012 1926< -.011 Higher 1992 .053 1904 .027
[E] Outliers 1 3.0 SD above or -4.5 SD below mean for year
1900 +3.1 SD
====================================================================================================================================
BYR703xB 1840 to 1910 71 years Series 63
[B] Entire series, effect on correlation ( .631) is:
Lower 1840> -.027 1854< -.021 1898< -.021 1847< -.021 1886< -.014 1887> -.010 Higher 1853 .046 1892 .028
====================================================================================================================================
PART 7: DESCRIPTIVE STATISTICS:
Corr //-------- Unfiltered --------\\ //---- Filtered -----\\
No. No. No. with Mean Max Std Auto Mean Max Std Auto AR
Seq Series Interval Years Segmt Flags Master msmt msmt dev corr sens value dev corr ()
--- -------- --------- ----- ----- ----- ------ ----- ----- ----- ----- ----- ----- ----- ----- --
1 BYR60 B 1886 2009 124 5 0 .556 1.04 3.28 .579 .543 .353 2.54 .346 -.023 1
2 BYR61 A 1933 2009 77 3 0 .572 1.25 4.51 .977 .708 .417 2.81 .588 .028 1
3 BYR62 B 1924 2009 86 4 0 .654 1.18 6.67 1.386 .772 .458 2.77 .554 -.012 1
4 BYR601 B 1935 2008 74 3 0 .620 .64 1.90 .354 .464 .438 2.94 .572 -.045 1
5 BYR602 B 1954 2009 56 2 0 .460 1.27 3.66 .753 .593 .390 2.61 .539 .025 1
6 BYR603 D 1933 2009 77 3 0 .453 .69 5.56 .857 .713 .458 2.96 .511 -.034 1
7 BYR604 D 1943 2009 67 3 0 .635 1.05 2.53 .592 .668 .424 2.61 .467 .027 1
8 BYR605 D 1935 2009 75 3 0 .550 .70 3.91 .756 .723 .502 2.86 .414 -.077 1
9 BYR606 D 1946 2009 64 3 0 .538 1.15 2.91 .580 .491 .430 2.76 .639 -.023 1
10 BYR607 D 1969 2009 41 1 0 .673 1.51 4.54 1.072 .719 .426 2.50 .448 .032 1
11 BYR608 C 1916 2009 94 4 0 .685 .60 1.97 .355 .205 .539 2.85 .622 .030 1
12 BYR609 C 1908 2009 102 4 0 .488 .86 3.89 .720 .671 .432 2.85 .524 -.060 1
13 BYR610 D 1907 2009 103 4 0 .609 .62 2.61 .509 .729 .467 2.74 .506 -.052 1

195
PART 7: DESCRIPTIVE STATISTICS: (CONT)
14 BYR612 D 1867 2009 143 6 0 .636 .78 2.73 .419 .431 .365 2.82 .452 -.070 2
15 BYR614 D 1904 2008 105 4 0 .574 .67 2.82 .459 .332 .493 2.82 .406 .026 1
16 BYR615 C 1867 2009 143 6 2 .466 .75 2.48 .494 .390 .493 3.10 .576 -.035 1
17 BYR616 E 1958 2009 52 2 0 .654 .56 1.24 .284 .526 .394 2.72 .511 .007 1
18 BYR617 A 1954 2009 56 2 0 .645 1.00 3.86 .613 .361 .436 2.74 .495 .044 1
19 BYR620 B 1919 2009 91 4 0 .643 .85 3.07 .551 .453 .485 2.73 .569 -.004 1
20 BYR621 C 1948 2009 62 3 0 .564 .64 1.69 .349 .422 .456 2.76 .562 -.033 1
21 BYR622 D 1921 2009 89 4 0 .660 .69 2.73 .440 .374 .498 2.87 .506 .005 1
22 BYR623 B 1922 2009 88 4 1 .408 .43 1.33 .228 .318 .461 2.94 .641 .066 1
23 BYR625 C 1977 2009 33 1 0 .433 .83 2.79 .479 .488 .387 3.02 .713 -.109 1
24 BYR626 A 1977 2009 33 1 0 .471 1.08 2.60 .506 .186 .454 2.48 .498 .017 1
25 BYR627 B 1884 2008 125 5 0 .573 1.00 3.61 .815 .563 .503 2.58 .405 .020 1
26 BYR001 A 1835 1944 110 4 0 .549 .70 2.45 .469 .436 .486 2.84 .472 -.048 3
27 BYR30x A 1869 2008 140 6 0 .558 .62 1.97 .324 .339 .468 2.83 .489 -.007 2
28 BYR31x A 1839 2009 171 7 0 .645 .75 2.59 .452 .422 .466 2.65 .414 .027 1
29 BYR31axA 1763 1942 180 7 0 .677 .77 3.25 .556 .440 .552 2.72 .367 -.052 2
30 BYR35x A 1721 1851 131 6 0 .561 .66 2.07 .388 .361 .548 2.43 .334 .008 1
31 BYR36x C 1785 2008 224 9 0 .591 .97 5.19 .725 .419 .475 2.92 .533 -.020 2
32 BYR40x A 1810 2008 199 8 0 .599 .76 3.11 .480 .298 .533 3.12 .657 -.008 1
33 BYR42x A 1822 1979 158 7 0 .693 .63 2.59 .403 .292 .501 3.03 .554 -.023 3
34 BYR43x B 1750 1910 161 6 0 .622 .69 2.07 .396 .311 .492 3.07 .576 .030 1
35 BYR44x A 1747 1897 151 6 0 .445 .74 2.79 .418 .384 .441 2.61 .397 -.004 3
36 BYR45x A 1858 2008 151 6 1 .506 .92 3.18 .522 .449 .447 2.84 .446 -.038 2
37 BYR46x A 1779 1933 155 6 0 .636 .77 4.72 .671 .249 .585 2.99 .447 -.041 2
38 BYR48x A 1767 2008 242 10 0 .590 .78 2.76 .418 .348 .474 2.59 .365 -.009 1
39 BYR49x A 1846 2008 163 7 0 .607 .77 2.67 .463 .500 .453 3.16 .546 .044 1
40 BYR50x C 1789 2008 220 9 1 .465 .99 3.82 .638 .579 .448 2.74 .462 -.003 1
41 BYR112xA 1747 1924 178 7 0 .632 .44 1.12 .231 .210 .510 2.84 .495 -.036 2
42 BYR501xA 1880 2008 129 5 0 .700 .86 2.88 .479 .537 .418 2.77 .506 -.006 1
43 BYR502xB 1898 2008 111 5 0 .591 .61 3.79 .453 .576 .403 2.85 .569 .048 1
44 BYR503xA 1929 2008 80 3 0 .502 1.16 4.21 .843 .606 .418 2.82 .589 .068 1
45 BYR504xA 1747 1824 78 3 0 .412 .72 2.75 .558 .679 .475 2.76 .532 -.054 1
46 BYR505xA 1756 1870 115 4 0 .616 .86 4.00 .786 .740 .510 2.72 .497 -.097 2
47 BYR507xA 1913 1997 85 3 0 .626 .33 .84 .177 .480 .401 2.84 .629 .003 1
48 BYR510xB 1902 2008 107 4 0 .455 .92 3.28 .622 .528 .430 3.12 .645 -.073 2
49 BYR511xC 1867 2008 142 6 0 .521 .62 3.13 .469 .550 .419 2.75 .481 -.056 2
50 BYR512xA 1873 2008 136 6 0 .555 1.26 3.28 .561 .443 .355 2.60 .409 -.020 1
51 BYR513xA 1911 2008 98 4 0 .497 .70 1.83 .370 .448 .386 2.83 .619 .022 1
52 BYR514xB 1932 2008 77 3 0 .579 .79 3.24 .619 .675 .473 2.69 .625 .097 1
53 BYR515xB 1885 2008 124 5 0 .659 1.08 2.82 .504 .381 .416 2.64 .469 -.022 2
54 BYR516xB 1815 2008 194 8 0 .615 1.11 6.05 .719 .474 .439 2.84 .471 -.003 2
55 BYR518xA 1811 2008 198 8 0 .533 .77 2.14 .384 .359 .466 2.73 .438 -.015 1
56 BYR519xA 1814 2008 195 8 0 .644 .78 2.38 .424 .330 .478 2.71 .456 -.044 2
57 BYR520xA 1838 1950 113 5 0 .686 1.07 2.76 .622 .484 .477 2.60 .465 .031 1
58 BYR521xB 1799 1904 106 5 0 .478 .90 2.40 .505 .372 .467 2.77 .642 -.002 1
59 BYR600xA 1855 1932 78 3 0 .489 1.31 3.71 .762 .419 .502 2.64 .540 -.074 1
60 BYR700AA 1707 1829 123 5 0 .610 .74 1.63 .332 .170 .504 2.65 .484 .002 1
61 BYR701xB 1882 1945 64 2 0 .406 .52 1.59 .333 .782 .326 2.71 .546 .040 1
62 BYR702xD 1861 2009 149 6 0 .494 .87 2.85 .476 .584 .384 2.56 .438 -.024 1
63 BYR703xB 1840 1910 71 3 0 .631 1.68 6.35 1.326 .724 .434 2.65 .468 -.007 1
--- -------- --------- ----- ----- ----- ------ ----- ----- ----- ----- ----- ----- ----- ----- --
Total or mean: 7367 299 5 .576 .83 6.67 .535 .455 .461 3.16 .497 -.012

196
Appendix 2. COFECHA program output for No Name Key site chronology, No Name Key, lower Florida Keys.
P R O G R A M C O F E C H A Version 6.06P 27843
------------------------------------------------------------------------------------------------------------------------------------
QUALITY CONTROL AND DATING CHECK OF TREE-RING MEASUREMENTS
File of DATED series: NNK.TXT
Time span of Master dating series is 1779 to 2009 231 years
Continuous time span is 1779 to 2009 231 years
Portion with two or more series is 1812 to 2009 198 years
****************************************
*C* Number of dated series 34 *C*
*O* Master series 1779 2009 231 yrs *O*
*F* Total rings in all series 2719 *F*
*E* Total dated rings checked 2686 *E*
*C* Series intercorrelation .539 *C*
*H* Average mean sensitivity .472 *H*
*A* Segments, possible problems 5 *A*
*** Mean length of series 80.0 ***
****************************************
ABSENT RINGS listed by SERIES: (See Master Dating Series for absent rings listed by year)
NNK02x A 3 absent rings: 1916 1930 1951
NNK26x A 3 absent rings: 1838 1871 1925
NNK42x A 1 absent rings: 1975
NNK74x B 1 absent rings: 1904
NNK82x 1 absent rings: 1951
NNK84x A 1 absent rings: 1951
10 absent rings .368%

197
PART 2: TIME PLOT OF TREE-RING SERIES:
------------------------------------------------------------------------------------------------------------------------------------
1050 1100 1150 1200 1250 1300 1350 1400 1450 1500 1550 1600 1650 1700 1750 1800 1850 1900 1950 2000 2050 Ident Seq Time-span Yrs
: : : : : : : : : : : : : : : : : : : : : -------- --- ---- ---- ----
. . . . . . . . . . . . . . . . . <==========> . NNK02x A 1 1895 2008 114
. . . . . . . . . . . . . . . . . . <======>. . NNK03x B 2 1924 1994 71
. . . . . . . . . . . . . . . . <==========> . . NNK05x B 3 1848 1951 104
. . . . . . . . . . . . . . . . <======> . . . NNK07x A 4 1850 1924 75
. . . . . . . . . . . . . . . . <========> . . . NNK08x A 5 1828 1918 91
. . . . . . . . . . . . . . . . . . <====> . NNK11x A 6 1953 2008 56
. . . . . . . . . . . . . . . . . .<========> . NNK12x B 7 1919 2008 90
. . . . . . . . . . . . . . . .<============>. . . NNK13x A 8 1812 1940 129
. . . . . . . . . . . . . . . . . <============> . NNK14x A 9 1870 2005 136
. . . . . . . . . . . . . . . . . . <=====>. . NNK16x B 10 1939 1995 57
. . . . . . . . . . . . . . . . . . <=====> . NNK17x A 11 1943 2008 66
. . . . . . . . . . . . . . . . . . <=====> . NNK18x B 12 1949 2008 60
. . . . . . . . . . . . . . . . . . <=====> . NNK19x A 13 1943 2008 66
. . . . . . . . . . . . . . . . . . <=====> . NNK20x A 14 1946 2008 63
. . . . . . . . . . . . . . . . . .<========> . NNK21x B 15 1913 2008 96
. . . . . . . . . . . . . . . <=============> . . . NNK22x A 16 1779 1910 132
. . . . . . . . . . . . . . . . <==========>. . . NNK26x A 17 1833 1943 111
. . . . . . . . . . . . . . . . .<=======>. . . NNK30x A 18 1864 1946 83
. . . . . . . . . . . . . . . . . . <====> . NNK34x A 19 1950 2006 57
. . . . . . . . . . . . . . . . . . <====> . NNK35x A 20 1957 2009 53
. . . . . . . . . . . . . . . . . .<=====> . . NNK36x A 21 1918 1977 60
. . . . . . . . . . . . . . . . . . <====>. . NNK38x B 22 1944 1997 54
. . . . . . . . . . . . . . . . <=====>. . . . NNK41x A 23 1831 1894 64
. . . . . . . . . . . . . . . . . . <======>. . NNK42x A 24 1929 1994 66
. . . . . . . . . . . . . . . . . .<========> . NNK50x A 25 1910 2009 100
. . . . . . . . . . . . . . . . . . <====> . NNK61x B 26 1953 2009 57
. . . . . . . . . . . . . . . . . .<=====> . . NNK71x A 27 1914 1978 65
. . . . . . . . . . . . . . . . . . <=====>. . NNK72x A 28 1938 1995 58
. . . . . . . . . . . . . . . . <======> . . . NNK74x B 29 1859 1921 63
. . . . . . . . . . . . . . . . <=========>. . . NNK76x A 30 1849 1941 93
. . . . . . . . . . . . . . . . . . <=======> . NNK80x A 31 1921 2009 89
. . . . . . . . . . . . . . . . . .<=====> . . NNK82x 32 1919 1970 52
. . . . . . . . . . . . . . . . . <============> . NNK84x A 33 1870 2006 137
. . . . . . . . . . . . . . . . . <====> . . NNK85x A 34 1903 1953 51
: : : : : : : : : : : : : : : : : : : : :
1050 1100 1150 1200 1250 1300 1350 1400 1450 1500 1550 1600 1650 1700 1750 1800 1850 1900 1950 2000 2050
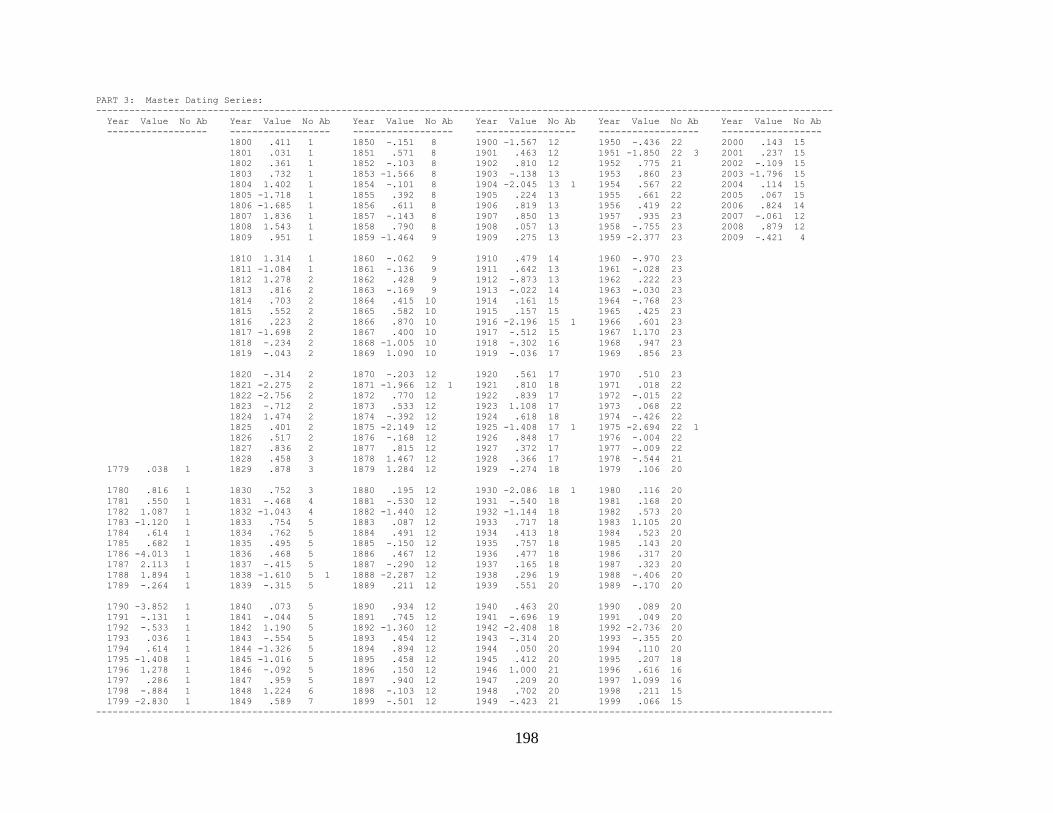
198
PART 3: Master Dating Series:
------------------------------------------------------------------------------------------------------------------------------------
Year Value No Ab Year Value No Ab Year Value No Ab Year Value No Ab Year Value No Ab Year Value No Ab
------------------ ------------------ ------------------ ------------------ ------------------ ------------------
1800 .411 1 1850 -.151 8 1900 -1.567 12 1950 -.436 22 2000 .143 15
1801 .031 1 1851 .571 8 1901 .463 12 1951 -1.850 22 3 2001 .237 15
1802 .361 1 1852 -.103 8 1902 .810 12 1952 .775 21 2002 -.109 15
1803 .732 1 1853 -1.566 8 1903 -.138 13 1953 .860 23 2003 -1.796 15
1804 1.402 1 1854 -.101 8 1904 -2.045 13 1 1954 .567 22 2004 .114 15
1805 -1.718 1 1855 .392 8 1905 .224 13 1955 .661 22 2005 .067 15
1806 -1.685 1 1856 .611 8 1906 .819 13 1956 .419 22 2006 .824 14
1807 1.836 1 1857 -.143 8 1907 .850 13 1957 .935 23 2007 -.061 12
1808 1.543 1 1858 .790 8 1908 .057 13 1958 -.755 23 2008 .879 12
1809 .951 1 1859 -1.464 9 1909 .275 13 1959 -2.377 23 2009 -.421 4
1810 1.314 1 1860 -.062 9 1910 .479 14 1960 -.970 23
1811 -1.084 1 1861 -.136 9 1911 .642 13 1961 -.028 23
1812 1.278 2 1862 .428 9 1912 -.873 13 1962 .222 23
1813 .816 2 1863 -.169 9 1913 -.022 14 1963 -.030 23
1814 .703 2 1864 .415 10 1914 .161 15 1964 -.768 23
1815 .552 2 1865 .582 10 1915 .157 15 1965 .425 23
1816 .223 2 1866 .870 10 1916 -2.196 15 1 1966 .601 23
1817 -1.698 2 1867 .400 10 1917 -.512 15 1967 1.170 23
1818 -.234 2 1868 -1.005 10 1918 -.302 16 1968 .947 23
1819 -.043 2 1869 1.090 10 1919 -.036 17 1969 .856 23
1820 -.314 2 1870 -.203 12 1920 .561 17 1970 .510 23
1821 -2.275 2 1871 -1.966 12 1 1921 .810 18 1971 .018 22
1822 -2.756 2 1872 .770 12 1922 .839 17 1972 -.015 22
1823 -.712 2 1873 .533 12 1923 1.108 17 1973 .068 22
1824 1.474 2 1874 -.392 12 1924 .618 18 1974 -.426 22
1825 .401 2 1875 -2.149 12 1925 -1.408 17 1 1975 -2.694 22 1
1826 .517 2 1876 -.168 12 1926 .848 17 1976 -.004 22
1827 .836 2 1877 .815 12 1927 .372 17 1977 -.009 22
1828 .458 3 1878 1.467 12 1928 .366 17 1978 -.544 21
1779 .038 1 1829 .878 3 1879 1.284 12 1929 -.274 18 1979 .106 20
1780 .816 1 1830 .752 3 1880 .195 12 1930 -2.086 18 1 1980 .116 20
1781 .550 1 1831 -.468 4 1881 -.530 12 1931 -.540 18 1981 .168 20
1782 1.087 1 1832 -1.043 4 1882 -1.440 12 1932 -1.144 18 1982 .573 20
1783 -1.120 1 1833 .754 5 1883 .087 12 1933 .717 18 1983 1.105 20
1784 .614 1 1834 .762 5 1884 .491 12 1934 .413 18 1984 .523 20
1785 .682 1 1835 .495 5 1885 -.150 12 1935 .757 18 1985 .143 20
1786 -4.013 1 1836 .468 5 1886 .467 12 1936 .477 18 1986 .317 20
1787 2.113 1 1837 -.415 5 1887 -.290 12 1937 .165 18 1987 .323 20
1788 1.894 1 1838 -1.610 5 1 1888 -2.287 12 1938 .296 19 1988 -.406 20
1789 -.264 1 1839 -.315 5 1889 .211 12 1939 .551 20 1989 -.170 20
1790 -3.852 1 1840 .073 5 1890 .934 12 1940 .463 20 1990 .089 20
1791 -.131 1 1841 -.044 5 1891 .745 12 1941 -.696 19 1991 .049 20
1792 -.533 1 1842 1.190 5 1892 -1.360 12 1942 -2.408 18 1992 -2.736 20
1793 .036 1 1843 -.554 5 1893 .454 12 1943 -.314 20 1993 -.355 20
1794 .614 1 1844 -1.326 5 1894 .894 12 1944 .050 20 1994 .110 20
1795 -1.408 1 1845 -1.016 5 1895 .458 12 1945 .412 20 1995 .207 18
1796 1.278 1 1846 -.092 5 1896 .150 12 1946 1.000 21 1996 .616 16
1797 .286 1 1847 .959 5 1897 .940 12 1947 .209 20 1997 1.099 16
1798 -.884 1 1848 1.224 6 1898 -.103 12 1948 .702 20 1998 .211 15
1799 -2.830 1 1849 .589 7 1899 -.501 12 1949 -.423 21 1999 .066 15
------------------------------------------------------------------------------------------------------------------------------------

199
PART 4: Master Bar Plot:
------------------------------------------------------------------------------------------------------------------------------------
Year Rel value Year Rel value Year Rel value Year Rel value Year Rel value Year Rel value Year Rel value Year Rel value
1800------B 1850---a 1900-f 1950--b 2000-----A
1801----@ 1851-------B 1901------B 1951g 2001-----A
1802------A 1852---@ 1902---------C 1952--------C 2002---@
1803--------C 1853-f 1903---a 1953---------C 2003g
1804----------F 1854---@ 1904h 1954-------B 2004-----@
1805g 1855------B 1905-----A 1955--------C 2005----@
1806g 1856-------B 1906---------C 1956------B 2006---------C
1807----------G 1857---a 1907---------C 1957---------D 2007---@
1808----------F 1858---------C 1908----@ 1958-c 2008---------D
1809---------D 1859-f 1909-----A 1959j 2009--b
1810----------E 1860---@ 1910-------B 1960-d
1811-d 1861---a 1911--------C 1961----@
1812----------E 1862------B 1912-c 1962-----A
1813---------C 1863---a 1913----@ 1963----@
1814--------C 1864------B 1914-----A 1964-c
1815-------B 1865-------B 1915-----A 1965------B
1816-----A 1866---------C 1916i 1966-------B
1817g 1867------B 1917--b 1967----------E
1818---a 1868-d 1918--a 1968---------D
1819----@ 1869----------D 1919----@ 1969---------C
1820--a 1870---a 1920-------B 1970-------B
1821i 1871h 1921---------C 1971----@
1822k 1872--------C 1922---------C 1972----@
1823--c 1873-------B 1923----------D 1973----@
1824----------F 1874--b 1924-------B 1974--b
1825------B 1875i 1925-f 1975k
1826-------B 1876---a 1926---------C 1976----@
1827---------C 1877---------C 1927------A 1977----@
1828------B 1878----------F 1928------A 1978--b
1779----@ 1829---------D 1879----------E 1929---a 1979-----@
1780---------C 1830--------C 1880-----A 1930h 1980-----@
1781-------B 1831--b 1881--b 1931--b 1981-----A
1782----------D 1832-d 1882-f 1932-e 1982-------B
1783-d 1833--------C 1883----@ 1933--------C 1983----------D
1784-------B 1834--------C 1884-------B 1934------B 1984-------B
1785--------C 1835-------B 1885---a 1935--------C 1985-----A
1786p 1836------B 1886------B 1936-------B 1986------A
1787----------H 1837--b 1887--a 1937-----A 1987------A
1788----------H 1838-f 1888i 1938------A 1988--b
1789---a 1839--a 1889-----A 1939-------B 1989---a
1790o 1840----@ 1890---------D 1940------B 1990----@
1791---a 1841----@ 1891--------C 1941--c 1991----@
1792--b 1842----------E 1892-e 1942j 1992k
1793----@ 1843--b 1893------B 1943--a 1993--a
1794-------B 1844-e 1894---------D 1944----@ 1994-----@
1795-f 1845-d 1895------B 1945------B 1995-----A
1796----------E 1846---@ 1896-----A 1946---------D 1996-------B
1797-----A 1847---------D 1897---------D 1947-----A 1997----------D
1798-d 1848----------E 1898---@ 1948--------C 1998-----A
1799k 1849-------B 1899--b 1949--b 1999----@

200
PART 5: CORRELATION OF SERIES BY SEGMENTS:
------------------------------------------------------------------------------------------------------------------------------------
Correlations of 50-year dated segments, lagged 25 years
Flags: A = correlation under .3281 but highest as dated; B = correlation higher at other than dated position
Seq Series Time_span 1800 1825 1850 1875 1900 1925 1950 1975
1849 1874 1899 1924 1949 1974 1999 2024
--- -------- --------- ---- ---- ---- ---- ---- ---- ---- ---- ---- ---- ---- ---- ---- ---- ---- ---- ---- ---- ---- ----
1 NNK02x A 1895 2008 .61 .58 .36 .28A .21A
2 NNK03x B 1924 1994 .58 .54 .46
3 NNK05x B 1848 1951 .48 .45 .47 .49 .45
4 NNK07x A 1850 1924 .45 .53
5 NNK08x A 1828 1918 .47 .56 .54
6 NNK11x A 1953 2008 .68 .74
7 NNK12x B 1919 2008 .61 .63 .65 .65
8 NNK13x A 1812 1940 .36 .40 .59 .68 .55
9 NNK14x A 1870 2005 .62 .65 .61 .55 .56 .52
10 NNK16x B 1939 1995 .45 .58
11 NNK17x A 1943 2008 .61 .57 .52
12 NNK18x B 1949 2008 .50 .50 .51
13 NNK19x A 1943 2008 .57 .59 .56
14 NNK20x A 1946 2008 .58 .56 .49
15 NNK21x B 1913 2008 .59 .56 .51 .50
16 NNK22x A 1779 1910 .22B .21A .50 .58
17 NNK26x A 1833 1943 .56 .65 .66 .62
18 NNK30x A 1864 1946 .57 .58 .51
19 NNK34x A 1950 2006 .47 .54
20 NNK35x A 1957 2009 .49 .47
21 NNK36x A 1918 1977 .64 .64 .61
22 NNK38x B 1944 1997 .57 .59
23 NNK41x A 1831 1894 .41 .45
24 NNK42x A 1929 1994 .69 .69
25 NNK50x A 1910 2009 .63 .53 .53 .57
26 NNK61x B 1953 2009 .36 .30B
27 NNK71x A 1914 1978 .61 .61 .63
28 NNK72x A 1938 1995 .58 .63
29 NNK74x B 1859 1921 .40 .59
30 NNK76x A 1849 1941 .56 .55 .59 .52
31 NNK80x A 1921 2009 .66 .67 .67 .60
32 NNK82x 1919 1970 .59 .56
33 NNK84x A 1870 2006 .61 .77 .65 .54 .52 .51
34 NNK85x A 1903 1953 .60 .61
Av segment correlation .29 .44 .53 .60 .59 .56 .55 .51

201
PART 6: POTENTIAL PROBLEMS:
------------------------------------------------------------------------------------------------------------------------------------
For each series with potential problems the following diagnostics may appear:
[A] Correlations with master dating series of flagged 50-year segments of series filtered with 32-year spline,
at every point from ten years earlier (-10) to ten years later (+10) than dated
[B] Effect of those data values which most lower or raise correlation with master series
Symbol following year indicates value in series is greater (>) or lesser (<) than master series value
[C] Year-to-year changes very different from the mean change in other series
[D] Absent rings (zero values)
[E] Values which are statistical outliers from mean for the year
====================================================================================================================================
NNK02x A 1895 to 2008 114 years Series 1
[A] Segment High -10 -9 -8 -7 -6 -5 -4 -3 -2 -1 +0 +1 +2 +3 +4 +5 +6 +7 +8 +9 +10
--------- ---- --- --- --- --- --- --- --- --- --- --- --- --- --- --- --- --- --- --- --- --- ---
1950 1999 0 -.11 .00 .04 .05 .00 -.10 .17 .25 .08 -.03 .28*-.31 -.13 -.14 -.05 .05 -.20 .15 .02 .00 .17
1959 2008 0 -.08 -.01 .13 .01 .12 -.18 .17 .18 .10 .02 .21*-.27 - - - - - - - - -
[B] Entire series, effect on correlation ( .476) is:
Lower 1967< -.026 2003> -.023 1982< -.014 1974> -.013 1971> -.011 1996< -.011 Higher 1951 .027 1916 .026
1950 to 1999 segment:
Lower 1967< -.049 1982< -.026 1974> -.026 1996< -.021 1971> -.021 1999> -.016 Higher 1951 .105 1992 .039
1959 to 2008 segment:
Lower 1967< -.065 2003> -.044 1982< -.036 1974> -.030 1996< -.028 1971> -.023 Higher 1992 .127 1959 .072
[D] 3 Absent rings: Year Master N series Absent
1916 -2.196 15 1
1930 -2.086 18 1
1951 -1.850 22 3
[E] Outliers 2 3.0 SD above or -4.5 SD below mean for year
1951 -6.0 SD; 1999 +3.3 SD
====================================================================================================================================
NNK03x B 1924 to 1994 71 years Series 2
[B] Entire series, effect on correlation ( .481) is:
Lower 1974< -.028 1975> -.021 1927< -.018 1942> -.014 1979< -.013 1952< -.012 Higher 1959 .027 1925 .025
====================================================================================================================================
NNK05x B 1848 to 1951 104 years Series 3
[B] Entire series, effect on correlation ( .467) is:
Lower 1893< -.016 1863> -.015 1886< -.015 1874> -.012 1858< -.010 1904> -.009 Higher 1892 .027 1925 .017
====================================================================================================================================
NNK07x A 1850 to 1924 75 years Series 4
[B] Entire series, effect on correlation ( .487) is:
Lower 1870< -.043 1875> -.026 1855< -.022 1909< -.012 1880< -.011 1877< -.010 Higher 1916 .043 1892 .022

202
[E] Outliers 1 3.0 SD above or -4.5 SD below mean for year
1875 +3.1 SD
====================================================================================================================================
NNK08x A 1828 to 1918 91 years Series 5
[B] Entire series, effect on correlation ( .478) is:
Lower 1879< -.022 1843> -.019 1835< -.017 1901< -.013 1855< -.012 1840> -.011 Higher 1888 .034 1871 .028
====================================================================================================================================
NNK11x A 1953 to 2008 56 years Series 6
[B] Entire series, effect on correlation ( .698) is:
Lower 1958> -.025 2002> -.023 1961< -.018 1977< -.016 1953< -.016 2006< -.008 Higher 1992 .061 1959 .035
====================================================================================================================================
NNK12x B 1919 to 2008 90 years Series 7
[B] Entire series, effect on correlation ( .610) is:
Lower 1941> -.026 1927> -.018 1934< -.015 1978> -.009 1982< -.009 1981> -.008 Higher 1942 .040 1992 .031
====================================================================================================================================
NNK13x A 1812 to 1940 129 years Series 8
[B] Entire series, effect on correlation ( .488) is:
Lower 1823< -.033 1861< -.021 1850< -.017 1841< -.013 1843> -.009 1940< -.009 Higher 1888 .025 1859 .018
[E] Outliers 1 3.0 SD above or -4.5 SD below mean for year
1823 -5.7 SD
====================================================================================================================================
NNK14x A 1870 to 2005 136 years Series 9
[B] Entire series, effect on correlation ( .567) is:
Lower 1977< -.019 1886< -.018 1871> -.018 1937< -.010 1923< -.007 1925> -.006 Higher 1992 .035 1916 .025
[E] Outliers 1 3.0 SD above or -4.5 SD below mean for year
1871 +3.1 SD
====================================================================================================================================
NNK16x B 1939 to 1995 57 years Series 10
[B] Entire series, effect on correlation ( .516) is:
Lower 1940< -.052 1941> -.024 1947< -.023 1957< -.019 1954< -.015 1986< -.014 Higher 1992 .075 1975 .040
====================================================================================================================================
NNK17x A 1943 to 2008 66 years Series 11
[B] Entire series, effect on correlation ( .568) is:
Lower 1996< -.019 1971> -.018 1972< -.017 1988> -.017 1997< -.016 1963< -.014 Higher 1992 .109 1951 .016
====================================================================================================================================
NNK18x B 1949 to 2008 60 years Series 12

203
[B] Entire series, effect on correlation ( .513) is:
Lower 1994< -.022 1952< -.022 1974> -.022 1967< -.022 1998> -.021 1984< -.016 Higher 1992 .172 1951 .030
====================================================================================================================================
NNK19x A 1943 to 2008 66 years Series 13
[B] Entire series, effect on correlation ( .552) is:
Lower 1992> -.032 1968< -.025 1948< -.021 2005< -.015 1999< -.013 1983< -.008 Higher 1975 .086 1959 .020
====================================================================================================================================
NNK20x A 1946 to 2008 63 years Series 14
[B] Entire series, effect on correlation ( .540) is:
Lower 1988> -.017 2006< -.016 1962< -.016 1954< -.015 1978> -.014 1967< -.014 Higher 1975 .090 1951 .039
====================================================================================================================================
NNK21x B 1913 to 2008 96 years Series 15
[B] Entire series, effect on correlation ( .523) is:
Lower 1995< -.017 1945< -.017 2008< -.015 1976< -.009 1958> -.009 1967< -.009 Higher 1992 .040 1942 .019
[E] Outliers 1 3.0 SD above or -4.5 SD below mean for year
2003 -5.2 SD
====================================================================================================================================
NNK22x A 1779 to 1910 132 years Series 16
[*] Early part of series cannot be checked from 1779 to 1811 -- not matched by another series
[A] Segment High -10 -9 -8 -7 -6 -5 -4 -3 -2 -1 +0 +1 +2 +3 +4 +5 +6 +7 +8 +9 +10
--------- ---- --- --- --- --- --- --- --- --- --- --- --- --- --- --- --- --- --- --- --- --- ---
1812 1861 1 -.10 -.06 -.11 -.14 -.05 .02 -.17 -.04 -.17 -.11 .22| .24* .06 .23 .14 .03 .07 -.08 -.35 -.04 .10
1825 1874 0 -.12 .07 -.14 .05 -.06 .03 -.26 .17 -.23 -.07 .21*-.07 -.16 .17 .08 .00 .05 .12 -.27 .05 .08
[B] Entire series, effect on correlation ( .364) is:
Lower 1834< -.045 1823> -.042 1845> -.037 1837> -.021 1840< -.018 1898> -.013 Higher 1821 .028 1904 .026
1812 to 1861 segment:
Lower 1823> -.067 1834< -.067 1845> -.058 1837> -.033 1840< -.024 1828< -.018 Higher 1821 .060 1822 .038
1825 to 1874 segment:
Lower 1834< -.077 1845> -.074 1837> -.043 1840< -.026 1864< -.021 1828< -.021 Higher 1871 .062 1838 .041
[E] Outliers 3 3.0 SD above or -4.5 SD below mean for year
1823 +5.7 SD; 1837 +3.1 SD; 1845 +4.5 SD
====================================================================================================================================
NNK26x A 1833 to 1943 111 years Series 17
[B] Entire series, effect on correlation ( .640) is:
Lower 1843> -.021 1841> -.010 1872< -.010 1896< -.008 1913< -.007 1848< -.006 Higher 1871 .016 1875 .014
[D] 3 Absent rings: Year Master N series Absent
1838 -1.610 5 1
Present in series 5 NNK08x A time span 1828 to 1918
Present in series 8 NNK13x A time span 1812 to 1940
Present in series 16 NNK22x A time span 1779 to 1910
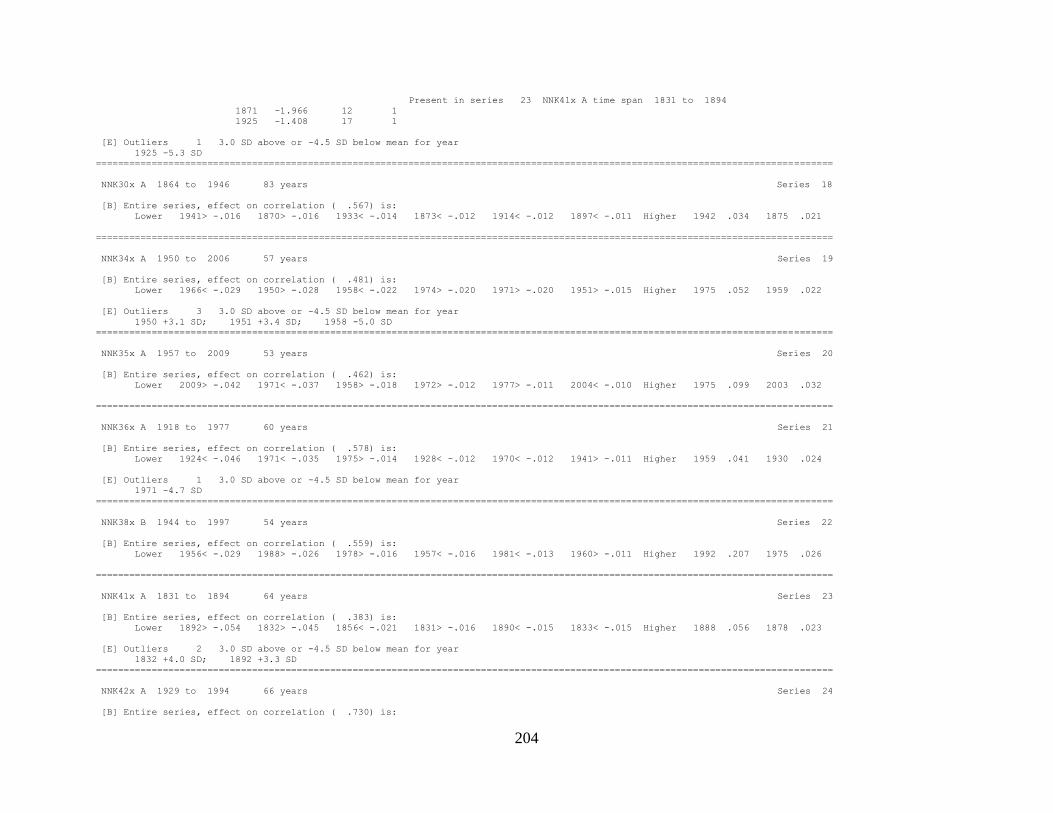
204
Present in series 23 NNK41x A time span 1831 to 1894
1871 -1.966 12 1
1925 -1.408 17 1
[E] Outliers 1 3.0 SD above or -4.5 SD below mean for year
1925 -5.3 SD
====================================================================================================================================
NNK30x A 1864 to 1946 83 years Series 18
[B] Entire series, effect on correlation ( .567) is:
Lower 1941> -.016 1870> -.016 1933< -.014 1873< -.012 1914< -.012 1897< -.011 Higher 1942 .034 1875 .021
====================================================================================================================================
NNK34x A 1950 to 2006 57 years Series 19
[B] Entire series, effect on correlation ( .481) is:
Lower 1966< -.029 1950> -.028 1958< -.022 1974> -.020 1971> -.020 1951> -.015 Higher 1975 .052 1959 .022
[E] Outliers 3 3.0 SD above or -4.5 SD below mean for year
1950 +3.1 SD; 1951 +3.4 SD; 1958 -5.0 SD
====================================================================================================================================
NNK35x A 1957 to 2009 53 years Series 20
[B] Entire series, effect on correlation ( .462) is:
Lower 2009> -.042 1971< -.037 1958> -.018 1972> -.012 1977> -.011 2004< -.010 Higher 1975 .099 2003 .032
====================================================================================================================================
NNK36x A 1918 to 1977 60 years Series 21
[B] Entire series, effect on correlation ( .578) is:
Lower 1924< -.046 1971< -.035 1975> -.014 1928< -.012 1970< -.012 1941> -.011 Higher 1959 .041 1930 .024
[E] Outliers 1 3.0 SD above or -4.5 SD below mean for year
1971 -4.7 SD
====================================================================================================================================
NNK38x B 1944 to 1997 54 years Series 22
[B] Entire series, effect on correlation ( .559) is:
Lower 1956< -.029 1988> -.026 1978> -.016 1957< -.016 1981< -.013 1960> -.011 Higher 1992 .207 1975 .026
====================================================================================================================================
NNK41x A 1831 to 1894 64 years Series 23
[B] Entire series, effect on correlation ( .383) is:
Lower 1892> -.054 1832> -.045 1856< -.021 1831> -.016 1890< -.015 1833< -.015 Higher 1888 .056 1878 .023
[E] Outliers 2 3.0 SD above or -4.5 SD below mean for year
1832 +4.0 SD; 1892 +3.3 SD
====================================================================================================================================
NNK42x A 1929 to 1994 66 years Series 24
[B] Entire series, effect on correlation ( .730) is:

205
Lower 1936< -.026 1986< -.019 1952< -.015 1929> -.014 1950< -.012 1931> -.010 Higher 1975 .041 1942 .028
[D] 1 Absent rings: Year Master N series Absent
1975 -2.694 22 1
====================================================================================================================================
NNK50x A 1910 to 2009 100 years Series 25
[B] Entire series, effect on correlation ( .582) is:
Lower 1968< -.030 1959> -.012 1911< -.010 1918> -.009 1965< -.009 1994< -.008 Higher 1992 .078 1925 .017
====================================================================================================================================
NNK61x B 1953 to 2009 57 years Series 26
[A] Segment High -10 -9 -8 -7 -6 -5 -4 -3 -2 -1 +0 +1 +2 +3 +4 +5 +6 +7 +8 +9 +10
--------- ---- --- --- --- --- --- --- --- --- --- --- --- --- --- --- --- --- --- --- --- --- ---
1960 2009 -6 -.03 -.15 -.13 -.11 .40*-.29 .07 -.02 -.10 .00 .30| - - - - - - - - - -
[B] Entire series, effect on correlation ( .342) is:
Lower 1992> -.042 1998< -.038 1970< -.025 2007> -.019 1957< -.018 2005> -.016 Higher 1958 .036 1997 .028
1960 to 2009 segment:
Lower 1992> -.042 1998< -.042 1970< -.030 2007> -.022 2005> -.019 2006< -.010 Higher 1997 .036 1975 .033
====================================================================================================================================
NNK71x A 1914 to 1978 65 years Series 27
[B] Entire series, effect on correlation ( .610) is:
Lower 1933< -.030 1973> -.021 1939< -.010 1962< -.010 1946< -.009 1922< -.008 Higher 1930 .019 1975 .019
[E] Outliers 1 3.0 SD above or -4.5 SD below mean for year
1973 +3.1 SD
====================================================================================================================================
NNK72x A 1938 to 1995 58 years Series 28
[B] Entire series, effect on correlation ( .659) is:
Lower 1948< -.036 1967< -.022 1964> -.015 1973< -.014 1987< -.011 1941> -.008 Higher 1992 .093 1942 .047
====================================================================================================================================
NNK74x B 1859 to 1921 63 years Series 29
[B] Entire series, effect on correlation ( .511) is:
Lower 1866< -.074 1888> -.061 1859> -.025 1861> -.018 1881> -.012 1910< -.010 Higher 1916 .059 1904 .044
[D] 1 Absent rings: Year Master N series Absent
1904 -2.045 13 1
[E] Outliers 1 3.0 SD above or -4.5 SD below mean for year
1888 +3.6 SD
====================================================================================================================================
NNK76x A 1849 to 1941 93 years Series 30
[B] Entire series, effect on correlation ( .555) is:
Lower 1898< -.028 1907< -.021 1891< -.017 1862< -.016 1902< -.016 1925> -.011 Higher 1888 .032 1871 .021

206
====================================================================================================================================
NNK80x A 1921 to 2009 89 years Series 31
[B] Entire series, effect on correlation ( .629) is:
Lower 1954< -.015 1949> -.012 2007< -.012 2003> -.011 1922< -.010 1927> -.009 Higher 1975 .023 1930 .020
====================================================================================================================================
NNK82x 1919 to 1970 52 years Series 32
[B] Entire series, effect on correlation ( .604) is:
Lower 1942> -.050 1969< -.026 1925> -.023 1933< -.023 1921< -.019 1947> -.015 Higher 1930 .059 1951 .049
[D] 1 Absent rings: Year Master N series Absent
1951 -1.850 22 3
====================================================================================================================================
NNK84x A 1870 to 2006 137 years Series 33
[B] Entire series, effect on correlation ( .571) is:
Lower 1871> -.029 1874< -.028 1932> -.012 1992> -.011 1981< -.009 1982< -.008 Higher 1916 .027 1930 .017
[D] 1 Absent rings: Year Master N series Absent
1951 -1.850 22 3
[E] Outliers 1 3.0 SD above or -4.5 SD below mean for year
1871 +3.7 SD
====================================================================================================================================
NNK85x A 1903 to 1953 51 years Series 34
[B] Entire series, effect on correlation ( .606) is:
Lower 1941< -.026 1944< -.022 1930> -.018 1937< -.016 1908< -.016 1931> -.012 Higher 1916 .048 1925 .015
====================================================================================================================================
PART 7: DESCRIPTIVE STATISTICS:
Corr //-------- Unfiltered --------\\ //---- Filtered -----\\
No. No. No. with Mean Max Std Auto Mean Max Std Auto AR
Seq Series Interval Years Segmt Flags Master msmt msmt dev corr sens value dev corr ()
--- -------- --------- ----- ----- ----- ------ ----- ----- ----- ----- ----- ----- ----- ----- --
1 NNK02x A 1895 2008 114 5 2 .476 .77 2.44 .483 .348 .517 2.56 .378 -.017 8
2 NNK03x B 1924 1994 71 3 0 .481 1.16 3.70 .783 .523 .467 2.69 .529 -.091 2
3 NNK05x B 1848 1951 104 5 0 .467 1.27 4.03 .842 .562 .502 2.70 .475 .002 1
4 NNK07x A 1850 1924 75 2 0 .487 1.43 4.92 .971 .472 .536 2.74 .483 -.046 2
5 NNK08x A 1828 1918 91 3 0 .478 1.06 4.11 .767 .513 .469 2.72 .443 -.064 1
6 NNK11x A 1953 2008 56 2 0 .698 .62 1.68 .318 .304 .495 2.96 .583 -.042 1
7 NNK12x B 1919 2008 90 4 0 .610 1.45 5.24 .910 .516 .410 2.81 .501 -.054 1
8 NNK13x A 1812 1940 129 5 0 .488 .79 2.10 .451 .603 .456 2.70 .566 -.005 1
9 NNK14x A 1870 2005 136 6 0 .567 1.24 5.66 .937 .699 .457 2.86 .519 -.011 3
10 NNK16x B 1939 1995 57 2 0 .516 2.38 6.63 1.571 .530 .472 2.91 .711 -.104 1
11 NNK17x A 1943 2008 66 3 0 .568 2.80 6.97 1.669 .651 .445 2.61 .544 -.066 2
12 NNK18x B 1949 2008 60 3 0 .513 1.69 6.18 1.363 .532 .451 2.77 .446 .054 1
13 NNK19x A 1943 2008 66 3 0 .552 2.20 7.91 1.925 .690 .453 2.74 .453 .000 1
14 NNK20x A 1946 2008 63 3 0 .540 1.30 3.71 .869 .606 .415 2.66 .444 -.036 2
15 NNK21x B 1913 2008 96 4 0 .523 1.48 4.03 .911 .637 .413 2.38 .371 -.069 2

207
PART 7: DESCRIPTIVE STATISTICS: (CONT)
16 NNK22x A 1779 1910 132 4 2 .364 1.17 3.52 .699 .395 .510 2.80 .549 -.068 2
17 NNK26x A 1833 1943 111 4 0 .640 .76 2.60 .496 .273 .581 2.58 .391 -.024 1
18 NNK30x A 1864 1946 83 3 0 .567 .80 2.06 .460 .388 .484 2.80 .504 -.059 1
19 NNK34x A 1950 2006 57 2 0 .481 .95 3.13 .580 .674 .433 2.59 .409 .006 1
20 NNK35x A 1957 2009 53 2 0 .462 1.34 3.93 .904 .464 .516 2.68 .587 -.055 2
21 NNK36x A 1918 1977 60 3 0 .578 1.87 7.95 1.423 .459 .411 3.24 .608 .106 1
22 NNK38x B 1944 1997 54 2 0 .559 1.32 3.52 .834 .683 .357 2.52 .403 .036 1
23 NNK41x A 1831 1894 64 2 0 .383 1.08 3.09 .711 .629 .446 2.84 .611 -.073 2
24 NNK42x A 1929 1994 66 2 0 .730 1.11 2.71 .633 .464 .523 2.64 .538 -.031 1
25 NNK50x A 1910 2009 100 4 0 .582 1.61 7.26 1.562 .731 .426 2.73 .397 -.007 2
26 NNK61x B 1953 2009 57 2 1 .342 1.32 6.25 1.361 .782 .447 2.86 .463 .049 1
27 NNK71x A 1914 1978 65 3 0 .610 1.53 5.72 1.142 .569 .478 2.73 .427 -.022 1
28 NNK72x A 1938 1995 58 2 0 .659 1.26 3.85 .748 .600 .395 2.58 .454 .022 1
29 NNK74x B 1859 1921 63 2 0 .511 1.59 3.83 .822 .446 .452 2.64 .534 -.084 3
30 NNK76x A 1849 1941 93 4 0 .555 .80 2.65 .705 .586 .557 3.00 .583 -.086 3
31 NNK80x A 1921 2009 89 4 0 .629 1.44 3.77 .891 .490 .503 2.76 .508 -.032 1
32 NNK82x 1919 1970 52 2 0 .604 .74 1.77 .366 .407 .478 2.61 .551 -.029 1
33 NNK84x A 1870 2006 137 6 0 .571 .95 3.61 .791 .720 .445 2.63 .457 -.009 1
34 NNK85x A 1903 1953 51 2 0 .606 1.35 3.83 .789 .363 .525 2.89 .552 .042 1
--- -------- --------- ----- ----- ----- ------ ----- ----- ----- ----- ----- ----- ----- ----- --
Total or mean: 2719 108 5 .539 1.26 7.95 .874 .541 .472 3.24 .494 -.028
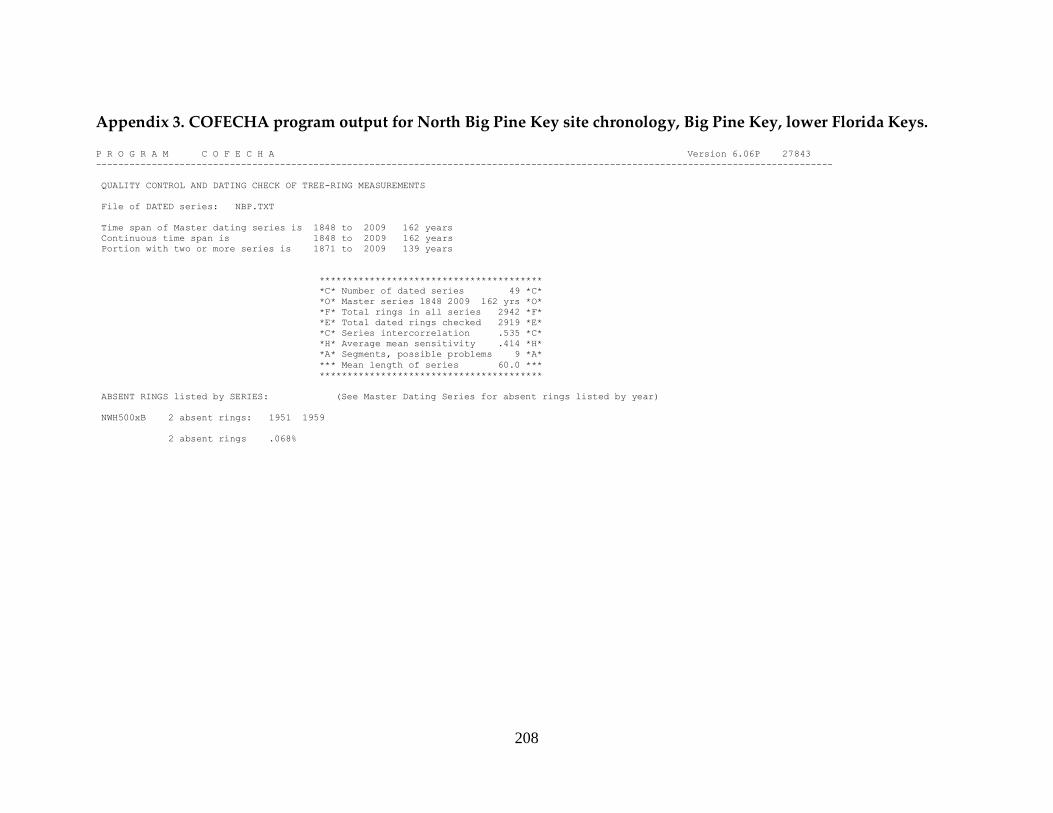
208
Appendix 3. COFECHA program output for North Big Pine Key site chronology, Big Pine Key, lower Florida Keys.
P R O G R A M C O F E C H A Version 6.06P 27843
------------------------------------------------------------------------------------------------------------------------------------
QUALITY CONTROL AND DATING CHECK OF TREE-RING MEASUREMENTS
File of DATED series: NBP.TXT
Time span of Master dating series is 1848 to 2009 162 years
Continuous time span is 1848 to 2009 162 years
Portion with two or more series is 1871 to 2009 139 years
****************************************
*C* Number of dated series 49 *C*
*O* Master series 1848 2009 162 yrs *O*
*F* Total rings in all series 2942 *F*
*E* Total dated rings checked 2919 *E*
*C* Series intercorrelation .535 *C*
*H* Average mean sensitivity .414 *H*
*A* Segments, possible problems 9 *A*
*** Mean length of series 60.0 ***
****************************************
ABSENT RINGS listed by SERIES: (See Master Dating Series for absent rings listed by year)
NWH500xB 2 absent rings: 1951 1959
2 absent rings .068%

209
PART 2: TIME PLOT OF TREE-RING SERIES:
------------------------------------------------------------------------------------------------------------------------------------
1050 1100 1150 1200 1250 1300 1350 1400 1450 1500 1550 1600 1650 1700 1750 1800 1850 1900 1950 2000 2050 Ident Seq Time-span Yrs
: : : : : : : : : : : : : : : : : : : : : -------- --- ---- ---- ----
. . . . . . . . . . . . . . . . . . <====> . NWH624 A 1 1952 2008 57
. . . . . . . . . . . . . . . . . . . <==> . NWH622 A 2 1977 2009 33
. . . . . . . . . . . . . . . . . . <====> . NWH616 A 3 1955 2009 55
. . . . . . . . . . . . . . . . . . . <=> . NWH617 B 4 1986 2009 24
. . . . . . . . . . . . . . . . . . . <=> . NWH618 A 5 1988 2009 22
. . . . . . . . . . . . . . . . . . . <> . NWH618 B 6 1990 2009 20
. . . . . . . . . . . . . . . . . . . <=> . NWH605 A 7 1985 2009 25
. . . . . . . . . . . . . . . . . . . <=> . NWH605 B 8 1985 2009 25
. . . . . . . . . . . . . . . . . . . <> . NWH610 B 9 1992 2007 16
. . . . . . . . . . . . . . . . . . . <=> . NWH626 A 10 1986 2009 24
. . . . . . . . . . . . . . . . . . . <=> . NWH626 B 11 1987 2009 23
. . . . . . . . . . . . . . . . . . . <> . NWH620 C 12 1991 2009 19
. . . . . . . . . . . . . . . . . . . <=> . NWH620 D 13 1983 2009 27
. . . . . . . . . . . . . . . . . . <====> . NWH624 A 14 1952 2008 57
. . . . . . . . . . . . . . . . . . . <=> . NWH614 C 15 1983 2009 27
. . . . . . . . . . . . . . . . . . . <==> . NWH612 C 16 1979 2008 30
. . . . . . . . . . . . . . . . . . . <==> . NWH612 B 17 1979 2008 30
. . . . . . . . . . . . . . . . . . <=====> . NWH604 B 18 1944 2008 65
. . . . . . . . . . . . . . . . . . .<===> . NWH602 A 19 1960 2009 50
. . . . . . . . . . . . . . . . . <=======> . . NWH530xB 20 1885 1963 79
. . . . . . . . . . . . . . . . . <==========>. . NWH500xB 21 1888 1997 110
. . . . . . . . . . . . . . . . . <===========> . NWH501xA 22 1888 2006 119
. . . . . . . . . . . . . . . . . <=========> . NWH503xB 23 1908 2007 100
. . . . . . . . . . . . . . . . . <=========> . NWH503xA 24 1908 2007 100
. . . . . . . . . . . . . . . . . <=========> . NWH506xA 25 1900 2009 110
. . . . . . . . . . . . . . . . . <=========> . NWH506xB 26 1900 2009 110
. . . . . . . . . . . . . . . . . <=====> . . . NWH509xB 27 1871 1932 62
. . . . . . . . . . . . . . . . . <=====> . . . NWH509xC 28 1871 1932 62
. . . . . . . . . . . . . . . . . <====> . . . NWH510xB 29 1889 1932 44
. . . . . . . . . . . . . . . . . <====> . . . NWH510xC 30 1889 1932 44
. . . . . . . . . . . . . . . . . . <==> . . NWH512xA 31 1924 1953 30
. . . . . . . . . . . . . . . . . . <==> . . NWH512xB 32 1924 1953 30
. . . . . . . . . . . . . . . . . <========> . . NWH513xA 33 1886 1977 92
. . . . . . . . . . . . . . . . . .<=======>. . NWH520xB 34 1910 1991 82
. . . . . . . . . . . . . . . . . . <=====> . NWH531xA 35 1948 2007 60
. . . . . . . . . . . . . . . . . . <=====> . NWH531xB 36 1948 2007 60
. . . . . . . . . . . . . . . . . <======> . . NWH533xA 37 1887 1955 69
. . . . . . . . . . . . . . . . . <======> . . NWH533xC 38 1887 1955 69
. . . . . . . . . . . . . . . . . <=========> . NWH534xD 39 1903 2003 101
. . . . . . . . . . . . . . . . . <=========> . NWH534xC 40 1903 2003 101
. . . . . . . . . . . . . . . . . <=======> . . NWH535xA 41 1908 1980 73
. . . . . . . . . . . . . . . . . <=======> . . NWH535xB 42 1908 1980 73
. . . . . . . . . . . . . . . . . <=====> . . NWH538xA 43 1902 1965 64
. . . . . . . . . . . . . . . . . <=====> . . NWH538xC 44 1902 1965 64
. . . . . . . . . . . . . . . . <==============>. . NWH539xA 45 1848 1993 146
. . . . . . . . . . . . . . . . . . <===> . . NWH540xA 46 1929 1965 37
. . . . . . . . . . . . . . . . . . <===> . . NWH540xB 47 1929 1965 37
. . . . . . . . . . . . . . . . . . <====> . . NWH540xC 48 1929 1977 49
. . . . . . . . . . . . . . . . . <============> . NWH600xA 49 1873 2008 136
: : : : : : : : : : : : : : : : : : : : :
1050 1100 1150 1200 1250 1300 1350 1400 1450 1500 1550 1600 1650 1700 1750 1800 1850 1900 1950 2000 2050

210
PART 3: Master Dating Series:
------------------------------------------------------------------------------------------------------------------------------------
Year Value No Ab Year Value No Ab Year Value No Ab Year Value No Ab Year Value No Ab Year Value No Ab
------------------ ------------------ ------------------ ------------------ ------------------ ------------------
1850 -.652 1 1900 -1.240 14 1950 .018 27 2000 .564 29
1851 -1.314 1 1901 .789 14 1951 -1.462 27 1 2001 1.210 29
1852 -1.407 1 1902 .461 16 1952 .255 29 2002 .042 29
1853 -.660 1 1903 .227 18 1953 .768 29 2003 -1.113 29
1854 1.306 1 1904 -1.039 18 1954 -.080 27 2004 -.489 27
1855 1.845 1 1905 -.093 18 1955 .219 28 2005 -.289 27
1856 1.015 1 1906 .403 18 1956 .692 26 2006 .646 27
1857 .666 1 1907 .624 18 1957 .950 26 2007 .563 26
1858 -.732 1 1908 .269 22 1958 .082 26 2008 1.241 21
1859 -2.869 1 1909 .459 22 1959 -1.437 26 1 2009 -2.800 15
1860 -1.594 1 1910 .166 23 1960 -.868 27
1861 .356 1 1911 1.011 23 1961 .192 27
1862 1.983 1 1912 -1.021 23 1962 .743 27
1863 .717 1 1913 -.213 23 1963 .577 27
1864 .030 1 1914 -.144 23 1964 -.188 26
1865 2.153 1 1915 .456 23 1965 -.126 26
1866 -.181 1 1916 -1.920 23 1966 .080 22
1867 -1.129 1 1917 -1.051 23 1967 .414 22
1868 -2.478 1 1918 -.331 23 1968 .111 22
1869 -.471 1 1919 .371 23 1969 .434 22
1870 -.319 1 1920 .079 23 1970 .579 22
1871 -1.081 3 1921 .677 23 1971 .355 22
1872 .088 3 1922 .266 23 1972 .350 22
1873 .594 4 1923 .374 23 1973 .383 22
1874 .331 4 1924 .942 25 1974 -1.201 22
1875 -1.419 4 1925 -.555 25 1975 -1.684 22
1876 1.583 4 1926 .982 25 1976 -.148 22
1877 1.747 4 1927 .014 25 1977 -.139 23
1878 1.696 4 1928 .402 25 1978 -1.046 21
1879 1.476 4 1929 .103 28 1979 -.501 23
1880 .096 4 1930 -1.997 28 1980 .014 23
1881 -.157 4 1931 -.273 28 1981 .713 21
1882 -3.582 4 1932 -1.464 28 1982 1.046 21
1883 -.408 4 1933 .375 24 1983 1.165 23
1884 -.648 4 1934 .827 24 1984 1.148 23
1885 -.344 5 1935 1.244 24 1985 .891 25
1886 .534 6 1936 .859 24 1986 .608 27
1887 -.168 8 1937 .242 24 1987 .161 28
1888 -1.842 10 1938 .507 24 1988 -.678 29
1889 .740 12 1939 .246 24 1989 -.420 29
1890 .724 12 1940 .776 24 1990 -.471 30
1891 1.038 12 1941 .728 24 1991 -.206 31
1892 -2.842 12 1942 -1.930 24 1992 -2.903 31
1893 .294 12 1943 .106 24 1993 -.047 31
1894 .951 12 1944 -.067 25 1994 .009 30
1895 .998 12 1945 -.183 25 1995 .162 30
1896 -.607 12 1946 .135 25 1996 .496 30
1897 .382 12 1947 -.547 25 1997 .686 30
1848 1.392 1 1898 .426 12 1948 .056 27 1998 .479 29
1849 1.143 1 1899 -.836 12 1949 -.637 27 1999 .215 29
------------------------------------------------------------------------------------------------------------------------------------

211
PART 4: Master Bar Plot:
------------------------------------------------------------------------------------------------------------------------------------
Year Rel value Year Rel value Year Rel value Year Rel value Year Rel value Year Rel value Year Rel value Year Rel value
1850--c 1900-e 1950----@ 2000-------B
1851-e 1901--------C 1951-f 2001---------E
1852-f 1902-------B 1952-----A 2002----@
1853--c 1903-----A 1953--------C 2003-d
1854----------E 1904-d 1954----@ 2004--b
1855----------G 1905---@ 1955-----A 2005---a
1856---------D 1906------B 1956--------C 2006--------C
1857--------C 1907--------B 1957---------D 2007-------B
1858--c 1908------A 1958----@ 2008----------E
1859k 1909-------B 1959-f 2009k
1860f 1910-----A 1960-c
1861------A 1911---------D 1961-----A
1862----------H 1912-d 1962--------C
1863--------C 1913---a 1963-------B
1864----@ 1914---a 1964---a
1865----------I 1915-------B 1965---a
1866---a 1916h 1966----@
1867-e 1917-d 1967------B
1868j 1918---a 1968-----@
1869--b 1919------A 1969-------B
1870---a 1920----@ 1970-------B
1871-d 1921--------C 1971------A
1872----@ 1922------A 1972------A
1873--------B 1923------A 1973------B
1874------A 1924---------D 1974-e
1875-f 1925--b 1975g
1876----------F 1926---------D 1976---a
1877----------G 1927----@ 1977---a
1878----------G 1928------B 1978-d
1879----------F 1929-----@ 1979--b
1880-----@ 1930h 1980----@
1881---a 1931---a 1981--------C
1882n 1932-f 1982---------D
1883--b 1933------A 1983---------E
1884--c 1934---------C 1984---------E
1885---a 1935----------E 1985---------D
1886-------B 1936---------C 1986--------B
1887---a 1937-----A 1987-----A
1888g 1938-------B 1988--c
1889--------C 1939-----A 1989--b
1890--------C 1940--------C 1990--b
1891---------D 1941--------C 1991---a
1892k 1942h 1992l
1893------A 1943-----@ 1993----@
1894---------D 1944----@ 1994----@
1895---------D 1945---a 1995-----A
1896--b 1946-----A 1996-------B
1897------B 1947--b 1997--------C
1848----------F 1898-------B 1948----@ 1998-------B
1849---------E 1899-c 1949--c 1999-----A

212
PART 5: CORRELATION OF SERIES BY SEGMENTS:
------------------------------------------------------------------------------------------------------------------------------------
Correlations of 50-year dated segments, lagged 25 years
Flags: A = correlation under .3281 but highest as dated; B = correlation higher at other than dated position
Seq Series Time_span 1850 1875 1900 1925 1950 1975
1899 1924 1949 1974 1999 2024
--- -------- --------- ---- ---- ---- ---- ---- ---- ---- ---- ---- ---- ---- ---- ---- ---- ---- ---- ---- ---- ---- ----
1 NWH624 A 1952 2008 .68 .69
2 NWH622 A 1977 2009 .67
3 NWH616 A 1955 2009 .50 .53
4 NWH617 B 1986 2009 .77
5 NWH618 A 1988 2009 .59
6 NWH618 B 1990 2009 .82
7 NWH605 A 1985 2009 .28A
8 NWH605 B 1985 2009 .68
9 NWH610 B 1992 2007 .81
10 NWH626 A 1986 2009 .62
11 NWH626 B 1987 2009 .53
12 NWH620 C 1991 2009 .85
13 NWH620 D 1983 2009 .71
14 NWH624 A 1952 2008 .68 .69
15 NWH614 C 1983 2009 .30A
16 NWH612 C 1979 2008 .71
17 NWH612 B 1979 2008 .74
18 NWH604 B 1944 2008 .39 .41 .47
19 NWH602 A 1960 2009 .39
20 NWH530xB 1885 1963 .20B .34 .48
21 NWH500xB 1888 1997 .42 .46 .22B .39
22 NWH501xA 1888 2006 .69 .70 .46 .45 .44
23 NWH503xB 1908 2007 .53 .58 .63 .58
24 NWH503xA 1908 2007 .42 .60 .61 .54
25 NWH506xA 1900 2009 .66 .66 .49 .65
26 NWH506xB 1900 2009 .45 .46 .49 .62
27 NWH509xB 1871 1932 .71 .71 .57
28 NWH509xC 1871 1932 .74 .75 .58
29 NWH510xB 1889 1932 .73
30 NWH510xC 1889 1932 .55
31 NWH512xA 1924 1953 .57
32 NWH512xB 1924 1953 .53
33 NWH513xA 1886 1977 .59 .53 .33 .30A
34 NWH520xB 1910 1991 .41 .38 .38
35 NWH531xA 1948 2007 .45 .37 .46
36 NWH531xB 1948 2007 .38 .30A .42
37 NWH533xA 1887 1955 .65 .30B .36
38 NWH533xC 1887 1955 .62 .23B .32A
39 NWH534xD 1903 2003 .34 .70 .63 .61
40 NWH534xC 1903 2003 .55 .73 .64 .65
41 NWH535xA 1908 1980 .57 .55 .51
42 NWH535xB 1908 1980 .61 .62 .61
43 NWH538xA 1902 1965 .58 .56
44 NWH538xC 1902 1965 .59 .57
45 NWH539xA 1848 1993 .59 .58 .51 .55 .59
46 NWH540xA 1929 1965 .60
47 NWH540xB 1929 1965 .73
48 NWH540xC 1929 1977 .47
49 NWH600xA 1873 2008 .59 .58 .58 .49 .33 .41
Av segment correlation .66 .59 .50 .51 .49 .60

213
PART 6: POTENTIAL PROBLEMS:
------------------------------------------------------------------------------------------------------------------------------------
For each series with potential problems the following diagnostics may appear:
[A] Correlations with master dating series of flagged 50-year segments of series filtered with 32-year spline,
at every point from ten years earlier (-10) to ten years later (+10) than dated
[B] Effect of those data values which most lower or raise correlation with master series
Symbol following year indicates value in series is greater (>) or lesser (<) than master series value
[C] Year-to-year changes very different from the mean change in other series
[D] Absent rings (zero values)
[E] Values which are statistical outliers from mean for the year
====================================================================================================================================
NWH624 A 1952 to 2008 57 years Series 1
[B] Entire series, effect on correlation ( .681) is:
Lower 1985< -.020 1988> -.016 1960> -.015 1961< -.014 2005< -.012 1962< -.012 Higher 1992 .150 1959 .022
====================================================================================================================================
NWH622 A 1977 to 2009 33 years Series 2
[B] Entire series, effect on correlation ( .671) is:
Lower 1983< -.056 1986< -.053 1979> -.017 1991> -.014 1989< -.013 1996> -.011 Higher 2009 .170 2003 .018
====================================================================================================================================
NWH616 A 1955 to 2009 55 years Series 3
[B] Entire series, effect on correlation ( .556) is:
Lower 1968< -.054 1962< -.036 1971< -.020 1956< -.014 1985< -.012 2004< -.009 Higher 2009 .032 1959 .027
====================================================================================================================================
NWH617 B 1986 to 2009 24 years Series 4
[B] Entire series, effect on correlation ( .767) is:
Lower 2005< -.038 1992> -.028 1994< -.022 2003< -.016 1986> -.008 2004> -.006 Higher 2009 .104 2001 .013
====================================================================================================================================
NWH618 A 1988 to 2009 22 years Series 5
[B] Entire series, effect on correlation ( .591) is:
Lower 1992> -.099 2006< -.038 1994< -.026 2002> -.020 2000< -.019 1995> -.011 Higher 2009 .167 2008 .030
====================================================================================================================================
NWH618 B 1990 to 2009 20 years Series 6
[B] Entire series, effect on correlation ( .825) is:
Lower 1992> -.059 2006< -.025 2004> -.018 1990< -.007 2005< -.003 1993< -.003 Higher 2009 .169 2008 .006
====================================================================================================================================
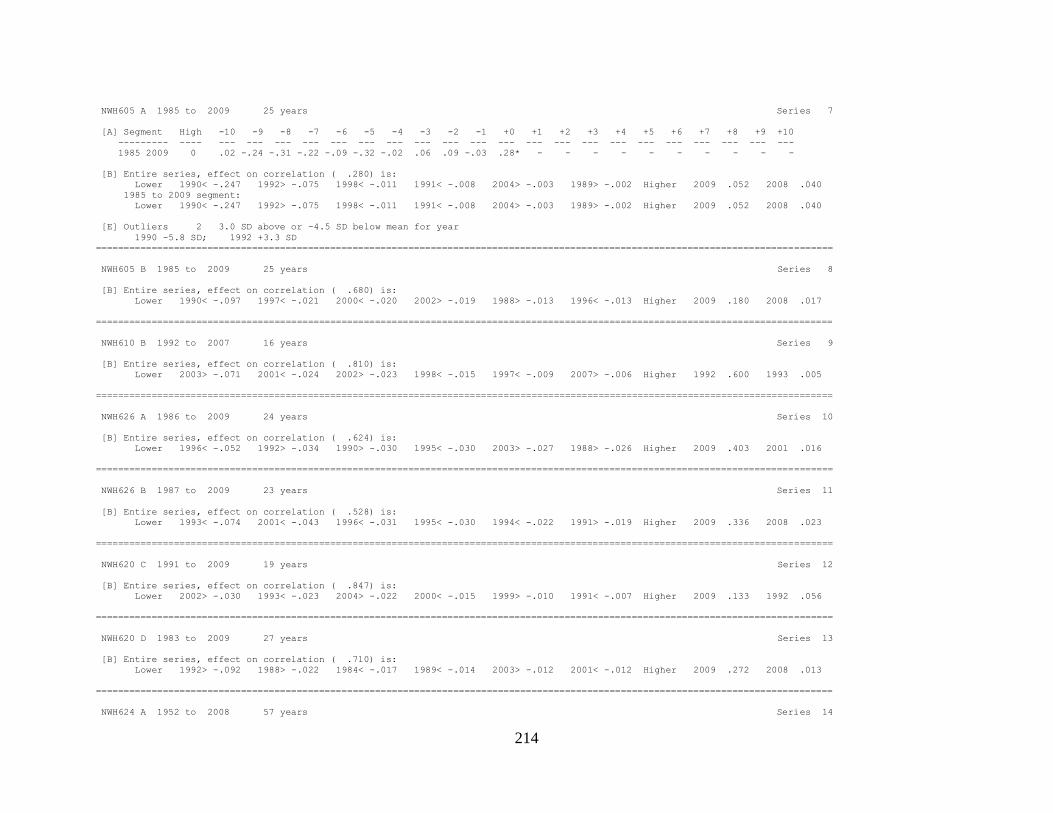
214
NWH605 A 1985 to 2009 25 years Series 7
[A] Segment High -10 -9 -8 -7 -6 -5 -4 -3 -2 -1 +0 +1 +2 +3 +4 +5 +6 +7 +8 +9 +10
--------- ---- --- --- --- --- --- --- --- --- --- --- --- --- --- --- --- --- --- --- --- --- ---
1985 2009 0 .02 -.24 -.31 -.22 -.09 -.32 -.02 .06 .09 -.03 .28* - - - - - - - - - -
[B] Entire series, effect on correlation ( .280) is:
Lower 1990< -.247 1992> -.075 1998< -.011 1991< -.008 2004> -.003 1989> -.002 Higher 2009 .052 2008 .040
1985 to 2009 segment:
Lower 1990< -.247 1992> -.075 1998< -.011 1991< -.008 2004> -.003 1989> -.002 Higher 2009 .052 2008 .040
[E] Outliers 2 3.0 SD above or -4.5 SD below mean for year
1990 -5.8 SD; 1992 +3.3 SD
====================================================================================================================================
NWH605 B 1985 to 2009 25 years Series 8
[B] Entire series, effect on correlation ( .680) is:
Lower 1990< -.097 1997< -.021 2000< -.020 2002> -.019 1988> -.013 1996< -.013 Higher 2009 .180 2008 .017
====================================================================================================================================
NWH610 B 1992 to 2007 16 years Series 9
[B] Entire series, effect on correlation ( .810) is:
Lower 2003> -.071 2001< -.024 2002> -.023 1998< -.015 1997< -.009 2007> -.006 Higher 1992 .600 1993 .005
====================================================================================================================================
NWH626 A 1986 to 2009 24 years Series 10
[B] Entire series, effect on correlation ( .624) is:
Lower 1996< -.052 1992> -.034 1990> -.030 1995< -.030 2003> -.027 1988> -.026 Higher 2009 .403 2001 .016
====================================================================================================================================
NWH626 B 1987 to 2009 23 years Series 11
[B] Entire series, effect on correlation ( .528) is:
Lower 1993< -.074 2001< -.043 1996< -.031 1995< -.030 1994< -.022 1991> -.019 Higher 2009 .336 2008 .023
====================================================================================================================================
NWH620 C 1991 to 2009 19 years Series 12
[B] Entire series, effect on correlation ( .847) is:
Lower 2002> -.030 1993< -.023 2004> -.022 2000< -.015 1999> -.010 1991< -.007 Higher 2009 .133 1992 .056
====================================================================================================================================
NWH620 D 1983 to 2009 27 years Series 13
[B] Entire series, effect on correlation ( .710) is:
Lower 1992> -.092 1988> -.022 1984< -.017 1989< -.014 2003> -.012 2001< -.012 Higher 2009 .272 2008 .013
====================================================================================================================================
NWH624 A 1952 to 2008 57 years Series 14

215
[B] Entire series, effect on correlation ( .681) is:
Lower 1985< -.020 1988> -.016 1960> -.015 1961< -.014 2005< -.012 1962< -.012 Higher 1992 .150 1959 .022
====================================================================================================================================
NWH614 C 1983 to 2009 27 years Series 15
[A] Segment High -10 -9 -8 -7 -6 -5 -4 -3 -2 -1 +0 +1 +2 +3 +4 +5 +6 +7 +8 +9 +10
--------- ---- --- --- --- --- --- --- --- --- --- --- --- --- --- --- --- --- --- --- --- --- ---
1983 2009 0 -.22 .02 -.09 -.44 -.26 -.20 .00 -.13 -.04 .02 .30* - - - - - - - - - -
[B] Entire series, effect on correlation ( .304) is:
Lower 2007< -.064 1987< -.058 2002> -.039 2008< -.037 2001< -.030 2000< -.017 Higher 1992 .082 2009 .058
1983 to 2009 segment:
Lower 2007< -.064 1987< -.058 2002> -.039 2008< -.037 2001< -.030 2000< -.017 Higher 1992 .082 2009 .058
====================================================================================================================================
NWH612 C 1979 to 2008 30 years Series 16
[B] Entire series, effect on correlation ( .706) is:
Lower 1989> -.048 1979< -.036 2003> -.034 1993< -.023 1998< -.015 1991> -.013 Higher 1992 .345 2008 .017
====================================================================================================================================
NWH612 B 1979 to 2008 30 years Series 17
[B] Entire series, effect on correlation ( .735) is:
Lower 1990> -.058 2003> -.054 2002< -.023 1994< -.013 1993< -.011 1979< -.010 Higher 1992 .226 2008 .018
====================================================================================================================================
NWH604 B 1944 to 2008 65 years Series 18
[B] Entire series, effect on correlation ( .354) is:
Lower 1959> -.034 1950< -.030 1975> -.025 2001< -.021 2007< -.021 1951> -.018 Higher 1992 .240 1983 .020
====================================================================================================================================
NWH602 A 1960 to 2009 50 years Series 19
[B] Entire series, effect on correlation ( .389) is:
Lower 1964< -.043 1975> -.042 1972< -.028 1974> -.021 1960> -.020 1979> -.016 Higher 2009 .089 2003 .028
====================================================================================================================================
NWH530xB 1885 to 1963 79 years Series 20
[A] Segment High -10 -9 -8 -7 -6 -5 -4 -3 -2 -1 +0 +1 +2 +3 +4 +5 +6 +7 +8 +9 +10
--------- ---- --- --- --- --- --- --- --- --- --- --- --- --- --- --- --- --- --- --- --- --- ---
1885 1934 4 -.32 .08 -.10 -.02 .09 .07 -.13 .00 -.06 .18 .20|-.05 -.08 -.22 .26*-.09 -.12 -.12 -.06 -.18 .07
[B] Entire series, effect on correlation ( .220) is:
Lower 1892> -.119 1901< -.064 1886< -.025 1896> -.022 1906< -.011 1905< -.011 Higher 1888 .053 1930 .052
1885 to 1934 segment:
Lower 1892> -.166 1901< -.082 1886< -.032 1896> -.029 1906< -.014 1905< -.013 Higher 1888 .071 1930 .067
[C] Year-to-year changes diverging by over 4.0 std deviations:

216
1891 1892 4.2 SD
[E] Outliers 2 3.0 SD above or -4.5 SD below mean for year
1892 +4.1 SD; 1901 -4.5 SD
====================================================================================================================================
NWH500xB 1888 to 1997 110 years Series 21
[A] Segment High -10 -9 -8 -7 -6 -5 -4 -3 -2 -1 +0 +1 +2 +3 +4 +5 +6 +7 +8 +9 +10
--------- ---- --- --- --- --- --- --- --- --- --- --- --- --- --- --- --- --- --- --- --- --- ---
1925 1974 -9 .00 .22* .20 .05 .07 .02 -.05 -.17 -.17 -.19 .22| .08 .07 .08 -.16 .02 -.10 .10 -.06 .10 -.05
[B] Entire series, effect on correlation ( .422) is:
Lower 1888> -.045 1957< -.027 1974> -.015 1899> -.010 1982< -.008 1944> -.008 Higher 1992 .049 1959 .026
1925 to 1974 segment:
Lower 1957< -.061 1974> -.040 1964> -.018 1960> -.017 1944> -.016 1938< -.015 Higher 1959 .091 1951 .055
[D] 2 Absent rings: Year Master N series Absent
1951 -1.462 27 1
1959 -1.437 26 1
[E] Outliers 2 3.0 SD above or -4.5 SD below mean for year
1888 +4.1 SD; 1959 -5.7 SD
====================================================================================================================================
NWH501xA 1888 to 2006 119 years Series 22
[B] Entire series, effect on correlation ( .575) is:
Lower 1963< -.018 1964> -.013 1943< -.011 1984< -.011 1954> -.009 1892> -.009 Higher 1916 .024 1992 .017
====================================================================================================================================
NWH503xB 1908 to 2007 100 years Series 23
[B] Entire series, effect on correlation ( .551) is:
Lower 1947> -.015 1912> -.011 1996< -.010 1963< -.009 2004< -.009 1919< -.008 Higher 1951 .022 1959 .017
====================================================================================================================================
NWH503xA 1908 to 2007 100 years Series 24
[B] Entire series, effect on correlation ( .478) is:
Lower 1992> -.025 1912> -.020 1923< -.013 1947> -.013 1996< -.011 1916> -.010 Higher 1951 .027 1974 .026
====================================================================================================================================
NWH506xA 1900 to 2009 110 years Series 25
[B] Entire series, effect on correlation ( .619) is:
Lower 1904> -.023 1921< -.013 1990> -.011 1936< -.010 1959> -.009 1915< -.009 Higher 1942 .034 2009 .023
====================================================================================================================================
NWH506xB 1900 to 2009 110 years Series 26
[B] Entire series, effect on correlation ( .503) is:
Lower 1921< -.024 1904> -.020 1936< -.013 1990> -.009 1924< -.009 1930> -.007 Higher 1916 .023 2009 .021
[E] Outliers 1 3.0 SD above or -4.5 SD below mean for year

217
1916 -6.1 SD
====================================================================================================================================
NWH509xB 1871 to 1932 62 years Series 27
[B] Entire series, effect on correlation ( .600) is:
Lower 1932> -.056 1911< -.028 1930> -.021 1926< -.018 1918> -.012 1906< -.008 Higher 1892 .115 1888 .019
[E] Outliers 1 3.0 SD above or -4.5 SD below mean for year
1932 +3.9 SD
====================================================================================================================================
NWH509xC 1871 to 1932 62 years Series 28
[B] Entire series, effect on correlation ( .644) is:
Lower 1932> -.048 1911< -.028 1930> -.023 1926< -.016 1893< -.009 1917> -.008 Higher 1892 .102 1882 .044
[E] Outliers 1 3.0 SD above or -4.5 SD below mean for year
1932 +3.6 SD
====================================================================================================================================
NWH510xB 1889 to 1932 44 years Series 29
[B] Entire series, effect on correlation ( .725) is:
Lower 1930> -.062 1915< -.024 1909< -.017 1906< -.016 1928< -.012 1907> -.011 Higher 1892 .134 1916 .021
====================================================================================================================================
NWH510xC 1889 to 1932 44 years Series 30
[B] Entire series, effect on correlation ( .551) is:
Lower 1930> -.066 1909< -.022 1900> -.020 1913< -.018 1898< -.012 1896< -.009 Higher 1892 .087 1916 .042
[E] Outliers 1 3.0 SD above or -4.5 SD below mean for year
1930 +3.1 SD
====================================================================================================================================
NWH512xA 1924 to 1953 30 years Series 31
[B] Entire series, effect on correlation ( .570) is:
Lower 1932> -.077 1947< -.065 1941< -.021 1951> -.015 1939< -.013 1945> -.012 Higher 1942 .146 1930 .034
====================================================================================================================================
NWH512xB 1924 to 1953 30 years Series 32
[B] Entire series, effect on correlation ( .530) is:
Lower 1932> -.108 1927< -.074 1939< -.018 1951> -.018 1935< -.012 1925> -.012 Higher 1942 .145 1930 .023
[E] Outliers 1 3.0 SD above or -4.5 SD below mean for year
1932 +3.2 SD
====================================================================================================================================
NWH513xA 1886 to 1977 92 years Series 33
[A] Segment High -10 -9 -8 -7 -6 -5 -4 -3 -2 -1 +0 +1 +2 +3 +4 +5 +6 +7 +8 +9 +10
--------- ---- --- --- --- --- --- --- --- --- --- --- --- --- --- --- --- --- --- --- --- --- ---
1928 1977 0 .16 -.03 -.04 .17 -.12 -.01 -.31 -.18 -.08 .04 .30*-.05 .13 -.04 -.15 .12 .14 .23 -.05 -.14 -.13

218
[B] Entire series, effect on correlation ( .437) is:
Lower 1888> -.039 1924< -.023 1947> -.021 1889< -.016 1964> -.013 1907< -.012 Higher 1892 .075 1930 .046
1928 to 1977 segment:
Lower 1947> -.046 1964> -.028 1960> -.022 1943< -.017 1977> -.016 1973< -.015 Higher 1930 .164 1942 .027
[E] Outliers 2 3.0 SD above or -4.5 SD below mean for year
1888 +3.1 SD; 1947 +3.1 SD
====================================================================================================================================
NWH520xB 1910 to 1991 82 years Series 34
[B] Entire series, effect on correlation ( .344) is:
Lower 1967< -.039 1916> -.038 1959> -.029 1929< -.029 1969< -.024 1975> -.018 Higher 1930 .047 1942 .034
====================================================================================================================================
NWH531xA 1948 to 2007 60 years Series 35
[B] Entire series, effect on correlation ( .365) is:
Lower 1951> -.074 2003> -.039 1999< -.038 1998< -.020 1964> -.018 1953< -.018 Higher 1992 .111 1974 .063
[E] Outliers 2 3.0 SD above or -4.5 SD below mean for year
1951 +3.6 SD; 1999 -5.9 SD
====================================================================================================================================
NWH531xB 1948 to 2007 60 years Series 36
[A] Segment High -10 -9 -8 -7 -6 -5 -4 -3 -2 -1 +0 +1 +2 +3 +4 +5 +6 +7 +8 +9 +10
--------- ---- --- --- --- --- --- --- --- --- --- --- --- --- --- --- --- --- --- --- --- --- ---
1950 1999 0 .07 -.08 -.20 .18 -.07 -.21 -.06 -.06 -.02 .01 .30* .03 .04 -.03 .23 .18 -.09 -.19 -.30 -.37 .17
[B] Entire series, effect on correlation ( .321) is:
Lower 1951> -.078 1999< -.049 2003> -.026 1953< -.023 1964> -.017 1989> -.016 Higher 1992 .052 1975 .034
1950 to 1999 segment:
Lower 1951> -.094 1999< -.055 1953< -.025 1964> -.021 1989> -.020 1998< -.012 Higher 1992 .065 1975 .041
[E] Outliers 2 3.0 SD above or -4.5 SD below mean for year
1951 +3.6 SD; 1999 -5.7 SD
====================================================================================================================================
NWH533xA 1887 to 1955 69 years Series 37
[A] Segment High -10 -9 -8 -7 -6 -5 -4 -3 -2 -1 +0 +1 +2 +3 +4 +5 +6 +7 +8 +9 +10
--------- ---- --- --- --- --- --- --- --- --- --- --- --- --- --- --- --- --- --- --- --- --- ---
1900 1949 -2 -.10 -.13 .02 -.11 -.15 -.06 -.10 .05 .33* .12 .30|-.07 .03 .05 -.04 -.25 -.21 -.11 -.16 .05 .13
[B] Entire series, effect on correlation ( .589) is:
Lower 1925> -.027 1910> -.018 1946> -.014 1937> -.013 1944< -.010 1890< -.010 Higher 1892 .147 1951 .015
1900 to 1949 segment:
Lower 1925> -.046 1910> -.024 1946> -.020 1937> -.018 1919< -.017 1944< -.016 Higher 1942 .038 1916 .036
[E] Outliers 1 3.0 SD above or -4.5 SD below mean for year
1910 +3.1 SD
====================================================================================================================================
NWH533xC 1887 to 1955 69 years Series 38
[A] Segment High -10 -9 -8 -7 -6 -5 -4 -3 -2 -1 +0 +1 +2 +3 +4 +5 +6 +7 +8 +9 +10
--------- ---- --- --- --- --- --- --- --- --- --- --- --- --- --- --- --- --- --- --- --- --- ---

219
1900 1949 -2 -.09 -.10 -.02 -.05 -.20 -.06 -.12 .07 .35* .13 .23|-.07 .07 .04 -.11 -.20 -.17 -.14 -.13 .06 .13
1906 1955 0 -.07 .01 -.12 .00 -.21 -.06 -.13 .15 .29 .07 .32*-.09 .05 .04 -.11 -.18 -.21 -.11 -.07 .08 .14
[B] Entire series, effect on correlation ( .562) is:
Lower 1925> -.026 1940< -.018 1910> -.017 1919< -.016 1937> -.012 1921< -.011 Higher 1892 .159 1951 .019
1900 to 1949 segment:
Lower 1925> -.044 1940< -.033 1919< -.029 1910> -.020 1921< -.018 1937> -.015 Higher 1942 .036 1916 .028
1906 to 1955 segment:
Lower 1925> -.043 1940< -.031 1919< -.027 1910> -.023 1921< -.018 1937> -.017 Higher 1951 .065 1942 .020
[E] Outliers 1 3.0 SD above or -4.5 SD below mean for year
1910 +3.2 SD
====================================================================================================================================
NWH534xD 1903 to 2003 101 years Series 39
[B] Entire series, effect on correlation ( .485) is:
Lower 1916> -.036 1912> -.029 1909< -.023 1978> -.020 1904> -.018 1917> -.017 Higher 1992 .119 1930 .035
[E] Outliers 1 3.0 SD above or -4.5 SD below mean for year
1992 -5.0 SD
====================================================================================================================================
NWH534xC 1903 to 2003 101 years Series 40
[B] Entire series, effect on correlation ( .593) is:
Lower 1912> -.026 1978> -.022 1924< -.015 1909< -.014 2002> -.011 1918> -.011 Higher 1992 .089 1916 .028
[E] Outliers 1 3.0 SD above or -4.5 SD below mean for year
1992 -4.7 SD
====================================================================================================================================
NWH535xA 1908 to 1980 73 years Series 41
[B] Entire series, effect on correlation ( .512) is:
Lower 1973< -.028 1978> -.023 1964> -.018 1916> -.014 1941< -.013 1917> -.011 Higher 1974 .034 1932 .032
====================================================================================================================================
NWH535xB 1908 to 1980 73 years Series 42
[B] Entire series, effect on correlation ( .544) is:
Lower 1978> -.030 1930> -.027 1973< -.024 1933< -.016 1917> -.015 1954> -.014 Higher 1942 .078 1932 .029
====================================================================================================================================
NWH538xA 1902 to 1965 64 years Series 43
[B] Entire series, effect on correlation ( .561) is:
Lower 1942> -.027 1938< -.022 1917< -.020 1957< -.019 1939< -.014 1959> -.014 Higher 1930 .049 1951 .032
====================================================================================================================================
NWH538xC 1902 to 1965 64 years Series 44
[B] Entire series, effect on correlation ( .569) is:
Lower 1938< -.025 1959> -.020 1957< -.019 1903< -.014 1925> -.010 1917< -.009 Higher 1930 .021 1951 .019
====================================================================================================================================

220
NWH539xA 1848 to 1993 146 years Series 45
[*] Early part of series cannot be checked from 1848 to 1870 -- not matched by another series
[B] Entire series, effect on correlation ( .588) is:
Lower 1901< -.021 1877< -.013 1896> -.012 1955< -.012 1899> -.009 1900> -.008 Higher 1892 .048 1942 .025
====================================================================================================================================
NWH540xA 1929 to 1965 37 years Series 46
[B] Entire series, effect on correlation ( .595) is:
Lower 1942> -.049 1963< -.036 1960> -.022 1965> -.018 1946< -.012 1950< -.012 Higher 1930 .106 1932 .044
====================================================================================================================================
NWH540xB 1929 to 1965 37 years Series 47
[B] Entire series, effect on correlation ( .732) is:
Lower 1962< -.028 1950< -.022 1960> -.014 1951> -.014 1946< -.012 1931> -.011 Higher 1930 .061 1959 .029
====================================================================================================================================
NWH540xC 1929 to 1977 49 years Series 48
[B] Entire series, effect on correlation ( .472) is:
Lower 1959> -.027 1952< -.023 1962< -.023 1975> -.023 1971< -.018 1974> -.018 Higher 1930 .110 1932 .043
====================================================================================================================================
NWH600xA 1873 to 2008 136 years Series 49
[B] Entire series, effect on correlation ( .535) is:
Lower 1892> -.018 1915< -.018 1974> -.013 1951> -.009 1949> -.009 1956< -.007 Higher 1882 .039 1930 .019
====================================================================================================================================
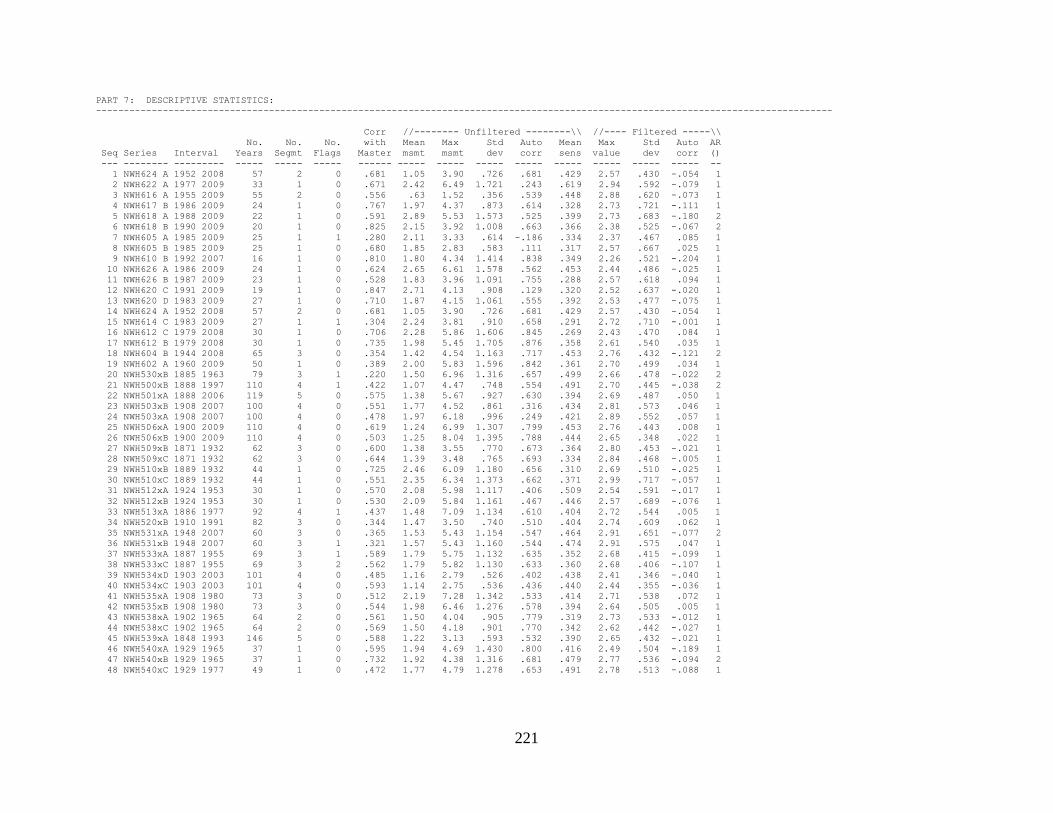
221
PART 7: DESCRIPTIVE STATISTICS:
------------------------------------------------------------------------------------------------------------------------------------
Corr //-------- Unfiltered --------\\ //---- Filtered -----\\
No. No. No. with Mean Max Std Auto Mean Max Std Auto AR
Seq Series Interval Years Segmt Flags Master msmt msmt dev corr sens value dev corr ()
--- -------- --------- ----- ----- ----- ------ ----- ----- ----- ----- ----- ----- ----- ----- --
1 NWH624 A 1952 2008 57 2 0 .681 1.05 3.90 .726 .681 .429 2.57 .430 -.054 1
2 NWH622 A 1977 2009 33 1 0 .671 2.42 6.49 1.721 .243 .619 2.94 .592 -.079 1
3 NWH616 A 1955 2009 55 2 0 .556 .63 1.52 .356 .539 .448 2.88 .620 -.073 1
4 NWH617 B 1986 2009 24 1 0 .767 1.97 4.37 .873 .614 .328 2.73 .721 -.111 1
5 NWH618 A 1988 2009 22 1 0 .591 2.89 5.53 1.573 .525 .399 2.73 .683 -.180 2
6 NWH618 B 1990 2009 20 1 0 .825 2.15 3.92 1.008 .663 .366 2.38 .525 -.067 2
7 NWH605 A 1985 2009 25 1 1 .280 2.11 3.33 .614 -.186 .334 2.37 .467 .085 1
8 NWH605 B 1985 2009 25 1 0 .680 1.85 2.83 .583 .111 .317 2.57 .667 .025 1
9 NWH610 B 1992 2007 16 1 0 .810 1.80 4.34 1.414 .838 .349 2.26 .521 -.204 1
10 NWH626 A 1986 2009 24 1 0 .624 2.65 6.61 1.578 .562 .453 2.44 .486 -.025 1
11 NWH626 B 1987 2009 23 1 0 .528 1.83 3.96 1.091 .755 .288 2.57 .618 .094 1
12 NWH620 C 1991 2009 19 1 0 .847 2.71 4.13 .908 .129 .320 2.52 .637 -.020 1
13 NWH620 D 1983 2009 27 1 0 .710 1.87 4.15 1.061 .555 .392 2.53 .477 -.075 1
14 NWH624 A 1952 2008 57 2 0 .681 1.05 3.90 .726 .681 .429 2.57 .430 -.054 1
15 NWH614 C 1983 2009 27 1 1 .304 2.24 3.81 .910 .658 .291 2.72 .710 -.001 1
16 NWH612 C 1979 2008 30 1 0 .706 2.28 5.86 1.606 .845 .269 2.43 .470 .084 1
17 NWH612 B 1979 2008 30 1 0 .735 1.98 5.45 1.705 .876 .358 2.61 .540 .035 1
18 NWH604 B 1944 2008 65 3 0 .354 1.42 4.54 1.163 .717 .453 2.76 .432 -.121 2
19 NWH602 A 1960 2009 50 1 0 .389 2.00 5.83 1.596 .842 .361 2.70 .499 .034 1
20 NWH530xB 1885 1963 79 3 1 .220 1.50 6.96 1.316 .657 .499 2.66 .478 -.022 2
21 NWH500xB 1888 1997 110 4 1 .422 1.07 4.47 .748 .554 .491 2.70 .445 -.038 2
22 NWH501xA 1888 2006 119 5 0 .575 1.38 5.67 .927 .630 .394 2.69 .487 .050 1
23 NWH503xB 1908 2007 100 4 0 .551 1.77 4.52 .861 .316 .434 2.81 .573 .046 1
24 NWH503xA 1908 2007 100 4 0 .478 1.97 6.18 .996 .249 .421 2.89 .552 .057 1
25 NWH506xA 1900 2009 110 4 0 .619 1.24 6.99 1.307 .799 .453 2.76 .443 .008 1
26 NWH506xB 1900 2009 110 4 0 .503 1.25 8.04 1.395 .788 .444 2.65 .348 .022 1
27 NWH509xB 1871 1932 62 3 0 .600 1.38 3.55 .770 .673 .364 2.80 .453 -.021 1
28 NWH509xC 1871 1932 62 3 0 .644 1.39 3.48 .765 .693 .334 2.84 .468 -.005 1
29 NWH510xB 1889 1932 44 1 0 .725 2.46 6.09 1.180 .656 .310 2.69 .510 -.025 1
30 NWH510xC 1889 1932 44 1 0 .551 2.35 6.34 1.373 .662 .371 2.99 .717 -.057 1
31 NWH512xA 1924 1953 30 1 0 .570 2.08 5.98 1.117 .406 .509 2.54 .591 -.017 1
32 NWH512xB 1924 1953 30 1 0 .530 2.09 5.84 1.161 .467 .446 2.57 .689 -.076 1
33 NWH513xA 1886 1977 92 4 1 .437 1.48 7.09 1.134 .610 .404 2.72 .544 .005 1
34 NWH520xB 1910 1991 82 3 0 .344 1.47 3.50 .740 .510 .404 2.74 .609 .062 1
35 NWH531xA 1948 2007 60 3 0 .365 1.53 5.43 1.154 .547 .464 2.91 .651 -.077 2
36 NWH531xB 1948 2007 60 3 1 .321 1.57 5.43 1.160 .544 .474 2.91 .575 .047 1
37 NWH533xA 1887 1955 69 3 1 .589 1.79 5.75 1.132 .635 .352 2.68 .415 -.099 1
38 NWH533xC 1887 1955 69 3 2 .562 1.79 5.82 1.130 .633 .360 2.68 .406 -.107 1
39 NWH534xD 1903 2003 101 4 0 .485 1.16 2.79 .526 .402 .438 2.41 .346 -.040 1
40 NWH534xC 1903 2003 101 4 0 .593 1.14 2.75 .536 .436 .440 2.44 .355 -.036 1
41 NWH535xA 1908 1980 73 3 0 .512 2.19 7.28 1.342 .533 .414 2.71 .538 .072 1
42 NWH535xB 1908 1980 73 3 0 .544 1.98 6.46 1.276 .578 .394 2.64 .505 .005 1
43 NWH538xA 1902 1965 64 2 0 .561 1.50 4.04 .905 .779 .319 2.73 .533 -.012 1
44 NWH538xC 1902 1965 64 2 0 .569 1.50 4.18 .901 .770 .342 2.62 .442 -.027 1
45 NWH539xA 1848 1993 146 5 0 .588 1.22 3.13 .593 .532 .390 2.65 .432 -.021 1
46 NWH540xA 1929 1965 37 1 0 .595 1.94 4.69 1.430 .800 .416 2.49 .504 -.189 1
47 NWH540xB 1929 1965 37 1 0 .732 1.92 4.38 1.316 .681 .479 2.77 .536 -.094 2
48 NWH540xC 1929 1977 49 1 0 .472 1.77 4.79 1.278 .653 .491 2.78 .513 -.088 1

222
PART 7: DESCRIPTIVE STATISTICS:
------------------------------------------------------------------------------------------------------------------------------------
Corr //-------- Unfiltered --------\\ //---- Filtered -----\\
No. No. No. with Mean Max Std Auto Mean Max Std Auto AR
Seq Series Interval Years Segmt Flags Master msmt msmt dev corr sens value dev corr ()
--- -------- --------- ----- ----- ----- ------ ----- ----- ----- ----- ----- ----- ----- ----- --
49 NWH600xA 1873 2008 136 6 0 .535 1.24 7.78 1.334 .788 .460 2.79 .445 .004 1
--- -------- --------- ----- ----- ----- ------ ----- ----- ----- ----- ----- ----- ----- ----- --
Total or mean: 2942 113 9 .535 1.58 8.04 1.032 .594 .414 2.99 .495 -.017
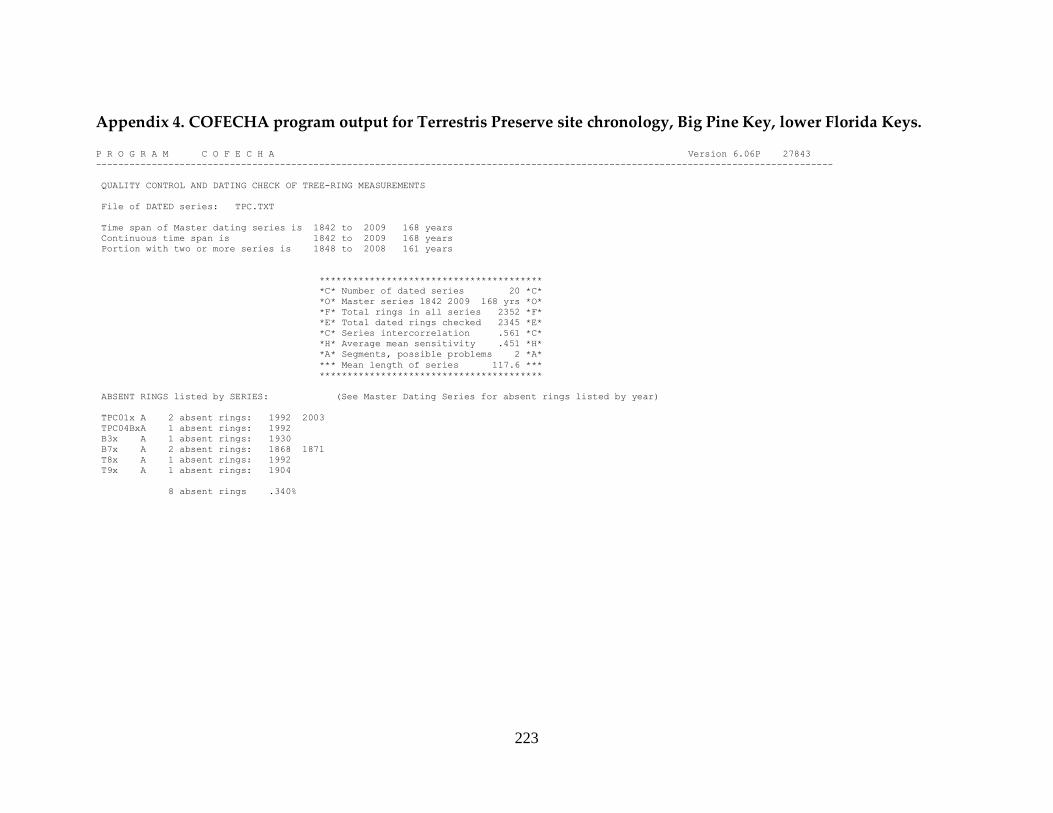
223
Appendix 4. COFECHA program output for Terrestris Preserve site chronology, Big Pine Key, lower Florida Keys.
P R O G R A M C O F E C H A Version 6.06P 27843
------------------------------------------------------------------------------------------------------------------------------------
QUALITY CONTROL AND DATING CHECK OF TREE-RING MEASUREMENTS
File of DATED series: TPC.TXT
Time span of Master dating series is 1842 to 2009 168 years
Continuous time span is 1842 to 2009 168 years
Portion with two or more series is 1848 to 2008 161 years
****************************************
*C* Number of dated series 20 *C*
*O* Master series 1842 2009 168 yrs *O*
*F* Total rings in all series 2352 *F*
*E* Total dated rings checked 2345 *E*
*C* Series intercorrelation .561 *C*
*H* Average mean sensitivity .451 *H*
*A* Segments, possible problems 2 *A*
*** Mean length of series 117.6 ***
****************************************
ABSENT RINGS listed by SERIES: (See Master Dating Series for absent rings listed by year)
TPC01x A 2 absent rings: 1992 2003
TPC04BxA 1 absent rings: 1992
B3x A 1 absent rings: 1930
B7x A 2 absent rings: 1868 1871
T8x A 1 absent rings: 1992
T9x A 1 absent rings: 1904
8 absent rings .340%

224
PART 2: TIME PLOT OF TREE-RING SERIES:
------------------------------------------------------------------------------------------------------------------------------------
1050 1100 1150 1200 1250 1300 1350 1400 1450 1500 1550 1600 1650 1700 1750 1800 1850 1900 1950 2000 2050 Ident Seq Time-span Yrs
: : : : : : : : : : : : : : : : : : : : : -------- --- ---- ---- ----
. . . . . . . . . . . . . . . . . <===========> . TPC01x A 1 1886 2008 123
. . . . . . . . . . . . . . . . . <============> . TPC04AxA 2 1870 2008 139
. . . . . . . . . . . . . . . . . <===========> . TPC04BxA 3 1887 2008 122
. . . . . . . . . . . . . . . . . . <=======> . TPC02x A 4 1923 2009 87
. . . . . . . . . . . . . . . . . . <=======> . B3x A 5 1927 2000 74
. . . . . . . . . . . . . . . . . <============> . B6x B 6 1870 2001 132
. . . . . . . . . . . . . . . . <===============> . B7x A 7 1842 2000 159
. . . . . . . . . . . . . . . . <===============> . B8x A 8 1848 2001 154
. . . . . . . . . . . . . . . . .<=============> . B9x A 9 1864 2001 138
. . . . . . . . . . . . . . . . .<=============> . B10x A 10 1860 2001 142
. . . . . . . . . . . . . . . . <==============> . N4x A 11 1854 2001 148
. . . . . . . . . . . . . . . . . <==========>. . N5x A 12 1880 1999 120
. . . . . . . . . . . . . . . . . . <=======> . N6x A 13 1926 2000 75
. . . . . . . . . . . . . . . . <=============>. . N7x A 14 1859 1995 137
. . . . . . . . . . . . . . . . . .<========> . N8x A 15 1915 2000 86
. . . . . . . . . . . . . . . . . . <=====>. . N9x A 16 1937 1999 63
. . . . . . . . . . . . . . . . . .<========> . N10x A 17 1918 2002 85
. . . . . . . . . . . . . . . . . <============> . T5x A 18 1871 2000 130
. . . . . . . . . . . . . . . . .<=============> . T8x A 19 1862 2000 139
. . . . . . . . . . . . . . . . . <=========> . T9x A 20 1902 2000 99
: : : : : : : : : : : : : : : : : : : : :
1050 1100 1150 1200 1250 1300 1350 1400 1450 1500 1550 1600 1650 1700 1750 1800 1850 1900 1950 2000 2050

225
PART 3: Master Dating Series:
------------------------------------------------------------------------------------------------------------------------------------
Year Value No Ab Year Value No Ab Year Value No Ab Year Value No Ab Year Value No Ab Year Value No Ab
------------------ ------------------ ------------------ ------------------ ------------------ ------------------
1850 .409 2 1900 -1.327 13 1950 -.192 20 2000 .177 17
1851 .092 2 1901 .487 13 1951 -2.310 20 2001 .144 10
1852 -1.570 2 1902 .105 14 1952 .366 20 2002 .319 5
1853 -1.714 2 1903 .189 14 1953 .902 20 2003 -2.435 4 1
1854 .396 3 1904 -2.097 14 1 1954 .807 20 2004 .782 4
1855 .295 3 1905 .128 14 1955 .739 20 2005 .723 4
1856 .857 3 1906 .327 14 1956 .581 20 2006 .803 4
1857 -.257 3 1907 .475 14 1957 .867 20 2007 -.813 4
1858 .859 3 1908 -.063 14 1958 -.809 20 2008 .739 4
1859 -1.778 4 1909 .824 14 1959 -2.220 20 2009 -1.028 1
1860 -1.353 5 1910 .612 14 1960 -.103 20
1861 -.918 5 1911 .805 14 1961 .701 20
1862 1.429 6 1912 -.547 14 1962 1.047 20
1863 .308 6 1913 .840 14 1963 .222 20
1864 .986 7 1914 .122 14 1964 -.932 20
1865 .259 7 1915 -.110 15 1965 .768 20
1866 1.116 7 1916 -2.668 15 1966 .358 20
1867 .774 7 1917 -.690 15 1967 .442 20
1868 -2.484 7 1 1918 .004 16 1968 .487 20
1869 1.349 7 1919 .200 16 1969 .886 20
1870 -.243 9 1920 .649 16 1970 .134 20
1871 -1.256 10 1 1921 .475 16 1971 -.010 20
1872 .331 10 1922 .607 16 1972 .100 20
1873 .295 10 1923 -.112 17 1973 .566 20
1874 .037 10 1924 .652 17 1974 -.197 20
1875 -2.054 10 1925 -1.654 17 1975 -3.389 20
1876 -.294 10 1926 1.005 18 1976 -.012 20
1877 .523 10 1927 .314 19 1977 -.305 20
1878 1.377 10 1928 .618 19 1978 -.569 20
1879 1.690 10 1929 .181 19 1979 -.384 20
1880 1.442 11 1930 -2.069 19 1 1980 -.230 20
1881 -.327 11 1931 .130 19 1981 .170 20
1882 -1.866 11 1932 -1.425 19 1982 .732 20
1883 .482 11 1933 .844 19 1983 .197 20
1884 .106 11 1934 .501 19 1984 -.246 20
1885 -.554 11 1935 .573 19 1985 -.269 20
1886 .224 12 1936 .122 19 1986 .581 20
1887 -.534 13 1937 .691 20 1987 .382 20
1888 -2.158 13 1938 1.072 20 1988 -.767 20
1889 .916 13 1939 .432 20 1989 -.098 20
1890 1.200 13 1940 .527 20 1990 -.452 20
1891 .716 13 1941 .167 20 1991 .719 20
1842 1.092 1 1892 -1.539 13 1942 -3.140 20 1992 -2.653 20 3
1843 1.518 1 1893 .543 13 1943 -.453 20 1993 .803 20
1844 -1.771 1 1894 1.059 13 1944 -.316 20 1994 .261 20
1845 -1.337 1 1895 -.049 13 1945 .034 20 1995 .213 20
1846 .392 1 1896 -.371 13 1946 .464 20 1996 .525 19
1847 -.908 1 1897 1.049 13 1947 -.169 20 1997 1.136 19
1848 1.570 2 1898 .481 13 1948 .675 20 1998 -.369 19
1849 1.608 2 1899 -.078 13 1949 -.239 20 1999 .271 19
------------------------------------------------------------------------------------------------------------------------------------
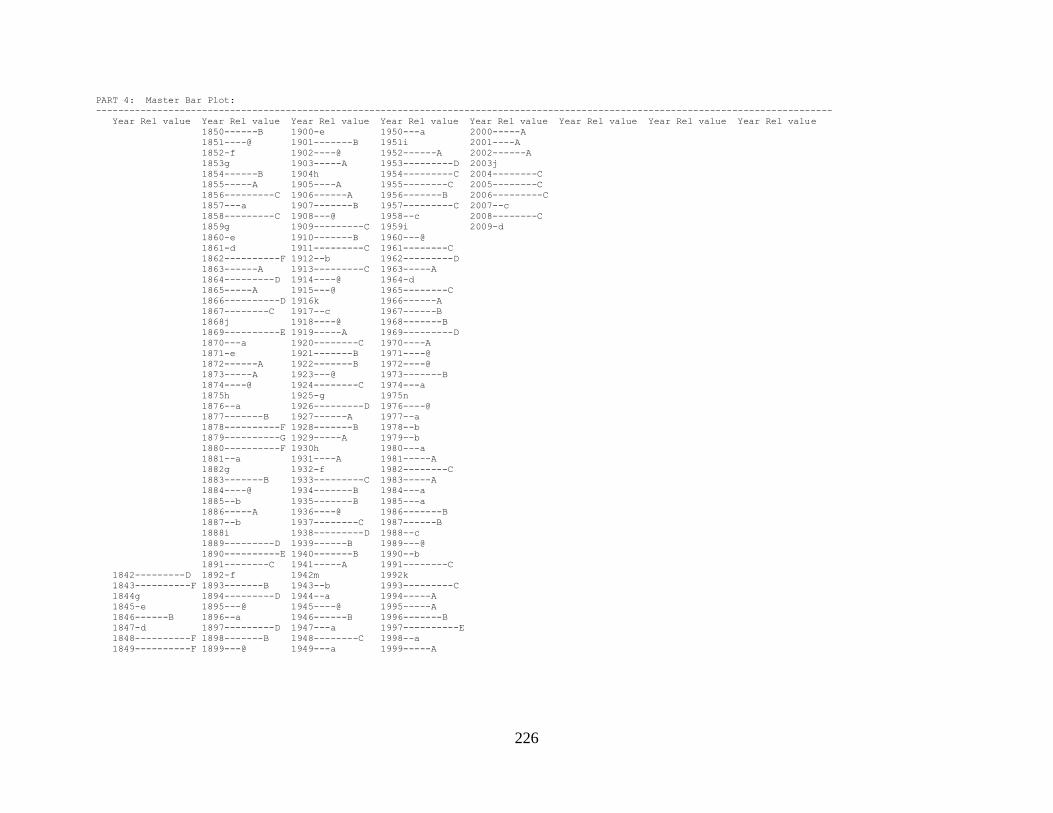
226
PART 4: Master Bar Plot:
------------------------------------------------------------------------------------------------------------------------------------
Year Rel value Year Rel value Year Rel value Year Rel value Year Rel value Year Rel value Year Rel value Year Rel value
1850------B 1900-e 1950---a 2000-----A
1851----@ 1901-------B 1951i 2001----A
1852-f 1902----@ 1952------A 2002------A
1853g 1903-----A 1953---------D 2003j
1854------B 1904h 1954---------C 2004--------C
1855-----A 1905----A 1955--------C 2005--------C
1856---------C 1906------A 1956-------B 2006---------C
1857---a 1907-------B 1957---------C 2007--c
1858---------C 1908---@ 1958--c 2008--------C
1859g 1909---------C 1959i 2009-d
1860-e 1910-------B 1960---@
1861-d 1911---------C 1961--------C
1862----------F 1912--b 1962---------D
1863------A 1913---------C 1963-----A
1864---------D 1914----@ 1964-d
1865-----A 1915---@ 1965--------C
1866----------D 1916k 1966------A
1867--------C 1917--c 1967------B
1868j 1918----@ 1968-------B
1869----------E 1919-----A 1969---------D
1870---a 1920--------C 1970----A
1871-e 1921-------B 1971----@
1872------A 1922-------B 1972----@
1873-----A 1923---@ 1973-------B
1874----@ 1924--------C 1974---a
1875h 1925-g 1975n
1876--a 1926---------D 1976----@
1877-------B 1927------A 1977--a
1878----------F 1928-------B 1978--b
1879----------G 1929-----A 1979--b
1880----------F 1930h 1980---a
1881--a 1931----A 1981-----A
1882g 1932-f 1982--------C
1883-------B 1933---------C 1983-----A
1884----@ 1934-------B 1984---a
1885--b 1935-------B 1985---a
1886-----A 1936----@ 1986-------B
1887--b 1937--------C 1987------B
1888i 1938---------D 1988--c
1889---------D 1939------B 1989---@
1890----------E 1940-------B 1990--b
1891--------C 1941-----A 1991--------C
1842---------D 1892-f 1942m 1992k
1843----------F 1893-------B 1943--b 1993---------C
1844g 1894---------D 1944--a 1994-----A
1845-e 1895---@ 1945----@ 1995-----A
1846------B 1896--a 1946------B 1996-------B
1847-d 1897---------D 1947---a 1997----------E
1848----------F 1898-------B 1948--------C 1998--a
1849----------F 1899---@ 1949---a 1999-----A

227
PART 5: CORRELATION OF SERIES BY SEGMENTS:
------------------------------------------------------------------------------------------------------------------------------------
Correlations of 50-year dated segments, lagged 25 years
Flags: A = correlation under .3281 but highest as dated; B = correlation higher at other than dated position
Seq Series Time_span 1825 1850 1875 1900 1925 1950 1975
1874 1899 1924 1949 1974 1999 2024
--- -------- --------- ---- ---- ---- ---- ---- ---- ---- ---- ---- ---- ---- ---- ---- ---- ---- ---- ---- ---- ---- ----
1 TPC01x A 1886 2008 .53 .49 .52 .47 .40
2 TPC04AxA 1870 2008 .60 .66 .56 .53 .56 .61
3 TPC04BxA 1887 2008 .69 .68 .64 .55 .49
4 TPC02x A 1923 2009 .74 .73 .58 .57
5 B3x A 1927 2000 .49 .50 .50
6 B6x B 1870 2001 .61 .64 .59 .63 .54 .52
7 B7x A 1842 2000 .58 .53 .39 .60 .77 .65 .64
8 B8x A 1848 2001 .68 .66 .64 .52 .42 .50 .49
9 B9x A 1864 2001 .64 .67 .63 .58 .35 .28A
10 B10x A 1860 2001 .63 .67 .54 .50 .62 .62
11 N4x A 1854 2001 .64 .52 .50 .52 .51 .50
12 N5x A 1880 1999 .64 .65 .65 .59
13 N6x A 1926 2000 .68 .55 .55
14 N7x A 1859 1995 .49 .53 .60 .45 .43
15 N8x A 1915 2000 .66 .62 .62 .62
16 N9x A 1937 1999 .28B .38
17 N10x A 1918 2002 .44 .45 .42 .43
18 T5x A 1871 2000 .41 .40 .49 .63 .67 .67
19 T8x A 1862 2000 .63 .64 .63 .63 .43 .43
20 T9x A 1902 2000 .49 .43 .44 .43
Av segment correlation .63 .58 .59 .58 .56 .52 .52
PART 6: POTENTIAL PROBLEMS:
------------------------------------------------------------------------------------------------------------------------------------
For each series with potential problems the following diagnostics may appear:
[A] Correlations with master dating series of flagged 50-year segments of series filtered with 32-year spline,
at every point from ten years earlier (-10) to ten years later (+10) than dated
[B] Effect of those data values which most lower or raise correlation with master series
Symbol following year indicates value in series is greater (>) or lesser (<) than master series value
[C] Year-to-year changes very different from the mean change in other series
[D] Absent rings (zero values)
[E] Values which are statistical outliers from mean for the year
====================================================================================================================================
TPC01x A 1886 to 2008 123 years Series 1
[B] Entire series, effect on correlation ( .584) is:
Lower 1959> -.015 1937< -.015 2007> -.012 1890< -.011 1932> -.011 1991< -.009 Higher 2003 .058 1992 .025
[D] 2 Absent rings: Year Master N series Absent
1992 -2.653 20 3
2003 -2.435 4 1
Present in series 2 TPC04AxA time span 1870 to 2008
Present in series 3 TPC04BxA time span 1887 to 2008
Present in series 4 TPC02x A time span 1923 to 2009

228
[E] Outliers 2 3.0 SD above or -4.5 SD below mean for year
1905 +3.1 SD; 2003 -5.3 SD
====================================================================================================================================
TPC04AxA 1870 to 2008 139 years Series 2
[B] Entire series, effect on correlation ( .582) is:
Lower 1870> -.014 1965< -.012 1912< -.012 1989< -.012 1953< -.007 2001> -.007 Higher 2003 .019 1975 .016
====================================================================================================================================
TPC04BxA 1887 to 2008 122 years Series 3
[B] Entire series, effect on correlation ( .629) is:
Lower 1958> -.017 2006< -.016 2003> -.013 1988> -.011 1897< -.011 1954< -.010 Higher 1992 .040 1916 .021
[D] 1 Absent rings: Year Master N series Absent
1992 -2.653 20 3
[E] Outliers 1 3.0 SD above or -4.5 SD below mean for year
1992 -4.6 SD
====================================================================================================================================
TPC02x A 1923 to 2009 87 years Series 4
[*] Later part of series cannot be checked from 2009 to 2009 -- not matched by another series
[B] Entire series, effect on correlation ( .637) is:
Lower 1976< -.027 1977< -.013 2004< -.013 1985> -.009 1989> -.008 2006> -.008 Higher 1942 .049 1975 .038
====================================================================================================================================
B3x A 1927 to 2000 74 years Series 5
[B] Entire series, effect on correlation ( .531) is:
Lower 1935< -.019 1958> -.016 1949> -.016 1964> -.016 1968< -.015 1987< -.013 Higher 1975 .077 1930 .051
[D] 1 Absent rings: Year Master N series Absent
1930 -2.069 19 1
====================================================================================================================================
B6x B 1870 to 2001 132 years Series 6
[B] Entire series, effect on correlation ( .607) is:
Lower 1989< -.017 1917> -.012 1977> -.009 1930> -.009 1910< -.009 1964> -.009 Higher 1992 .033 1942 .021
====================================================================================================================================
B7x A 1842 to 2000 159 years Series 7
[*] Early part of series cannot be checked from 1842 to 1847 -- not matched by another series
[B] Entire series, effect on correlation ( .607) is:
Lower 1906> -.013 1900> -.012 1985> -.010 1857< -.009 1897< -.008 1891< -.007 Higher 1942 .031 1975 .021
[D] 2 Absent rings: Year Master N series Absent
1868 -2.484 7 1

229
1871 -1.256 10 1
[E] Outliers 2 3.0 SD above or -4.5 SD below mean for year
1906 +3.4 SD; 1959 -5.3 SD
====================================================================================================================================
B8x A 1848 to 2001 154 years Series 8
[B] Entire series, effect on correlation ( .555) is:
Lower 1925> -.027 1964> -.010 1903< -.010 1919< -.009 1912> -.008 1854< -.007 Higher 1942 .034 1992 .033
[E] Outliers 2 3.0 SD above or -4.5 SD below mean for year
1925 +3.2 SD; 1931 +3.2 SD
====================================================================================================================================
B9x A 1864 to 2001 138 years Series 9
[A] Segment High -10 -9 -8 -7 -6 -5 -4 -3 -2 -1 +0 +1 +2 +3 +4 +5 +6 +7 +8 +9 +10
--------- ---- --- --- --- --- --- --- --- --- --- --- --- --- --- --- --- --- --- --- --- --- ---
1952 2001 0 -.09 .18 .23 -.31 .10 -.19 -.09 -.20 -.06 .15 .28* .06 .00 .04 .02 .28 -.07 -.08 -.09 - -
[B] Entire series, effect on correlation ( .514) is:
Lower 1992> -.065 1869< -.015 1945< -.011 1998< -.010 1976< -.007 1972< -.007 Higher 1975 .038 1916 .027
1952 to 2001 segment:
Lower 1992> -.189 1976< -.018 1979> -.015 1985> -.014 1972< -.014 1965< -.014 Higher 1975 .210 1959 .049
[E] Outliers 1 3.0 SD above or -4.5 SD below mean for year
1992 +4.5 SD
====================================================================================================================================
B10x A 1860 to 2001 142 years Series 10
[B] Entire series, effect on correlation ( .593) is:
Lower 1940< -.011 1985> -.010 1930> -.010 1994< -.009 1868> -.008 1980< -.007 Higher 1992 .033 1916 .019
====================================================================================================================================
N4x A 1854 to 2001 148 years Series 11
[B] Entire series, effect on correlation ( .552) is:
Lower 1959> -.021 1916> -.010 1921< -.008 1901< -.008 1889< -.007 1870< -.006 Higher 1992 .040 1942 .021
====================================================================================================================================
N5x A 1880 to 1999 120 years Series 12
[B] Entire series, effect on correlation ( .613) is:
Lower 1985< -.022 1890< -.012 1992> -.012 1885> -.009 1947< -.007 1938< -.007 Higher 1975 .041 1916 .029
====================================================================================================================================
N6x A 1926 to 2000 75 years Series 13
[B] Entire series, effect on correlation ( .631) is:
Lower 1935< -.021 1975> -.011 1978> -.011 1955< -.009 1989> -.009 1947> -.009 Higher 1942 .064 1930 .033
====================================================================================================================================
N7x A 1859 to 1995 137 years Series 14

230
[B] Entire series, effect on correlation ( .485) is:
Lower 1959> -.026 1952< -.019 1879< -.018 1932> -.014 1860> -.013 1861> -.012 Higher 1942 .024 1992 .024
[E] Outliers 1 3.0 SD above or -4.5 SD below mean for year
1959 +3.5 SD
====================================================================================================================================
N8x A 1915 to 2000 86 years Series 15
[B] Entire series, effect on correlation ( .628) is:
Lower 1985< -.021 1973< -.011 1977> -.011 1988< -.010 1954< -.009 1995> -.008 Higher 1975 .051 1916 .019
====================================================================================================================================
N9x A 1937 to 1999 63 years Series 16
[A] Segment High -10 -9 -8 -7 -6 -5 -4 -3 -2 -1 +0 +1 +2 +3 +4 +5 +6 +7 +8 +9 +10
--------- ---- --- --- --- --- --- --- --- --- --- --- --- --- --- --- --- --- --- --- --- --- ---
1937 1986 2 .07 .22 -.10 .20 -.08 .06 -.14 -.02 .08 -.09 .28|-.07 .30* .20 -.18 -.09 -.10 .05 -.10 -.14 -.03
[B] Entire series, effect on correlation ( .290) is:
Lower 1939< -.065 1942> -.027 1973< -.022 1956< -.018 1957< -.017 1996< -.013 Higher 1951 .051 1959 .038
1937 to 1986 segment:
Lower 1939< -.079 1942> -.043 1973< -.026 1956< -.022 1957< -.020 1969< -.011 Higher 1951 .066 1959 .048
[E] Outliers 1 3.0 SD above or -4.5 SD below mean for year
1942 +3.2 SD
====================================================================================================================================
N10x A 1918 to 2002 85 years Series 17
[B] Entire series, effect on correlation ( .426) is:
Lower 1992> -.027 1962< -.021 1922< -.017 1979> -.014 1971> -.013 1958> -.012 Higher 1975 .051 1959 .042
====================================================================================================================================
T5x A 1871 to 2000 130 years Series 18
[B] Entire series, effect on correlation ( .538) is:
Lower 1871> -.019 1921< -.013 1994< -.012 1958> -.012 1927< -.012 1894< -.010 Higher 1992 .043 1975 .029
====================================================================================================================================
T8x A 1862 to 2000 139 years Series 19
[B] Entire series, effect on correlation ( .587) is:
Lower 1978> -.017 1880< -.014 1865< -.010 1895> -.010 1969< -.007 1922> -.007 Higher 1992 .015 1875 .012
[D] 1 Absent rings: Year Master N series Absent
1992 -2.653 20 3
[E] Outliers 1 3.0 SD above or -4.5 SD below mean for year
1868 -5.5 SD
====================================================================================================================================
T9x A 1902 to 2000 99 years Series 20
[B] Entire series, effect on correlation ( .501) is:

231
Lower 1978> -.015 1932> -.012 1957< -.010 1946< -.010 1982< -.010 1967< -.009 Higher 1992 .053 1904 .042
[D] 1 Absent rings: Year Master N series Absent
1904 -2.097 14 1
[E] Outliers 1 3.0 SD above or -4.5 SD below mean for year
1904 -5.1 SD
====================================================================================================================================
PART 7: DESCRIPTIVE STATISTICS:
------------------------------------------------------------------------------------------------------------------------------------
Corr //-------- Unfiltered --------\\ //---- Filtered -----\\
No. No. No. with Mean Max Std Auto Mean Max Std Auto AR
Seq Series Interval Years Segmt Flags Master msmt msmt dev corr sens value dev corr ()
--- -------- --------- ----- ----- ----- ------ ----- ----- ----- ----- ----- ----- ----- ----- --
1 TPC01x A 1886 2008 123 5 0 .584 .61 2.03 .387 .359 .524 2.66 .350 .000 2
2 TPC04AxA 1870 2008 139 6 0 .582 .83 4.22 .669 .702 .424 2.82 .489 -.037 1
3 TPC04BxA 1887 2008 122 5 0 .629 .64 2.48 .374 .434 .407 2.74 .366 -.011 1
4 TPC02x A 1923 2009 87 4 0 .637 .87 2.42 .538 .548 .450 2.73 .537 .140 3
5 B3x A 1927 2000 74 3 0 .531 .81 3.82 .861 .571 .465 2.80 .547 -.097 1
6 B6x B 1870 2001 132 6 0 .607 .82 4.08 .735 .642 .441 2.82 .570 -.099 1
7 B7x A 1842 2000 159 7 0 .607 .78 3.29 .597 .510 .475 2.86 .399 .006 1
8 B8x A 1848 2001 154 7 0 .555 .86 2.70 .439 .320 .420 2.99 .517 .021 1
9 B9x A 1864 2001 138 6 1 .514 .54 2.37 .412 .536 .481 2.86 .563 .013 1
10 B10x A 1860 2001 142 6 0 .593 .80 2.30 .473 .420 .448 2.79 .525 .048 1
11 N4x A 1854 2001 148 6 0 .552 .67 2.84 .512 .592 .444 2.63 .395 -.005 1
12 N5x A 1880 1999 120 4 0 .613 .72 2.78 .497 .533 .433 2.72 .507 .059 1
13 N6x A 1926 2000 75 3 0 .631 .86 2.93 .623 .595 .474 2.88 .547 -.031 1
14 N7x A 1859 1995 137 5 0 .485 .99 3.35 .653 .506 .408 2.66 .430 .038 2
15 N8x A 1915 2000 86 4 0 .628 .70 2.24 .485 .582 .458 2.67 .561 -.015 1
16 N9x A 1937 1999 63 2 1 .290 .64 2.16 .463 .684 .406 2.67 .512 -.085 2
17 N10x A 1918 2002 85 4 0 .426 .56 1.67 .317 .497 .455 2.71 .479 -.037 1
18 T5x A 1871 2000 130 6 0 .538 .82 3.08 .598 .513 .454 2.74 .507 -.046 2
19 T8x A 1862 2000 139 6 0 .587 .73 3.06 .543 .534 .479 2.81 .387 -.056 1
20 T9x A 1902 2000 99 4 0 .501 .74 2.23 .487 .526 .474 2.48 .367 -.058 1
--- -------- --------- ----- ----- ----- ------ ----- ----- ----- ----- ----- ----- ----- ----- --
Total or mean: 2352 99 2 .561 .75 4.22 .532 .522 .451 2.99 .472 -.009

232
VITA
Grant L. Harley earned a Bachelor of Arts degree in geography with a
concentration in physical/environmental geography from the University of South
Florida in 2005. He received a Master of Arts degree from the Department of Geography
at the University of South Florida in 2007. His thesis research involved the integration
of GIS and environmental impact assessment techniques to develop a new approach to
evaluating the sensitivity and disturbance of cave and karst environments in west-
central Florida. In 2012, he was awarded the Doctorate of Philosophy degree in
geography by the University of Tennessee. During his tenure as a doctoral student at
the University of Tennessee, he served as a Graduate Fellow for the University of
Tennessee GK–12 Earth Project funded by the National Science Foundation, and
worked as a Graduate Teaching Associate in the Department of Geography. After
graduation, Grant will relocate to Mississippi where he accepted a position as an
assistant professor in the Department of Geography and Geology at The University of
Southern Mississippi.