tree coring to assess subsurface volatile organic … 1 tree coring to assess subsurface volatile...
TRANSCRIPT

1
1
Tree Coring to Assess Subsurface Volatile Organic Compound ContaminationBy Don A. Vroblesky (USGS, Columbia, SC)

2
User’s guide to tree coring for VOCsIntroduction (Advantages and
Limitations)Methodology• Tree core collection• Analysis• Quality control
Historical Perspectives and Technical Considerations• Historical perspectives• Technical rationale for
method aspects.• Factors influencing VOCs
in tree coresAppendix 1: Case StudiesAppendix 2: Gas chromatography
methodology
http://pubs.water.usgs.gov/sir2008-5088

3
Basic concept: •Tree roots take up water, gasses, and associated contaminants from the subsurface. •The contaminants move up the trunk. •Tree coring provides a sample of the ground water beneath the tree.

4
Application
• Rapid and inexpensive reconnaissance tool for determining whether subsurface VOCsare present or for areally mapping subsurface VOCs.
• Useful for directing drilling efforts.• Used at a variety of sites as tool in places
where contamination is suspected but little or no subsurface information is available.

5
What types of VOCs are appropriate?
• Typically VOCs with a log Kow of 0.5-3• Previous investigations have found:
– PCE, TCE, cDCE, VC– PCA, TCA, CT– Benzene, toluene, ethylbenzene, xylene
isomers, MTBE

6
Advantages (1 of 3)
• Adantages:1. Can provide information in areas where
access is limited (cultural influences, vegetation cover)
2. Applicable to a wide variety of common ground-water VOC contaminants (chlorinated solvents and petroleum hydrocarbons)
3. Presence of VOCs in tree cores is a strong indicator of subsurface VOCs.

7
Advantages (2 of 3)4. Sometimes can be used to detect VOCs in
soil gas.5. Can detect VOCs at relatively low
concentrations. Schumacher and others, (2004) detected PCE in tree cores where ground-water PCE was as low as 8 μg/L.
6. Rapid, simple method.7. Can be field analyzed or analyzed later.8. If analyzed later, the samples can be stored
without refrigeration.
References of tree coring related to soil gas: Struckhoff, 2003; Shumacher and others, 2004; Struckhoff and others, 2005; Vroblesky and others, 2006; 2008.
7

8
Advantages (3 of 3)9. Inexpensive method. Borers cost a few
hundred dollars and can be used indefinitely.
10. Minimum amt. of field equipment required. (Coring tool and bottles)
11.Sometimes tree-core parent/daughter VOC ratios can indicate areas of subsurface dechlorination.
12.Trees sample a large areal volume.
9
Limitations (1 of 2)1. Absence of VOC detection in tree cores
does not mean there are no VOCs in the subsurface.
2. Tree-core VOC concentrations provide only a generalized quantification of subsurface VOC concentrations.
3. Trees readily recover from coring, but care should be taken to avoid excess coring of an individual tree to reduce stress to the tree

10
Limitations (2 of 2)4. Under some conditions, rainfall and winter
dormancy can reduce VOC concentrations in tree cores.
5. A number of tree-related VOCs elute early on a typical short-column field gas chromatograph, potentially obscuring early eluting VOCs, such as vinyl chloride.

11
Methodology for Collection of Tree Cores for VOC analysis

12
Mark the tree to facilitate returning to it.• “engraved” aluminum tag, tree
paint, wooden stake, flagging, etc., depending on esthetic issues and how long the tag needs to last.
Take notes•Location info: date, time, site, tree ID, etc.•Tree info: species, stress indicators, diameter, etc.•Core info: height of core, side of tree, unusual characteristics, etc.

13
Tree CoringCollect cores from about the same height for the sake of comparison.
In general, a core near the ground can have higher VOC concs. than a core farther up the trunk, but for ease of collection, a simple approach is to use mean breast height (about 4.3 ft from the base).
13

14
How deep to core?B. Diffuse-porouswoodA.Nonporouswood C. Ring-porouswood
•Water transport takes place in the outermost part of the trunk, so you don’t have to core deep (not more than 2 to 3 inches).
•In ring-porous wood, such as oak, nearly all of the transpiration water moves through the outermost growth ring.
•In nonporous trees, such as pines, water transport is through several growth rings.
•In general, core length should be consistent across a particularstudy site and should be about the length of the sample jar being used.

15
Teeth on the core extractor

16
Core removal from core barrel: When you reach the coring depth, insert the
extractor, turn the coring tool ½ turn outward to break the core off, and pull it out.

17
Transfer the tree core to a vial

18
Cap the vial with Teflon–lined seal

19
20 mL
Or use standard VOA vial (just remember that they are made for water, not gases)
Crimp cap on vial
40 mL

20
Tree core in vial
In general, the vials tend to begin fogging up within seconds of capping, indicating vapor transfer to the headspace.

21
Post-coring tree care• Sealing the tree core hole probably is not needed
and sometimes can be harmful.• The open hole can allow decay and disease, but
plugging the hole does little to reduce discoloration or decay.
• In general, healthy trees (particularly conifers) respond well to coring by self sealing and creating chemical barriers.
• So a practical approach is to leave the core hole unsealed.
22
Quality Control
• Collect 10% duplicate samples (a second core slightly below the first core).
• Collect an air blank sample.• Collect samples of background trees for
each species to assure that the “contaminant” identification is not simply a natural VOC associated with the tree.

23
23
Increasing equilibration time
Tree T2b
0.08
0.25 0.4 26
0
10000
20000
30000
40000 Tree T1
2 4 26
TCE,
ppb
/v
0500
10001500200025003000
Equilibration time, in hours
4/18
/200
65/
3/20
07 Tree T100
0.1
0.13 29
29.5
0102030405060
Tree T802
0.08
0.08
1 24 27
0
200
400
600
800
1000
Day 0 Day 1
How long should the vials equilibrate before analysis?
Vroblesky and others, 4th Int. PhytotechnologiesConference, Denver, CO., September 24-28, 2007.
TCE in unheated cores over time
In some cases the tree VOC HSA concentration did not substantially change from 5 minutes after sampling to the next day. In other cases, the VOC concentration dramatically increased. The differences could be due to many factors, including the ambient temperature and how hot the core barrel became from friction during coring.

24
24
Comparison of tree-core equilibration after 1 day and 19 days
Vial number1 2 3 4 5 6 7 8 9Tr
ichl
oroe
then
e, in
par
tspe
r bill
ion
by v
olum
e
0
2000
4000
6000
8000
10000 24 hours19 Days
Vroblesky and others, 4th Int. Phytotechnologies Conference, Denver, CO., September 24-28, 2007.
In a comparison test, TCE concentrations did not increase enough over 19 days to make it worth waiting more than 24 hours.

25
Sample analysis approaches• Headspace analysis (HSA)
– Simple, cheap, probably sensitive enough for most shallow TCE ground-water plumes
• Methanol extraction: – Produces higher TCE concentrations than HSA, but costs more. – Extracts more than just the volatiles.
• Activated carbon (contact Joel Burken)– Very sensitive, but more expensive than HSA– Uses the corehole rather than the core.
• Field colorimetric gas-detector tubes– Very quick and easy, but useful only at high concentrations

26
Headspace sampling of vial

27
Inject the headspace into a gas chromatograph

28
Typical chromatograph of tree core showing chlorinated solvents
There typically are early eluting chromatographic peaks associated with natural volatile compounds in the tree.
28
29
29
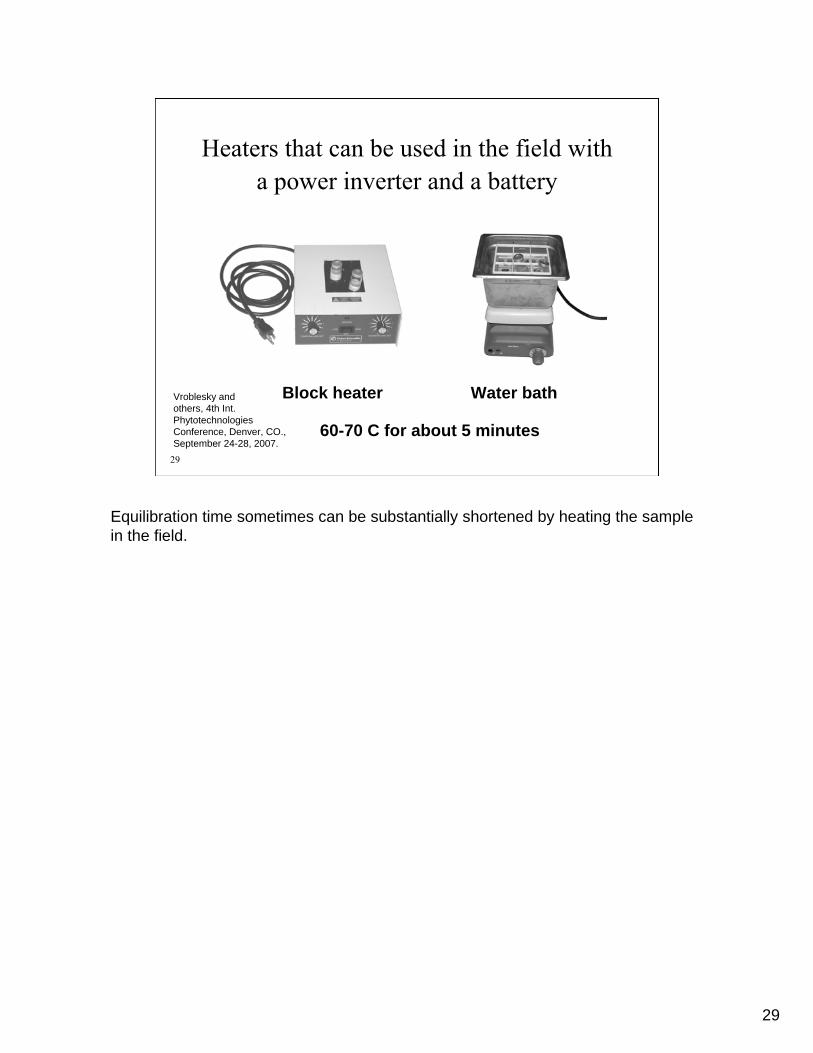
Heaters that can be used in the field with a power inverter and a battery
Block heater Water bath
60-70 C for about 5 minutes
Vroblesky and others, 4th Int. PhytotechnologiesConference, Denver, CO., September 24-28, 2007.
Equilibration time sometimes can be substantially shortened by heating the sample in the field.

30
30
Comparison of field heated and analyzed tree cores to unheated tree cores analyzed after 24 hours
TCE(r2=0.936)
1 10 100 100010000
100000Fiel
d he
ated
, ppb
/v
1
10
100
1000
10000
100000PCE
0 20 40 60 80 100 120 1400
20406080
100120140
24-hr stabilization, ppb/v
South Carolina Connecticut
1:1 correspondence
Vroblesky and others, 200, USGS SIR2007-5212.

31
31
Comparison of field heated to unheated tree cores 5 min. after collection
(NWS Charleston SWMU17)
Vroblesky and others, 4th Int. Phytotechnologies Conference, Denver, CO., September 24-28, 2007.
Typicalreporting limit
02468
1012
TCE
, ppb
/v
020406080
100120140
0
400
800
1200
Not
det
ecte
d
Tree T100 Tree T802
Unheated Heated (70 oC)
Tree T807

32
Field analysis
• Field analysis can be used to direct the tree coring effort and optimize plume mapping.
• Heating the cores can increase the potential for VOC detection.
• Don’t heat them too much or you will volatilize tree constituents that complicate the chromatogram, potentially have vapor loss, and possibly stink up the place.

33
Colorimetric device
For very high concentrations (>1 ppmv), a simple colorimetric approach can be used in the field to detect VOCs in tree cores.
33

34
Gastube from tree core
Chlorinated VOCs are presentVroblesky and others, 4th Int. PhytotechnologiesConference, Denver, CO., September 24-28, 2007.
This is a colorimetric response from a tree core done within a few minutes of core collection showing that chlorinated VOCs are present.
34

35
Comparison to field GC
We did a field comparison of our modified ColorTec method to what we would find using a typical field gas chromatograph.
35

36
Comparison of colorimetric to field GC tree-core analysis after heating
Field GC CVOCs, in ppm/v0 10 20 30 40 50
Col
or T
ec C
VOC
s, in
ppm
/v
0
2
4
6
8
r2=0.95
Difference in magnitude is because colorimetric is calibrated for water
Vroblesky and others, 4th Int. PhytotechnologiesConference, Denver, CO., September 24-28, 2007.
We got a very linear correlation between the field GC results and the simple colorimetric method at high tree-core VOC concentrations (>1 ppmv). The scale on the Color Tec axis is simply a relative scale. At
36

37
Comparison of field GC to colorimetric approach
• Good detection and relative correlation to field GC at GC vapor concentrations >1 ppmv, although the gas tubes have a different reporting scale.
• In the range of 0.7-1 ppmv (field GC), the values are at the detection limit for the colorimetric.
• CVOC concentrations <0.7 ppmv (field GC) are not detectable with the colorimetric approach. Field GCs are sensitive down to about 0.01 ppmv for TCE.
• The colorimetric method is inexpensive and easy for field analysis where tree-core concentrations are high (>1 ppm/v). (~$1500 for the reusable kit, about $5.65/analysis)
Vroblesky and others, 4th Int. Phytotechnologies Conference, Denver, CO., September 24-28, 2007.
37

38
38
Selected factors influencing VOC
concentrations in tree cores

39
39
TCE concentrations in tree cores are partly a function of TCE concentrations in ground water
(Carswell Golf Course, TX)
Oak trees
Vroblesky and others, 2004, GWMR, v. 24, p. 124-138

40
40
TCE concentrations around the trunk near the edge of a plume
10,000 μg/L 1,000 μg/L
100 μg/L
TCE in gw
Forest
(SWMU12, NWS Charleston, 2000)
1,975 ppb 1,925 ppb
6,025 ppb5,087 ppb
Vroblesky and others, 2004, GWMR, v. 24, p. 124-138
Concentrations in this tree were substantially higher on the side facing the main body of contamination. This may not always be true because in some trees, upward movement of water spirals around the tree.

41
41
Differences in TCE concentrations relative to water-table depth
29-39 μg/L200 μg/L
99 ppbv2,191 ppbv
24 ft
PJ1
PJ3
Air Force Plant PJKS, CO (1999)
Vroblesky and others, 2004, GWMR, v. 24, p. 124-138
41
More intimate contact between the tree roots and the contaminated water can produce substantially higher tree-VOC concentrations than in a tree whose roots are more vertically distant from the contaminated water. This is partly because the tree in less intimate contact with the contaminated water probably has other sources of water (such as recharge capture).

42
42
Comparison of TCE in adjacent cottonwood and willow.
Carswell Golf Course
Vroblesky and others, 2004, GWMR, v. 24, p. 124-138
TCE
(nM
/L)
0
100
200
300
400
500
600
700
Tree 3Cottonwood
Tree 2Willow
These trees are adjacent to each other and have similar TCE concentrations, despite being different species. However, they are both diffuse porous, so they probably move water in similar ways.

43
43
Species comparison: TCE in adjacent trees, SRS, 1998
TCE
(nM
/L)
0
1000
2000
3000
4000
oak pine
TCE
(nM
/L)
0500
1000150020002500
T11
T12
T7
T25
T34
oak pine
TCE
(nM
/L)
0200400600800
1000
T13
T32
pines
TCE
(nM
/L)
0200400600800
1000T31
T30T29
T33T14
T32
T14
OakPineCypressSweet gum
sweet gums
oak pine cypress
Vroblesky et al.,1999, ES&T, v. 33, p. 510-515.
These graphs represent clusters of closely spaced trees of differing species. In general, pines and cypress contained more TCE than oaks and sweet gum.

44
Trees have higher VOC concentrations in the summer than in the winter
44
45
45
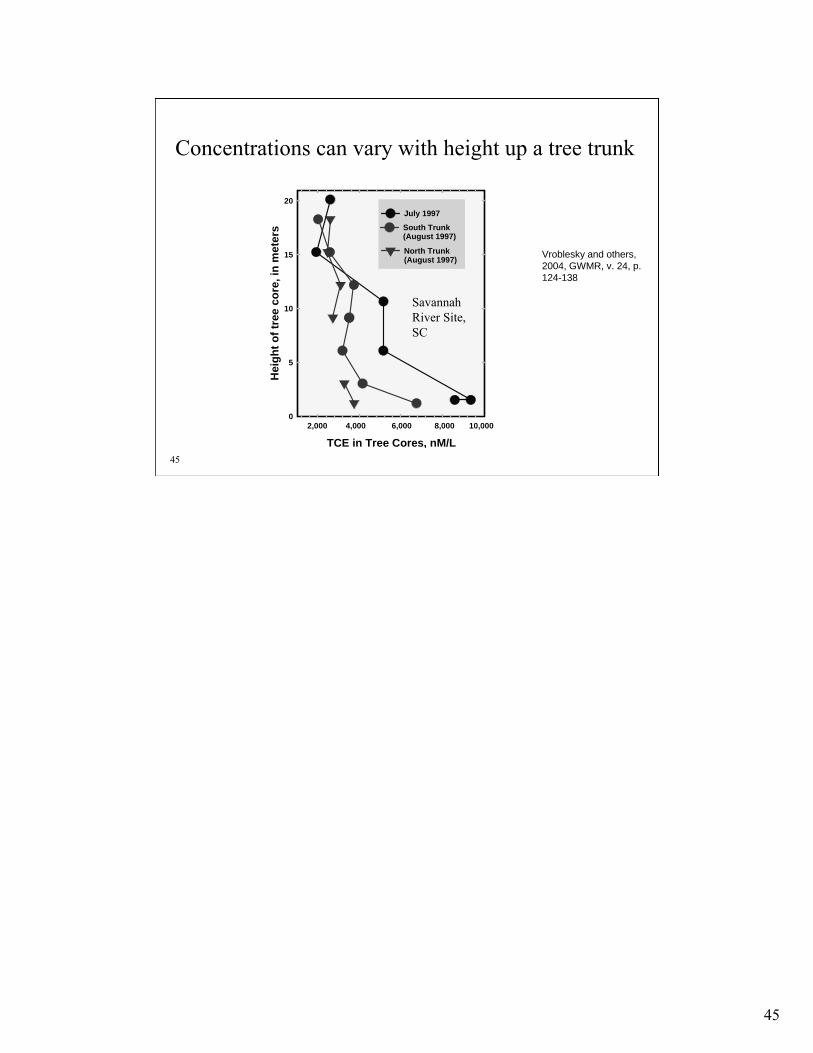
TCE in Tree Cores, nM/L
Hei
ght o
f tre
e co
re, i
n m
eter
s
0
5
10
15
20
2,000 4,000 6,000 8,000 10,000
July 1997
South Trunk(August 1997)
North Trunk (August 1997)
Savannah River Site, SC
Vroblesky and others, 2004, GWMR, v. 24, p. 124-138
Concentrations can vary with height up a tree trunk

46
46
Eastern Cottonwood, Carswell Golf Course, Texas

47
47
VOCs up tree after rainstorm, Carswell, TXTCE
ppbv60
0
800
1000
c-1,2-DCE
300
500
700
Hei
ght o
f cor
e (ft
)
0
10
20
30
40
50
60After Rainstorm After Rainstorm
ppbv

48
48
VOCs up tree before and after rainstorm, Carswell TX
TCE
ppbv60
0
800
1000
c-1,2-DCE
300
500
700
Hei
ght o
f cor
e (ft
)
0
10
20
30
40
50
60After Rainstorm After Rainstorm
Before Rainstorm
Before Rainstorm
ppbv

49
49
Cottonwood instrumented for irrigation test: Carswell Golf Course, TX

50
50
M a x im u m T r a n s p ir a t io n , in k g /h r0 1 0 0 2 0 0 3 0 0 4 0 0
Hei
ght,
in ft
0
2
4
6
8
1 0
1 2
M a x im u m T r a n s p ir a t io n , in k g /h r0 2 0 0 4 0 0 6 0 0 8 0 0 1 0 0 0
Hei
ght,
in ft
0
2
4
6
8
1 0
1 2
D a y 1D a y 2 : ir r ig a te dD a y 3 : ir r ig a te dD a y 4
D a y 2 : P o s t ir r ig a t io n
D a y 1 : P r e ir r ig a t io n
Maximum Transpiration During Artificial Irrigation of Cottonwood
Clinton and others, 2004, Int. J. Remed., v. 6, p. 239-252

51
51 TCE (ppb v/v)600 800 1000 1200
Hei
ght o
f tre
e co
re, i
n fe
et
0
2
4
6
8
10
12
14Pre
IrrigationPost
Irrigation
Day1
am
Day 1 pm
Day2
Day3
Day4
Avg. TCE in Tree CoresBefore and After Artificial Irrigation
Vroblesky and others, 2004, GWMR, v. 24, p. 124-138

52
52
Tree
Tree corer
Flame
Zeikus and Ward, 1974, Methane formation in living trees: A microbial origin: Science, v. 184, no. 4142
Methanogenicbacteria can infest the interior wood of visibly healthy trees in poorly drained soils, creating methanogenicconditions within the tree
Photograph of a flame extruding from a tree corer

53
53
TCE and cDCE in the inner and outer tree core (AF Plant PJKS, Colorado)
Vroblesky and others, 2004, GWMR, v. 24, p. 124-138
TCE dehalogenation under methanogenic conditionsTCE cis-1,2-DCE
Methanogenic
This tree spit methane and water from the tree corer once the corer penetrated the inner part of the tree. Analysis of the cores showed that the inner core contained a substantial amount of methane relative to the outer core. The methanogenic conditions of the inner core were conducive to reductive dechlorination of TCE. The TCE and cDCE results from the inner core also implies inner-trunk dechlorination activity.

54
Chlorinated solvent degradation by trees
• Newman and others (1977) found that cells from poplar trees were capable of transforming and mineralizing TCE without microbes.
• Additional evidence for VOC degradation by trees includes the presence of oxidative transformation products in tree tissue (several researchers)
54

55
Field Examples

56
56
Ground-water TCE and cDCE plume under a swamp,
Savannah River Site, SC

57
57
Vroblesky and others, 1999, ES&T, v. 33, p. 510-515

58
58
cDCE and TCE in Tree Cores, SRS, Jan/Feb 1998
Swamp
Source
Source
Vroblesky and others, 1999, ES&T, v. 33, p. 510-515

59Distance along ditchbed, in feet
0 200 400 600
TC
E, i
n pp
b v/
v
0
100
200
300
400
cDC
E, i
n pp
b v/
v
0
10
20
30
40
TCEcDCE
UpstreamDownstream
Results of passive vapor samplers beneath sediment in the ditch confirmed the plume extent defined by the tree cores.
59

6060
cis-1,2-Dichloroethene in Tree Cores, England AFB, LA, 3/11/03
Big Bayou
Landfill
This is another site showing that trees in a swamp were capable of seeing chlorinated solvents beneath the swamp, even though the standing water was relatively uncontaminated.
60

61
61
Air Force Plant PJKS, Colorado

62
62
Air Force Plant PJKS, Colorado

63
63
DI-1 Tributary
East Fork
Brush Creek
Alluvial Aquifer
TCE in GW
Vroblesky and others, 2004, GWMR, v. 24, p. 124-138
63

64
64
SWMU12, NWS Charleston, SC

65
65
1 ft of tight soil overlying about 10 ft of plastic clay (shown below). Well 12MW-29S,
SWMU12

66
66
Clay
Clayey sand
Sand
Sand
Land surface
15
10
10
5
2020 30
0
Dep
th (f
t)
Feet
VOCs
NWS Charleston, SC.About 6 to 10 ft of tight clay above the aquifer

67
67
TCE in ground water (μg/L), SWMU12, NWS Charleston
Forest
Swamp
Vroblesky and others, 2004, GWMR, v. 24, p. 124-138

68
68
Forest
Swamp
TCE in ground water (μg/L), and cored trees SWMU12
Vroblesky and others, 2004, GWMR, v. 24, p. 124-138

69
69
TCE in ground water (μg/L), and trees containing TCE
Forest
Swamp
Vroblesky and others, 2004, GWMR, v. 24, p. 124-138

70
70
Forest
Swamp
Tree 30
Tree 2
Tree 32
Locations of selected trees, SWMU12, Charleston SC
Vroblesky and others, 2004, GWMR, v. 24, p. 124-138

71
71 Vroblesky and others, 2004, GWMR, v. 24, p. 124-138
Changes in TCE over time in trees,
SWMU12, Charleston SC
Tree SC30
2000 2001 2002 2003
TCE
in tr
ee c
ores
,in
ppb
vol
10
100
1000
Tree SC2
Tree SC32
Trees

72
72
SWMU17, NWS Charleston

73
73
SWMU17, NWS Charleston,SC
400 feet
SWMU17

74
74
2001, 2002 wells SWMU17
110 ppb PCE
31,000 ppb TCE
Data from Tetra Tech NUS
190 ppb PCE61 ppb PCE

75
75
Potential source areas, SWMU17
Trenches
Shallow pit

76
76
Water levels, low tide, SWMU17
Data from Tetra Tech NUS

77
77
Water levels, high tide, SWMU17
Data from Tetra Tech NUS

78
78
SWMU17, NWS Charleston SC

79
79
Locations of cored trees
Vroblesky and others, 2004, GWMR, v. 24, p. 124-138

80
80
PCETCEcDCEND
VOCs from tree cores
Vroblesky and others, 2004, GWMR, v. 24, p. 124-138

81
81
PCE
TCE
PCETCEcDCEND
Plumes inferred from tree cores
PCE
TCE
Vroblesky and others, 2004, GWMR, v. 24, p. 124-138

82
82
Locations of temporary wells
New Temporary wells in red
Vroblesky and others, 2004, GWMR, v. 24, p. 124-138

83
83
TCE>100 ppbPCE>100 ppb
TCE>1,000 ppb
Plumes determined by well sampling
Data from Columbia Technologies

84
84
TCE>100 ppbPCE>100 ppb
TCE>1,000 ppb
GW plumes detected in wells and tree cores

85
Merriam Manufacturing Company Property, CT (tree cores and soil gas)

86
Merriam Manufacturing Company Property information
• Types of trees and shrubs– Maple, Catalpa, Mulberry, Sumac– Mostly small trees and shrubs
• (diam=2.2 to 4 inches) (one tree was 40 inches)• Depth to water= 15 to 20 ft• Rooting depth of Mulberry
– 1-2 ft in well drained soil (Peper, 1998)– 7.9 ft (but 70% of roots were in the top 2 ft) (Bunger and
Thompson (1938)– 3.9 ft (but 70% of roots were in the top 2 ft)(Olson and Fletcher,
1999; Olson and others, 2001)– Mulberry TCE probably from vadose contamination (Struckoff and
others, 2005); less likely to be hydraulic lift (Richards and Caldwell, 1987)

87
Comparison of field-analyzed 111TCA in 2007 trees and shrubs to 2004 soil-gas 111TCA
Vroblesky and others, 2008, USGS SIR 2007-5212

88
Comparison of field-analyzed TCE in 2007 trees and shrubs to 2004-2006 soil-gas TCE
Vroblesky and others, 2008, USGS SIR 2007-5212
Analyzing the tree onsite with field heating provided sufficient concentrations to identify zones of relatively high and low VOC concentrations.The tree-core VOC concentrations in the shallow-rooted species probably were derived from horizons shallower than the water table.
88

89
Merriam Manufacturing Company Property
• Analyzing the tree onsite with field heating provided sufficient concentrations to identify zones of relatively high and low VOC concentrations.
• The tree-core VOC concentrations in the shallow-rooted species probably were derived from horizons shallower than the water table.

90
90
SUMMARY
• Tree coring is a simple, rapid, inexpensive reconnaissance tool for examining VOC contamination in ground water
• It has application in a variety of environments

91
After viewing the links to additional resources, please complete our online feedback form.
Thank You
Links to Additional Resources
Feedback Form