treatment of solar generation in electric utility...
TRANSCRIPT
NREL is a national laboratory of the U.S. Department of Energy Office of Energy Efficiency & Renewable Energy Operated by the Alliance for Sustainable Energy, LLC
This report is available at no cost from the National Renewable Energy Laboratory (NREL) at www.nrel.gov/publications.
Contract No. DE-AC36-08GO28308
Treatment of Solar Generation in Electric Utility Resource Planning John Sterling Solar Electric Power Association
Joyce McLaren National Renewable Energy Laboratory
Mike Taylor Solar Electric Power Association
Karlynn Cory National Renewable Energy Laboratory
Technical Report NREL/TP-6A20-60047 October 2013

NREL is a national laboratory of the U.S. Department of Energy Office of Energy Efficiency & Renewable Energy Operated by the Alliance for Sustainable Energy, LLC
This report is available at no cost from the National Renewable Energy Laboratory (NREL) at www.nrel.gov/publications.
Contract No. DE-AC36-08GO28308
National Renewable Energy Laboratory 15013 Denver West Parkway Golden, CO 80401 303-275-3000 • www.nrel.gov
Treatment of Solar Generation in Electric Utility Resource Planning John Sterling Solar Electric Power Association
Joyce McLaren National Renewable Energy Laboratory
Mike Taylor Solar Electric Power Association
Karlynn Cory National Renewable Energy Laboratory
Prepared under Task No. SM13.1570
Technical Report NREL/TP-6A20-60047 October 2013

NOTICE
This report was prepared as an account of work sponsored by an agency of the United States government. Neither the United States government nor any agency thereof, nor any of their employees, makes any warranty, express or implied, or assumes any legal liability or responsibility for the accuracy, completeness, or usefulness of any information, apparatus, product, or process disclosed, or represents that its use would not infringe privately owned rights. Reference herein to any specific commercial product, process, or service by trade name, trademark, manufacturer, or otherwise does not necessarily constitute or imply its endorsement, recommendation, or favoring by the United States government or any agency thereof. The views and opinions of authors expressed herein do not necessarily state or reflect those of the United States government or any agency thereof.
This report is available at no cost from the National Renewable Energy Laboratory (NREL) at www.nrel.gov/publications.
Available electronically at http://www.osti.gov/bridge
Available for a processing fee to U.S. Department of Energy and its contractors, in paper, from:
U.S. Department of Energy Office of Scientific and Technical Information P.O. Box 62 Oak Ridge, TN 37831-0062 phone: 865.576.8401 fax: 865.576.5728 email: mailto:[email protected]
Available for sale to the public, in paper, from:
U.S. Department of Commerce National Technical Information Service 5285 Port Royal Road Springfield, VA 22161 phone: 800.553.6847 fax: 703.605.6900 email: [email protected] online ordering: http://www.ntis.gov/help/ordermethods.aspx
Cover Photos: (left to right) photo by Pat Corkery, NREL 16416, photo from SunEdison, NREL 17423, photo by Pat Corkery, NREL 16560, photo by Dennis Schroeder, NREL 17613, photo by Dean Armstrong, NREL 17436, photo by Pat Corkery, NREL 17721.
Printed on paper containing at least 50% wastepaper, including 10% post consumer waste.

iii
This report is available at no cost from the National Renewable Energy Laboratory at www.nrel.gov/publications.
Acknowledgments This paper was prepared by the National Renewable Energy Laboratory (NREL) and the Solar Electric Power Association (SEPA), who worked together to engage utilities directly to research solar in long-term utility planning and author this report. NREL managed the project, directed research, and led analysis of results. NREL is a national laboratory of the U.S. Department of Energy Office of Energy Efficiency & Renewable Energy Operated by the Alliance for Sustainable Energy, LLC. SEPA is a 501 (c)(3) educational non-profit research organization that delivers the latest actionable information to help members (utilities, developers, manufacturers and installers) implement solar business plans, get smarter about the changing energy sector, meet peers, and exchange ideas.
NREL and SEPA would like to thank the following individuals and companies for providing valuable input, insights, and feedback throughout this project: James Wilde (Arizona Public Service); Myron Rollins, Bradley Kushner, Mon Hong, Ryan Pletka, Tim Mason, and Scott Olson (Black & Veatch); Andrew Mills (Lawrence Berkeley National Laboratory); Tom Stanton (National Regulatory Research Institute); Jennifer Szaro (Orlando Utilities Commission); Pat O’Connell (Public Service Company of New Mexico); Bob Long (SCANA); Jon Bertolino (Sacramento Municipal Utility District); Gary Brinkworth (Tennessee Valley Authority); Brad Harrison, Norm Richardson, and Eric Hughes (Ventyx); David Berry (Western Resource Advocates); and additional contributors who choose to remain anonymous. We also are grateful to Mark Dyson (NREL) for providing insights and some text about capacity expansion modeling and how solar technology characterization can significantly impact the simulated value of solar generators.
We would also like to thank the report’s peer reviewers for their expert advice and counsel, including many of the utility industry individuals we interviewed or that answered our questionnaire, as well as Lori Bird, Jaquelin Cochran, Lynn Billman, Maggie Mann and Douglas Arent of NREL. Finally, we would like to thank our project sponsors, Chris Nichols and Kelly Knutson of the U.S. Department of Energy SunShot program. We offer our appreciation to Anthony Castellano and Jim Leyshon for providing support on some of the graphics and to NREL Communications for providing editorial support.

iv
This report is available at no cost from the National Renewable Energy Laboratory at www.nrel.gov/publications.
List of Acronyms and Abbreviations AC alternating current APS Arizona Public Service CA IOUs California investor-owned utilities CEM capacity expansion model CPV concentrating photovoltaics CSP concentrating solar power DC direct current DG distributed generation DOE Department of Energy Duke Duke Energy EE energy efficiency EERS energy efficiency resource standard ELCC Effective Load-Carrying Capability GHG greenhouse gas Idaho Idaho Power IID Imperial Irrigation District IRP integrated resource plan IOU investor-owned utility ITC Investment Tax Credit LADWP Los Angeles Department of Water and Power LBNL Lawrence Berkeley National Laboratory LOLP Loss of Load Probability MW megawatt MWh megawatt-hour NEM net energy metering NREL National Renewable Energy Laboratory NVE NV Energy (Nevada) PCM production cost model PGE Portland General Electric PNM Public Service of New Mexico PPA purchased power agreement PSCo Public Service of Colorado PV photovoltaic PVRR Present Value Revenue Requirements RE renewable energy (or electricity) RFP request for proposals RPS renewable portfolio standard SCANA An electric and gas utility in SC and NC SEPA Solar Electric Power Association SREC solar renewable energy credit T&D transmission and distribution TEP Tucson Electric Power TMY typical meteorological year Tri-State Tri-State Generation and Transmission Association

v
This report is available at no cost from the National Renewable Energy Laboratory at www.nrel.gov/publications.
Executive Summary Today’s utility planners have a different market and economic context than their predecessors, including planning for the growth of renewable energy. State and federal support policies, solar photovoltaic (PV) price declines, and the introduction of new business models for solar PV “ownership” are leading to increasing interest in solar technologies1 (especially PV); however, solar introduces myriad new variables into the utility resource planning decision. Most, but not all, utility planners have less experience analyzing solar than conventional generation as part of capacity planning, portfolio evaluation, and resource procurement decisions. To begin to build this knowledge, utility staff expressed interest in one effort: utility exchanges regarding data, methods, challenges, and solutions for incorporating solar in the planning process. Through interviews and a questionnaire, this report aims to begin this exchange of information and capture utility-provided information about: 1) how various utilities approach long-range resource planning; 2) methods and tools utilities use to conduct resource planning; and, 3) how solar technologies are considered in the resource planning process.
The National Renewable Energy Laboratory (NREL) and the Solar Electric Power Association (SEPA) worked together to engage utilities directly to research this topic and author this report. An advisory council of electric industry experts guided the methodology used and provided feedback on draft analysis. The main sources of information captured in this report were predominantly from utilities. The authors conducted interviews with electric sector representatives from 13 entities (9 of which were utilities) and developed a utility questionnaire that secured more specific modeling data sources and methodologies from 28 utilities in 22 states. Key questions from the questionnaire and a summary of utility responses are included in Appendix B.
Resource Planning Background Integrated resource plan (IRP) procedures and long-term planning refer to the processes utilities2 take to evaluate a wide range of potential supply- and demand-side resource options to meet energy (MWh) requirements and peak demand (MW), plus a reserve margin. Utilities look for the best set of future decisions to reliably serve customers and meet regulatory requirements over a long-term period, usually approximately 20 years. This process is traditionally designed to maintain reliability and meet load at the lowest reasonable cost (i.e., least-cost). In recent decades, IRP processes have included other factors, including renewable energy mandates. Additionally, some utilities have recognized that generation diversity provides direct benefits and utilities have started to place increased emphasis on lowering risk and uncertainty of future regulations and fuel prices, on “affordable” costs, or other non-cost metrics (unless prevented by state law or statute). Valuing diversity and considering the risk of the status quo is one way utilities are starting to incorporate non-cost metrics in decision-making. Some utilities note that an exclusive focus on least-cost may not yield the optimal portfolio of resources.
1 This report considers distributed solar PV, utility-scale solar PV with and without tracking, concentrated solar power with and without storage, PV with battery storage, and concentrating PV. Because distributed PV and fixed-axis utility-scale PV are the dominant applications in the market, these technologies are the main focus. 2 For the purposes of this report, “utility” refers to any entity that engages in long-term supply- and demand-side planning to serve the load requirements of its customers. This typically applies to vertically-integrated utilities, which may include investor-owned utilities (IOUs), municipal utilities, and electric cooperatives.
vi
This report is available at no cost from the National Renewable Energy Laboratory at www.nrel.gov/publications.
Through interviews and a questionnaire, the authors gathered information on utility supply planning. Utilities were asked to provide their resource planning process details, key assumptions (e.g. whether DG is represented as supply or negative load), modeling methodology (e.g. type of risk analytics and candidate portfolio development), and capacity expansion and production simulation model software. Utilities performing the most detailed long-term planning3 include the following steps (and within steps there are many variations):
1. Evaluate State Policies and Mandates. Evaluate state laws and regulations that influence future electricity demand and supply (e.g. efficiency and renewable energy mandates), because they impact the amount and timing of new supply procurement needs and the characteristics of demand increases through the year and over time.
2. Review Existing Generation Fleet. Consider existing baseload, intermediate, peaking, and variable renewable generation that is owned or under a power purchase agreement (PPA).
3. Forecast Load. Study each customer class and forecast current and future energy and demand requirements. Roll up the forecasts to determine peak demand periods on a daily, monthly, seasonal and annual basis. Attempt to anticipate future disruptive changes that could increase demand (e.g., plasma televisions and electric vehicles), decrease demand (e.g., energy efficiency program success), or moderate demand (e.g., smart meters, load shifting/shedding).
4. Plan Capacity Expansion. Analyze options for meeting long-term demand using either capacity expansion modeling or engineering judgment. Popular commercial models include Strategist, System Optimizer (previously known as Capacity Expansion), AURORAxmp and EGEAS, although a few utility interviewees use in-house models. These models can include one or more specific constraints, such as: specific resource limits, minimum renewable requirements, transmission plans and capabilities, resource restrictions, and forced plant additions or retirements. Generally speaking, the goal of the capacity expansion process is to minimize future costs, given the constraints in question. While not always available in commercial models, there are a wide range of supply- and demand-side technologies and a variety of configurations possible. Utilities interviewed wish more technology options were available in commercial models. Most utilities consider scenarios/plausible futures that need to be tested (e.g., forced plant retirements, carbon tax, or high natural gas prices) to ensure a robust process.
5. Production Cost Modeling. Simulate hourly dispatch over the entire planning horizon and perform complex sensitivity analyses by: 1) using Monte Carlo simulation to randomly change multiple key input variables hundreds or even thousands of times; 4 2) varying single variables to examine specific impacts of major assumptions on a portfolio; or 3) a combination of both. Variables that can be modified include fossil fuel prices, wholesale market prices, load, environmental costs, renewable energy levels, hydro availability, energy efficiency, and incentive availability.
3 Based on interviews and questionnaire results, it appears that most – but not all – utilities take the steps detailed here. For each step, utilities use different levels of detail, models or alternative calculation methodologies. The differences in the baseline supply planning processes were stark enough to capture the different methodologies used, as they provide a basis for including solar in long-term planning. 4 For simplicity, the terms Monte Carlo simulations and stochastic modeling are used interchangeably in this report.

vii
This report is available at no cost from the National Renewable Energy Laboratory at www.nrel.gov/publications.
6. Select Portfolio. Select a portfolio, in which key metrics for each mix of future resources are tracked for comparison purposes. Metrics include revenue requirements, capital expenditures, emissions, fuel diversity, water usage, and average system cost. Future risk (including generator diversity and potential regulations) is a more recent metric used by some utilities to incorporate potential future risks into today’s decision-making. To select a resource portfolio that is both low cost and resilient to upward price risk, utilities can focus on the expected Present Value Revenue Requirements (PVRR) as well as the potential price risk (or risk tail, represented by the upper 5% of PVRRs or some other value).
Inclusion of Solar in Resource Planning Processes Through interviews and a questionnaire, the authors gathered information on solar project representation in long-term utility plans (project size, capacity value and integration cost adder).
Interviewees gathered solar PV profile and cost information from a variety of sources. Solar generation profiles were either taken from existing operational solar plants, or from external sources like PVsyst or NREL’s PVWatts program, which provide a typical year of data for a limited number of specific locations. While there is interest in the combination of storage and PV, storage is not modeled in long-term planning by the majority of utility interviewees, because utilities feel they need more credible data and analysis before storage can be successfully incorporated.
Solar cost information was less consistent – and there were big questions about the future, especially for PV technologies. Some utilities interviewed believed that U.S. Department of Energy SunShot goals for PV may be achieved by 2020; others said costs will continue to go down but at a slower pace, and still others said that solar costs have reached their minimum and will flatten out for the foreseeable future. These solar PV cost assumptions are reflected in their solar cost assumptions used in their long-term planning. Notably, utilities indicated they would like more credible estimates of future solar PV prices, because predicting future solar PV prices is considered a key uncertainty, especially over a multi-decade planning horizon. While prices have come down rapidly, questions remain about how long the prices will continue to decline and when they will bottom out (or if they already have).
One key question discussed at length with interviewees was the capacity value utilities attribute to the addition of solar capacity on their system. In essence, a solar generator’s capacity value is the percentage of its nameplate capacity that is anticipated to be reliably available to meet daily and seasonal peak demand, and is a region-specific metric.5 Fully dispatchable conventional generation can be called upon to meet load as it fluctuates throughout the day and year. In contrast, the most commonly deployed solar technology, fixed-axis solar PV, generates only when the sun is available. Maximum energy production is mid-day; as the sun sets the production capability can diminish rapidly, depending on the panel orientation (westward panels can moderate this impact, although overall production is likely reduced). Most utilities peak later in the afternoon (e.g., between 4-6 p.m. in the summer months), so solar energy may not correlate perfectly with a utility’s need, depending on their specific situation (e.g., latitude, 5 Utility resource planners interviewed in this report routinely referred to the percentage of nameplate assigned to solar or other variable resources as its “capacity value”. The authors chose to use this term rather than “capacity credit”, which is also an acceptable industry term for this characteristic.

viii
This report is available at no cost from the National Renewable Energy Laboratory at www.nrel.gov/publications.
insolation). Different solar technology configurations can moderate this potential for rapid impact through the addition of storage, or PV tracking (one or multiple axes).
Figure ES 1 shows the ranges of capacity values attributed to a variety of solar configurations, based on questionnaire responses. 60–76% of respondents assigned some capacity value to the first three solar PV configurations, ranging from 0–60% for fixed PV and up to 80% with tracking. Conversely, only 26–44% of utility respondents assigned any capacity value to CSP (with or without storage), PV with battery storage or concentrating photovoltaics (CPV); 56–74% used a 0% capacity value.6
Note: Numbers in circles represent the number of utility responses Figure ES 1. Range of solar capacity values used in planning analysis, by technology,
provided by utility questionnaire respondents
A few other considerations for including solar in resource planning were briefly discussed during interviews, including solar integration costs (the costs to manage solar variability with other generating resources, typically $2-11/MWh – as indicated by utility IRPs investigated by LBNL (Mills and Wiser 2012)), whether to treat customer-sited distributed generation as net load
6 These utilities either have no or virtually no solar on their systems today, or have specifically stated that they have not determined the capacity value assigned to solar at this time.

ix
This report is available at no cost from the National Renewable Energy Laboratory at www.nrel.gov/publications.
(typical) or as a resource (just starting), and ways to link long-term resource planning with power procurement through request for proposal processes.
A number of key challenges of incorporating solar into supply planning analysis were raised during the utility interviews. Most of these utilities have not experienced notable levels of solar PV, CSP or CPV penetration, and have not always modeled solar in their IRP studies. Most utilities expressed an interest in incorporating and refining distributed- and utility-scale solar PV in their modeling (since they anticipate more PV coming onto their system in the next decade), although some utilities noted that CSP and CPV are not appropriate technologies for their service territories. Several utilities mentioned that they participated in this project specifically to learn from their peers about best practices.
Improving Solar Within Utility Supply Planning Utility interviewees identified a number of benefits and challenges associated with solar technology, listed in Table ES 1 and described in more detail in the report. And with declining technology costs and increasing customer interest, the participants stated that they are likely to include solar PV as a resource in their forthcoming plans.
Table ES 1. Benefits and Challenges of Solar, Based on Utility Interviews
With these benefits and challenges in mind, utilities can more accurately incorporate solar generation into their long-term planning processes. The following list highlights some of the leading, utility-identified best-practices and analysis needs discussed in Sections 4 and 5 of this report:
1. Analyze and assign appropriate capacity values to solar resources – While not always available at 100% of potential output when a utility’s demand peaks, solar generation provides some ability to meet that peak. Utilities can carry out capacity valuation analyses for solar resources that are specific to their system and region (PV with or without tracking and with or without storage, CSP with or without storage and CPV). For PV, differentiation between fixed tilt and tracking systems will clarify results. Further, utilities can update all solar values on a routine basis as penetrations increase
Benefits of Solar
• Meet renewable standard requirements
• Fuel diversification • Cost stability • Geographic dispersal benefits and
modularity • Partial correlation with peak demand • Mitigation of environmental
compliance risks • Avoid line losses (typically DG only)
Challenges of Solar
• Variableand uncertain output • Ramping issues • Economics • Lack of current capacity need • Cross-subsidization concerns (DG) • Reduced capacity benefit over time
with increasing solar penetration

x
This report is available at no cost from the National Renewable Energy Laboratory at www.nrel.gov/publications.
(which may result in declining capacity values over time). Consider the benefits of geographic diversity and be sure to include integration cost add-ons, if needed.
2. Analyze solar individually, to get more accurate aggregate results – Individual solar assets are subject to output variability relative to the specific conditions at their sites; however, when solar generation is aggregated across multiple systems in various sites this variability becomes substantially reduced. For long-term planning purposes, consider aggregating individual solar profiles to create a more accurate aggregated geographic dispersion of specific systems.
3. Improve modeling assumptions and methods – If not modeled accurately, the inclusion of solar can yield erroneous results. Based on analysis experience to date, results can be skewed when solar is added to previously-optimized generation portfolio, decreased marginal capacity credit is not accounting for with higher solar penetrations, neighboring utility activities are unaccounted for, or accurate thermal generator operating limits are not appropriately captured.
4. Pursue sub-hourly sensitivities – The vast majority of production cost modeling work undertaken today is done based on an hourly dispatch over the planning horizon. Attempting to run those same models on a more granular level (such as 15-minute dispatch) would prove both time-consuming and computer-intensive. As an alternative, utilities can consider modeling sample periods (such as one week a season for each planning year) on a more granular sub-hourly basis. This approach could provide insight into the integration issues caused by variable resources like solar, show the impacts to generation ramping, dispatch, and system operations, and lead to refinements in the amount of flexible resources or energy storage included in future portfolios of resources.
5. Evaluate whether to treat distributed generation as a resource – The majority of utilities today treat distributed generation (DG) resources as a net load impact. This approach, while acceptable, in essence embeds distributed solar penetration variability within the utility’s load forecast. Utility load is one of the key drivers of long-term supply planning, so combining DG and actual load forecast may make it harder to determine the impact of either alone. Alternatively, it might make sense to analyze solar DG as a resource that can be dynamically added in capacity expansion models. Utilities can then test how changes to key input variables impact the cost viability of distributed solar resources, and begin to optimize the amount of DG they want to target in the future.
6. Utility-identified analysis needs – Finally, utilities identified a number of key analysis needs that would better inform their supply planning, including:
• Credible PV price and performance data (preferable from other utilities or another third-party; not from industry)
• Analysis of how to incorporate geographically diversified resources into modeling o Example: Instead of one 50 MW PV plant; model ten 5 MW PV across territory
• Analysis of the potential relationship between energy storage and PV • Easier ways to predict impacts of increased PV penetration • Better risk/uncertainty analysis methods (beyond scenario planning)

xi
This report is available at no cost from the National Renewable Energy Laboratory at www.nrel.gov/publications.
• Improved commercial models that include: o Currently unavailable technologies (e.g. solar PV, CPV, CSP, wind, etc.) o Intra-hour sensitivity capability o Improved performance (e.g. runtime when running sub-hourly)
• Capture distribution system impacts of DG and other technologies/activities in long-term plans (broader issue than solar)
• Clarity about when to include DG in supply modeling o What is the tipping point that will impact results? o What is net-energy metered DG’s impact on revenue requirements?7
• Supply additions during periods of low/no load growth.
7 Although the resource planning process and resulting documents are not part of ratemaking procedures, utility supply planning does occur within the broader context of utility decision-making and is impacted by the utility's overarching goals. As such, during the discussions of resource planning, the issue of the impacts of distributed generation on utility revenues and the implications for utility planning processes arose. Here we present only the results of our discussions with utility representatives, and do not holistically explore the issue of utility revenue loss resulting from distributed generation. This key question indicates that further research is needed.

xii
This report is available at no cost from the National Renewable Energy Laboratory at www.nrel.gov/publications.
Table of Contents Executive Summary .................................................................................................................................... v
Resource Planning Background ............................................................................................................. v Inclusion of Solar in Resource Planning Processes .............................................................................. vii Improving Solar Within Utility Supply Planning .................................................................................. ix
1 Introduction ........................................................................................................................................... 1 1.1 The Task for Utility Resource Planners ........................................................................................... 1 1.2 Purpose of this Report ...................................................................................................................... 1 1.3 Key Audiences ................................................................................................................................. 2 1.4 Related Research to Date ................................................................................................................. 2 1.5 Research Methodology .................................................................................................................... 2
1.5.1 Research Team .................................................................................................................. 2 1.5.2 Advisory Council .............................................................................................................. 3 1.5.3 Utility and Stakeholder Participation ................................................................................ 3
1.6 Report Organization ......................................................................................................................... 3 2 Resource Planning Process ................................................................................................................ 4
2.1 Key IRP Metrics: Least-Cost and Lowest-Risk ............................................................................... 4 2.2 The IRP Process ............................................................................................................................... 5 2.3 Electricity Supply and Demand Laws and Regulations ................................................................... 6 2.4 Existing Generation Fleet Review ................................................................................................... 7 2.5 Load Forecast ................................................................................................................................... 9 2.6 Capacity Expansion Planning ........................................................................................................ 10
2.6.1 Capacity Expansion Modeling ........................................................................................ 12 2.6.2 Engineering Judgment ..................................................................................................... 13
2.7 Production Cost Modeling ............................................................................................................. 13 2.8 Portfolio Selection ......................................................................................................................... 15
3 Inclusion of Solar in Resource Planning Processes ...................................................................... 18 3.1 Background .................................................................................................................................... 18 3.2 Solar Data ...................................................................................................................................... 18
3.2.1 Solar Profiles ................................................................................................................... 18 3.2.2 Solar Cost Information .................................................................................................... 19
3.3 Solar Capacity Valuation ............................................................................................................... 21 3.4 Additional Considerations for Solar in Resource Planning ........................................................... 25
3.4.1 Solar Integration Costs .................................................................................................... 25 3.4.2 Customer-Sited Distributed Generation .......................................................................... 25 3.4.3 From Solar Planning to Procurement .............................................................................. 25
4 Improving Solar Within Utility Supply Planning .............................................................................. 27 4.1 Utility-Identified Benefits and Challenges .................................................................................... 27
4.1.1 Solar Benefits .................................................................................................................. 27 4.1.2 Solar Challenges ............................................................................................................. 28
4.2 Utility-Identified Key Questions and Answers .............................................................................. 30 4.2.1 What Are Credible Estimates of Future Solar PV Prices and Performance? .................. 30 4.2.2 How Should Solar Capacity Be Valued? ........................................................................ 31 4.2.3 How Should Solar Resource Variability Be Considered? ............................................... 32 4.2.4 How Can Scenario Planning More Optimally Manage Risk and Uncertainty? .............. 33 4.2.5 How Can Software Models More Effectively Incorporate Solar? .................................. 33 4.2.6 Should Customer-Sited, Net Energy Metered Photovoltaics Be Treated as a Net Load in
Modeling? ................................................................................................................................ 34 4.2.7 How Should DG Impact on the Distribution System Be Managed? ............................... 35 4.2.8 How Should Net Energy Metered DG’s Impacts on Revenue Be Considered? ............. 36

xiii
This report is available at no cost from the National Renewable Energy Laboratory at www.nrel.gov/publications.
4.2.9 Can Solar Supply Planning Be More Appropriately Linked to Other Utility Planning and Operations? .............................................................................................................................. 37
4.2.10 Can Transmission and Distribution Planning Be More Appropriately Linked to Supply Planning? ................................................................................................................................. 38
4.2.11 How Can a Utility Consider Solar During Periods of Low/No Load Growth? .............. 39 4.2.12 Other Considerations for Solar in Capacity Expansion Models and Ongoing Research 39 4.2.13 Summary of Solar Supply Planning Challenges and Solutions ...................................... 42
5 Utility-Identified Analysis Needs ....................................................................................................... 43 Glossary ..................................................................................................................................................... 46 References ................................................................................................................................................. 50 Appendix A – Tennessee Valley Authority Case Study ........................................................................ 54
I. Who is TVA? ................................................................................................................................. 54 II. Envisioning the Future: Developing the TVA Scenarios ............................................................... 54 III. Developing the TVA Strategies ..................................................................................................... 55 IV. Selecting Preferred Strategies ........................................................................................................ 57 V. Involvement and Role of Distribution Companies ........................................................................ 57 VI. Renewable Energy and Energy Efficiency Program Considerations ............................................. 58 VII. Conclusion ............................................................................................................................... 58
Appendix B – Select Utility Questionnaire Responses ......................................................................... 59

xiv
This report is available at no cost from the National Renewable Energy Laboratory at www.nrel.gov/publications.
List of Figures Figure 1. States with IRP requirements as of 2011 .................................................................................. 6 Figure 2. States with RPS requirements ................................................................................................... 7 Figure 3. Load duration curve by resource category .............................................................................. 8 Figure 4. Average annual consumption growth (Net of EE/DG) ........................................................... 10 Figure 5. Sample resource selection options ........................................................................................ 11 Figure 6. Resource characteristics used in capacity expansion planning ......................................... 11 Figure 7. Common factors in PCM analytics .......................................................................................... 14 Figure 8. Key metrics for IRP and long-term planning selection ......................................................... 16 Figure 9. Sample scatter plot of portfolios for risk analytics ............................................................... 16 Figure 10. Opinions on future of solar costs ......................................................................................... 20 Figure 11. Range of capacity values used in IRP plans, by solar technology .................................... 22 Figure 12. Range of solar capacity values used in planning analysis, by technology, provided by
utility questionnaire respondents ..................................................................................................... 23 Figure 13. Impact of increasing PV penetration on ability to meet system peak ............................... 24
List of Tables Table 1. Historical and Projected Load Growth ....................................................................................... 9 Table 2. Examples of Capacity Expansion Model Constraints............................................................. 12 Table 3. Common Resource Planning Tools and Their Associated Functions .................................. 15 Table 4. Primary Capacity Valuation Approaches ................................................................................. 21 Table 5. Challenges and Utility-Identified Best-Practices for Incorporating Solar Into Utility Supply
Planning, Based on Utility Interviews .............................................................................................. 42

1
This report is available at no cost from the National Renewable Energy Laboratory at www.nrel.gov/publications.
1 Introduction 1.1 The Task for Utility Resource Planners When large coal facilities were constructed 50 years ago, utility planners had never heard of production cost models or integrated resource plans. Climate change was still an unfamiliar term, and utilities were tasked with meeting a steady six-percent load growth. Committing to large coal-fired generating stations, despite the risk and investments they required, was likely viewed as a necessity to provide baseload generation, rather than one option of many.
Today’s utility planners are presented with a very different landscape: near-zero load growth, the near-term retirement of large baseload facilities, fuel price uncertainties, a variety of evolving generation and grid technologies, state and federal efficiency and renewable support policies, and a host of environmental considerations. Planners are asked to balance a wide variety of factors relating to reliability, cost, risk, environmental protection, and equity. They have an aging grid, new customer demands, and a host of stakeholders to consider. Utility resource planning has evolved into a resource-intensive process that requires significant expertise, substantial time, and sophisticated tools (Wilson and Peterson 2011). Even so, there are many benefits to undertaking a thorough planning process to determine the lowest practical costs of reliably meeting expected future electricity demand. For this reason, at least 27 states now require utilities to produce formal IRPs or similar plans (Wilson and Biewald 2013).8
1.2 Purpose of this Report One of the relatively new elements that resource planners are challenged to consider is solar energy technology.9 The goal of this report is to review current utility practices in long-term supply planning, and to understand how solar technologies are represented and modeled.
Federal and state policy developments, solar PV price declines, and the introduction of new solar PV “ownership” business models are stimulating increasing interest in solar technologies, at every scale. However, solar introduces a host of technology types, a wide variety of system sizes (from residential to utility-scale), variability in the generation profile, and rapidly changing costs. In addition, the established rules, regulations, and laws that govern utility supply procurement were developed during a time when large-scale, centrally-located, conventionally-fueled generation was the only real option considered. Now that generation options and different configurations are increasing, the policies may need to be adapted to new technological, operational, and market needs, such as distributed solar generation.
Most, but not all, utility planners have less experience analyzing solar than conventional generation as part of capacity planning, portfolio evaluation, and resource procurement decisions. In the last 5-10 years, some utilities have developed tools and methods to model solar PV, if not other solar technologies. However, aside from publicly-available IRPs, there have been few resources through which utility planners can learn from each other regarding
8 For the purposes of this report, the authors use integrated resource plans, integrated resource planning, and long-term planning interchangeably. 9 This report considers distributed solar PV, utility-scale solar PV with and without tracking, concentrated solar power with and without storage, PV with battery storage, and concentrating PV. Because distributed solar PV and utility-scale PV are the dominant applications in the market, these technologies are the main focus.

2
This report is available at no cost from the National Renewable Energy Laboratory at www.nrel.gov/publications.
methods, challenges, and solutions about how to consider solar in planning process.10 This report aims to begin this exchange of information.
In sum, this report aims to build understanding of:
• Time frames and methods for utility long-range resource planning
• Tools and assumptions to conduct utility resource planning
• How solar technologies are considered in the resource planning process.
1.3 Key Audiences The primary audience for this report is utility resource planning departments. The report’s aim is to share information about how others in the industry incorporate solar generation – both utility-scale and customer-sited – into their resource planning processes. A secondary target audience is the U.S. Department of Energy, who is interested in understanding how solar electricity is represented in the market and whether there are analysis needs the Department can address.
1.4 Related Research to Date The research for this report builds upon work completed in 2012 by Lawrence Berkeley National Laboratory (LBNL), as reported in “An Evaluation of Solar Valuation Methods Used in Utility Planning and Procurement Processes” (Mills and Wiser 2012). For that effort, LBNL conducted a literature review of a sample of utility planning studies and procurement processes. Their aim was to understand the methods utilities use to design resource portfolios for consideration, as well as how the utilities evaluate the various bids during the procurement process. They looked at how the utilities approached a variety of factors – including capacity value, energy value and integration costs, risk reduction, grid integration, and operability issues – as they relate to solar.
The LBNL team found that utility approaches vary widely. While many utilities have a method to evaluate the value of solar, only a few conducted detailed analyses that considered key factors. Rarely were the tradeoffs between various solar options or the full range of benefits and costs to the grid considered. The authors noted that improvements could be made to current utility methods in many areas, including the ranking of resource options, estimating capacity, evaluating the energy value of solar, estimating integration costs, and considering storage.
This report expands on the LBNL report. While the LBNL report used information found in utility IRPs and looked only at methodology, this report relies on interviews and a questionnaire to investigate the planning process and assumptions more thoroughly.
1.5 Research Methodology 1.5.1 Research Team NREL managed the project, directed research, and led analysis of results. Together, NREL and SEPA conducted electric sector interviews, delivered a utility questionnaire, and analyzed results. NREL and SEPA worked together to author this report.
10 The Joint Resource Planner’s Forum, sponsored by the Western Governors’ Association, has also provided a forum for information exchange for planners in the U.S. West. See: http://westgov.org/newsite/crepc/past-meetings/.

3
This report is available at no cost from the National Renewable Energy Laboratory at www.nrel.gov/publications.
1.5.2 Advisory Council Prior to beginning the research for this report, a small advisory council was formed. The council helped focus the project’s goals, inform its design and review the questions that were used in interviews with select utilities and in a written questionnaire. The council consisted of 6 members representing two utilities, two national labs (NREL and LBNL), and two stakeholder groups (National Regulatory Research Institute and Western Resource Advocates).
1.5.3 Utility and Stakeholder Participation Much of the data for this report was obtained through interviews with utility planners and non-utilities involved with the resource planning process, including software providers and consultants. Most, but not all, are identified in the acknowledgements; a few prefer to remain anonymous given current or near-term resource planning activities. In total, the research team conducted interviews in-person or by phone with representatives from 13 entities in the electric sector, including nine utilities. The authors gathered information on utility supply planning and how solar is represented, including:
• Resource planning process details (planning horizon, expected net load growth), • Key assumptions (whether DG is represented as supply or negative load, solar cost
assumptions, existing solar projects) • Model methodology (inclusion of distribution and transmission planning, type of risk
analytics, candidate portfolio development), • Model software (which models for capacity expansion and production simulation); and • Solar representation (project size, capacity value, integration cost adder).
To supplement the interviews, the research team designed and administered a questionnaire. The questionnaire, which was distributed to 58 utilities using a web-based platform, included 25 questions focusing on the methods and tools used in the planning process and the incorporation of solar into this process. Key questions and a summary of utility responses from the utility questionnaire are included in Appendix B.11 Twenty-two responses were received, representing 28 utilities in 22 states.12
1.6 Report Organization In Section 2, the report provides background information, including the IRP/long-term planning process, laws and regulations that shape electricity supply and demand (e.g. state mandates for renewable energy and energy efficiency), and related research to date. Section 2 also covers details of the resource planning process and explains considerations about the existing generation fleet, load forecasts, capacity expansion planning, production cost modeling, and long-term portfolio selection. The inclusion of solar in resource planning processes is explored in Section 3. This section includes a solar PV technology overview, information on where to get solar data, experiences in capacity valuation, and additional considerations in how to include solar in resource planning. Section 4 explores challenges and benefits with including solar in the supply planning process that were identified by the utility participants and stakeholders, as well as some utility-identified answers for thirteen key questions around including solar in utility long-term planning. And finally, next steps and utility-identified analysis needs are discussed in Section 5.
11 Individual utility responses are not provided in this report. 12 Some utilities reported similar planning processes across multiple affiliated companies, and some utilities operate in multiple states.
4
This report is available at no cost from the National Renewable Energy Laboratory at www.nrel.gov/publications.
2 Resource Planning Process Integrated resource/long-term planning is a utility function that looks across a wide range of potential resource options to decide the best combination to reliably serve customers over a long-term period, often 20 years or more. This long-term view is often codified in an IRP or other long-term plan.13 Based on interviews and questionnaire results, it appears that most – but not all – utilities follow a similar structure for long-term planning. It is also clear that for each step, utilities use different levels of detail, models or alternative calculation methodologies to analyze their generation portfolio. While resource planning is much broader than just the incorporation of solar, the differences were stark enough that the authors decided to capture the different methodologies used, as they provide a basis for incorporating solar into long-term planning.
2.1 Key IRP Metrics: Least-Cost and Lowest-Risk Historically, IRPs were judged almost exclusively on a least-cost perspective, meaning utilities must choose whatever mix of future resources result in the lowest cost. Cost still appears to be the dominant metric guiding long-term planning decisions, particularly because the least-cost requirement may be codified in state law. With the advent of renewable energy and energy efficiency standards, coupled with several natural gas market disruptions and associated price spikes, some state commissions and utilities are increasingly looking toward incorporating supply diversity and risk-reduction into their planning model. For example, some utilities are placing an emphasis on risk-adjusted metrics that consider future regulations, future fuel prices, “affordable costs” or other non-cost metrics.
However, some states may require state law updates in order to consider least-risk in addition to least-cost. For example, the Wyoming Public Service Commission updated their guidelines for IRPs to specifically state that the commission’s review of resource plans may include “least-cost/least-risk planning” (WY PSC 2013). Utilities who note that an exclusive focus on least-cost may not yield the optimal portfolio of resources, may decide to push for changes in state law and statute to allow for inclusion of least-risk considerations in addition to least-cost.
Incorporating regulatory and fuel price risk and variability into the planning process introduces significant complexity but provides a much fuller picture of how different assumptions regarding future resource mixes will impact key metrics for the utility in question. For example, the following questions can be more closely analyzed when considering least-risk in addition to least-cost:
• What is the impact of a 30% price swing in natural gas on the future revenue requirements of multiple portfolios?
• How do more stringent environmental regulations impact the economic viability of the existing coal fleet?
• Will higher load growth materially impact the resource decisions being made in the next five years?
• In 30 years, what are the potential risks and uncertainties with building resources today?
13 To illustrate an example of a successful and thorough process, a case study covering Tennessee Valley Authority’s recent IRP is included at Appendix A.

5
This report is available at no cost from the National Renewable Energy Laboratory at www.nrel.gov/publications.
To determine the answers to these questions, the utility must examine relevant supply and demand policies, look at its existing fleet of generation resources, project the longevity and availability of each asset and contract, consider demand-side opportunities to reduce load and/or peak demand, forecast future energy and peak demand requirements, and determine the best set of future resource additions to meet customer needs. As a result, there are a large number of variables that could change over a 20–30 year planning horizon, and thus a large number of potential futures that could come to fruition.
It is important to note that utilities plan to meet two related yet distinct customer needs as part of this assessment: peak demand (in MW) and energy requirements (in MWh). From a peak demand standpoint, utilities typically plan to meet the forecast load growth plus a reserve margin. This reserve margin is often based on a Loss of Load Probability study, i.e., determining the reserves needed to ensure a probability of no worse than one outage in a 10-year period. Reserve margins vary slightly for each utility, but typically fall in the 12–18% range of peak demand (meaning that for every 1,000 MW of peak demand, utilities plan for 1,120–1,180 MW of generation availability).
From an energy perspective, the mix and type of each generation resource becomes much more critical. A utility could conceivably meet all of its needs by adding combustion turbines; however, these resources typically have a poor heat rate (or lower fuel efficiency), which translates into a high overall production cost to the consumer. Alternatively, the utility could meet all of its future needs with renewable energy, which effectively has no production cost due to its fuel source being free; however, renewable energy is often variable in nature and not perfectly aligned with system needs. This could result in a significant over-building of capacity than would otherwise be pursued. It is for these reasons that integrated resource planning is such a critical activity for so many utilities – the decisions contemplated in this process can have huge ramifications to customers over the long term.
2.2 The IRP Process Integrated resource planning is the process of determining the lowest practical costs of reliably meeting expected future electricity load through the combination of supply-side generation and demand-side resources, while balancing reliability of service, environmental protection, and other goals.
Given the benefits of careful planning, particularly to ratepayers, some states require utilities to undertake IRP or long-term planning processes that are overseen by the state regulators. As of 2011, 27 states had IRP requirements, two states were developing or revising IRP rule or filing requirement, and ten states had long-term plan filing requirements (see Figure 1). The planning horizons generally range from 10 to 20 years, with the majority using a 20-year period. Plans must be updated every 2–5 years, with most states requiring biannual updates (Wilson and Biewald 2013). In general, state rules require that all feasible supply and demand side resources be considered, with some states specifying the resource types. Long-term planning can be done differently, depending on the structure of the market and the authority of the regulators. In states with regulated retail markets (mainly in the West and South), generation suppliers are regulated and often have state requirements to produce an IRP or long-term plan. In states with competitive retail markets (mainly the Northeast, Mid-Atlantic, parts of the Midwest and California), the suppliers of generation are not regulated, and thus do not have state requirements that suppliers produce an IRP. Distribution companies that operate in competitive markets, however, are the “provider of last resort” and

6
This report is available at no cost from the National Renewable Energy Laboratory at www.nrel.gov/publications.
are thus responsible for procuring power for customers that do not choose a competitive generation supplier. These distribution companies are subject to oversight by the public utilities commission. As of 2011, four states with competitive retail markets (Ohio, Delaware, Connecticut, and Rhode Island) required distribution utilities to undertake an IRP process, although the resource plans are generally not as comprehensive as in states with vertically-integrated utilities (SEE Action 2011). Even in the states that do not require the submission of IRPs or long-term plans, utilities often undertake their own resource planning efforts as a matter of prudent business practice either on regular intervals or as needed based on market conditions.
Adapted from Wilson and Biewald 2013
Figure 1. States with IRP requirements as of 2011
2.3 Electricity Supply and Demand Laws and Regulations Many states have laws or regulations that can impact the mix of generation supply, or the total amount of customer demand. The dominant supply policy is the renewable portfolio standards (RPS). RPS policies require electric utilities to generate or buy renewable energy (RE) equal to a certain percentage of their retail electricity sales, or a set minimum quantity, within a specified timeframe. Currently, 29 states and the District of Columbia have established RPS mandates, while eight states have less binding goals. RPS policies vary by state in their requirement, deadlines, types of utilities covered, eligible resources, penalties for non-compliance, and technology eligibility. Several states have specific solar or distributed generation “carve-outs,” shown in Figure 2.
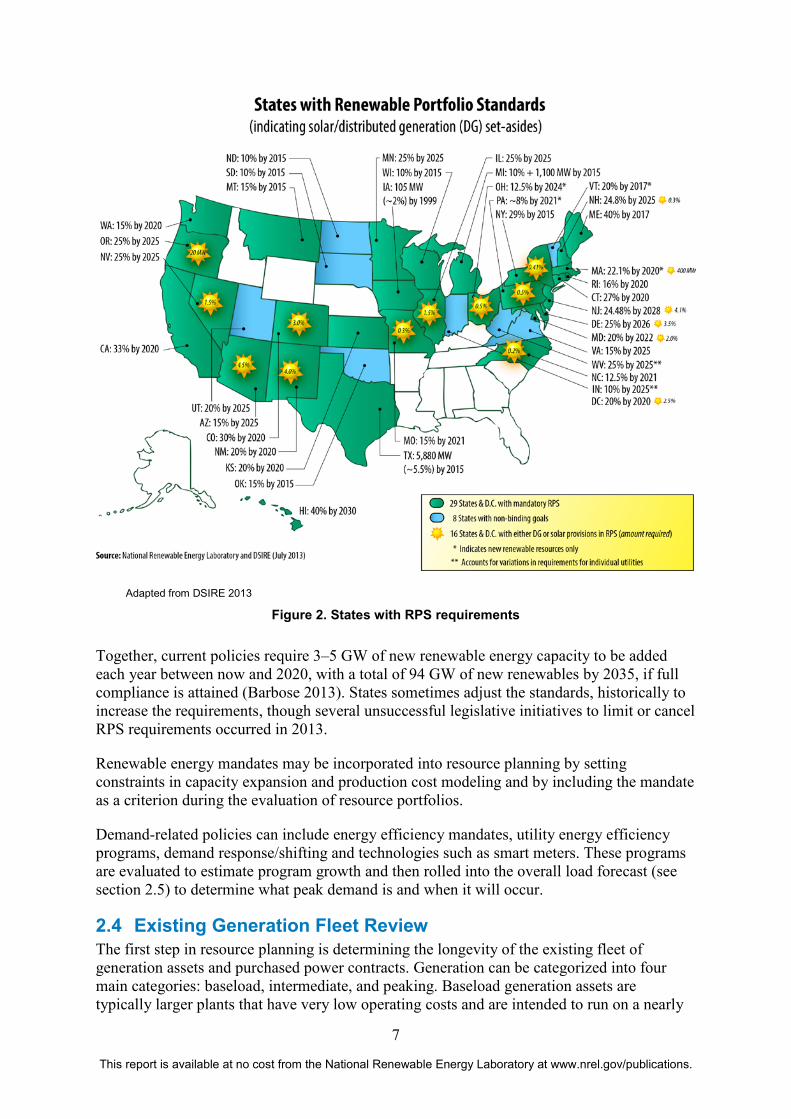
7
This report is available at no cost from the National Renewable Energy Laboratory at www.nrel.gov/publications.
Adapted from DSIRE 2013
Figure 2. States with RPS requirements
Together, current policies require 3–5 GW of new renewable energy capacity to be added each year between now and 2020, with a total of 94 GW of new renewables by 2035, if full compliance is attained (Barbose 2013). States sometimes adjust the standards, historically to increase the requirements, though several unsuccessful legislative initiatives to limit or cancel RPS requirements occurred in 2013.
Renewable energy mandates may be incorporated into resource planning by setting constraints in capacity expansion and production cost modeling and by including the mandate as a criterion during the evaluation of resource portfolios.
Demand-related policies can include energy efficiency mandates, utility energy efficiency programs, demand response/shifting and technologies such as smart meters. These programs are evaluated to estimate program growth and then rolled into the overall load forecast (see section 2.5) to determine what peak demand is and when it will occur.
2.4 Existing Generation Fleet Review The first step in resource planning is determining the longevity of the existing fleet of generation assets and purchased power contracts. Generation can be categorized into four main categories: baseload, intermediate, and peaking. Baseload generation assets are typically larger plants that have very low operating costs and are intended to run on a nearly

8
This report is available at no cost from the National Renewable Energy Laboratory at www.nrel.gov/publications.
constant basis. They also require a long lead time to start and therefore ramping on and off are not particularly viable for these facilities, particularly as it could have an impact on minimum loading requirements for the generators. Nuclear and coal generation are often treated as baseload resources. The degree that baseload facilities can ramp up and down is dependent upon the design of each individual plant. NREL research shows that repeated cycling of coal plants can have large impacts on cost and wear (Lew et al. 2012).
Intermediate resources, typically natural gas combined-cycle plants, dispatch next. These resources are typically more flexible (compared to baseload plants) and able to follow load during the day. They can also be started more quickly than baseload resources (in a few hours), can be cycled on and off daily, and can be ramped up and down relatively easily.
Peaking resources such as combustion turbines are used to meet demand during the peak hours of the day when load is at its highest. These assets can start and stop very quickly (often in 10 minutes or less), but are more expensive to operate. Graphically the three dispatchable resource types can be depicted as serving distinct portions of a utility’s load duration curve, shown in Figure 3.
Figure 3. Load duration curve by resource category
Certain renewable resources can be placed into a fourth category called “variable.” Renewable resources like solar and wind are not dispatchable; that is, they cannot be turned on and off at the utility’s discretion. Moreover, they are effectively “must take” resources, meaning that when the sun shines or the wind blows, the utility will be taking the energy.
Separate from utility-owned generation assets, many utilities rely upon purchased power agreements (PPAs), power exchanges, storage, and short-term market transactions to meet a portion of their load requirements. Contracted power could be in the form of fixed blocks (100 MW delivered for a given time period), tolling agreements (where the utility is
Baseload
Intermediate
Peaking
MW
(Cap
acity
)
Hours
Load Duration Curve
8760

9
This report is available at no cost from the National Renewable Energy Laboratory at www.nrel.gov/publications.
responsible for the delivery of gas and dispatching the third party’s unit), or call option contracts (executable when the power price exceeds an agreed upon strike price). PPAs differ significantly from owned assets in that when their contract term ends the resources must be replaced or renegotiated, whereas with owned assets there is the potential to extend the plant’s life.
When approaching long range planning, the utility must understand what tools it has in the proverbial toolbox and how long those tools will be accessible. As infrastructure ages, more and more generation assets will be nearing the end of their useful life and plant retirement decisions will loom large. This is particularly relevant with existing coal-fired generation, where environmental regulations requiring expensive upgrades to emissions control equipment, coupled with low natural gas prices, cause resource planning groups to perform detailed economic analyses of repair-versus-replace scenarios. Plant retirements could require the addition of new generation assets regardless of whether the utility forecasts any customer load growth during its planning horizon.
2.5 Load Forecast A key component in long-term planning is predicting future customer demand. This involves detailed analytical reviews of each customer segment and the likelihood of each segment adding new customers as well as increased (or decreased) consumption on a per-customer basis. Residential customers can change their electricity needs without physically changing their footprint in several ways. Increased load can result from more computers, smart devices, and video games, as well as replacing old technology with new, higher energy-use technology (e.g., plasma TVs). Decreased load can occur when appliances are replaced with more energy efficient models. For each customer class, the utility rolls up the load forecasts to determine the peak demand periods on a daily, monthly, seasonal and annual basis.
According to data collected by the Energy Information Administration, electricity sales growth has slowed significantly over the last several years compared to the previous several decades (EIA 2013).
Table 1. Historical and Projected Load Growth
Time Period Average Annual Load Growth
1981 – 2005 2.3% 2006 – 2012 0.23% 2013 – 2040 (est.) 0.78%
Source: EIA 2013
Utilities as recently as five years ago were building resource plans based upon compound growth assumptions of more than 2% per year. The economic slow-down that began in the late 2000s is a principle cause of the reduced demand growth in recent years. In addition, many utilities have implemented energy efficiency programs and goals, which further reduce energy and demand projections. Others have implemented programs designed to reduce demand (utility energy efficiency programs), or to moderate demand including the use of smart meters, demand side management and programs designed to shift or shed peak loads. Based on a questionnaire conducted in support of this report, utilities appear to have lowered their overall internal load growth forecasts and are now more in line with what EIA is predicting (see Figure 4).

10
This report is available at no cost from the National Renewable Energy Laboratory at www.nrel.gov/publications.
Source: Utility questionnaire, as part of this project14
Figure 4. Average annual consumption growth (Net of EE/DG)
Aligning a growth assumption with the existing generation and purchased power assets gives the resource planning group a vision of how much new generation capacity is required and when those additions are needed. This task is tackled as part of capacity expansion planning.
2.6 Capacity Expansion Planning Capacity expansion planning is the act of determining the most viable long-term resource plan that meets projected electric demand. The process includes reviewing a wide array of new resource additions or contract renewals to meet growth or fill needs created by asset retirements and purchase contract expirations. Multiple future energy resource mixes, based on a wide array of potential options, are considered in aggregate. As mentioned previously, many utilities have operated or continue to operate in a least-cost planning environment; the determination of what is truly least-cost is a difficult task. Utilities have at their disposal dozens of technology choices and multiple configuration options within those choices. Figure 5 shows some of the choices for natural gas and solar.
14 Load growth is highly region-specific, as it depends in large part upon a utility’s local economic outlook and population growth.
0 2 4 6 8 10 12
< 0%
0-1%
1-2%
2-3%
> 3%
Average Annual Consumption Growth - Net of EE/DG

11
This report is available at no cost from the National Renewable Energy Laboratory at www.nrel.gov/publications.
Figure 5. Sample resource selection options
For each viable technology option, the utility will track and calculate a series of cost and performance characteristics that will drive decisions about whether the resource will be included in any year of a future potential resource plan. Representative characteristics are shown in Figure 6.
Figure 6. Resource characteristics used in capacity expansion planning
Based upon these options and their unique characteristics, a plan for future resource additions can be developed. Two general forms of capacity expansion planning occur today: capacity expansion modeling and engineering judgment.
Natural Gas
Combined Cycle
1x1
2x1
Duct-fired
Combustion Turbine
Reciprocating engine
Aeroderivative
Wet- vs. Dry-Cooled
Solar
PV
Fixed tilt
1- or 2-axis tracking
West- vs. south-facing
Concentrating
CSP
Parabolic trough
Central receiver
Trough w/ storage
Plant Statistics
Nameplate MW
Summer/Winter Net Dependable Capacity
Capacity Value (RE only)
Construction Time
Useful Life
Plant Operating Characteristics
Capacity Factor
Heat Rate (combustion only)
Water Use
Emissions
Ramp rate, minimum load, start times
Planned/Unplanned Outages
Plant Economics
Capital Cost ($/kW)
Incentives (e.g.tax credits, MACRS, state incentives)
Variable O&M ($/MWh)
Fixed O&M ($/kW-yr)
Integration Costs

12
This report is available at no cost from the National Renewable Energy Laboratory at www.nrel.gov/publications.
2.6.1 Capacity Expansion Modeling Capacity expansion modeling is a process of creating a series of resource plans using a computer software tool called a capacity expansion model (CEM). Utilities provide an array of inputs into the model with details on their existing generation assets and purchased power contracts, load growth assumptions, cost curves for fuel sources, capital and O&M costs for potential resource additions, and other key variables. The models then typically run through a dispatch simulation (often a sample week in every month of the planning horizon) that reviews existing resources against load requirements and determines when new resources are required. The model then reviews the resource options available and identifies the best choice based on set criteria, often times using least-cost as the primary criterion (as noted earlier, some utilities are also including one or more lowest-risk criteria). To do this, the model looks at literally thousands of potential resource addition combinations and uses filters or “screens” to reduce them down to either one optimized plan or a ranked series of plans.
Certain constraints can be forced on the model so that multiple outcomes result, which can be further investigated with additional modeling. For example, Table 2 shows the potential capacity expansion constraint criteria, along with an explanation of how each criterion is applied.
Table 2. Examples of Capacity Expansion Model Constraints
Potential Capacity Expansion Constraint Criteria Motivation Limiting the number of specific resources that can be added in a given window of time
This approach is taken if the utility knows that it will be constrained from a capital or workforce perspective and could not build more than a given number of resources (i.e., combustion turbines) in any given year or over a set period of time.
Setting a minimum level of capacity or energy from a specific resource type
If a utility is subject to an RPS standard, this approach could be used to force a renewable resource to be selected even if it is not the least-cost option.
Restricting certain resources from being selected A utility may wish to run a scenario where the model is not allowed to select certain resource types, like new coal generation, or limits how much capacity can be from PPAs.
Requiring a specific resource to be built at a certain point in time
The utility could force the model to place a specific unit in service during the planning horizon. This could be done if the utility wished to see the impacts of adding new nuclear capacity.
Forcing a plant retirement prior to its book life Certain environmental regulations could warrant early closure of coal-fired generators. While capacity expansion models often can run “repair versus retire” analytics, the utility may wish to see the retirement scenario play out regardless of the least-cost option.
By varying these constraints with each successive run of the CEM, a utility will be able to see the resource plans optimized to different end goals. Another way of thinking about this process is the concept of scenario planning. Several utilities use a series of “future states,” or potential scenarios that could play out in the future, to drive how they could approach building out resource plans.

13
This report is available at no cost from the National Renewable Energy Laboratory at www.nrel.gov/publications.
Scenario planning often tries to set plausible boundary cases based on existing unknown conditions. For example, one scenario could contemplate a future with extremely restrictive federal environmental policies. The utility could then look at constraining the CEM by forcing closure of coal plants, using high natural gas price curves, setting a carbon tax, or other activities. The CEM would then look to build a portfolio that operated at the least cost possible in that potential future, possibly by focusing on renewable additions. Alternatively, a scenario could be developed that postulated persistently low natural gas prices due to shale gas availability. This low-cost gas curve would likely lead to natural gas generation being the dominant new resource of choice.
The result of these constrained scenarios is a series of resource plans optimized to different assumptions and that outline the construction timeframes and availability dates of new resource additions throughout the planning horizon.
2.6.2 Engineering Judgment One criticism of reliance on CEMs is that many of the resulting portfolios look quite similar. This is because the software is trying to optimize around cost given all of the constraints it is working against, and it will not make wildly different selections on its own.
Some utilities rely instead on engineering judgment to come up with distinct portfolio options. Developing portfolios using this approach often starts with an end goal and works backwards. A utility could look to create portfolios that met substantively different goals, such as a plan that would consume the least amount of water or a plan that used 30% renewable energy. These end goals could be internally generated or could result from gauging the interests of key stakeholders in the IRP process. Regardless, it is a viable method to determine the timing and addition of key resources.
2.7 Production Cost Modeling The next stage in the long-term planning process is to run a production cost model (PCM). PCMs simulate hourly dispatch over the entire planning horizon rather than a representative sample as is done in a CEM. Utilities use these hourly dispatch models to perform complex sensitivity analyses. One approach is called Monte Carlo simulation, where multiple key input variables are randomly changed hundreds or even thousands of times in order to see how robust each potential resource plan is and how well it performs against a handful of key metrics. Other utilities will vary one variable at a time in order to see the specific impacts that major assumptions have on the outcome of a portfolio. Some utilities use both methods.
There are a group of assumptions utilities commonly vary as part of this process, as shown in Figure 7.
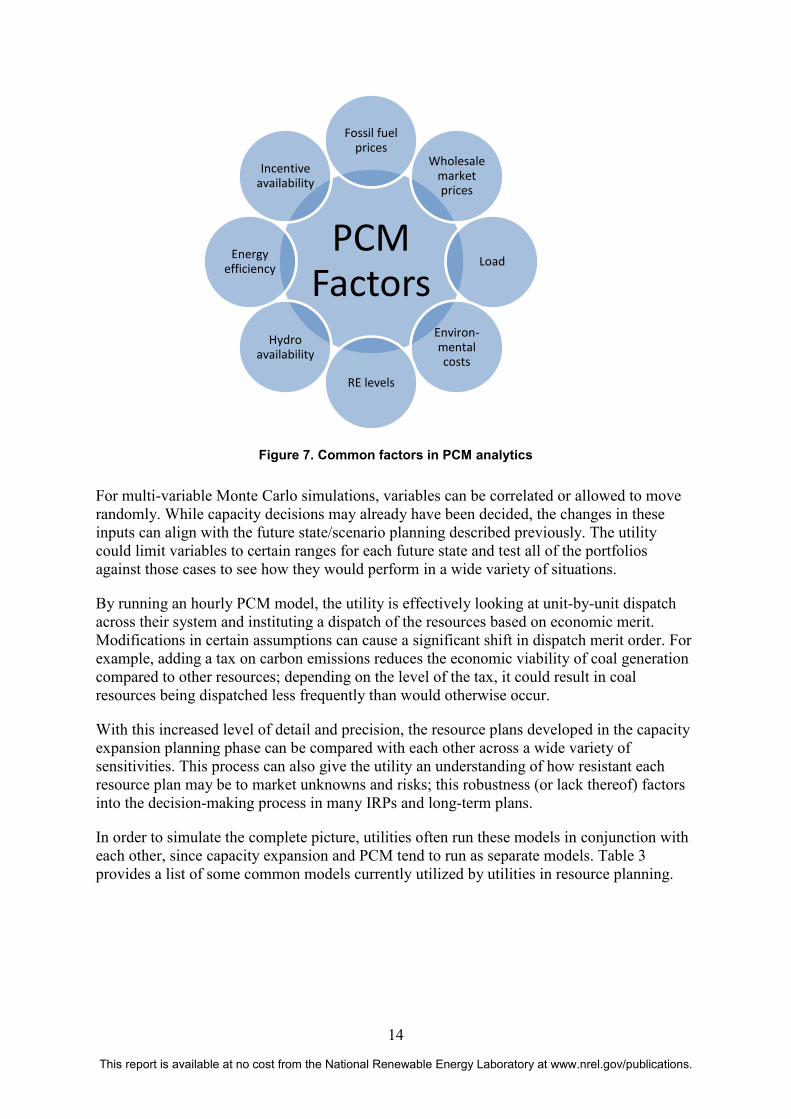
14
This report is available at no cost from the National Renewable Energy Laboratory at www.nrel.gov/publications.
Figure 7. Common factors in PCM analytics
For multi-variable Monte Carlo simulations, variables can be correlated or allowed to move randomly. While capacity decisions may already have been decided, the changes in these inputs can align with the future state/scenario planning described previously. The utility could limit variables to certain ranges for each future state and test all of the portfolios against those cases to see how they would perform in a wide variety of situations.
By running an hourly PCM model, the utility is effectively looking at unit-by-unit dispatch across their system and instituting a dispatch of the resources based on economic merit. Modifications in certain assumptions can cause a significant shift in dispatch merit order. For example, adding a tax on carbon emissions reduces the economic viability of coal generation compared to other resources; depending on the level of the tax, it could result in coal resources being dispatched less frequently than would otherwise occur.
With this increased level of detail and precision, the resource plans developed in the capacity expansion planning phase can be compared with each other across a wide variety of sensitivities. This process can also give the utility an understanding of how resistant each resource plan may be to market unknowns and risks; this robustness (or lack thereof) factors into the decision-making process in many IRPs and long-term plans.
In order to simulate the complete picture, utilities often run these models in conjunction with each other, since capacity expansion and PCM tend to run as separate models. Table 3 provides a list of some common models currently utilized by utilities in resource planning.
PCM Factors
Fossil fuel prices
Wholesale market prices
Load
Environ-mental costs
RE levels
Hydro availability
Energy efficiency
Incentive availability

15
This report is available at no cost from the National Renewable Energy Laboratory at www.nrel.gov/publications.
Table 3. Common Resource Planning Tools and Their Associated Functions
Software Tool Capacity Expansion Modeling
Production Cost Modeling
Transmission Simulation
Notes
Strategist ✔ Pairs with PROMOD IV System Optimizer (Capacity Expansion)
✔ Pairs with Planning and Risk
PROMOD IV ✔ ✔ Pairs with Strategist Regional scale Hourly load profile
Planning and Risk (PROSYM)
✔ Pairs with System Optimizer
AURORAxmp ✔ ✔
Strategic Planning (MIDAS)
✔ Used mostly for financial analysis.
EGEAS ✔
A modular package that optimizes to a load duration curve, with the single objective of least cost
GENTRADER ✔ Modular tool Regional scale Hourly load profile
PLEXOS ✔ ✔
Models transactions to consider competition of supply, and is thus suitable for use in a competitive environment.
2.8 Portfolio Selection The end result for many IRPs is a recommendation on a resource portfolio. Selecting one resource plan from several (or dozens) created in the capacity expansion planning process and analyzed through production cost modeling can be a daunting task. To assist with this, utilities rely on a handful of key metrics to guide their selection. These metrics could be viewed qualitatively or quantitatively as part of a detailed scorecard. Metrics typically examined are shown in Figure 8.

16
This report is available at no cost from the National Renewable Energy Laboratory at www.nrel.gov/publications.
Figure 8. Key metrics for IRP and long-term planning selection
Of particular note is the inclusion of risk parameters in the long-term planning process. Least-cost planning dominated the IRP landscape for many years; however, several states have introduced least-risk planning and metrics as a way to gauge the potential for long-term rate stability. These can include the value of generator diversity to lower potential future risks, as well as the potential risk of future regulations that could increase the risk of today’s supply decisions. Risk metrics are often a result of detailed Monte Carlo simulations, where it is possible to create a bell curve of potential present value of revenue requirements (PVRR) for each portfolio. If a utility wanted to ensure that it selected a portfolio of future resources that was both low cost and resilient to upward price risk, it could focus on the expected PVRR as well as the potential price risk (or risk tail, represented by the upper 5% of PVRRs or some other value).
Figure 9. Sample scatter plot of portfolios for risk analytics
Portfolio Selection
Present Value of Revenue
Requirements
Cumulative CapEx
Emissions
Fuel Diversity
Water Usage
Average System Cost
Future Risk
Expe
cted
PVR
R
95th Percentile - Expected PVRR
PVRR and Risk Tail Analysis

17
This report is available at no cost from the National Renewable Energy Laboratory at www.nrel.gov/publications.
In the sample scatter plot in Figure 9, a handful of potential resource portfolios are plotted based on two key metrics: their expected PVRR, and the delta between their 95th percentile PVRR (i.e., upper tail of cost projections) and the expected PVRR. Portfolios falling in the lower left quadrant (as highlighted by the black line in Figure 9) would be considered to have lower expected cost as well as lower overall risk of price increases for ratepayers. While only a few utilities follow this approach, many have considered adopting this or some other similar method as part of their portfolio selection process. This can be augmented by also looking at the environmental impacts of each portfolio (carbon emissions, water usage, etc.), or even impacts to economic development criteria like job creation.
It is important to note that portfolios selected as part of an IRP process are rarely binding; rather, they are treated as roadmaps based on a given set of assumptions. Virtually all utilities have a separate process to receive approval for building new assets and bringing them into their rate base. Indeed, IRPs are often only “acknowledged” by state commissions, a term of art that provides little assurance to utility financial officers and investors, as it does not contain any level of approval or surety of future cost recovery; however, IRPs and long-term plans do provide an opportunity for the utility to lay out its vision of potential futures and the resource mix that is most appropriate for its customer base.

18
This report is available at no cost from the National Renewable Energy Laboratory at www.nrel.gov/publications.
3 Inclusion of Solar in Resource Planning Processes
3.1 Background Solar generation has become increasingly prevalent in recent years, driven by an increased focus on renewable energy coupled with rapid decreases in the cost to deploy solar assets. Over the last three years alone, total annual solar installations have risen from 781 MW in 2010 to nearly 2,400 MW in 2012, and cumulatively nearly 6.1 GW of solar is now installed and operating in the United States as of the end of 2012 (Krishanmoorthy et al. 2013).15 Three interesting characteristics exist for that installed capacity:
1. More than 99% of the installations are customer-sited (DG).
2. Nearly 80% of the cumulative U.S. solar capacity serves the load requirements of 10 utilities, with 30% of the overall capacity at one utility (Krishanmoorthy et al. 2013).
3. In the last 2 years, centralized solar (projects > 5 MW in size) have increased from less than 1 GW to more than 3 GW (SEPA 2013).
The proliferation of DG systems across multiple jurisdictions has been driven by many disparate factors. In some regions, it is due to aggressive customer adoption incentives. In others, the systems can compete on a cost basis against existing utility retail rates. Utility-scale systems, on the other hand, must compete more directly against wholesale costs, either all-source or renewable-only. The declining costs of PV in recent years have helped close the gap between what it costs to develop and deploy solar and what the market can bear. This became crystallized in 2012 when large-scale solar systems made up approximately half of all new solar capacity installed (slightly more than 1,100 MW), an increase of 2.5 times the capacity from 2011(SEPA 2013).
Not all utilities are adopting solar generation at the same pace; however, as solar deployment costs continue to decline and reach parity with other resource options (especially solar PV recently), more and more utilities are likely to turn their attention toward solar generation and how it can play a part in future resource plans. In fact, most if not all utility interviewees stated that they are likely to include solar PV as a resource in their forthcoming plans.
3.2 Solar Data There are two main types of solar data required in long-term planning according to utility interviewees, which include solar profiles and solar costs.
3.2.1 Solar Profiles Solar profiles characterize the potential solar generator output, which includes resource potential on an hourly basis. Utilities that participated in the research for this report identified three main sources for solar profile data that they incorporate into their IRPs/long-term plans: National Renewable Energy Laboratory’s PVWatts (PVWatts 2013), PVsyst (PVsyst 2013), and data from existing operating plants in their service territory. PV Watts and PVsyst are only relevant for PV systems, the dominant technology included in long-term plans (if any).
PVWatts is an online program developed by NREL that provides the capability to create a typical meteorological year (TMY) of profile data for a solar resource in a given geographic
15 All values listed in MW-ac.

19
This report is available at no cost from the National Renewable Energy Laboratory at www.nrel.gov/publications.
region. This tool can provide a first glimpse into what kind of production could be expected from a proposed solar facility. Using a DC rating in kW, a derate factor, the type of array (fixed or tracking), and the array’s tilt and azimuth (where south-facing is stated as 180°), the model will create an hourly expected output based on typical weather patterns and solar irradiance, as experienced over several decades’ worth of recorded data. The downside to PVWatts is that the analysis can be run only for a limited number of sites. For example, there are only four sites available in Arizona: Flagstaff, Phoenix, Prescott, and Tucson.16 This data can be particularly helpful if utilities do not have many PV systems in operation in their jurisdiction, or do not have access to those systems’ output and want an extremely simple methodology.
PVsyst is a software package that allows users to study the design of PV systems and perform sizing and data analytics. It includes component and meteorological databases, and is intended for use by architects, engineers, and researchers. PVsyst performs three general levels of study: preliminary design, including sizing the project; project design, where detailed hourly modeling is conducted; and measured data analysis, which allows for the actual data from the fully operational plant to be compared against simulated variables (PVsyst 2013).
Data from operational plants is also used by utilities with access to system data within their service territory. This data provides the utilities a view into the real operational characteristics of solar PV and other solar generation. However, because these profiles are based on actual plant output, they may require some review and potential adjustments prior to inclusion in any kind of analytics. For example, if a PV plant has only been in operation for a short period of time, it may be necessary to supplement the profile with PVWatts data. Alternatively, severe or abnormal weather occurrences may dictate the need to augment with PVWatts data. This scrubbing is appropriate, as long-term plans are based first and foremost on projected load requirements which themselves have been “weather normalized,” or stripped of any impacts from abnormal weather conditions. As solar output is also predicated on weather patterns, it is appropriate to ensure an “apples to apples” comparison.
While there is interest in the combination of storage and PV to improve the profile of PV overall, storage is not typically modeled in long-term planning by the majority of utility interviewees, because utilities feel they need more credible data and analysis before storage can be included in long-term planning analysis. A few utilities that do consider the combination of storage and PV consider the combination to have dispatchability, although on a limited basis.
3.2.2 Solar Cost Information For the most part, solar cost information is collected from publicly available sources, and from existing plants in the utility territory. However, for PV technologies the market is changing so fast, it is hard for utilities to understand the future cost trajectory.
Utility interview participants universally commented on the rapid decline in PV costs over the last several years. In particular, most utilities had forecast a declining cost curve in their planning assumptions, only to see the actual costs decline much more steeply than
16 The preceding statement is specific to TMY2 data, which is based on solar data from 1961–1990, and covers 239 sites. TMY3 (1991-2005) is available for 1,020 locations, but is used less frequently due to the smaller sample size.

20
This report is available at no cost from the National Renewable Energy Laboratory at www.nrel.gov/publications.
anticipated. Common beliefs regarding the root cause of the nearly exponential cost reductions included:
• U.S. tax subsidies
• Foreign manufacturing credits
• Efficiency gains
• Market surplus of panels.
On a going-forward basis, there was still consensus but less overall agreement on where PV costs would trend. Companies that were questioned on this issue fell into three general groups of thinking shown in Figure 10.
Figure 10. Opinions on future of solar costs
Several utilities specifically mentioned the Department of Energy’s (DOE) SunShot Initiative goals for reduced costs of PV deployment by 2020 as being potentially obtainable.17 Others commented that (while the dramatic declines seen over the last 5 years are not sustainable) reductions will continue, albeit in a more measured fashion. Finally, several companies believed that solar costs were at or near a bottom and would levelize for the foreseeable future. These solar PV cost assumptions are reflected in their solar cost assumptions used in their long-term planning. While prices have come down rapidly, questions remain about how long the prices will continue to decline and when they will bottom out (or if they already have).
A few items have contributed to the thinking of utilities that believe PV costs may have bottomed out. First and foremost, there has been a series of bankruptcies in the solar industry over recent years, which has taken several manufacturers out of the market. Second, demand for solar panels globally is increasing and the market surplus is expected to dissipate over 17 The SunShot Initiative’s target is a 75% reduction in installed costs by the year 2020, down to $1.50/watt for utility-scale systems.
DOE SunShot Initiative cost
targets are achievable
Reductions will continue but at a
more gradual pace
Costs have already stabilized
?

21
This report is available at no cost from the National Renewable Energy Laboratory at www.nrel.gov/publications.
utility planning horizons. Finally, there is concern over post-2016 when the ITC reverts from 30% back to 10%; demand could potentially slow.
Publicly available data sources for solar cost data that can be used in utility analysis are explained in Section 4.2.1.
3.3 Solar Capacity Valuation One key question discussed at length with interviewees was the capacity value utilities attribute to the addition of solar capacity on their system. In essence, a solar generator’s capacity value is the percentage of its nameplate capacity that is anticipated to be reliably available to meet daily and seasonal peak demand, and is a very region-specific metric. There are multiple terms of art for this occurrence, capacity credit and capacity value being two more commonly used.
Conventional generation resources, like natural gas combustion turbines and coal-fired plants, are fully dispatchable and can be called upon to meet load as it fluctuates throughout the day and year. In contrast, the most commonly deployed solar technology, fixed-axis solar PV, generates only when the sun is shining.18 Typically, the sun provides the most energy for production between noon and 1 p.m. each day, and the production capability can diminish rapidly as the sun sets for projects facing south. PV facing west can moderate this drop-off, although overall production of the facility will be lower. Most utilities commonly peak later in the afternoon, between 4 p.m.–6 p.m., due to air conditioning load in the summer months. For this reason, solar energy may not correlate perfectly with a utility’s need for it, depending on their specific situation (e.g., latitude, insolation). Different solar technology configurations can moderate this potential for rapid impact through the addition of storage, or PV tracking (one or multiple axes) – but these configurations are not always included in long-term planning modeling.
Several methods are used to calculate the capacity value. Some of the more commonly used approaches are explained in Table 4.
Table 4. Primary Capacity Valuation Approaches19
Method Definition Effective Load-Carrying Capability (ELCC)
Represents the ability of a power plant to increase the total load of a local grid without increasing its Loss of Load Probability (LOLP).
Peak Time/Season Windows Calculates capacity credits across predefined hours, months, and/or seasons. This approach can look at either the minimum or median output likely to occur with a given probability. It does not account for the impact of different levels of grid penetration.
Capacity Factor Quantifies a power plant’s average output relative to its installed capacity; while this approach is simple to calculate, it bears no relation to load served, and cannot account for the impact of different levels of grid penetration for solar as a whole.
18 Solar generation with storage, whether from battery or thermal technologies, can be considered dispatchable. 19 Additional information on capacity valuation approaches can be found in: Hoff et al. 2008
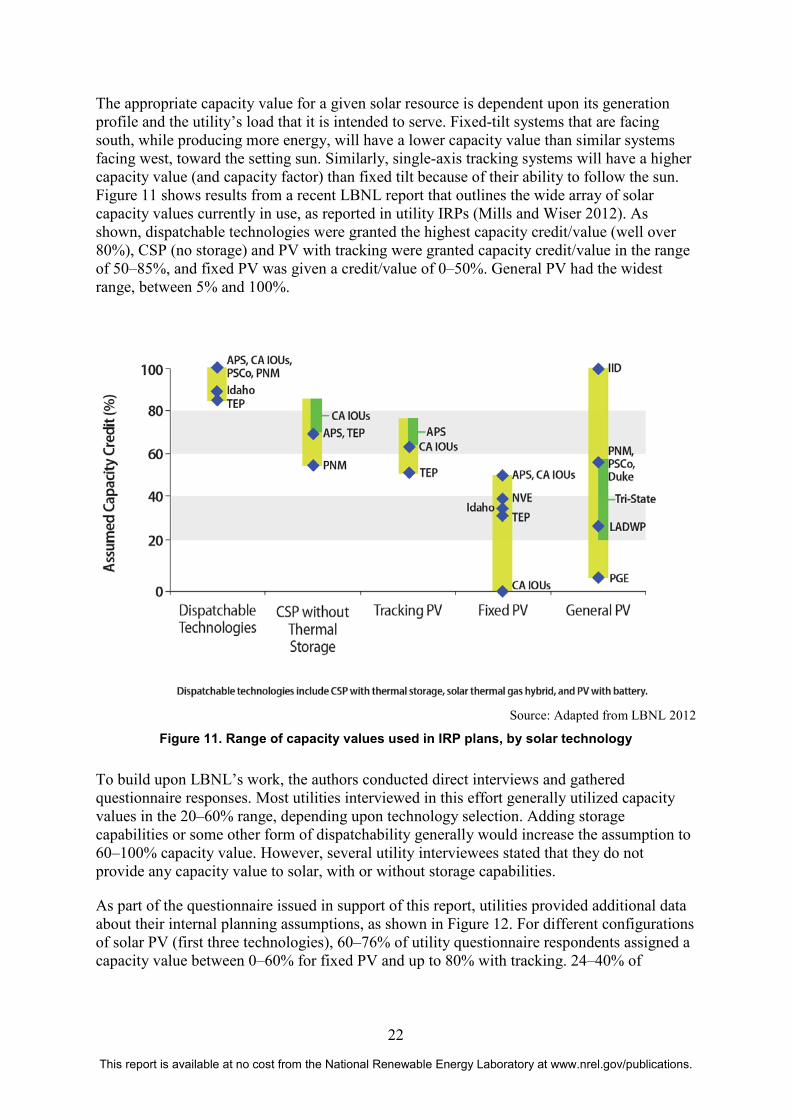
22
This report is available at no cost from the National Renewable Energy Laboratory at www.nrel.gov/publications.
The appropriate capacity value for a given solar resource is dependent upon its generation profile and the utility’s load that it is intended to serve. Fixed-tilt systems that are facing south, while producing more energy, will have a lower capacity value than similar systems facing west, toward the setting sun. Similarly, single-axis tracking systems will have a higher capacity value (and capacity factor) than fixed tilt because of their ability to follow the sun. Figure 11 shows results from a recent LBNL report that outlines the wide array of solar capacity values currently in use, as reported in utility IRPs (Mills and Wiser 2012). As shown, dispatchable technologies were granted the highest capacity credit/value (well over 80%), CSP (no storage) and PV with tracking were granted capacity credit/value in the range of 50–85%, and fixed PV was given a credit/value of 0–50%. General PV had the widest range, between 5% and 100%.
Source: Adapted from LBNL 2012
Figure 11. Range of capacity values used in IRP plans, by solar technology
To build upon LBNL’s work, the authors conducted direct interviews and gathered questionnaire responses. Most utilities interviewed in this effort generally utilized capacity values in the 20–60% range, depending upon technology selection. Adding storage capabilities or some other form of dispatchability generally would increase the assumption to 60–100% capacity value. However, several utility interviewees stated that they do not provide any capacity value to solar, with or without storage capabilities.
As part of the questionnaire issued in support of this report, utilities provided additional data about their internal planning assumptions, as shown in Figure 12. For different configurations of solar PV (first three technologies), 60–76% of utility questionnaire respondents assigned a capacity value between 0–60% for fixed PV and up to 80% with tracking. 24–40% of

23
This report is available at no cost from the National Renewable Energy Laboratory at www.nrel.gov/publications.
responses indicated no value assumed for PV technologies.20 Of utilities that did assign capacity value, the greatest value was assigned to utility-scale tracking axis PV; more than half assigned a capacity value greater than 40%. This makes sense because PV with tracking capability can help meet early evening peak demand and provide more capacity value overall. Fixed axis PV was allocated a lower capacity value than tracking overall – with a slightly higher value for utility-scale compared to distributed PV.
Conversely, only 26–44% of utility respondents assigned any capacity value to CSP (with or without storage), PV with battery storage or concentrating photovoltaics (CPV); 56–74% used a 0% capacity value.21 Utilities that assigned capacity values used a range of 0–100%. Half the respondents that assigned value to CSP with storage assumed a value of 80% or above and 88% assumed a capacity value of 40% or greater. For CPV technology, of those that assigned value, 80% assumed a value of 40% or greater.
Note: Numbers in circles represent the number of utility responses
Figure 12. Range of solar capacity values used in planning analysis, by technology, provided by utility questionnaire respondents
When looked at in aggregate, the incremental capacity value for PV generation resources can actually decrease as penetration increases. This occurs because a utility must still meet system summer demand after the sun goes down around 7 p.m.–8 p.m. As its penetration 20 These utilities either have no or virtually no solar on their systems today, or have specifically stated that they have not determined the capacity value assigned to solar at this time. 21 Same comment as Footnote 20.
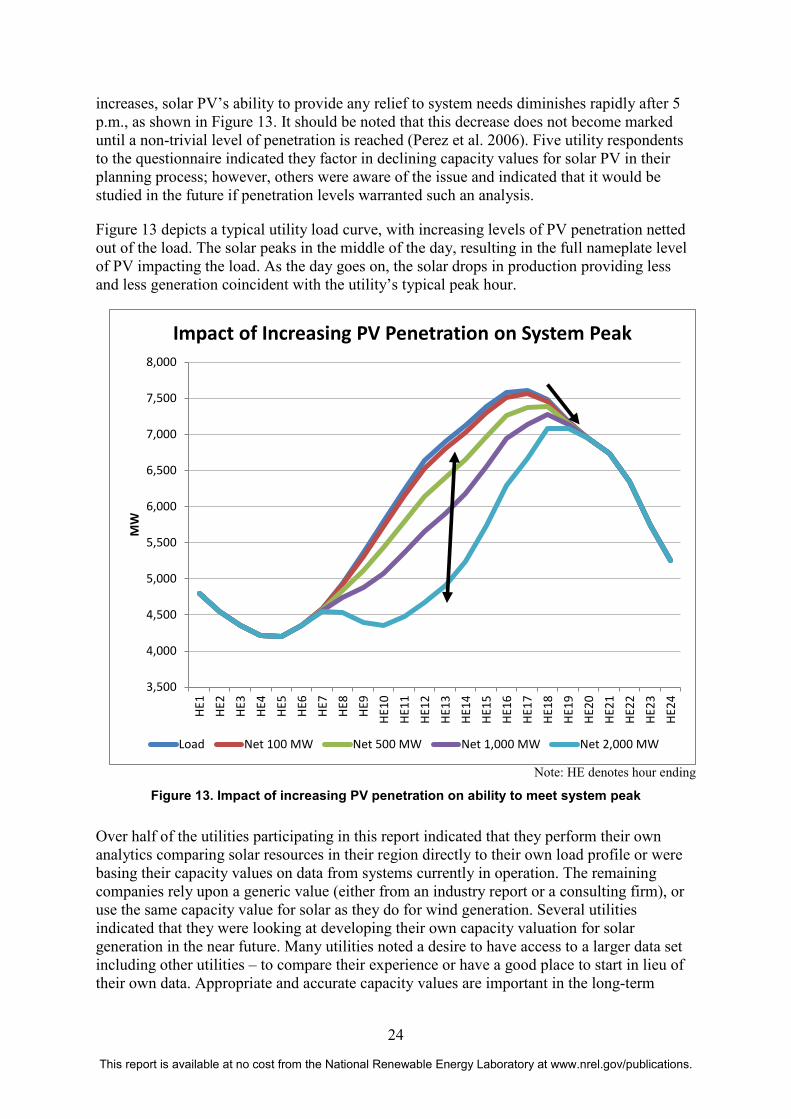
24
This report is available at no cost from the National Renewable Energy Laboratory at www.nrel.gov/publications.
increases, solar PV’s ability to provide any relief to system needs diminishes rapidly after 5 p.m., as shown in Figure 13. It should be noted that this decrease does not become marked until a non-trivial level of penetration is reached (Perez et al. 2006). Five utility respondents to the questionnaire indicated they factor in declining capacity values for solar PV in their planning process; however, others were aware of the issue and indicated that it would be studied in the future if penetration levels warranted such an analysis.
Figure 13 depicts a typical utility load curve, with increasing levels of PV penetration netted out of the load. The solar peaks in the middle of the day, resulting in the full nameplate level of PV impacting the load. As the day goes on, the solar drops in production providing less and less generation coincident with the utility’s typical peak hour.
Note: HE denotes hour ending
Figure 13. Impact of increasing PV penetration on ability to meet system peak
Over half of the utilities participating in this report indicated that they perform their own analytics comparing solar resources in their region directly to their own load profile or were basing their capacity values on data from systems currently in operation. The remaining companies rely upon a generic value (either from an industry report or a consulting firm), or use the same capacity value for solar as they do for wind generation. Several utilities indicated that they were looking at developing their own capacity valuation for solar generation in the near future. Many utilities noted a desire to have access to a larger data set including other utilities – to compare their experience or have a good place to start in lieu of their own data. Appropriate and accurate capacity values are important in the long-term
3,500
4,000
4,500
5,000
5,500
6,000
6,500
7,000
7,500
8,000
HE1
HE2
HE3
HE4
HE5
HE6
HE7
HE8
HE9
HE10
HE11
HE12
HE13
HE14
HE15
HE16
HE17
HE18
HE19
HE20
HE21
HE22
HE23
HE24
MW
Impact of Increasing PV Penetration on System Peak
Load Net 100 MW Net 500 MW Net 1,000 MW Net 2,000 MW

25
This report is available at no cost from the National Renewable Energy Laboratory at www.nrel.gov/publications.
planning context because they will allow for solar generation to meet at least a portion of future demand requirements, thereby deferring the need for some new fossil fuel generation.
3.4 Additional Considerations for Solar in Resource Planning 3.4.1 Solar Integration Costs One risk associated with solar generation without storage is adequately integrating its production fluctuations into the overall resource mix for a given utility. Based on responses to the questionnaire, discussions during interviews, and industry research, one commonly used approach is to estimate the cost (in $/MWh) to the system at large that was caused by the variable renewable resources. These studies look at the operating reserve requirements and what is needed on a 5- or 10-minute system operation timeframe. While the cost estimates are typically low, often in the $2–11/MWh range – as indicated by utility IRPs investigated by LBNL (Mills and Wiser 2012), they do represent a cost to the system once these resources are operating.22 Utilities can incorporate this cost into their CEM to provide a more robust view of the costs of this variable resource.
3.4.2 Customer-Sited Distributed Generation DG systems are typically installed behind the utility’s meter. Because the system operator does not have complete control over DG, and because the production is generally used to reduce total site demand for utility power, most utilities today treat DG as a net load impact rather than as a resource (see Appendix B, question 3). This net load approach can happen implicitly or explicitly, by either assuming that the lower load growth projections that are now used already incorporate some assumption of DG behind the meter or by projecting a DG adoption curve and then subtracting it from a gross load growth projection for their overall customer base.
Alternatively, a small number of utilities treat DG (or are strongly considering treating DG) as a generation resource option, rather than a net load impact. This approach can allow the CEM to determine a more optimized approach to the amount of DG that could be included in the resource plan, and allows for independent investigation of customer load profiles (a major driver of long-term planning results). Some potential solutions for addressing DG in modeling can be found in Section 4.2.7.
3.4.3 From Solar Planning to Procurement Resource planning focuses on long-term visions for where the utility wants to take its resource mix. The capacity expansion plan that results from the capacity expansion analytics performed in support of an IRP outlines the timing and type of resources that will likely be pursued. It then falls upon the power procurement division of the utility to turn those plans into projects that deliver energy and capacity to the grid. This section focuses mostly on PV procurement.
While long-term resource planning is used to inform power procurement at many utilities, these two operations are often run by two different departments within the utility. And the level of coordination between these groups can vary significantly from utility to utility.
22 Table 6 “Assumed integration costs used by LSEs to adjust production costs for portfolios with solar.” One important caveat is that few utilities have done system-specific studies for integration costs. Several rely upon studies done for wind integration and simply use the same $/MWh cost for solar.

26
This report is available at no cost from the National Renewable Energy Laboratory at www.nrel.gov/publications.
Utility procurement procedures typically start with a request for proposal (RFP) that is generally targeted to a specific need, be it meeting an RPS goal, adding additional peaking generation, or replacing an expiring PPA. Some utilities may use the same/similar key metrics from the IRP reviews to inform the RFP process to determine the best mix of future resources. As discussed above, PVRR is the main metric on which utilities focus. Once an RFP is issued, the focus shifts from comparing large portfolios against one another to comparing specific projects on a case-by-case basis. One approach is to compare the proposals to an avoided cost proxy. At this stage, it is critical that the utility be able to model the specifics of each proposal to determine their relative ranking. And some utilities who want to have their IRP processes drive their procurement will review the RFP criteria and outputs with the IRP planning team to make sure the procurement process is lining up with the planning process results.
The main variable in solar bids will be the site-specific production profile. Where many utilities may rely today upon generic TMY data for modeling solar in their long-term planning analysis, each proposal submitted as part of an RFP will, by necessity, contain much more granular information that impacts the solar profile. Site footprints, technology selections, array orientations, and site irradiance levels all aggregate together to produce a specific solar profile that must be analyzed. As part of the RFP process, the utility can request expected production profiles that can be evaluated and compared against each other. In fact, many utilities keep a database that compiles a historical record of all of the responses to solar RFPs; this is used as a baseline to compare against future bids.
Some renewable developers have begun to study utility valuation methods and preferences to create tailored proposals. Often, these unique proposals may have a higher development cost or lower production capabilities, but actually provide greater value to the utility reviewing the bid. As mentioned previously, a system facing west will not produce as much energy as one facing due south, but the production profile could line up much more favorably with the utility’s system peak and therefore offer greater capacity value (boosting its overall value to the utility).
From an analytical perspective, reviewing individual bids as part of an RFP process is mechanically similar to the analytics performed in the IRP process. The utility is still comparing the resources and looking for the overall lowest cost and/or best value for its customers.
By integrating more solar into the IRP process in general, utility staff will be more familiar with the modeling characteristics associated with solar generation and be more adept once bids begin coming in for those resources. Over the next several years, assuming solar development costs continue to decline and/or existing supply costs increase, more utilities will see solar generation approach grid parity with conventional generation options. It is anticipated that this trend will first become noticeable as part of traditional RFP processes, at which point those reduced pricing trends will filter back into routine long-term planning processes. Reductions in solar costs could also drive CEMs to begin selecting solar resources above and beyond what may be required to meet RPS requirements.

27
This report is available at no cost from the National Renewable Energy Laboratory at www.nrel.gov/publications.
4 Improving Solar Within Utility Supply Planning A number of key challenges of incorporating solar into supply planning analysis were raised during the utility interviews. Most of these utilities have not experienced notable levels of solar PV, CSP or CPV penetration, and have not always modeled solar in their IRP studies. Most utilities expressed an interest in incorporating and refining distributed- and utility-scale solar PV in their modeling23 because they anticipate more PV coming onto their system in the next decade. Some utilities noted that CSP and CPV are not appropriate technologies for their service territories. Several utilities mentioned that they participated in this project specifically to learn from their peers about best practices for including DG and utility-scale solar PV in their models.
This section explores some of the key benefits and challenges of incorporating solar PV into supply planning analysis and decision-making raised during the utility interviews. Note that this list is not comprehensive. It captures only items/characteristics raised by the interviewees; others may exist or emerge. This section also provides questions and answers to these challenges – many of which were identified directly by the interviewees. The goal of capturing this dialogue is to help advance the discussion of how solar could be better represented in both utility supply planning and broader utility operations.
4.1 Utility-Identified Benefits and Challenges During the course of interviews with utilities and stakeholders, several benefits and challenges associated with solar were brought up and discussed. These are not meant to be all-inclusive or applicable to all utilities. Rather, they give a sense for how solar generation is currently perceived, which may lead to a stronger understanding of how it could be adopted in the future.
4.1.1 Solar Benefits • Meeting renewable standards requirements – Many states have renewable
standards in place, and several of those have specific requirements for solar energy and/or solar renewable energy certificates (SRECs). Several utilities identified renewable mandate compliance as a key factor in their pursuit of solar generation.
• Fuel diversification – Many utilities are beginning to look at fuel diversification as a way to mitigate rate volatility for their customers. Utilities that are coal heavy expressed concern about future environmental regulations, while those that rely upon natural gas generation viewed severe historical price volatility as a motivating factor to diversify their fuel mix.
• Cost stability – Solar energy has effectively a zero dollar dispatch cost, as virtually all of the costs to operate the facility are fixed (i.e., construction cost and some fixed O&M). Utilities were drawn to avoid fuel price-related risks by essentially guaranteeing a portion of its energy requirements will be met with a very stably priced resource.
• Geographic dispersal benefits and PV modularity – Solar PV’s variability can be mitigated by dispersing solar projects across a wide geographic region. Utility interviewees liked that solar PV can be deployed on a very incremental basis; there is no standard footprint or capacity size that must be considered. PV generation is
23 All utilities interviewed were interested in PV. CSP was of interest to a few utilities, but is not a viable option for others due to the quality of resource, land constraints, etc.

28
This report is available at no cost from the National Renewable Energy Laboratory at www.nrel.gov/publications.
immensely flexible in this regard as it can be sized on a scale of hundreds of kilowatts to hundreds of megawatts. By deploying solar in smaller amounts across a wider region, a utility can smooth out any site-specific cloud variability and related quick ramping up and down. Targeting specific geographic locations for PV installations can also allow the utility to solve localized voltage concerns or avoid transmission curtailment issues within load pockets, where siting generation assets (particularly those with emissions) can be problematic. PV generation also benefits in its substantial difference in construction schedules compared to conventional natural gas and coal. Solar PV facilities can be constructed and brought online in as few as six months, while natural gas resources can take anywhere from three to five years.
• Partial correlation with peak demand – Utilities’ summer peak demands are driven primarily by air conditioning load, which results in system peaks in mid- to late afternoon each day, when the sun is still in the sky and solar generators are still producing some energy. The correlation of solar production to peak demand varies with each utility, location, technology selection, and orientation (Perez et al. 2006). Utilities interviewed for this report repeatedly stated that they believed there was a capacity value associated with solar – while not always 100%, it can be higher capacity value than with wind generation. This subject was covered in more detail in Section 3.24
• Mitigation of environmental compliance risks – Solar energy is produced with zero emissions of CO2 or other greenhouse gases (GHGs). With the federal government considering a carbon tax, cap-and-trade system, or some other mechanism intended to curb GHG emissions, utilities are contemplating future compliance costs. Diversifying portfolios with solar generation provides the added benefit of displacing emissions-generating resources.
• Avoided line losses (typically DG only) – DG resources are located at the load (the end user of electric power) rather than on the high-voltage transmission system like other forms of centralized generation. Because it is generated near the end user, the energy does not have to be transmitted across transmission and distribution lines, nor does it need to undergo any transformation (step-up or step-down) to serve load, meaning all of the typical line losses associated with remote, centralized generation resources are saved. Utilities liked that small-scale central station PV can also be located near load centers and interconnected at distribution voltages, avoiding line losses in a similar manner.25
4.1.2 Solar Challenges • Variable and Uncertain Output – Solar is a variable resource that ramps down (e.g.
cloud cover or storms) and is non-dispatchable. This means that utilities treat it as a “must take” resource and modify their economic dispatch decisions around its profile or production curve. The variability of solar is difficult to predict in advance and can lead to sudden drops and rises in the production profile at a given location. Utilities account for this variability by maintaining both spinning reserves and quick-start natural gas capacity. One third of the utilities responding to the questionnaire
24 Correlation with peak demand is also highly penetration-specific. Section 3 of this report discusses the impact of higher penetration of solar PV, and how the incremental capacity value of the next system falls. 25 Deferred transmission and distribution (T&D) costs are often discussed as another benefit of solar generation; however, during the report’s interview process, utilities either did not mention deferred T&D costs as a benefit, or stated that it may be a benefit but it had not been quantified to date.
29
This report is available at no cost from the National Renewable Energy Laboratory at www.nrel.gov/publications.
indicated that they include a cost add-on when reviewing variable resource proposals to account for the additional ramping requirements placed on their natural gas fleet.
• Ramping issues – With sufficiently high penetration levels of solar generation, operational issues can arise due to the solar generation ramping up rapidly in the morning, as the sun rises, and then ramping down rapidly in the afternoon as the sun sets. These severe ramps require the utility to have a large amount of flexible resources available (CA ISO 2013).26
• Economics – Utilities operating in a least-cost planning state must be able to prove that solar generation is economic for its customers compared to other available resources, either all-source or renewable-only. In regions where the solar irradiance levels are high, like the desert Southwest, large-scale solar has begun to compete on an economic basis with conventional natural gas-fired resources; however, in other states this convergence has not occurred. Utilities in least-cost planning paradigms that choose a more expensive resource are at risk for cost disallowances, unless they are assured there will not be a prudency review, or some form of cost recovery is pre-established. Utilities also mentioned difficulty in pursuing solar now while prices are still in steep decline, and the consequences of locking in prices that are significantly higher than what could be available 1–2 years later.
• Lack of current capacity need – The economic downturn experienced over the last several years has not only stalled load growth for utilities; in many cases it has actually caused a load reduction. Because utilities plan several years in advance to meet load, this change from the predicted load growth left many utilities long on generation capacity. In states with RPS requirements, additional generation capacity is being pursued regardless of overall capacity need, mainly because utilities want to avoid paying RPS non-compliance penalties. Adding solar generation in states that are not subject to an RPS could result in prudency concerns and associated cost disallowances.
• Cross-subsidization concerns (DG only) – When solar is installed behind a customer’s meter, the generation from that system offsets the customer’s electric usage. When that usage is less than the solar production, the generation gets exported to the utility’s distribution system. This transaction is often completed under a rate paradigm known as net energy metering (NEM). The concern from utilities comes from the fact that most retail rates (particularly those for residential customers) are designed to recover both fixed and variable costs primarily through consumption-based variable rates. As DG is installed behind the meter and offsets (or reduces) energy and load requirements, these fixed costs can go under-recovered. This issue is largely separated from utility planning requirements, but was mentioned during interviews as part of the research for this report.
• Reduced capacity benefit over time with increasing solar penetration – As solar penetration increases and begins to have a larger impact on the system in aggregate, the overall benefits that each solar system provides decreases. Utilities are concerned about this decreasing capacity benefit. This concern is expected to rise unless utilities are rigorous about adequate dispersal of resources or energy storage solutions become commercially viable from a cost and technology perspective. Potential analysis solutions are explained in Section 4.2.2.
26 This solar ramp can be viewed every day on the California ISO website (second chart), http://www.caiso.com/Pages/TodaysOutlook.aspx.
30
This report is available at no cost from the National Renewable Energy Laboratory at www.nrel.gov/publications.
4.2 Utility-Identified Key Questions and Answers Utilities and stakeholders identified their key questions about including solar as part of their long-term planning and analysis activities. Some even mentioned potential innovations or analysis methodologies to get answers to these questions. Both the key questions and answers that emerged as themes in our conversations are captured here, as best practices. Note that this section is not meant to be all-inclusive or applicable to all utilities.
4.2.1 What Are Credible Estimates of Future Solar PV Prices and Performance?
Many utilities acknowledged that in the last few years, solar prices are declining in a non-linear fashion, and a few mentioned that it appears the market will reach the U.S. Department of Energy SunShot cost goals. However, collectively, utilities had many questions about how long the solar prices will continue to decline rapidly and when prices will bottom out.
The challenge of predicting future solar PV prices was seen as a key uncertainty by most interviewees, particularly because planning is done over a multi-decade horizon. In order to consider the full range of potential resources that will be available, an accurate depiction of the trajectory of future solar PV prices would be extremely helpful.
Research and utility interviews revealed a number of reasons why PV prices are hard to estimate. There are a number of different references and data sources, and they are not always in agreement about the future of solar PV prices. It does seem that the further out in time you go, the fuzzier the price of PV becomes and the wider the range of predictions grows. There appear to be geographic distinctions in terms of resource quality, and experience of installers and other cost factors that aren’t clearly articulated in the literature. And there were questions about the current market oversupply of PV – when will it be exhausted and the supply-demand balance be reestablished? Could PV prices increase once the oversupply is exhausted, and if so, by how much? Together, these factors make PV prices seem hard to predict.
NREL and SEPA both strive to create credible, objective analyses on a variety of topics, including the cost and performance of solar PV. As such, both entities have assembled a list of useful datasets, information, tools, and reports that could help inform solar PV predictions. They include:
Data Sources that are Regularly Updated
1. NREL’s Transparent Cost Database –utility scale data (http://en.openei.org/wiki/Transparent_Cost_Database)
2. NREL’s Energy Technology Cost and Performance Data for Distributed Generation (http://www.nrel.gov/analysis/tech_cost_data.html)
3. NREL’s Open PV Project, which captures voluntary historical cost and performance data (https://openpv.nrel.gov/)
4. LBNL’s Tracking the Sun report (Barbose et al. 2013 – http://emp.lbl.gov/sites/all/files/LBNL-5919e-REPORT.pdf)

31
This report is available at no cost from the National Renewable Energy Laboratory at www.nrel.gov/publications.
Data and Analysis Snapshots in Time
1. U.S. Department of Energy November Technical Report: PV Pricing Trends: Historical, Recent, and Near-Term Projections (Feldman et al. 2012 - http://www.nrel.gov/docs/fy13osti/56776.pdf)
2. U.S. Department of Energy November Technical Report: Benchmarking Non-Hardware Balance of System (Soft) Costs for U.S. Photovoltaic Systems Using a Data-Driven Analysis from PV Installer Survey Results (Ardani et al. 2012 – http://www.nrel.gov/docs/fy13osti/56806.pdf)
3. Western Wind and Solar Integration Study - Phase 2 (integration costs only) (Lew et al. 2013 – http://www.nrel.gov/electricity/transmission/western_wind.html)
Analysis Tools
1. NREL’s System Advisor Model - advanced tool for estimating levelized cost of energy (LCOE) (http://sam.nrel.gov/)
2. NREL’s Cost of Renewable Energy Spreadsheet Tool - simplified spreadsheet tool for estimating levelized cost of energy (LCOE) (https://financere.nrel.gov/finance/content/crest-cost-energy-models)
3. NREL’s PVWatts - tool for modeling production profiles of solar resources at different geographic locations (http://www.nrel.gov/rredc/pvwatts/about.html)
4.2.2 How Should Solar Capacity Be Valued? The authors asked the utilities to explain if and how they valued solar capacity in their input assumptions, modeling, and planning. As shown in Figure 12, some ignored it altogether; a few used wind capacity valuation as a benchmark or proxy, and others have studied solar PV capacity value in detail (believing that wind is a weak proxy).
Utilities that have specifically studied and analyzed the value of solar PV capacity on their system tend to assign some sort of capacity value to PV or they indicated plans to analyze and use values in the near future. Several utilities perform their own analytics comparing solar resources in their region directly to their own load profile, rather than relying upon a generic value or using the same capacity value for solar as they do for wind generation. More recent research found that PV plants in the U.S. West have capacity values that range between 52% and 93%, depending on location and sun-tracking capability (Madaeni et al. 2013). This research also compared data- and computationally-intense reliability-based estimation techniques with simpler approximation methods and found that if designed well, simpler methods can provide accurate approximations. The most accurate of these simpler methods is weighted capacity factor of the plant (Madaeni et al. 2013). By valuing both the benefits and challenges of adding PV to their system, these utilities are able to better capture the positive and negative impacts.
The capacity value can be very specific to a particular location. Even in areas with a strong and consistent solar resource, there are concerns because the system summer peak occurs in the evening hours as commuters are returning home for the evening and just as solar facilities without storage are ramping down. Only through analysis of a specific solar technology, location, and system characteristics can a utility identify the most accurate capacity credit that can be attributed to solar on any particular system.

32
This report is available at no cost from the National Renewable Energy Laboratory at www.nrel.gov/publications.
Also, utilities will perform analysis to compare actual solar performance data to actual load data for increased precision. Comparing actual data to a forecast weather normalized load curve can provide misleading results, due to the correlations between weather and load, as well as weather and solar. TMY data (which is an average) can be compared to weather normalized load, or actual solar output can be compared to actual load data.
Importantly, only a few interviewees have considered the capacity valuation differences between fixed and tracking solar PV. The advantage of tracking solar PV is that it optimizes the amount of generation during the evening peak as the modules track the setting sun. The inclusion of tracking PV for those solar installations where it is feasible and cost effective can help optimize the output of the solar modules and reduce the overall impact of shifting the peak into the early evening hours.
Appropriate and accurate capacity values are important in the long-term planning context because they will allow for solar generation to meet at least a portion of future demand requirements. Each technology operates differently in real-world situations and can provide distinct costs and values – only by studying the differences between the two can an accurate solar PV valuation be captured.
4.2.3 How Should Solar Resource Variability Be Considered? Solar resources can vary greatly depending on where they are located. There are a few key factors that impact the amount of electricity that can be produced from a solar resource, including total solar insolation (or total sunshine on an hourly, daily, seasonal, and annual basis), cloud cover (minute-by-minute and hourly changes), shading (seasonal), and technology used. The combination of these factors and others will determine the scale of impact that one or more solar systems will have when interconnected to a utility’s electric grid.
There are several ways that a utility can reduce the potential impact on its system’s resiliency and reliability resulting from the variance of output from solar systems, particularly PV.
1. Geographic Diversity: Solar PV is a modular technology. When solar projects are scattered over a wide geographic area, the variability of the entire portfolio of solar projects is limited and greater certainty of the output of the solar portfolio can be achieved. It is similar to when an investor diversifies his/her investment portfolio so that any issues with one investment can be moderated by success in other areas.
2. Integration cost add-on: Utilities can also address resource variability by incorporating an integration cost adder into their planning analytics. This practice is done at many utilities and could be considered a common practice today. If this approach is taken, utilities will get the best analytic results if they conduct a system-specific (i.e., based on their own generation and transmission systems and resources) study to better understand this method. For example, detailed analytics could be conducted to quantify the potential need for incremental spinning and non-spinning reserves as PV penetration increases. Additional reserves can help the overall system deal with some of the ramping challenges and the best analysis will be on the utility’s own system.
33
This report is available at no cost from the National Renewable Energy Laboratory at www.nrel.gov/publications.
4.2.4 How Can Scenario Planning More Optimally Manage Risk and Uncertainty?
In some respects, today’s electric sector is starting to quickly move away from the one for which the rules and regulations were established. Utilities and regulators are focused on a wider range of options to meet increasing load than just a small number of large, central-station generators, with transmission to interconnect these large plants.
Today, there are many more supply and demand options to consider, including:
• Generation technology choices (e.g. wind, solar PV, geothermal, distributed generation)
• Demand options (demand response, energy efficiency)
• Flexibility options (storage, ramping existing generators differently than tradition)
• Co-optimization of transmission and generation simultaneously.
The potential combinations of supply, demand, and flexible technology options can feel overwhelming. Rather than address the full range of options, to save time and money several interviewees noted that they use scenario planning to consider risks and uncertainties. However, scenario planning cannot investigate the full range of technologies available and identify the optimal portfolio; it can only consider the handful of scenarios that are determined by the analysts. Moreover, examining a few optimum scenarios in depth may not allow for a full exploration of risks and uncertainty. While scenario analysis can test each variable individually, it may not allow for the full capture of interactions between variables. Utilities routinely incorporate some form of risk analysis into their long-term planning activities. One common approach is to look at the impacts of modifying one variable at a time on a portfolio’s overall metrics. This can isolate, for example, how the natural gas price forecast can impact generation dispatch, fuel mix, and the PVRR of a given set of resources.
Several utilities perform a more comprehensive and intricate set of risk analyses as part of their IRP/long-term planning procedures. This is often done by correlating key variables and running Monte Carlo simulations. These random-draw computer models can test how multiple variables can together impact both the potential results of capacity expansion decisions and the subsequent PVRR for each portfolio under consideration. Correlation among the variables has been used in the past, primarily between factors like load growth and natural gas prices. In the future, it is expected that other variables like carbon costs, prices of renewable energy credits, installed capacity costs, and other major items could be tied together so that as one is varied, the rest move in a somewhat logical and predictable fashion. These more complex and interrelated risk methods can provide a more robust vision of how something as dynamic as a portfolio of resources can interact.
4.2.5 How Can Software Models More Effectively Incorporate Solar? All of the interviewees model their electric system in order to support their supply planning decisions. While they all use different models for different purposes, the goal is the same: to better understand the impacts of their current decisions on their future outlook.
According to several interviewees, commercially available models do not keep up with the technology options and innovations that are actually available. All utilities mentioned that the software they use has one or more constraints that make them less than ideal. Requested

34
This report is available at no cost from the National Renewable Energy Laboratory at www.nrel.gov/publications.
changes or updates to the software may result in customized “one-off” versions of the model for their particular situation. Many of the utilities interviewed expressed an interest in learning more about their software options. This interest included a better understanding of the full functionality of the software options and what software other utilities are using. However, none seemed ready to try another software option until they fully understood their options, due to the large investment of money and time needed. One potential solution could be having a third-party review and explore the modeling software available today.
Second, a few utilities mentioned they were potentially interested in software upgrades. In order to make the investment in the new software option, one utility mentioned a desire to see a direct comparison of the existing software to the new software – a comparison that explains the full range of new features, the errors in previous versions that were addressed and statistics like improved run time, computing power needed, and other key factors. Potentially the software vendors or a third party could compare the improvements and advantages of the new software more clearly so that a utility can feel more confidence in moving forward with an upgrade.
The ability of commercially available models to incorporate accurate wind and solar profiles is quite limited. To better represent wind and solar, one utility said it is working on stochastically varying the wind and solar inputs in its own modeling. Instead of using a simplified representation (either a typical week each quarter, or even an average wind or solar year), this utility hopes to utilize stochastic methodologies to vary the wind and solar weather patterns.27 So, in the first year, they see one type of pattern, and in the second, a totally different pattern is used to more closely approximate the variability of wind and solar generation over seasons and years. The authors did not investigate how these more accurate wind and solar inputs could be incorporated directly into the commercial models.
4.2.6 Should Customer-Sited, Net Energy Metered Photovoltaics Be Treated as a Net Load in Modeling?
Historically, utilities have not had to model or plan for a substantive amount of distributed generation. In the last 5–10 years, the number of customer-sited PV systems has increased dramatically, and utilities are struggling with when and how to incorporate customer-sited PV into their planning and modeling. More background on customer-sited DG can be found in Section 3.4.2. Interviewees raised concerns that span several different aspects of customer on-site generation using solar PV.
Solar is often treated by utilities as a net load. The advantage is that the modeling run time of the analysis is greatly reduced. There are several challenges with this simplification. Several utilities note that load assumptions are one of the main drivers of differences between scenarios tested. Therefore if solar is treated as net load, the analyst is unable to capture the direct impact of solar PV on the system at the distributed or bulk level. Variations in load growth include DG penetration variability, but are not explicitly visible.
One utility clarified that because solar PV penetration is still “in the noise,” it is easier to model solar as netted out of load. Even when that utility modeled distributed solar PV as a resource, it found the results didn’t differ from the baseline model. Only as PV penetration reaches a certain level does it make sense to model PV as a resource, according to this utility. Several utilities did ask questions about the threshold level – when is this point reached and 27 These profiles would also be correlated to the load forecast, which is already typically part of a utility’s Monte Carlo simulations.

35
This report is available at no cost from the National Renewable Energy Laboratory at www.nrel.gov/publications.
how will they know they are approaching it? One solution could be for a third party to analyze where the point of inflection is: at what point does including distributed solar as a resource impact the system and is that inflection point different depending on the characteristics of the system?
Another utility treats customer-sited generation as a resource and does not net it out of load. In others words, even customer-sited (residential and commercial) generation competes against other generation in the dispatch queue. Similarly, they treat energy efficiency and conservation measures as a resource that can also compete and whatever resource is most cost effective wins.
This utility operates in more than one state, which can complicate the modeling because some PV and conservation measures are more cost effective in some states than in others. Even so, the utility believes that treating DG and EE as resources is a more accurate way to plan for and model these non-traditional resources. By building in DG, EE, and utility-scale generators as resources, this process allows all technologies to compete against each other on the biggest driver – cost. Together, the combination determines how much supply there will be, what resources will be available in the energy profile, and what choices are accessible during the system peak.
If a utility were interested in treating DG as a resource instead of as a net load impact, it could take its DG forecast curve (or curves, if multiple scenarios are possible) and assign it as a zero cost “must take” resource. The CEM would select it each year in lieu of other options. The PVRR of this portfolio could be compared to the PVRR of the base case run (i.e., without DG) to determine the overall cost savings from this resource. This type of information could be useful should the utility be interested in leveraging the resource planning process for DG incentive structures.
Additionally, another utility suggested including reserves for these “resources.” If DG and EE are included as resources, then utilities will likely want to include this when calculating their reserve requirements. While taking this approach does increase modeling run times and expense, one utility feels the trade-off is worth it to the increased accuracy of choosing the best combination of resources to lower overall system and operational costs.
4.2.7 How Should DG Impact on the Distribution System Be Managed? The impact of DG on the distribution system is uncertain because it has not been fully analyzed by most utilities. Utilities are interested in both the positive and negative impacts of solar on the distribution system. Until solar reaches a high level of penetration on most utility systems, especially at the feeder level, doing this type of detailed analysis is not considered to be warranted.
Most of the participating utilities acknowledged that DG penetration is expected to become notable in the next 10 years; however, a few interviewees said they were not sure how to determine the point at which DG should be included in their supply planning analyses. One utility also said it was not sure about the methodology needed to include DG penetration in its bulk power analysis studies.
New analyses could help define what is needed and when. Since this is an issue that spans across utilities, it might make sense for a national research institute, like a national laboratory, EPRI, or SEPA, to scope out and perform this analysis to inform the utilities

36
This report is available at no cost from the National Renewable Energy Laboratory at www.nrel.gov/publications.
about the general conditions for including DG. This broad analysis would allow for a starting point from which each utility can consider its unique situation.
4.2.8 How Should Net Energy Metered DG’s Impacts on Revenue Be Considered?
Although the resource planning process and resulting documents are not part of ratemaking procedures, utility supply planning does occur within the broader context of utility decision-making and is impacted by the utility's overarching goals. As such, during the discussions of resource planning, the issue of the impacts of distributed generation on utility revenues and the implications for utility planning processes arose. Here we present only the results of our discussions with utility representatives, and do not holistically explore the issue of utility revenue loss resulting from distributed generation. This key question indicates that further research is needed. For more thorough discussions of the topic, please refer to other reports (Newcomb et al. 2013, Aliff 2013, EEI 2013, Lehr and Binz 2013, and Rábago et al. 2012).
The rapid adoption of distributed generation is a concern for utilities as it represents a paradigm shift within the traditional electric utility business model. This is a hot topic in many forums held across the country and was identified as a critical issue in utility interviews.28 Utilities may want to consider examining the tipping point to determine when DG should be included in supply modeling, as well as looking at DG as both a net load and as a resource to quantify the difference in revenue required per kWh. With this information, any differences that exist can be discussed as part of a broader long-term planning stakeholder initiative.
Several interviewees mentioned their anxiety about the possibility that their distributed generation incentive programs and/or NEM programs might be more popular than anticipated. In that case, one utility mentioned that the success could lead to an overall rate increase, particularly as the utility sells less power and has fewer customers to cover the cost of the transmission and distribution system.29 Few utilities would be interested in creating incentives that result in a rate increase; utilities do not want to fundamentally change the way the revenue forecast is developed. As directed by state laws and regulations, utilities strive to be careful when developing their revenue requirements, so that their attention is on least-cost planning. This least-cost planning focus is especially important for any analyst that considers the market from the wholesale power provider perspective. Their main question is what happens to the rate revenues if this new program is successful?
None of the interviewees identified a direct solution to the possibility of rate increases that result from successful customer-sited on-site generation programs. This is likely because regulatory approval for any potential solution is required and could be challenging.
28 In 2014, NREL has several activities to analyze this space more thoroughly including quantifying methodologies for valuing costs and benefits of solar, utility operationalization of value of solar in program design and implementation, and examining DG solar issues from the regulatory perspective. Contact Karlynn Cory ([email protected]) if you have questions or would like to get involved. 29 Most retail rates are recovered as per kilowatt-hour (kWh) payments (e.g., ¢/kWh). The fewer customers that make the kWh payments, the more the remaining customers have to pay to cover the system’s transmission and distribution costs. It can be a self-defeating cycle where rising rates make it more attractive for the customers to consider on-site generation, so more of them sign up to self-generate, which results in more rate increases for the remaining customers. There is also a concern of cross-subsidization where the few who participate in on-site generation programs (generally more affluent homeowners) are subsidized by the remaining customers (generally middle- and low-income ratepayers).

37
This report is available at no cost from the National Renewable Energy Laboratory at www.nrel.gov/publications.
Considering alternative rate mechanisms may also create economic, social, and political angst within the traditional rate setting process.
Three examples of alternative rate mechanisms are currently under discussion or at the early stages of deployment30 in the United States, (and more potential solutions are expected to develop in this rapidly emerging field):
1. Fixed cost recovery via demand charges, customer charges, or standby charges In this approach, the utility modifies their residential rate schedules to recover some fixed costs through either the creation of a demand charge (which is currently very rare on a residential customer level) or by implementing a fixed customer or standby charge for customers who have DG behind their meter (Newcomb et al. 2013). This approach can be difficult to implement, as stakeholders are likely to see it as a direct charge for “going solar.” As one utility pointed out, new technologies may require new ways of thinking on the rates side as well.
2. Create a “Value of Solar” rate schedule A second approach used in Austin, Texas actually creates two separate transactions (Rábago et al. 2012). The customer continues to pay all applicable charges on their bill to the utility. Under a separate transaction (combined on the bill for simplicity), the utility purchases all of the PV system’s output from the customer at a rate that represents the value provided to the utility of that resource. This approach is beginning to gain traction. It will require a sound methodology on how to calculate the value of the resource, how to translate that into a contract rate, and what the update frequency of that rate will be. Lessons learned are starting to emerge on the program design, which others may want to consider. One utility mentioned that this is very complex and confusing for all parties (particularly customers), and that it is challenging to get consensus on appropriate methodology and the values to use.
3. Reframe the cost of service framework The final method is to develop and implement correct market and regulatory incentives to reframe the cost of service framework (Lehr and Binz 2013). One way is to perform a “line item” cost review of all of the services that the utility provides to the customer, and likewise the services that the DG customer provides back to the utility. These two buildups can then be netted for purposes of customer billing. While technically sound, this is a very complex approach.
4.2.9 Can Solar Supply Planning Be More Appropriately Linked to Other Utility Planning and Operations?
Long-term supply planning performed at utilities does not always impact supply procurement or transmission planning. For solar generation resources, particularly at the distributed level, this may not allow for the full value of these non-conventional supply sources to be captured
30 Another option that is covered in the literature, but not in the scope of the utility discussions, is to consider overhauling cost of service ratemaking used today. Some market analysts question the usefulness of cost of service ratemaking in the future, when the electric sector will be more complex with a wider variety of generation technologies, at the behind-the-meter distributed level, the wholesale distributed level (on the utility side of the meter), and at the transmission level. If regulatory approval could be secured, it may be possible to depart from the traditional model of cost of service ratemaking (Aliff 2013, EEI 2013, and Newcomb et al. 2013).

38
This report is available at no cost from the National Renewable Energy Laboratory at www.nrel.gov/publications.
by the utility unless solar supply planning is linked to other utility planning and operations. This section explores two of these factors.
Several utilities interviewed acknowledged that the tasks of analysis for generation supply planning and issuing RFPs in order to procure new supply fall to different groups. These utilities indicated that the two groups may not extensively collaborate or coordinate. Without more coordination, the RFP evaluation criteria may not reflect the future needs or expectations of the utility adequately, and future supply planning could then have to be adjusted to accommodate different generation resources than were originally modeled and anticipated as optimal.
Several utilities discussed using their internal bid database from previous RFPs as a benchmark for their anticipated RFP price results (“mark-to-market”), which is standard practice.
One utility mentioned that in addition to examining individual RFP responses and comparing them on a price basis alone, the short-list of potential awardees could be modeled in the current system to determine which of the bids actually delivers the best value to the existing portfolio, beyond just the price proposed. This is a tested approach used by other utilities (Mills and Wiser 2012). This type of detailed modeling allows more factors than least cost to be considered, including impacts on the local system, resource diversity, and supply resources that lower overall system risk. While the utility hasn’t yet implemented this type of approach, it is considering it (not only for renewables, but for all supply resources).
Another option that goes beyond the mark-to-market test is that the supply planners can be more directly involved in developing the RFP evaluation criteria. If there are specific characteristics that are desirable in the optimal supply portfolio, these can be communicated to the supply acquisition team; the supply planners also may be able to help develop specific criteria associated with each key factor. By including these criteria in the RFP and clearly articulating what the utility needs to best meet the optimal supply future (e.g., supply located in specific locations, specific technologies), the chances of getting new supply that meets those needs increases dramatically.
4.2.10 Can Transmission and Distribution Planning Be More Appropriately Linked to Supply Planning?
For most of the interviewees, supply planning does not usually inform transmission planning analysis or decisions.31 The two are regularly performed separately and do not always inform each other. While this is standard practice at the utilities interviewed, the increase in penetration of renewables, and particularly solar at the distributed level, may mean that there are unique costs and benefits that could be considered. In these cases, it might be advantageous for the generation supply and transmission planning teams to more closely coordinate. Without this discussion or additional analysis, the value of T&D deferral benefits that result from DG is likely assumed to be zero.
One utility interviewee already links generation and transmission analyses. The utility integrates generation and transmission planning through a more complicated analysis, but the utility staff feels they can identify the optimal combination of supply and transmission by examining many more scenarios. The interviewee considers many different scenarios that can
31 In some states there are rules that are intended to prevent a utility giving itself an unfair advantage by favoring its generation resources on its transmission resources.
39
This report is available at no cost from the National Renewable Energy Laboratory at www.nrel.gov/publications.
dramatically change the generation supply portfolio (along with associated constraints – e.g., range of natural gas prices, CO2 scenario). The utility also identifies a handful of new transmission build-outs across its system footprint. Then it considers the full combination of generation supply under each transmission build-out scenario. The utility analyzes the full range of combined supply and transmission portfolios to satisfy all of its stakeholders in a transparent, collaborative way.
Another utility knows that it wants to better link supply and transmission planning and has started internal discussions toward that end. The supply planners are talking to the transmission planners to think about whether localized penetrations of solar will change the delivery point load forecast in their service territory – and to consider how it could result in changes or impacts to the transmission plan. This utility hasn’t yet chosen a path forward.
4.2.11 How Can a Utility Consider Solar During Periods of Low/No Load Growth?
Today, many utilities have more generating capacity than they need due to the economic downturn. The combination of less manufacturing and industrial activity and cost-cutting measures, as well as improved energy efficiency and conservation, has flattened out the overall demand for electricity more quickly than anticipated. As a result, some generation and capacity resources added in the past decade may not be fully utilized.
Utilities continue to study new supply technology options, despite low or no load growth, for two main reasons. Many utilities are studying the impacts of repairing/retrofitting existing plants instead of replacing them. One example is whether to retire a coal plant and build a new replacement facility, retrofit it with environmental controls, or to replace the generators with alternative technologies. New supply options could inform which technologies are used for replacement.
Second, several utilities pointed out the current lack of demand growth is a near-term issue for all resources, not just renewables. Sometime in the future, new supply planning will be needed. One utility suggested the desire to investigate and analyze the full range of technology options available today, taking time to better understand those options. In so doing, the utility suggested that full range of costs and values could be considered, including ways to reduce overall portfolio risk (e.g., increased diversity), ways to hedge against or reduce uncertainty (e.g., potential future fuel price scenarios), and better understanding of the cost of the full range of alternatives.
4.2.12 Other Considerations for Solar in Capacity Expansion Models and Ongoing Research
Modeling an electric system can be challenging for sub-hourly timing specifically and for integration modeling more generally. This section examines the challenges with sub-hourly modeling, capacity expansion models, and explores the impacts of broader modeling approaches, based on current NREL research. Wind and solar can vary on a minute-by-minute basis, whereas most production cost models run only hourly simulations over a year. Therefore it is challenging for today’s production cost models to run sub-hourly and to consider how to integrate the wind and solar resource more closely to actual production. Likewise, running detailed cost models at 5-minute levels can drastically increase run times and may not be practical overall.

40
This report is available at no cost from the National Renewable Energy Laboratory at www.nrel.gov/publications.
Some utility analysts have performed analysis of integration costs at 5- or 10-minute intervals, but not many. These utility analysts estimate integration costs in the range of $2–$11/MWh, as explained in Section 4.4.1 (Mills and Wiser 2012). Importantly, this range reflects assumptions used by utilities, not the range of estimates found in detailed studies of PV variability (due to the paucity of actual studies). Utilities can examine these previous studies and use the information found therein as proxies for the cost of solar integration on their system, as a first-cut approximation.
Another option is to run the analysis over shorter timeframes. If the utility’s goal is to determine solar feasibility, then detailed simulations of “tough” periods make sense. Instead of running a 5- or 10-minute model for the entire year, one utility suggested that running “one-off” cases can help, by examining a month or two at 5- or 10- minute intervals. Another utility suggested that modeling could be performed using a 5-minute dispatch on a representative day or week each month during the planning horizon. Either way, utilities could be able to study variability impacts without having to wait for the entire year to run.
If the utility’s goal is to improve the accuracy of PVRR estimates, then the utility might only need to run an hourly model with additional operating reserves to represent the cost of resources that will be needed to chase sub-hourly deviations.
Several of the methods and assumptions used to characterize renewable energy technologies in CEMs can significantly impact the simulated value of solar generators, and associated deployment of solar resources in utility IRPs. Ongoing research at NREL and within the academic community has identified some modeling choices that are likely to overestimate the value of solar, while others under-represent the contribution of solar to system performance. The magnitudes of these impacts are frequently utility- and scenario-specific, and this is an area of active research to identify modeling methodologies that can accurately capture the value of solar generators to system performance.
Based on current knowledge, four common modeling approaches are discussed below, along with their impact on simulated solar resource selection.
• Addition of solar capacity to previously-optimized generation portfolios can lead to suboptimal resource selection. Some utilities optimize capacity expansion without renewable resources, and then add solar resources to the conventional generation fleet without accounting for the energy and capacity contributions from solar generators. These portfolios do not represent a least-cost resource plan because they do not co-optimize renewable and conventional generation resources in the CEM (Mills and Wiser 2012). This practice is akin to assigning solar a 0% capacity value, and results in higher simulated costs of adding solar resources to a utility portfolio than if the CEM had co-optimized the deployment of conventional and renewable generation resources.
• Failing to account for decreasing marginal capacity credit can inflate the perceived value of solar generation to a utility system. As outlined in Section 3, the marginal or incremental capacity value of new solar installations can decrease as more solar resources are installed, because the utility’s peak in net load shifts from afternoon to evening. Failing to account for this by dynamically calculating the capacity credit of solar generation as a function of installed solar capacity will likely result in CEM scenarios where solar is expected to provide more firm peak capacity
41
This report is available at no cost from the National Renewable Energy Laboratory at www.nrel.gov/publications.
than is feasible. This can over-estimate the value of solar generation in a utility system and lead to higher than optimal solar deployment.
• Renewable generation and other infrastructure investments by other, neighboring utilities can impact optimal solar investment in a utility’s own service territory. Utilities in the United States operate within synchronized electrical interconnections where new generation resources outside a utility’s service territory can impact transmission line congestion and the price and accessibility of power transfers from other regions. Several recent studies have analyzed renewable resource build-out pathways and their impacts on power flow and marginal energy costs (Mai et al. 2013; Milligan et al. 2012; Lew et al. 2010). These studies suggest that failing to account for out-of-state capacity expansion either directly or through dynamic boundary conditions can lead to sub-optimal investment within a utility’s jurisdiction. For example, if high solar deployment is expected in a neighboring region, a utility might cost-effectively choose to rely on market purchases during hours of peak solar generation when solar electricity may suppress marginal electricity costs in boundary regions, rather than developing solar resources within their service territory. The sign and magnitude of this impact is highly system- and scenario-specific, and could lead to over- or under-estimates in simulated optimal solar deployment.
• The representation of thermal generator operating limits can impact the optimal level of solar resource investment. To estimate production costs and determine the most cost-effective combination of generating resources to meet load, some CEMs rely on a load duration curve-based approach, and others use a simplified, chronological dispatch. The latter approach can be improved by modeling generator commitment states as integer or binary variables, rather than continuous variables, in order to capture important generator characteristics such as minimum stable generation level and minimum up and down time. A chronological approach with explicit representation of generator commitment status has been shown to more accurately model the impacts of solar production on the cycling and ramping behavior of thermal (gas and coal) plants (Palmintier and Webster 2011). CEMs that do not model these constraints are likely to find sub-optimal generation portfolios and fail to represent the true impact of solar production variability on system cost, which could lead to over or underestimations.
These and other modeling considerations are likely to have important impacts on the selection of solar resources in utility IRP processes. Building on prior analysis (Mai et al. 2013), current work at NREL aims to more accurately quantify the impacts of these and other modeling approaches and assumptions on optimal solar deployment levels in utility planning processes (Mai et al. 2014 Forthcoming). This research is focused on identifying ways that commercial CEMs could be improved to more accurately represent renewable energy value within a utility portfolio. Specifically, near term research will use a newly developed CEM, NREL’s Resource Planning Model, to quantify the sensitivity of optimal solar deployment to different methods for quantifying solar capacity value, different representations of renewable development in neighboring utilities’ jurisdictions, and different methods for modeling thermal generation and transmission constraints. Preliminary findings using Colorado-area utilities as an example are expected to be published in early 2014.32
32 For more information on this ongoing work, please contact Trieu Mai ([email protected]).

42
This report is available at no cost from the National Renewable Energy Laboratory at www.nrel.gov/publications.
4.2.13 Summary of Solar Supply Planning Challenges and Solutions Table 5 summarizes the challenges utility interviewees identified for incorporating solar PV into utility supply planning, as well as some potential solutions. While this is not comprehensive, this information may advance the discussion of how to better represent solar energy in utility supply planning.
Table 5. Challenges and Utility-Identified Best-Practices for Incorporating Solar Into Utility Supply Planning, Based on Utility Interviews
Main Challenge Challenge Details Potential Solutions
Future Solar PV Price Uncertainty
What is a credible estimate of future solar PV prices? Or a range of predictions?
Gather and review reputable data sources, many of which are publicly available. Compare a wide variety of public historical costs and predictions of solar (and other renewable) costs.
Solar PV Technology Characteristics
How should I value solar capacity, if at all?
Utilities that have studied the value of solar capacity tend to assign some value through solar-specific analysis. Study the capacity value of solar specific to your location, technology and utility system. Consider tracking, as it may reduce the system peak shift into the early evening.
How concerned should I be that solar PV output can vary greatly?
Dispersal of solar PV over a wide geographic area can diversify output and create overall greater certainty in total solar output.
Risk and Uncertainty – Limitations of Scenario Planning
Scenario planning may not address full range of risk, uncertainty, and the full range of interactions between the supply, demand and flexibility technology options available today.
Develop more comprehensive and more inclusive risk analysis to address today’s complex electricity market and technology options.
Modeling Commercially available models don’t keep up with or include technology innovations; software is sometimes less than ideal.
Explore and compare software options – it would be particularly helpful for a third party to compare the software available today (to available packages as well as upgrades). Optimize wind and solar modeling inputs and move away from simplifications.
Integration at the sub-hourly level is challenging using today’s models.
Test 5-minute intervals for 1 or 2 key months instead of the entire analysis period. To improve PVRR, include additional operating reserves in hourly modeling.
Customer-Sited PV
Load assumptions drive scenario results.
Treat both DG and EE as resources instead of as net load
Uncertainty of how DG impacts the distribution system.
Perform analysis to understand when and how DG needs to be included (perhaps through a third party). Begin to model on-site generation as its own resource to see impact on distribution.
Desire to avoid a rate increase. Consider alternative rate mechanisms, including solar tariff rates (utility collects for services and self-generators get payment for their full benefits).
Link Solar Supply Planning to Other Utility Planning and Operations
Resource RFPs are not always linked to supply planning.
Go beyond mark-to-market solar database; consider modeling RFP finalists to understand their value in today’s system; also coordinate with supply planners to include specific RFP criteria in procurement.
Transmission planning and decisions are not always linked to supply planning.
Simultaneously examine optimal generation and transmission planning through combined analysis.
Low/No Load Growth
Load growth has slowed or halted and utilities have more generating capacity than they need.
Analyze the full suite of potential supply and demand technologies available for replacing retiring plants, compared to environmental control retrofits. Better understand options to meet future resource needs.

43
This report is available at no cost from the National Renewable Energy Laboratory at www.nrel.gov/publications.
5 Utility-Identified Analysis Needs Solar generation is becoming a viable resource for inclusion in IRP/long-term planning analytics across the country. In some regions solar generation already competes from a cost perspective, while in other states and regions, RPS requirements may still drive solar adoption. Through utility discussions, the authors identified several areas that warrant further consideration and research to better understand the impact of solar on local and regional utility operations, and how it can be optimized to best support the resiliency of the electric grid. These include:
• Credible PV price and performance data – Identify and gather PV price and performance data. Utilities could consider centralizing the data into a database with a trusted third-party, who could aggregate the information so the breadth and depth of the data can be shared between utilities, without specific project or utility identifiers.
• Analysis of how to incorporate geographically diversified resources into modeling – Utilities today typically allow their CEM to consider a standard size (MW) for each potential resource it may select (i.e., a 50-MW solar generator, or a 110-MW combustion turbine).
Solar is unique in that its footprint is scalable to any size requirement and can be integrated across a large geographic region. Rather than installing a static 50-MW solar farm at one location, a utility could choose instead a set of ten 5-MW solar farms spread out across its service territory. This approach is not typically used in IRP processes today, but further analysis could explore the possibilities and explain the modeling implications. Question for investigation could include – what size makes sense for these smaller farms? Where could they be realistically located? And how does spreading them out impact local and overall system operation?
These smaller systems would be easier to interconnect (due to the fact that they could tie in at lower voltages), and the variable and intra-minute fluctuations (i.e., quick ramping) due to cloud cover and other weather events could be smoothed. Staggering systems from east to west in a service territory could stagger ramping up and down across the aggregate production. Such an approach, while not currently implemented in IRPs today, may be viable and provide a glimpse into how solar can be optimized in the future. Additional analysis to explore different configurations of smaller solar farms could be informative to utility decision-makers.
• Analysis of the potential relationship between energy storage and PV – Energy storage applications are an intriguing match for solar generation. Although storage is less important at current low penetrations, at high penetrations storage could be useful in smoothing fluctuations in solar production, or as a method to provide firm output across the system peak. Storage may be particularly helpful for distributed applications, to help address potential islanding due to high percentages of distributed solar on a particular feeder. There are several pilot projects that tie solar and energy storage together, but to date there has not been long-term analysis of efforts to bundle these technologies.
The primary roadblocks to incorporating energy storage are its high cost to deploy and uncertainty in how to value the resources it can provide. Unlike solar generation (or any fossil-fuel resource), energy storage does not actually generate power; rather, it stores it, presumably from a less expensive time to a more expensive (peak) time. This arbitrage by itself is difficult to cost justify because of the inherent losses in
44
This report is available at no cost from the National Renewable Energy Laboratory at www.nrel.gov/publications.
storing energy. Pairing storage with solar generation to increase its capacity value and providing both smoothing and firming services may create sufficient justification for deploying energy storage resources.
Current analysis explores some key aspects of energy storage including operational benefits (Denholm et al. 2013), market and policy barriers (Sioshani et al. 2012), high penetration of renewables in combination with storage (Augustine et al. 2012 and Denholm and Hand 2011), and ways that storage can reduce renewable energy curtailment (Denholm 2012). More analysis on the benefits and different configurations of solar and energy storage could inform ways to consider specific storage-PV combinations, and their direct impact on utility operations.
• Easier ways to predict impacts of increased PV penetration – In Figure 13, varying levels of PV penetration were shown with their relative impact on a utility’s peak load day. The higher the penetration, the less its incremental capacity will be able to contribute to meeting the utility’s peak demand.33 Currently, CEM software tools appear unable to model this dynamic impact to capacity values.
High penetration of PV and renewables has been analyzed, including large-scale solar deployment (Drury et al. 2012) and technologies that enable high wind and solar penetration (Denholm 2011). Including these capabilities and modeling the interactions more closely could allow for a more robust picture of system interactions at higher levels of solar penetration.
• Better risk/uncertainty analysis methods (beyond scenario planning) – Examine and consider performing more comprehensive risk analyses as part of long-term planning, because scenario planning is not capable of investigating the full range of technologies available in order to identify the optimal portfolio. Using an advanced risk analysis method (e.g. Monte Carlo), correlate key variables (load growth, natural gas prices, carbon costs, renewable energy technology prices, installed capacity costs, etc.) so that if one is varies, the rest move in a logical fashion.
• Improved commercial production cost models –Include technologies in analysis that are not currently available or poorly represented in commercially available models.
Today’s PCMs are only capable of doing a resource dispatch hourly. However, solar output may fluctuate enough within the hour from cloud cover and other weather events to create operational impacts that are not currently captured. Several utilities mentioned a desire to be able to model the variability of solar (and other variable renewables such as wind) on an intra-hour basis.
Intra-hour cost modeling is not currently done because running PCMs on any time scale less than an hour would require massive amounts of computing power, or slow the model run time such that analysis would take significantly longer timeframes. As explained in Section 4.2.6, this timeframe could be run for a few key months, or for a few representative weeks each month. This level of analysis may be sufficient to reveal the implications of solar production variances and the level of flexible quick-start generators required. In addition, improvements in PCMs themselves (i.e. decreased run-times) or using faster, more powerful computers (i.e., high performance computing centers) could address these issues so intra-hour solar could be modeled more easily.
33 For additional information on this decreasing capacity value, please see: Perez et al. 2006.

45
This report is available at no cost from the National Renewable Energy Laboratory at www.nrel.gov/publications.
• Translate distribution system impacts to long-term plans – Much discussion has occurred in recent years regarding the true value and cost of solar generation, particularly as it relates to the distribution grid. Solar advocates believe that system upgrades can be deferred and asset lives extended due to solar being located on local feeders. Utilities are more skeptical and see the potential need for significant system upgrades in the future because the existing distribution system was not designed for bi-directional flow. While IRPs do not often address long-term distribution system planning, effects on distribution system values and costs could become important for incorporation, particularly as NEM expands across the country.
• Clarity about when to include distributed generation in supply modeling – PV systems are often tied in behind a customer’s meter. As such, these systems can be modeled in an IRP as a net load impact that highlights reduced retail sales in the future, or as a stand-alone resource. The method used impacts the PVRR on a per kWh basis for all customers. Utilities may want to consider examining the tipping point to determine when DG should be included in supply modeling, as well as looking at DG as both a net load and as a resource to quantify the difference in revenue required per kWh. With this information, any differences that exist can be discussed as part of a broader long-term planning stakeholder initiative.

46
This report is available at no cost from the National Renewable Energy Laboratory at www.nrel.gov/publications.
Glossary avoided cost The incremental costs of electric energy or other services, if a utility did not
purchase from the existing power seller; the focus is on the cost of alternatives available to the buyer/utility.34
azimuth The angle between the north direction and the projection of the surface normal into the horizontal plane; measured clockwise from north.35 More simply stated it is the angle between due north (0 degrees) and the direction from which the sunlight is coming. On the equinoxes, the sun rises at due east with an azimuth of 90 degrees, and sets at due west with an azimuth of 270 degrees. At solar noon in the northern hemisphere, the azimuth angle is 180 degrees.
baseload generation Electric generating facilities within a utility system that are operated to the greatest extent possible to maximize system mechanical and thermal efficiency and minimize system operating costs.36 Baseload generation typically has annual load factors that exceed 75%. Examples include coal-fired, natural gas combined cycle, nuclear, very large, damned hydroelectric (i.e. not run of river), geothermal and biomass.37
capacity expansion model (CEM)
A computer software tool used in resource planning to determine potential expansion of electricity generation, storage and transmission systems over several decades. The model chooses the cost-optimal mix of technologies that meet reserve requirements, technology-specific resource constraints and policy constraints.38 Results are used to generate plans for electricity capacity additions or energy purchases, and are tested in production simulation models to determine the final cost and emissions outputs. Inputs to the model include variables such as existing generating assets and purchased power contracts, potential resources, load growth assumptions, fuel cost curves, capital and operations/maintenance expenses.
capacity factor (CF) The ratio of actual energy produced by an energy generating unit or system in a given period, to the hypothetical maximum possible (i.e. energy produced from continuous operation at full rated power).39
capacity value The value assigned to a generating facility, based on the extent to which the facility can help reliably serve load.40 In this report, we use capacity value in the sense used by resource planners (expressed as a percentage of maximum generating capacity), rather than the monetary or market value assigned to the capacity.
derate factor (DC/AC) A number accounting for the loss of power in the conversion from DC to AC power. The overall derate factor for a system is the product of the derate factors for the components of the system.
distributed generation (DG)
Generation located on a utility distribution system, typically at or near the load. For purposes of this report, DG is often intended to mean customer-sited PV.
34 Adapted from EEI’s Glossary of Electric Industry Terms, http://www.eei.org/resourcesandmedia/products/glossry_electerm/Pages/default.aspx 35 Quoted from: http://www.solarbuzz.com/resources/glossary 36 Quoted from EEI’s Glossary of Electric Industry Terms, http://www.eei.org/resourcesandmedia/products/glossry_electerm/Pages/default.aspx 37 Adapted from http://www.renewableenergyworld.com/rea/news/article/2009/10/how-to-compare-power-generation-choices 38 Quoted from NREL’s Energy Analysis description of the Regional Energy Deployment System model (ReEDS), http://www.nrel.gov/analysis/reeds/description.html 39 Quoted from OpenEI: http://en.openei.org/wiki/Definition:Capacity_factor 40 Adapted from http://www.ise.osu.edu/isefaculty/sioshansi/papers/pv_cv.pdf

47
This report is available at no cost from the National Renewable Energy Laboratory at www.nrel.gov/publications.
Effective Load-Carrying Capability (ELCC)
The ability of a power generator to support additional peak load without reducing the reliability of the electrical system (in terms of loss of load probability or loss of load expectation). The amount of ELCC for a particular generator is calculated by determining the amount of existing supply capacity that can displaced by the source while serving the same load profile and maintaining the reliability of the electrical system.
energy storage Devices or technologies that can store electrical energy so that it can be used to meet demand at a later time.41 Adding an energy storage system to a solar photovoltaic system allows the solar energy to be used when the sun is not shining. This expands the flexibility of the photovoltaic system.
greenhouse gases (GHG)
Gases that trap heat in the atmosphere.42 Specifically, they absorb and emit infrared radiation and contribute, either directly or indirectly, to the process of absorption and re-dispersion of thermal radiation coming from a planet’s surface (the greenhouse effect). Greenhouse gases include water vapor, carbon dioxide, methane, nitrous oxide, ozone and chlorofluorocarbons (CFCs).
grid parity The point where the cost of alternative energy sources equals the cost of electricity purchased from the grid.43
heat rate A common measure of the efficiency of a steam power plant. The amount of energy input to an electric generator to generate one kilo-watt hour of electricity generated; typically represented in Btu/kWh.44
integrated resource plan (IRP)
A plan developed by an electric power provider, sometimes required by a public regulatory commission or agency, that defines the short and long term capacity additions (supply side) and demand side management programs that it will undertake to meet projected energy demands.45
integrated resource planning (or resource planning)
The process of developing an integrated resource plan.
intermediate generation (load-following power plants)
Power-generating equipment that can vary its level of output (generation) in response to changes in electricity demand. Normally operated on a daily cycle to serve on-peak loads during the day but not off-peak loads during nights and weekends.46 Typically, these plants have annual load factors ranging from 40% - 60%. Examples include smaller coal-fired power plants, natural gas combined cycle plants, most hydroelectric (when the weather cooperates), and in the future, offshore wind power, concentrated solar power, thermal solar power and wave energy.47
load duration curve A graph that illustrates the average (or peak) hourly load, from highest to lowest, sorted in decreasing order for all 8,760 hours per year.48 The area under the load duration curve represents the total demand for the period of time. Load Duration Curves are used in capacity planning.
Monte Carlo A problem solving technique used to approximate the probability of certain outcomes by running multiple trial runs, called simulations, using random variables.49 A class of computational algorithms that use repeated random sampling, by running simulations many times over, in order to compute the probability of an occurrence; especially useful for simulating systems with many variables, or coupled degrees of freedom with significant uncertainty.50
41 Adapted from http://energy.gov/oe/technology-development/energy-storage 42 Quoted from U.S. Environmental Protection Agency: http://www.epa.gov/climatechange/ghgemissions/gases.html 43 Adapted from NREL: http://www.nrel.gov/docs/fy12osti/54527.pdf 44 Adapted from: http://www.eia.gov/tools/faqs/faq.cfm?id=107&t=3 45 Quoted from http://www1.eere.energy.gov/tribalenergy/guide/glossary.html 46 Quoted from http://www.risk.net/energy-risk/glossary/2040393/intermediate-generation-cycling-generation 47 Adapted from http://www.renewableenergyworld.com/rea/news/article/2009/10/how-to-compare-power-generation-choices 48 Adapted from RMI: http://www.rmi.org/RFGraph-load_duration_curve 49 Quoted from Investopedia: http://www.investopedia.com/terms/m/montecarlosimulation.asp 50 Adapted from Wikipedia: http://en.wikipedia.org/wiki/Monte_Carlo_method

48
This report is available at no cost from the National Renewable Energy Laboratory at www.nrel.gov/publications.
net dependable capacity
The maximum amount of electricity that a generating system or facility can reliably produce during the most restrictive seasonal conditions, minus the amount of electricity that is consumed by the facility itself, if any.
net energy metering (NEM)
A policy that allows a customer to receive a financial credit from the utility for power generated by their distributed energy system that is fed onto the electricity grid (net, or after most is used on-site by the customer, behind the meter). The credit is used to offset the customer's electricity bill and rules vary by jurisdiction.
peaking generation Generation from power plants that normally operate to serve loads during peak load times or during system emergencies, and that operate at very low annual load factors (5%-15%). Examples include natural gas combustion turbine, and simple cycle turbine (natural gas- or oil-fueled).51
peak demand/peak load
A period of time during the day, month, season or year during which the peak electrical demand/load/use occurs on the electric system. In warm climates, the peak electrical use may occur in the summer, when there is high demand for electricity to run air conditioning. In cold climates, the peak demand may occur during winter when there is high demand for heating.
planning horizon The period of time (in years) that a planning process covers.
(generation) portfolio The collection of energy generation assets (power plants or purchased energy) available (or planned) to be used by a utility to meet the load.
present value The current worth of a cash flow, after considering interest. Future value becomes present value through the process of discounting.52
Present Value of Revenue Requirements (PVRR)
A dollar amount that represents the total annual revenue, discounted to present dollars at the time of calculation that a utility must collect from customers to pay all costs and expenses including a reasonable return on investment.53
production cost modeling (PCM)
Production cost modeling simulates hourly electric generation dispatch over the entire planning horizon. Production costing models are used extensively in the electric power industry to forecast the expected amount of electricity produced by different power generation units and the expected cost of producing that electricity for a given power generation system.54 The models can be used to forecast the expected amount of electricity production and to perform sensitivity analyses that account for the expected variation of load over time and the expected availability of generating facilities and, often times, transmission and distribution capacity, while accounting for uncertainties (e.g. fuel price, seasonal variations).
Power Purchase Agreement (PPA)
A legal contract between an electricity generator and a power purchaser for the sale of energy, capacity and/or ancillary services. The contract includes all the terms of the sale and often serves to determine the credit quality of the generating project by financers.55
renewable energy certificate
The property rights to the environmental, social, and other non-power qualities of renewable electricity generation. A REC, and its associated attributes and benefits, can be sold separately from the underlying physical electricity associated with a renewable-based generation source.56
renewable portfolio standard (RPS)
A legislated mandate for utilities to generate or purchase a portion (generally expressed as a percentage) of electricity sold from certain renewable generating sources, such as wind, solar, geothermal, biomass and biogas.
51 Adapted from Adopted from http://www.renewableenergyworld.com/rea/news/article/2009/10/how-to-compare-power-generation-choices 52 Quoted from: http://www.eei.org/resourcesandmedia/products/glossry_electerm/Pages/default.aspx 53 Adapted from Pennsylvania code: http://www.pacode.com/secure/data/052/chapter57/subchapktoc.html 54 Quoted from ERCOT: http://www.ercot.com/content/meetings/lts/keydocs/2011/0110/Production_Cost_Modeling_Presentation_10JAN2011.pdf 55 Adapted from: http://en.wikipedia.org/wiki/Power_Purchase_Agreement 56 Quoted from the EPA: http://www.epa.gov/greenpower/gpmarket/rec.htm

49
This report is available at no cost from the National Renewable Energy Laboratory at www.nrel.gov/publications.
resource mix The different types of generating facilities that contribute to meeting the load of an electric system within a defined area.
solar renewable energy credit (SREC)
A Renewable Energy Credit generated by a solar generating system, which indicates the production of a unit of solar energy. SRECs are tradable within some U.S states and regions that have Renewable Portfolio Standards, or voluntary green power markets.
typical meteorological year (TMY)
A set of hourly weather data for a particular location over a period of a year that represent a typical year and are consistent with the long-term averages. TMY files capture typical conditions for your location of interest and are available in TMY2 (most current 30 years) or TMY3 (most current 7, 10, or 15 years) constructs.57 The data (which include temperature, solar radiation and precipitation) are often used for conducting simulations to facilitate the design and location of solar energy systems.
weather normalization
An adjustment methodology that accounts for weather. Normalization allows for the comparison of energy consumption between different periods of time or geographic locations that have different weather conditions by factoring out aberrations or unusual occurrences (e.g. variables such as higher than or lower than normal outside air temperature).
57 Quoted from Weather Analytics: http://www.weatheranalytics.com/weather-products/simulation-and-modeling/tmy-files/

50
This report is available at no cost from the National Renewable Energy Laboratory at www.nrel.gov/publications.
References Aliff, Gregory. (2013). “The Math Does Not Lie. Factoring the Future of the U.S. Electric Power Industry.” Deloitte Center for Energy Solutions. http://www.deloitte.com/assets/Dcom-UnitedStates/Local%20Assets/Documents/Energy_us_er/us_er_DeloitteMathDoesNotLie_102212.pdf
Ardani, Kristin; Barbose, Galen; Margolis, Robert; Wiser, Ryan; Feldman, David; and Ong, Sean. (2012). Benchmarking Non-Hardware Balance of System (Soft) Costs for U.S. Photovoltaic Systems Using a Data-Driven Analysis from PV Installer Survey Results. NREL/TP-7A20-56806; DOE/GO-102012-3834. http://www.nrel.gov/docs/fy13osti/56806.pdf
Augustine, C.; Bain, R.; Chapman, J.; Denholm, P.; Drury, E.; Hall, D.G.; Lantz, E.; Margolis, R.; Thresher, R.; Sandor, D.; Bishop, N.A.; Brown, S.R.; Cada, G.F.; Felker, F. (2012). “Renewable Electricity Futures Study. Volume 2: Renewable Electricity Generation and Storage Technologies. (Volume 2 of 4).” Golden, CO: National Renewable Energy Laboratory. NREL/TP-6A20-52409-2. http://www.nrel.gov/docs/fy12osti/52409-2.pdf
Barbose, G. (2013). “Renewables Portfolio Standards in the United States: A Status Update.” Presentation to the National Conference of State Legislatures. May 2, 2013. http://www.cleanenergystates.org/assets/2013-Files/RPS/Barbose-RPS-Presentation-NCSL-Spring-2013.pdf.
Barbose, Galen L., Naïm Darghouth, Samantha Weaver, and Ryan H. Wiser. (2013). “Tracking the Sun VI: An Historical Summary of the Installed Price of Photovoltaics in the United States from 1998 to 2012.” Berkeley: Lawrence Berkeley National Laboratory. http://emp.lbl.gov/sites/all/files/lbnl-6350e.pdf
California Independent System Operator. (CA ISO 2013). “Renewables: Graph shows aggregated output from renewables connected to the ISO grid.” California ISO website: Today’s Outlook, accessed August 2013 at http://www.caiso.com/Pages/TodaysOutlook.aspx
Database of State Incentives for Renewables and Efficiency. (DSIRE 2013). “RPS Policies with Solar/DG Provisions.” Accessed July 16, at http://www.dsireusa.org/documents/summarymaps/Solar_DG_RPS_map.pdf
Denholm, P.; Jorgenson, J.; Hummon, M.; Jenkin, T.; Palchak, D.; Kirby, B.; Ma, O.; O'Malley, M. (2013). Value of Energy Storage for Grid Applications. NREL/TP-6A20-58465. Golden, CO: National Renewable Energy Laboratory. http://www.nrel.gov/docs/fy13osti/58465.pdf
Denholm, P. (2012). “Energy Storage to Reduce Renewable Energy Curtailment.” Prepared for the 2012 IEEE Power and Energy Society General Meeting, 22-26 July 2012. NREL/CP-6A20-53533. http://dx.doi.org/10.1109/PESGM.2012.6345450
Denholm, P. (2011). “Enabling Technologies for High Penetration of Wind and Solar Energy.” Prepared for ASME 2011 5th International Conference on Energy Sustainability & 9th Fuel Cell Science, Engineering and Technology Conference (ESFuelCell2011), 7-10

51
This report is available at no cost from the National Renewable Energy Laboratory at www.nrel.gov/publications.
August 2011. Paper No. ES2011-54500. NREL/CP-6A20-50868. http://dx.doi.org/10.1115/ES2011-54500
Denholm, P.; Hand, M. (2011). “Grid Flexibility and Storage Required to Achieve Very High Penetration of Variable Renewable Electricity.” Energy Policy. (39:3), March 2011; pp. 1817-1830. NREL/JA-6A20-49400. http://dx.doi.org/10.1016/j.enpol.2011.01.019
Drury, E.; Brinkman, G.; Denholm, P.; Margolis, R.; Mowers, M. (2012). “Exploring Large-Scale Solar Deployment in DOE's SunShot Vision Study.” Prepared for 38th IEEE Photovoltaic Specialists Conference, 3-8 June 2012. NREL/CP-6A20-55372. http://dx.doi.org/10.1109/PVSC.2012.6317716
Edison Electric Institute (EEI 2013). “Disruptive Challenges: Financial Implications and Strategic Responses to a Changing Retail Electric Business.” Prepared by Peter Kind of the Energy Infrastructure Advocates for the Edison Electric Institute. January 2013. http://www.eei.org/ourissues/finance/Documents/disruptivechallenges.pdf
Energy Information Administration (EIA 2013). “Annual Energy Outlook 2013.” Washington, D.C.: U.S. Department of Energy. DOE/EIA-0383(2013); supporting data to Figure 79, accessed August 2013, http://www.eia.gov/forecasts/aeo/pdf/0383(2013).pdf
Feldman, David; Barbose, Galen; Margolis, Robert; Wiser, Ryan; Darghouth, Naïm; and Goodrich, Alan (2012). Photovoltaic (PV) Pricing Trends: Historical, Recent, and Near-Term Projections. NREL/TP-6A20-56776; DOE/GO-102012-3839. http://www.nrel.gov/docs/fy13osti/56776.pdf
Hoff, T.; R. Perez, J.P. Ross, and M. Taylor (2008). Photovoltaic Capacity Valuation Methods. Solar Electric Power Association Report #02-08. http://www.solarelectricpower.org/media/84207/sepa%20pv%20capacity.pdf
Krishanmoorthy, Bart; Mike Taylor; and Becky Campbell (2013). 2012 SEPA Utility Solar Rankings. Solar Electric Power Association Report #02-13. http://www.solarelectricpower.org/media/324121/final-2012-top-10-report-v2.pdf
Lehr, Ron and Binz, Ron (2013). “New Utility Business Models: Implications of a High-Penetration Renewable Energy Future.” Prepared for the session “New utility model for a low load growth/high DG future” of the Joint Meeting of Committee on Regional Electric Power Cooperation and State-Provincial Steering Committee, April 8-10, 2013. http://www.westgov.org/wieb/meetings/crepcsprg2013/briefing/Lehr-Binz.pdf
Lew, D.; Brinkman, G.; Ibanez, E.; Florita, A.; Heaney, M.; Hodge, B. M.; Hummon, M.; Stark, G.; King, J.; Lefton, S. A.; Kumar, N.; Agan, D.; Jordan, G.; Venkataraman, S. (2013). “Western Wind and Solar Integration Study Phase 2.” NREL/TP-5500-55588. Golden, CO: National Renewable Energy Laboratory. http://www.nrel.gov/docs/fy13osti/55588.pdf
Lew, D.; Brinkman, G.; Kumar, N.; Besuner, P.; Agan, D.; Lefton, S. (2012). “Impacts of Wind and Solar on Fossil-Fueled Generators.” Preprint. Prepared for the 2013 IEEE Power and Energy Society General Meeting. NREL/CP-5500-53504. Golden, CO: National Renewable Energy Laboratory. http://www.nrel.gov/docs/fy12osti/53504.pdf

52
This report is available at no cost from the National Renewable Energy Laboratory at www.nrel.gov/publications.
Lew, Debra; Nicholas Miller; Kara Clark, Gary Jordan and Zhi Gao. (2010). Impact of High Solar Penetration in the Western Interconnection. NREL/TP-5500-49667. Golden, CO: National Renewable Energy Laboratory. http://www.nrel.gov/docs/fy11osti/49667.pdf
Madaeni, S. H.; Sioshansi, R.; Denholm, P. (2013). “Comparing Capacity Value Estimation Techniques for Photovoltaic Solar Power.” IEEE Journal of Photovoltaics (3:1); January 2013; pp. 407-415. NREL/JA-6A20-54703. http://dx.doi.org/10.1109/JPHOTOV.2012.2217114
Mai, Trieu (et al. – TBD). (2014 Forthcoming – a quantification of the impact of modeling approaches and assumptions on optimal solar deployment levels in utility planning processes). For more information, please contact Trieu Mai ([email protected])
Mai, T., E. Drury, K. Eurek, N. Bodington, A. Lopez, and A. Perry. (2013). Resource Planning Model: An Integrated Resource Planning and Dispatch Tool for Regional Electric Systems. NREL/TP-6A20- 56723. Golden CO: National Renewable Energy Laboratory. January 2013. http://www.nrel.gov/docs/fy13osti/56723.pdf
Mai, T.; Wiser, R.; Sandor, D.; Brinkman, G.; Heath, G.; Denholm, P.; Hostick, D.J.; Darghouth, N.; Schlosser, A.; Strzepek, K. (2012). Renewable Electricity Futures Study: Volume 1: Exploration of High-Penetration Renewable Electricity Futures. NREL/TP-6A20-52409-1. Golden, CO: National Renewable Energy Laboratory. http://www.nrel.gov/analysis/re_futures/
Milligan, M.; Ela, E.; Hein, J.; Schneider, T.; Brinkman, G.; Denholm, P. (2012). Renewable Electricity Futures Study: Volume 4:Bulk Electric Power Systems: Operations and Transmission Planning.” NREL/TP-6A20-52409-4. Golden, CO: National Renewable Energy Laboratory. http://www.nrel.gov/docs/fy12osti/52409-4.pdf
Mills, A. and Wiser, R. (2012). An Evaluation of Solar Valuation Methods Used in Utility Planning and Procurement Processes. LBNL-5933E. Berkeley, CA: Lawrence Berkeley National Laboratory. http://emp.lbl.gov/sites/all/files/lbnl-5933e_0.pdf
Newcomb, James; Lacy, Virginia; and Hansen, Lena. (2013). “New Business Models for the Distribution Edge: The Transition from Value Chain to Value Constellation” Boulder, CO: Rocky Mountain Institute Electricity Innovation Lab (e-lab). April 2013. www.rmi.org/new_business_models
Palmintier, B., & M. Webster. (2011). “Impact of Unit Commitment Constraints on Generation Expansion Planning with Renewables.” Prepared for 2011 IEEE Power and Energy Society General Meeting, Detroit, Institute of Electrical and Electronics Engineers. http://web.mit.edu/b_p/pdf/Palmintier%20and%20Webster%20-%202011%20-%20Impact%20of%20Unit%20Commitment%20Constraints%20on%20Generation%20Planning%20with%20Renewables.pdf
Perez, R; R. Margolis; M. Kmiecik; M. Schwab; and M. Perez. (2006). “Update: Effective Load-Carrying Capability of Photovoltaics in the United States.” Preprint. Prepared for the 2006 American Solar Energy Society 35th Annual Conference. NREL/CP-620-40068. Golden, CO: National Renewable Energy Laboratory. June 2006. http://www.nrel.gov/docs/fy06osti/40068.pdf

53
This report is available at no cost from the National Renewable Energy Laboratory at www.nrel.gov/publications.
PVsyst. (2013). “General description of the PVsyst Software,” PVsyst 6 Help file, accessed August, http://files.pvsyst.com/help/index.html?general_descr.htm
PVWatts. (2013) “PVWatts” Renewable Resource Data Center, accessed August, http://www.nrel.gov/rredc/pvwatts/
Rábago, Karl; Libby, Leslie; Harvey, Tim; Norris, Benjamin; and Hoff, Thomas. (2012). Designing Austin Energy’s Solar Tariff Using a Distributed PV Value Calculator. Self-published by Karl Rábago and Clean Power Research. Accessed July 9, 2013 at http://rabagoenergy.com/files/value-of-solar-rate.pdf
State and Local Energy Efficiency Action Network. (SEE Action 2011). Washington, D.C.: U.S. Department of Energy SEE Action Program. http://www1.eere.energy.gov/seeaction/pdfs/ratepayer_efficiency_irpportfoliomanagement.pdf
Solar Electric Power Association (SEPA) (2013). Centralized Solar Projects Bulletin: Member-Only News and Information. Q2 2013 edition. August 2013. http://www.solarelectricpower.org/media/351408/sepa-bulletin-q2-2013-final.pdf
Sioshansi, R.; Denholm, P.; Jenkin, T. (2012). “Market and Policy Barriers to Deployment of Energy Storage.” Economics of Energy and Environmental Policy (1:2); March 2012; pp. 47-63; NREL/JA-6A20-53820. http://dx.doi.org/10.5547/2160-5890.1.2.4
Wilson, Rachel and Bruce Biewald. (2013). “Best Practices in Electric Utility Integrated Resource Planning.” Prepared by Synapse Energy Economics for the Regulatory Assistance Project. June 2013. http://www.raponline.org/document/download/id/6608 .
Wilson, Rachel and Paul Peterson. (2011). “A Brief Survey of State Integrated Resource Planning Rules and Requirements.” Prepared by Synapse Energy Economics for the Clean Skies Foundation. April 28. http://www.cleanskies.org/wp-content/uploads/2011/05/ACSF_IRP-Survey_Final_2011-04-28.pdf
Wyoming Public Service Commission. (WY PSC 2013). “Commission Guidelines Regarding Electric IRP.” Accessed August 2013 at http://psc.state.wy.us/pscdocs/dwnload/ElectricIRPGuidelines7-10.pdf

54
This report is available at no cost from the National Renewable Energy Laboratory at www.nrel.gov/publications.
Appendix A – Tennessee Valley Authority Case Study
I. Who is TVA? The Tennessee Valley Authority (TVA) is the largest publicly owned electric utility in the United States. It is a federal corporation that was created in 1933 by Congress as part of the New Deal to help move the country out of the Great Depression.
TVA is the primary electricity provider in Tennessee and also covers areas of Mississippi, Alabama, Georgia, North Carolina, Kentucky, and Virginia. The company works with 155 municipal and cooperative distributors that resell over 80% of the TVA-generated power to their consumers. The remainder of the TVA power is sold directly to 51 large industrial customers and six federal installations. Besides power production, TVA provides navigation, flood control, and land management services for the Tennessee River system.
TVA is a self-regulated utility and is not subject to oversight by any state public service commissions, as are other regulated utilities. This means that state-level policies do not apply to the area within the TVA district and TVA is not required to produce an Integrated Resource Plan (IRP).
The company’s 2011 IRP, TVA’s Environmental and Energy Future, was the result of over 30 months of effort and was the first IRP TVA had completed since 1995. TVA was under no obligation to update the 1995 plan, but by 2008 it was clear that the time had come to reconsider the future. TVA staff redesigned the way the IRP would be developed, driven by a strong desire to improve the methodology for considering and planning for a variety of alternative futures. The resulting methodology and product highlighted here is an example of a thoughtful IRP process with clearly presented results.
II. Envisioning the Future: Developing the TVA Scenarios As TVA approached the task of producing a new IRP, staff from across the company were brought together to brainstorm the attributes of all possible futures and describe these future worlds. Once the most likely futures had been agreed upon, they were presented to stakeholders using storyboards. After stakeholder vetting, the plausible futures were passed on to planning modelers for transformation into individual scenarios through the identification of appropriate assumptions and constraints. This initial phase of conceptualizing the scenarios and modeling the parameters to match those “futures” was a time-consuming step. In fact, it was so critical that it is now incorporated into TVA’s annual planning process.
For their 2011 IRP, TVA developed eight future scenarios:

55
This report is available at no cost from the National Renewable Energy Laboratory at www.nrel.gov/publications.
• Dramatic Economic Recovery • Environmental Focus as a National Priority • Prolonged Economic Malaise • Game-Changing Technology • Focus on Energy Independence • Carbon Regulation Creates Economic Downturn • Reference Case: Spring 2010 • Revised Reference Case: Great Recession Impacts Recovery These scenarios were based on distinct visions of the future that were vetted in collaboration with stakeholders. For each scenario, uncertainty values were identified (e.g. commodity prices, environmental regulations, etc.) and then used as attributes to describe each future. Forecasts for each attribute were developed, discussed with internal and external stakeholders, and compared across scenarios to ensure reasonableness. A review of the scenario definitions after completion of the study made it apparent that some of the scenarios were similar in many respects; that is, some attribute values did not show significant variations across the scenarios. Over time, TVA has realized the importance of ensuring that each imagined future is both distinct and credible. Making sure that each scenario is sufficiently different and likely to occur avoids wasting time and resources on duplicative efforts and far-fetched notions. For example, there is little need to consider a future with 2% load growth if there is little expectation that this future will occur.
In their upcoming IRP,58 TVA plans to reduce the number of scenarios, perhaps by half. To accomplish this goal, the 2015 IRP will focus on more distinct futures based on key uncertainties of particular interest to stakeholders. This approach aims to satisfy specific cases of interest to a wide variety of stakeholders (e.g., assumptions regarding penetration of distributed generating resources). TVA anticipates that stakeholder involvement in the creation of these scenarios will improve understanding and buy-in during the more complex modeling phase.
III. Developing the TVA Strategies Once scenarios were finalized, strategies that represented potential business decisions and portfolio choices that TVA could control were developed. First, key components of the strategies were defined, such as the types of generation technologies from which TVA could select and the development of new transmission infrastructure. Company management and stakeholders were consulted during this phase, to identify what business strategies they were willing to consider. If management were not on-board with a particular component, such as the accelerated development of nuclear, there would be no need to consider it.
Next, development of the strategies was accomplished by combining variations of the key components. A total of nine key components (or attributes) were selected, with input from public scoping efforts. These key components included four model inputs and four model constraints:
58 In general, as long as the long-term plan remains in line with the outcomes of the annual planning cycle, TVA does not deem it necessary to update the IRP. Although originally scheduled to begin in 2015, TVA will begin updating the IRP in late 2013, with a completion date of 2015. This effort is in direct response to stakeholder requests to review the company’s plans in light of changing natural gas prices and other key uncertainties. The company has already begun to reach out to stakeholders, including the solar industry, to continue to improve the methods through which solar can best be considered within the IRP process.

56
This report is available at no cost from the National Renewable Energy Laboratory at www.nrel.gov/publications.
• The level of the energy efficiency and demand response included in each strategy • The amount of renewable resources input in each strategy • The schedule for coal-fired idling to be tested • The option of including a pumped-storage unit • Constraints on the addition of new nuclear capacity • Constraints on technology and timing of new coal facilities • Constraints on gas-fired unit expansions • Constraints on the type and level of transmission infrastructure to support the resource
options in each strategy.
Through the consideration of these key components, five business strategies, represented by different resource portfolios for the future, were developed:
1. Limited change in current resource portfolio 2. Baseline plan resource portfolio 3. Diversity-focused resource portfolio 4. Nuclear-focused resource portfolio 5. Energy efficiency/demand response-focused resource portfolio.
The strategies were differentiated from each other by the extent to which each key component was included in the strategy. That is, each key component was assigned a numerical boundary or range for each strategy (e.g., the Energy Efficiency and Renewable Focused strategy included the addition of 5,100 MW of renewables by 2020). In response to stakeholder comments, the target ranges for energy efficiency, demand response, and renewable energy were increased in the strategies during the strategy development process.
The attributes of the five strategies were used as modeling inputs to create optimized generation portfolios. First, an optimized capacity expansion plan was generated using Ventyx’s System Optimizer tool, which minimizes the PVRR for each portfolio. The resulting portfolios were then evaluated using an hourly production cost model with stochastics, Ventyx’s Strategic Planning Model (MIDAS). The model determined the range of plan costs based on Monte Carlo modeling of thirteen key variables that account for commodity prices, financial variables, operating costs, dispatching costs, and load forecast uncertainties. These variables differ from the key attributes (described above) in that the variables are not business decisions, but variables that are not in the utility’s control.
The total PVRR for each resource plan was calculated by using the random set of uncertainty variables drawn for stochastic iteration. The mean value across the plan cost distribution from the set of iterations was used as the reported plan cost of each strategy in a particular scenario.
One portfolio was generated for each of five planning strategies associated with each of the six future scenarios during the draft phase of the IRP study. In addition, there was a portfolio for each of the five strategies associated with the Reference Case. This resulted in a total of 35 portfolios. Each portfolio represented a 20-year plan for capacity expansion.

57
This report is available at no cost from the National Renewable Energy Laboratory at www.nrel.gov/publications.
IV. Selecting Preferred Strategies To evaluate the 35 portfolios, TVA (with input from stakeholders) created a scorecard. The goal was to identify trends or common characteristics that could lead to the most desirable outcomes.59 The scorecard organized and communicated the evaluation process, which involved scoring each of the five strategies on its cost, risk, environmental impacts, and other strategic metrics.60 The scoring process was subject to public comment, during which there were discussions of the trade-offs, constraints and compromises. These discussions, as well as a sensitivity analysis to identify top performing strategies were used to refine the evaluation results during the final phase of the IRP.
The results of this scoring process, as well as a narrative explaining the technology investments associated with each strategy, were included in a draft IRP study report. The report was released for public comment consistent with the requirements of the National Environmental Policy Act (NEPA). A companion Environmental Impact Study (EIS) report was also issued with the draft IRP results. Based on public comment and stakeholder input, adjustments were made to the assumptions and the strategies following the release of the draft findings. During the final phase of the IRP, additional modeling and analysis was completed and led to the development of a Recommended Planning Direction, which consisted of guideline ranges for key components of the resource plan that performed well across most scenarios. This Recommended Planning Direction was submitted to the TVA Board of Directors and was adopted in April 2011.The final IRP defined TVA’s short- and long-term strategic direction and identified short-term actions.
V. Involvement and Role of Distribution Companies In the years leading up to 2008, the 155 distributors of TVA contemplated separating from TVA. As a result, there was not significant involvement of individual distribution companies during the initial stages of the IRP process. However, the association that represents the distributors, The Tennessee Valley Public Power Association (TVPPA), did participate as a stakeholder during the IRP process.
Today, there is more direct collaboration with the 155 distributors, and while they are not closely involved in the IRP, they do have involvement primarily through various committees of TVPPA. There is a wide variety of levels of experience and interest in capacity expansion planning amongst the distributors, with some having little knowledge or interest in the details of new capacity needs or construction. The fuel source and technology by which the electricity they distribute is produced has, to date, not been an expressed as the overriding concern, and distributors are more adamant that the cost of power from TVA remains as low as possible.
The distribution companies are, however, the ultimate implementers of all distributed generation programs (such as distributed solar or energy efficiency and demand response products), and therefore need to understand the benefits and challenges of distributed generation on their system. Likewise, TVA needs to know which distributors will be offering distributed generation programs to their customers and the extent of the customer-interest, in order to estimate the role that distributed generation will play in meeting future load and its effect on future transmission 59 Determining which outcomes were the most desirable (i.e. what were the indicators of a successful portfolio) was challenging but critical. 60 See TVA 2011 IRP, Chapter 6, pages 103-1 for details on the scorecard evaluation.

58
This report is available at no cost from the National Renewable Energy Laboratory at www.nrel.gov/publications.
system needs. In some cases, the distribution companies have expressed some reluctance to share information regarding customer involvement in distributed generation with TVA.
The uncertainties associated with the TVA relationship to its distributors, including the potential of separation and the imperfect information regarding future involvement in efficiency, demand response, and distributed generation programs, introduces an element of risk into the TVA capacity planning process. If communication surrounding these uncertainties remains unchanged, this risk will increase with rising penetration of distributed generation on the system. Currently, TVA planners assume an overall level of DG penetration and adoption across the TVA territory; however, a methodology that includes sub-region-specific DG penetration curves may be necessary in the future.
VI. Renewable Energy and Energy Efficiency Program Considerations
For the 2011 IRP, a fixed portfolio for renewable energy and energy efficiency was created outside of the capacity planning model and input as must-take transactions. These portfolios were designed using standard cost-effectiveness tests and other techniques and during the IRP were tested to confirm overall benefit, although individual components of the defined portfolios were not optimized directly in the models. The renewable energy portfolios were pre-selected based on a determination of future markets and the availability of supply. In its upcoming IRP, TVA wants to allow the model to select the renewable energy portfolio from a variety of options based on current market and resource data. This will result in more optimized renewable energy costs and production profiles. A similar approach to energy efficiency resource selection is also planned for the next IRP, based on direct optimization of small blocks of efficiency based on end-use or customer segment groups.
VII. Conclusion TVA executed a thorough resource planning process that includes significant and meaningful stakeholder involvement, and culminates in a clearly written Integrated Resource Plan. TVA dedicates significant resources to informing, surveying and responding to stakeholders through all phases of the planning process, from scenario formulation to portfolio selection. The TVA IRP explains this process; results are well-organized and clearly written and thus are accessible to all stakeholders.
59
This report is available at no cost from the National Renewable Energy Laboratory at www.nrel.gov/publications.
Appendix B – Select Utility Questionnaire Responses
1. What is your integrated resource planning horizon?
Total number of responses: 22
2. What is the average annual consumption growth percentage for your planning horizon, net of any energy efficiency or customer-sited generation impacts?
Total number of responses: 22
14%
18%
41%
5%
9%
5%
9%
0%
5%
10%
15%
20%
25%
30%
35%
40%
45%
10 years 15 years 20 years 25 years 30 years 35 years Other
0 2 4 6 8 10 12
< 0%
0-1%
1-2%
2-3%
> 3%
Number of Responses

60
This report is available at no cost from the National Renewable Energy Laboratory at www.nrel.gov/publications.
3. How is distributed, net metered solar (behind the meter) incorporated into the modeling?
Total number of responses: 22
46%
18% 14%
23%
0.0%5.0%
10.0%15.0%20.0%25.0%30.0%35.0%40.0%45.0%50.0%
Negative loadthat changesconsumption
profiles
Generationresource
Notincorporated
due tonegligible
penetration
Other (orAdditional
Comments)

61
This report is available at no cost from the National Renewable Energy Laboratory at www.nrel.gov/publications.
4. (a) Does your utility incorporate long-term transmission system planning into its resource planning process?
Total number of responses: 22
(b) Does your utility incorporate long-term distribution system planning into its resource planning process?
Total number of responses: 22
86%
0%
14%
0.0%10.0%20.0%30.0%40.0%50.0%60.0%70.0%80.0%90.0%
100.0%
Yes No, but will for nextplanning cycle
No
41%
5%
55%
0.0%
10.0%
20.0%
30.0%
40.0%
50.0%
60.0%
Yes No, but will for nextplanning cycle
No
62
This report is available at no cost from the National Renewable Energy Laboratory at www.nrel.gov/publications.
5. (a) What capacity expansion model software does your utility utilize? (ex. Strategist)
Other: Plexos, Aurora, P&R CapEx, EGEAS, Outsource to 3rd party
Total response count: 21
(b) What production cost modeling software system does your utility use? (ex. PROMOD)
Other: Plexos, Aurora, Ascend Analytics PowerSimm, Market Analytics, RTSim, MIDAS
Total number of responses: 21
29%
10%
14%
19%
29%
0%
5%
10%
15%
20%
25%
30%
Strategist System Optimizer In-House Model Unknown/None Other
10%
19%
10% 10%
14%
10%
29%
0%
5%
10%
15%
20%
25%
30%
Gentrader ProMod Pmonth PROSYM Planning andRisk (PaR)
Unknown /N/A
Other

63
This report is available at no cost from the National Renewable Energy Laboratory at www.nrel.gov/publications.
6. (a) What type of risk analytics does your company perform?
Total number of responses: 21
(b) Which variables do you stress?
Total number of responses: 21
Other or additional comments: • We vary hydro output • Stochastic modeling stresses: load, gas prices, power prices, and outages • Energy efficiency is a single-variable sensitivity; the other items are stressed
stochastically. The other item stressed in the risk analysis is the market price for electricity
• Other commodity prices, financial parameters, O&M costs, availability • Sensitivities are run around multiple variables. • fuel consumption, fuel costs, as-available energy purchases, as-available energy
curtailment, capital cost for new generation, independent power producer payments/costs • High/Low Distributed Generation • EE Costs, Inflation • Fuel consumption, fuel costs, as-available energy purchases, as-available energy
curtailment, capital cost for new generation, independent power producer payments/costs
67% 52% 57%
76%
10%
0.0%
20.0%
40.0%
60.0%
80.0%
Single-variablesensitivities
Stochasticanalyses
Monte Carlo Discretescenarios
Other orAdditionalComments
86% 71%
33%
95%
29%
57% 48% 43%
0.0%10.0%20.0%30.0%40.0%50.0%60.0%70.0%80.0%90.0%
100.0%
Natural gasfuel prices
Carboncosts
Installedcapacity
costs
Load Federal orstate
incentivesor tax
decisions
Renewablerequirement
decisions
Energyefficiency
levels
Other orAdditionalComments

64
This report is available at no cost from the National Renewable Energy Laboratory at www.nrel.gov/publications.
7. How do you choose solar capacity sizes for candidate portfolio evaluation?
Total number of responses: 21
Other or additional comments:
• Solar capacity size is standard based on MWh needs (i.e., RPS MWh requirements) • Based on customer request • Sizes are based upon actual projects • To meet our Sustainability Targets - 20% by 2020, solar is one of many sustainable
options that is valued • Policy directed from governing board
43%
19%
10%
29%
0.0%
5.0%
10.0%
15.0%
20.0%
25.0%
30.0%
35.0%
40.0%
45.0%
50.0%
Standard size based onnameplate megawatts,i.e. 20 MW increments
Standard size based onmegawatt-hours needs,
i.e. RPS MWhrequirements
Dynamic/Scalable Other (or AdditionalComments)

65
This report is available at no cost from the National Renewable Energy Laboratory at www.nrel.gov/publications.
8. (a) What capacity values for resource adequacy purposes do you assign for each type of solar resource? Note: not capacity factors
Note: Numbers in circles represent the number of utility responses
Total number of responses: 21

66
This report is available at no cost from the National Renewable Energy Laboratory at www.nrel.gov/publications.
b) What are these capacity values based on?
Total number of responses: 21 Other or additional comments:
• Regional Transmission Organization • We will continue to analyze PV levels of generation, PV ability to meet electricity
demand, etc. to determine the capacity value of PV. • Initially RFP's. Thereafter, we gather actual solar operational production data to track
against estimates. If needed, we will adjust our capacity values accordingly.
c) What methodology was utilized to calculate the capacity value?
Total number of responses: PV – 21; CSP – 18
43%
29% 24%
10%
29%
0.0%5.0%
10.0%15.0%20.0%25.0%30.0%35.0%40.0%45.0%
Internal utilityresearch
Experience withoperational
systems
General industryreports
Consultant(s)research
Other or AdditionalComments
0
5
10
15
20
25
PV CSP
Num
ber o
f Res
pons
es
Unsure
Other
Solar Load Control Capacity
Capacity Factor
Peak Time/Season Windows
Effective Load Carrying Capacity

67
This report is available at no cost from the National Renewable Energy Laboratory at www.nrel.gov/publications.
9. (a) Do you incorporate an integration cost adder for solar resources?
Total number of responses: 21
(b) As solar PV is considered a non-firm resource, does your utility explicitly add a firming cost for valuation purposes?
Total number of responses: 21
If yes, please describe the methodology/approach:
• Estimate at this point, as we have little experience. • Indirectly, by applying coincident capacity value • Cost of natural gas back up is used • It varies based on valuation method
33%
10%
57%
0.0%
10.0%
20.0%
30.0%
40.0%
50.0%
60.0%
Yes No, but will in next planningprocess
No
14%
43%
0%
43%
0.0%5.0%
10.0%15.0%20.0%25.0%30.0%35.0%40.0%45.0%50.0%
Yes No, but it is implicitlycaptured on a portfolio
basis in the capacityexpansion model
No, but will in nextplanning process
No