treasury management strategy 2021/22 - wakefield
TRANSCRIPT

Treasury Management Strategy 2021/22
TREASURY
MANAGEMENT
STRATEGY
2021/22

Treasury Management Strategy 2021/22 CONTENTS
1. Introduction
1.1 Background
1.2 Reporting Requirements
1.3 Treasury Management Strategy 2021/22
1.4 Training
1.5 Treasury Management Consultants
2. Capital Prudential Indicators
2.1 Capital Expenditure
2.2 Capital Financing Requirement
2.3 Minimum Revenue Provision
3. Borrowing
3.1 Portfolio Position
3.2 Treasury Indicators
3.3 Interest Rate Forecasts
3.4 Investment and Borrowing Rates
3.5 Borrowing Strategy
3.6 Borrowing Requirement
3.7 Borrowing in Advance of Need
3.8 Debt Rescheduling
3.9 New Financial Institutions as a Source of Borrowing
4. Annual Investment Strategy
4.1 Investment Policy Management of Risk
4.2 Creditworthiness Policy
4.3 Liquidity of Investments
4.4 Specified Investments
4.5 Non-specified Investments
4.6 Monitoring Credit Ratings
4.7 Investment Strategy
4.8 Treasury Management Advisors
4.9 Member and Officer Training
Annexes
1 Prudential and Treasury Indicators
Capital Expenditure
Affordability Indicators
Prudence Indicators
External Debt Indicators
Treasury Management Indicators
2 Treasury Management Practices
3 Treasury Management Report for the period to 31st December 2020
Treasury Management Strategy 2021/22 1. Introduction
1.1 Background
1.1.1 The Council is required to operate a balanced budget, which broadly means that
cash raised during the year will meet cash expenditure. Part of the treasury
management operation is to ensure that this cash flow is adequately planned, with
cash being available when it is needed. Surplus monies are invested in low risk
counterparties or instruments commensurate with the Council’s low risk appetite,
providing adequate liquidity initially before considering investment return
1.1.2 The second main function of the treasury management service is the funding of the
Council’s capital plans. These capital plans provide a guide to the borrowing need of
the Council, essentially the longer-term cash flow planning, to ensure that the Council
can meet its capital spending obligations. This management of longer-term cash may
involve arranging long or short-term loans, or using longer-term cash flow surpluses.
On occasion, when it is prudent and economic, any debt previously drawn may be
restructured to meet Council risk or cost objectives.
1.1.3 The contribution the treasury management function makes to the authority is critical,
as the balance of debt and investment operations ensure liquidity or the ability to
meet spending commitments as they fall due, either on day-to-day revenue or for
larger capital projects. The treasury operations will see a balance of the interest
costs of debt and the investment income arising from cash deposits affecting the
available budget. Since cash balances generally result from reserves and balances,
it is paramount to ensure adequate security of the sums invested, as a loss of
principal will in effect result in a loss to the General Fund Balance.
1.1.4 CIPFA defines treasury management as:
“The management of the local authority’s borrowing, investments and cash
flows, its banking, money market and capital market transactions; the
effective control of the risks associated with those activities; and the pursuit of
optimum performance consistent with those risks.”
1.1.5 Revised reporting was required from the 2019/20 reporting cycle due to revisions of
the MHCLG Investment Guidance, the MHCLG Minimum Revenue Provision (MRP)
Guidance, the CIPFA Prudential Code and the CIPFA Treasury Management Code.
The primary reporting changes include the introduction of a capital strategy, to
provide a longer-term focus to the capital plans, and greater reporting requirements
surrounding any commercial activity undertaken under the Localism Act 2011. The
capital strategy is being reported separately.

Treasury Management Strategy 2021/22 1.2 Reporting Requirements
1.2.1 Capital Strategy
1.2.1.1 The CIPFA revised 2017 Prudential and Treasury Management Codes require, from
2019-20, all local authorities to prepare an additional report, a capital strategy report,
which will provide the following:
A high-level long term overview of how capital expenditure, capital financing
and treasury management activity contribute to the provision of services
A high-level long term
An overview of how the associated risk is managed
The implications for future financial sustainability
1.2.1.2 The aim of this capital strategy is to ensure that Full Council fully understands the
overall long-term policy objectives and resulting capital strategy requirements,
governance procedures and risk appetite.
1.2.2 Treasury Management Reporting
1.2.2.1 The Council is currently required to receive and approve, as a minimum, three main
treasury reports each year, which incorporate a variety of policies, estimates and
actuals.
1.2.2.2 Prudential and treasury indicators and treasury strategy (this report) - The first, and
most important report is forward looking and covers:
The capital plans, (including prudential indicators)
A minimum revenue provision (MRP) policy, (how residual capital expenditure
is charged to revenue over time)
The treasury management strategy, (how the investments and borrowings are
to be organised), including treasury indicators; and
An investment strategy, (the parameters on how investments are to be
managed)
1.2.2.3 A mid-year treasury management report – This is primarily a progress report and will
update members on the capital position, amending prudential indicators as
necessary, and whether any policies require revision, if applicable.
1.2.2.4 An annual (outturn) treasury report – this is a backward looking review document and
provides details of a selection of actual prudential and treasury indicators and actual
treasury operations compared to the estimates within the strategy.
1.2.2.5 The above reports are required to be adequately scrutinised before being
recommended to the Council. This role is undertaken by the Audit and Governance
Committee.
Treasury Management Strategy 2021/22
1.3 Treasury Management Strategy
1.3.1 The strategy for 2021/22 covers two main areas:
1. Capital issues
The capital expenditure plans and the associated prudential indicators;
The minimum revenue provision (MRP) policy;
2. Treasury management issues
Current treasury position;
Treasury indicators which limit the treasury risk and activities of the Council;
Prospects for interest rates
Borrowing strategy
Policy on borrowing in advance of need
Debt rescheduling
Investment strategy
Creditworthiness policy
Policy on use of external service providers
1.3.2 These elements cover the requirements of the Local Government Act 2003, the
CIPFA Prudential Code, MHCLG MRP Guidance, the CIPFA Treasury Management
Code and MHCLG Investment Guidance.
1.4 Training
1.4.1 The CIPFA Code requires the section 151 officer to ensure that elected members
with responsibility for treasury management receive adequate training in treasury
management. This especially applies to members responsible for scrutiny. Annual
training is provided by the Council’s treasury management adviser, Link Group,
Treasury Solutions and the most recent training was undertaken by Members on 27th
January 2021.
1.4.2 The training needs of treasury management officers are periodically reviewed.
1.5 Treasury Management Consultants
1.5.1 The Council uses Link Group, Treasury Solutions as its external treasury
management advisors.
1.5.2 The Council recognises that responsibility for treasury management decisions
remains with the organisation at all times and will ensure that undue reliance is not
placed upon the services of our external service providers. All decisions will be

Treasury Management Strategy 2021/22
undertaken with regards to all available information, including, but not solely, our
treasury advisers.
1.5.3 It also recognises that there is value in employing external providers of treasury
management services in order to acquire access to specialist skills and resources.
The Council will ensure that the terms of their appointment and the methods by which
their value will be assessed are properly agreed and documented, and subjected to
regular review.
Treasury Management Strategy 2021/22 2. Capital Prudential Indicators
2.1 The Council’s capital expenditure plans are the key driver of treasury management
activity. The output of the capital expenditure plans is reflected in the prudential
indicators, which are designed to assist members’ overview and confirm capital
expenditure plans.
2.2 Capital Expenditure
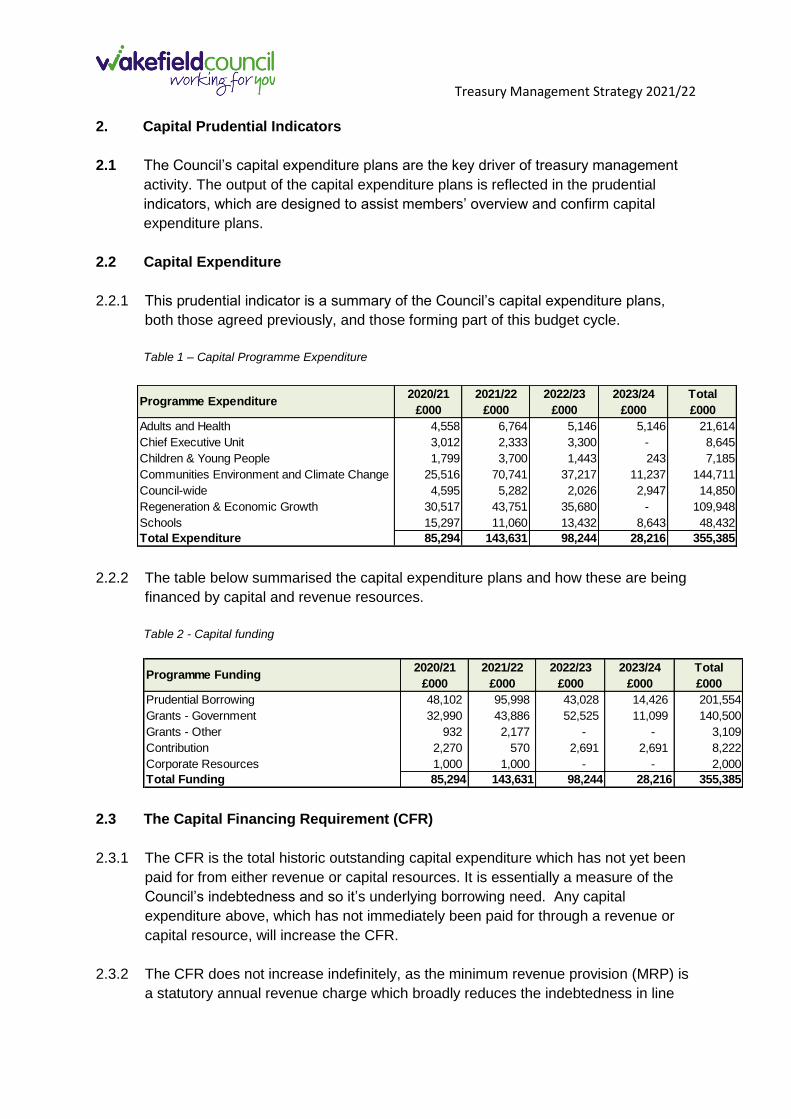
2.2.1 This prudential indicator is a summary of the Council’s capital expenditure plans,
both those agreed previously, and those forming part of this budget cycle.
Table 1 – Capital Programme Expenditure
2.2.2 The table below summarised the capital expenditure plans and how these are being
financed by capital and revenue resources.
Table 2 - Capital funding
2.3 The Capital Financing Requirement (CFR)
2.3.1 The CFR is the total historic outstanding capital expenditure which has not yet been
paid for from either revenue or capital resources. It is essentially a measure of the
Council’s indebtedness and so it’s underlying borrowing need. Any capital
expenditure above, which has not immediately been paid for through a revenue or
capital resource, will increase the CFR.
2.3.2 The CFR does not increase indefinitely, as the minimum revenue provision (MRP) is
a statutory annual revenue charge which broadly reduces the indebtedness in line
2020/21 2021/22 2022/23 2023/24 Total
£000 £000 £000 £000 £000
Adults and Health 4,558 6,764 5,146 5,146 21,614
Chief Executive Unit 3,012 2,333 3,300 - 8,645
Children & Young People 1,799 3,700 1,443 243 7,185
Communities Environment and Climate Change 25,516 70,741 37,217 11,237 144,711
Council-wide 4,595 5,282 2,026 2,947 14,850
Regeneration & Economic Growth 30,517 43,751 35,680 - 109,948
Schools 15,297 11,060 13,432 8,643 48,432
Total Expenditure 85,294 143,631 98,244 28,216 355,385
Programme Expenditure
2020/21 2021/22 2022/23 2023/24 Total
£000 £000 £000 £000 £000
Prudential Borrowing 48,102 95,998 43,028 14,426 201,554
Grants - Government 32,990 43,886 52,525 11,099 140,500
Grants - Other 932 2,177 - - 3,109
Contribution 2,270 570 2,691 2,691 8,222
Corporate Resources 1,000 1,000 - - 2,000
Total Funding 85,294 143,631 98,244 28,216 355,385
Programme Funding

Treasury Management Strategy 2021/22
with each assets life, and so charges the economic consumption of capital assets as
they are used.
2.3.3 The CFR includes any other long-term liabilities (e.g. PFI schemes, finance leases).
Whilst these increase the CFR, and therefore the Council’s borrowing requirement,
these types of scheme include a borrowing facility by the PFI provider and so the
Council is not required to separately borrow for these schemes. The Council
currently has £96.6m of such schemes within the CFR.
Table 3 - Capital Financing Requirement
2.4 Minimum Revenue Provision (MRP) Policy Statement 2021/22
2.4.1 The Council is required to pay off an element of the accumulated General Fund
capital spend each year (the CFR) through a revenue charge (the minimum revenue
provision - MRP), although it is also allowed to undertake additional voluntary
payments if required (voluntary revenue provision – VRP).
2.4.2 MHCLG regulations have been issued which require Full Council to approve an MRP
Statement in advance of each year. This can be varied in-year with Full Council
approval. A variety of options are provided to councils, so long as there is a prudent
provision. The MRP policy detailed below has not changed from the policy that was
approved for 2020/21. The Council is recommended to approve the following MRP
Statement.
2.4.3 For capital expenditure incurred before 1st April 2008 or which was incurred after 1
April 2008 as Supported Capital Expenditure, the MRP policy will be:
Asset life method – MRP will be based on the estimated life of the assets, in
accordance with the guidance based on the annuity method.
From 1 April 2008 for all unsupported borrowing the MRP policy will be:
Asset life method – MRP will be based on the estimated life of the assets, in
accordance with the guidance based on the annuity method.
2019/20
Actual
£m
2020/21
Estimate
£m
2021/22
Estimate
£m
2022/23
Estimate
£m
2023/24
Estimate
£m
Capital Financing Requirement 461,652 494,910 563,561 607,730 627,521
Movement in CFR 33,258 68,651 44,169 19,791
Movement in CFR represented by
Net financing need for the year 40,186 77,839 56,451 33,689
Less MRP and other financing movements (6,928) (9,188) (12,282) (13,898)
Movement in CFR 33,258 68,651 44,169 19,791

Treasury Management Strategy 2021/22 2.4.4 When the MRP Policy was amended in the 2016/17 Treasury Management Strategy
Report, it resulted in a cumulative MRP reduction compared with the previous
method of charging MRP. As at 1st April 2020, there was a remaining MRP cost
reduction of £44.8m. This will be offset annually against MRP charges relating to
capital expenditure incurred before 1 April 2016. This will result in a zero MRP
charge for this particular element of the residual capital expenditure until the saving
is fully consumed.
2.4.5 For capital expenditure incurred after 1st April 2016, capital receipts will be set aside
to repay debt and to fund PFI liabilities in the year. The value of the MRP which
would otherwise have been set aside will be reduced by the amounts which have
instead been paid from capital receipts.
2.4.6 MRP overpayments - A change introduced by the revised MHCLG MRP Guidance
was the allowance that any charges made over the statutory MRP, voluntary revenue
provision or overpayments, can, if needed, be reclaimed in later years if deemed
necessary or prudent. In order for these sums to be reclaimed for use in the budget,
this policy must disclose the cumulative overpayment made each year. No
overpayments have been made in 2020/21.
2.4.7 Where capital expenditure is incurred on an investment property, MRP may not be
applied providing there is a realistic expectation that an asset purchased as an
investment property will be sold in the future and the capital receipts from that sale
will be set aside to enable repayment of the borrowing associated with the asset.
These assets will be reviewed each year to assess any reduction in value including
the acquisition cost. If any reduction in value has occurred then an MRP will be
charged to recover the loss in the medium term.
Treasury Management Strategy 2021/22 3. Borrowing
3.1 The treasury management function ensures that the Council’s cash is managed in
accordance with the relevant professional codes, so that sufficient cash is available
to meet service activity and the Council’s capital strategy. This will involve both the
organisation of the cash flow and, where capital plans require, the organisation of
appropriate borrowing facilities. The strategy covers the relevant treasury / prudential
indicators, the current and projected debt positions and the annual investment
strategy.
3.2 Portfolio position
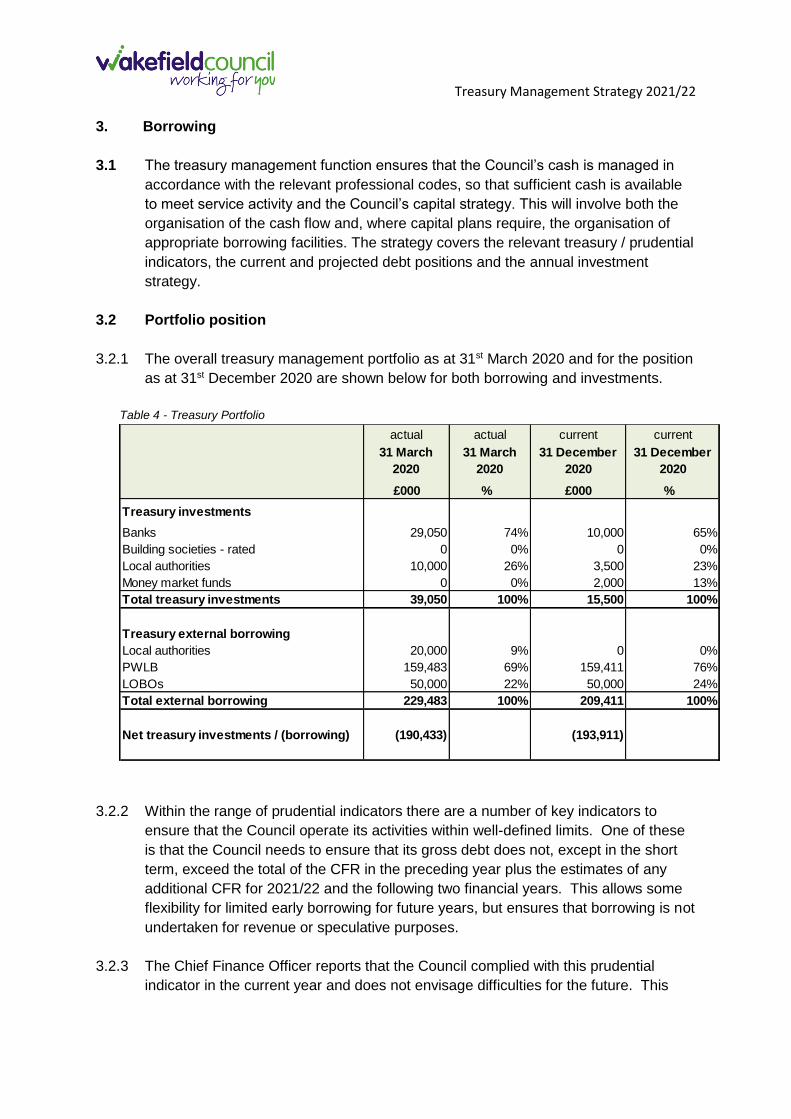
3.2.1 The overall treasury management portfolio as at 31st March 2020 and for the position
as at 31st December 2020 are shown below for both borrowing and investments.
Table 4 - Treasury Portfolio
3.2.2 Within the range of prudential indicators there are a number of key indicators to
ensure that the Council operate its activities within well-defined limits. One of these
is that the Council needs to ensure that its gross debt does not, except in the short
term, exceed the total of the CFR in the preceding year plus the estimates of any
additional CFR for 2021/22 and the following two financial years. This allows some
flexibility for limited early borrowing for future years, but ensures that borrowing is not
undertaken for revenue or speculative purposes.
3.2.3 The Chief Finance Officer reports that the Council complied with this prudential
indicator in the current year and does not envisage difficulties for the future. This
actual actual current current
31 March
2020
31 March
2020
31 December
2020
31 December
2020
£000 % £000 %
Treasury investments
Banks 29,050 74% 10,000 65%
Building societies - rated 0 0% 0 0%
Local authorities 10,000 26% 3,500 23%
Money market funds 0 0% 2,000 13%
Total treasury investments 39,050 100% 15,500 100%
Treasury external borrowing
Local authorities 20,000 9% 0 0%
PWLB 159,483 69% 159,411 76%
LOBOs 50,000 22% 50,000 24%
Total external borrowing 229,483 100% 209,411 100%
Net treasury investments / (borrowing) (190,433) (193,911)
Treasury Management Strategy 2021/22
view takes into account current commitments, existing plans and the plans in the
budget report.
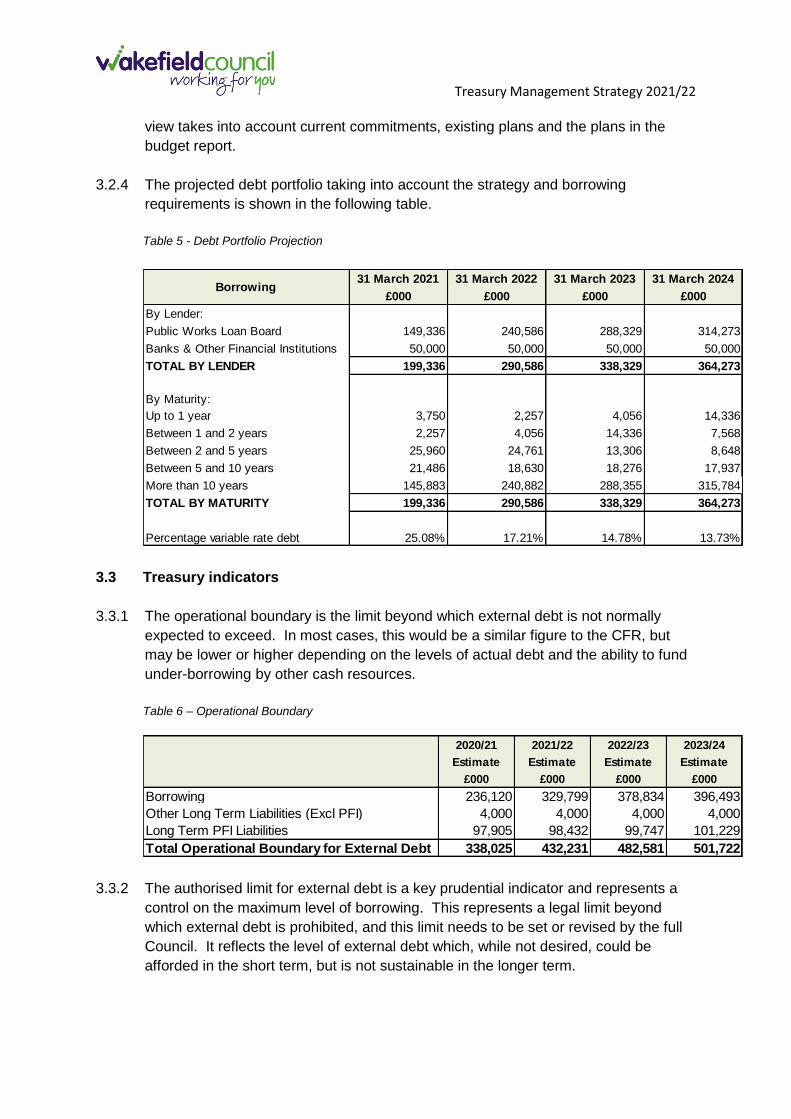
3.2.4 The projected debt portfolio taking into account the strategy and borrowing
requirements is shown in the following table.
Table 5 - Debt Portfolio Projection
3.3 Treasury indicators
3.3.1 The operational boundary is the limit beyond which external debt is not normally
expected to exceed. In most cases, this would be a similar figure to the CFR, but
may be lower or higher depending on the levels of actual debt and the ability to fund
under-borrowing by other cash resources.
Table 6 – Operational Boundary
3.3.2 The authorised limit for external debt is a key prudential indicator and represents a
control on the maximum level of borrowing. This represents a legal limit beyond
which external debt is prohibited, and this limit needs to be set or revised by the full
Council. It reflects the level of external debt which, while not desired, could be
afforded in the short term, but is not sustainable in the longer term.
31 March 2021 31 March 2022 31 March 2023 31 March 2024
£000 £000 £000 £000
By Lender:
Public Works Loan Board 149,336 240,586 288,329 314,273
Banks & Other Financial Institutions 50,000 50,000 50,000 50,000
TOTAL BY LENDER 199,336 290,586 338,329 364,273
By Maturity:
Up to 1 year 3,750 2,257 4,056 14,336
Between 1 and 2 years 2,257 4,056 14,336 7,568
Between 2 and 5 years 25,960 24,761 13,306 8,648
Between 5 and 10 years 21,486 18,630 18,276 17,937
More than 10 years 145,883 240,882 288,355 315,784
TOTAL BY MATURITY 199,336 290,586 338,329 364,273
Percentage variable rate debt 25.08% 17.21% 14.78% 13.73%
Borrowing
2020/21 2021/22 2022/23 2023/24
Estimate Estimate Estimate Estimate
£000 £000 £000 £000
Borrowing 236,120 329,799 378,834 396,493
Other Long Term Liabilities (Excl PFI) 4,000 4,000 4,000 4,000
Long Term PFI Liabilities 97,905 98,432 99,747 101,229
Total Operational Boundary for External Debt 338,025 432,231 482,581 501,722

Treasury Management Strategy 2021/22
This is the statutory limit determined under section 3 (1) of the Local Government Act
2003. The Government retains an option to control either the total of all council’s
plans, or those of a specific council, although this power has not yet been exercised.
The Council is asked to approve the following authorised limit:
Table 7 – Authorised Limit
3.4 Interest rate forecasts
3.4.1 The Council has appointed Link Asset Services as its treasury adviser and part of
their service is to formulate a view on interest rates.
Table 8 – Interest Rate Forecasts – Link Asset Services
3.4.2 Given the current level of uncertainties surrounding Brexit, the above forecasts may
need to be materially re-assessed in the light of events over the coming months.
3.4.3 The coronavirus outbreak has had a significant impact on economies around the
world. After the Bank of England took emergency action in March 2020 to cut the
Bank Rate to initially 0.25% and then to 0.10%. It left the Bank Rate unchanged at
its subsequent meetings to 17th December, although some forecasters had
suggested that a cut into negative territory could happen. However, the Governor of
the Bank of England has made it clear that he currently thinks that such a move
would do more damage that good and that more quantitative easing is the favoured
tool if further action becomes necessary. As shown in the forecast table above, no
2020/21 2021/22 2022/23 2023/24
Estimate Estimate Estimate Estimate
£000 £000 £000 £000
Borrowing 199,336 290,586 338,329 364,273
Other Local Authority Borrowing (12,573) (12,069) (11,587) (11,124)
Borrowing Limit to CFR 210,242 186,612 181,241 173,143
Total Authorised Borrowing Limit 397,005 465,129 507,983 526,292
Long Term PFI Liabilities 97,905 98,432 99,747 101,229
Total Authorised Limit for External Debt 494,910 563,561 607,730 627,521
Link Group Interest Rate View 9.11.20
These Link forecasts have been amended for the reduction in PWLB margins by 1.0% from 26.11.20
Mar-21 Jun-21 Sep-21 Dec-21 Mar-22 Jun-22 Sep-22 Dec-22 Mar-23 Jun-23 Sep-23 Dec-23 Mar-24
BANK RATE 0.10 0.10 0.10 0.10 0.10 0.10 0.10 0.10 0.10 0.10 0.10 0.10 0.10
3 month ave earnings 0.10 0.10 0.10 0.10 0.10 0.10 0.10 0.10 0.10 0.10 0.10 0.10 0.10
6 month ave earnings 0.10 0.10 0.10 0.10 0.10 0.10 0.10 0.10 0.10 0.10 0.10 0.10 0.10
12 month ave earnings 0.20 0.20 0.20 0.20 0.20 0.20 0.20 0.20 0.20 0.20 0.20 0.20 0.20
5 yr PWLB 0.80 0.80 0.80 0.80 0.90 0.90 0.90 0.90 0.90 1.00 1.00 1.00 1.00
10 yr PWLB 1.10 1.10 1.10 1.10 1.20 1.20 1.20 1.20 1.20 1.30 1.30 1.30 1.30
25 yr PWLB 1.50 1.60 1.60 1.60 1.60 1.70 1.70 1.70 1.70 1.80 1.80 1.80 1.80
50 yr PWLB 1.30 1.40 1.40 1.40 1.40 1.50 1.50 1.50 1.50 1.60 1.60 1.60 1.60

Treasury Management Strategy 2021/22
increase in the Bank Rate is expected in the forecast table above as economic
recovery is expected to be only gradual and, therefore, prolonged.
3.4.4 As the interest forecast table for PWLB certainty rates above shows, there is
expected to be little upward movement in PWLB rates over the next two years as it
will take economies, including the UK, a prolonged period to recover all the
momentum they have lost in the sharp recession caused during the coronavirus
lockdown period. From time to time, gilt yields, and therefore PWLB rates, can be
subject to exceptional levels of volatility due to geo-political, sovereign debt crisis,
emerging market developments and sharp changes in investor sentiment (as shown
on 9th November when the first results of a successful COVID-19 vaccine trial were
announced). Such volatility could occur at any time during the forecast period.
3.5 Investment and borrowing rates
3.5.1 Investment returns are likely to remain exceptionally low during 2021/22 with little
increase in the following two years.
3.5.2 Borrowing interest rates fell to historically very low rates as a result of the COVID-19
crisis and the quantitative easing operations of the Bank of England. Indeed, gilt
yields up to six years were negative during most of the first half of 2020/21. The
policy of avoiding new borrowing by running down spare cash balances has served
local authorities well over the last few years. The unexpected increase of 100 bps in
PWLB rates on top of the then current margin over gilt yields of 80 bps in October
2019, required an initial major rethink of local authority treasury management
strategy and risk management. However, in March 2020, the Government started a
consultation process for reviewing the margins over gilt rates for PWLB borrowing for
different types of local authority capital expenditure. It also introduced the following
rates for borrowing for different types of capital expenditure.
PWLB Standard Rate is gilt plus 200 basis points (G+200bps)
PWLB Certainty Rate is gilt plus 180 basis points (G+180bps)
PWLB HRA Standard Rate is gilt plus 100 basis points (G+100bps)
PWLB HRA Certainty Rate is gilt plus 80bps (G+80bps)
Local Infrastructure Rate is gilt plus 60bps (G+60bps)
3.5.3 As a consequence of these increase in margins, many local authorities decided to
refrain from PWLB borrowing unless it was for HRA or local infrastructure financing,
until such time as the review of margins was concluded. Wakefield Council took out
additional borrowing in March 2020 at the local infrastructure rate to finance a street
lighting capital scheme.
3.5.4 On 25th November 2020, the Chancellor of the Exchequer announced the conclusion
to the review of margins over gilt yields for PWLB rates; the standard and certainty
margins were reduced by 1% but a prohibition was introduced to deny access to

Treasury Management Strategy 2021/22
borrowing from the PWLB for any local authority which had purchase or assets for
yield in its three year capital programme. The new margins are as follows:
PWLB Standard Rate is gilt plus 100 basis points (G+100bps)
PWLB Certainty Rate is gilt plus 80 basis points (G+80bps)
PWLB HRA Standard Rate is gilt plus 100 basis points (G+100bps)
PWLB HRA Certainty Rate is gilt plus 80bps (G+80bps)
Local Infrastructure Rate is gilt plus 60bps (G+60bps)
3.5.5 The Council’s treasury advisor’s long-term forecast for the Bank Rate is 2.00% and
all PWLB rates are below 2.00%, there is now value in borrowing from the PWLB for
all types of capital expenditure for all maturity periods, especially as current rates are
at historic lows. However, greater value can be obtained in borrowing for shorter
maturity periods so the Council will assess its risk appetite in conjunction with
budgetary pressures to reduce total interest costs.
While this authority will not be able to avoid borrowing to finance new capital
expenditure or to replace maturing debt and the planned reduction of general fund
reserves, there will be a cost of carry to any new borrowing that causes a temporary
increase in cash balances.
3.6 Borrowing strategy
3.6.1 The Council has the facility to borrow in respect of the following
Maturing debt (net of MRP)
Approved and unsupported capital expenditure
To finance cash flow in the short term
3.6.2 The Council is currently maintaining an under-borrowed position. This means that
the capital borrowing need (the CFR) has not been fully funded with loan debt as
cash supporting the Council’s reserves, balances and cash flow has been used as a
temporary measure. This strategy is prudent as investment returns are low.
3.6.3 Against this background and the risks within the economic forecast, caution will be
adopted with the 2021/22 treasury operations. The Chief Finance Officer will monitor
interest rates in financial markets and adopt a pragmatic approach to changing
circumstances.
If it was felt that there is significant risk of a sharp fall in long and short-term
rates, then long-term borrowing would be postponed
If it was felt that there was a significant risk of a much sharper rise in long and
short-term rates that that currently forecast, perhaps arising from an
acceleration in the rate of increase in central rates in the USA and UK, an
increase in world economic activity, or a sudden increase in inflation risks, then
the portfolio position will be re-appraised. Most likely, fixed rate funding will be

Treasury Management Strategy 2021/22
drawn whilst interest rates are lower than they are projected to be in the next
few years.
3.6.4 Any decisions will be reported to the elected members at the earliest opportunity.
3.7 Borrowing requirement
3.7.1 Continuation of the strategy to postpone borrowing and run down investment
balances will be considered within any review of borrowing need. This strategy
reduces counterparty risk and hedges against the fall in investment returns.
3.7.2 It is currently forecast that the Council will be required to borrow £175m over the
years 2020/21 to 2023/24. This is expected to be borrowed from the PWLB at fixed
rates.
3.7.3 The estimated borrowing requirement for the period from 2020/21 to 2023/24 is
shown in the following table:
Table 9 – Borrowing Position
3.8 Borrowing in advance of need
3.8.1 The Council will not borrow more than or in advance of its needs purely in order to
profit from the investment of the extra sums borrowed. Any decision to borrow in
advance will be within forward approved Capital Financing Requirement estimates,
and will be considered carefully to ensure that value for money can be demonstrated
and that the Council can ensure the security of such funds.
3.8.2 Risks associated with any borrowing in advance activity will be subject to prior
appraisal and subsequent reporting through the mid-year or annual reporting
mechanism.
2020/21
Estimated
£000
2021/22
Estimated
£000
2022/23
Estimated
£000
2023/24
Estimated
£000
Under Borrowed Position 1 April 168,616 210,242 186,612 181,241
New Borrowing 0 (95,000) (50,000) (30,000)
Maturing Debt/Early repayments 10,147 3,749 2,258 4,056
Other Local Authority Debt Repayments (523) (503) (483) (463)
Prudential Borrowing 38,482 76,819 54,616 31,637
Minimum Revenue Provision exc PFI (6,480) (8,695) (11,762) (13,328)
Planned Under Borrowed Position 31 March 210,242 186,612 181,241 173,143

Treasury Management Strategy 2021/22 3.9 Debt rescheduling
3.9.1 The Chief Finance Officer, under delegated powers, and treasury advisers will
monitor prevailing rates for any debt restructuring opportunities during the year,
taking into account the following factors:
The maturity profile – i.e. restructuring will only be actioned where it complies
with the maturity profile limits
The capacity to achieve on going revenue savings
The impact of premiums and discounts
The impact on prudential indicators
3.10 New financial institutions as a source of borrowing
3.10.1 Following the decision by the PWLB on 25th November 2020 to reverse the previous
increase in margin and decrease their margin over gilt yields by 100 bps to 80 bps on
loans lent to local authorities, it is likely that the PWLB will be the cheapest source of
funding for long term borrowing. If short dated borrowing or borrowing out of a
forward date is required then consideration will also need to be given to sourcing
funding from the following:
Local authorities (primarily shorter dated maturities)
Financial institutions (primarily insurance companies and pension funds but also some banks, out of spot or forward dates)
Municipal Bonds Agency
3.10.2 The Council’s treasury advisors will keep us informed on the degree to which these
options are appropriate for the Council.

Treasury Management Strategy 2021/22
4. Annual Investment Strategy
2
4.1 Investment policy – management of risk
4.1.1 The MHCLG and CIPFA have extended the meaning of ‘investments’ to include both
financial and non-financial investments. This report deals solely with financial
investments, (as managed by the treasury management team). Non-financial
investments, essentially the purchase of income yielding assets, are covered in the
Capital and Investment Strategy, (a separate report).
4.1.2 The Council’s investment policy has regard to the following:
MHCLG’s Guidance on Local Government Investments (“the Guidance”)
CIPFA Treasury Management in Public Services Code of Practice and Cross
Sectoral Guidance Notes 2017 (“the Code”)
CIPFA Treasury Management Guidance Notes 2018
4.1.3 The Council’s investment priorities will be security first, portfolio liquidity second and
then yield, (return). The Council will aim to achieve the optimum return (yield) on its
investments commensurate with proper level of security and liquidity and with the
Council’s risk appetite. In the current economic climate it is considered appropriate
to keep investments short term to cover cash flow needs. However, where
appropriate to keep investments short term to cover cash flow needs. However,
where appropriate the Council will consider the value available in periods up to 12
months with high credit rated financial institutions, as well as wider range fund
options.
4.1.4 The above guidance from the MHCLG and CIPFA places a high priority on the
management of risk. This authority has adopted a prudent approach to managing risk
and defines its risk appetite by the following means:
Minimum acceptable credit criteria are applied in order to generate a list of
highly creditworthy counterparties
The Council has a list of the types of investment instruments that the treasury
management team are authorised to use
Specified investments – those with a high level of credit quality and
subject to maturity limit of one year
Non-specified investments – those with less high credit quality and may
be for periods in excess of one year. A limit of £50m will be applied to
these investments.
The Council will set a limit for the amount of its investments which are
invested for longer than 365 days
Investments will only be placed with counterparties from countries with a
specified minimum sovereign rating.
All financial investments will be in sterling.

Treasury Management Strategy 2021/22
As a result of the change in accounting standards under IFRS 9, the Council
will consider the implications of investment instruments which could result in
an adverse movement in the value of the amount invested and resultant
charges at the end of the year to the General Fund. (In November 2018,
MHCLG concluded a consultation for a temporary override to allow English
local authorities time to adjust their portfolio of all pooled investments by
announcing a statutory override to delay implementation of IFRS 9 for five
years commencing from 1st April 2018).
4.1.5 However, the Council will also pursue value for money in treasury management and
will monitor the yield from investment income against appropriate benchmarks for
investment performance. Regular monitoring of investment performance will be
carried out during the year.
4.2 Creditworthiness policy
4.2.1 The primary principle governing the Council’s investment criteria is the security of its
investments, although the yield or return on the investment is also a key
consideration. After this main principle, the Council will ensure that:
It maintains a policy covering both the categories of investment types it will
invest in, criteria for choosing investment counterparties with adequate
security, and monitoring their security. This is set out in the specified and non-
specified investment sections below; and
It has sufficient liquidity in its investments. For this purpose it will set out
procedures for determining the maximum periods for which funds may
prudently be committed. These procedures also apply to the Council’s
prudential indicators covering the maximum principal sums invested.
4.2.2 The Chief Finance Officer will maintain a counterparty list in compliance with the
following criteria and will revise the criteria and submit them to Council for approval
as necessary. These criteria are separate to that which determines which types of
investment instrument are either specified or non-specified as it provides an overall
pool of counterparties considered high quality which the Council may use, rather than
defining what types of investment instruments are to be used.
4.2.3 The criteria for providing a pool of high quality investment counterparties (both
specified and non-specified investments) is:
Banks 1 - Good Credit Quality – the Council will only use banks which:
Are UK banks; and/or
Are non-UK and domiciled in a country which has a minimum Sovereign long
term rating of AAA
And have, as a minimum, the following Fitch, Moody’s and Standard and
Poor’s credit ratings (where rated):
Short Term – F1

Treasury Management Strategy 2021/22
Long Term – A
Banks 2 – Part nationalised UK banks – currently Royal Bank of Scotland.
This bank can be included if it continues to be part nationalised or it meets the
ratings in Banks 1 above.
Banks 3 – The Council’s own banking contract. At the point of awarding a
banking contract the bank must have a minimum individual short term credit
rating of F2 (Fitch) or equivalent and a minimum Sovereign long term rating of
BBB, from each of the major credit rating agencies: Fitch, Moody’s and
Standard and Poor’s (where rated). The ratings reflect that the cash held with
the Council’s own bank is on a basis of overnight deposit.
Bank Subsidiary and Treasury Operation – the Council will use these
where the parent bank has the necessary ratings outlined above.
Building Societies – the Council will only use Societies which meet the
ratings for banks outlined above
Money Market Funds (CNAV,LVNAV,VNAV)– Long-term credit rating AAA
UK Government (including the Government’s Debt Management Account
Deposit Facility(DMADF))
Local authorities, police & crime commissioners, fire authorities, parish
councils or community councils
4.2.4 A limit of £50m will be applied to the use on non-specified investments. This limit will
be kept under review during 2021/22 and any changes considered appropriate
arising from changing economic conditions will be reported back to Cabinet for
approval.
4.2.5 Country and Sector Considerations – Due care will be taken to consider the
country, group and sector exposure of the Council’s investments. In part the country
selection will be chosen by the credit rating of the Sovereign state in Banks 1 above.
In addition:
No more than £10m will be placed with any non-UK country at any time;
Limits of £10m will apply to Banking Groups.
Sector limits will be monitored regularly for appropriateness
4.2.6 Use of additional information other than credit ratings – Requirements under the
Code of Practice requires the Council to supplement credit rating information. The
Council has arrangements in place to assess additional operational market
information before making any specific investment decision from the agreed pool of
counterparties. This additional market information (for example Credit Default

Treasury Management Strategy 2021/22
Swaps, negative rating watches/outlooks) is applied to compare the relative security
of differing investment counterparties.
4.2.7 Time and Monetary Limits applying to Investments - The time and monetary
limits for institutions on the Council’s Counterparty List are as follows (these will
cover both Specified and Non-Specified Investments):
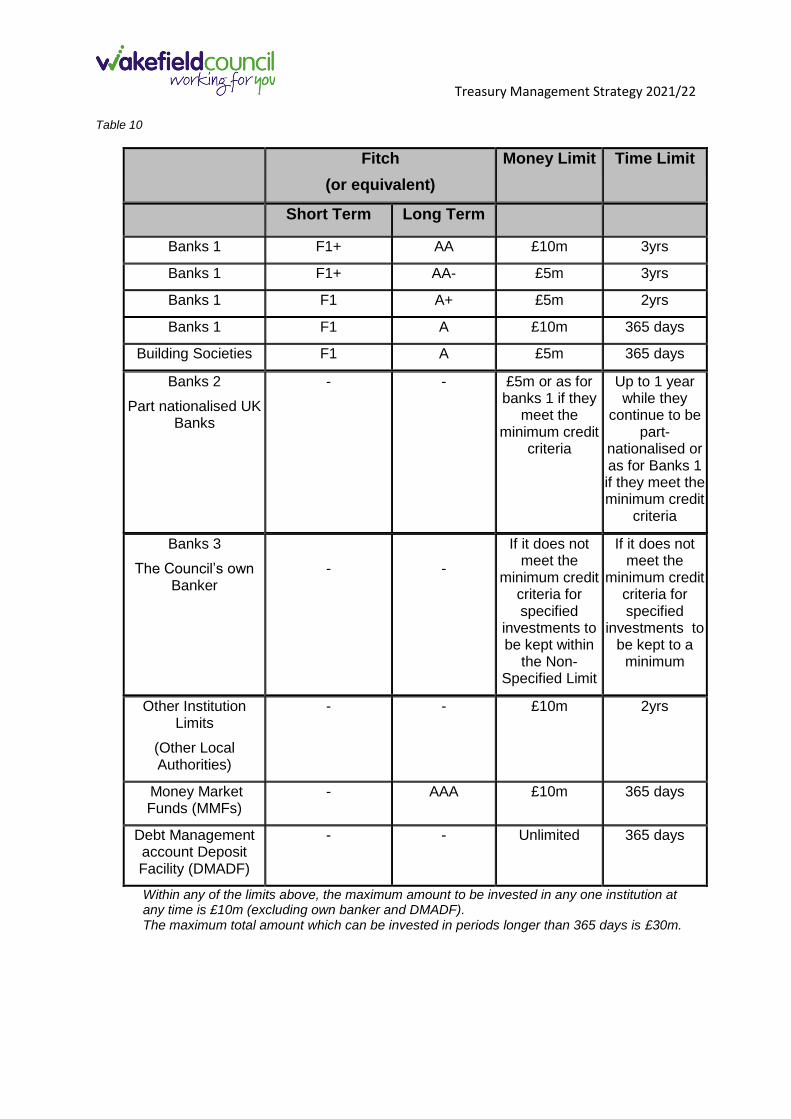
Treasury Management Strategy 2021/22 Table 10
Fitch
(or equivalent)
Money Limit Time Limit
Short Term Long Term
Banks 1 F1+ AA £10m 3yrs
Banks 1 F1+ AA- £5m 3yrs
Banks 1 F1 A+ £5m 2yrs
Banks 1 F1 A £10m 365 days
Building Societies F1 A £5m 365 days
Banks 2
Part nationalised UK Banks
- - £5m or as for banks 1 if they
meet the minimum credit
criteria
Up to 1 year while they
continue to be part-
nationalised or as for Banks 1 if they meet the minimum credit
criteria
Banks 3
The Council’s own Banker
-
-
If it does not meet the
minimum credit criteria for specified
investments to be kept within
the Non-Specified Limit
If it does not meet the
minimum credit criteria for specified
investments to be kept to a
minimum
Other Institution Limits
(Other Local Authorities)
- - £10m 2yrs
Money Market Funds (MMFs)
- AAA £10m 365 days
Debt Management account Deposit Facility (DMADF)
-
-
Unlimited 365 days
Within any of the limits above, the maximum amount to be invested in any one institution at any time is £10m (excluding own banker and DMADF). The maximum total amount which can be invested in periods longer than 365 days is £30m.

Treasury Management Strategy 2021/22
4.3 Liquidity of Investments
4.3.1 In the normal course of the Council’s cash flow operation it is expected that both
specified and non-specified investments will be utilised for the control of liquidity as
both categories allow for short-term investments.
4.3.2 The use of longer-term instruments (greater than one year from inception to
repayment) will fall in the Non-specified investment category. These instruments will
only be used where the Council’s liquidity requirements are safeguarded. This will
also be limited by the longer-term investments limits.
4.4 Specified Investments
4.4.1 A financial investment is a specified investment if all of the following apply.
It is sterling denominated
It is not a long term investment (ie due to be repaid within 12 months of the
date on which the investment was made, or one which the local authority may
require to be repaid within that period)
The making of the investment is not defined as capital expenditure
The investment is made with a body or in an investment scheme of high credit
quality or is made with any one of the following public sector bodies;
The United Kingdom Government
A local authority, a police and crime commissioner/fire authority in
England and Wales or a similar body in Scotland or Northern Ireland
A parish council or community council
4.4.2 The following ratings (provided by the credit rating agencies) are the minimum the
Authority will use to determine that a body has “high credit quality” as required by the
CLG guidance. Investments will only be made at ratings at or above these levels:
4.4.3 Determining the ratings at this level for the placing of investments means that the
ratings would have to be reduced by at least two levels before causing concern.
4.4.4 For investments in periods of less than one year, only the short-term credit rating
may be referred to where this is felt to be appropriate.
4.4.5 The rating criteria use the lowest common denominator method of selecting
counterparties and applying limits. This means that the application of the Council’s
minimum criteria will apply to the lowest available rating for any institution. For
instance if an institution is rated by two agencies, one meets the Council’s criteria,
Agency Long Term Short Term
Fitch A F1
Moody’s A2 P-1
Standard & Poor’s A A-1

Treasury Management Strategy 2021/22
the other does not, the institution will fall outside the lending criteria. This is in
compliance with a CIPFA Treasury Management Panel recommendation in March
2009 and the revised CIPFA Treasury Management Code of Practice.
4.4.6 The list of specified investments for the Council is as follows:
All up to 365 days
Institution / Instrument
The UK Government (including the Debt Management Account Deposit
Facility (DMADF), UK Treasury Bills).
Pooled investment vehicles (such as money market funds) that have been
awarded a high long term credit rating by a rating provided by credit rating
agency. (AAA being the highest rating agencies)
A local authority, a police and crime commissioner, fire authority, parish
council or community council
Pooled investment vehicles (such as money market funds) that have been
awarded a high long term credit rating by a credit rating agency. (AAA being
the highest rating provided by credit rating agencies)
A body that is considered of a high credit quality (such as a bank or building
society)
4.5 Non-specified Investments
4.5.1 Non-specified investments are any other type of investment (ie not defined as
specified above). The identification and rationale supporting the selection of these
other investments and the maximum limits to be applied are set out below:
Part nationalised UK banks – where they do not meet the basic criteria
The Council’s own banker where it’s rating does not meet the specified
investments criteria. In this instance, balances will be minimised as far as
possible.
The Council will review categories of non-specified investments on an annual
basis in discussion with its external Treasury Advisers (Link) and amend the
categories appropriately.

Treasury Management Strategy 2021/22 4.6 Monitoring Credit Ratings
4.6.1 The credit ratings of counterparties are monitored on a weekly basis using credit
rating information received from the Council’s Treasury Advisors on all active
counterparties that comply with the above criteria. Any rating changes, rating
watches (notification of a likely change), rating outlooks (notification of a possible
longer term change) are received almost immediately after they occur and this
information is used to review the counterparty list before dealing with a counterparty.
4.6.2 The information provided includes the credit ratings and potential changes to credit
ratings of counterparties with whom the Council has current investments.
4.6.3 If a rating is downgraded on an institution with which the Council has an existing
investment then the following action is taken:
• If it goes below the minimum criteria the Council has established, (with all
agencies with whom the counterparty is rated for specified investments), the
risk implications are discussed with our external advisors and if it is deemed
appropriate a request is made to return the investments.
• It should be noted, however, that the general position taken by investment
counterparties is not to return wholesale term deposits before the maturity
date.
• If it remains within the investment criteria then the risk implications are
discussed with our external advisors and the position monitored.
4.6.4 Any counterparty failing to meet the minimum criteria, as set out above, is
immediately removed from the investment list and will not be considered for new
investments.
4.6.5 Where ratings are upgraded, new counterparties are added to the list when they
meet the minimum criteria.
4.6.6 The criteria for choosing counterparties set out above provide a sound approach to
investment in “normal” market circumstances. Whilst Members are asked to approve
this base criteria, under the exceptional current market conditions the Chief Finance
Officer may temporarily restrict further investment activity to those counterparties
considered of higher credit quality than the minimum criteria set out for approval.
These restrictions will remain in place until the banking system returns to “normal”
conditions. Similarly the time periods for investments will be restricted.
4.6.7 Examples of these restrictions would be use of the Debt Management Deposit
Account Facility, money market funds, part nationalised banks and strongly rated
institutions offered support by the UK Government.

Treasury Management Strategy 2021/22 4.7 Investment Strategy
4.7.1 Investments will be made with reference to the core balance and cash flow
requirements and the outlook for short-term interest rates (ie rates for investments up
to 12 months). Greater returns are usually obtainable by investing for longer periods.
While most cash balances are required in order to manage the ups and downs if
cash flow, where cash sums can be identified that could be invested for longer
periods, the value to be obtained from longer term investments will be carefully
assessed.
If it is thought that the Bank rate is likely to rise significantly within the time
horizon being considered, then consideration will be given to keeping most
investments as being short term or variable.
Conversely, if it is thought that the Bank Rate is likely to fall within that time
period, consideration will be given to locking in higher rates currently
obtainable, for longer periods.
4.8 Treasury Management Advisers
4.8.1 Link Asset Services are the Council’s treasury management advisers. They provide
a range of services which include:
Technical support on treasury matters, capita finance issues and advice on
the drafting of Member reports
Economic and interest rate analysis
Debt services which includes advice on the timing of borrowing
Debt rescheduling advice surrounding the existing portfolio
Generic investment advice on interest rates, timing and investment
instruments
Credit ratings/market information service comprising the three main credit
rating agencies
4.8.2 Whilst the advisers provide support to the internal treasury function, under current
market rules and the CIPFA Code of Practice the final decision on treasury matters
remain with the Council. The advisory service is subject to review.
4.9 Member and Officer Training
4.9.1 The increased Member consideration of treasury management matters and the need
to ensure officers dealing with treasury management are trained and kept up to date
requires a suitable training process for Members and officers. The Council has
addressed this important issue by providing:

Treasury Management Strategy 2021/22 4.9.2 Member training
Treasury Management awareness courses are provided regularly for Members. The
most recent training was undertaken on 27th January 2021 and it is expected that
further treasury management training will continue to be made available on a regular
basis.
4.9.3 Officer training
Regular intermediate and advanced treasury management training is undertaken by
key members of staff. The majority of this training is provided by Link Asset
Services, however, staff are also encouraged to undertake other relevant training as
it becomes available.

Treasury Management Strategy 2021/22
ANNEXES
Treasury Management Strategy 2021/22
Annexe 1 5 and MRP statement
Prudential and treasury indicators
To facilitate the decision making process and support capital investment decisions,
the Prudential Code requires the Council to approve and monitor a minimum number
of prudential indicators. These indicators are mandatory and cover affordability,
prudence, capital expenditure, external debt and treasury management.
The indicators are purely for internal use by the Council and are not intended to be
used as comparators between councils. In addition to this in-year indication, the
benefit from monitoring arises from following the movement in indicators over time
and the year-on-year changes.
Based upon historical performance of the capital programme, the prudential
indicators allow for a rephrasing of capital expenditure (due to slippage, delays
beyond the council’s control, etc.). Slippage of £9.6m of the current year capital
borrowing budget to 2021/22 has been assumed. There is also assumed slippage of
the capital borrowing budget of £28m from 2021/22 to 2022/23 and £17m from
2022/23 to 2023/24.
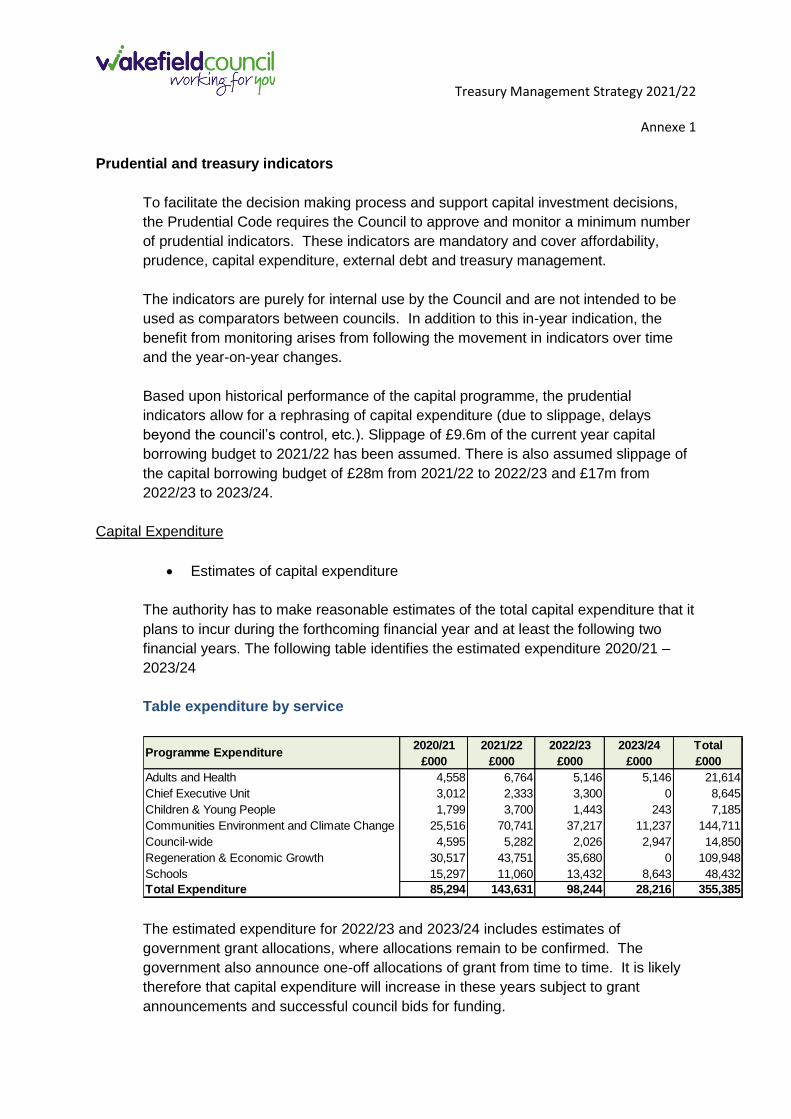
Capital Expenditure
Estimates of capital expenditure
The authority has to make reasonable estimates of the total capital expenditure that it
plans to incur during the forthcoming financial year and at least the following two
financial years. The following table identifies the estimated expenditure 2020/21 –
2023/24
Table expenditure by service
The estimated expenditure for 2022/23 and 2023/24 includes estimates of
government grant allocations, where allocations remain to be confirmed. The
government also announce one-off allocations of grant from time to time. It is likely
therefore that capital expenditure will increase in these years subject to grant
announcements and successful council bids for funding.
2020/21 2021/22 2022/23 2023/24 Total
£000 £000 £000 £000 £000
Adults and Health 4,558 6,764 5,146 5,146 21,614
Chief Executive Unit 3,012 2,333 3,300 0 8,645
Children & Young People 1,799 3,700 1,443 243 7,185
Communities Environment and Climate Change 25,516 70,741 37,217 11,237 144,711
Council-wide 4,595 5,282 2,026 2,947 14,850
Regeneration & Economic Growth 30,517 43,751 35,680 0 109,948
Schools 15,297 11,060 13,432 8,643 48,432
Total Expenditure 85,294 143,631 98,244 28,216 355,385
Programme Expenditure

Treasury Management Strategy 2021/22
Annexe 1
Estimates of capital financing requirements (CFR)
The authority has to make reasonable estimates of the total capital financing
requirement at the end of the forthcoming financial year and the following two
financial years. These are shown in the following table together with the actual for
2019/20 for comparative purposes:
Estimates of capital financing requirement
Council’s own direct estimates of capital financing requirements
The local indicator excludes PFI schemes which are fully funded. By removing this
item the local indicator shows the Council’s own capital investment and gross debt.
Reductions in the CFR relate to the reduction in capital expenditure (net of MRP) that
is to be funded from borrowing, increases in CFR relate to the increase in capital
expenditure (net of MRP to be funded from borrowing).
Affordability indicators
Within the prudential framework, indicators are required to assess the affordability of
the capital investment plans. These provide an indication of the impact of the capital
investment plans on the overall Council finances.
Ratio of financing costs to net revenue stream
The Prudential Code requires that financing costs of private finance initiative
schemes and other finance arrangements are included within this indicator, even
2019/20
Actual
£m
2020/21
Estimate
£m
2021/22
Estimate
£m
2022/23
Estimate
£m
2023/24
Estimate
£m
Capital Financing Requirement 461,652 494,910 563,561 607,730 627,521
2019/20
Actual
£m
2020/21
Estimate
£m
2021/22
Estimate
£m
2022/23
Estimate
£m
2023/24
Estimate
£m
Capital Financing Requirement
excluding PFI schemes 365,003 397,005 465,129 507,983 526,292
%
2019/20
Actual
2020/21
Estimate
2021/22
Estimate
2022/23
Estimate
2023/24
Estimate
Total 10.83% 11.74% 13.92% 15.47% 16.31%

Treasury Management Strategy 2021/22
Annexe 1 though the Council is not incurring borrowing costs directly on these issues. A
position which better reflects the comparator between the Council’s own net
borrowing costs and the revenue budget is shown below.
The estimates of financing costs include current commitments and the proposals in
the budget report. The actual rate for 2020/21 will be reported in the outturn report
on treasury management activities.
Prudence indicators
Gross debt and the capital financing requirement
The Prudential Code requires the calculation of the capital financing requirement
(CFR). This figure represents the Council's underlying need to borrow for a capital
purpose and the change year-on-year will be influenced by the capital expenditure in
the year.
In order to ensure that over the medium term gross debt will only be for capital
purposes, the Council must ensure that gross debt does not, except in the short-term,
exceed the total of the CFR in the preceding year plus the estimates of any additional
CFR for the current and next two financial years. In cases where the CFR is
reducing over the period, the Code allows the CFR at its highest point to be used in
this calculation.
The Authority had no difficulty meeting the previous calculation in 2019/20, nor are
any difficulties envisaged for the current or future years. This view takes into account
current commitments, existing plans, and the proposals in this budget report and is
shown in the table below.
%
2019/20
Actual
2020/21
Estimate
2021/22
Estimate
2022/23
Estimate
2023/24
Estimate
Total 5.72% 6.73% 8.57% 10.27% 11.22%
2019/20 2020/21 2021/22 2022/23 2023/24
Actual Estimate Estimate Estimate Estimate
£000 £000 £000 £000 £000
Borrowing 196,387 186,763 278,517 326,742 353,149
PFI Schemes 96,649 97,905 98,432 99,747 101,229
Total Gross Debt 293,036 284,668 376,949 426,489 454,378
Capital Financing Requirement 461,652 494,910 563,561 607,730 627,521
Planned Under Borrowed 168,616 210,242 186,612 181,241 173,143

Treasury Management Strategy 2021/22
Annexe 1
External debt indicators
Authorised limit
These authorised limits are consistent with the authority's current commitments,
existing plans and the proposals in this budget report for capital expenditure and
financing, and with its approved treasury management policy statement and
practices.
Operational boundary
The operational boundary for external debt is based on the same estimates as the
Authorised Limit but is based on the probable external debt during the course of the
year. This is both the Council borrowing and that managed on behalf of other
Authorities. It is not a limit and actual borrowing could vary around this boundary for
short times during the year. It will act as an indicator to ensure the Authorised Limit is
not breached.
Actual external debt as at 31 March
This will be reported within the outturn report on treasury management.
2020/21 2021/22 2022/23 2023/24
Estimate Estimate Estimate Estimate
£000 £000 £000 £000
Borrowing 199,336 290,586 338,329 364,273
Other Local Authority Borrowing (12,573) (12,069) (11,587) (11,124)
Borrowing Limit to CFR 210,242 186,612 181,241 173,143
Total Authorised Borrowing Limit 397,005 465,129 507,983 526,292
Long Term PFI Liabilities 97,905 98,432 99,747 101,229
Total Authorised Limit for External Debt 494,910 563,561 607,730 627,521
2020/21 2021/22 2022/23 2023/24
Estimate Estimate Estimate Estimate
£000 £000 £000 £000
Borrowing 236,120 329,799 378,834 396,493
Other Long Term Liabilities (Excl PFI) 4,000 4,000 4,000 4,000
Long Term PFI Liabilities 97,905 98,432 99,747 101,229
Total Operational Boundary for External Debt 338,025 432,231 482,581 501,722

Treasury Management Strategy 2021/22
Annexe 1 Treasury management indicators
Adoption of the CIPFA Code of Practice for Treasury Management in the
Public Services
The Council complies with the requirements of this code and the relevant clause is
contained in Financial Procedure Rule 16.1.
Interest rate exposure
The Council has to set for the forthcoming financial year and the following two
financial years upper limits to its exposures to the effects of changes in The council
has to set for the forthcoming year and the following two financial years upper limits
to its exposures to the effects of changes in interest rates. The indicators relate to
both fixed interest rates and variable interest rates.
Upper limit on fixed interest rates
The Council’s upper limit for fixed interest rate exposure for the period
Upper limit on variable interest rates
The Council’s upper limit for variable interest rate exposure for the period
Maturity structure of borrowing
The authority must set for the forthcoming financial year both upper and lower limits
with respect to the maturity structure of its borrowing. The indicator identifies the
amount of projected borrowing that is maturing in each period expressed as a
percentage of total projected borrowing. The percentages are shown below over the
specified periods.
2019/20 2020/21 2021/22 2022/23
£m £m £m £m
347 415 458 476
2020/21 2021/22 2022/23 2023/24
£m £m £m £m
90 90 90 90

Treasury Management Strategy 2021/22
Annexe 1
Total principal sums invested for periods longer than 365 days
If the authority invests or plans to invest for longer than 365 days it has to set an
upper limit for each financial year for the maturing of such investments.
Total Principal Sums invested for periods longer than 365 days where the maturity
date is beyond the financial year end.
Maturity structure of borrowing Upper Limit % Lower limit %
Under 12 Months 45 0
12 - 24 Months 50 0
2 Years - 5 Years 60 0
5 Years - 10 Years 90
10 Years - 15 years 90
15 years - 20 Years 90
20 Years - 25 Years 90
25 Years - 30 years 90 30
30 Years - 35 years 100
35 Years - 40 Years 100
40 years - 45 years 100
45 Years - 50 Years 100
50 Years and above 100
Upper limit for principal sums invested for longer than 365 days
2021/22 £m 2022/23 £m 2023/24 £m
Principal sums invested for
longer than 365 days 30 30 30
Current investments as at 31
December 2020 in excess of one
year maturing in each year 0 0 0

Treasury Management Strategy 2020/21
Annexe 2 Treasury Management Practices
TMP1: Treasury risk management
Credit and counterparty risk
The risk of failure of a third party to meet their contractual obligations under an
investment, borrowing, capital, project or partnership financing, particularly as a
result of the third party’s diminished creditworthiness.
Liquidity risk
The risk that cash will not be available when needed.
Interest rate risk
Fluctuations in the levels of interest rates create an unexpected or an
unbudgeted burden on an organisation’s finances against which it has failed to
protect itself adequately.
Inflation Risk
The sensitivity of its treasury assets and liabilities to inflation and managing the
risk accordingly in the concert of the whole organisation’s inflation exposures.
Exchange rate risk
The risk that fluctuations in foreign exchange rates create an unexpected or
unbudgeted burden on an organisation’s finances.
Refinancing risk
The risk that maturing borrowings, capital, project or partnership financing cannot
be refinanced on terms that reflect the provisions made by the organisation for
those refinancing, both capital and revenue.
Legal and regulatory risk
The risk that the organisation fails to act in accordance with its powers or
regulatory requirements.
Fraud error, corruption and contingency management
The failure to employ suitable systems and procedures and to maintain effective
contingency management arrangements to these ends.
Market risk
The risk that through adverse market fluctuations in the value of the principal
sums an organisation invests, it’s stated policies and objectives are
compromised.

Treasury Management Strategy 2020/21
Annexe 2 TMP2: Performance measurement
The process designed to calculate the effectiveness of the portfolio’s or manager’s
investment returns or borrowing costs and the application of the resulting data for the
purposes of comparison with the performance of other portfolios or managers, or with
recognised industry standards or market indices.
TMP3: Decision-making and analysis
Consideration of key aspects such as risk, legality, creditworthiness and
competitiveness.
TMP4: Approved instruments, methods, and techniques
Consideration of the types of investment instruments the organisation is legally able
to deal in and also the level of competences available within the organisation to allow
effective decisions to be taken.
TMP5: Organisation, clarity and segregation of responsibilities and dealing
arrangements
Clear organisational and decision making lines, clearly laid down division of
responsibilities, proper internal control procedures in place.
TMP6: Reporting requirements and management information requirements.
Covering reporting lines and frequencies.
TMP7: Budgeting, accounting, and audit arrangements
Covering manpower costs, debt and financing costs, bank and overdraft charges,
brokerage commissions, external advisor’s and consultants’ costs.
TMP8: Cash and cash flow management
The preparation of cash flow management forecasts and ‘actuals’ to determine
acceptable levels of cash balances, the adequacy of overdraft facilities and the
optimum arrangements for investing and managing surplus cash.
TMP9: Money laundering
Making Treasury staff aware of the provisions of the Money Laundering Regulations
(2007) and associated legislation such as the Terrorism Act 2000 and the Proceeds
of Crime Act 2002, and ensuring (as far as possible) that adequate procedures are in
place to ensure effective compliance with them.
TMP10:Training and qualifications
Ensuring the staff training and development regime is in place and that staff are
competent to operate within a treasury environment.
Ensuring that Council Members tasked with treasury management responsibilities,
including those responsible for scrutiny, have access to training relevant to their
needs an those responsibilities.

Treasury Management Strategy 2020/21
Annexe 2 TMP11:Use of external service providers
Ensuring that correct appointment and renewal procedures are followed.
TMP12:Corporate governance
The code requires a commitment to the principles of corporate governance, which will
embrace the TPS itself, treasury policies, procedural guidelines and defined
responsibilities, dealings with counter parties and external bodies.

Treasury Management Strategy 2020/21
Annexe 3
Treasury Management Report for the Period to 31 December 2020
1. 2020/21 Treasury Strategy and actions to date
1.1 Strategy – The Council will borrow to cover the impact of maturing debt, and approved unsupported (prudential) capital expenditure but will manage a sustainable level of under-borrowing in order to optimise use of its cash flows and minimise investment counterparty risk.
Information –
2020/21 Estimate
£m Under borrowing c/f from 2008-09 onwards New borrowing Maturing Loans/Early Repayments Other Local Authority Debt
168.62 0
10.14 (0.52)
Prudential borrowing 38.48
216.72 Less: MRP and other repayments In-year (6.48)
Total Amount under Borrowed as at 31/03/21 210.24
There is a significant increase in the estimated borrowing requirement in 2020/21. This is due to the policy of using prudential borrowing to fund capital expenditure instead of corporate resources (capital receipts).
Action – No PWLB borrowing has been undertaken as at 31 December 2020. Decisions on the optimum level of long-term borrowing within the borrowing requirement will be taken during 2020/21 having regard to the prevailing investment and borrowing markets, the Council’s cash flow position and future capital expenditure plans.
1.2 Strategy – To consider debt restructuring either through premature
repayments, converting fixed rate debt to variable rate debt or vice versa, or debt rescheduling. Any restructuring will be done in accordance with the policy on maturity profiles and only where savings can be achieved.
Action – No debt rescheduling exercises have been undertaken so far in 2020/21 as there have been no cost effective opportunities for the council to do so.
1.3 Strategy – To manage the Authority’s debt maturity profile by seeking to ensure
that the maturity profile is kept within the Prudential Indicator Limits set for 2020/21

Treasury Management Strategy 2020/21
Annexe 3
Information – The existing debt maturity profile is in line with this requirement.
Action – There are no periods where repayments exceed the indicator which has been set.
1.4 Strategy – To maintain a spread of maturity dates for cash deposits.
Information – Invested funds were £39m as at 1 April 2020 and £15.5m as at 31 December 2020.
Action – A total of 32 deposits in Money Market Funds equating to £178m have been made as at 31 December 2020. The periods on deposit ranged from 1 day to 2 months. There was also £6.5m invested with YPO for 6 to 10 months.
2. Current Portfolio Position
2.1 The Council's debt and investment position as at 31 December 2020 is shown in the table below.
Treasury Position as at 31 December 2020
Amount £m
Average Interest
Rate %
Fixed Rate Funding: Public Works Loan Board Market Loans Temporary Loans
159.4
NIL NIL
4.88
Variable Rate Funding/Temporary Loans:
Public Works Loan Board Market Loans
NIL 50.0
5.34
Total Debt 209.4 4.99 Investments: Wholesale Cash Deposits
15.5
0.38
Total Investments 15.5 0.38
2.2 The Amount of total debt that is variable is currently £50m, which is 31% of total
debt (excluding temporary borrowing).
Since the PWLB reduced rates by 1% in November 2020 it is expected that new long term borrowing will be taken from the PWLB on a fixed rate basis.
Opportunities to prematurely repay market loans will be investigated and action taken in line with the criteria in 1.2 above.

Treasury Management Strategy 2020/21
Annexe 3 2.3 The investments figure represents the level of reserves and balances together
with net working capital i.e. the cash flow benefit that derives from income receipts flowing in faster than payments are made. It is currently estimated that external income earned from cash deposits during 2020/21 will be £65k including income earned on behalf of other funds e.g. trust funds, investment of internal balances.
3. Banking Arrangements
3.1 The Council entered into a five year contract for its banking arrangements with Barclays Bank on 1 October 2013. The Council took the option to extend the contract for a further two years and an additional approval was granted to extend until 30 September 2021.
3.2 Bank charges are based on changes in the level of activity from year one base figures plus inflation. In order to minimise costs the Council makes every effort to reduce the amount of cash and cheques collected and/or paid out and replace them with electronic processes.
3.3 There is regular contact between the Council and the bank to ensure that the service being provided is as specified and to identify new opportunities and services which the bank may be able to provide.
3.4 The Council’s own banker was identified as a specified investment in the investment strategy agreed for 2020/21. The Council determines the credit rating criteria for its banking facility separately from the criteria applied to wholesale cash deposits. This recognises that funds held with the Council’s own banker are overnight deposits and not term deposits.
4. Cash Flow
4.1 Estimates are made of the Authority’s cash flow on an annual, monthly, weekly and daily basis. These are used to plan the investment activities and are monitored on an on-going basis.
4.2 Daily cash flows are monitored to achieve minimum utilisation of bank overdraft
facilities.