treasure coast regional planning council dri summary agenda... · draft subject to modifications...
TRANSCRIPT

DRAFT Subject to Modifications
TREASURE COAST REGIONAL PLANNING COUNCIL
M E M O R A N D U M
To: Council Members AGENDA ITEM 11 From: Staff Date: October 21, 2011 Council Meeting Subject: Summary of Development of Regional Impact Activity in the Treasure Coast Region Introduction At the June 17, 2011 Council meeting, Council requested that staff provide a summary of Development of Regional Impact (DRI) activity in the region. Specifically, Council asked if staff could provide a report that describes the cumulative impacts of all DRIs approved in the region in terms of number of people and vehicle trips. Council also requested information on the buildout status of each DRI, and a comparison of what was built versus what was approved. This report summarizes the DRI activity in the region to date. The report also describes some of the challenges encountered in providing a more detailed analysis of DRIs in the region. Background Developments of Regional Impact were first defined in the Environmental Land and Water Management Act of 1972 (Sections 380.012-380.07, Florida Statutes). The DRI process is governed by Section 380.06, Florida Statutes, which identifies the types of development and numerical thresholds that determine what projects qualify for this program. The statute defines a DRI as any development which, because of its character, magnitude, or location, would have a substantial effect upon the health, safety, or welfare of citizens of more than one county. Regional planning councils are responsible for coordinating the review of DRIs within their regions. A major responsibility of the regional planning council is to prepare and submit to the local government a report and recommendations on the regional impact of the proposed development. The report typically makes recommendations on how to mitigate or eliminate impacts to regional resources, facilities, and adjacent jurisdictions. The local government with jurisdiction has the responsibility to make a determination on final approval of each DRI and adopt a development order with conditions of approval. Treasure Coast Regional Planning Council was created by Interlocal Agreement between Indian River, St. Lucie, Martin, and Palm Beach counties in 1976. The first DRI reviewed by Council was in 1978. Prior to this time, South Florida Regional Planning Council (SFRPC) reviewed DRIs in the region.

DRAFT Subject to Modifications
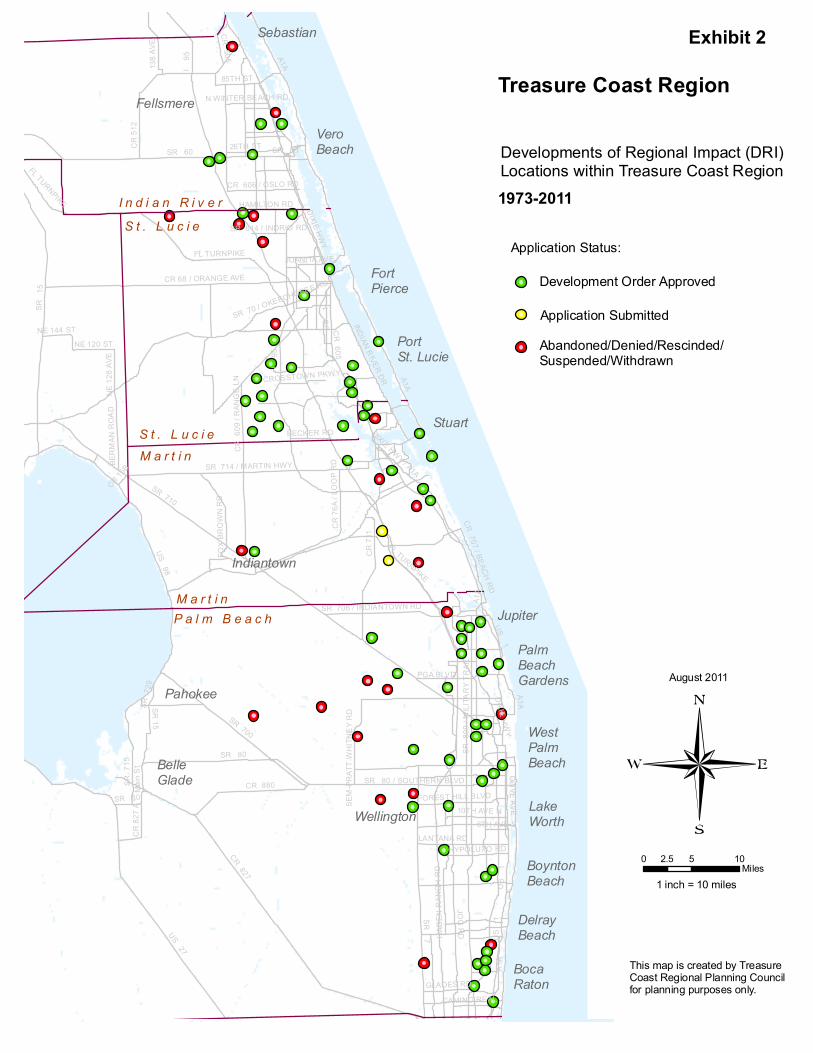
Summary of DRIs in the Region The available records indicate that 90 DRIs have been proposed in the region (Exhibit 1), including 65 projects that received a local government development order and remain viable today; 23 that are nonviable because they were abandoned, denied, rescinded, suspended, or withdrawn prior to the initiation of any development; and 2 that were recently submitted and are currently under review. The viable DRIs are shown in green on the attached map of the region (Exhibit 2). The projects shown in green also feature 3 DRIs that are essentially built-out, but the DRI status was officially abandoned after being completed. These include Jupiter Medical Center, North Palm Beach County General Aviation Facility, and Palm Beach County International Airport. The nonviable DRIs are shown in red on the map in Exhibit 2, and the 2 recently submitted DRIs (Harmony and Hobe Grove) are shown in yellow. The map in Exhibit 2 illustrates that most of the DRIs are located in the eastern portion of the region. The DRIs are distributed in all 4 counties of the region, as shown in the following table:
County
Proposed1 DRIs
Approved1 DRIs
Submitted DRIs
Other2 DRIs
Indian River 7.5 5.5 0 2St. Lucie 23.5 18.5 0 5Martin 17 10 2 5Palm Beach 42 31 0 11Total 90 65 2 231The Lake Pointsett-Martin-Midway DRI transmission line was located in Indian River and St. Lucie counties 2Includes DRIs that were abandoned, denied, rescinded, suspended, or withdrawn prior to development
Approximately 46.7% of the DRIs are located in Palm Beach County, 26.1% in St. Lucie County, 18.9% in Martin County, and 8.3% in Indian River County. The DRI approval rate as measured by the percentage of proposed DRIs approved is 78.7% in St. Lucie County, 73.8% in Palm Beach County, 73.3% in Indian River County, and 66.7% in Martin County. The Martin County percentage excludes the submitted DRIs in this calculation. DRIs and Population Growth in the Region U.S. Census data indicate that the population of the region has grown from 1,204,797 in 1990 to 1,882,269 in 2010, representing a 56.2% increase as shown in the following table:
County
1990 Population
2000 Population
2010 Population
Indian River 90,208 112,947 138,028 St. Lucie 150,171 192,695 277,789 Martin 100,900 126,731 146,318 Palm Beach 863,518 1,131,184 1,320,134 Total 1,204,797 1,563,557 1,882,269
2

DRAFT Subject to Modifications
Changes in population growth of the region are illustrated in color-coded maps of persons per square mile in census tracts using 1990 census data in Exhibit 3, 2000 census data in Exhibit 4, and 2010 census data in Exhibit 5. These maps also include a plot of the viable DRIs for the appropriate time period. The 1990 population map (Exhibit 3) includes all the viable DRIs from 1973 to 1990, the 2000 map (Exhibit 4) includes the DRIs from 1973 to 2000, and the 2010 map (Exhibit 5) includes the DRIs from 1973 to 2010. Comparison of the population maps in Exhibits 3-5 shows that the location of DRIs has closely followed the areas where population growth is most evident in the region. For example, comparison of southern St. Lucie County in the three maps illustrates population growth in the City of Port St. Lucie from 1990 to 2010. From 1990 to 2000, only one new DRI was added to this area, but the changes in color of the census tracts suggest significant population growth. Comparison of this same area from 2000 to 2010 continues to indicate significant population growth. The 2010 map shows a large cluster of relatively new DRIs in western Port St. Lucie. However, the impact of these DRIs on the population of the area is yet to be seen. Three of the 6 most recent DRIs in western Port St. Lucie have not yet started to build (Riverland/Kennedy, Western Grove, and Wilson Groves). Considering all 9 DRIs in western Port St. Lucie and St. Lucie County, only 12,960 (22%) of the 58,874 residential units approved have been built. Using the latest University of Florida, Bureau of Economic and Business Research (BEBR) occupancy rate for St. Lucie County of 2.43 persons per household, and assuming 100% occupancy, these DRIs could account for an existing population of 31,493 persons, compared with a future potential population of 143,064 persons. The impact of DRIs on the total population in the region can be estimated by multiplying the number of actual residential units built in DRIs by the latest average household size provided by BEBR. The average household size is 2.23 persons in Indian River County, 2.43 persons in St. Lucie County, 2.21 persons in Martin County, and 2.34 persons in Palm Beach County. Use of these values yield the following estimates of the total percent of population attributed to DRIs:
County
2010 Total Population
DRI Population
DRI Percent of Total
Indian River 138,028 5,087 3.7% St. Lucie 277,789 48,129 17.3% Martin 146,318 21,355 14.6% Palm Beach 1,320,134 65,031 4.9% Region 1,882,269 139,607 7.4%
This analysis indicates that DRIs have played a much greater role in the total population growth in St. Lucie and Martin counties, and are responsible for far less of the total population growth in Indian River and Palm Beach counties.
3
DRAFT Subject to Modifications
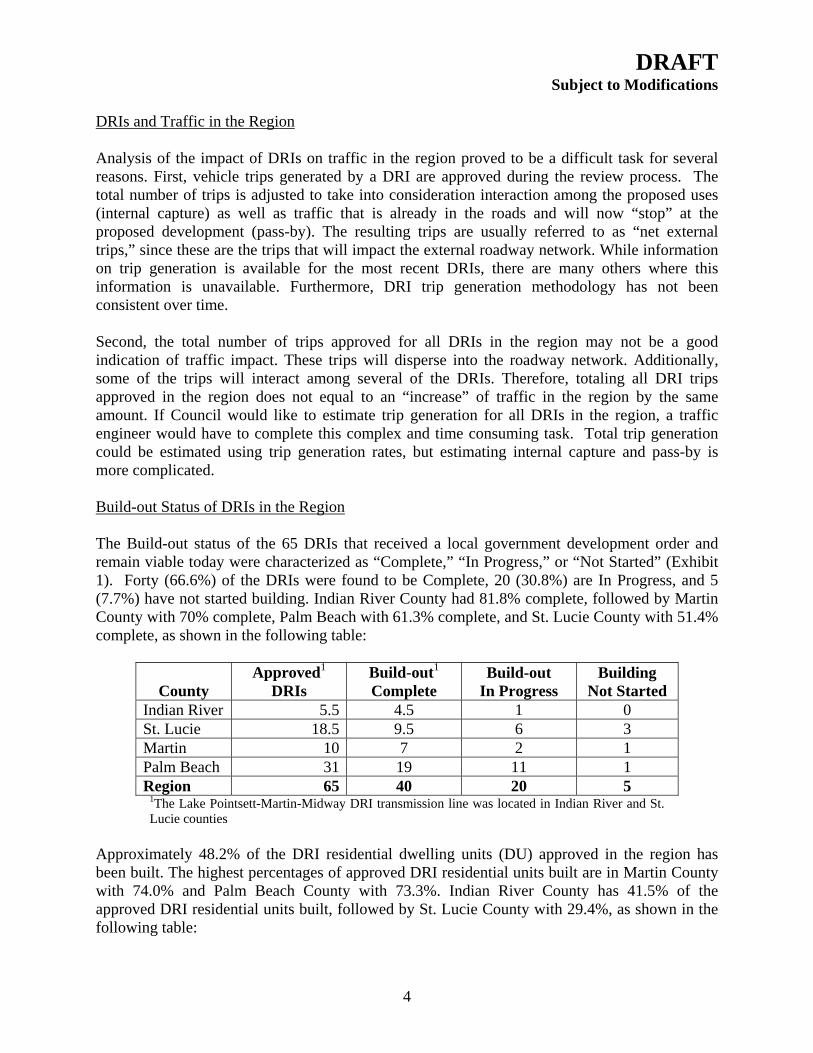
DRIs and Traffic in the Region Analysis of the impact of DRIs on traffic in the region proved to be a difficult task for several reasons. First, vehicle trips generated by a DRI are approved during the review process. The total number of trips is adjusted to take into consideration interaction among the proposed uses (internal capture) as well as traffic that is already in the roads and will now “stop” at the proposed development (pass-by). The resulting trips are usually referred to as “net external trips,” since these are the trips that will impact the external roadway network. While information on trip generation is available for the most recent DRIs, there are many others where this information is unavailable. Furthermore, DRI trip generation methodology has not been consistent over time. Second, the total number of trips approved for all DRIs in the region may not be a good indication of traffic impact. These trips will disperse into the roadway network. Additionally, some of the trips will interact among several of the DRIs. Therefore, totaling all DRI trips approved in the region does not equal to an “increase” of traffic in the region by the same amount. If Council would like to estimate trip generation for all DRIs in the region, a traffic engineer would have to complete this complex and time consuming task. Total trip generation could be estimated using trip generation rates, but estimating internal capture and pass-by is more complicated. Build-out Status of DRIs in the Region The Build-out status of the 65 DRIs that received a local government development order and remain viable today were characterized as “Complete,” “In Progress,” or “Not Started” (Exhibit 1). Forty (66.6%) of the DRIs were found to be Complete, 20 (30.8%) are In Progress, and 5 (7.7%) have not started building. Indian River County had 81.8% complete, followed by Martin County with 70% complete, Palm Beach with 61.3% complete, and St. Lucie County with 51.4% complete, as shown in the following table:
County
Approved1 DRIs
Build-out1 Complete
Build-out In Progress
Building Not Started
Indian River 5.5 4.5 1 0 St. Lucie 18.5 9.5 6 3 Martin 10 7 2 1 Palm Beach 31 19 11 1 Region 65 40 20 5
1The Lake Pointsett-Martin-Midway DRI transmission line was located in Indian River and St. Lucie counties
Approximately 48.2% of the DRI residential dwelling units (DU) approved in the region has been built. The highest percentages of approved DRI residential units built are in Martin County with 74.0% and Palm Beach County with 73.3%. Indian River County has 41.5% of the approved DRI residential units built, followed by St. Lucie County with 29.4%, as shown in the following table:
4

DRAFT Subject to Modifications
County
Approved Residential
(DU)
Built Residential
(DU)
Percent
Built Indian River 5,492 2,281 41.5% St. Lucie 67,340 19,806 29.4% Martin 13,050 9,663 74.0% Palm Beach 38,308 28,096 73.3% Region 124,190 59,846 48.2%
Approximately 45.3% of the DRI non-residential square feet (SF) approved in the region has been built. The highest percentage of approved DRI non-residential SF is in Indian River County with 75.4%, followed by Martin County with 64.9%, Palm Beach County with 52.8%, and St. Lucie County with 28.2%, as shown in the following table:
County
Approved Non-Residential
(SF)
Built Non-Residential
(SF)
Percent
Built Indian River 2,188,174 1,649,163 75.4% St. Lucie 29,446,372 8,317,024 28.2% Martin 4,025,342 2,614,239 64.9% Palm Beach 47,691,297 25,162,103 52.8% Region 83,351,185 37,742,529 45.3%
This analysis indicates that within the region, slightly less than half of all residential units and non-residential square footage approved in DRIs have been built. Future of DRIs in the Region Significant changes were made to the DRI regulations in Section 380.06, Florida Statutes, when Florida Senate Bill 360 was signed into law on June 1, 2009. Many of these same changes were reaffirmed when Florida House Bill 7207 was signed into law on June 2, 2011. Proposed developments are now automatically exempt from the DRI process if located in: 1) a municipality that has an average of at least 1,000 people per square mile of land area and a minimum total population of at least 5,000; 2) a county, including the municipalities located in the county, that has an average of at least 1,000 people per square mile of land area and is located within an urban service area as defined in Section 163.3164, Florida Statutes, which has been adopted into the comprehensive plan; 3) a county, including the municipalities located therein, which has a population of at least 900,000, that has an average of at least 1,000 people per square mile of land area, but which does not have an urban service area designated in the comprehensive plan; or 4) a county, including the municipalities located therein, which has a population of at least 1 million and is located within an urban service area as defined in Section 163.3164, Florida Statutes, which has been adopted into the comprehensive plan. For the region, this means that new DRIs are exempt from any location in Palm Beach County; from within qualifying urban service areas in Indian River, St. Lucie, and Martin counties; and
5

DRAFT Subject to Modifications
6
from within all municipalities in the region except the following: City of Fellsmere, Town of Indian River Shores, Town of Orchid, Town of St. Lucie Village, Town of Jupiter Island, Town of Ocean Breeze Park, and Town of Sewall’s Point (Exhibit 6). Relatively few new DRIs are expected in the future because much of the region is now exempt from the DRI process. The development orders of previously approved DRIs in exempt areas continue to be effective. Discussion There were major challenges in collecting the information necessary to produce this summary. First, many elements of the DRIs have changed over time, including the names of many DRIs, property boundaries, local governments with jurisdiction, and regional planning councils. The first 12 DRIs processed from 1973 to 1975 in the Treasure Coast Region were reviewed by SFRPC. Second, the files of the older DRIs are not as complete as the files of newer DRIs. This includes all the information in the applications, development orders, and annual reports. Many of the development orders have been modified numerous times, making it difficult to track changes in levels of approval over time. Also, many of the DRIs have not kept up with providing annual reports. Council is missing annual reports for 23 of the 65 DRIs that received local government development orders. Many of the annual reports that Council does have contain incomplete or outdated information. Staff relied on and gratefully acknowledges the assistance from several local governments and private consultants in collecting the information necessary for this summary. Recommendation For informational purposes only. Attachments

Exhibit 1

Exhibit 1 (continued)
P a l m B e a c hM a r t i n
S t . L u c i eM a r t i n
I n d i a n R i v e rS t . L u c i e
Stuart
Jupiter
Pahokee
Sebastian
Fellsmere
Wellington
Indiantown
BocaRaton
LakeWorth
VeroBeach
BelleGlade
FortPierce
DelrayBeach
BoyntonBeach
PortSt. Lucie
WestPalmBeach
PalmBeachGardens
SR 710
I 95
A1A
US
1
US 27
JOG RD
SR 60
US 98
SR 7
SR 1
5
FL TURNPIKE
SR 80
CR 880
SR 700
CR 827
SR 8
09 / M
ILITA
RY TR
AIL
SR 7
15
SR 70 / OKEECHOBEE RD
CR 71
1
CR 51
2
CR 68 / ORANGE AVE
DIXIE HWY
SR 714 / MARTIN HWY
SR 15
CR 605
SR 80 / SOUTHERN BLVD
INDIAN RIVER DRDIXIE HWY / A1A
SR 706 / INDIANTOWN RD
GLADES RD
CR 505
10TH AVE N
85TH ST
BERM
AN R
OAD
HAGE
N RA
NCH
RD
FOX
BROW
N RD
26TH ST
FOREST HILL BLVD
NE 120 ST
Main
St
HYPOLUXO RD
138 A
VE
LANTANA RDCR 82
7 A
PGA BLVD
CR 606 / OSLO RD
NE 12
8 AVE
CR 707 / BEACH RD
CAMINO REAL
SEM-
PRAT
T WHI
TNEY
RD
BECKER RD
CR 6
09 / R
ANGE
LN
SR 7
29
NE 144 STCR
76A /
LOOP
RD
CROSSTOWN PKWY
6TH AVE S
N WINTER BEACH RD
OLIVE AVE
JUANITA AVE
CR 15B
SR 614 / INDRIO RD
HAMILTON RD
US 1
I 95
SR 60
A1A
DIXIE HWY
FL TURNPIKE
A1A
US
1US
1
A1A
FL TURNPIKE
SR 80
A1A
This map is created by Treasure Coast Regional Planning Council for planning purposes only.
August 2011
1 inch = 10 miles
Treasure Coast Region
0 5 102.5Miles
Developments of Regional Impact (DRI)Locations within Treasure Coast Region1973-2011
Application Status:
Development Order Approved
Application SubmittedAbandoned/Denied/Rescinded/Suspended/Withdrawn
Exhibit 2

P a l m B e a c hM a r t i n
S t . L u c i eM a r t i n
I n d i a n R i v e rS t . L u c i e
Stuart
Jupiter
Pahokee
Sebastian
Fellsmere
Wellington
Indiantown
BocaRaton
LakeWorth
VeroBeach
BelleGlade
FortPierce
DelrayBeach
BoyntonBeach
PortSt. Lucie
WestPalmBeach
PalmBeachGardens
This map is created by Treasure Coast Regional Planning Council for planning purposes only.
August 2011
1 inch = 10 miles
Treasure Coast Region1990 Population
0 5 102.5Miles
Source: U.S. Census 1990
Persons per Square Mile0 - 4950 - 99100 - 499500 - 9991,000 or more
Development Order Approved
Developments of Regional Impact (DRI)Locations within Treasure Coast Region1973-1990
Exhibit 3

P a l m B e a c hM a r t i n
S t . L u c i eM a r t i n
I n d i a n R i v e rS t . L u c i e
Stuart
Jupiter
Pahokee
Sebastian
Fellsmere
Wellington
Indiantown
BocaRaton
LakeWorth
VeroBeach
BelleGlade
FortPierce
DelrayBeach
BoyntonBeach
PortSt. Lucie
WestPalmBeach
PalmBeachGardens
This map is created by Treasure Coast Regional Planning Council for planning purposes only.
August 2011
1 inch = 10 miles
Treasure Coast Region2000 Population
0 5 102.5Miles
Source: U.S. Census 2000
Persons per Square Mile0 - 4950 - 99100 - 499500 - 9991,000 or more
Development Order Approved
Developments of Regional Impact (DRI)Locations within Treasure Coast Region1973-2000
Exhibit 4

P a l m B e a c hM a r t i n
S t . L u c i eM a r t i n
I n d i a n R i v e rS t . L u c i e
Stuart
Jupiter
Pahokee
Sebastian
Fellsmere
Wellington
Indiantown
BocaRaton
LakeWorth
VeroBeach
BelleGlade
FortPierce
DelrayBeach
BoyntonBeach
PortSt. Lucie
WestPalmBeach
PalmBeachGardens
This map is created by Treasure Coast Regional Planning Council for planning purposes only.
August 2011
1 inch = 10 miles
Treasure Coast Region2010 Population
0 5 102.5Miles
Source: U.S. Census 2010
Persons per Square Mile0 - 4950 - 99100 - 499500 - 9991,000 or more
Development Order Approved
Developments of Regional Impact (DRI)Locations within Treasure Coast Region1973-2011
Exhibit 5

P a l m B e a c hM a r t i n
S t . L u c i eM a r t i n
I n d i a n R i v e rS t . L u c i e
Stuart
Jupiter
Pahokee
Sebastian
Wellington
Indiantown
BocaRaton
LakeWorth
VeroBeach
BelleGlade
FortPierce
DelrayBeach
BoyntonBeach
PortSt. Lucie
WestPalmBeach
PalmBeachGardens
Orchid
Fellsmere
Sewall's Point
JupiterIsland
OceanBreeze Park
St. LucieVillage
Indian RiverShores
SR 710
US 98
SR 1
5
A1A
SR 60
I 95
FL TURNPIKE
CR 71
1
CR 51
2
SR 70 / OKEECHOBEE RD
SR 714 / MARTIN HWY
CR 68 / ORANGE AVE
US 1
DIXIE HWY
SR 7
8 BERM
AN R
OAD
FOX
BROW
N RD
NE 120 ST
138 A
VECR 606 / OSLO RD
NE 12
8 AVE
CR 6
09 / R
ANGE
LN
CR 722 / COVE RD
NE 144 ST
CR 76
A / LO
OP R
D
CR 15B
SR 614 / INDRIO RD
HAMILTON RD A1A
FL TURNPIKE
I 95
A1A
US 27
SR 80
CR 880
SR 700
CR 827
US 9
8
SR 710
SR 80 / SOUTHERN BLVD
SR 706 / INDIANTOWN RD
GLADES RD
A1A
CR 71
1
BOYNTON BCH BLVD
SEM-
PRAT
T WHI
TNEY
RD
This map is created by Treasure Coast Regional Planning Council for planning purposes only.
August 2011
1 inch = 10 miles
Treasure Coast Region
0 5 102.5Miles
ExemptNot Exempt
DRI Exemption Areas
Exhibit 6