transylvania county schools
TRANSCRIPT
TRANSYLVANIA COUNTY SCHOOLS BREVARD, NORTH CAROLINA
INTEGRATED PLANNING FOR SCHOOL AND COMMUNITY
(IPSAC)
LAND USE STUDY REPORT
PREPARED AND SUBMITTED BY
OPERATIONS RESEARCH AND EDUCATION LABORATORY
INSTITUTE FOR TRANSPORTATION RESEARCH AND EDUCATION
NORTH CAROLINA STATE UNIVERSITY
APRIL 7, 2015


2014-15 IPSAC Land Use Study – Transylvania County Schools 1
INTEGRATED PLANNING FOR SCHOOL AND COMMUNITY
School systems nationwide are facing difficult planning challenges arising from a changing
student population, an aging school infrastructure, and increasing complexity in pupil
assignments. The communities that must fund building and renovation projects share these
challenges. The Operations Research and Education Laboratory (OREd) has developed a system
of Integrated Planning for School and Community (IPSAC) that integrates community and
regional data, economic and demographic forecasts, land use studies, GIS student and school
data, and mathematical optimization algorithms. The integrated planning system is comprised of
multiple data-driven components including:
Membership Forecasting
Land Use Studies
Out-Of-Capacity Analysis
School Site Optimization
Attendance Zone Optimization
OREd is part of the Geovisual Analytics and Decision Management (GADA) group at the
Institute for Transportation Research and Education (ITRE) on Centennial Campus of North
Carolina State University. Since its founding in 1990, OREd has assisted dozens of school
districts in North Carolina and beyond and has served many districts for over two decades.
OREd is a pioneer in data-driven decision science applications in school planning and continues
to explore new technologies that help decision-makers better plan for their schools and the
communities they serve.
This report documents findings from the limited study of the Transylvania County Schools
district. The objective of this study is to quantify future growth potential. The study includes
two components: interviews and data analysis.
Interviews: Interviews allow OREd to compose an impression of future growth of the study area
by interviewing a cross-section of people from government, business, and civic leaders. By
involving the community in the study, these critical interviews cultivate an understanding of
infrastructure development plans (transportation, water/sewer), recent subdivision permits,
residential zonings, available land for development, and comprehensive plans developed by the
local government agencies.
Data Analysis: OREd performs geo-spatial analyses based on GIS parcel and student data using
state-of-the-art GIS software. The GIS analysis provides quantitative data concerning available
parcels and subdivision lots that then can be used to identify areas of future growth. Student
demographic analysis can also be conducted at this stage to better understand socio-economic
compositions that may influence school assignment decisions. Census data is also used to paint a
broad picture of county demographics.
The end result of this analysis is a forecast of membership growth; by district and by school.

2 2014-15 IPSAC Land Use Study – Transylvania County Schools
INTRODUCTION
Transylvania County is located in western North
Carolina, nestled in the Appalachian Mountains
about 30 miles southwest of Asheville, NC and
60 miles north of Greenville-Spartanburg, SC.
Transylvania County covers 379 square miles of
which 136 square miles is National Forest land.
Of the 242,988 acres in the county, nearly 76%
has been identified as having development constraints. (See Table 1.)
The remaining 60,000 acres includes steep slopes and prime farmland.
The actual developable land area is less than 60,000 acres.
Quick Facts and Forecasts
The population estimate for 2013 showed a -0.6% decrease since 2010.
ACCESSNC1 projects the population to increase to 35,029 in 2019 as
shown in Table 2.
The projected increase in the total population is not uniform across age
groups. In particular, the number of school-aged persons is projected to
decrease, as seen in Table 3, from 5326 in
2000 to 5063 in 2019.
This aging population is best defined by
the median age. The median age rises
from 43.8 in 2000 to an estimated 49.5 in
2019. Almost one-third of all persons in
Transylvania County are projected to be
60 or older by 2019.
These projections follow a trend. The
percentage of persons 18 years or younger
of the total population has decreased from
20.36% in 2000 to 17.62% in 2010. The
percentage of persons 60 years or older
has increased from 21.42% in
2000 to 25.81% in 2010.
The number of households is
projected to increase, as shown
in Table 4. However, the
average household size will
continue to decrease to about
2.2 persons per household in
2019. A large number of the
housing units will continue to
be vacant (mostly because of
seasonal residences).
1 ACCESSNC is a project of the N C Department of Commerce.
Year Population
2019 35029
2014 34047
2013 32903
2010 33090
2000 29334 Table 2 - Population
Age Group 2000 2019
All 29334 35029
0 - 4 1435 4.9% 1504 4.3%
5 - 9 1591 5.4% 1559 4.5%
10 - 14 1776 6.1% 1681 4.8%
15 - 19 1959 6.7% 1823 5.2%
60+ 8199 28.0% 11436 32.6%
Median Age 43.8 49.5
Table 3 – Population by Age Group
1990 2000 2019
Number of Housing Units 12893 15553 20721
Per Cent of Housing Units Vacant 23% 20.8 25%
Number of Owner Housing Units 8039 9917 11386
Number of Rental Housing Units 2411 2675 4096
Total households 10001 12370 14971
Average Household Size 2.29 2.2 Table 4 – Housing Facts
Table 1 – Non-Developable Land
2014-15 IPSAC Land Use Study – Transylvania County Schools 3
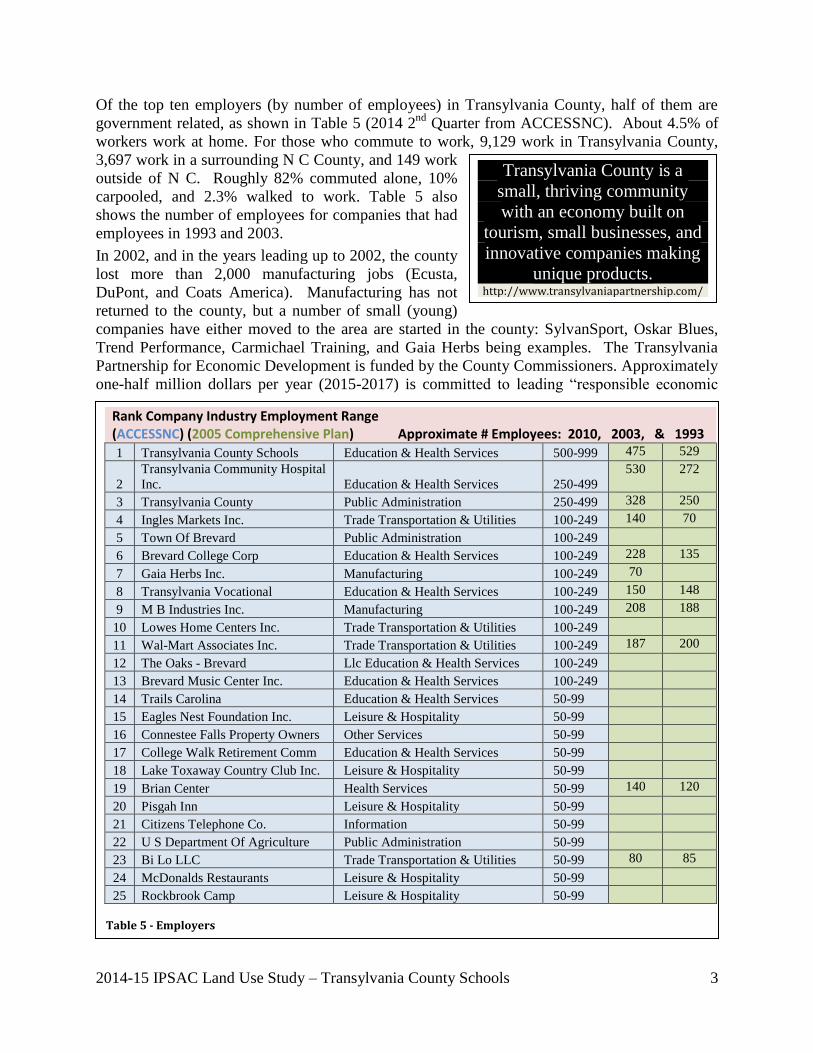
Of the top ten employers (by number of employees) in Transylvania County, half of them are
government related, as shown in Table 5 (2014 2nd
Quarter from ACCESSNC). About 4.5% of
workers work at home. For those who commute to work, 9,129 work in Transylvania County,
3,697 work in a surrounding N C County, and 149 work
outside of N C. Roughly 82% commuted alone, 10%
carpooled, and 2.3% walked to work. Table 5 also
shows the number of employees for companies that had
employees in 1993 and 2003.
In 2002, and in the years leading up to 2002, the county
lost more than 2,000 manufacturing jobs (Ecusta,
DuPont, and Coats America). Manufacturing has not
returned to the county, but a number of small (young)
companies have either moved to the area are started in the county: SylvanSport, Oskar Blues,
Trend Performance, Carmichael Training, and Gaia Herbs being examples. The Transylvania
Partnership for Economic Development is funded by the County Commissioners. Approximately
one-half million dollars per year (2015-2017) is committed to leading “responsible economic
Rank Company Industry Employment Range (ACCESSNC) (2005 Comprehensive Plan) Approximate # Employees: 2010, 2003, & 1993
1 Transylvania County Schools Education & Health Services 500-999 475 529
2
Transylvania Community Hospital
Inc. Education & Health Services 250-499
530 272
3 Transylvania County Public Administration 250-499 328 250
4 Ingles Markets Inc. Trade Transportation & Utilities 100-249 140 70
5 Town Of Brevard Public Administration 100-249
6 Brevard College Corp Education & Health Services 100-249 228 135
7 Gaia Herbs Inc. Manufacturing 100-249 70
8 Transylvania Vocational Education & Health Services 100-249 150 148
9 M B Industries Inc. Manufacturing 100-249 208 188
10 Lowes Home Centers Inc. Trade Transportation & Utilities 100-249
11 Wal-Mart Associates Inc. Trade Transportation & Utilities 100-249 187 200
12 The Oaks - Brevard Llc Education & Health Services 100-249
13 Brevard Music Center Inc. Education & Health Services 100-249
14 Trails Carolina Education & Health Services 50-99
15 Eagles Nest Foundation Inc. Leisure & Hospitality 50-99
16 Connestee Falls Property Owners Other Services 50-99
17 College Walk Retirement Comm Education & Health Services 50-99
18 Lake Toxaway Country Club Inc. Leisure & Hospitality 50-99
19 Brian Center Health Services 50-99 140 120
20 Pisgah Inn Leisure & Hospitality 50-99
21 Citizens Telephone Co. Information 50-99
22 U S Department Of Agriculture Public Administration 50-99
23 Bi Lo LLC Trade Transportation & Utilities 50-99 80 85
24 McDonalds Restaurants Leisure & Hospitality 50-99
25 Rockbrook Camp Leisure & Hospitality 50-99
Table 5 - Employers
Transylvania County is a
small, thriving community
with an economy built on
tourism, small businesses, and
innovative companies making
unique products. http://www.transylvaniapartnership.com/

4 2014-15 IPSAC Land Use Study – Transylvania County Schools
development through engaging the private and public sectors to develop community assets that
are needed to maximize opportunities for investment and quality job creation.” (Mission
Statement of the Transylvania Partnership for Economic Development) The success of the
Henderson County industry recruiting agency in obtaining new industry, especially in the Mills
River area, may have encouraged this
investment by the commissioners. Another
175 new jobs is anticipated in 2015 because
of the agency’s efforts. (Henderson
Lightning, January 23, 2015) Because of the
lack of affordable housing in Mills River,
and the close proximity to Transylvania
County (see Figure 1), the jobs in Mills
River may end up bringing new residents to
Transylvania County.
The median earnings per worker in
Transylvania County is $34,683, just above
Jackson County and less than Buncombe,
Henderson, Haywood, Pickens, and
Greenville Counties. The median household income is $41,781, just above Haywood and
Jackson Counties, but below Pickens, Buncombe, Henderson, and Greenville Counties. About
12.4% of people are self-employed in Transylvania County (reported self-employment income),
only lower than Buncombe County. In terms of source of income, Transylvania County has the
largest proportion of investment and retirement income, 25.6%, as well as Social Security,
17.1%, of the total income, of all surrounding counties.
The unemployment rate in Transylvania County is reported at 5%. However, only 53.1% of the
population is in the labor force, the lowest of all surrounding counties and much lower than the
US rate of 64.3%. About 31.8% of all families in Transylvania County have no one working.
29.5% of families have a single earner.
Data sources: North Carolina Office of State Budget and Management, State Demographics Unit,
http://www.osbm.state.nc.us/ncosbm/facts_and_figures/socioeconomic_data/ and the North Carolina Department of
Commerce, http://www.nccommerce.com/
Figure 1 – Mills River
2014-15 IPSAC Land Use Study – Transylvania County Schools 5
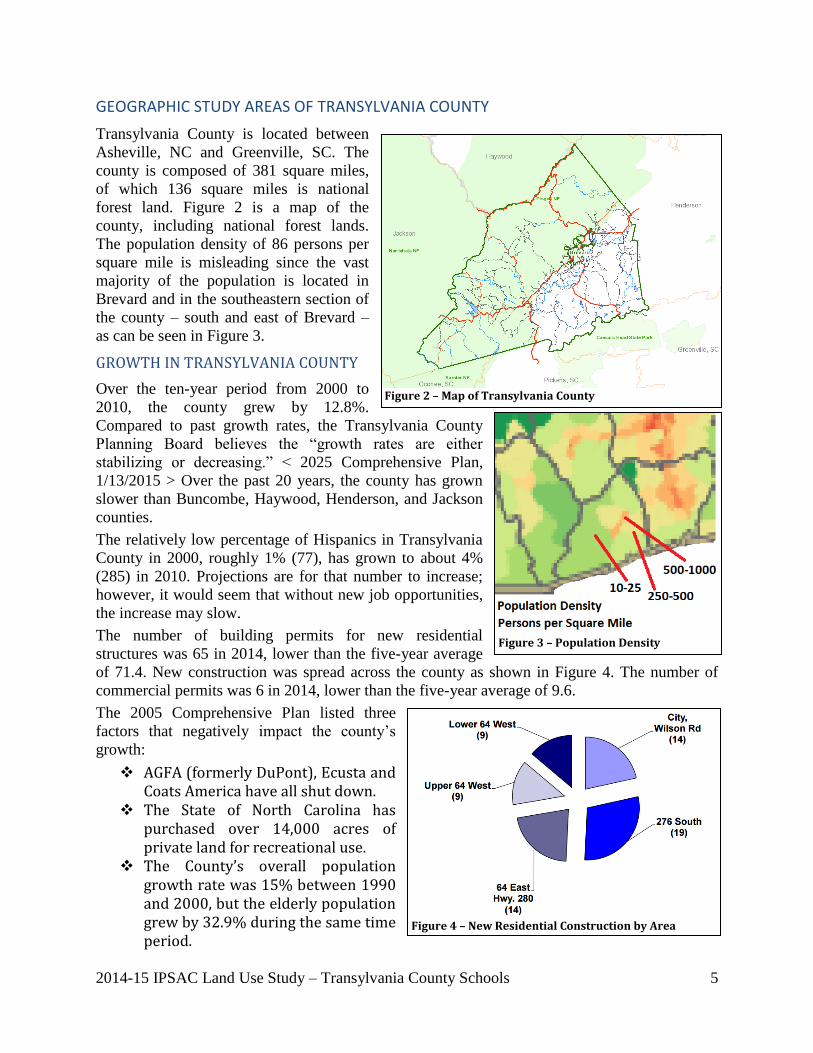
GEOGRAPHIC STUDY AREAS OF TRANSYLVANIA COUNTY
Transylvania County is located between
Asheville, NC and Greenville, SC. The
county is composed of 381 square miles,
of which 136 square miles is national
forest land. Figure 2 is a map of the
county, including national forest lands.
The population density of 86 persons per
square mile is misleading since the vast
majority of the population is located in
Brevard and in the southeastern section of
the county – south and east of Brevard –
as can be seen in Figure 3.
GROWTH IN TRANSYLVANIA COUNTY
Over the ten-year period from 2000 to
2010, the county grew by 12.8%.
Compared to past growth rates, the Transylvania County
Planning Board believes the “growth rates are either
stabilizing or decreasing.” < 2025 Comprehensive Plan,
1/13/2015 > Over the past 20 years, the county has grown
slower than Buncombe, Haywood, Henderson, and Jackson
counties.
The relatively low percentage of Hispanics in Transylvania
County in 2000, roughly 1% (77), has grown to about 4%
(285) in 2010. Projections are for that number to increase;
however, it would seem that without new job opportunities,
the increase may slow.
The number of building permits for new residential
structures was 65 in 2014, lower than the five-year average
of 71.4. New construction was spread across the county as shown in Figure 4. The number of
commercial permits was 6 in 2014, lower than the five-year average of 9.6.
The 2005 Comprehensive Plan listed three
factors that negatively impact the county’s
growth:
AGFA (formerly DuPont), Ecusta and Coats America have all shut down.
The State of North Carolina has purchased over 14,000 acres of private land for recreational use.
The County’s overall population growth rate was 15% between 1990 and 2000, but the elderly population grew by 32.9% during the same time period.
Figure 2 – Map of Transylvania County
Figure 3 – Population Density
Figure 4 – New Residential Construction by Area

6 2014-15 IPSAC Land Use Study – Transylvania County Schools
This plan also noted the increasing median age of the population and the decreasing size of the
average household – both negative impacts on the number of citizens in the county. The plan
predicted a 15 to 20% increase in the county’s population over the next ten years –
overestimating the actual rate of increase by 2.2 to 7.2%.
Historically, a large number of Transylvania
County citizens have been employed in
manufacturing. That number decreased
rapidly in the last decade of the 20th
century.
Those jobs were replaced by jobs in
Wholesale and Retail and in Service and
Misc. See Figure 5.
The AccessNC report in 2014 showed that,
aside from private industry, health care,
retail trade, accommodation and food
service, and education, in addition to
government, employed the most citizens of
Transylvania County. See Figure 6.
Figure 5 – Industry Employment by Work Type
Figure 6 – Employment by Industry
2014-15 IPSAC Land Use Study – Transylvania County Schools 7
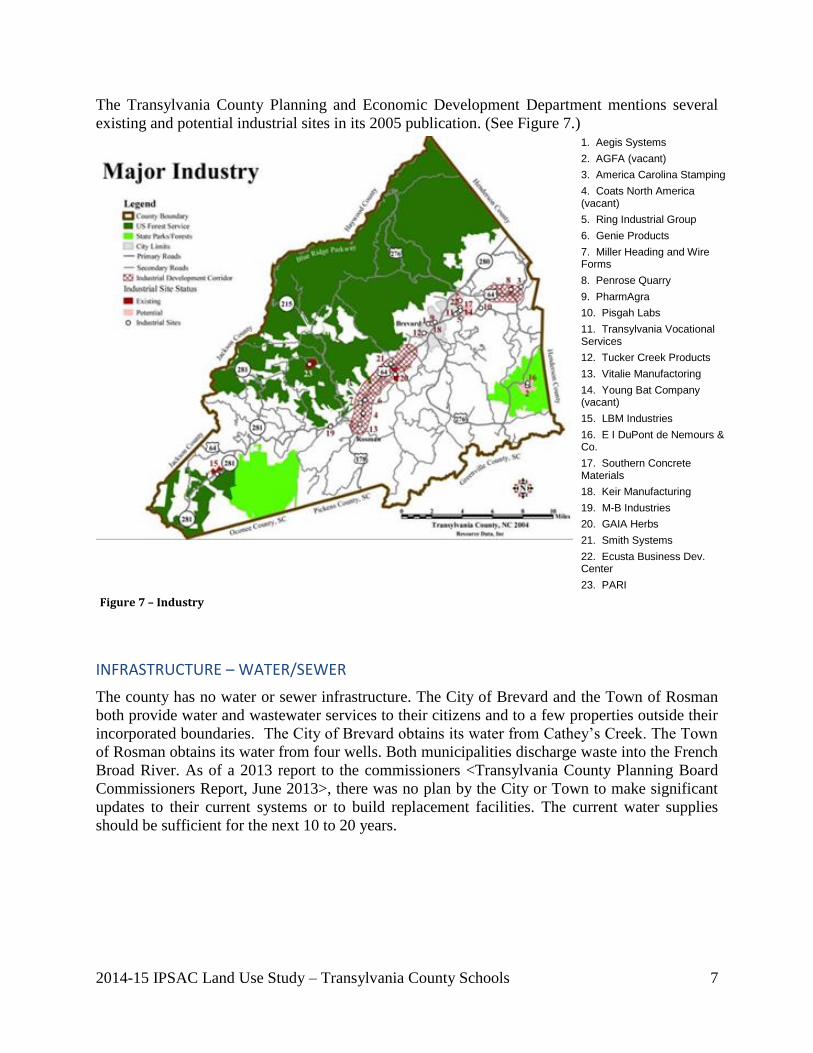
The Transylvania County Planning and Economic Development Department mentions several
existing and potential industrial sites in its 2005 publication. (See Figure 7.)
1. Aegis Systems
2. AGFA (vacant)
3. America Carolina Stamping
4. Coats North America (vacant)
5. Ring Industrial Group
6. Genie Products
7. Miller Heading and Wire Forms
8. Penrose Quarry
9. PharmAgra
10. Pisgah Labs
11. Transylvania Vocational Services
12. Tucker Creek Products
13. Vitalie Manufactoring
14. Young Bat Company (vacant)
15. LBM Industries
16. E I DuPont de Nemours & Co.
17. Southern Concrete Materials
18. Keir Manufacturing
19. M-B Industries
20. GAIA Herbs
21. Smith Systems
22. Ecusta Business Dev. Center
23. PARI Figure 7 – Industry
INFRASTRUCTURE – WATER/SEWER
The county has no water or sewer infrastructure. The City of Brevard and the Town of Rosman
both provide water and wastewater services to their citizens and to a few properties outside their
incorporated boundaries. The City of Brevard obtains its water from Cathey’s Creek. The Town
of Rosman obtains its water from four wells. Both municipalities discharge waste into the French
Broad River. As of a 2013 report to the commissioners <Transylvania County Planning Board
Commissioners Report, June 2013>, there was no plan by the City or Town to make significant
updates to their current systems or to build replacement facilities. The current water supplies
should be sufficient for the next 10 to 20 years.
8 2014-15 IPSAC Land Use Study – Transylvania County Schools
There are several residential communities that provide public water and/or wastewater
services. Connestee Falls, Burlingame and Lake Toxaway are three examples. In addition, there
are a number of smaller public water and wastewater systems that are permitted by the State, but
most residents and businesses outside the incorporated areas of Brevard and Rosman use wells
and septic systems.
INFRASTRUCTURE – TRANSPORTATION
The 2013 report (above) discussed transportation issues. Three major projects were identified as
“major issues” for the next ten years:
Safety improvement and climbing lanes on US 64 from NC 107 at Cashiers to US 178 at
Rosman.
Relocation and construction of NC 215.
Improving and paving NC 281 N to Jackson County
The report expressed the need for municipalities and developers to
Consider the environment when planning transportation
Promote alternative transportation (bike paths and pedestrian paths)
EDUCATION
Transylvania County Schools manages nine schools
that serve about 3,500 students. There are two high
school attendance zones. Each high school is fed by a
middle school that shares the same attendance zone.
Each middle school is fed by two elementary schools.
One special/alternative school serves middle and high
school students.
Brevard Academy is a charter school that opened in
1998. It started the 2014-15 school year with 251 students. The target enrollment for 2016-17 is
325. The target enrollment will most likely require a move to a new campus and would represent
a substantial increase in enrollment. Historical information shows enrollment averaging less than
200 students per year over the past 8 years. (This information was obtained from
schooldigger.com. No one at the academy responded to requests for information.)
There may be as many as six private schools in Transylvania County. (Data is difficult to
obtain.) Table 6 identifies these school as well as the approximate number of students they
serve, the number of teachers (if known), and the grades taught.
The mission of Transylvania County Schools is to prepare students to become caring and productive citizens in an ever-changing society through the shared responsibility of students, parents, educators, and the community. www.transylvania.k12.nc.us
Private Schools # Students # Teachers Grades
Anchor Baptist Academy 10
K-11
Bethany Christian School 36 4 PK-8
Looking Glass Montessori School 9
PK
Mountain Sun Community School 48 11 PK-6
The Outdoor Academy 19 8 9-11
Wellspring Academy of the Carolinas 32 7 6-12
Table 6 – Private Schools in Transylvania County
2014-15 IPSAC Land Use Study – Transylvania County Schools 9
There are at least two home school groups that serve Transylvania County residents.
Nationwide, the US Dept. of Education estimates that 3% of the school-age population is
homeschooled. GIS ANALYSIS AND MEMBERSHIP TRENDS
Another component of the IPSAC Land Use Study is collection and analysis of Geographic
Information Systems (GIS) data. GIS analysis allows OREd to quantify student generation rates
in different areas of the district.
Neighborhoods, Subdivisions and the Student Generation Ratio An analysis of GIS data matched with planning data provides a student generation ratio (SGR)
for a subdivision or neighborhood. Planning data is used to find the number of developed lots
(residences). GIS data (student geocode) is used to find the number of students. The ratio of the
number of students to the number of residences yields the SGR.
If additional lots are available in a subdivision, the SGR can project the number of school
children those lots should produce. If a new subdivision is planned, the number of students that
subdivision may generate can be approximated by using a known SGR from a comparable
subdivision elsewhere in the county.
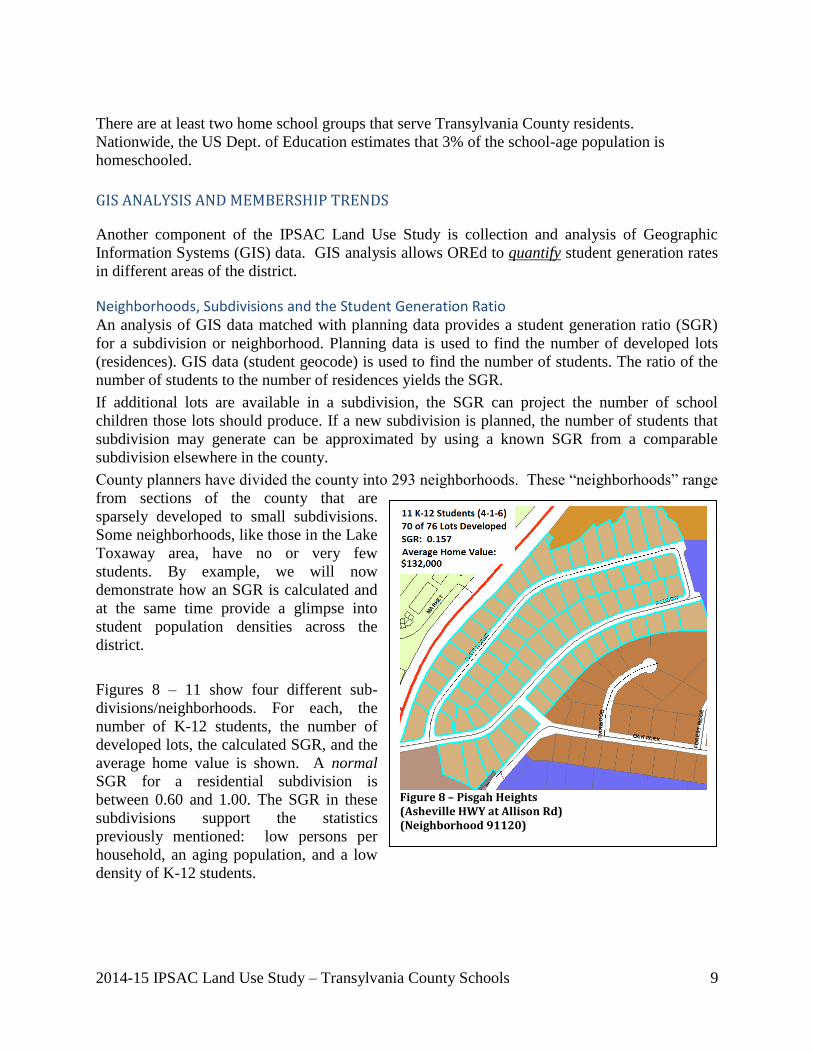
County planners have divided the county into 293 neighborhoods. These “neighborhoods” range
from sections of the county that are
sparsely developed to small subdivisions.
Some neighborhoods, like those in the Lake
Toxaway area, have no or very few
students. By example, we will now
demonstrate how an SGR is calculated and
at the same time provide a glimpse into
student population densities across the
district.
Figures 8 – 11 show four different sub-
divisions/neighborhoods. For each, the
number of K-12 students, the number of
developed lots, the calculated SGR, and the
average home value is shown. A normal
SGR for a residential subdivision is
between 0.60 and 1.00. The SGR in these
subdivisions support the statistics
previously mentioned: low persons per
household, an aging population, and a low
density of K-12 students.
Figure 8 – Pisgah Heights (Asheville HWY at Allison Rd) (Neighborhood 91120)

10 2014-15 IPSAC Land Use Study – Transylvania County Schools
Figure 9 – South Illahee (Cardinal Rd and Illahee Rd) (Neighborhood 34206)
Figure 10 – Woodland Terrace (Woodland and Country Club) (Neighborhood 34101)
Figure 11 – Connestee Falls (Greenville Rd.) (Neighborhoods 30202, 30210, 30220, 30230, 30240, & 30250)
2014-15 IPSAC Land Use Study – Transylvania County Schools 11
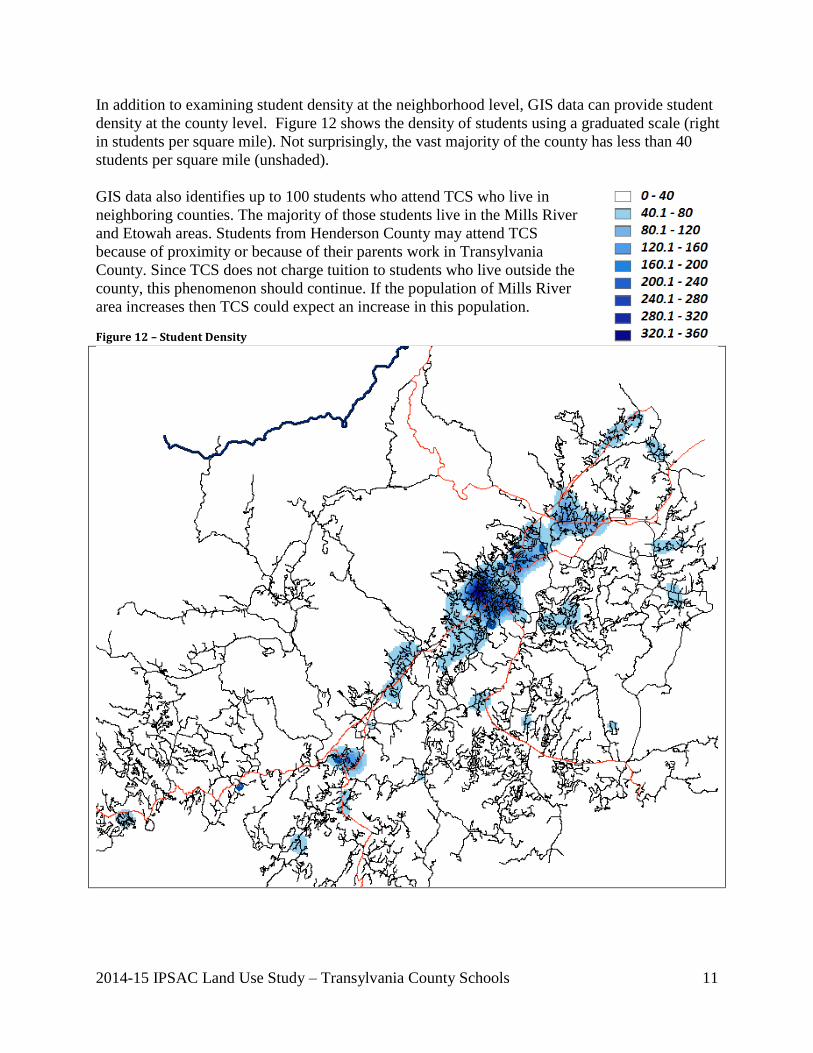
In addition to examining student density at the neighborhood level, GIS data can provide student
density at the county level. Figure 12 shows the density of students using a graduated scale (right
in students per square mile). Not surprisingly, the vast majority of the county has less than 40
students per square mile (unshaded).
GIS data also identifies up to 100 students who attend TCS who live in
neighboring counties. The majority of those students live in the Mills River
and Etowah areas. Students from Henderson County may attend TCS
because of proximity or because of their parents work in Transylvania
County. Since TCS does not charge tuition to students who live outside the
county, this phenomenon should continue. If the population of Mills River
area increases then TCS could expect an increase in this population. Figure 12 – Student Density
12 2014-15 IPSAC Land Use Study – Transylvania County Schools
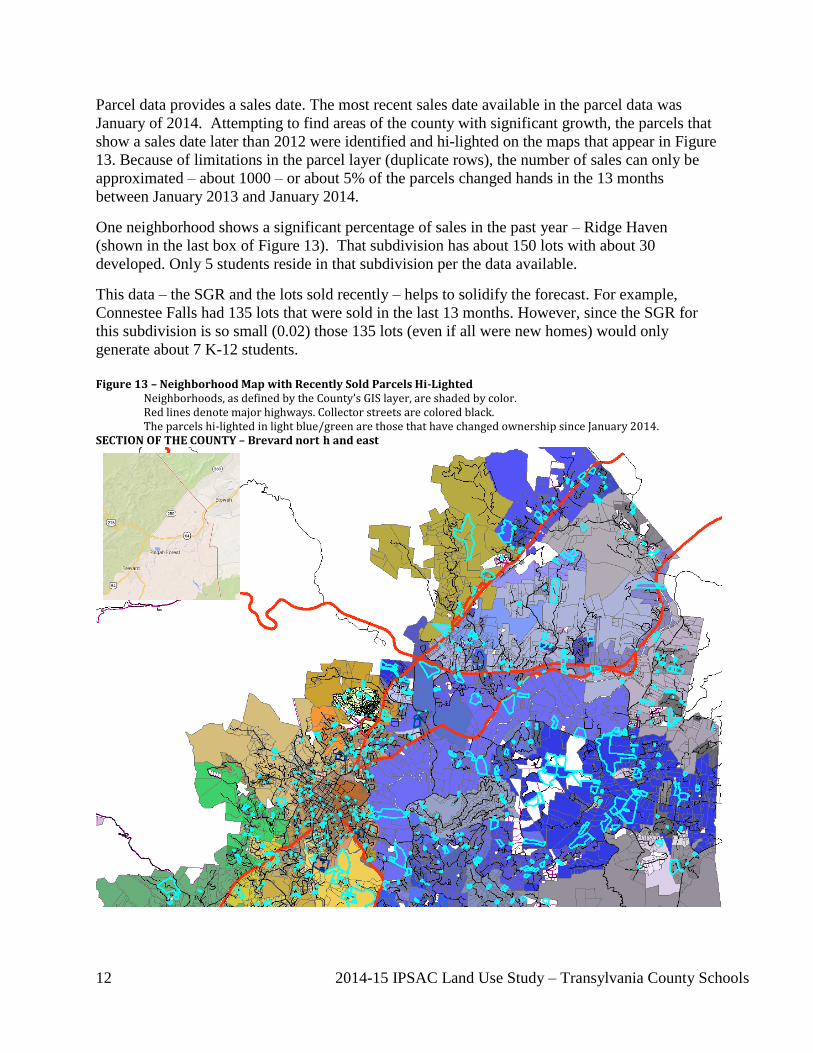
Parcel data provides a sales date. The most recent sales date available in the parcel data was
January of 2014. Attempting to find areas of the county with significant growth, the parcels that
show a sales date later than 2012 were identified and hi-lighted on the maps that appear in Figure
13. Because of limitations in the parcel layer (duplicate rows), the number of sales can only be
approximated – about 1000 – or about 5% of the parcels changed hands in the 13 months
between January 2013 and January 2014.
One neighborhood shows a significant percentage of sales in the past year – Ridge Haven
(shown in the last box of Figure 13). That subdivision has about 150 lots with about 30
developed. Only 5 students reside in that subdivision per the data available.
This data – the SGR and the lots sold recently – helps to solidify the forecast. For example,
Connestee Falls had 135 lots that were sold in the last 13 months. However, since the SGR for
this subdivision is so small (0.02) those 135 lots (even if all were new homes) would only
generate about 7 K-12 students.
Figure 13 – Neighborhood Map with Recently Sold Parcels Hi-Lighted Neighborhoods, as defined by the County’s GIS layer, are shaded by color. Red lines denote major highways. Collector streets are colored black. The parcels hi-lighted in light blue/green are those that have changed ownership since January 2014. SECTION OF THE COUNTY – Brevard nort h and east

2014-15 IPSAC Land Use Study – Transylvania County Schools 13
SECTION OF THE COUNTY – southeas tern
SECTION OF THE C OUNTY – southwestern

14 2014-15 IPSAC Land Use Study – Transylvania County Schools
Ridge Haven
The calculation of the Student Generation Ratio can provide an estimate of potential student
growth impact from new residential development and in-fill. Using GIS tools, the inventory of
existing available lots is combined with
residential data collected during the
Community Interviews and with the
SGR to determine impact on individual
schools within the district.
Membership history also plays a role in
forecasting. Existing membership
trends within a school can yield short-
term fluctuations as grade cohorts
advance year-by-year through the
system. Growth
Potential by School
In-fill of Existing
Developments
SGR New
Developments
Membership History

2014-15 IPSAC Land Use Study – Transylvania County Schools 15
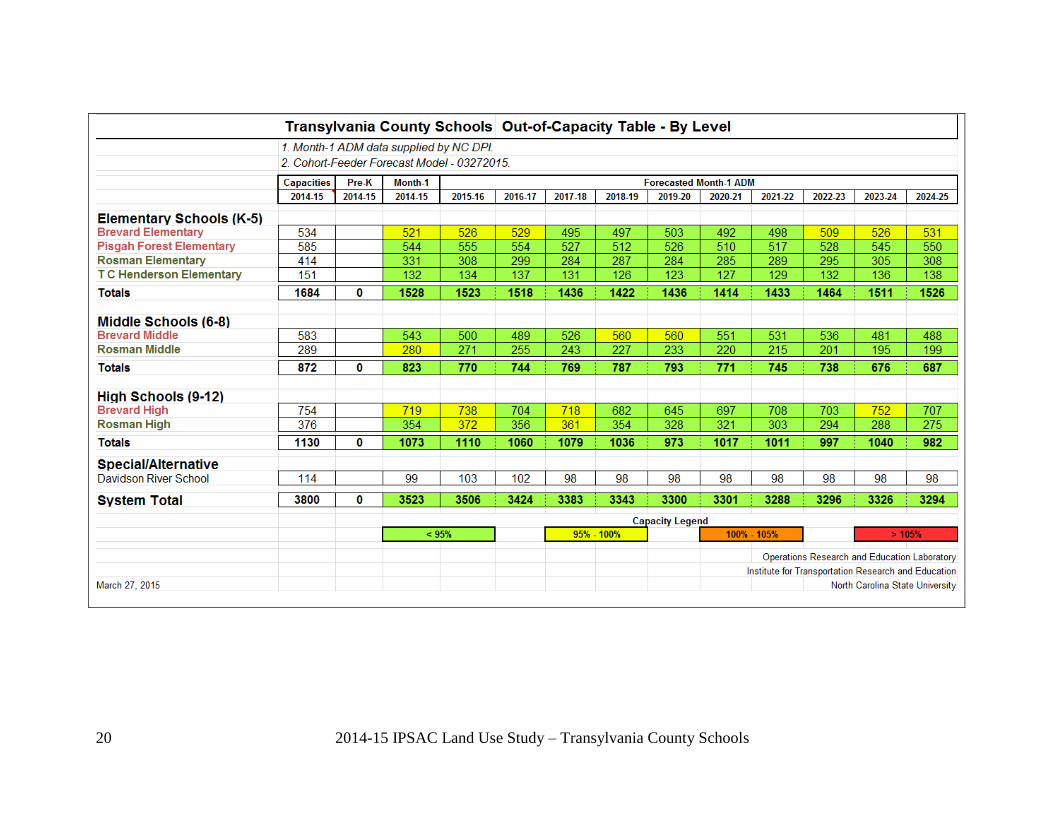
OUT-OF-CAPACITY TABLE
When the membership forecast – driven by GIS data, planning data, and historic membership
trends – is combined with school building capacity, the result is the Out-of-Capacity table
(OOC). Please refer to the OOC table, draft date: March 27, 2015 – pages 20 and 21.
OOC Assumptions and Inputs Resident Live Births (RLB) – Transylvania County resident live births are used as a part of the
predictor for future kindergarteners (see Figures 14 and 15). The latest RLB data for 2013 (285)
shows an increase of 41 from the 2012 RLB, the lowest number of RLB in over 10 years. The
decline in RLB over the period 2010-2012 will significantly impact the system over the next 14
years unless in-migration occurs to negate this impact. A 1% increase in RLB is projected over
the next six years. The average number of RLB between 2005 and 2009 was 303. The average
number of RLB between 2010 and 2013 was 266.
The number of RLB by
county is reported by the NC
Center for Health Statistics.
That number is generated
from data hospitals provide.
The county of birth is derived
from the data the parents
provide and is their current
address. Thus, even though
there may not be any new
births that occur in the
county, the RLB data will
reflect the number of births
by parents who reside in
Transylvania County. Figure 14 - Transylvania County RLB
RLB is a good predictor of
K-students. For the past five
years, the two data sets have
a correlation coefficient of
0.85.
Figure 15 – Comparing Transylvania County RLB and Kindergarteners
297 312
297 295 316
272 262 244
285
0
50
100
150
200
250
300
350
2005 2006 2007 2008 2009 2010 2011 2012 2013
Resident Live Births in Transylvania County
0
100
200
300
400
2010-11 2011-12 2012-13 2013-14 2014-15
RLB and KI KI
RLB (+ 5 years)

16 2014-15 IPSAC Land Use Study – Transylvania County Schools
Transylvania County Schools Month-1 Average Daily Membership (ADM)
The North Carolina Department of Public Instruction supplies historic Month-1 membership data
for all LEAs in the state. Figure 16 shows ADM data for the period 2009-10 through 2014-15.
Figure 16 - Transylvania County Schools Month-1 ADM
Building Capacities
School building capacities were supplied by TCS.
Forecast Model
In addition to the system-wide forecast, known as the Historic2 forecast, OREd used a Cohort-
Feeder3 forecast model for TCS. The Cohort-Feeder forecast model is suitable for smaller
districts having different growth trends in different regions of the county. The Cohort-Feeder
model allows growth characteristics of the individual feeder systems within the district to be
examined separately. To determine an appropriate forecast, both models can be compared.
When convergence occurs, the likelihood of the forecast being accurate is high.
Figure 17 compares the Historic forecast with the Cohort-Feeder forecast. The two forecasts are
very close for at least the next four years. It is not unusual for the cohort-feeder model to be
somewhat more aggressive than the historical forecast during the last half of the forecast – as
2 The Historic model uses historical data to determine the cohort survival ratio on a grade-by-grade basis for the entire system. The weighted average of the last four years of CSRs is used to determine a forecast. 3 The Cohort-Feeder model uses historic data to determine an average CSR on a grade-by-grade basis for each school. The average of the last four years of CSRs for that school is used to move that cohort through each grade. The feeder system defines the CSR for the first grade in each level. For example, the CSR for the 6th grade in a middle school is derived using the number of 5th graders from the two elementary schools that feed that middle school.
3647
3554
3531
3567
3517 3523
3450
3500
3550
3600
3650
3700
2009-10 2010-11 2011-12 2012-13 2013-14 2014-15
Month-1 K-12 Average Daily Membership

2014-15 IPSAC Land Use Study – Transylvania County Schools 17
shown below.
Figure 17 – Historic vs. Cohort-Feeder Forecast
Figure 18 shows the cohort-feeder forecast split into K-5/6-8/9-12 cohorts.
Figure 18 – Cohort-Feeder Forecast by Level
3200
3400
3600
3800
2009-10
2010-11
2011-12
2012-13
2013-14
2014-15
2015-16
2016-17
2017-18
2018-19
2019-20
2020-21
2021-22
2022-23
2023-24
2024-25
K-12 Forecast Comparison
HISTORIC
COHORT-FEEDER

18 2014-15 IPSAC Land Use Study – Transylvania County Schools
Forecast and OOC Summary
The March 27, 2015 draft of the OOC projects a system-wide decline of 229 students over the
next ten years, a projected decline of 1.35% per year.
The forecast, by level, shows the number of elementary students dipping, because of the decrease
in RLB, and then rebounding to only decline by 2 students in ten years. The number of middle
schools students, more susceptible to annual changes, declines sharply, rebounds, and then
declines again because of the negative cohort from the elementary level due to RLB. A decline
of 136 students is forecast. The negative cohort in the elementary schools now creates a smaller
dip at the high school level. The effect of the RLB decline is just getting into high schools at the
end of this forecast. High schools are projected to lose 91 students over ten years.
The 2014-15 OOC for Transylvania County schools is color-coded by building utilization:
Two versions of the OOC table were generated: one table groups schools by level and the other
table groups schools by region. By region, the Brevard area loses 51 students in ten years. The
Rosman area loses 178 students. By school, the forecast shows some pressure on capacity at
Brevard Elem, Brevard Middle, and Brevard High over the next three to five years. However, the
negative cohorts in the middle of the forecast lessen that pressure. Similarly, Rosman Middle and
Roman High are projected to be in the 95-100% capacity range in the next three years.
These forecasts are based on historical data. That data includes in-migration and out-migration. It
includes the shifts from public to private schools and academies and to home schools. Therefore,
1599 1573 1567 1533 1528 1528 1523 1527 1444 1431 1445 1424 1443 1473
1521 1536
876 825 829 844 826 827
770 744 769 787 793 771 745 738 676 687
1172 1156 1135 1190 1163 1168 1213
1162 1177 1134 1071 1116 1110 1095
1138 1080
0
200
400
600
800
1000
1200
1400
1600
1800
2000
2009-10
2010-11
2011-12
2012-13
2013-14
2014-15
2015-16
2016-17
2017-18
2018-19
2019-20
2020-21
2021-22
2022-23
2023-24
2024-25
ADM Forecast: Cohort-Feeder
K-5 6-8 9-12
Capacity Legend
< 95% 95% - 100% 100% - 105% > 105%

2014-15 IPSAC Land Use Study – Transylvania County Schools 19
if the Transylvania Partnership for Economic Development is successful in attracting new
employers, the forecast may need to be re-examined.
The Davidson River
Village project (Renova
Partners LLC) includes
about 540 acres on the
edge of Brevard (formerly
the Ecusta Paper Mill).
Renova acquired the
property, shown in Figure
19, in 2008 and has
worked with the US EPA
and NC ENR to ensure
that a thorough clean-up
takes place. They intend
to work closely with local
government to ensure that
a “vibrant community
center is created.” The
plan is to include retail,
residential, and hospitality
development as well as
open public space.
<accessed from
www.renovapartners.com
on 3/30/15).
Thank You
We conclude by expressing our gratitude to Mark Burrows and his staff at Transylvania County
Planning and Community Development and to Jeremy Gibbs, Tom Sweet, and Julie Roberts at
TCS for providing OREd with information and data for this report.
Figure 19 – Renova Property in Brevard, NC (from Transylvania County GIS)
20 2014-15 IPSAC Land Use Study – Transylvania County Schools

2014-15 IPSAC Land Use Study – Transylvania County Schools 21
Figure 20 - OOC for Transylvania County Schools