transverse load redistribution and effective shear width … · transverse load redistribution and...
TRANSCRIPT

HERON Vol. 60 (2015) No. 3 145
Transverse load redistribution and effective shear width in reinforced concrete slabs
E.O.L. Lantsoght 1,2, C. van der Veen 1, A. de Boer 3, J.C. Walraven 1
1 Delft University of Technology, the Netherlands
2 Universidad San Francisco de Quito, Ecuador
3 Ministry of Infrastructure and the Environment, the Netherlands
In slabs subjected to concentrated loads close to the support, shear is verified for two limit
states: beam shear over an effective width, and punching shear on a perimeter around the
concentrated load. In current practice, the beam shear strength of slabs is calculated as for
beams, and thus the beneficial effects of transverse load redistribution in slabs are not
considered. An experimental program was conducted at Delft University of Technology to
determine the shear capacity of slabs under concentrated loads close to the support. This
paper presents the results of the tests conducted on continuous slabs and slab strips. The
influence of the loading sequence, size of the loaded area, moment distribution at the support
and distance between the load and the support is studied and discussed with regard to the
behaviour in slabs and slab strips. It is recommended to use the effective width based on a
load spreading method as used in French practice. This recommendation is based on the
experimental results, a statistical analysis and non-linear finite element models. The
parameter analyses show an increased capacity in slabs as compared to beams as the result of
transverse load distribution. The shear capacity of slabs under concentrated loads close to
supports can be calculated based on the Eurocode provisions for shear over the recommended
effective width.
Key words: Effective width, load redistribution, punching, reinforced concrete, slabs, shear
1 Introduction
The problem of determining the shear capacity of a slab under a concentrated load close to
the support occurs when the concentrated loads of live load models are applied to, for
example, slab bridges. The incentive for the research on the shear capacity of slabs under

146
concentrated loads came from analysing existing slab bridges. With the implementation of
the Eurocodes, the shear provisions have become more conservative in EN 1992-1-1:2005
(CEN [2005]) as compared to NEN 6720:1995 (Code Committee 351001 [1995]) and the
prescribed live loads in EN 1991-2:2003 (CEN [2003]) are heavier and with a smaller axle
distance. A number of existing reinforced concrete slab bridges designed according to the
previous Dutch national codes was found to be shear-critical upon assessment. Therefore,
a further study of shear in slabs under a concentrated load close to the support was
necessary (Lantsoght, et al. [2012a]).
Shear in reinforced concrete one-way slabs loaded with a concentrated load close to the
support is typically checked in two ways: by calculating the beam shear capacity over a
certain effective width, as not the whole width can be activated to carry the shear force,
and by checking the punching shear capacity on a perimeter around the load. The beam
shear capacity as prescribed by the codes is the result of a statistical analysis of
experimental shear capacities from small, heavily-reinforced, simply-supported beams in a
four-point bending test. The empirical expression for the shear capacity from EN 1992-1-
1:2005 was derived by Regan [1987]. The method of horizontal load spreading, resulting in
the effective width effb of the support which carries the load, depends on local practice. In
most cases (e. g. Dutch practice) horizontal load spreading is assumed under a 45° angle
from the centre of the load towards the support, Figure 1a. In French practice (Chauvel, et
al. [2007]), load spreading is assumed under a 45° angle from the far corners of the loaded
area towards the support, Figure 1b. The fib Model Code 2010 [2012] provides
recommendations for the effective width based on another load spreading method, as
shown in Figure 1c. Other methods for the effective width are found in the literature, in
which the effective width is determined based on a formula. Lubell, Bentz and Collins
[2008] define a reduction factor βL on the slab width b so that the effective width is βLb :
β = + κ
κ = supload
0.7 0.3
min( ; )
Lbb
b b
(1)
with:
b the member width;
loadb the width of the load;
supb the width of the support.

147
Grasser and Thielen [1991] defined the effective width that is used in German practice for
simply supported one-way slabs as:
= + ≤
= +load
0.5eff y
y l
b t x b
t b d (2)
In Equation (2), x is the centre-to-centre distance between the load and the support
and ld the effective depth to the longitudinal reinforcement. The expression is valid
provided that 0 < x < l, yt ≤ 0.8 l and xt ≤ l with xt = loadl + d. The values of xt and yt are the
size of the wheel print, distributed to mid-depth of the concrete slab, and l is the span
length. For loads at a clamped end, effb = yt + 0.3 x, valid for 0.2 < x < l, yt ≤ 0.4 l and xt ≤
0.2 l. For bridge decks, Zheng et al. [2010] defined the effective width as follows
(with loadl the loaded length):
= + − Φ
= ≤
Φ = +
load
load
(1 )tan
0.4
23.3 35.1
eff cp
cp
cp
b l l r
br
lr
(3)
In Equation (3), the value of Φ is given in degrees. A last method for finding the effective
width is from the Swedish Code BBK 79:
= + + +load load loadmax( 7 ; 0.65( ) 10.65 )eff l lb b d b l d (4)
load
beff,1
(a) (b)
support supportbeff,2
load
45o
45o
support
load
dl ≤ av/2 beff
60o
ava
(c)
Figure 1. Effective width (a) assuming 45º load spreading from the centre of the load: 1effb ;
(b) assuming 45º load spreading from the far corners of the load: 2effb ; top view of slab;
(c) load spreading method from fib Model Code 2010 [2012]

148
The punching shear (two-way shear) capacity in code formulas is developed for two-way
slabs. Most empirical methods for punching shear have been derived from tests on slab-
column connections; a loading situation which is significantly different from a slab under a
concentrated load close to the support.
2 Previous experiments from literature
Recent research as carried out by Sherwood, et al. [2006] concerning shear in slabs focused
on one-way slabs under line loads. It was experimentally shown that one-way slabs under
line loads behave like beams and that beam shear provisions lead to good estimates of
their shear capacity.
A database of 215 experiments on wide beams and slabs (Lantsoght [2012a]) shows that
test data regarding the shear capacity of one-way slabs and slab strips under concentrated
loads are scarce. In total, 36 experiments with la d < 2.5 are available in the literature,
Table 1. In Table 1, the following symbols are used:
b total width of the specimen;
a the shear span: the centre-to-centre distance between the load and the support;
ld the effective depth to the longitudinal flexural reinforcement;
loadb the width of the loaded area, taken parallel to the span direction;
loadl the length of the loaded area, taken perpendicular to the span direction;
,c cylf the average cylinder compressive strength of the specimen;
uP the ultimate load.
FM the failure mode, as observed from the available photographs or crack pattern
drawings in the cited reference;
P punching shear failure, development of a (partial) punching cone at the bottom of
the slab is visible;
WB wide beam shear failure: shear failure at the side face, and/or inclined cracks on
the bottom face of the slab.
The criterion for activating the transverse load redistribution is that the effective width
based on the French load spreading method 2effb from Figure 1b is smaller than the total
specimen width b. Only 22 of the 215 experiments of a wide beams and slabs database
fulfil this requirement, in addition to loading with a concentrated load close to the support.

149
Table 1. Overview of test data of slabs in shear under concentrated loads close to the support
( la d ≤ 2.5)
Reference Nr. b
(m) la d loadb × loadl
(mm × mm) ,c cylf
(MPa)
uP
(kN)
FM
Regan [1982]
2SS 2CS
1.2 1.2
2.16 2.16
100 × 100 100 × 100
23.0 23.0
130 180
P P
3SS 3CS
1.2 1.2
1.68 1.68
100 × 100 100 × 100
30.1 30.1
195 250
P WB
4SS 1.2 1.44 100 × 100 35.1 230 P 5SS 1.2 2.16 200 × 100 30.3 190 P 7SS 7CS
1.2 1.2
1.68 2.16
200 × 100 200 × 100
36.7 36.7
200 230
P P
Furuuchi, et al. [1998]
A-10-10 0.5 1.75 100 × 50 26.1 294 P/WB A-10-20 0.5 1.75 100 × 50 20.2 294 WB A-10-30 0.5 1.75 100 × 50 23.8 333 WB A-20-10 0.5 1.75 200 × 50 19.6 340 - A-30-10 0.5 1.75 300 × 50 23.8 450 - B-10-10 0.65 1.75 100 × 50 29.4 368 - C-10-10 0.5 1.25 100 × 50 34.6 480 WB C-20-10 0.5 1.25 200 × 50 32.1 525 WB C-30-10 0.5 1.25 300 × 50 31.5 626 WB C-50-10 0.5 1.25 500 × 50 34.9 811 WB C-10-20 0.5 1.25 100 × 50 36.4 483 - C-10-30 0.5 1.25 100 × 50 30.7 520 - D-10-10 0.5 2.25 100 × 50 35.2 294 -
Graf [1933] 1243 a1 2 1.30 100 × 150 19.1 314 WB 1243 a2 2 2.17 100 × 150 19.1 235 P/WB 1243 b1 2 0.65 100 × 150 19.1 355 P 1243 b2 2 1.52 100 × 150 19.1 206 WB 1244 a1 2 1.92 100 × 150 13.3 275 WB 1244 a2 2 2.40 100 × 150 13.3 196 WB 1244 b1 2 1.68 100 × 150 13.3 157 WB 1244 b2 2 2.16 100 × 150 13.3 147 WB 1245 a1 2.4
2.4 2.4 2.4
1.89 100 × 150 100 × 150 100 × 150 100 × 150
23.6 23.6 23.6 23.6
333 P/WB 1245 a2 2.36 257 WB 1245 b1 1.65 196 P/WB 1245 b2 2.12 206 P/WB
Richart and Kluge [1939]
2-2 6.1 1.64 150‡ 29.1 369 P/WB
Leonhardt and Walther [1962]
P12 0.5 2.46 80 × 80 12.6 101† WB
Ekeberg, et al. [1982]
2nd fl nr. 3 5 2.18 100 × 100 17.8 465 -
-: Photographs or a description of the failure mode were not provided.
†: self-weight is reported to be included in the value of the ultimate load.
‡: a disc is used as loading plate, the diameter is given.

150
The majority of these experiments were carried out on small specimens ( ld < 15cm). These
experiments have been compared to the governing design codes. The results (Lantsoght
[2012b]) indicate that slabs can support higher concentrated loads than beams as a result of
their extra dimension. However, not enough experimental evidence is available to support
this statement. Therefore, a series of experiments on slabs with ld = 265 mm was carried
out.
3 Experiments
3.1 Setup
To study the shear capacity of slabs under a concentrated load close to the support,
experiments are carried out. A top view of the test setup with a slab is presented in Figure
2. The line supports used for S1 – S14 and the slab strips are composed of a steel beam
(HEM 300) of 300 mm wide, a layer of plywood and a layer of felt of 100 mm wide. The
properties of the plywood and felt are described by Prochazkova and Lantsoght [2011]. In
S15 – S18, 3 elastomeric bearings of 350 mm × 280 mm × 45 mm are used per side as a
support. Over the depth, the bearings contain 3 layers of 8 mm natural rubber, 4 layers of 4
mm steel S235 and 2 layers of 2.5 mm chloroprene, resulting in a compressive stiffness of
2361 kN/mm.
Experiments are carried out close to the simple support (sup 1 in Figure 2) and close to the
continuous support (sup 2 in Figure 2). The rotation at support 2 is partly restrained by
vertical prestressing bars that are fixed to the strong floor of the laboratory. This restraint
results in a moment over support 2: the continuous support. The prestressing force is
applied on the bars before the start of every test. During the course of the experiment,
some rotation could occur over support 2 due to the deformation of the felt and plywood
and the elongation of the prestressing bars. The force in the prestressing bars is measured
throughout the experiments by means of load cells.
3.2 Specimens
An overview of the specimens that are tested in the first series of experiments is given in
Table 2, using the following symbols and abbreviations:
b the width of the specimen;
,cubecf the measured cube compressive strength of the concrete at the age of testing;
,cubectf the measured cube splitting strength of the concrete at the age of testing;

151
ρl the longitudinal flexural reinforcement ratio;
ρt the transverse flexural reinforcement ratio;
a the shear span: the centre-to-centre distance between the load and the support;
ld the effective depth to the longitudinal reinforcement;
n the number of experiments on the considered specimen;
M/E the concentrated load is placed in the middle of the width (M) or near the edge
(E) for the uncracked experiments;
loadz the size of side of the square loaded area;
age the age at which the specimen is tested for the first time.
All slabs and slab strips had a height of 300 mm. The effective depth to the longitudinal
flexural reinforcement is ld = 265 mm for S1 – S14 and the slab strips, and is ld = 255 mm for
S15 – S18 (slabs supported by bearings).
load
simple support
continuous support
load
2500 mm
300 mm
3600 mm
600 mm
500 mm prestressing bars
1250 mm (M)438 mm (E)
sup 2
sup 1
300 mm
plywoodfelt
100 mm
300 mm
100 mm
N
Figure 2. Sketch of test setup for S1 – S14, top view
sup 2
continuoussupport
plywoodfelt
3600 mm
load load
simplesupport
sup1
100 mm
300 mm
1250 mm (M)
300 mm
600 mm100 mm
500 mm
2500 mm
N
prestressing bars
438 mm (E)
300 mm

152
The numbering for the slabs starts with “S”, while for the slab strips or beams (“B”) the
numbering is subdivided according to the width: S (b = 0.5 m), M (b = 1 m), L (b = 1.5 m) or
X (b = 2 m). The slabs were either loaded at the middle of the slab width (position M) at the
simple and continuous support, resulting in two tests per slab that are “uncracked” (one at
the simple support and one at the continuous support) and maximum four tests that are
considered “cracked”, see Figure 3. These “cracked” experiments were executed after the
first, “uncracked” experiments, so that the cracks and failure of the “uncracked”
experiments influenced the capacity of the “cracked” experiment. Executing an experiment
in the vicinity of a the failure cracks from an earlier experiment can give a lower bound
estimate of the shear capacity of bridge slabs that are fully cracked in bending after being
in service for several decades.
Table 2. Properties of S1 – S18 and the series of slab strips
Slab nr.
b
(m) ,cubecf
(MPa) ,measctf
(MPa)
ρl
(%)
ρt
(%) la d n M E loadz
(mm)
age
S1 2.5 35.8 3.1 0.996 0.132 2.26 6 M 200 28 S2 2.5 34.5 2.9 0.996 0.132 2.26 6 M 300 56 S3 2.5 51.6 4.1 0.996 0.258 2.26 5 M 300 63 S4 2.5 50.5 4.1 0.996 0.182 2.26 6 E 300 76 S5 2.5 46.2 3.6 0.996 0.258 1.51 5 M 300 31 S6 2.5 58.2 3.9 0.996 0.258 1.51 6 E 300 41 S7 2.5 82.1 6.2 0.996 0.258 2.26 6 E 300 83 S8 2.5 77.0 6.0 0.996 0.258 2.26 3 M 300 48 S9 2.5 81.7 5.8 0.996 0.258 1.51 6 M 200 77 S10 2.5 81.6 5.8 0.996 0.258 1.51 7 E 200 90 S11 2.5 54.9 4.2 1.375 0.358 2.26 6 M 200 90 S12 2.5 54.8 4.2 1.375 0.358 2.26 6 E 200 97 S13 2.5 51.9 4.2 1.375 0.358 1.51 6 M 200 91 S14 2.5 51.3 4.2 1.375 0.358 1.51 6 E 200 110 S15 2.5 52.2 4.2 1.035 1.078 2.35 5 M 200 71 S16 2.5 53.5 4.4 1.035 1.078 2.35 6 E 200 85 S17 2.5 49.4 3.7 1.035 1.078 1.57 6 M 200 69 S18 2.5 52.1 4.5 1.035 1.078 1.57 6 E 200 118 BS1 0.5 81.5 6.1 0.948 0.258 2.26 2 M 300 55 BM1 1 81.5 6.1 0.948 0.258 2.26 2 M 300 62 BL1 1.5 81.5 6.1 0.948 0.258 2.26 2 M 300 189 BS2 0.5 88.6 5.9 0.948 0.258 1.51 2 M 200 188 BM2 1 88.6 5.9 0.948 0.258 1.51 2 M 200 188 BL2 1.5 94.8 5.9 0.948 0.258 1.51 2 M 200 180 BS3 0.5 91.0 6.2 0.948 0.258 2.26 2 M 300 182 BM3 1 91.0 6.2 0.948 0.258 2.26 2 M 300 182 BL3 1.5 81.4 6.2 0.948 0.258 2.26 2 M 300 171 BX1 2 81.4 6.0 0.948 0.258 2.26 2 M 300 47 BX2 2 70.4 5.8 0.948 0.258 1.51 2 M 200 39 BX3 2 78.8 6.0 0.948 0.258 2.26 2 M 200 40

153
Alternatively, the slabs were loaded consecutively at the east and west side (position E) at
the simple and continuous support, resulting in four “uncracked” tests per slab and
maximum two “cracked” tests. The experiments are numbered as SxTy with x the
specimen number and y the number of the test on this specimen. These test numbers are
taken consecutively and do not denote the location of the load (position M or E), see §4.1.
Deformed bars of steel S500 (measured properties for ø20 mm: ymf = 542 MPa yield
strength; umf = 658 MPa ultimate strength and for ø10 mm: ymf = 537 MPa; umf = 628 MPa)
were used. Plain bars of steel 52.3K (measured properties for ø20 mm: ymf = 601
MPa; umf = 647 MPa and for ø10 mm: ymf = 635 MPa; umf = 700 MPa) were used. The
flexural reinforcement was designed to resist a moment caused by a load of 2 MN
(maximum capacity of the jack) at position M along the width (Figure 2) and at 600 mm
along the span ( la d = 2.26).
According to EN 1992-1-1:2005 §9.3.1.1(2), the amount of transverse flexural reinforcement
for slabs needs to be taken as 20% of the longitudinal flexural reinforcement. In the tested
slabs, 13.3% of the longitudinal flexural reinforcement was used as transverse
reinforcement in S1 and S2; 25.9% in S3, S5-S10 and the slab strips; 26.0% in S11-S14
(different reinforcement layout for slabs with plain bars); and 104% in S15 – S18, where a
virtual beam of heavy reinforcement above the support is used for the slabs supported by
sup 1 sup 2
2500
mm
300 mm 3600 mm 600 mm 500 mma
S5T5c
S5T4uncr
S5T6c
S5T1uncr
S5T2c
a
Figure 3. Loading sequence on a slab, taking S5 as an example

154
bearings (instead of a line support). In S4 the amount of transverse flexural reinforcement
is only doubled as compared to S1 and S2 in the vicinity of the supports. Figure 4 shows
elevation, cross-section and detailing of the reinforcement in S1 – S10, Figure 5 shows the
reinforcement layout of the slabs with plain bars (S11 - S14) and the slabs supported by
bearings (S15 – S18). Figure 6 shows the reinforcement layout as used for the slab strips
demonstrated for BS1-BS3. Similar reinforcement is used in the BM, BL and BX-series, with
the number of bars proportionally increased with the increasing width.
Two types of concrete have been used: normal strength concrete (C28/35) for slabs S1 – S6
and S11 – S18 and high strength concrete (C55/65) for slabs S7 – S10 and the slab strips.
Glacial river aggregates with a maximum aggregate size of 16 mm were used.
(a)
5000
2500
21φ20 - 125
21φ20 - 125
21φ1
0 - 2
50
11φ10 - 25021
φ10
- 250
(b)
(d)
(c)φ10 - 125
φ10 - 250 φ10 - 250
φ10 - 250
φ10 - 250
φ10 - 250
φ10 - 250
φ10 - 125 φ20 - 125
300
300
300
φ20 - 125
φ20 - 125
φ20 - 125
Figure 4. Reinforcement layout of slabs with line supports: (a) plan view of S1 and S2, (b) section of
S1 and S2, (c) section of S4, (d) section of S3, S5-S10, in [mm]

155
(b)
(a)
5000
2500
300
29φ20 - 89
15φ10 - 178
29φ20 - 89
57φ1
0 - 8
9
57φ1
0 - 8
9
φ20 - 89
φ10 - 178 φ10 - 89
φ10 - 89
φ20 - 89
N
(c)
(d)
5000
300
2500
11φ2
5 - 1
00
100023001100600
11φ10 - 250
21φ20 - 125
21φ20 - 125
φ10 - 250
4φ10
- 12
5
18φ1
0 - 1
25
11φ2
5 - 1
00
4φ10
- 12
5
φ20 - 125
φ10 - 125
φ10 - 125
φ20 - 125
φ25 - 100 φ25 - 100φ10 - 125
N
Figure 5. Reinforcement layout for slabs with plain reinforcement or supported by elastomeric
bearings: (a) top view of S11-S14; (b) cross section of S11-S14; (c) top view of S15-S18; (d) cross
section of S15-S18 in [mm]
(a)
5000
500
41φ10 - 125 2φ10 - 2504φ20 - 130 41φ10 - 125
4φ20 - 130
(b)
300
φ20 - 130φ10 - 125
φ10 - 125φ10 - 250 φ20 - 130
Figure 6. Reinforcement layout for slab strips: (a) top view of BS1; (b) cross section of BS1 in [mm]
156
4 Results
4.1 Test Results
The number of the specimen is followed by the number of the test on this specimen (e. g.
S6T2: 2nd test on 6th slab). The experimental results of the slabs and slab strips are
summarized in Table 3, in which the following symbols are used:
la d the ratio of the distance between the load and the support (or shear span) to the
effective depth to the longitudinal reinforcement;
rb the distance between the centre of the loaded area and the free edge of the slab
along the width;
SS/CS the position of the load: close to the simple support (SS) or the continuous
support (CS);
uncr/c experiment on an uncracked specimen (uncr) or on a previously tested, locally
failed and severely damaged specimen (c);
(e)(c)
(a)
(b)
(d)
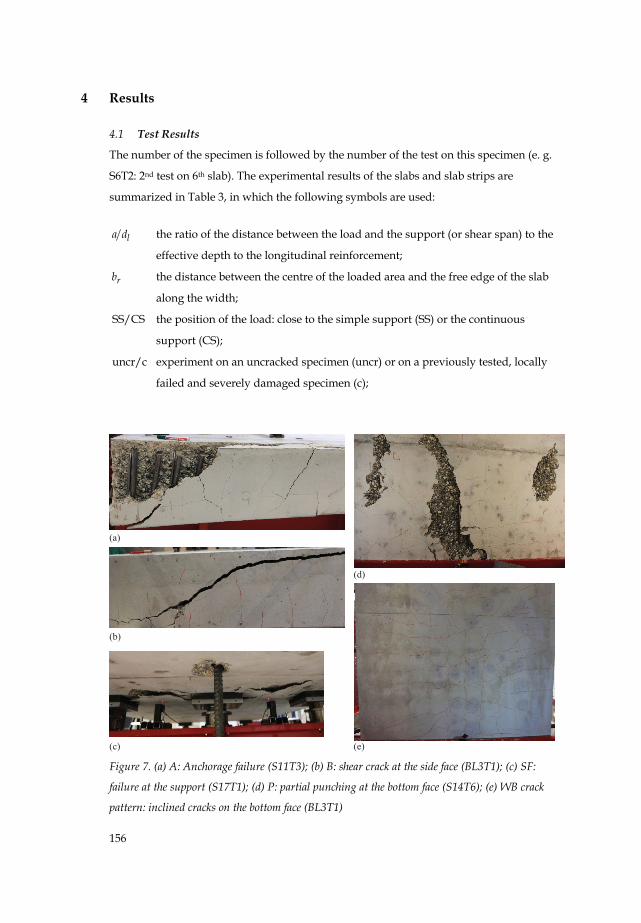
Figure 7. (a) A: Anchorage failure (S11T3); (b) B: shear crack at the side face (BL3T1); (c) SF:
failure at the support (S17T1); (d) P: partial punching at the bottom face (S14T6); (e) WB crack
pattern: inclined cracks on the bottom face (BL3T1)

157
uP the measured ultimate load at the concentrated load during the experiment;
presF the sum of the forces in the 3 prestressing bars;
expV the shear force at the support as a result of the self-weight of the slab, the
concentrated load and the force in the prestressing bars;
Observed failure mode:
• anchorage failure (A, Figure 7a);
• failure as a beam in shear with a noticeable shear crack at the side (B, Figure 7b);
• punching failure around the support (SF, Figure 7c)
• development of a partial punching surface on the bottom face (P, Figure 7d); or
• failure as a wide beam in shear with inclined cracks on the bottom of the specimen
(WB, Figure 7e).
Most slabs were tested within 1 to 2 weeks after the first experiment on the specimen as
given in Table 2. A complete description of the experiments on the undamaged specimens
can be found in the full test reports by Lantsoght [2011b] and of the residual capacity in the
full test report by Lantsoght [2011a].
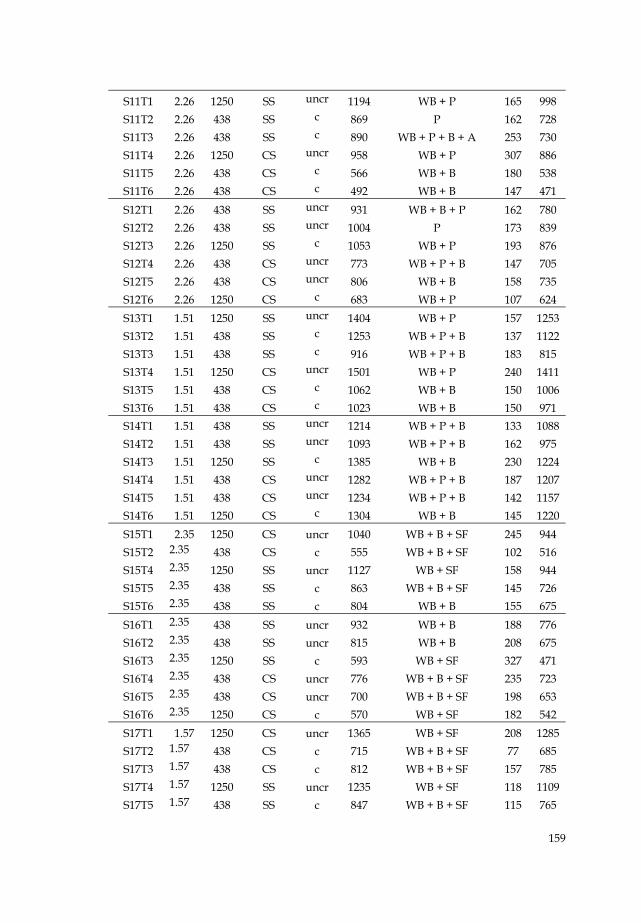
Table 3. Results from experiments on S1 – S18 and the slab strips
Test
a/d
rb
(mm) SS/CS
uncr/c uP
(kN) Mode
presF
(kN)
expV
(kN)
S1T1 2.26 1250 SS uncr 954 WB 163 799
S1T2 2.26 1250 CS uncr 1023 WB 138 912
S1T3 2.34 438 CS c 758 WB + B 87 683
S1T4 2.26 438 CS c 731 WB + B 100 663
S1T5 2.26 438 SS c 851 WB + B 147 716
S1T6 2.26 438 SS c 659 WB + B 145 556
S2T1 2.26 1250 SS uncr 1374 WB + P 280 1129
S2T2 2.26 438 SS c 1011 WB + B 228 835
S2T3 2.26 438 SS c 844 WB + B 248 693
S2T4 2.26 1250 CS uncr 1421 WB 330 1276
S2T5 2.26 438 CS c 805 WB + B 153 733
S2T6 2.26 438 CS c 957 WB + B 177 864
S3T1 2.26 1250 SS uncr 1371 WB 252 1131
S3T2 2.26 438 SS c 993 WB + B 245 818
S3T3 2.26 438 SS c 705 WB + B 190 587
S3T4 2.26 1250 CS uncr 1337 WB + B 287 1199

158
S3T5 2.26 438 CS c 852 WB + B 128 768
S4T1 2.26 438 SS uncr 1160 WB + B 203 964
S4T2 2.26 438 SS uncr 1110 WB + B 187 925
S4T3 2.26 1250 SS c 1016 WB 227 840
S4T4 2.26 438 CS c 861 WB + B 158 781
S4T5 2.26 438 CS c 1014 WB + B 185 913
S4T6 2.26 1250 CS c 994 WB 147 889
S5T1 1.51 1250 CS uncr 1804 WB + B 235 1679
S5T2 1.51 438 CS c 1395 WB + B 162 1304
S5T4 1.51 1250 SS uncr 1755 WB + B 280 1544
S5T5 1.51 438 SS c 1295 WB + B 227 1144
S5T6 1.51 438 SS c 1286 WB + B 170 1146
S6T1 1.51 438 CS uncr 1446 WB + B 183 1353
S6T2 1.51 438 CS uncr 1423 WB + B 213 1337
S6T3 1.51 1250 CS c 1897 WB 313 1775
S6T4 1.51 438 SS uncr 1366 WB + B 195 1213
S6T5 1.51 438 SS uncr 1347 WB + B 245 1187
S6T6 1.51 1250 SS c 1384 WB 270 1216
S7T1 2.26 438 SS uncr 1121 WB + P + B 217 929
S7T2 2.26 438 CS uncr 1172 WB + P + B 197 1046
S7T3 2.26 438 CS uncr 1136 WB + P + B 227 1021
S7T4 2.26 1250 CS c 1128 WB + P 188 1008
S7T5 2.26 438 SS uncr 1063 WB + P + B 157 891
S7T6 2.26 1250 SS c 1011 WB + P 443 799
S8T1 2.26 1250 SS uncr 1481 WB + B 233 1226
S8T2 2.26 1250 CS uncr 1356 WB + B 278 1213
S8T5 2.26 438 SS c 868 WB + B 160 728
S9T1 1.51 1250 SS uncr 1523 WB + P 175 1355
S9T2 1.51 438 SS c 929 WB + P + B 142 833
S9T3 1.51 438 SS c 1089 WB + P + B 178 969
S9T4 1.51 1250 CS uncr 1842 WB + P 255 1717
S9T5 1.51 438 CS c 1287 WB + B 138 1204
S9T6 1.51 438 CS c 1128 WB + B 87 1054
S10T1 1.51 438 SS uncr 1320 WB + P + B 162 1177
S10T2 1.51 438 SS uncr 1116 WB + P + B 173 994
S10T3 1.51 1250 SS c 1326 WB + P 320 1156
S10T4 1.51 438 CS uncr 1511 WB + (B) 252 1422
S10T4B 1.51 438 CS c 1058 WB + B 165 1005
S10T5 1.51 438 CS uncr 1454 WB + B 235 1368
S10T6 1.51 1250 CS c 1431 WB 233 1348
159
S11T1 2.26 1250 SS uncr 1194 WB + P 165 998
S11T2 2.26 438 SS c 869 P 162 728
S11T3 2.26 438 SS c 890 WB + P + B + A 253 730
S11T4 2.26 1250 CS uncr 958 WB + P 307 886
S11T5 2.26 438 CS c 566 WB + B 180 538
S11T6 2.26 438 CS c 492 WB + B 147 471
S12T1 2.26 438 SS uncr 931 WB + B + P 162 780
S12T2 2.26 438 SS uncr 1004 P 173 839
S12T3 2.26 1250 SS c 1053 WB + P 193 876
S12T4 2.26 438 CS uncr 773 WB + P + B 147 705
S12T5 2.26 438 CS uncr 806 WB + B 158 735
S12T6 2.26 1250 CS c 683 WB + P 107 624
S13T1 1.51 1250 SS uncr 1404 WB + P 157 1253
S13T2 1.51 438 SS c 1253 WB + P + B 137 1122
S13T3 1.51 438 SS c 916 WB + P + B 183 815
S13T4 1.51 1250 CS uncr 1501 WB + P 240 1411
S13T5 1.51 438 CS c 1062 WB + B 150 1006
S13T6 1.51 438 CS c 1023 WB + B 150 971
S14T1 1.51 438 SS uncr 1214 WB + P + B 133 1088
S14T2 1.51 438 SS uncr 1093 WB + P + B 162 975
S14T3 1.51 1250 SS c 1385 WB + B 230 1224
S14T4 1.51 438 CS uncr 1282 WB + P + B 187 1207
S14T5 1.51 438 CS uncr 1234 WB + P + B 142 1157
S14T6 1.51 1250 CS c 1304 WB + B 145 1220
S15T1 2.35 1250 CS uncr 1040 WB + B + SF 245 944
S15T2 2.35 438 CS c 555 WB + B + SF 102 516
S15T4 2.35 1250 SS uncr 1127 WB + SF 158 944
S15T5 2.35 438 SS c 863 WB + B + SF 145 726
S15T6 2.35 438 SS c 804 WB + B 155 675
S16T1 2.35 438 SS uncr 932 WB + B 188 776
S16T2 2.35 438 SS uncr 815 WB + B 208 675
S16T3 2.35 1250 SS c 593 WB + SF 327 471
S16T4 2.35 438 CS uncr 776 WB + B + SF 235 723
S16T5 2.35 438 CS uncr 700 WB + B + SF 198 653
S16T6 2.35 1250 CS c 570 WB + SF 182 542
S17T1 1.57 1250 CS uncr 1365 WB + SF 208 1285
S17T2 1.57 438 CS c 715 WB + B + SF 77 685
S17T3 1.57 438 CS c 812 WB + B + SF 157 785
S17T4 1.57 1250 SS uncr 1235 WB + SF 118 1109
S17T5 1.57 438 SS c 847 WB + B + SF 115 765

160
S17T6 1.57 438 SS c 875 WB 117 789
S18T1 1.57 438 SS uncr 1157 WB + B + SF 170 1031
S18T2 1.57 438 SS uncr 1079 WB + B 213 954
S18T3 1.57 1250 SS c 967 WB 280 844
S18T4 1.57 438 CS uncr 1122 WB + B + SF 167 1062
S18T5 1.57 438 CS uncr 1104 WB + B + SF 190 1050
S18T6 1.57 1250 CS c 995 WB + P + SF 185 952
BS1T1 2.26 250 SS uncr 290 B 37 242
BS1T2 2.26 250 CS uncr 623 B 212 562
BS2T1 1.51 250 SS uncr 633 B 100 552
BS2T2 1.51 250 CS uncr 976 B 267 919
BS3T1 2.26 250 SS uncr 356 B 57 293
BS3T2 2.26 250 CS uncr 449 B 107 399
BM1T1 2.26 500 CS uncr 923 WB + B 160 755
BM1T2 2.26 500 SS uncr 720 WB + B 127 636
BM2T1 1.51 500 SS uncr 1212 WB + B 167 1062
BM2T2 1.51 500 CS c 1458 WB + B 262 1354
BM3T1 2.26 500 SS uncr 735 WB + B 110 607
BM3T2 2.26 500 CS uncr 895 WB + B 183 791
BL1T1 2.26 750 SS uncr 1034 WB + B 215 844
BL1T2 2.26 750 CS uncr 1252 WB + B 320 1119
BL2T1 1.51 750 SS uncr 1494 WB + B 212 1311
BL2T2 1.51 750 CS uncr 1708 WB + B 277 1586
BL3T1 2.26 750 SS uncr 1114 WB + B 242 907
BL3T2 2.26 750 CS uncr 1153 WB + B 312 1035
BX1T1 2.26 1000 SS uncr 1331 WB + P 325 1080
BX1T2 2.26 1000 CS uncr 1596 WB + B + P 335 1415
BX2T1 1.51 1000 SS uncr 1429 WB + B + P 217 1259
BX2T2 1.51 1000 CS uncr 1434 WB + P 167 1332
BX3T1 2.26 1000 SS uncr 1141 WB + P 245 935
BX3T2 2.26 1000 CS uncr 1193 WB + B 210 1059
4.2 Loading Sequence
Concerning the shear or punching capacity of pre-cracked concrete beams and slabs, very
few experiments are available in the literature. For aggregate interlock, an important shear-
carrying mechanism, Hofbeck et al. [1969] argument that, if a crack exists in the shear
plane before the application of shear, then the slip at all stages of loading will be greater
than would have occurred if the crack had not been present. In their push-off experiments,
the existence of a crack in the shear plane reduced the ultimate shear strength from

161
aggregate interlock. Following this argument, Yang [2011] observed similar inclined
cracking strengths for pre-cracked beams but lower ultimate strengths, as the pre-cracked
beams failed upon or shortly after the formation of the inclined crack. For beams pre-
cracked in bending, Hamadi and Regan [1980] did not observe any influence of these
cracks on the shear failure. For punching shear, Azad et al. [1993] studied the orientation
of the crack in pre-cracked slab-column experiments. For existing cracks under a degree of
20 to 30o, the existing crack had a detrimental effect on the punching shear capacity, which
became about 54% of the punching shear capacity of a specimen without an existing crack.
For slabs S3 to S18, two specimens were tested with all parameters similar, except the
loading sequence (Figure 3). To study the effect of pre-cracking, the result of an experiment
on an undamaged specimen is compared to the result of an experiment carried out in the
vicinity of a local failure. It was observed that the width of cracks from previous testing
increased during testing for residual capacity. S6T3 gave a 5% higher residual capacity
than S5T1 and S13T2 gave a 3% higher capacity than S14T2; all other comparisons gave
lower residual capacities, as expected. The overall average is a residual capacity of 81% of
the undamaged shear strength. This result is surprisingly high, as it was not expected that
slabs which had been tested up to their ultimate capacity and showed cracks of sometimes
20 mm to 30 mm wide (Figure 8) would be able to resist considerable loads upon
reloading.
The high residual capacity of slabs under concentrated loads close to the support in shear
demonstrates the large redistribution capacity of slabs. In the case of an experiment in the
vicinity of a local failure, an alternative load carrying path away from the local failure can
be found.
4.3 Size of the loaded area
The size of the loaded area is interesting to study, as it does not influence the effective
width as determined from the Dutch load spreading method, 1effb , Figure 1a, while it does
Figure 8. Punching damage at the bottom of a slab after an experiment

162
influence the effective width as determined from the French load spreading method, 2effb ,
Figure 1b.
Test results from the literature that are compared based on the size of the loaded area in
Table 4 indicate an increasing shear capacity for an increasing width of the loaded area.
The increase in loaded area (“increase load size”), as compared to the loaded area of the
experiment on the previous row, and the increase in ultimate capacity (”increase expP ”), as
compared to the ultimate capacity of the experiment on the previous row, are shown. Note
that the increase in ultimate capacity becomes larger for the largest tested loading plates,
while the increase in size of these loading plates is percentage-wise smaller than for the
smaller tested loading plates. For smaller la d distances, smaller increases in capacity are
reported than for loads applied further away from the support. In these experiments one
dimension of the loading plate is constant, leading to an increasing degree of
rectangularity. Experiments using square loading plates of different sizes are not available.
Table 4. Increase in ultimate load for an increasing size of the loading plate as reported in literature
Reference Nr la d load (mm × mm)
increase load size
expP
(kN)
increase
expP
Furuuchi et al. 1998
A-10-10 1.75 100 × 50 - 294 - A-20-10 1.75 200 × 50 100% 340 16% A-30-10 1.75 300 × 50 50% 450 32% C-10-10 1.25 100 × 50 - 480 - C-20-10 1.25 200 × 50 100% 525 9% C-30-10 1.25 300 × 50 50% 626 19% C-50-10 1.25 500 × 50 67% 811 30%
Regan 1982
2SS 2.16 100 × 100 - 130 - 5SS 2.16 200 × 100 100% 190 46% 3SS 1.68 100 × 100 - 195 - 7SS 1.68 200 × 100 100% 200 3%
To study the influence of the size of a square loading plate on the shear capacity of one-
way slabs and slab strips, the results of slabs and slabs strips of comparable experiments
(in which only the size of the loaded area is changed) are studied. The slabs consist of
normal strength concrete and the slab strips of high strength concrete. The results of the
comparison of the experimental data are shown in Table 5, displaying the measured
average increase in capacity uV for an increase in size of loading plate from 200 mm × 200
mm to 300 mm × 300 mm. The results of the specimens with widths of 1 m to 2.5 m in
Table 5 show that the influence of the loading plate size on the shear capacity becomes
larger as the overall specimen size increases (Lantsoght, et al. [2012b]).

163
Table 5. Measured increase in ultimate shear capacity for an increase in the size of the loaded area
from 200 mm × 200 mm to 300 mm × 300 mm
Specimens b (m) Average increase uV
BS1 – BS3 0.5 11.5% BM1 – BM3 1.0 0.1% BL1 – BL3 1.5 0.6% BX1 – BX3 2.0 24.6%
S1 – S2 2.5 40.6%
The influence of the size of the loaded area can be explained based on the transverse load
redistribution capacity in slabs. Considering the load distribution as a three-dimensional
problem in which compression struts occur over the depth and the width of the slab, it is
clear that a larger loaded area provides a larger base for the compressive struts. As these
compressive struts develop over a larger area, more material is activated to carry the load
and thus the shear capacity is increased.
4.4 Moment distribution at the support
Research from the 60s and 70s indicated a lower shear capacity at the continuous support.
Rafla [1971] attributed this observation to the larger rearrangement of the inner forces, the
lower quality of bond for the top reinforcement at the support and the combination of
larger moments and larger shear forces. As a result, in the former Dutch code NEN
6720:1995, an increase in capacity as a result of direct load transfer can only be accounted
for in the case of loads close to the end supports or when no change in the sign of the
moment occurs. Regan [1982], however, observed a larger shear capacity at the continuous
support, which is expressed by the enhancement factor Regana .
+= 1 2Regan
1
M Ma
M (5)
in which 1M and 2M are the larger respectively the smaller moment at either end of the
shear span. For Regan’s experiments [1982], an average increase in shear capacity at the
continuous support of 55% is measured (Table 1), while the calculated increase based on
Regana is 14%. For these results, the correction factor Regana underestimates the influence
of the moment distribution over the support.
All slabs S1 – S18 and slab strips BS1 – BX3 are tested at the simple and continuous
support. The execution procedure of the experiments, using prestressing bars that allow

164
some rotation over the continuous support, is different from those by Regan [1982] in
which the rotation at the continuous support was fully restrained.
The experimental results are summarized in Table 6, showing the average (AVG) increase
of the shear capacity when an experiment at the continuous support, exp,CSV is compared
to an identical experiment at the simple support, exp,SSV and the associated standard
deviation (STD) and coefficient of variation (COV). The expected increase based on
Regan’s proposed factor Regana is also given. The results show that the shear capacity at the
continuous support is larger than the shear capacity at the simple support. The factor
Regana overestimates the effect of the continuous support for all slabs S1 – S18. When
studying the results in Table 6 with regard to the specimen width, it is seen that the
influence of the moment distribution at the support decreases with an increase in the slab
width (Lantsoght [2012c]).
Table 6. Comparison between shear capacity at simple and continuous support
Experiments b (m) Regana AVG exp,CS
exp,SS
V
V
STD COV
BS 0.5 1.263 1.783 0.492 28% BM 1 1.149 1.329 0.069 5% BL 1.5 1.191 1.225 0.093 8% BX 2 1.134 1.167 0.130 11% S1 – S10 2.5 1.150 1.112 0.133 12% S11 – S14 2.5 1.169 1.015 0.140 14% S15 – S18 2.5 1.196 1.031 0.085 8% BS - BX var 1.184 1.376 0.337 24%
The experimental results indicate that for slabs, the influence of the moment distribution
over the support is smaller than for beams. For slabs the transverse moment plays a role
for the capacity at the continuous support. It is thus necessary to investigate the
combination of longitudinal and transverse moment to assess the influence of the moment
distribution at the support. As calculated by Lantsoght [2012c] this observation is reflected
by the results of linear finite element calculations, in which the profile of the reaction forces
over the support length is studied to determine the theoretical effective width from a linear
finite element calculation. The requirement for determining the effective width is
theoretically that the reaction resulting from the total shear stress over the full support
width should equal the reaction resulting from the maximum shear stress over the effective
width. This effective width is smaller at the continuous support as compared to the simple
support, indicating the role of the transverse moment. This analysis also shows that

165
cracking and non-linear behaviour only play a secondary role in the difference between the
shear capacity at the simple and the continuous support.
4.5 Distance between the load and the support
In early research by Talbot [1909], Richart [1927] and Clark [1951] it was already known
that the distance between the load and the support, expressed as the shear span to depth
ratio ( la d ) is an important parameter influencing the shear capacity.
Kani [1964] showed the influence of the la d ratio on the ratio of maximum moment to
theoretical flexural failure moment CR FLM M and the failure mode, resulting in the so-
called valley of shear failure. When the load is placed close to the support, the formation of
a concrete compressive strut between the load and the support provides an additional load
bearing path after inclined cracking occurs. This mechanism allows for a considerable
increase of the load upon the formation of an inclined crack. As a result, decreasing
the la d ratio from about 2.5 to 0.5 increases the shear resistance, as a steeper compression
strut can carry a larger load.
To take direct load transfer into account, EN 1992-1-1:2005 §6.2.2. (6) allows for the
reduction of loads applied within a face-to-face distance va between the load and the
support between 2ld and 2 ld with a factor β = 2v
l
ad . This value is determined by Regan
[1998] from beam shear tests and provides a lower bound for the increase in capacity
as v la d decreases.
In the case of slabs under concentrated loads, the influence of the span to depth ratio is not
well understood, as two counteracting mechanisms occur: the effective width and the
development of the compressive strut. A 45º load spreading in the horizontal direction as
shown in Figure 1 leads to a decreasing effective width for a decreasing distance to the
support. For a given maximum shear stress uv , a smaller effective width leads
consequently to a smaller maximum theoretical shear capacity uV , with:
=u u eff lV v b d (6)
To study the influence of the distance between the load and the support ( la d )
experimentally, the results of the slabs and slab strips with a = 600 mm and a = 400 mm are
compared (Lantsoght, et al. [2013]).
The experimental observations are summarized in Table 7, showing the measured average
ratio of the shear capacity for a = 400 mm, exp,400V to the shear capacity for a = 600 mm,

166
Table 7. Influence of the decrease in the shear span from 600 mm to 400 mm on the observed
increase on the shear capacity
Specimens b(m)
AVG
exp,400
exp,600
V
V
standard deviation
coefficient of variation
expected
exp,400
exp,600
V
V
BS2 – BS3 0.5 2.09 0.297 14.2% 1.8 BM2 – BM3 1 1.73 0.027 1.6% 1.8 BL2 – BL3 1.5 1.49 0.061 4.1% 1.8 BX2 – BX3 2 1.30 0.063 4.8% 1.8 S3 – S6 2.5 1.42 0.172 12.1% 2 S11 – S14 2.5 1.45 0.213 14.7% 1.8 S15 – S18 2.5 1.39 0.145 10.4% 2.25 // 1.41
exp,600V . The results show a clear increase in shear capacity with decreasing distance to the
support as well as a clear influence of the overall member width b on the quantity of this
increase. The last column of Table 7 shows the expected average ratio of the shear capacity
for a = 400 mm as compared to the shear capacity for a = 600 mm based on the factor β
from EN 1992-1-1:2005. For S17 and S18 the value of 2v
l
ad = 0.314 which results in β = 0.5.
Therefore, the expected increase in capacity is given based on the comparison of
400 600v va a (2.25) and based on β β400 600 (1.41). Comparing the expected to the measured
increase shows that the observed increase in shear resistance for slabs is less than obtained
with the factor β given by EN 1992-1-1:2005 for beam shear.
The observed lower increase and dependence on the width b of the capacity for a decrease
in the ratio of distance between the load and the support and the effective depth la d can be
explained when studying the compression struts in slabs under concentrated loads. For
beams, a clearly defined strut develops over the distance a, while in slabs a fan of struts can
develop. A plan view of these struts is shown in Figure 9. This sketch also shows the
influence of the width in slabs and the resulting transverse redistribution of the load. In
load
support
a/dl = 1a/dl = √2
a/dl = 1.2
a/dl = √2
a/dl = 1.2
Figure 9. Larger average la d ratio for slabs as compared to beams

167
beams, only the straight strut ( la d = 1 in Figure 9) can develop. In slabs, the resulting
la d will be influenced by the fan of struts and their average resulting load path. A larger
average la d results, leading to a smaller influence of the distance between the concentrated
load and the support on the shear resistance of slabs. The experimental results show the
difference in behaviour between the beams or slab strips with mainly two-dimensional
load carrying behaviour and slabs with mainly three-dimensional load-carrying behaviour.
5 Recommendations for the effective width
5.1 Influence of the width
Regan and Rezai-Jorabi [1988] suggested that the difference in shear capacity from the
narrow to full width conditions as observed in experiments on slabs under concentrated
loads at larger distances to the support, is the result of an interaction between the one-way
and two-way shear modes. This idea is supported by the experiments from Table 3, in
which the cracking patterns on the bottom face of the specimens show the differences
between two-dimensional beam behaviour and three-dimensional slab behaviour. The
specimens with a smaller width (BS and BM series) show a cracking pattern at the bottom
face consisting mainly of straight cracks parallel to the support, Figure 10a. In the wider
specimens, a more grid-like pattern with cracks perpendicular to and parallel with the
span direction is visible, Figure 10b. These observations correspond to the concept of
transverse load redistribution in slabs.
(a) (b)
Figure 10. Difference in cracking pattern between beam and slab: (a) cracking pattern at bottom face
after BS2T1, (b) cracking pattern at bottom face after S9T1. The grey area denotes the location of the
loading plate. Bold lines in (b) denote areas of punching damage
(a) (b)

168
For members with a smaller width, transverse load redistribution cannot occur and the
load is carried directly from its point of application to the support. As seen in the previous
parameter analysis, the effective width depends on the influence of the size of the loaded
area, the distance between the load and the support and the moment distribution at the
support. All these experimental observations can be explained based on the concept of
transverse load redistribution: when the possibility of carrying load over the width
direction is activated, additional loading paths develop and these paths are influenced by
the geometry.
Regan and Rezai-Jorabi [1988] observed increasing maximum shear capacities for
increasing widths (0.4 m to 1.2 m) up to a certain value (1 m) for la d = 5.42 after which the
maximum shear capacity remained around the same value. Reißen and Hegger [2012]
tested slabs of increasing widths, but a threshold value cannot be observed from this series
of tests. From the results of experiments on slabs under a concentrated load close to the
support from the literature, only A-10-10 and B-10-10 from Table 4 can be compared. The
expected increase in capacity based on the Dutch load spreading method is 2% and based
on the French load spreading method is 30%. The experimental results show an increase in
capacity of 25%. Thus, for this case, the French load spreading method agrees best.
The results of slabs S8 (2.5 m) and S9 (2.5 m) are compared to the results of the series of
slab strips (BS1/0.5 m – BX3/2 m), all of which are made with high strength concrete
(Table 2). The results are used to evaluate the horizontal load spreading methods. In line
with the concept of the effective width (Figure 1), for slab strips with a small width an
increase of the specimen width should lead to an increase of the shear capacity: the full
specimen width carries the load at the support. For larger widths, a threshold value should
apply above which no further increase in shear capacity is observed with an increasing
specimen width. This threshold value corresponds to the effective width that carries the
load at the support, and is –according to the concept sketched in Figure 1– independent of
the specimen width. The results of the comparison of the experimental data are shown in
Figure 11. These results show that the concept of using an effective width for slabs is a
logical concept as the shear capacity does not increase linearly for larger widths.
The threshold effective width is determined for each of the set of parameters shown in the
legend of Figure 11 by finding the intersection of the trend line through the data points for
which the shear capacity is increasing with the specimen width and of the horizontal line
that defines the average shear capacity which remains constant for increasing specimen

169
widths. The results for the calculated effective width based on the experimental results are
given in Table 8 and compared to the calculated widths based on the load spreading
methods from Figure 1a, 1effb , Figure 1b, 2effb , Figure 1c, MCb and the effective width from
German practice DEb , the effective width from Zheng et al. [2010], Zhb , and the effective
width from BBK79, BBKb . In Table 8, the following results are given:
measb effective width as the calculated threshold from the series of experiments with
different widths;
1effb effective width based on the load spreading method as used in Dutch practice;
0
200
400
600
800
1000
1200
1400
1600
1800
0 500 1000 1500 2000 2500
V u(k
N)
b (mm)
300 mm × 300 mm SS a/dl=2.26300 mm × 300 mm CS a/dl=2.26200 mm × 200 mm SS a/dl=1.51200 mm × 200 mm CS a/dl=1.51200 mm × 200 mm SS a/dl=2.26200 mm × 200 mm CS a/dl=2.26
b < beff b = beff
Figure 11. Influence of overall width on shear capacity. Test results for BS, BM, BL, BX, S8 and S9
are shown
Table 8. Effective width as calculated from the experimental results
Series measb
(m) 1effb
(m)
2effb
(m)
MCb
(m) DEb
(m) Zhb
(m) BBKb
(m)
300 mm × 300 mm, SS, a/dl = 2.26 2.04 1.1 1.7 0.99 0.87 2.79 3.21
300 mm × 300 mm, CS, a/dl = 2.26 1.78 1.1 1.7 0.99 - 2.79 3.21
200 mm × 200 mm, SS, a/dl = 1.51 1.31 0.7 1.1 0.63 0.67 2.71 3.08
200 mm × 200 mm, CS, a/dl = 1.51 0.94 0.7 1.1 0.63 - 2.71 3.08
200 mm × 200 mm, SS, a/dl = 2.26 1.53 1.1 1.5 0.98 0.77 2.71 3.08
200 mm × 200 mm, CS, a/dl = 2.26 1.31 1.1 1.5 0.98 - 2.71 3.08

170
2effb effective width based on the French load spreading method (Chauvel et al.
[2007]);
MCb effective width based on the load spreading method from the fib Model Code;
DEb effective width from German practice (Grasser and Thielen [1991]), Eq. (2);
Zhb effective width for bridge decks (Zheng et al. [2010]), Eq. (3);
BBKb effective width from BBK 79, Eq. (4).
In Table 8, no results are given for DEb at the continuous support. Grasser and Thielen
[1991] recommend the use of yt + 0.3 x for fixed-pin conditions, but only for 0.2 l < x < l. For
the considered experiments, this would mean a > 720 mm. For this reason, the effective
width DEb is only given for experiments close to the simple support. Comparing the results
of measb to the calculated effective widths in Table 8 shows that the experimental effective
width corresponds best to the effective width based on the French load spreading method.
The results for Zhb and BBKb lead to effective widths larger than the specimen width, and
are not considered in further analysis for being overly unconservative. The results
for MCb and DEb on the other hand are too conservative as compared to measb . For this
reason, these results are not considered in the further analysis.
In Table 9, the results of the effective width from Eq. (1) are given (Lubell, Bentz and
Collins [2008]). In this method, the effective width depends on the specimen width.
Therefore, Table 9 gives the effective width for the increasing specimen sizes, both for
loadb = 300 mm and loadb = 200 mm. Comparing the results of measb from Table 8 with the
results in Table 9 shows that using the reduction factor βL leads to conservative effective
widths for slabs strips with b < 2 m (except for loading at la d = 1.51 close to the simple
support). The distance between the load and the support does not influence the effective
width from Lubell, Bentz and Collins [2008]. Because this method disregards the important
Table 9. Effective width from Lubell, Bentz and Collins [2008]
b
(mm) loadb
(mm)
κ βL effb
(m)
loadb
(mm)
κ βL effb
(m) 500 300 0.60 0.88 0.44 200 0.40 0.82 0.41
1000 300 0.30 0.79 0.79 200 0.20 0.76 0.76
1500 300 0.20 0.76 1.14 200 0.13 0.74 1.11
2000 300 0.15 0.75 1.49 200 0.10 0.73 1.46
2500 300 0.12 0.74 1.84 200 0.08 0.72 1.81
171
influence of the distance between the load and the support, it is omitted from further
analysis.
The results from Table 8 show a difference between loading at the simple (SS) and
continuous (CS) support. Consistently, lower effective widths are found at the continuous
support as compared to the simple support. This observation corresponds to the results
from the linear finite element analysis, indicating the influence of the transverse moment in
slabs.
The results from Table 8 also show a different effective width depending on the size of the
loaded area. As previously discussed, load spreading from the centre of the load towards
the support would not imply an influence of the size of the loaded area on the effective
width or the overall shear capacity. The results of this series of experiments show the
influence of the size of the loaded area on the effective width, as used in the French load
spreading method. A larger loaded area leads to a larger effective width and thus a wider
mechanism of load spreading. This observation can be explained by the larger area from
which the compression struts are distributed.
Moreover, the results from Table 8 show that the effective threshold width becomes
smaller as the la d ratio decreases, which corresponds to the idea of horizontal load
spreading from the load towards the support at a certain angle. The importance of the
distance between the load and the support is reflected by both studied horizontal load
spreading methods as well as the measured effective widths based on the series of slab
strips. Indeed, at smaller distances between the load and the support, the compression
struts cannot fan out over the width as much as at larger distances.
5.2 Statistical analysis
A statistical analysis is also used to quantify which load spreading method can be
recommended for use in combination with EN 1992-1-1:2005. All experiments on slabs and
slab strips (Table 3, uncracked results) are analysed as well as relevant experiments from
the slab shear database (Lantsoght [2012a]). Mean material properties are used, and all
partial safety factors are equal to 1. The analysis shows that combining 1effb and 2effb with
the shear provisions from EN 1992-1-1:2005 both lead to conservative results. The statistical
analysis is shown in Table 10, with:
AVG average value;
STD standard deviation;

172
COV coefficient of variation;
expDUTV the shear force at the support in the experiments from Table 3, uncracked;
, 1EC beffV the shear capacity as prescribed by EN 1992-1-1:2005 and using 1effb ;
, 2EC beffV the shear capacity as prescribed by EN 1992-1-1:2005 and using 2effb ;
DUTdbV the shear capacity as found in the experiments from the slab shear database.
The results in Table 10 show the large conservatism in the shear provisions from EN 1992-
1-1:2005 when compared to the experimental results from §4.1. The 5% lower bound of the
distribution of the ratio of experimental to predicted values is found to be larger than 1 for
the experimental results from §4.1. The French load spreading method results in a smaller
underestimation of the capacity when compared to the Delft experiments, and a
significantly smaller coefficient of variation. Note that the scatter on the experiments from
the slab shear database is large, as it comprises shear, punching and flexural failures (when
calculating the flexural capacity for such experiments, it was found that the failure mode
could have been bending, even though these failures were reported as shear failures).
Moreover, the empirical equations from EN 1992-1-1:2005 take only a limited number of
parameters into account. Variations in other parameters invariably lead to increases in the
standard deviation. Therefore, the results of the comparison of the test results from the
database with the predicted shear capacity are used here in terms of the coefficient of
variation to determine the preferable load spreading method. As such, Table 10 clearly
indicates that the French load spreading method leading to 2effb (Figure 1b) is to be
preferred.
Table 10. Comparison between EN 1992-1-1:2005 and the experimental results
exp
, 1
DUT
EC beff
V
V exp
, 2
DUT
EC beff
V
V
, 1
DUTdb
EC beff
VV
, 2
DUTdb
EC beff
VV
AVG 3.401 2.382 1.937 1.570 STD 0.890 0.522 1.228 0.659 COV 26% 22% 63% 42%
The statistical results of the comparison between the experiments and the shear capacities
from EN 1992-1-1:2005 show that there is room for improvement to determine the shear
capacity of slabs subjected to concentrated loads close to supports. To find better estimates
for this capacity, two methods are proposed (Lantsoght, [2013]): (1) extending the formula
from EN 1992-1-1:2005, based on the safety philosophy of the Eurocodes, to take the
beneficial influence of transverse load redistribution further into account; and (2)

173
developing a mechanical model, based on the Bond Model for concentric punching shear
by Alexander and Simmonds [1992]. Both resulting models (currently given in Lantsoght
[2013]) are the subject of future publications.
5.3 Non-linear finite element models
Falbr [2011] and Doorgeest [2012] studied in non-linear finite element models the stress
distribution at the support to assess the effective width. Doorgeest [2012] determined the
effective width based on the stress distribution over the support for a series of finite
element models of slabs in Diana [2012] with variable width and variable shear span,
Figure 12. This analysis shows that the French load spreading method gives mostly a safe
average of the effective width, although the increase of the effective width for an
increasing shear span is smaller in the models than as found based on the French load
spreading method. Moreover, the effective width in the models is found to be dependent
on the overall slab width.
Figure 12. The vertical stress distribution in the interface layer of the support at failure, as
calculated by Doorgeest [2012]
a) = 1500 mm, = 1500 mm
= 400 mmeffb b
a
b) = 1500 mm, = 1500 mm
= 700 mmeffb b
a
c) = 1500 mm, = 1500 mm
= 1000 mmeffb b
a
d) = 2500 mm, = 2000 mm
= 400 mmeffb b
a
e) = 2500 mm, = 2080 mm
= 700 mmeffb b
a
f) = 2500 mm, = 2200 mm
= 1000 mmeffb b
a
g) = 3500 mm, = 2020 mm
= 400 mmeffb b
a
h) = 3500 mm, = 2250 mm
= 700 mmeffb b
a
i) = 3500 mm, = 2600 mm
= 1000 mmeffb b
a

174
Falbr [2011] modelled the experiment S1T1 in ATENA [2011]. From this analysis, the
effective width based on the shear stress distribution was found. Translating this back into
a load spreading method, the required angle for load spreading from the far side of the
loading plate (Alternative II) or from the centre of the loading plate (Alternative I) was
defined, as shown in Figure 13. The effective width is also determined from the area over
which inclined cracks at the soffit were observed in the “experiment” (the green line shows
the associated load spreading method). The sketch shows a good comparison between the
effective width resulting from the experimentally observed cracked region, the effective
width based on the nonlinear finite element calculations and the effective width 2effb
according to the French load spreading method (Alternative II in Figure 13).
Figure 13. Comparison between different angles for the load spreading method leading to different
considered effective widths: effective width based on the stress distribution over the support in Atena
(red line), based on the area over which the inclined cracks on the soffit of the slab after failure in the
experiment were observed (green line) and based on a load spreading method using a 450 angle
(black line), calculated by Falbr [2011]. Alternative I is based on the Dutch load spreading method,
while Alternative II is based on the French load spreading method.
Alternative I
Alternative II
ExperimentAtena models
o45 prediction
1750 1600
300 600

175
6 Summary and Conclusions
An experimental study has been performed to assess the difference in behaviour between
beams and slabs failing in shear. This difference is described in terms of the transverse load
redistribution capacity that occurs in slabs as a result of their additional dimension.
An overview of the experiments reported in the literature on slabs and wide beams, failing
in shear or in punching, as a result of loading with a concentrated load, multiple loads or a
line load shows that only 22 shear experiments have been carried out on one-way slabs
under a concentrated load close to the support. These experiments are carried out on slabs
with a small depth ( ld < 150 mm).
The current research aims at studying the shear capacity of slabs under a concentrated load
close to the support, for practical assessment of slab bridges in which the load model from
EN 1991-2:2003 is applied and a heavy axle load is placed in the vicinity of the support. In
total, 127 experiments on 18 slabs and 12 slab strips under a concentrated load close to the
support have been carried out.
It can be seen from the results that when a locally failed and heavily damaged slab is tested
in the vicinity of this failure, the redistribution capacity of the slab will lead to a large
residual capacity (on average 81% of the capacity of an undamaged specimen).
In the experiments, it is observed that the influence of the size of the loaded area is
significant, and also depends on the overall specimen width. This observation affirms that
the transverse load redistribution is activated as the width of the specimen increases. For a
larger loaded area, the compressive struts developing between the load and the support
will have a larger base to start from. As a result, more material can be used to carry load
and hence the capacity is increased.
The gradient of the support moment has a smaller influence on the shear capacity for
specimens with a larger width. This influence is also observed in linear finite element
analyses, explaining the role of the transverse moment in slabs for which transverse load
redistribution is activated.
For slabs, it is observed that the influence of the distance between the load and the support
(expressed as la d ) is smaller as compared to slab strips with a smaller width. Two
mechanisms counteract in slabs subjected to a concentrated load closer to the support: on
one hand, the struts between the load and the support become steeper, thus increasing the

176
capacity; on the other hand, the associated effective width in shear becomes smaller, thus
decreasing the maximum shear force that can be carried. The experimental observations
can be explained by imagining a fan of struts between the load and support, for which the
average distance la d is larger than the la d distance of the straight compression strut.
The effective width in shear as used in French practice is recommended for application to
slabs. This recommendation is based on the threshold values from the series of slab strips,
a statistical analysis of the ratio between the experimental and predicted values based on
the combination with EN 1992-1-1:2005 and the studied load spreading methods for the
effective width, and non-linear finite element models. The non-linear finite element models
show that, while using the French load spreading method leads to reliable results; it does
not cover all parameters that were found to affect the stress distribution and effective
width at the support. It is thus shown that the shear capacity of slabs under a concentrated
load close to the support can be calculated by using the shear capacity from EN 1992-1-
1:2005 over the recommended effective width.
Overall, the experiments, parameter analysis and comparison to the shear capacity from
EN 1992-1-1:2005 show that slabs subjected to a concentrated load close to the support fail
in a three-dimensional shear mode that is distinctly different from the two-dimensional
failure mode of beams.
Acknowledgement
The authors wish to express their gratitude and sincere appreciation to the Dutch Ministry
of Infrastructure and the Environment (Rijkswaterstaat) for financing this research work
and InfraQuest for coordinating the cooperation between Delft University of Technology,
Rijkswaterstaat and the research institute TNO.

177
Literature
Alexander, S.D.B. and Simmonds S.H. (1992), Bond Model for Concentric Punching Shear,
ACI Structural Journal. 89: 325-334.
ATENA. ATENA Program Documentation Part 2-2: User’s Manual for ATENA 3D Version
4.3.0, 2011.
Azad, A. K., Baluch, M. H., Almandil, M. Y., Sharif, A. M. and Kareem, K. (1993). Loss of
punching capacity of bridge deck slabs from crack damage. ACI Structural Journal. 90:
37-41.
BBK. Regulations for concrete structures - Part 1: Design. Statens Betong Kommitte.
Stockholm. 1979.
CEN. Eurocode 1: Actions on structures - Part 2: Traffic loads on bridges, EN 1991:2-2003.
2003.
CEN. Eurocode 2 – Design of Concrete Structures: Part 1-1 General Rules and Rules for
Buildings. EN 1992-1-1:2005. 2005.
Chauvel, D., Thonier, H., Coin, A. and Ile, N. Shear Resistance of slabs not provided with
shear reinforcement CEN/TC 250/SC 02 N 726. 2007.
Clark, A. P. (1951). Diagonal Tension in Reinforced Concrete Beams. ACI Journal
Proceedings. 48: 145-156.
Code Committee 351001 (Code Committee 351001). NEN 6720 Technical Foundations for
Building Codes, Concrete provisions TGB 1990 - Constructive requirements and
calculation methods (VBC 1995). 1995. (in Dutch)
Doorgeest, J. Transition between one-way shear and punching shear. MSc Thesis Delft
University of Technology. 2012.
Ekeberg, P. K., Sjursen, A. and Thorenfeldt, E. (1982). Load-carrying capacity of continuous
concrete slabs with concentrated loads. Nordisk betong. 4: 153-156. (in Norwegian)
Falbr, J. Shear redistribution in solid concrete slabs. MSc Thesis Delft University of
Technology. 2011.
fib. Model Code 2010: Final Draft. Lausanne, International Federation for Structural
Concrete. 2012.
Furuuchi, H., Takahashi, Y., Ueda, T. and Kakuta, Y. (1998). Effective width for shear
failure of RC deep slabs. Transactions of the Japan concrete institute. 20: 209-216.
Graf, O. (1933). Experiments on the Capacity of Reinforced Concrete Slabs under
Concentrated Loads close to a Support. Deutscher Ausschuss für Eisenbeton. 73: 10-16.
(in German)

178
Grasser, E. and Thielen G. (1991). Design aid for the calculation of sectional forces and
deformations of reinforced concrete structures. Deutscher Ausschuss für Stahlbeton,
240: 1-86. (in German)
Hamadi, Y. D. and Regan, P. E. (1980). Behaviour in shear of beams with flexural cracks.
Magazine of Concrete Research. 32: 67-78.
Hofbeck, J. A., Ibrahim, I. O. and Mattock, A. H. (1969). Shear Transfer in Reinforced
Concrete. ACI Journal Proceedings. 66: 119-128.
Kani, G. N. J. (1964). The Riddle of Shear Failure and Its Solution. ACI Journal Proceedings.
61: 441-467.
Lantsoght, E. O. L. Shear tests of reinforced concrete slabs: experimental data of residual
capacity of slabs. Stevinrapport nr 25.5-11-08: Delft University of Technology, the
Netherlands. 2011a.
Lantsoght, E. O. L. Shear tests of reinforced concrete slabs: experimental data of
undamaged slabs. Stevinrapport nr 25.5-11-07: Delft University of Technology, The
Netherlands. 2011b.
Lantsoght, E. O. L. Shear in reinforced concrete slabs under concentrated loads close to the
support – Literature review. Stevinrapport 25.5-12-11: Delft University of Technology.
2012a.
Lantsoght, E. O. L. Shear tests of reinforced concrete slabs and slab strips under
concentrated loads. Proceedings of The 9th fib International PhD Symposium in Civil
Engineering. Karlsruhe Institute of Technology (KIT), 22 – 25 July 2012, Karlsruhe,
Germany: 3-8, 2012b.
Lantsoght, E. O. L. Progress report: Experiments on slabs in reinforced concrete: Part II:
analysis of the results. Stevinrapport 25.5-12-10: Delft University of Technology, the
Netherlands. 2012c. (in Dutch)
Lantsoght, E. O. L., van der Veen, C. and Walraven, J. C. Shear assessment of solid slab
bridges. ICCRRR 2012, 3rd International Conference on Concrete Repair, Rehabilitation and
Retrofitting. Cape Town, South Africa: 827-833, 2012a.
Lantsoght, E. O. L., van der Veen, C. and Walraven, J. C. (2012b). Shear capacity of slabs
and slab strips loaded close to the support. ACI SP-287, Recent Development in
Reinforced Concrete Slab Analysis, Design and Serviceability. 5.1-5.18.
Lantsoght, E.O.L. Shear in Reinforced Concrete Slabs under Concentrated Loads Close to
Supports. PhD Thesis: Delft University of Technology, the Netherlands. 2013.
Lantsoght, E. O. L., van der Veen, C. and Walraven, J. C. (2013). Shear in One-way Slabs
under a Concentrated Load close to the support. ACI Structural Journal. 110: 275-284.
179
Leonhardt, F. and Walther, R. (1962). Contributions to the Treatment of the Shear Problem
in Reinforced Concrete - 2. Continuation of Chapter II. Experimental report. Beton- und
Stahlbetonbau. 57: 54-64. (in German)
Lubell, A.S., Bentz E., and Collins M.P. (2008). One-Way Shear in Wide Concrete Beams
with Narrow Support. ASCE Structures Congress, Vancouver, Canada.
Prochazkova, Z. and Lantsoght, E. O. L. Material properties – Felt and Reinforcement For
Shear test of Reinforced Concrete Slab. Delft University of Technology. 2011.
Rafla, K. (1971). Empirical Formulas for the Calculation of the Shear Capacity of Reinforced
Concrete Beams. Strasse Brucke Tunnel. 23: 311-320. (in German)
Regan, P. E. Shear Resistance of Concrete Slabs at Concentrated Loads close to Supports.
Polytechnic of Central London. 1982.
Regan, P.E., Shear Resistance of Members without Shear Reinforcement; Proposal for CEB
Model Code MC90. Polytechnic of Central London. 1987.
Regan, P. E. Enhancement of shear resistance in short shear spans of reinforced concrete -
an evaluation of UK reccomendations and particularly of BD44/95. University of
Westminster. 1998.
Regan, P. E. and Rezai-Jorabi, H. (1988). Shear Resistance of One-Way Slabs under
Concentrated Loads. ACI Structural Journal. 85: 150-157.
Reißen, K. and Hegger, J. Shear Capacity of Reinforced Concrete Slabs under Concentrated
Loads. IABSE 2012. Seoul, South Korea. 2012.
Richart, F. E. An investigation of web stresses in reinforced concrete beams, bulletin No.
166 of the Engineering Experiment Station. 24: University of Illinois. 1927.
Richart, F. E. and Kluge, R. W. Tests of reinforced concrete slabs subjected to concentrated
loads; a report of an investigation. 36: University of Illinois. 1939.
Sherwood, E. G., Lubell, A. S., Bentz, E. C. and Collins, M. R. (2006). One-way shear
strength of thick slabs and wide beams. ACI Structural Journal. 103: 794-802.
Talbot, A. N. Tests of reinforced concrete beams: resistance to web stresses, bulletin No. 29
of the Engineering Experiment Station. 6: University of Illinois. 1909.
TNO DIANA. User’s Manual of DIANA, Release 9.4.4, Delft, the Netherlands. 2012.
Yang, Y. Report of Experimental Research on Shear Capacity of Beams Close to
Intermediate Supports. Stevinrapport 25.5-11-10: Delft University of Technology, the
Netherlands. 2011.
Zheng, Y., Taylor, S., Robinson, D. and Cleland, D. (2010). Investigation of Ultimate
Strength of Deck Slabs in Steel-Concrete Bridges. ACI Structural Journal. 107: 82-91.

180