transverse cracks corner cracks pinholes longitudinal mid-face cracks star cracks sub-surface...
TRANSCRIPT

TransverseCracks
Corner Cracks
Pinholes
Longitudinal Mid-Face Cracks
Star Cracks
Sub-Surface Porosity
Inter ColumnarCracking Centreline
SegregationSpider Cracks
Off-Corner Cracks
LongitudinalCorner Cracks
Edge Cracks/Splits
Fig. 1. Typical defects found on the surface and inside an as-cast product
Fig. 2. Comparison signals between the 3 different laser systems
Electromagnetic Noise
Surface Waves Bulk Waves

Billet EMAT
Lens
LaserPlasma
TrolleySystem
Fig. 3. The billet being inspected with the Laser-EMAT system using theautomated trolley system

Fig. 4. Two A-Scans overlapped, showing the change in arrival time when the steel and EMAT have been moved a known distance
Fig. 5. Time vs distance graph, where the gradient is the velocity of aRayleigh wave in steel
Time vs Distance Graph
-0.1200
-0.1000
-0.0800
-0.0600
-0.0400
-0.0200
0.0000
15 20 25 30 35 40 45 50
Time (us)
Dis
tan
ce
(m
)
5 mm
10 mm
5 mm
10 mm
Arrival time changes as the
EMAT position is movedV
olta
ge/(
Arb
itra
ry U
nits
)
Time (µs)

Fig. 6. The automatic peak detection algorithm used to calculate thevelocity in steel, from twenty different A-Scans
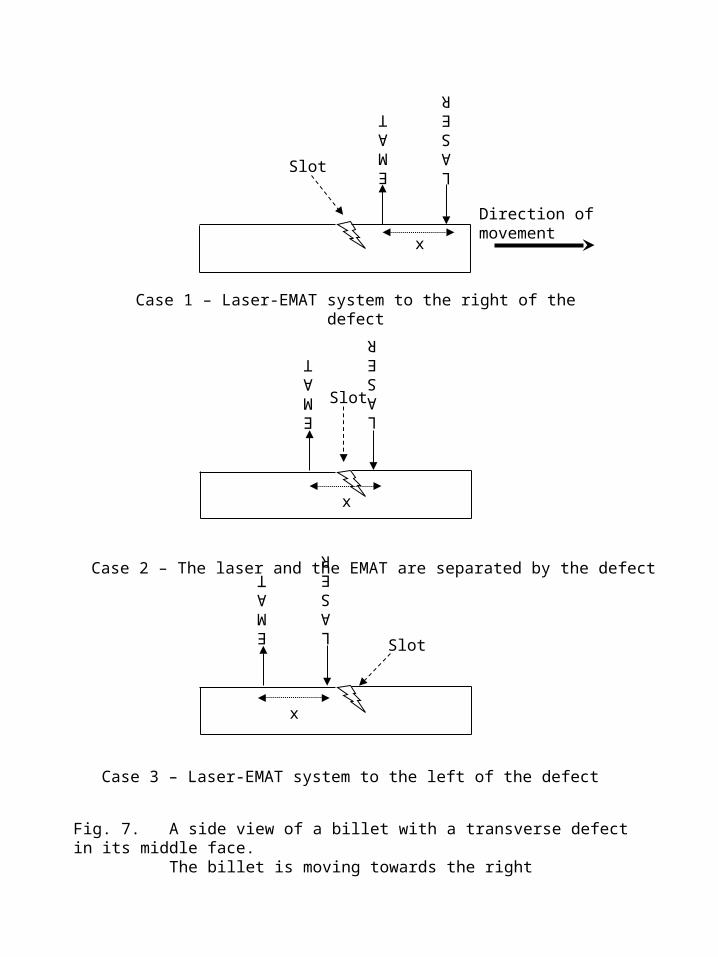
LASER
EMAT
x
Slot
x
EMAT
Slot
LASER
LASER
EMAT
x
Slot
Direction of movement
Case 1 – Laser-EMAT system to the right of the defect
Case 2 – The laser and the EMAT are separated by the defect
Case 3 – Laser-EMAT system to the left of the defect
Fig. 7. A side view of a billet with a transverse defect in its middle face.The billet is moving towards the right

Rayleigh Wave Reflected from the Slot
Shear (Bulk) Wave
SurfaceSkimming
RayleighWave
RayleighWave
Shear (Bulk) Wave
SurfaceSkimming
RayleighWave
Shear (Bulk) Wave
Rayleigh Wave Reflected from the Slot
Rayleigh Wave Reflected from the Slot
Shear (Bulk) Wave
SurfaceSkimming
RayleighWave
Case 1 – Laser and EMAT to the right of the slab
RayleighWave
Shear (Bulk) Wave
Case 2 – The slab is between the laser and EMAT
SurfaceSkimming
RayleighWave
Shear (Bulk) Wave
Rayleigh Wave Reflected from the Slot
Case 3 – The laser and EMAT are to the left of the slab
Fig. 8. A-Scans for each of the three cases
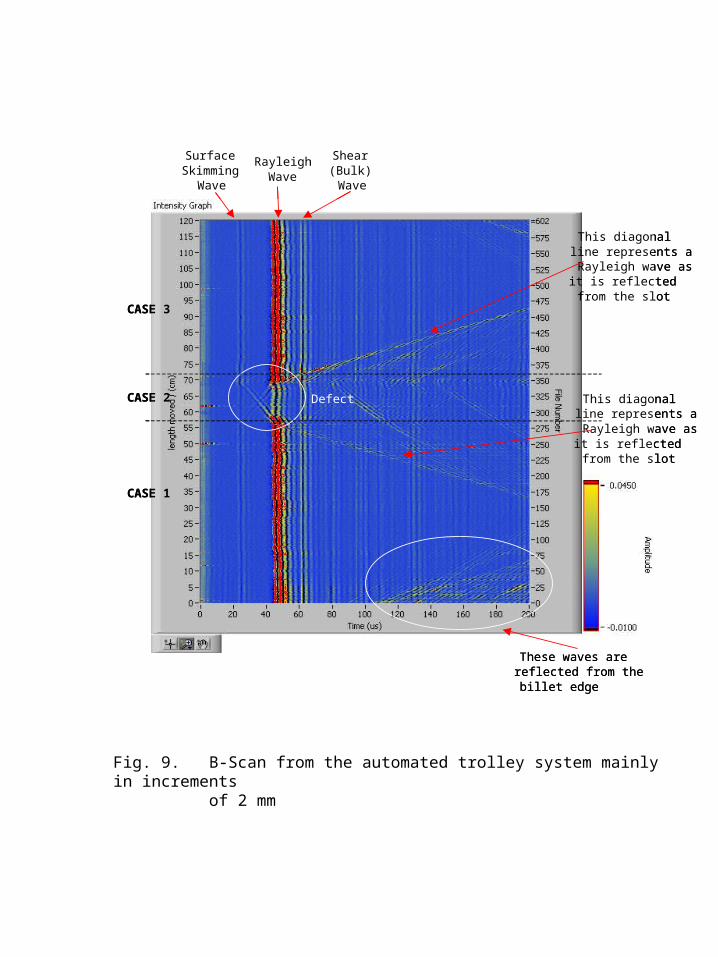
Surface Skimming
Wave
RayleighWave
Shear (Bulk) Wave
CASE 1
CASE 2
CASE 3
This diagonal line represents a Rayleigh wave as it is reflected from the slot
This diagonal line represents a Rayleigh wave as it is reflected from the slot
These waves are reflected from thebillet edge
Defect
Surface Skimming
Wave
RayleighWave
Shear (Bulk) Wave
CASE 1
CASE 2
CASE 3
This diagonal line represents a Rayleigh wave as it is reflected from the slot
This diagonal line represents a Rayleigh wave as it is reflected from the slot
These waves are reflected from thebillet edge
Defect
Fig. 9. B-Scan from the automated trolley system mainly in incrementsof 2 mm
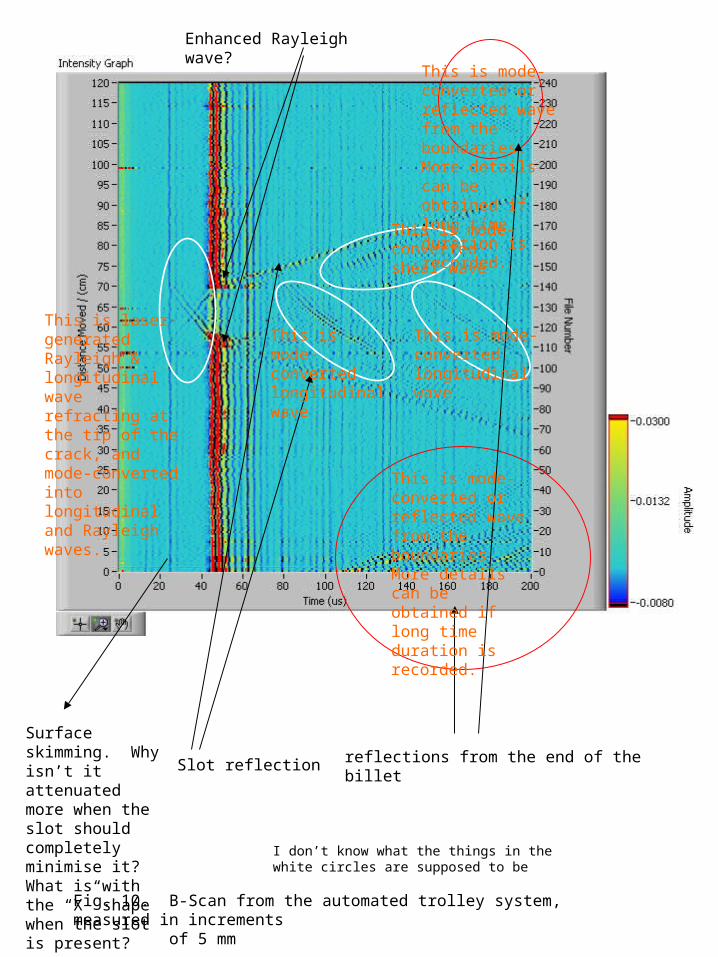
Defect
These waves are reflectedfrom the billet edge
Fig. 10. B-Scan from the automated trolley system, measured in incrementsof 5 mm
reflections from the end of the billetSlot reflection
Surface skimming. Why isn’t it attenuated more when the slot should completely minimise it? What is with the “X” shape when the slot is present?
I don’t know what the things in the white circles are supposed to be
Enhanced Rayleigh wave?
This is laser-generated Rayleigh & longitudinal wave refracting at the tip of the crack, and mode-converted into longitudinal and Rayleigh waves.
This is mode-converted longitudinal wave
This is mode-converted longitudinal wave
This is mode-converted shear wave
This is mode-converted or reflected wave from the boundaries. More details can be obtained if long time duration is recorded.
This is mode-converted or reflected wave from the boundaries. More details can be obtained if long time duration is recorded.

Rayleighwaveenhancement
This is a mode-convertedRayleigh wave to surfaceskimming wave
This is a mode-convertedsurface skimming wave to Rayleigh wave
Fig. 11. Close-up of the region where the defect is

Defect
/Arbitrary units)
Fig. 12. B-Scan generated when the billet was moved using the trolley system
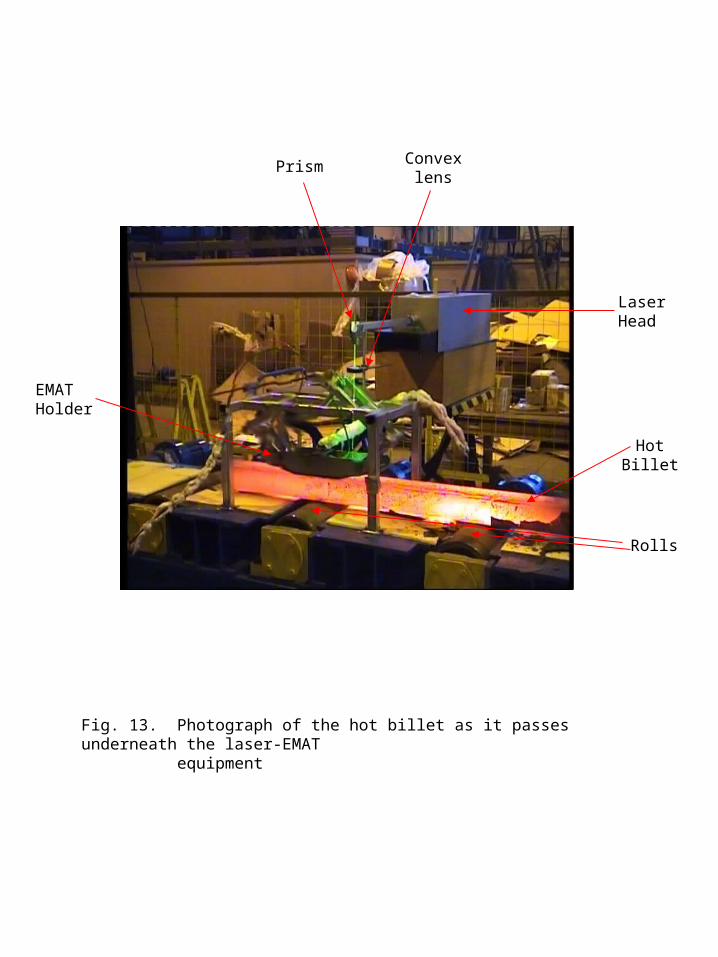
Prism Convexlens
LaserHead
HotBillet
Rolls
EMATHolder
Fig. 13. Photograph of the hot billet as it passes underneath the laser-EMATequipment
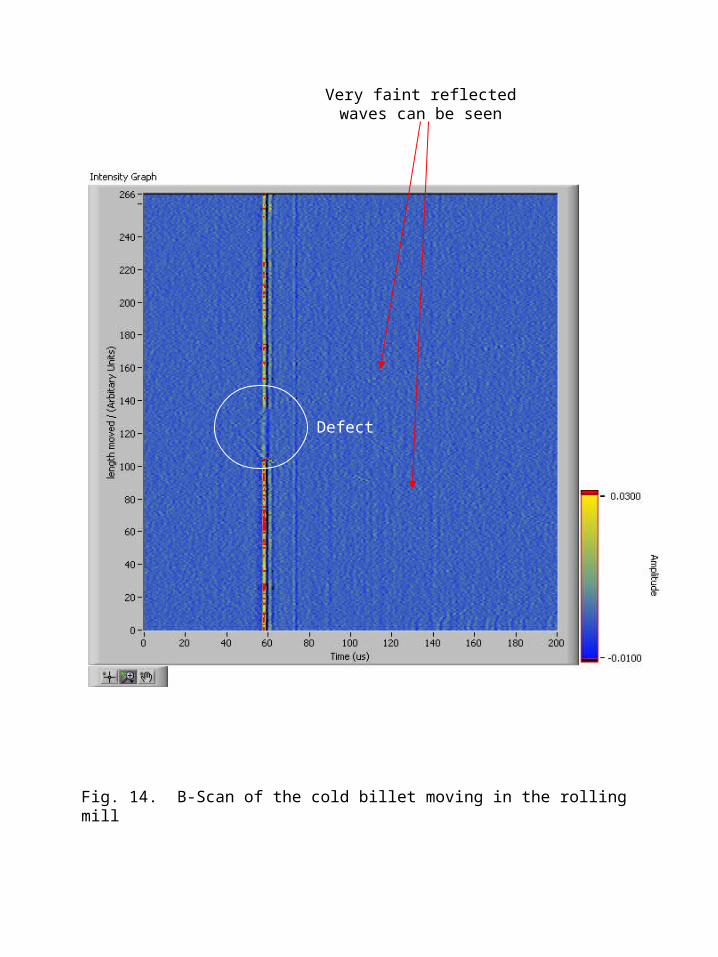
Defect
Very faint reflectedwaves can be seen
Fig. 14. B-Scan of the cold billet moving in the rolling mill
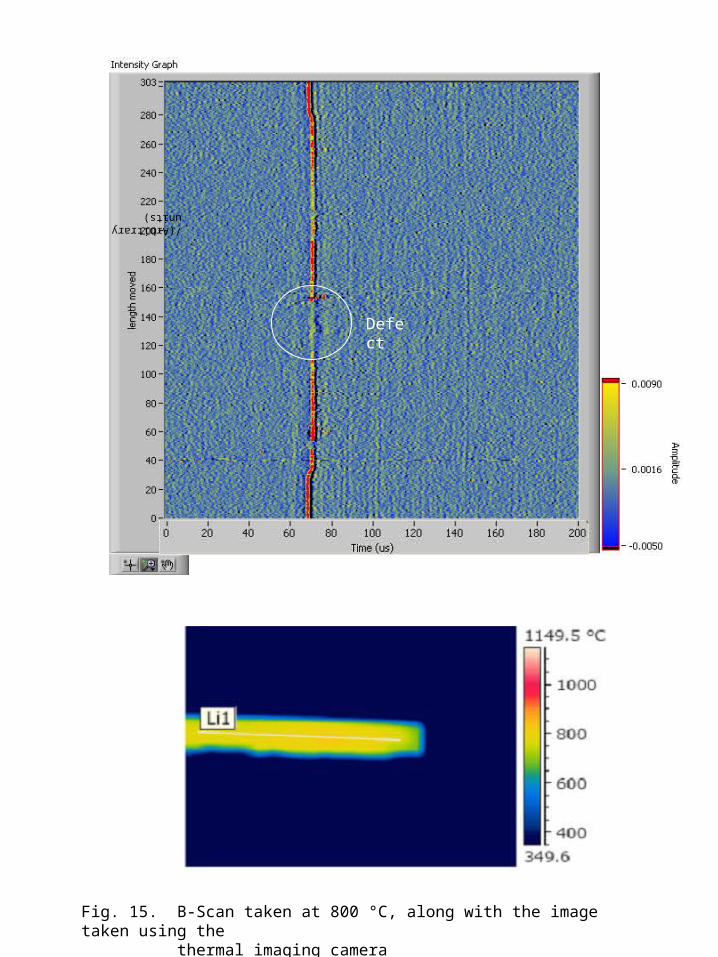
Defect
/(Arbitrary units)
Fig. 15. B-Scan taken at 800 °C, along with the image taken using thethermal imaging camera
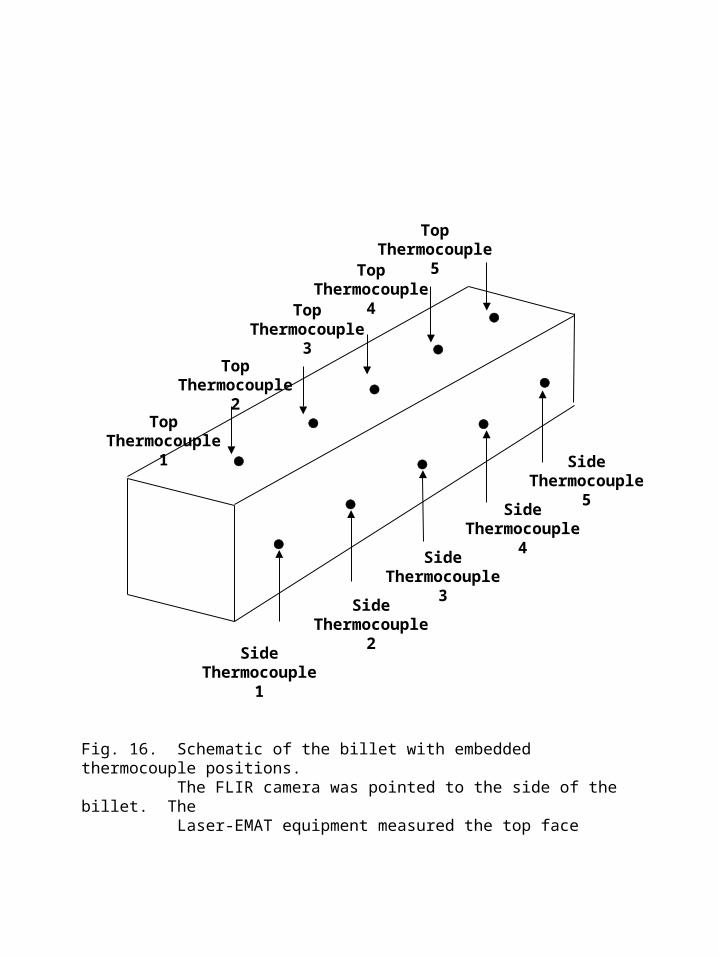
TopThermocouple 5
SideThermocouple 1
SideThermocouple 2
SideThermocouple 3
SideThermocouple 4
SideThermocouple 5
TopThermocouple 1
TopThermocouple 3
TopThermocouple 4
TopThermocouple 2
Fig. 16. Schematic of the billet with embedded thermocouple positions.The FLIR camera was pointed to the side of the billet. TheLaser-EMAT equipment measured the top face