transverse cracking of symmetric and unsymmetric glass-fibre/epoxy-resin laminates
TRANSCRIPT

ELSEVIER
Composites Science and Technology Sl(l997) 1513-1526 0 1997 Else&x Science Limited
PII: SO266-3538(97)00082-l
Printed in Northern Ireland. All rights reserved 0266-3538/97/$17.00
TRANSVERSE CRACKING OF SYMMETRIC AND UNSYMMETRIC GLASS-FIBRE/EPOXY-RESIN LAMINATES
J. W. Hoover, D. Kujawski* & F. Ellyin+
Department of Mechanical Engineering, University of Alberta, Edmonton, Alberta, Canada T6G 2G8
(Received 11 September 1996: revised 20 March 1997; accepted 28 April 1997)
Abstract This paper presents the results of an experimental investigation into transverse cracking of symmetric and unsymmetric glass-fibre/epoxy-resin laminates. The test specimens were fabricated in house and were of two types: symmetric [ f 13/90,/,~ with 0 = o”, 25”, 45”, and unsymmetric [ f 0/9O/OJ, with 0 =25” and 45”. Through-specimen-width matrix cracks were recorded visually, Testing was performed in quasi-static load (stress) control and displacement (strain) control with hold-time periods of 3 min, 1 h and 24 h. During load- controlled tests, transverse cracks initiated during a fixed-stress hold-time period but correlated well with measured strain. Displacement-controlled tests showed that the number of transverse cracks was not reduced by increasing the duration of the fixed-strain hold-time period. The effect of transverse cracks on stiffness was investigated and three stages of stiffiess reduction were observed. In the intermediate range, the stiffness reduction was linear with respect to the number of transverse cracks. Stiffness losses at the initial stage of loading were observed before transverse cracking. There was also a reduction in stifflless near final specimen failure due to delamination and jibre breakage. @ 1997 Elsevier Science Limited
Keywords: A. glass fibres; B. stress/strain curves; C. transverse cracking; C. laminate theory; C. damage mechanics
1 INTRODUCTION
Fibre-reinforced plastics are becoming the most widely applied of all advanced materials. The fibres, which are typically made from carbon or glass, contribute high strength and high stiffness but are susceptible to bending and buckling. The polymer matrix transfers load between fibres and forms the shape of the composite. The matrix does not have extraordinary
* Present address: Department of Mechanical and Aero- nautical Engineering, Western Michigan University, Kalama- zoo, Michigan 49008-5065, USA. ’ To whom correspondence should be addressed.
physical strength properties but is lightweight, easily formed, cost effective, corrosion resistant, and elec- trically insulating. The goal of polymeric composite technology is to create a material which combines the desired characteristics of polymers with the strength and stiffness of fibres.
For a specific design criteria in which the principal loading axis varies, a popular design procedure for polymeric composites is to create a multidirectional laminate from unidirectional laminae. Unidirectional laminae are widely available in prepreg form in which the glass fibres are pre-impregnated with uncured polymeric matrix. A multidirectional laminate can be constructed by stacking layers of unidirectional laminae at different angles (Fig. 1). The curing of the prepreg consolidates the layers and forms a laminate with fibres oriented at a variety of angles.
For off-axis plies within a multidirectional laminate, the applied load will not be in the fibre direction. In these cases, the relatively weak and brittle matrix can become damaged. If the local strain is greater than the
Fig. 1. Multidirectional laminate can be fabricated by stacking and curing unidirectional laminae with different
orientations.
1513

1514 J. W. Hoover et al.
in situ ultimate strain of the matrix, matrix cracks will Attempts to count transverse cracks with this form within each lamina. These cracks will not cause method were unsuccessful because not enough pene- ultimate failure of the laminate because of the trant flowed into the cracks. The method described in constraining effect of neighbouring plies. Section 2.1.4 was more efficient and accurate.
The motivation behind much of the work on matrix cracking has been to correlate transverse cracking with stiffness reductions.‘4 In addition, transverse cracking can initiate further matrix damage in the form of delaminations or lead to functional failure of a composite such as pressure vessel weepage.
2.1.2 Edge examination
In order to study the effect of transverse cracks on glass-fibrejepoxy-resin laminates, three phenomena were examined:
During the loading procedure, transverse cracks open and split the matrix. Along the edge, these cracks can easily be seen with the unaided eye. Crack damage can be quantified by recording the number of cracks that appear along the edge.
1. the initiation and development of transverse cracks in load- and displacement-controlled conditions;
2. fixed stress/strain hold-time effects on the initiation and development of transverse cracks; and
3. stiffness reduction as a result of transverse cracking.
In the process of the investigation, a new transverse crack observation technique was developed which was a significant improvement over previous techniques.
There are two popular methods. Moore and Dillard6 and Highsmith and Reifsnider’ applied acetone between an acetate film and a highly polished specimen edge. Once the acetone evaporated, the tape provided a permanent record of the position and number of cracks. Another method involving optical microscopy has been used by Talreja,’ Varna et aL7 and Matsuhisa and King.8
2 BACKGROUND
2.1 ‘hansverse crack observation techniques Techniques that have been used to study damage in composite materials can be divided into four cate- gories: X-ray and ultraviolet penetrant inspection, acoustic emission, edge examination, and optical inspection.
There are two drawbacks to the edge examination technique. Moore and Dillard6 found that edge replicas may not be a good indication of cracks within the specimen. For example, it is not possible to distinguish edge flaws from a long crack which runs through the specimen width. They conclude that edge views alone are insufficient for detailed studies of transverse crack behaviour. In addition, any contact between acetone and the matrix might introduce corrosion effects into the test.
2.1.3 Acoustic emission
2.1.1 X-ray and ultraviolet penetrant inspection X-radiation can penetrate visibly opaque materials and has been used to reveal damage in laminates. Crossman and Wangs identified transverse cracks in a laminate by removing the specimen from the testing apparatus and swabbing the edges with an X-ray sensitive penetrant which flowed into cracks and delaminations. The penetrant absorbed the X-rays and the images, taken in an X-radiographic chamber, revealed the position and length of the cracks.
Crack initiation and growth emit vibrations. Peters’ detected these vibrations with a piezo-electric load cell in conjunction with a high speed recorder to register cracks as a function of time. Varna et al.’ and Renard et al3 have reported recording emissions with acoustic microphones. A transverse crack was recorded when the vibrations from a cracking event was resolved from background noise. During the testing associated with the current experiment, the sound of transverse cracking and delamination could be heard over the noise of the testing machine.
This procedure was equally effective for laminates which were either visibly opaque (carbon-fibre com- posites) or translucent (glass-fibre composites). Unfor- tunately, the photographic procedure required inten- sive labour, time for the penetrant to flow into the laminate, and fluid penetrant to be exposed to the interior of the specimen.
There are several problems with acoustic emission observations. In order to record a transverse crack, the vibrations emitted must produce a signal that can be distinguished from background noise. If a crack propagates slowly, it is unlikely that the vibrations will produce a signal that can be resolved. Even in the case of a crack being recorded, it is difficult to determine the location of the crack which can be important if cracking is not uniform along the length.
Similarly, ultraviolet light can be used to reveal cracks. An ultraviolet-sensitive penetrant fluoresces when exposed to ultraviolet light. Cracks can be recorded visually during the test and photography is not required. Transverse cracks appear as thin, fluorescent lines inside the specimen.
Further difficulties result when delamination is accumulating. The problem arises because delamina- tion (cracks between laminae) and transverse cracks (cracks within a lamina) are both matrix cracks and the acoustic emissions are similar. Therefore, observa- tions which record acoustic emissions are recording

Transverse cracking of glass-fibre/epoxy-resin laminates 1515
Consbaiing Plies
,,A/‘\
9oDegmePlll Transverse ‘h&s 1 Fig. 2. Incident light rays on a cracked laminate are partially
>
reflected by cracks.
both transverse cracks and delamination. It was found by Varna et al.? that acoustic signals were weak and did not correlate well with visual counts or edge observations.
2.1.4 Present approach An optical crack detection technique was used for this experiment. Light from a bright halogen desk lamp was used to reveal the interior features of the translucent laminate. The lamp was placed 250 mm from the laminate to avoid localized heating. When the laminate was viewed from the opposite side of the light source, cracks appeared as thin lines of lower light intensity (Fig. 2) and delaminations were identified by regions of reduced intensity. The lamp was strong enough for laminates of 10 layers and all observations were carried out in situ.
Two conditions led to difficulties. Due to fabrication variations, fibre concentrations were present in the transverse layer of the laminate which caused dark bands to appear across the width of the specimen. It was difficult to determine if a shadow was due to a crack or a local fibre concentration. Another difficulty was hairline cracks in the transverse layers. When initiated, these cracks were thin and difficult to observe. However, as the applied load increased, these cracks opened sufficiently to cause an observable shadow.
Blocking light rays with a sharp-edged object eliminated these problems. The object was an aluminium rectangle, 50 mm by 25 mm, but any opaque object is suitable. Light in the laminate scattered around the opaque object due to diffraction and refraction (Fig. 3). The shadow caused by the object was not sharp due to scattering and the light intensity along the laminate changed gradually.
When cracks were present in the laminate, the scattered light encountered the crack at a glancing angle (Fig. 4). Due to the nature of light striking the crack/matrix interface with such a large angle of
Light lnbmlty
.-
opaqm objed J
Fig. 3. Light scattering around an opaque object in an untracked laminate.
incidence, most of the light was reflected from the crack and only a very small percentage passed through the crack. The light intensity when the edge of the opaque object was near the crack is shown on the plot on the right side of Fig. 4. The crack nearest to the edge has the largest effect on light intensity. Above the crack, light intensity is near that of the untracked specimen but just below the light intensity is very low. This sharp contrast between light and dark areas revealed the presence of a crack. By moving the opaque object along the observation area, all the cracks were recorded.
This technique is accurate, cost effective, requires no liquid penetrants and provides in situ observations of transverse cracks. It is effective because the contrast in light intensity is due to a small separation of the crack surfaces. A crack cannot be confused with delamina- tions, matrix-rich areas, fibre-rich areas or voids because these defects have different effects on the light transmitted through the laminate. The observer can also distinguish between a partial crack from one that extends fully across the width of the specimen. An additional benefit of the light transmission technique
Lllht lntenslty
_ 1. __----_*
I I
Laminate with Transverse Cm&
Fig. 4. Light incident on a cracked laminate with opaque object.

516 J. W. Hoover et al.
was that it allowed delaminations to be observed. Near [O/90& specimens are compared, a trend emerges. As final failure (c = 1.5%) edge delaminations developed the thickness of the transverse layer increases from 1 and propagated across the specimen. Delaminations to 6 prepreg layers, the maximum possible stiffness were not the focus of this experiment but were linked reduction increases, and the maximum possible crack to stiffness reduction (Section 5.4). density decreases.
A drawback of this technique was that visually counting cracks required time. In the case of stress control, cracks developed and creep strain increased during the time required to count all the transverse cracks. It was therefore difficult to determine both the stress, strain and the number of cracks at an instant in time. This was most problematic for data which were taken at the start of the hold time because cracks would develop as the counting was being performed. Fortunately, this was not a problem for displacement controlled tests because very few cracks developed during the hold time. (A digital imaging technique may alleviate the above problem and is now under development in our laboratory.)
3 SPECIMEN PREPARATION AND TEST PROCEDURE
3.1 Specimen fabrication
Recently, optical cameras and remote microscopes have been employed to analyze matrix damage with visible light. Kitano et ~1.” recorded transverse crack damage on-line with videotape and analyzed off-line. Transverse crack counts could not be performed near final failure due to the scanning speed limitations of the remote microscope. Bourban et al.” used a Canon Ci 20PM camera to record an image of white light transmitted through a laminate. The images were analyzed with the Optilab image analysis system and relative reduction in light intensity was used as a damage parameter. This optical technique was less successful at detecting damage at low strain because microdamage had a small effect on the intensity of transmitted light.
Specimens were fabricated from 3M Scotchply type 1003 continuous E-glass-fibre/epoxy-resin-reinforced plastic at the University of Alberta Department of Mechanical Engineering. Prepreg rectangles, 204 mm by 153 mm, were hand cut and aligned in a specially designed mould. Once in the mould, the laminate plate was placed in a vacuum chamber (maximum 0.0013 atm (133 Pa)) for 18 h before being cured at 150°C (300°F) for 12 h. A pressure of 172 kPa (25 psi) was applied to the laminate with a pneumatic bladder during curing. The cured laminate plate was cut into coupons with a diamond saw and the edges were ground and polished. This served only to reduce surface edge effects as described by Kitano et al.” and is not a requirement of the experimental method. The final specimen dimensions were 204 mm X 22 mm X 2.5 mm. Aluminium tabs were attached with adhesive and the specimens were stored in atmos- pheric conditions until testing. Specimens with the following lay-ups were manufactured: [ & 0/90& with f? = O”, 25”, 45”; and [ f 45/90,/O& and [ f 25/906/O&
2.2 Previous studies of stiffness reduction in transversely cracked laminates Table 1 summarizes the results of previous investiga- tions into stiffness reduction of transversely cracked glass-fibre/epoxy-resin laminates. In the lay-up descrip- tion, the subscript S refers to a symmetric ply configuration whereas the T subscript indicates the total ply configuration is included in the square bracket. All the experimental results are for crossply specimens, [0,/90,], (n = 1, 2 and m = 1, 2, 4, and 6). If the results for the [O/90/0], [0/9O]s, [O/90Js, and
It should be noted that all specimens have a transverse ply of six prepreg layers. This was done to eliminate the effect of variations in transverse ply thickness on the crack density and stiffness reduction which have been described by Crossman and Wang” and discussed in Section 2.2.
The elevated curing temperature of 150°C and the mismatch in coefficients of thermal expansion for differing ply orientations led to residual stresses at room temperature. The thermal coefficients of linear thermal expansion for the principle directions of the unidirectional prepreg were provided by the manu- facturer: (Y, (parallel to the fibres) =4S X 10eh “F-’ and a2 (transverse to the fibres) = 12.3 X 10Mh OF-‘. The larger coefficient for the transverse direction caused the transverse plies to be subjected to residual
Table 1. Summary of previous studies into transverse cracking and stiffness reduction of crossply glass-fibre/epoxy-resin laminates
Specimen lay-up Maximum stiffness Average crack reduction (%) spacing (cracks mm-‘)
Highsmith and Reifsnider’ [O/90& 45 0.8 Peters’* 35 1.7 Peters” 2.5 3 Peters” 10 5 Varna and Berglund 30 1.5

Transverse cracking of glass-fibre/epoxy-resin laminates 1517
Table 2. Calculated residual hygrothermal strains: the subscript x refers to the loading direction and y denotes the in-plane diretion perpendicular to x
Lay-up
[ f 4519031s 1 f 25190~1~
Transverse ply strains-(%) _~ ______.
Ex HI E ,H’r L
_____
+ 0.061 - 0.003 +0.106 - 0.020
iO2/9031s +0.129
Constraint ply strains (%I)
E .“T H-I ,I Eb
- 0.025 + 0.083 - 0.036 +0.121
0.030 - 0.052 +0.143
tensile stresses at room temperature. The residual strains were computed with laminate plate theory and are given in Table 2.
3.2 Testing procedure Quasi-static tensile tests with hold-time periods were utilized. Two types of quasi-static tests were employed: load (stress) control (Fig. 5) and displacement (strain) control (Fig. 6). Typical loading increments were ha = 5 MPa and Ac = O-1 %. The number of cracks, strain and stress were recorded throughout the hold- time. At the end of every time interval, the load or displacement was manually adjusted. This continued until final failure.
Strain, E
Fig. 5. Loading procedure for a stress-controlled test.
Strain, E
Fig. 6. Loading procedure for a strain-controlled test.
Uniaxial tension tests were performed with a 50 kN capacity MTS testing machine. A 75 mm (3 in) clip gauge extensometer was mounted on the edge of the specimen with elastic bands and used to measure the strain. The load and strain values were recorded with an XY chart recorder.
Transverse cracks within a counting gauge length were recorded (Fig. 7). The gauge lengths were between 39 and 75 mm in length and extended across the specimen width. Early observations were within a counting length of 45 mm which was shorter than the gauge length of the extensometer. In later tests, the counting length was increased to 75 mm which matched the gauge length of the extensometer. With this length, all the transverse cracks which could affect the extensometer measurement were recorded.
The XY chart recorder was used to record the stress/strain curve as the specimen was unloaded. The
Fig. 7. Specimen in testing apparatus.

1518 J. W. Hoover et al.
stiffness (secant modulus) was determined from two points: one which corresponded to the load at the end of the hold time and the other which was 15 MPa less than this load (Figs 5 and 6). The strain rate used to unload the specimen was approximately 1% per minute (i: = 1.67 X lop3 s-l).
In order to study the growth of cracks across the width, the specimen was divided into thirds (Fig. 7). A-, B- and C-types were defined (Fig. 8) to account for crack length with respect to the specimen width. For every test, A, B, and C cracks were recorded.
4 EXPERIMENTAL RESULTS
Tables 3 and 4 give a summary of the test results obtained under stress and strain control. More data recorded during the tests are given elsewhere.13
4.1 Displacement (strain) controlled test results
4.1.1 Three minute hold-time period Figures 9 and 10 show how transverse cracks developed with applied strain. Figure 9 displays the response of the symmetric laminates which were tested with a hold-time period of 3 min. The value for the number of cracks were recorded at the end of the
Fig. 8. Section of the gauge length showing the three types of transverse cracks: A, B, and C.
hold-time periods. There were no cracks extending partially across the width (A- and B-type cracks) for the specimens shown. Cracks initiated after 0.5% for constraining ply orientations of 0” and 25”, and at 0.3% for 45” and increased until final specimen failure. The cause of the low strain crack initiation in the 45” constraining ply specimen will be discussed in Section
Table 3. Summary of results for specimens tested in strain control
Specimen Lay-up Hold time (min)
Increment, As (%)
Failure strain,
Ef (%)
Failure stress,
uf (MPa)
Ul [ f 25/9OdO& 3 0.1 1.9 277 u2 [ f 25/90dO& 3 0.1 1.9 324 u3 [ f 25/9040& 3 0.1 1.6 276 u4 [ l 45/906/O& 3 0.1 1.8 227 U5 3 0.1 2 240 s4 3 0.1 2 127 S5 3 0.1 2.5 128 s7 3 0.1 1.3 91 S8 3 0.1 1.9 230 s9 3 0.1 1.6 214 SlO 3 0.1 1.7 206 Sll 3 0.1 2 327 s12 3 0.1 1.8 333 s13 60 0.2 1.8 109 s14 60 0.2 2.4 102 SlS 1440 0.2 2.0 90 S16 3 0.2 2.4 100
Table 4. Summary of results for specimens tested in stress control
Specimen Lay-up Hold time (min)
Increment, Ag (MPa)
Failure stress,
gf (MPa)
Failure strain,
Ef (“/I
Sl [ f 45/90& 3 5 115 2.5 s2 3 5 115 2.6 s3 3 5 120 2.6 S6 3 10 130 2.1 s15 60 10 110 2.4 S16 1440 varied 110 2.2

Transverse cracking of glass-jibre/epoxy-resin laminates 1519
3u I I I I
5- .fjZ p@iJ :
. .
Odd 0.0 0.5 1.0 1.5 2.0
Measured Strain, E, (%)
Fig. 9. Transverse cracks versus measured strain for symmetric laminates.
5.1. In general, new cracks did not develop during the hold-time period when displacement controlled tests were performed. However, for strains near 0.5%, some cracks developed over the hold-time. It should be noted that the first cracks appear at this strain and that there might be some short-term time effects present. This will be a topic of future work. In any case, this effect was minor, the largest increase in transverse cracks at a constant strain value was two cracks.
Figure 10 shows the response of the unsymmetric laminates, [ f 45/906/O& and [ f 25/90,/O,], Due to the unsymmetric lay-up, the specimens had unsym- metric residual stresses which induced warpage in the laminates. The cracking response of the unsymmetric specimens was very similar to that of the symmetric
laminates. Transverse cracking initiated near E = 0.5% and ultimate failures were about 2%.
4.1.2 One hour hold-time period Figure 11 shows the number of transverse cracks versus strain for specimen S8, [ f 45/90& tested in displacement control with a 1 h hold-time period. The cracks were recorded twice during the hold-time period, once at 3 min and again at the end of one hour. For all strain values except for 0.6 and 1*5%, the number of transverse cracks did not increase during the hold-time. For 0.6% strain, which is very near the onset of cracking, two cracks developed in 1 h and for 1.5% strain, 1 crack developed over the hour. It
xl I I I I I
Y 3 i
I I
. 1 I . . .
.
I I
I .
.
A
0 15-i
z b 2 5
10
i= i
. .
I
.
.
- 5-
. a
0 - I I I I 0.0 0.5 1.0 1.5 2.0
Measured Strain, E, (%)
Fig. 10. Transverse cracks versus measured strain for unsymmetric laminates.

1520 J. W. Hoover et al.
0 :: h I I I I
0.0 0.5 1.0 1.5 2.0
Measured Strain, E, (%)
Fig. 11. Transverse cracks versus measured strain for specimen S8, [ f 45/90&.
should be noted that 1.5% strain was the onset of delamination.
4.1.3 Twenty-four hour hold-time period Figure 12 compares the response of two laminates tested in displacement control. Specimen S15 was tested with 24 h hold-time periods and S16 was tested with 3 min hold-time periods. Both specimens were unloaded after every hold-time and the loading rates were approximately the same for both tests. Transverse cracks were recorded twice during the 24 h hold time, once at 3 min into the hold-time and once at the end of the 24 hour period.
response was similar as the strain was increased. The specimen with the 24 h holding times did not have less cracks than the specimen with the 3 min holding times. This indicates that constant strain hold-time periods do not enhance stress recovery in cracked transverse plies.
4.2 Load controlled tests results
4.2.1 Three minute hold-time period Figure 13 shows the number of transverse cracks versus stress for a [ do 45/90& specimen tested with a 3 min hold-time period. It reveals that cracks do not initiate at low stresses, but beyond 50 MPa accumulate rapidly. In addition, there are two curves corre- sponding to the number of cracks at 0.5 and 3 min into
The figure shows that transverse cracking initiated in both specimens at 0.5% strain and the cracking
.
. 0
.
13
.
:
0 .
.
. 0
.
0 \
0.0
. I
0.5 I I I I J
1.0 1.5 2.0 2.5
Measured Strain, E, (Oh)
Fig. 12. Transverse cracks versus measured strain for two [ f 45/90& specimens tested in strain control.
Transverse cracking of glass-jibre/epoxy-resin laminates 1521
0
Stress, CY, (MPa)
Fig. 13. Transverse cracks versus stress for specimen Sl, [ YII 45/90&.
the hold-time period. This was due to new cracks forming as time period elapsed. On average, two cracks developed during the 3 min hold-time. The data at 100 and 110 MPa show that the number of transverse cracks decreased over the hold-time period. This is not possible and may have been caused by errors in the counting procedure when the crack count was high. In order to count 35 cracks, the operator was required to count very quickly which may have led to inaccurate crack totals.
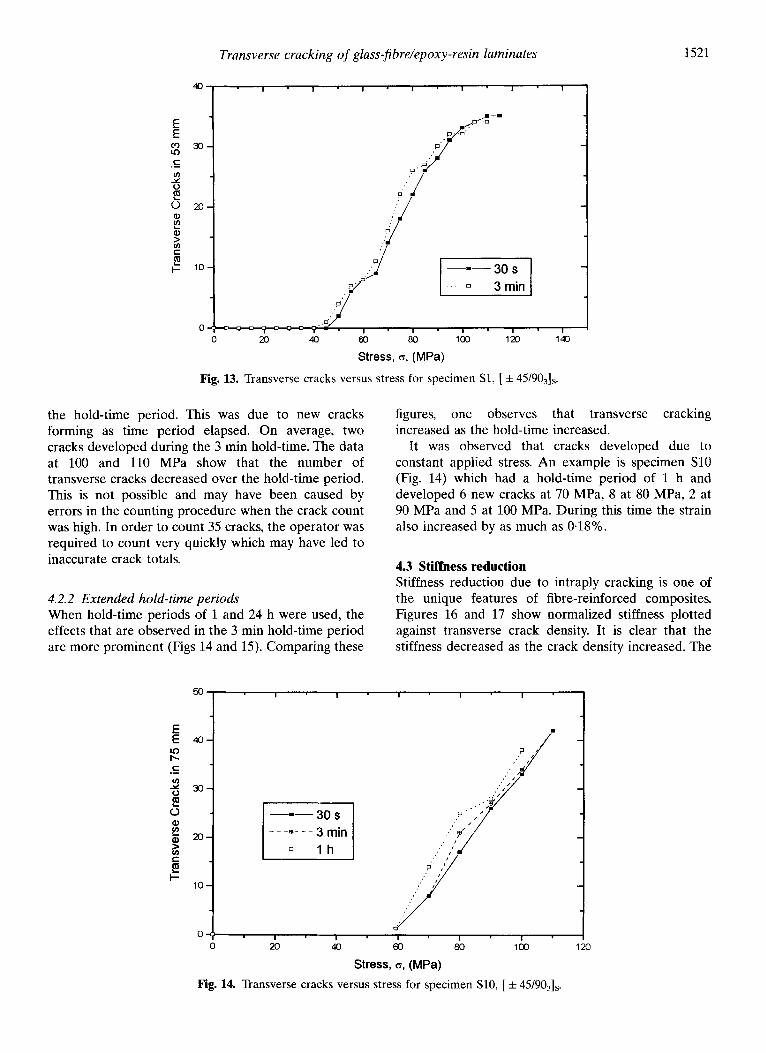
4.2.2 Extended hold-time periods When hold-time periods of 1 and 24 h were used, the effects that are observed in the 3 min hold-time period are more prominent (Figs 14 and 15). Comparing these
figures, one observes that transverse cracking increased as the hold-time increased.
It was observed that cracks developed due to constant applied stress. An example is specimen SlO (Fig. 14) which had a hold-time period of 1 h and developed 6 new cracks at 70 MPa, 8 at 80 MPa, 2 at 90 MPa and 5 at 100 MPa. During this time the strain also increased by as much as 0.18%.
4.3 Stiffness reduction Stiffness reduction due to intraply cracking is one of the unique features of fibre-reinforced composites. Figures 16 and 17 show normalized stiffness plotted against transverse crack density. It is clear that the stiffness decreased as the crack density increased. The
-l”““““‘l m
40- P
, .’ ,
30- _’ ,’
,’ I
.‘I
20- ---s---3 min .’ , .’ p
.’ I 0 , h .’ I : I
: ’ P ,’
/:
.’ I IO-
.' I ,' /
-=- 30 s
I El :
p I , .’ ,
0 :: I , , [, . , . 1
0 20 40 60 80 100 120
Stress, CT, (MPa)
Fig. 14. Transverse cracks versus stress for specimen SlO, [ f 45/90&.

1522 J. W. Hoover et al.
n - 3 min @ 2 20-
t
--~-_-, h
9 _... q 24 h 2 15-
E lo-
5-
0 :: I 0 20 40 60 80 100 120
Stress, G, (MPa)
Fig. 15. Transverse cracks versus stress for specimen Sll, [ f 45/90&.
stages indicated in Fig. 16 will be discussed in Section 5.4.
5 DISCUSSION
5.1 The effect of edge polishing on transverse cracks All specimens, with the exception of Sl-S6, were ground and polished along the edges before testing. The transverse cracks spanned the entire width of the specimen upon initiation and no partial cracks were observed.
The edges of specimens SlS6 were not polished after grinding and it was observed that A- and B-type cracks developed in these specimens (Fig. 18). This
might also explain why specimen S4 in Fig. 9 develops more cracks than the polished specimens, Sll and S8, at comparable strains. Similar observations were reported by Kitano et a1.l’ who found that removing edge defects delays the onset of transverse cracking.
5.2 Load controlled tests examined with respect to the measured strain Figures 13-15 show that the number of transverse cracks could not be determined from the average stress alone. The utilization of three different hold- time periods revealed that there was a large time effect when a specimen was subjected to a fixed load.
1 I I , I
-.- PJq, u - - -*- - - k25/9OJ, ----A..--. L+&j/g(Q
‘.. ._
.._. -.
-.._. Final Failure
‘t/ (Stage 3) A
i I I I I I I
0.1 0.2 0.3 0.4 0.5 0.6
Transverse Crack Density, p, (mm-‘)
0.4 ;
0.0
Fig. 16. Normalized stiffness versus transverse crack density for symmetric specimens.

Transverse cracking of glass-fibre/epoxy-resin laminates 1523
g l.\ . . .._. -.......__,__ ..-...._ n ------.
cn * 0.7-
-._
'-
i 0.61 j-1 ..-..-...w..--..-----*..v
0.5 -
I I f I I 0.0 0.1 0.2 0.3 0.4 0.5 0.6
Transverse Crack Density, p, (mm-‘)
Fig. 17. Normalized stiffness versus transverse crack density for unsymmetric specimens.
The time effect can be eliminated by plotting the number of transverse cracks versus the measured strain.
Figure 19 is the number of transverse cracks versus measured strain for a [ f 4.5/90Js specimen tested in load control. It is the same specimen as in Fig. 15 which showed three curves when the number of transverse cracks was plotted against applied stress. When the number of cracks are plotted against measured strain, there is only one curve (Fig. 19). This indicates that the number of transverse cracks occurring during a load controlled test is uniquely determined by the measured strain. This behaviour was present in all load controlled tests.
5.3 Characteristic damage state Highsmith and Reifsnider’ have proposed the exist- ence of a characteristic damage state (CDS) for transverse cracking in composite laminates. One type of CDS is a saturation crack density beyond which no cracks can develop. It is based on the assumption that insufficient load can be transferred from the constrain- ing plies to the transverse plies to induce additional transverse cracking at high crack densities.
In this investigation, the data is inconclusive with respect to the existence of a saturation crack density. Figure 9 shows the development of transverse cracking as the strain increases. From the figure, it appears that the cracks are increasing up to the final failure of the
0.-v;-+;- -.-.-.-
0 M 40 60 80 103 120 140
Stress, a, (MPa)
Fig. 18. Transverse cracks versus stress for specimen S3, [ f 45/9033s.

1524 J. W. Hoover et al.
S-
0 :: & I I I I 0.0 0.5 1.0 15 20
Measured Strain, E, (%)
Fig. 19. Transverse cracks versus measured strain for specimen Sll, [ f 4.5/90,],.
0” and 25” specimens. This would suggest that the saturation density does not exist. But for the 45” specimen, no new cracks develop after 1.6% strain (+= 2.0%) and this could be interpreted as the specimen reaching a saturation density.
5.4 Stiffness reduction In this study, plots of normalized stiffness reduction versus transverse crack density show that there are three stages involved. The three stages are shown in Fig. 16 and can be defined as follows:
1. Stage 1: pre-transverse cracking region 2. Stage 2: linear decrease region 3. Stage 3: final failure region
5.4.1 Stage 1 The first stage of the stiffness decrease occurred before any transverse cracks were observed. The decrease was as little as 0.03% (specimen SlO) and as large as 20% (specimen S9).
The existence of the Stage 1 stiffness reduction was unexpected because stiffness degradation was thought to result from transverse cracks. Initially, it was assumed that the transverse crack density was incorrect. Since the length of the observation area was less than the length of the extensometer, it was possible that some cracks were affecting the stiffness measurement but not being recorded because they were outside the counting area. In some cases, especially for unsymmetric laminates, the first cracks developed outside the counting area (45 mm) but within the extensometer gauge length (75 mm). If a stiffness observation is taken for this physical situation, the lower stiffness will correspond to the number of cracks in the observation area which is 0. However, this 0 value is not an accurate value for
average crack density within the extensometer gauge length.
Once it was known that the size of the counting area might be misleading the analysis, the length of the counting area was increased to 75 mm. The stiffness values in Figs 16 and 17 were measured with a counting area length which matched the extensometer gauge length. With this correction, the values for crack density were accurately correlated with stiffness reduction.
With the 75 mm gauge length, Stage 1 stiffness reduction was still observed. The decrease in stiffness before observable transverse cracks indicated that there were other mechanisms of stiffness reduction, e.g. subcritical damage and residual stresses.
Subcritical damage is one explanation for this type of stiffness reduction. Mok-Yeo and Bader14 and Bailey and Parvizi” claim that subcritical damage develops between 0.2 and 0.3%. They argue that laser diffraction methods can reveal this damage in laminates. The subcritical damage occurs in two forms: microcracking and microdebonding. Microcracks are small cracks in the matrix which consolidate at higher strains to produce transverse cracks. Microdebonding is the separation of fibres and matrix. If this damage were present, it might lead to the stiffness reduction of the pre-transverse cracking region.
Another source of stiffness reduction could be the presence of residual strains (Table 2). During the early stages of a test, these residual strains may relax which would contribute to stiffness reduction.
5.4.2 Stage 2 In every specimen there was a region of linear stiffness reduction. This occurred for intermediate values of crack density below 0.5 cracks mm-‘. This feature of

Transverse cracking of glass-jibre/epoxy-resin laminates 1525
the stiffness reduction curve occurred over the greatest range of crack densities. If the plots are examined carefully for this trend, the approximate linearity of the data within the second stage is quite evident.
A damage mechanics model that predicts linear stiffness reduction due to cracking has been developed by Talreja.* In this model, damage is represented by a vector field quantity. For the specific case of matrix cracking of a transverse laminate and no damage in any other plies, the model can be used to predict stiffness/damage relationships for the overall laminate. The relationship for longitudinal stiffness becomes:
El -=l-kp E:
where El/E:’ is the reduction in longitudinal stiffness, p is the transverse crack density, and k is a constant of proportionality. The constant of proportionality is determined by inserting the change in longitudinal stiffness at any given crack density, p:
Stage 3 was labeled the final failure region because the stiffness decreased due to combined failure modes within the laminate. In this region, transverse cracking is not the only damage mode and the transverse crack density does not represent the amount of accumulated damage. Therefore, transverse crack density should not be used to model Stage 3 stiffness reduction.
E, -- E:’
1
--k P
6 CONCLUSIONS
Thus, k can be determined by measuring both El/E: and p at the same point.
In this investigation, a new method was developed for counting cracks in a semi-transparent laminate. The technique was effective, simple to implement and accurate for most observations.
Talreja16 suggests that the k value should be For specimens with 0” and 25” constraining plies, the determined by measuring E,IEy at the CDS. As tests suggest that transverse cracking increases until already discussed, this investigation shows that the final specimen failure. However, some 45” constraining existence of a CDS is uncertain and that the final crack ply specimens appear to reach a maximum crack density might increase until failure. In order to use density. Thus, the evidence regarding the existence of a Talreja’s model for this data, E,IEy at the last point transverse crack saturation state was inconclusive. before failure was used to determine k. The model and Various hold time periods were utilized in order to experimental data are plotted in Fig. 20. The figure study the effect of fixed strain and stress on transverse
shows that the model underestimates the stiffness reduction that occurs at low crack densities, especially in the case of f 45” constraining layers.
5.4.3 Stage 3 The stiffness reduction of Stage 3 is identified by a large decrease in stiffness at a high crack density. This type of stiffness reduction can be seen for the less stiff constraining ply orientations f 25” and f 45”. Near final failure of these specimens, a sharp drop in stiffness is noticeable for very small changes in the transverse crack density. This occurs at high strains due to constraining ply cracking, delamination and fibre failure contributing to the damage state.
0.3 ;
0.0 I I I I I I
0.1 0.2 0.3 0.4 0.5 0.6
Transverse Crack Density, p, (mm”)
Fig. 20. Variation of the longitudinal Young’s modulus for [ f 4.5/90& and [0,/90& specimens.

1526 J. W. Hoover et al.
cracking. The load controlled tests showed that strain increased and cracks accumulated over time when the laminate was subjected to a fixed load. A major conclusion is that the number of cracks correlated well with the measured strain during a load control test. For constant strain hold-time periods, the tests showed that the number of cracks increased during periods of fixed strain. Furthermore, the number of cracks did not increase as the duration of the hold-time was increased.
Plots of normalized stiffness reduction versus transverse crack density revealed that there were three stages of stiffness reduction. Stage 1 was the pre- transverse cracking region and was a stiffness reduction which occurred before observable matrix cracks. This region occurred before the strain reached 0.5% and may be due to subcritical damage and residual stresses. Stage 2 was an approximately linear region which occurred over the largest range of crack densities and accounted for most of the stiffness reduction. Stage 3, the final failure region, occurred at large crack densities. In this region, stiffness reduction was caused by large scale delamination, fibre failure, constraining ply cracking and transverse cracking. At this stage, the extent of laminate damage cannot be represented by the amount of transverse crack damage.
ACKNOWLEDGEMENTS
This research is supported, in part, by the Natural Sciences and Engineering Research Council of Can- ada, grant A-3808. In addition, it is a pleasure to acknowledge the discussions with our colleague J. D. Wolodko.
REFERENCES
Highsmith, A. L. and Reifsnider, K. L., Stiffness reduction mechanisms in composite laminates. In Damage In Composite Materials, ASTM STP 775, ed. K. L. Reifsnider. American Society for Testing and Materials, Philadelphia, PA, 1982, pp. 103-117. Talreja, R., Transverse cracking and stiffness reduction in cross ply laminates of different matrix toughness. J. Compos. Mater., 1992,26, 1644-1663. Renard, J., Favre, J.-P and Jeggy, Th., Influence of transverse cracking on ply behavior: Introduction of a characteristic damage variable. Compos. Sci. Technol., 1993, 46,29-37.
4.
5.
6.
7.
8.
9.
10.
11.
12.
13.
14.
15.
16.
Varna, J. and Berglund, L. A., Thermoelastic properties of composite laminates with transverse cracks. J. Compos. Technol. Res., 1994, 16, 77-87. Crossman, F. W. and Wang, A. S. D., The dependence of transverse cracking and delamination on ply thickness in graphite/epoxy laminates. In Damage In Composite Materials, ASTM STP 775, ed. K. L. Reifsnider. American Society for Testing and Materials, Phil- adelphia, PA, 1982, pp. 118-139. Moore, R. H. and Dillard, D. A., Time dependent matrix cracking in cross-ply laminates. Compos. Sci. Technol., 1990, 39,1-12. Varna, J., Berglund, L. A. and Bjornberg, H., On the determination of transverse strain to failure in compos- ites. In Proc. European ConjY on Composites Testing and Standardization (ECCM-TS), ed. P J. Hogg, K. Schulte and H. Wittich. Woodhead Publishing, Cambridge, 1994, pp. 267-276. Matsuhisa, Y. and King, J. E., Effects of fibre surface treatment and test temperature on monotonic and fatigue properties of carbon fibre epoxy cross ply laminates. In Proc. 9th Int. Conf: on Composite Materials (ICCM/9), Vol. 5, ed. A. Miravete. Woodhead Publish- ing, Cambridge, 1993, pp. 145-152. Peters, I? W. M., The strength distribution of 90” plies in O/90/0 graphite epoxy laminates. .I. Compos. Mater., 1984, l&545-555. Kitano, A., Yoshioka, K., Noguchi, K. and Matsui, J., Edge finishing effects on transverse cracking of cross-ply CFRP laminates. In Proc. 9th Int. Conf on Composite Materials (ICCM/9), Vol. 5, ed. A. Miravete. Woodhead Publishing, Cambridge, 1993, pp. 169-176. Bourban, P-E., Cantwell, W. J., Kaush, H. H. and Youd, S. J., Damage initiation and development in chopped strand mat composites. In Proc. 9th Int. Conf on Composite Materials (ICCM/S), Vol. 5, ed. A. Miravete. Woodhead Publishing, Cambridge, 1993, pp. 79-86. Peters, P. W. M. and Meusemann, H., On cross-ply cracking in graphite, glass and aramid fibre-reinforced epoxy laminates. In Proc. ICCM-VI, ECCM-2, Vol. 3, ed. F. L. Mathews, N. C. R. Buskell, J. M. Hodgekinson and J. Morton. Elsevier Applied Science, London, 1987, pp. 3508-3525. Hoover, J. W., Kujawski, D. and Ellyin, F., Transverse Cracking of Symmetric and Unsymmetric Glass Fibre/E- poxy Resin Laminates. University of Alberta Depart- ment of Mechanical Engineering Report No. 100, 1996. Mok-Yeo, B. L. and Bader, M. G., Sub-critical damage in glass fibre/epoxy-resin laminates: Use of laser diffraction and CLSM techniques. In Proc. ICCM-10, Vol. 5, ed. A. Poursartip and K. N. Street. Woodhead Publishing, Cambridge, 1995, pp. 357-372. Bailey, J. E. and Parvizi, A., On fibre debonding effects and the mechanism of transverse-ply failure in cross-ply laminates of glass fibreithermoset composites. J. Mater. Sci., 1981, 16, 649-659. Talreja, R., Transverse cracking and stiffness reduction in composite laminates. J. Compos. Mater., 1985, 19, 355-375.