transunion/media/files/t/...transunion is a leading provider of risk and information solutions ¹...
TRANSCRIPT

TransUnion
APRIL 2017
Investor Presentation

2 | © TransUnion LLC All Rights Reserved
Disclaimer
This presentation contains forward-looking statements within the meaning of the Private Securities Litigation Reform Act
of 1995. These statements are based on the current beliefs and expectations of TransUnion’s management and are
subject to significant risks and uncertainties. Actual results may differ materially from those described in the forward-
looking statements. Factors that could cause TransUnion’s actual results to differ materially from those described in the
forward-looking statements can be found in TransUnion’s Annual Report on Form 10-K for the year ended December 31,
2016, as modified in any subsequent Quarterly Report on Form 10-Q or Current Report on Form 8-K, which are filed with
the Securities and Exchange Commission and are available on TransUnion's website (www.transunion.com/tru) and on
the Securities and Exchange Commission's website (www.sec.gov). TransUnion undertakes no obligation to update the
forward-looking statements to reflect the impact of events or circumstances that may arise after the date of the forward-
looking statements.

3 | © TransUnion LLC All Rights Reserved
59%
18%
23%
USIS
International
Consumer
Interactive
30+
Countries
Global footprint with first mover advantage in
many of the world’s fastest growing markets
#1 position in India, Hong Kong, South Africa
Foundation of 90,000 data sources
20B+ records
Only scaled provider of FCRA and non-FCRA data
Large and diversified customer base
Attractive verticals in established and
emerging industries
1B+
Consumer
Files
Pioneer in alternative consumer channels
Innovative consumer offerings
65,000+
Businesses
and
Millions of
Consumers
2016 Total Revenue¹: $1.7B
TransUnion is a Leading Provider of Risk and Information Solutions
¹ Total consolidated revenue as reported, net of intersegment eliminations. Segment percentages are based on gross revenue, before intersegment eliminations (reconciliation in the appendix).
4 | © TransUnion LLC All Rights Reserved
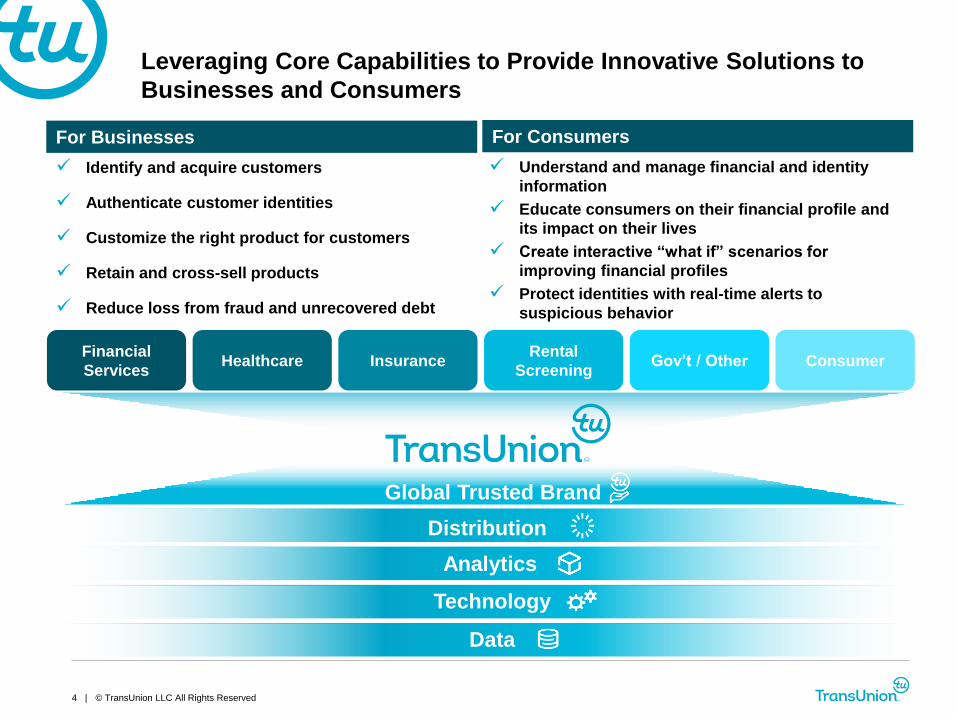
Data
Distribution
Analytics
Technology
Leveraging Core Capabilities to Provide Innovative Solutions to
Businesses and Consumers
Global Trusted Brand
Identify and acquire customers
Authenticate customer identities
Customize the right product for customers
Retain and cross-sell products
Reduce loss from fraud and unrecovered debt
Financial
ServicesHealthcare
Rental
ScreeningGov’t / OtherInsurance
Understand and manage financial and identity
information
Educate consumers on their financial profile and
its impact on their lives
Create interactive “what if” scenarios for
improving financial profiles
Protect identities with real-time alerts to
suspicious behavior
For Businesses For Consumers
Consumer

5 | © TransUnion LLC All Rights Reserved
Significant Scale in Some of the Fastest Growing Markets Globally
Canada 1 of 2 Players
Asia
Presence in Multiple
Countries with #1
Position in India and
Hong Kong
Latin
America
#1 or #2 Positions
in Multiple
Countries
Africa
Presence in 10
Countries with #1
Position in
South Africa
Represents TU presence
Note: Position represents risk and information solutions market share based on company estimates.

6 | © TransUnion LLC All Rights Reserved
TransUnion’s Business Model is Powerful
Contributory, Unique and Massive Data
Characteristics Benefits
Scalable Platform and Solutions
Next-Generation Technology
and Analytics
Mission-Critical SolutionsLong-Term Relationships and
Significant Recurring Revenue
Powerful and Extensible Data Sets
with Significant Barriers to Entry
Solutions Applicable Across Many
Verticals and Geographies
Cost, Time to Market, and
Innovation Advantages

7 | © TransUnion LLC All Rights Reserved
Strategic Investments Driving Transformation and
Substantial Momentum
Transformation
Built Strategic Growth Portfolio
Expanded Breadth and Depth of Data
Broadened Markets and Geographies
Served
Built Multiple New, Innovative and
Differentiated Solutions
Made Impactful Acquisitions
Implemented Next-Generation
Technology and Analytics
Substantial Momentum
Differentiated Solutions
Emerging Verticals
Geographic Footprint
CreditVision, CreditVision Link,
CreditView, Fraud & ID Management
Healthcare, Insurance,
Government
Consumer Reach
Pioneer of alternative channels
Asia Pacific, Latin America,
Africa

8 | © TransUnion LLC All Rights Reserved
$1,305
$1,507
$1,705
2014 2015 2016
$454
$527
$637
2014 2015 2016
$ in millions
Strong Financial Performance
$ in millions
+31%1
Adj. EBITDA
Margin %34.8% 35.0% 37.3%
Revenue Adjusted EBITDA
¹ Growth rates reflect 2016 results vs. 2014 results.
+40%1

9 | © TransUnion LLC All Rights Reserved
Well-Positioned to Capitalize on Multiple Growth Strategies
Further
Penetrate
Existing
Verticals
Enter New,
Adjacent
Verticals
Expand
International
Presence
Continue to
Broaden
Reach in
Consumer
Market
Pursue
Strategic
Acquisitions
Data, Technology
and Analytics

10 | © TransUnion LLC All Rights Reserved
Attractive Financial Model
Strong Organic Growth
Significant Recurring Revenue
Premium Margin Profile
High Operating Leverage and Scale Efficiencies
Capital Efficient Model with High FCF Conversion

11 | © TransUnion LLC All Rights Reserved
2016 USIS Revenue¹
(59% of Total)
2016 International Revenue¹
(18% of Total)
2016 Consumer Interactive Revenue¹
(23% of Total)
Online Data Services
65%Marketing Services
15%
Decision Services
20%
35%65%
100%
Developed
MarketsEmerging
Markets Consumer
Interactive
Revenue Model Supported by Distinct Operating Platforms
Across Segments
$812
$924
2014 2015 2016
$258 $270
$314
2014 2015 2016
$294
$370
2014 2015 2016
1 Gross revenue, before intersegment eliminations (reconciliation in the appendix). 2 The second figure is constant currency (average of 2015 and 2016 constant currency growth rates).3 Growth rates reflect 2016 results vs. 2014 results.
$ in millions $ in millions $ in millions
$1,045$407

12 | © TransUnion LLC All Rights Reserved
$303 $328 $338 $336
$353 $379 $389 $386
$406 $426 $438 $436
$455
$250
$300
$350
$400
$450
$500
Q1-14 Q2-14 Q3-14 Q4-14 Q1-15 Q2-15 Q3-15 Q4-15 Q1-16 Q2-16 Q3-16 Q4-16 Q1-17
0%
Quarterly Adjusted EBITDA
Quarterly Revenue
$95
$116 $126
$116 $115
$135 $140 $137 $141
$159 $167 $169 $172
$80
$100
$120
$140
$160
$180
Q1-14 Q2-14 Q3-14 Q4-14 Q1-15 Q2-15 Q3-15 Q4-15 Q1-16 Q2-16 Q3-16 Q4-16 Q1-17
$ in millions
$ in millions
Continued Momentum Validated by Recent Quarterly Results
YoY
growth
12% 16% 16%
15%4% 9% 13% 15% 15%16%16%
20% 16%
15%
11% 23%18% 18%
12%
19% 21%
13%12% 12%
24%YoY
growth

13 | © TransUnion LLC All Rights Reserved
$0
$150
$300
$450
Q1 2016 Q1 2017
USIS International Consumer Interactive
$ in millions
• Revenue increased 14% in Q1 2017 vs. Q1 2016
• Growth driven by Financial Services, Healthcare,
Insurance, Diversified Markets, and Rental
Screening verticals
USIS
• Revenue increased 16% on a constant currency
basis in Q1 2017 vs. Q1 2016
• Driven by solid growth in both Developed and
Emerging Markets
International
• Revenue decreased 1% in Q1 2017 vs. Q1 2016
• Results aligned with expectations due to a new
agreement with one channel partner and acquisition
of another partner by a competitor
Consumer Interactive
Revenue1 Commentary
Strong First Quarter 2017 Performance
Adjusted EBITDA and Margin
$141
$172
$0
$50
$100
$150
$200
Q1 2016 Q1 2017
Adj. EBITDA
Margin %34.8% 37.7%
$ in millions
$471$421
1 Gross revenue, before intersegment eliminations (reconciliation in the appendix).

14 | © TransUnion LLC All Rights Reserved
Invest in Organic
Growth InitiativesDebt Repayment Acquisitions Dividends
Share
Repurchases
Highly Efficient Balance Sheet and Strong Free Cash Flow
Enables Financial Flexibility
Net Debt / Adjusted EBITDA Ratio
$39
$199
$266
$0
$50
$100
$150
$200
$250
$300
2014 2015 2016
Adjusted Free Cash Flow1
$ in millions
Strong Free Cash Flow Provides Financial Flexibility
6.2x
4.4x
3.4x
1.0x
3.0x
5.0x
7.0x
2014 Q2 2015PF IPO
Q1 2017
1 Free Cash Flow figures adjusted to exclude capex related to Project Spark and HQ renovations (reconciliation in the appendix).

15 | © TransUnion LLC All Rights Reserved
TransUnion has a Differentiated Value Proposition
Data
Key Growth
Geographies
Technology
and Analytics
Growth Initiatives
Portfolio
Consumer
Only scaled provider of both FCRA and
non-FCRA data
#1 positions¹ in high-growth markets such as
India, Hong Kong, South Africa
Next-generation technology platform
and analytics capabilities
CreditVision, DriverRisk,
CreditView, eScan
Innovative consumer offerings and pioneer in
alternative consumer channels
Attractive VerticalsUniquely positioned in fastest growing verticals:
Insurance, Healthcare
TransUnion Differentiation
Strong revenue growth, margin expansion, and high free cash flow generation
¹ Position represents risk and information solutions market share based on company estimates.
III. Appendix
17 | © TransUnion LLC All Rights Reserved
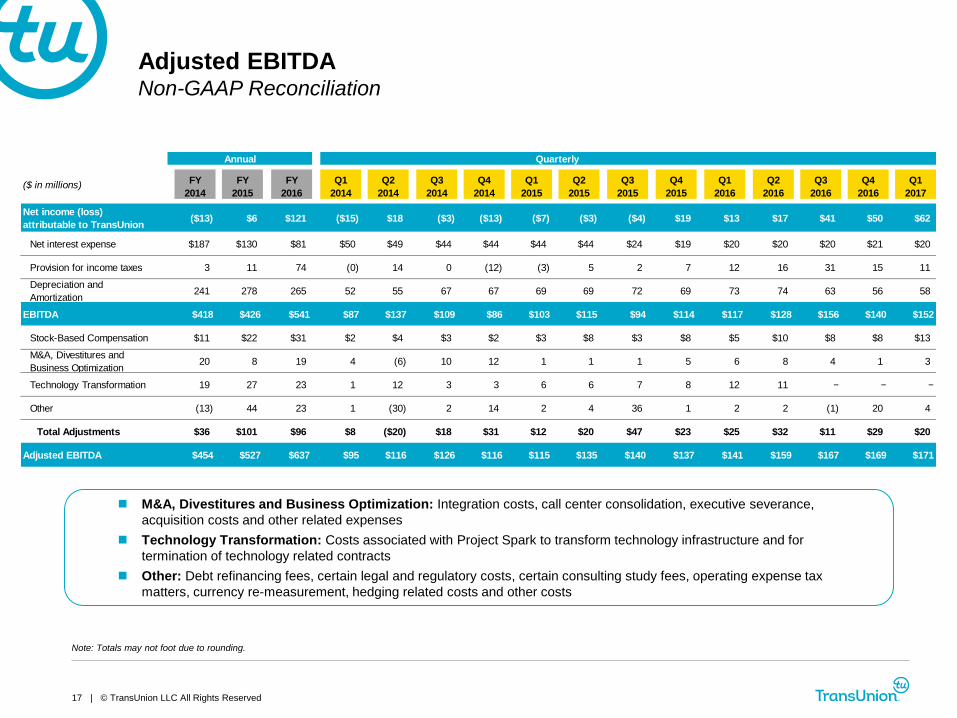
Adjusted EBITDANon-GAAP Reconciliation
M&A, Divestitures and Business Optimization: Integration costs, call center consolidation, executive severance,
acquisition costs and other related expenses
Technology Transformation: Costs associated with Project Spark to transform technology infrastructure and for
termination of technology related contracts
Other: Debt refinancing fees, certain legal and regulatory costs, certain consulting study fees, operating expense tax
matters, currency re-measurement, hedging related costs and other costs
Note: Totals may not foot due to rounding.
($ in millions)FY
2014
FY
2015
FY
2016
Q1
2014
Q2
2014
Q3
2014
Q4
2014
Q1
2015
Q2
2015
Q3
2015
Q4
2015
Q1
2016
Q2
2016
Q3
2016
Q4
2016
Q1
2017
Net income (loss)
attributable to TransUnion($13) $6 $121 ($15) $18 ($3) ($13) ($7) ($3) ($4) $19 $13 $17 $41 $50 $62
Net interest expense $187 $130 $81 $50 $49 $44 $44 $44 $44 $24 $19 $20 $20 $20 $21 $20
Provision for income taxes 3 11 74 (0) 14 0 (12) (3) 5 2 7 12 16 31 15 11
Depreciation and
Amortization241 278 265 52 55 67 67 69 69 72 69 73 74 63 56 58
EBITDA $418 $426 $541 $87 $137 $109 $86 $103 $115 $94 $114 $117 $128 $156 $140 $152
Stock-Based Compensation $11 $22 $31 $2 $4 $3 $2 $3 $8 $3 $8 $5 $10 $8 $8 $13
M&A, Divestitures and
Business Optimization20 8 19 4 (6) 10 12 1 1 1 5 6 8 4 1 3
Technology Transformation 19 27 23 1 12 3 3 6 6 7 8 12 11 ‒ ‒ ‒
Other (13) 44 23 1 (30) 2 14 2 4 36 1 2 2 (1) 20 4
Total Adjustments $36 $101 $96 $8 ($20) $18 $31 $12 $20 $47 $23 $25 $32 $11 $29 $20
Adjusted EBITDA $454 $527 $637 $95 $116 $126 $116 $115 $135 $140 $137 $141 $159 $167 $169 $171
QuarterlyAnnual

18 | © TransUnion LLC All Rights Reserved
Annual
($ in millions) 2014 2015 2016
Cash from Operations $154 $309 $390
Less: Capital Expenditures (155) (132) (124)
Plus: Project Spark and HQ Renovations1 40 22 -
Free Cash Flow $39 $199 $266
Free Cash FlowNon-GAAP Reconciliation
Note: Totals may not foot due to rounding.
1 Project Spark capital expenditures are excluded from capital expenditures since we completed the transformation of our technology platform in the first half of 2016. Corporate headquarters renovation
capital expenditures are excluded from capital expenditures since we completed the improvements to our corporate headquarters facility in the first half of 2015.
19 | © TransUnion LLC All Rights Reserved
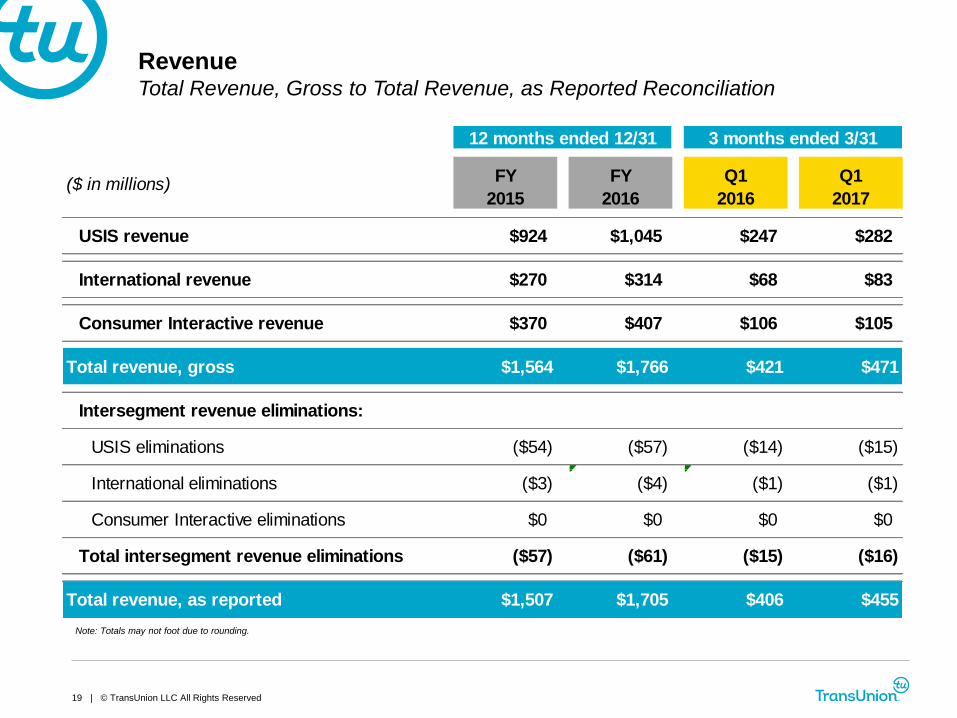
RevenueTotal Revenue, Gross to Total Revenue, as Reported Reconciliation
Note: Totals may not foot due to rounding.
($ in millions)FY
2015
FY
2016
Q1
2016
Q1
2017
USIS revenue $924 $1,045 $247 $282
International revenue $270 $314 $68 $83
Consumer Interactive revenue $370 $407 $106 $105
Total revenue, gross $1,564 $1,766 $421 $471
Intersegment revenue eliminations:
USIS eliminations ($54) ($57) ($14) ($15)
International eliminations ($3) ($4) ($1) ($1)
Consumer Interactive eliminations $0 $0 $0 $0
Total intersegment revenue eliminations ($57) ($61) ($15) ($16)
Total revenue, as reported $1,507 $1,705 $406 $455
12 months ended 12/31 3 months ended 3/31