transportation to connect your whole community
TRANSCRIPT

Transportation to Connect
Your Whole Community
2019 Priest Lake Conference
American Planning Association
Washington Chapter
Inland Empire Section

2

3

4
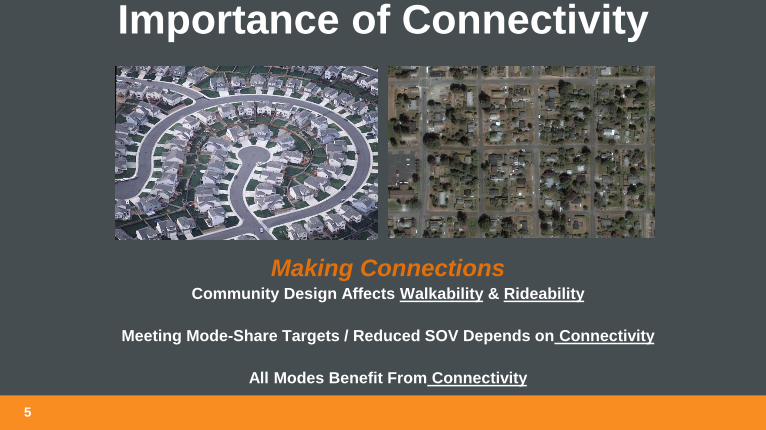
Making ConnectionsCommunity Design Affects Walkability & Rideability
Meeting Mode-Share Targets / Reduced SOV Depends on Connectivity
All Modes Benefit From Connectivity
Importance of Connectivity
5

• Tangible benefits of better connected communities.
• Effective policy and development guidelines that require
high quality connectivity in new, private developments.
• Challenges crafting local plans that help redefine poorly
connected neighborhoods.
• Structuring local transportation plans to emphasize
equitable access and connectivity.
Connectivity
6

• Incorporating state policy that encourages connected
community into your local plan
• Developing local policies that guide connected
communities (Complete Streets, development code,
mapping connectivity gaps, Safe Routes to School)
• Measuring multimodal network connectivity – national
best practices
• Applying mapping techniques that effectively integrate
principles of equity in local transportation plans
Learning Objectives
7

Transportation & Land Use
Benefits of Connected Community
8

Benefits of Improved Connectivity
Central City block pattern
Inner neighborhood block pattern
Newer block patterns
Well-connected neighborhoods tend to have…….
Lower levels of vehicle travel and emissions per capita, and
higher levels of walking, bicycling and transit use.
Greater street route options with higher quality and more
efficient emergency medical, fire and police response.
With greater route options….lower average vehicle travel speeds
and lower severity of vehicle, pedestrian and bicycle crashes.
Increased access to recreational facilities and increased rates of
physical activity (Active Transportation), with lower rates of obesity, heart
disease and diabetes.
Higher land values.
Po
orl
y C
on
ne
cte
dW
ell
Co
nn
ect
ed
Hig
hly
Co
nn
ect
ed
9

California Cities Study
10 Source: Wesley Marshall and Norman Garrick
Street network, Safety, Sustainability
And Active Living in 24 medium sized California
cities
Cities selected to represent a range of
traffic safety level

Better Travel Safety
Street network characteristics influence safety
• 24 California cities: safer and less safe
• Safer cities have reduced rates of severe and fatal crashes
• Safer cities have greater street and intersection density per sq mile
• Underlying factor may be lower vehicle speeds
Source: Street network types and road safety: A study of 24 California cities
Wesley Marshall and Norman Garrick, April 2010
11

Better Travel Safety
Source: Wesley Marshall and Norman Garrick
Characteristic
Safer
Cities
Less
Safe
Cities
Percent
Difference
Average year of incorporation 1895 1932
Average year of block development 1957 1972
Population (2000 Census) 65,719 58,845 -8.9
Real intersection density (per sq mi) 106.2 62.7 -41.0
Average block size (acres) 18.2 34.5 89.6
Link to node ratio 1.34 1.29 -3.7
Fatal crashes 3.1 10.1 225.8
Fatal crashes not on limited access highways 2.3 8.6 273.9
Source: Wesley E. Marshall and Norman Glick, Street Network Types and Road Safety: A Study of 24
California Cities
safe less safe
• Better connected cities are
safer
• Intersection Density (better
measure) & Link-Node
Ratio
• Both measures – difficult
for people to understand
intuitively
12

Higher Mode-Share
Street network patterns influence mode choice
• Street network patterns: connectivity and density
• Connected dense street networks have higher walk, bike and transit mode-share
• Intersection density associated with greatest increases rates of walking and biking
• Model indicated:
Increased intersections from 81 to 324 per sq mile would lead
Walk/Bike combined mode share increases from 3.2% to 7.8%
Source: The Effect of Street Network Design on Walking and Biking
Wesley Marshall and Norman Garrick, November 2009
13

San Mateo
2%
9%
3%
1%
4%
1%
2%
9%
6%
Connectivity & Mode-Share
Source: Wesley Marshall and Norman Garrick
Grid
Tributary
Percentage of People Walking, Biking or Taking Transit to Work
Better connected cities have higher walk and bike work trips
14

Transit Productivity
15 Pedestrian Network Analysis Study

Transit Productivity
16 Pedestrian Network Analysis Study

Greater Active Living
Source: Wesley Marshall and Norman Garrick | interim results17

Transportation & Land Use
Policy Guide to Better Connectivity
18

Policy & Development Guide – New Dev
19
Neighborhood Pattern & Design – NPD▪ Walkable Streets
▪ Compact Development
▪ Connected and Open Community
IntentTo promote projects that have high levels of internal connectivity and are well connected to
the community. To encourage development within existing communities that promote
transportation efficiency through multimodal transportation. To improve public health by
encouraging daily physical activity.
Surrounding Connectivity - Locate the project such that the connectivity within ¼ mile (400
meters) of the project boundary is at least 90 intersections per square mile
Internal Connectivity - Design and build the project such that its internal connectivity is at
least 140 intersections per square mile.

Block Length and Perimeter
20
Access and Connectivity
Vehicle, pedestrian, and bicycle access is addressed in Article 27, Access. Vehicle access requirements, specifically minimum distances between driveways and intersections, are established in Subsection 27.121(11)(c). Modifications to these requirements may be granted by the City Engineer. Joint access at a common property line is encouraged, and in some cases may be required (Subsection 27.121(11)(g).
Section 27.122 is dedicated to connectivity standards. Maximum block length and block perimeters are set in this code section, as well as mid-block pedestrian and bicycle access way requirements for blocks over 600 feet long.
Section 27.330 establishes standards for Pedestrian Connector Routes. The development review body is authorized to require a pedestrian connection (access way) when a street connection is not provided, as well as in cases where “the route is necessary to continue existing or potential pedestrian or bicycle circulation routes, or to provide access to a special feature such as a school or transit station (Subsection 27.330(9)).”
Similarly, standards related to cul-de-sacs and dead-end streets in Subsections 27.122(3), 27.123(1), and 27.332(6) state that these type of streets shall be limited and an access way may be required to connect them to other transportation facilities.
Design standards for Pedestrian Connector Routes (access ways) are found in Section 27.333.
There are no standards for pedestrian/bicycle circulation and access within a development site, or between a development site and adjacent development or transportation facilities in Article 27.
Access to transit stops and requirements for improving transit stops in coordination with transit service providers are not specified in the Development Code.
Other code requirements partially address “active” transportation needs. Standards in the Central Business District require that buildings be set back no more than 10 feet from the property line and that the main entrance be oriented to the street or a pedestrian-oriented space (Subsection 12.256(3)). Conditions that may be imposed with site plan approval, specified in Sections 19.043 and 19.053, include locating buildings and uses close to each other and to public rights-of-way, pedestrian ways, and or bikeways; and provision of on-site pedestrian ways to connect uses on a site, to public right-of-way, and/or to an abutting site.
Block Length Local & Collector Streets 600 feet
Perimeter Block Length Local & Collector Streets 1,800 feet
Pedestrian / Bicycle Access Way Provided at Mid-block
where block length is
greater than
600 feet
Implications for Grants Pass TSP
Update
Access to transit stops and requirements for improving transit stops in coordination with transit service providers are not specified in the Development Code. These provisions can be addressed in Task 5.1 - development code amendments during the implementation phase of this TSP update process.

Example Complete Streets PolicyThe safety and convenience of all users of the transportation system including pedestrians, bicyclists, transit users, freight, and motor vehicle drivers shall be accommodated and balanced in all types of transportation and development projects and through all phases of a project so that even the most vulnerable – children, elderly, and persons with disabilities – can travel safely within the public right of way.
Examples of how the complete streets policy may be implemented:• Design and construct right-of-way improvements in compliance with ADA accessibility guidelines. • Incorporate features that create a pedestrian friendly environment, such as
o narrower traffic lanes o median refuges o curb extensions ("bulb-outs") o count-down pedestrian signals
• Improve pedestrian accommodation and safety at signalized intersections by: o using good geometric design to minimize crossing distances and increase visibility between pedestrians and
motoristso timing signals to minimize pedestrian delay & conflicts o balancing competing needs of vehicular level of service and pedestrian safety (e.g., 2007 version of MUTCD to
reduce design walking speed from 4 ft./sec. to 3.5 ft./sec.) • Reclaim street space for other uses through the use of "road diets" (e.g., convert four-lane roadway to three-lane
roadway with marked bike lanes)
21
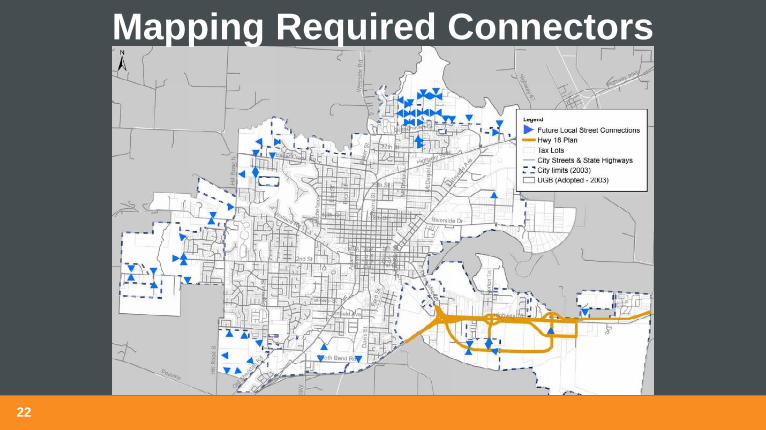
Mapping Required Connectors
22

Mapping Major Streets Plan
23

Concurrency Refinement Planning
24
• Refine Non-Motorized Plans to Include Priority Bike and Ped System Improvements, Including Pedestrian Crossing and Neighborhood Connector Projects as Concurrency Mitigation
• Integrate Street and Non-Motorized Connectivity Indices with Percent Complete Measures as Thresholds for Non-Motorized Person-Trip Credits
• Consider TDM and Transit Capital Projects for Concurrency Mitigation

Transportation & Land Use
Measuring Connectivity
25

Comparing Connectivity Metrics
Intersection Density doesn’t measure local
connections or reflect pedestrian system barriers
RDI measures local connections and
impact of pedestrian system barriers
Intersection Density Route Directness Index
26

What is Route Directness Index?
straight-line distance “A”
B
RDI = A / B
Aactual route distance “B”
27

RDI = 0.20 RDI = 0.83
RDI Applied - Neighborhood Example
28

Sample City: Variation in RDI
29

Davis, California
30
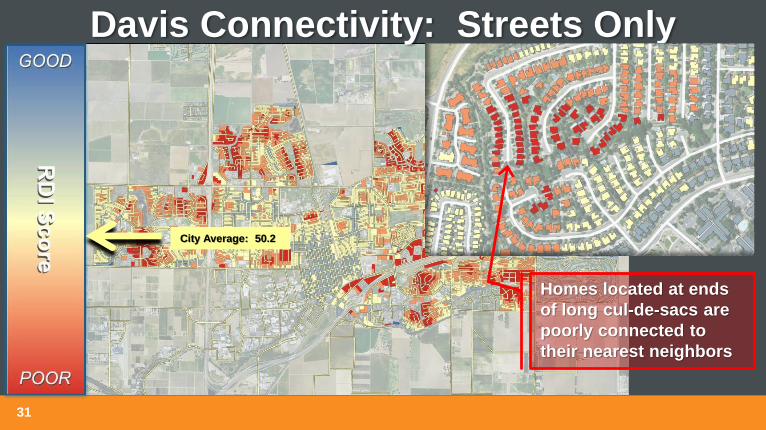
Davis Connectivity: Streets Only
City Average: 50.2
Homes located at ends
of long cul-de-sacs are
poorly connected to
their nearest neighbors
31

Davis Connectivity: Streets & Pathways
City Average: 56.8
Neighborhood
Connectivity vastly
improved with pathway
network
32

Davis Connectivity: Impact of Pathways
33

Pedestrian Connectivity Analysis
34
100%
74%
84%
74%
26%
16%
22% 5%
0% 20% 40% 60% 80% 100%
State Highway…
Arterial…
Collector…
Local…
Full sidewalk (both sides)
Partial sidewalk
No sidewalk (both sides)
Intersection Density
Route Directness
Network Completeness
Level of Traffic Stress

Pedestrian Connectivity Analysis
35
34%StreetlightCoverage
Driver did not yield
79%
Pedestrian
i l legally in road6%
Other6%
Reckless Driving
6%
Speeding3%
0
5
10
15
20
25
30
20 25 30 35 40+
Posted Vehicle Speed Limit
+ Improve pedestrian visibility along 6th Street and 7th
Street+ Enhance G St/3rd St pedestrian crossings and traffic
control+ Consider development code revision - require
additional east-west street grid connections near the Rogue River
+ Prioritizing new sidewalks with appropriate buffering and new street lighting along:
Lighting Coverage
Access
Safety
Key Findings

Pedestrian Connectivity Analysis+ Priority sidewalk, additional buffering and street lighting
improvements (city-wide)
+ Refining the land development code to require additional
east-west street grid connections near the I-5 Exit 58
interchange if/when re-developed (NW & NE)
+ Evaluate/identify east-west street corridor with pedestrian
pathway/cycle track connection between eastern city
boundary and central city (with cross-river links to Baker
Park)
+ Evaluate/identify new, east-west street corridor options with
pedestrian pathway/cycle track connection between the
western and eastern city boundaries, south of US 199 and
OR 99
+ Evaluate/identify new non-motorized bridge connection to
southwest neihgborhoods

Priority Bus Stop ConnectivityPotential Ridership Built Environment
HH Income (Low) Housing Density Measured Walk
Connectivity (Poor)
Priority Stop Plan:
Improve Connectivity
Ped-Bike Crash History
(re-assigned summary by
individual bus stop)
Walk
-Tra
nsit
Barr
iers
Next Step:
Local Pedestrian Plan Refinement
and Implementation
✓ Sidewalk Coverage/Inventory
✓ ADA Transition PlanCentral Contra
Costa County37

Identify Walk Barriers
38

Transit Station Connectivity
39

Transportation & Land Use
Emphasizing Equity
40

Equity in Transportation Planning
https://www.vtpi.org
Social/Environmental Justice
• Housing affordability
• Impacts on low-income
communities
• Fare structures
• Access to employment
• Public transportation service
quality in lower income
communities
Mobility Need And Ability
• Universal design
• Special mobility services
• Disabled parking
• Service quality for non-drivers
A fair or equitable distribution of transportation benefits and cost…..
41

Equity – Mapping Vulnerable Populations
42
Transit Equity IndexSingle - Head of HH Limited English Elderly Non-White/
Non-Hispanic
Poverty Foreign Born Youth
This? Or This?

Transit Equity Index
43
People of Color Low Income Population*
Limited English Proficiency Senior Population
Youth Population People with Disabilities
Limited Vehicle Access Low and Medium Wage Jobs
Affordable Housing Units Key Retail/Human/Social
Services
‘* Persons Reporting Income Below 200% of Federal Poverty Level

Transit Equity – ACS-Based Data
44
1. Relevant ACS data is complied in Excel for
the entire state or region (at the block group
level)
2. Simple data organization and calculations -
one time in Excel
3. Excel sheets are input into GIS Model and
scored automatically for user-specified areas
(e.g., State, County, City, District)
GIS Model will normalize ACS data for
the given area and assign scores of 0-4
for each index component, for each
block group according to the chart at
right
-3 -2 -1 0 1 2 3
0 1 2 3 4
Std. Dev. from mean
Equity Score

Region
45
Low Income
Population*Senior Population
Youth PopulationPeople with
Disabilities
Limited Vehicle
Access
‘* Persons Reporting Income Below 200% of Federal
Poverty Level
A Transit Equity Index scoring regimen
should include measures of Low
Income Populations summarized by
individual Census block groups. Five or
perhaps more factors can be
normalized, scored and integrated into
the Index to describe and identify
locations of high concentrations of Low-
Income Populations for the region.
U.S. Census; American Community Survey: 2012-2016
-3 -2 -1 0 1 2 3
Equity Score 0 1 2 3 4
Std. Dev. from mean

Spokane
46
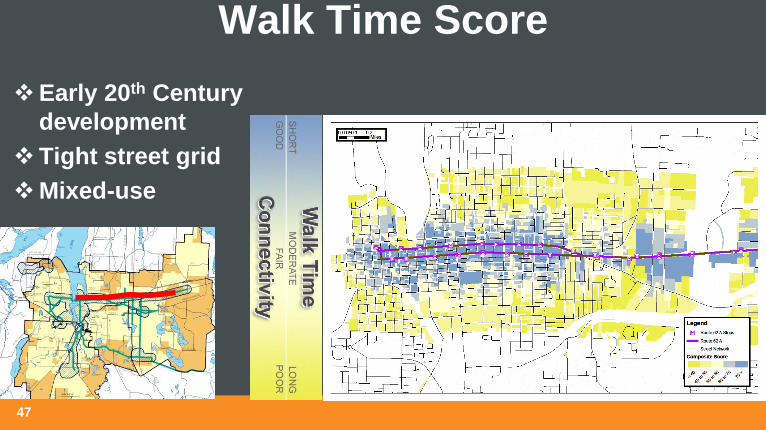
Walk Time Score
❖Early 20th Century
development
❖Tight street grid
❖Mixed-use
47

Area 3: Composite RDI / Walk Time Score
90
48

Area 2: Composite RDI / Walk Time
Score
Pedestrian Barrier: Poor Street Connectivity & Auto-Oriented Access Design49

Area 2: Poor Street Network Design
96
96
50

Area 2: Impact of City Bike Plan Priority
Prioritizing City Plan: New Shared-Use Path Connectors
90
90
51

Connected Centers – Jade District
D I V I S I O N S T
82
ND
A
VE
P O W E L L B L V D
C L I N T O N S T
B R O O K LY N S T
87
TH
AV
E
90
TH
PL
92
ND
AV
E
§̈¦205
W O O D A R D S T
T I B B E T S S T
C L I N T O N S T
G R A N T S T
L I N C O L N S T
H A R R I S O N S TH A R R I S O N S T
89
TH
AV
E
L A FAY E T T E S T
87
TH
AV
E
85
TH
AV
E
PortlandCommunity
College
Harrison
Park ES
GraceLutheran
88888
88888
CommercialResidential
Built before 1950
1951 to 1970
1971 to 1990
1991 to 2010
Built after 2010
Building Age
Legend
General Zoning Designations
Commercial Zone
Residential Zone
Other Zoning Designation
Building Age
54

Connected Centers – Jade District
I-20
5Tra
i l
PortlandCommunity
College
Harrison
Park ES
GraceLutheran
§̈¦205
85
TH
AV
E
87
TH
AV
E
L A F AY E T T E S T
89
TH
AV
E H A R R I S O N S TH A R R I S O N S T
L I N C O L N S T
G R A N T S T
C L I N T O N S T
T I B B E T S S T
W O O D A R D S T
92
ND
AV
E
90
TH
PL
87
TH
AV
E
B R O O K LY N S T
C L I N T O N S T
P O W E L L B L V D
82
ND
A
VE
D I V I S I O N S T
Route 4
Route 9
Green MAX Line
Rout
e 72
Other Features
J2 Green MAX Line
! ! ! ! ! ! ! ! ! !
Half Mile Buffer fromLight Rail Station
Light Rail
!!!!
250 to 500Up to 50 50 to 100 100 to 250
"@ Bus Route 4
"@ Bus Route 9
"@ Bus Route 72
Bus Routes and Boardings
Parks and/orNatural Areas
School
Place of Worship
Transit System
55

Connected Centers – Jade District
Separated in Roadway
Shared Roadway
Trail
Active/Planned Recommended
Parks and/or Natural Areas
School
Place of Worship
Traffic Control
Bike Network
"! @
@
Rapid Flashing Beacon
Pedestrian and Bicycle Crossing
Pedestrian Bridge
Pedestrian and Bicycle Bridge
Bicycle System
56

Connected Centers – Jade District
Sidewalk
Trail
Active/Planned Recommended
Other Features
Parks and/or Natural Areas
School
Place of Worship
Traffic Control
Sidewalk Network
èéëìí Traffic Signal
"! @
@
Rapid Flashing Beacon
Ö Speed Bump
Crosswalk
Pedestrian and Bicycle Crossing
Pedestrian Bridge
Pedestrian and Bicycle Bridge
Pedestrian System
57

Connected Centers – Jade District
Route Directness Index
58

Connected Centers – Jade District
Intersection Density
59

Connected Centers – Jade District
Barriers
60
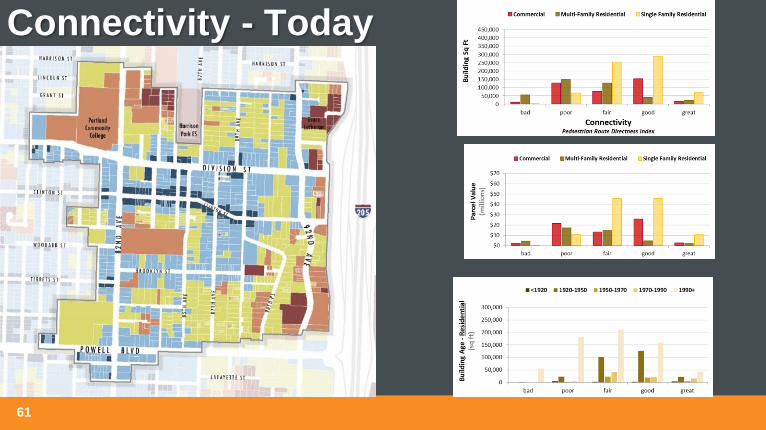
Connectivity - Today
61

Connectivity - Plan
62

61
Public Street Connector Phase 1
✓ Interim Driveway within public rights-
of-way.
✓ Narrow street space shared by site-
generated cars, bicycles and
pedestrians.
✓ Interim signing for shared street space.
✓ No through connection.
✓ Buffer strip with Green Street
drainage, lighting and street tree
features.

62
Public Street Connector Phase 2Phase 2
✓ Partially completed Public Street
and sidewalk within public rights-
of-way added with new
development.
✓ Through-connection for
pedestrians and bicyclists only -
barricades to prohibit vehicle
through-traffic.
✓ Buffer strip with Green Street
drainage, lighting and street tree
features.
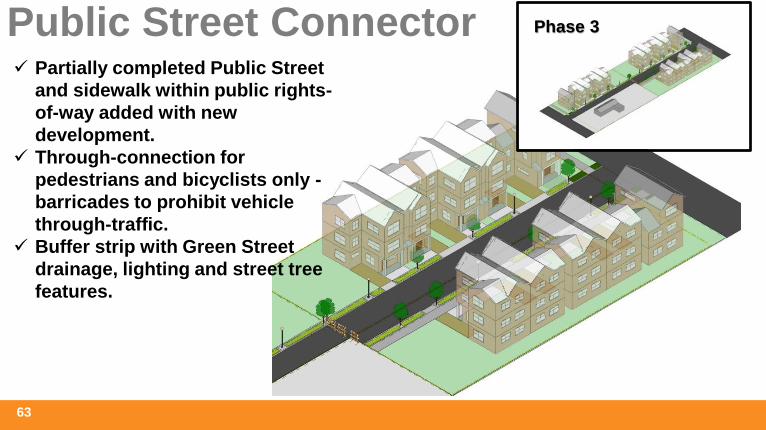
63
Public Street Connector✓ Partially completed Public Street
and sidewalk within public rights-
of-way added with new
development.
✓ Through-connection for
pedestrians and bicyclists only -
barricades to prohibit vehicle
through-traffic.
✓ Buffer strip with Green Street
drainage, lighting and street tree
features.
Phase 3

64
Public Street Connector✓ Completed Public Street and
sidewalk added with new
development.
✓ Interim signing and barricades
removed – through-connection
for all modes.
Phase 4
Planning Partners: Denver Igarta, PBOT Complete Street Program Manager / Jacob Niger,Toole Design