transportation research recordonlinepubs.trb.org/onlinepubs/trr/1992/1373/1373.pdf · mundy reports...
TRANSCRIPT

TRANSPORTATION RESEARCH
RECORD No. 1373
Aviation
Airport Landside Planning and
Operations
A peer-reviewed publication of the Transportation Research Board
TRANSPORTATION RESEARCH BOARD NATIONAL RESEARCH COUNCIL
NATIONAL ACADEMY PRESS WASHINGTON, D.C. 1992
Transportation Research Record 1373 Price: $17.00
Subscriber Category V aviation
TRB Publications Staff Director of Reports and Editorial Services: Nancy A. Ackerman Senior Editor: Naomi C. Kassabian Associate Editor: Alison G. Tobias Assistant Editors: Luanne Crayton, Norman Solomon,
Susan E. G. Brown Graphics Specialist: Terri Wayne Office Manager: Phyllis D. Barber Senior Production Assistant: Betty L. Hawkins
Printed in the United States of America
Library of Congress Cataloging-in-Publication Data National Research Council. Transportation Research Board.
Airport landside planning and operations. p. cm.-(Transportation research record ISSN 0361-1981;
no. 1373) "A peer-reviewed publication of the Transportation Research
Board." ISBN 0-309-05415-X 1. Intra-airport transportation. I. National Research Council
(U.S.). Transportation Research Board. II. Series: Transportation research record; 1373. TE7.H5 no. 1373 [TL725.3.16] 388 s-dc20 [629.136]
92-43573 CIP
Sponsorship of Transportation Research Record 1373
GROUP 1-TRANSPORTATION SYSTEMS PLANNING AND ADMINISTRATION Chairman: Sally Hill Cooper, Virginia Department of
Transportation
A via ti on Section Chairman: George W. Blomme, Port Authority of New York and
New Jersey
Committee on Airport Landside Operations Chairman: Greig W. Harvey, Deakin Harvey Skabardonis Inc. Secretary: Peter B. Mandie, Peat Marwick Main & Co. Ronald E. Ahlfeldt, John S. Andrews, Norman Ashford, Winfield S. Beyea, George W. Blomme, William E. Brougher, James A. Doyle, Norman J. Faramelli, Geoffrey D. Gosling, Salah G. Hamzawi, Walter Hart, Dean Hobson, Bradley T. Jacobsen, Andrew C. Lerner, Francis X. McKelvey, S. A. Mumayiz, Elisha Novak, Prianka N. Seneviratne, Vojin Tosic, S. C. Wirasinghe
Larry Jenney, Transportation Research Board staff
The organizational units, officers, and members are as of December 31, 1991.

Transportation Research Record 1373
Contents
Foreword
Toronto Island Airport Access Julius Gorys and Alan Paul
Dynamic Capacity of Airport Enplaning Curbside Areas Mahmoud S. Parizi and John P. Braaksma
Evolution of Ground Transportation Management as a Major Airport Function Ray A. Mundy
Public Transportation for Airport Employees: Q3 Extension into John F. Kennedy International Airport Daniel K. Boyle and Paul R. Gawkowski
Planning of Parallel Pier Airport Terminals with Automated People Mover Systems Under Constrained Conditions S. C. Wirasinghe and S. Bandara
v
1
8
17
26
35


Foreword
The papers in this Record examine various aspects of airport landside operations: airport access, vehicular flow at the terminal building curbside, management of ground transportation, extension of public transportation to airports, and automated people mover systems. The theme that runs through these research efforts is that airports are multimodal transportation hubs that are as dependent on surface transportation as they are on air transportation for their efficient operation.
Gorys and Paul describe the operational costs of Toronto Island Airport, a site accessible only by ferry. They examine issues and concerns with respect to the situation and function of the airport itself and assess alternative means of access.
Parizi ·and Braaksma develop a method to calculate the dynamic vehicular capacity of the curbside in the enplanning area of airport passenger terminals. This method is used to estimate how drivers' preferences for parking space and terminal building doors in the unloading area affect traffic distribution and practical dynamic curbside capacity.
Mundy reports a survey of the organizational structure of airports-as it pertains to management of ground transportation. He concludes that although ground transportation officials have been inadequately represented in the management structure historically, there is evidence that management of landside activities is now receiving more attention and greater allocation of resources in modern airport complexes.
Airport employees typically make up a substantial fraction of the automobile travelers to and from a large metropolitan airport. Boyle and Gawkowski describe the success of a New York City bus route extension in attracting ridership by employees of John F. Kennedy International Airport. Direct bus service to the airport, combined with free transfer privileges, has created a stable ridership base within a large bus transit service area.
Automated people mover (APM) systems in large airport terminals reduce passenger walking distances and improve terminal operation. Wirasinghe and Bandara propose a method to determine an optimum APM system geometry that minimizes total system cost (monetary and passenger disutility). By means of case studies of the new Denver and the Atlanta Hartsfield airports, the authors show that the optimal terminal geometry is sensitive to the ratio of walking time to riding time, which can be interpreted as the relative disutility of walking.
v


TRANSPORTATION RESEARCH RECORD 1373
Toronto Island Airport Access
Juuus GoRYS AND ALAN PAUL
The Toronto Island Airport is a small downtown airport serving metropolitan Toronto. It is used for general aviation and limited commercial aviation activity. The airport can be accessed only by a ferry, the operational costs of which ?ave bec?me i~creasing prohibitive. Issues and concerns surrounding the airport itself and its means of access are addressed, as are recommended alternatives.
The Toronto Island Airport (TIA) is one of three principal airports serving the Toronto area. It is about l 1/2 mi, or 10 min from the central business district of Toronto (Figure 1). Est~blished in 1937, it was the major airport for Toronto until the development of Pearson International Airport (PIA) in suburban Malton. During World War II, it served as a training base for the Royal Norwegian Air Force and the Royal Canadian Air Force. It has been operated by the Toronto Harbor Commissioners (THC) since 1962, although its airport operations have been subsidized by Transport Canada, a federal agency, since 1974.
TIA is one of Canada's busiest airports in terms of aircraft movements (124,500 in 1990), consistently ranking in the top 10 (J). Indeed, in 1961, TIA had the highest number of aircraft movements of all Canadian airports. Since the advent of commercial aviation to TIA in 1983, the number of commercial air travelers using the airport each year has increased from about 20,000 to approximately 275,000 currently.
The operation of the airport is governed by a tripartite agreement signed between Transport Canada, the city of Toronto, and THC. This agreement limits airport expansion, prohibits jet aircraft, and forbids the construction of a vehicular tunnel or a bridge to the island. A ferry alone provides access to the facility.
The intent of the paper is to identify the unique circumstances surrounding the existence of this downtown airport, focusing on the costs associated with providing access (i.e., ferry service) to it, the alternatives to ferry service, and the acceptability of such alternatives.
TORONTO ISLANDS
The Toronto Islands were created by major storms more than 100 years ago from what was then a peninsula. They are separated from the mainland by a western gap that is used principally by recreational boaters and by an eastern gap that commercial ships use to access the Port of Toronto.
J. Gorys, Urban and Regional Planning Office, Ontario Ministry of Transport, 1201 Wilson Avenue, 3rd Floor, West Tower, Downsview, Ontario, Canada M3M 118. A. Paul, Works Department, Toronto Harbor Commissioners, 60 Harbor Street, Toronto, Ontario, Canada M5J 1B7.
The Toronto Islands have largely functioned as a local resort. Summer cottages and, later, year-round residences were subsequently established on the islands. Their numbers peaked in the 1950s. A program of park development by the municipality resulted in the removal of many of those homes over the next 20 years. Intense lobbying by island residents was necessary for the preservation of the homes that remain. The only means of access to the island is by boat. The parks department operates several large ferries to carry summer passengers to the island parks and provide year-:round service to the 450 or so permanent island residents. Each year the ferries carry some 1.2 million passengers at a cost of $6.5 million and a deficit of $3.4 million (Metropolitan Toronto Parks and Recreation Department and Ontario Ministry of Transport, unpublished data).
TIA sits on 820 acres at the northwestern part of the island, approximately 3 km from island residences; it is separated from the mainland by the western gap. It has three runways: one east-west runway that is 4,000 ft long and can be lit (this one is most often used), and two unlit runways that are 3,000 ft long-one east-west and one north-south. TIA's hours of operations are from 6:30 a.m. to 11:30 p.m. with customs facilities available from 8:00 a.m. to midnight.
Airside facilities have been considerably enhanced in the past few years: a microwave landing system was installed and a new air traffic control tower and maintenance building were built. The value of recent capital expenditures at the airport by the federal government exceeds $20 million.
ISLAND AIRPORT ACCESS
The distance between TIA and the mainland is about 394 ft (120 m). Access was by means of a cable ferry until 1963, when this service was abandoned and replaced by a temporary tugboat service. From 1965 to the present, a used ferry-the Maple City, which could accommodate four vehicles and 40 passengers-was deployed to meet the demand (Figure 2). The actual capacity of the ferry is determined by crew size; the ferry is now licensed by the Coast Guard to carry up to six vehicles and 100 passengers. In 1985 a second ferry (and the sister ship to the Maple City-the Windmill Point) with similar capacity was purchased as a backup vessel to ensure that service levels would not be disrupted in the event of a mechanical breakdown.
Ferry operations are done 18 hr/day (6:00 a.m. to 11:30 p.m.), 7 days a week; the ferry undertakes some 53,870 trips each year. The actual ferry trip takes less than a minute, and service is provided every 15 min. It is reportedly the shortest ferry ride in the world.

2
FIGURE 1 Regional airports in Toronto.
The Ontario Ministry of Transport has been responsible for the annual deficit for ferry operations since 1974. The rationale for its original involvement was based on
• Its support for multimodal systems such as short take-off and landing service, to be based on the island, and through job creation for associated aircraft production at a local manufacturing plant;
• Support for air ambulance service operated by the provincial Ministry of Health at TIA; and
FORT
LAKE ONTARIO
FIGURE 2 Toronto Island Airport.
TRANSPORTATION RESEARCH RECORD 1373
LAKE ONTARIO
--- FREEWAY NETWORK
• The necessity of providing a place for the off-loading of short-distance air traffic from PIA.
Use of TIA for air ambulance service has since increased because of the proximity of the airport to downtown Toronto hospitals, congestion at PIA, and congestion levels on Toronto streets and highways between suburban airports and downtown hospitals.
The Ministry of Transport contributes to the operation of 11 other ferry services in the province of Ontario to varying
FRONT ST.
TORONTO ISLAND PARKS FERRIES
Gorys and Paul
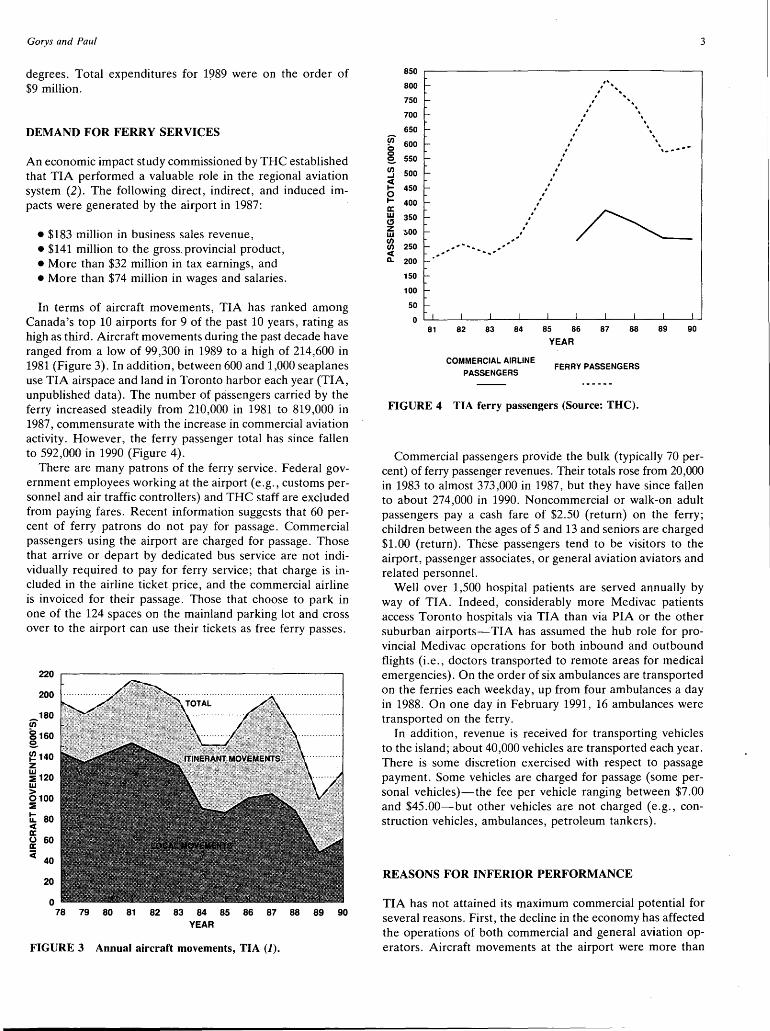
degrees. Total expenditures for 1989 were on the order of $9 million.
DEMAND FOR FERRY SERVICES
An economic impact study commissioned by THC established that TIA performed a valuable role in the regional aviation system (2). The following direct, indirect, and induced impacts were generated by the airport in 1987:
• $183 million in business sales revenue, • $141 million to the gross. provincial product, •More than $32 million in tax earnings, and •More than $74 million in wages and salaries.
In terms of aircraft movements, TIA has ranked among Canada's top 10 airports for 9 of the past 10 years, rating as high as third. Aircraft movements during the past decade have ranged from a low of 99,300 in 1989 to a high of 214,600 in 1981 (Figure 3). In addition, between 600 and 1,000 seaplanes use TIA airspace and land in Toronto harbor each year (TIA, unpublished data). The number of passengers carried by the ferry increased steadily from 210,000 in 1981 to 819,000 in 1987, commensurate with the increase in commercial aviation activity. However, the ferry passenger total has since fallen to 592,000 in 1990 (Figure 4).
There are many patrons of the ferry service. Federal government employees working at the airport (e.g., customs personnel and air traffic controllers) and THC staff are excluded from paying fares. Recent information suggests that 60 percent of ferry patrons do not pay for passage. Commercial passengers using the airport are charged for passage. Those that arrive or depart by dedicated bus service are not individually required to pay for ferry service; that charge is included in the airline ticket price, and the commercial airline is invoiced for their passage. Those that choose to park in one of the 124 spaces on the mainland parking lot and cross over to the airport can use their tickets as free ferry passes.
200
180 Ui 81so e. ~140 z ~ 120 UJ > 0100 == t:: 80 < a: 0 60 a: Ci 40
20
~ ~ ~ ~ ~ ~ ~ ~ ~ ~ ~ ~
YEAR
FIGURE 3 Annual aircraft movements, TIA (1).
850
800
750
700
650 Ui 600 0 0
550 e. en 500 ...I < I- 450 0 I- 400 a: UJ 350 CJ z -~oo UJ en
250 en < Q. 200
150
100
50
0 81
------- ..... ____ ,-
, , ,
, , ,
, , ,
, , , , ,
,, ,'' ',,, , ' , '• , . , . , . , .
,' ', ,' ', ---,' ,_ ..
, ,
82 83 84 85 86 87 88 89 90
COMMERCIAL AIRLINE
PASSENGERS
YEAR
FERRY PASSENGERS
FIGURE 4 TIA ferry passengers (Source: THC).
3
Commercial passengers provide the bulk (typically 70 percent) of ferry passenger revenues. Their totals rose from 20,000 in 1983 to almost 373,000 in 1987, but they have since fallen to about 274,000 in 1990. Noncommercial or walk-on adult passengers pay a cash fare of $2.50 (return) on the ferry; children between the ages of 5 and 13 and seniors are charged $1.00 (return). These passengers tend to be visitors to the airport, passenger associates, or general aviation aviators and related personnel.
Well over 1,500 hospital patients are served annually by way of TIA. Indeed, considerably more Medivac patients access Toronto hospitals via TIA than via PIA or the other suburban airports-TIA has assumed the hub role for provincial Medivac operations for both inbound and outbound flights (i.e., doctors transported to remote areas for medical emergencies). On the order of six ambulances are transported on the ferries each weekday, up from four ambulances a day in 1988. On one day in February 1991, 16 ambulances were transported on the ferry.
In addition, revenue is received for transporting vehicles to the island; about 40,000 vehicles are transported each year. There is some discretion exercised with respect to passage payment. Some vehicles are charged for passage (some personal vehicles)-the fee per vehicle ranging between $7.00 and $45.00-but other vehicles are not charged (e.g., construction vehicles, ambulances, petroleum tankers).
REASONS FOR INFERIOR PERFORMANCE
TIA has not attained its maximum commercial potential for several reasons. First, the decline in the economy has affected the operations of both commercial and general aviation operators. Aircraft movements at the airport were more than

4
halved between 1987 and 1989, with considerable declines in both local and itinerant movements.
Second, the general aviation component of the facility is reputedly not priced competitively to attract other general aviation movements. Subsequently, when capacity constraints on general aviation traffic at PIA were introduced in the 1980s, displaced general aviation traffic went to suburban airports rather than to the island, and considerable traffic at TIA itself was diverted.
Third, certain politicians in the city of Toronto and adjacent residential neighborhoods-particularly the island residents-are largely and very vocally opposed to its enhancement. For several years they have lobbied and litigated to prevent the granting of permission for additional carriers to use TIA, and they have tried to halt construction of a temporary terminal to house those additional carriers. Such efforts have been unsuccessful in preventing new carriers or the construction of a temporary terminal, but they have succeeded in delaying the upgrading of airport facilities and the introduction of additional operators.
Restrictions on the size or noise of aircraft and the time or type of operation (i.e., some of the terms of the tripartite agreement) have, to a certain extent, placed the airport at a competitive disadvantage as well. The largest aircraft that land at TIA are Dash 7 and Dash 8 varieties that compete with jets over distances of 300 to 400 mi and can carry between 35 and 50 passengers. The only jets that can access the facility are Medivac-related.
In the 1980s, when there was a single commercial carrier at TIA, it served eight destinations and generated 40 movements a day. (This particular carrier curtailed operations in 1990 and suspended operations in 1991.) In 1990 a commuter movement cap of 112 per day was introduced by THC with the granting of additional landing rights to four carriers. A second commercial carrier was added that year that served three destinations and generated 21 movements per day. However, two other principal carriers did not exercise their rights, mainly because of market conditions.
Fourth, there are perceived and real difficulties of using air services at TIA for both commercial and general aviation purposes because it is an island. There are concerns about· being stranded on the island either during inclement weather or after the last ferry has departed for the mainland (although a more costly water taxi service is available). There is also a reluctance to pay a one-way fare of $2.00 to cross to a destination that is only a stone's throw away.
Fifth, for 10 to 15 days a year, wind and ice conditions require the ferry to use a more protected bad weather berth. Access to the ferries is more awkward during this timevehicles cannot be accommodated, and boarding and exiting the ferry is more difficult and airside ground access is made more uncomfortable because of the absence of sufficient shelter and wind breaks for pedestrians.
Sixth, the ferries and docks themselves require considerable amounts of money to maintain their safety and adherence to Canadian Coast Guard standards. Both ferries are more than 40 years old. Maintenance has been sometimes deferred in order to maintain fiscal prudence, with the result that both the ferries and the dock facilities now require extensive rehabilitation to extend their useful lives.
TRANSPORTATION RESEARCH RECORD 1373
PRESENT COST OF ACCESS
The cost of operating the ferry climbed from $426,000 in 1981 to $1.2 million by 1990 (THC, unpublished data). The increase in cost can be attributed to several factors, among them the following:
• The costs of maintaining two ferries instead of just one, • The age of the ferries and the difficulties associated with
obtaining specially commissioned parts in the advent of a mechanical breakdown,
• The advanced age and disrepair of the docks caused in · part by increased vehicular crossings, and
• The need to expand the operating hours of the airport to attract potential revenue from commercial and general aviation.
Revenues have increased more slowly, from $95 ,000 in 1981 to $450,000 in 1990, as the airport has failed to meet potential commercial and general aviation expectations (Figures 5 and 6).
The deficit for operating the ferry rose from $330,000 in 1981 to $823,000 in 1990. The total amount of deficit paid by the province between 1981 and 1990 was about $4.9 million. The deficit as a percentage of cost was as high as 80 percent in 1983, falling to as low as 47 percent in 1987, but it increased steadily to 64 percent in 1990 (Table 1).
The single largest expense is operating labor, at between 57 and 59 percent of the total cost. The average wage for ferry staff is on the order of $49 ,000/year, due to the need to work between 8% and 9Y4 hr/shift and the opportunity to accrue considerable overtime credits. Coast Guard staffing requirements afford little flexibility in reducing this expense.
The works department's overhead charge to the province has been consistently applied through this period; it remains at 17 percent of the total. Special items, a catch-all category that includes most emergency repair work, has climbed from 3 percent in 1984 to about 12 to 13 percent currently (Table 2). This is largely a function of the advanced age of the ferries and the frequent need to overhaul engines or commission specially designed components, such as new clutches, since parts manufacturers have stopped making them.
The operational and maintenance costs of the docks themselves have fluctuated considerably, ranging from 2 to 12 per-
1,300 fJ) 1,200 a: ct 1,100 ...I ...I 1,000 0 0 900 0 z 800 ct fJ) 700 :::> 0 J:
600 I-0
400 w a:
300 0 z 200 :::>
J: 100
0 81 82 83 84 85 86 87 88 89 90
YEAR
FIGURE 5 TIA ferry access: cost and revenues, 1981-1990.

Gorys and Paul
90
80
w
" 70 < ..... z w 0 60 a: w D..
50
40 81 82 83 84 85 86 87 88 89 90
YEAR
FIGURE 6 TIA ferry access: deficit as percentage of cost.
cent of the yearly cost of operation. The bad debt category results from the cessation of operations of one of the two commercial carriers at TIA. That carrier was invoiced for ferry passenger passage charges, but those costs could not be recovered. Similarly, airside landing charges were not recovered. All other expenses themselves constituted a very small proportion of the costs of ferry operations in any given year.
PROSPECTS FOR GROWTH
A study commissioned by the city of Toronto investigated the possible roles for TIA under a number of scenarios (3; Table 3). It concluded that the airport could not fulfill a role as a reliever airport for PIA, given the nature of hub and spoke traffic at PIA and the amount of commuter traffic at the island. However, it acknowledged that it did perform a valuable function with respect to handling general aviation traffic that might otherwise go to PIA. The study also concluded that TIA could not function as an exclusive general aviation facility. It determined that the airport could not be financially viable as such, even with a doubling of itinerant general aviation traffic.
Other scenarios examined a continuation of the same mix of activity at forecast annual rates ( 4 percent for commuter traffic and 1.4 percent for general aviation) and increased commuter movements with and without jet aircraft.
Under these scenarios, ferry capacity would be compromised soon after the turn of the next century but could be upgraded with the introduction of a larger ferry or the construction of a pedestrian tunnel to provide adequate capacity. The study did not address, however, the utility of a tunnel option or the continued willingness of higher levels of government to subsidize ferry operations.
TABLE 1 TIA Ferry Access Financial Situation($ thou.sands)
YEAR COST REVENUE DEFICIT
1981 426.4 95.5 330.9 1982 606.3 140.1 466.2 1983 637.4 127.1 510.3 1984 714.9 199.5 515.5 1985 790.3 242.5 547.8 1986 876.4 383.6 492.8 1987 995.6 526.6 469.0 1988 987.4 475.8 511. 6 1989 977. 6 383.5 594.1 1990 1,277.8 455.0 822.8
5
TABLE 2 Detailed Ferry Results ($)
PARTICULARS 1984 1987 1990
Maint. Labour 18117 33997 28029 Material 9177 11724 16277 Plant & Sundry 4781 13807 10531 Insurance 3000 8990 8129 Operating Material 36488 36066 40908 Special Items 21603 129338 143219 Operating Labour 407785 569741 710230 Alternate Service 4083 900 Metro Ferry 886 1069 Dock Op'g & Maint 79942 19821 48720 N.E.S. 9900 5092 3978
Sub-Total 595762 829645 1010921 Works Overhead 119152 165929 202184
Total 714914 995574 12i3106
Ferry Revenue 199468 526588 433333 Bad Debt 65776
Deficit 515446 468986 823854
ALTERNATIVE ACCESS OPTIONS
A number of studies commissioned by various agencies identified that use of the present ferry system represented a weakness in achieving the maximum commercial potential of the airport and proposed alternatives means ( 4-6). Preferred alternatives to deal with the question of access varied by study. However, limited action had never been taken to improve access to the airport for a number of reasons, among them cost and jurisdictional complexities.
In 1935 a contract to construct a tunnel for $1 million was actually let by the federal government, but it was cancelled before any work had progressed to any meaningful extent, after a change in government. As stated earlier, a second ferry was purchased in 1985 for $120,000 to ensure a consistent level of service.
In 1988 the Ministry of Transport commissioned a study to evaluate access alternatives (7). It investigated five options: expanded ferry service, a pedestrian tunnel and vehicular ferry, a low-level bridge, a high-level bridge, and a vehicular tunnel.
The 1987 capital costs associated with those alternatives have been updated and are as follows:
•Two new ferries and new docks-$12 million, • A pedestrian tunnel and overhaul of one ferry-$23 mil
lion, •A vehicular tunnel-$39 million, and •Low-level bridge and shipping channel relocation
$35 million.
The conclusion of that report was that a restricted-access vehicular tunnel would provide the highest level of service
TABLE 3 TIA Annual Enplaned/Deplaned Passengers (thousands)
PROJECTED LEVELS
SCENARIO 1992 2000 2008
Current Trends 510 704 964 Conunuter, No Jets 607 940 1,273 Conunuter, with Jets 752 1,102 1,400

6
and, unlike the ferry, would have adequate capacity to meet access requirements for the foreseeable future. Of prime importance were the concerns of disaster response agencies about an aircraft accident involving large numbers of people who needed assistance and the suitability of the access alternatives.
The total annual cost of the tunnel option, including amortization, operation, and maintenance, was comparable to the pedestrian tunnel option. However, acceptance of this option would require altering the terms of the tripartite agreement.
The other options were rejected because they would only marginally improve access; insufficiently address emergency access concerns; or result in less capacity and less revenue potential, higher operating costs, or less flexibility with respect to land use impacts and effects on recreational boating activity in the harbor.
COMMENTS
To some politicians and residents of Toronto, the value of a downtown airport is questionable. Those individuals or groups would prefer that the site be used for park land or affordable housing. Others are willing to tolerate it as currently envisioned: a general aviation airport with limited commercial operations.
General aviation airports perform a valuable role. Studies in the United States point to their increased use for business as opposed to recreational activity because of travel time and operational cost savings.
It has been estimated that at least a quarter of the general aviation aircraft fleet is operated exclusively for business and more than half are used partly for business purposes. In addition, almost three-quarters of the largest publicly held corporations in the United States operate their own business aircraft, and more than two-thirds of all business aircraft trips use general aviation airports rather than commercial air terminals (8).
Residential developments have recently been built near the airport: residents in those complexes do not wish to see an expansion of its commercial operations; they wish to have general aviation activities curtailed as well. Some see the limited capacity of the ferry to handle vehicles and passengers as a way to control airport operations just as they see the jet prohibition (9).
Prior studies have determined that an increase in commercial and general aviation activity is required if the airport is to become financially viable. An examination of the regional airport situation would suggest that this is a possible scenario, most certainly if an open-skies policy is adopted, offering alternative American venues.
It reportedly is not necessary for the jet restriction to be lifted to attain such growth. Indeed, there is muted recognition that the lower noise levels created by the new generations of jet aircraft can make it possible to negotiate successfully for the relaxation of that restriction.
As well, regional airlines in Canada now largely feed the larger parent airlines through the application of hub and spoke connecting service. This has concentrated airport activity to the larger international airports such as PIA. If those regional airlines are afforded some flexibility, with the addition of
TRANSPORTATION RESEARCH RECORD 1373
alternate Canadian and American destinations, then TIA itself becomes more attractive.
This would suggest that it would be prudent to improve access to TIA to meet the needs of present and future users (implicitly reducing or eliminating the current level of operating subsidies) and to make more safe, and convenient, use of the facility for expanding air ambulance services. The question is how to accomplish that.
The ferry option requires the construction of larger modem vessels to adhere to increasingly more strenuous Coast Guard standards. A more recent investigation of the ferry option indicated that a new, larger ferry could be functionally obsolete the instant it is pressed into service because of increased goods movement and ambulance space demands, greater capacity, and longer embarking and disembarking times affecting passenger service capabilities. A new ferry built to accommodate future needs could itself account for 30 percent of the distance it is supposed to traverse. Although it would require the lowest initial capital outlay, it would entail a continued commitment to operating subsidies. It also would not improve access.
Land use considerations derived from an ongoing analysis of access property requirements, coupled with further waterfront and airport development, suggest that a tunnel option would be advantageous, because it is least space-extensive. A low-level bridge option or lift bridge is impractical given the amount of recreational boat traffic in the western gap during summer. The lift bridge would have to be manned, adding to its costs; being mechanical, it would be subject to breakdown as well. A high-level bridge consumes too much land and is aesthetically unacceptable.
The tunnel option provides the most superior level of service, albeit at a premium price. Even the tunnel option is fraught with design complications, though. Currently the St. Lawrence Seaway depth provisions would need to be maintained for watercraft in the western gap. This would present considerable grades for tunnel traffic and add to the cost of such a facility. However, lowering those grades and not adhering to seaway depth provisions could result in negative environmental consequences with unknown mitigation costs.
Toronto Island residents are overwhelmingly opposed to a tunnel or bridge, insisting that it would destroy the integrity of the islands as an island, regardless of whatever conditions are attached to improved access.
Although it would be useful to take a proactive approach in this regard, political and financial realities are such that the demand for improved access cannot be definitively demonstrated in advance of the need to act, given present economic conditions, the fortunes of commercial operators at TIA, and the cost of alternatives.
The jurisdictional framework presents an added complication. The THC Board of Governors consists of five members: two are appointed by the federal government, and three are appointed by the city of Toronto and are from the local council. The interests of the THC and those of area residents may be quite opposed, presenting a problem for an elected official appointed to the THC who must represent both interests. Although councillors who are board members have argued that their participation can improve the accountability of the THC, a recent independent study of port operations was concerned enough to recommend a new approach to the

Gorys and Paul
role of the THC board and the removal of political considerations from port decision making (JO).
In addition, the municipality of metropolitan Toronto, representing the regional interest, and the province of Ontario, which has been temporarily responsible for the subsidization of access, have no control or say as to how the airport is run; Transport Canada, the federal agency, is principally concerned about the adequacy and cost of airside operations. As such, passenger handling pressures or the continuation of high ferry deficit levels would have to be in evidence for some time before a preferred access option would receive serious attention and could be justified on both political and cost/technical grounds.
Emphasis may be renewed for improving ferry access in light of the recent fatal crash of a light plane short of the airport's runway in January 1992. It took only 7 min for an ambulance to reach the accident site via the ferry-a commendable level of response. The rapidness of this action was a function of the alertness of and interaction among the pilot, control tower, ferry personnel, and emergency response authorities.
However, after disaster response exercises conducted in 1987 and 1991, emergency response personnel expressed concern that in a worst-case scenario, their efforts could be compromised by the ferry's operating deficiencies.
Indeed, given the location and quantity of downtown stationed ambulances and the vehicular capacity of the ferry, it could conceivably take a hour to transport all casualties (if necessary) from a fully loaded commuter aircraft downed at the airport to downtown hospitals.
In the opinion of emergency response agencies, the ferry working at 100 percent efficiency provides adequate support under normal conditions. With the ferry inoperative or unable to carry emergency response vehicles, the consequences would be significant in a worst-case scenario. Not surprisingly, a tunnel is the preferred option of emergency response agencies.
THC, through the creation of an airport community relations committee, has made considerable strides in (a) persuading area residents to understand and try to accept the airport, and (b) encouraging general aviation and commercial operators to accept and respect each other's competing needs and those of area residents.
It is difficult to forecast what will take place in the near future given traditional suspicions between the respective participants in the process. The continuation of such openness, coupled with guarantees of a cap on airport operation and with acceptable access restrictions, could allow an improved fixed link option, if it is affordable, to proceed with a reasonable chance of success later in this decade.
7
On the other hand, island residents have a very entrenched dislike of TIA, evident by the fact that a disproportionate amount (97 percent) of noise and overflight complaints (valid and otherwise) to the airport originate from that community-80 percent from four households-compared to a much larger population, within the same distance, to the immediate north of the airport (TIA, unpublished data). Much work is still required to continue to stem the polarization that characterized earlier internal and external relationships at TIA.
The safety of the Canadian traveling public is of paramount interest. Resolution of the differences and conflicts is being attempted through meetings with the community and the various levels of government.
ACKNOWLEDGMENTS
The authors wish to acknowledge the considerable efforts of individuals within THC and the Ontario Ministry of Transport who assisted in the development of the paper, particularly B. Turner, A. Home, B. Guest, H. Anders, and P. Dimitrou.
REFERENCES
1. Statistics Canada, Airport Movement Survey (TP577). Policy and Coordination, Central Region, Transport Canada.
2. Acres International Limited. Toronto Island Airport Economic Impact Study, Toronto Harbor Commissioners, Ontario, Canada, Sept. 1988.
3. Peat Marwick Stevenson & Kellogg. Toronto Island Airport Study. City of Toronto, Ontario, Canada, May 1991.
4. Peter Barnard Associates. Review of Access Alternatives for the Toronto Island Airport. Ontario Ministry of Transport and Communication, Toronto, Canada, May 1985.
5. Hatch Associates and Transmode Consultants Inc. Review of Access Alternatives for the Toronto Island Airport. Ontario Ministry of Transport and Communication, Toronto, Canada, March 1988.
6. Ferguson Architects. Toronto Island Airport Access Study. City Express, Toronto, Canada, March 1985.
7. Hatch Associates and Transmode Consultants Inc. Review of Access Alternatives for the Toronto Island Airport. Ontario Ministry of Transport and Communication, Toronto, Canada, March 1988.
8. G. Weisbrod. The Economic Impacts of Improving General Aviation Airports. Transportation Quarterly, Vol. 45, No. 1, Jan. 1991, pp. 67-83.
9. The Future of the Toronto Island Airport: The Issues. Royal Commission on the Future of the Toronto Waterfront, Supply and Services Canada, May 1989.
10. The Port of Toronto Impact Study. Mariport Group, Ltd. and Acres International, Ltd. Dec. 1991.
The views of the paper are those of the authors and in no way reflect the position of either the THC or the Ontario Ministry of Transport.

8 TRANSPORTATION RESEARCH RECORD 1373
Dynamic Capacity of Airport Enplaning Curbside Areas
MAHMOUD S. PARIZI AND ]OHN P. BRAAKSMA
An analytical model based on the theory of time-space was developed to calculate the dynamic vehicular capacity of the enplaning curbside area at airport passenger terminal buildings. The enplaning curbside area was considered as a system, and most of the variables that affect the capacity of this system were taken into account. To calculate the practical capacity, two distribution functions were developed. First, the traffic distribution around the doors of the terminal building was analyzed, on the basis of drivers' parking space preference, in the form of a binomial function. Second, weighting functions were developed and calibrated on the basis of users' door preference for unloading, in the case of more than one door, in the form of a modified binomial distribution. Using these functions, the percentage of distribution of traffic as well as the practical dynamic capacity of the enplaning curbs were found.
One of the most significant traffic bottlenecks at airports is the curbside area at which people and their baggage enter or leave the terminal. The curbside area is defined as the "temporary" loading or unloading facility on the roadway next to the passenger terminal building. The enplaning curbside exists primarily for people arriving at the airport from the community.
The objective of the dynamic capacity analysis for the curbside area is to determine the maximum vehicle flow rate for the design period, for example, 1 hr. In other words, the dynamic capacity of the curbside area is defined as the maximum number of vehicles that can pass through a certain point of a terminal frontage road in a specified period of time.
From the literature review it was found that curb capacity is usually defined as the maximum length of curb or maximum number of stalls available at any period of time, that is, a static capacity. Transport Canada developed a model for static curb capacity calculations, and a coefficient (m = 0.35) was used to convert static capacity to dynamic capacity (1). Cherwony and Zabawski defined theoretical and practical capacity (2); according to their definition, practical capacity is 70 percent of theoretical capacity. Mandie and Whitlock stated that door location is one of the most important factors in curbside capacity, but they did not consider door locations in their analysis (3). Moreover, most of the studies have focused on how much space there is rather than on how it is used. A rule-of-thumb method suggested by DeNeufville for use in the United States is 4 in. of curb length for every 1,000 annual passengers (4). The method developed by Whitlock for Eastern Airlines at Kennedy International Airport stipulates that
Department of Civil Engineering, Carleton University, Ottawa, Ontario, Canada KlS 5B6.
1 ft of curb space per hour is required for 2.42 enplaning persons and that the same amount is required for 2.28 deplaning persons (5). Transport Canada relates the curb length requirements to the passenger peak-hour planning period (6). To consider users' characteristics, stochastic approaches based on queueing theory were developed (7,8). Some basic assumptions of these approaches are not supported by real-life curb traffic operations: for example, no preference for vacant spaces is given in the assumption, which is violated in practical cases. By taking the user characteristics into account, it was found that the curb users are sometimes inclined to wait or double park for a vacant space near the terminal doors rather than park in a space farther away. Therefore, increasing the length of curb without changing the terminal layout is not necessarily a solution to the congestion problem. Even though some airports provide enough curb length, they still suffer from congestion and double parking and also need a very strict enforcement policy.
However, it was thought than an analysis of how people use the curbside with respect to the terminal layout-in particular, door locations-is of utmost importance. Therefore, some analytical tools should be developed to consider the users' behavior in curbside area capacity and design.
MODEL DEVELOPMENT
The theory of time-space is applied to the curb system operation to develop an analytical model for dynamic capacity calculation. In this study the maximum vehicle flow rate that can be processed by the system over a 1-hr period is defined as the dynamic capacity (9). Simple assumptions are considered during the analysis, such as what would occur under ideal conditions. After finding the maximum flow rate under these conditions, adjustments based on field observations were made to calculate the capacity under prevailing conditions. Assumptions that are expected to hold during calculations are as follows:
• Average influence length and a deterministic average service time of vehicles are considered.
•Average speed is considered for the system, which cannot exceed the allowable speed limit.
• Double and triple parking is not allowed, and vehicles can stop only in parking spaces directly in front of the doors.
In considering the foregoing assumptions, formulas for calculating the maximum and minimum service flow rates were found.

Parizi and Braaksma
Minimum Flow Rate
The minimum flow rate occurs where there is only one service station (one parking space in front of the entrance door), and it is assumed that vehicles unload only in this space. The objective is to calculate the maximum number of vehicles that can pass through the curb length, assuming that there is a continuous flow of demand, or no gaps.
Suppose an arriving vehicle enters the curb from the entrance ramp with an average driving speed of v. It will park, unload, and start to leave within the service time T. The vehicle travel time is obtained by dividing the length of the curbside area by the average speed. The effect of deceleration and acceleration are inherently included in the average speed. The time it takes for the first vehicle to exit the system or pass the curb frontage road from B to A in Figure 1 is as follows:
t1 = T + Liv + o:lv (1)
where
t 1 exit time of first vehicle, T = deterministic service time,
L total length of enplaning curb, o: influence length of vehicle, and v = average speed of vehicles.
Elapsed exit time for the second vehicle would be
12 = f 1 + T + a.Iv (2)
The difference between t1 and t2 is the service time of the second vehicle plus the time it takes to travel the influence length of one vehicle. Because the next vehicle must wait until the previous vehicle leaves the door, the value of o:lv is defined as delay for the oncoming vehicle. It should be noted that this very short period of time ( o:lv) is the extra time over and
L
A . B Entrance Ramp
:•• r---~ .~.~~·~· ~ .~~ .~.~ ~.~. ~ .~.~ .T---~ I D C I I I I
:+ I
Parking
ABCD = Curbside Area (System) TAR = Terminal Access Road L = Length of Enplaning Portion of the Terminal Building a =Influence Length of the Vehicle
FIGURE 1 Schematic layout of enplaning curbside area (system).
I I
t: TAR
Space
tt tt 't A
Door
B
tl
tt = Travel time d =Delay = a./v 't = Service time Door = Door location
t2
Cycles
•3····························~
t3
k
tk Elapsed Exit Time
FIGURE 2 Time-space diagram of vehicles, one door.
9
above the service time. Figure 2 illustrates the time-space diagram of vehicles in the case of only one service station. As shown in Figure 2, one vehicle can be serviced in each system operation cycle. Subsequently, by the same procedure, the processing time of the kth cycle or elapsed exit time of the nth vehicle would be as follows:
tk = k(T + o:lv) + Liv (3)
where tk is the processing time of the kth cycle and k is the total number of system processing cycles.
In this situation, k is the number of system processing cycles, which, because there is one service station, is equal to the number of vehicles. Suppose tk is equal to the time period T, usually 1 hr; then the number of system processing cycles or maximum number of vehicles that can pass through the system during the time period Tis obtained as follows:
T = k(T + o:lv) + Liv
T-!::_ k - ___ v
0: T+
V
(4)
(5)
In practical curbside operations, some spaces on either side of the entrance are used as service stations in addition to the spaces in front of the door entrance. This affects traffic distribution along the curb and will be discussed later.
Maximum Flow Rate
The maximum flow rate occurs where all parking spaces can be used as service stations with the same degree of utility. In other words, all vehicles can unload at any section of the curbside and all parking spaces have equal preference for the

10
Cycles
Space r-----T······························ 2 k
0 tl t2 tn
Elapsed Exit Time
tt = Travel time d =Delay = a/v 't = Service time Door = Door location
FIGURE 3 Time-space diagram of vehicles, n doors.
drivers. Following the same procedure as for the first case, the elapsed exit times of vehicles from the system are as follows:
'T + Lfv + Ol../V (6)
T + Liv + 201..!v (7)
tn = 'T + Liv + n01..!V (8)
It should be noted that because there are n service stations in the system, n vehicles can be serviced in each cycle. Because of the assumption of equal curb use for the first series of n vehicles, the difference between the exit time of each vehicle is only the vehicle influence length divided by the average speed (01../v). As shown in Figure 3, under the continuous arrival rate for the second series of vehicles and before the third series of arrivals, the elapsed exit times would be as follows:
(9)
and
(10)
Finally, for the last vehicle in the second cycle of the system, the elapsed exit time is
t2n = 2T + Liv + 2n01..!v (11)
The difference between the exit time of vehicles in the first cycle and vehicles in the second cycle is average service time (T) plus the cumulative value of 01..!v. If the same process continues until the end of time period T, the processing time for the nth vehicle in the kth cycle would be as follows:
tkn = kT + Liv + kn01..!V (12)
TRANSPORTATION RESEARCH RECORD 1373
where k is the number of cycles that the curbside was occupied and evacuated during the time period T and n is the total number of vehicles that passed the curbside length in each cycle, that is, the total number of service stations.
Therefore, by substituting the specific time period T for tkn' there will be
T = kT + Liv + kn01..!v (13)
Hence, the number of cycles during the time period Twould be
L T--
k = __ v_ n01..
T+V
(14)
It is clear that for only one service station, the capacity is equal to the number of cycles. However, involving n service stations, the total number of vehicles that can be processed during the time period T is
n01.. T+
V
(15)
The number calculated in Equation 15 can be referred to as the maximum dynamic capacity of the curb during time period T under specified conditions. It should be noted that this capacity is valid under the assumption that drivers indicated no preference for a particular service station when unloading. Since this assumption is not supported in practical operations, the calculated maximum dynamic capacity is also called the ideal capacity. The ideal capacity, if adjusted for drivers' behavior, will give the practical capacity.
DOOR TRAFFIC DISTRIBUTION MODEL
One of the basic variables in the capacity model was the number of service stations. Under ideal conditions, to get the maximum capacity, it was assumed that drivers showed no preference among service stations when unloading. Since in practice this assumption of equal preference is not borne out, a probability function for cur_b traffic distribution according to the drivers' behavior should be found. In other words, a probabilistic approach should be considered to find the percentage of traffic distributed along the different sections of the curbside. Because it is assumed that the probability distribution of traffic along the curb can reflect the drivers' preferences or constraints, a comprehensive survey of curbside area was necessary.
Site Inventories
To eliminate the effect of adjacent doors on each other, sites with only one enplaning door had to be considered first. Therefore, a literature survey of all airports in the province

Parizi and Braaksma
of Ontario was made, and airport terminals with a fair amount of traffic were chosen. Data were collected during two consecutive days at different times for each airport according to the airline schedules at four airports. The surveys were of the observation type so as to avoid passenger interference. Sections 8.0 m long were marked from the entrance ramp along the enplaning curb. A vehicle was assumed to use a particular section if more than half of its length fell in that section.
On the basis of the data analyzed, it was postulated that the curb traffic distribution follows some form of discrete probability distribution. From the analysis it was found that the best function that could fit the data properly was the binomial distribution as a function of the number of spaces and the relative location of the door from the entrance ramp as follows:
n! ---px(l _ p)n-x x!(n - x)!
x = 0, 1, 2, 3, ... n (16)
where
f; = percentage of curb traffic distribution at xth section from entrance ramp,
n = total number of sections available at enplaning curb, p ratio of door location space to total number of spaces
(xr)n), and x = section number from entrance ramp.
Calibration of Traffic Distribution Model
Although the trend represented by the distribution held for the four specified airports, the extent to which the model can replicate the existing situations is another important aspect to consider. Statistical tests such as the two-tailed F-test and the two-tailed Student t-test were performed. The STATGRAGHICS program using the least-squares method was run between observed and predicted values. At the 5.0 percent level of significance, the Student t- and F-test values were much greater than the critical values obtained from the statistical tables (10,11). The coefficient of correlation (r), which shows the degree of linear relationship between the observed and predicted values, was defined as the degree of predictability of the model; it was close to 1 for all four airports.
WEIGHTING DISTRIBUTION MODEL
In a very small airport at which not more than one door is needed, there would be no problem because all traffic must use the same door. But in larger airports with more than one entrance door, the traffic will be split among the doors. Finding the degree of split or the traffic distribution among the doors was an important task. From the field observations it was found that for car drivers, doors close to the entrance ramp have more weight than doors away from the entrance ramp. Drivers tend to stop at the first space they find, for they normally do not know the situation ahead. Because of the foregoing reasons the distribution function among the doors is called the "weighting function."
11
In this case, since the number of doors is limited, a discrete probability distribution must be considered. Because the model is based on users' behavior, a comprehensive survey must be undertaken to find the distribution. Financial and time constraints prohibited the collection of new data. Therefore, data previously collected by Mo from two large airports, Montreal International Airport (MIA) and Toronto International Airport (TIA), were used to calibrate and validate the function (12). On the basis of observations from the field, it was postulated that for an airport with more than one door, the drivers' preference function can be expressed as some form of modified binomial distribution as follows:
k! (1 - q)k W = qY(l - qy-y + ---
y y!(k - y)! k
y = 1, 2, 3, ... k (17)
where
wY percentage of total traffic distribution around yth door, y sequential door number starting from entrance ramp, k total number of doors at curb, and q relative location of first door over total number of
doors (q = l.O/k).
In contrast to the binomial distribution, the weighting function is always decreasing and shows the descending weights of the doors away from the entrance ramp. It starts from a value and tends to zero, and its maximum value always occurs at the first door.
For the calibration and validation process, the theoretical data must be compared with the observed data from the field. First, the predicted values are obtained from the two models that have been developed as follows:
1. From Equation 16, find the traffic distribution for each door without considering the effect of adjacent doors.
2. Calculate the weight of each door from Equation 17 (weighting function).
3. Multiply the traffic distribution numbers for each door by their own weight.
4. For each parking space, sum up the numbers obtained from Step 3; finally, these values would be the predicted values of traffic distributed along the curb.
Figures 4 and 5 illustrate the comparison of predicted values against the observed data in the case of transborder and domestic section of enplaning curbside at MIA.
It should be noted that in any case the cumulative value of the composite function obtained from Step 4 should be 1. This is because the area under the curve consists of the total amount of traffic (100 percent) during a specified period of time. A simple regression analysis using the least-squares method was run between the observed and predicted values and the results were satisfactory. Therefore, the trend represented by the model held for two different airports with single curbs at domestic, international, and transborder sections.
PRACTICAL CAPACITY MODEL
By applying the two distributions and using the characteristics of a curbside area such as the length of the enplaning curb

12 TRANSPORTATION RESEARCH RECORD 1373
Traffic Distribution(%) 0.25 ..---------------------------
-e- Predicted -*""" Observed
0.20
0.15
0.10
0.05
0.00 '-------'-------'------1.----J__ ___ _J_ __ ..:.___J
0 2 4 6 8 10 Space Number
FIGURE 4 Comparison of observed and predicted values of curbside traffic distribution, transborder section, MIA.
12
or the location of doors, the practical capacity can be found as follows:
1. Find the values of fx for each door according to the relative location of doors (i.e., p-values).
fore, the criterion for the effective number of spaces is the desired minimum percentage of total traffic at any section.
5. Estimate an average speed and service time according to the historical data, experience, or the airport's policies.
2. Find the values of wY for the enplaning curb according to the number of doors (i.e., q = 1.0/k).
6. Substitute all those numbers in the capacity model (Equation 15) and find the upper volume of traffic that can be handled practically at the curbside area.
3. Multiply the values of fx by w Y to find the traffic distribution for the whole curb (e.g., Gx)·
7. Calculate the maximum dynamic capacity of the curbside area during time period T from the following equation:
4. Assume a minimum value for the percentage of traffic that is expected to be distributed along the curb [e.g., (Gx = 0.0)] and count the number of spaces above the minimum value, that is, effective number (Neff). The term "effective" depends on the minimum percentage of traffic that one expects to be parked at any section of the enplaning curb. There-
Traffic Distribution(%)
cpractical
0.20 .----------------------------
-B- Predicted --+- Observed
0.15
0.10
0.05
0.00 .,.__ ------'--------'----------'------'--------'
0 2 4 6 Space Number
8
FIGURE S Comparison of observed and predicted values of curbside traffic distribution, domestic section, MIA.
10
(18)

Parizi and Braaksma
where
cpractical = practical dynamic capacity of curbside area (veh/ hr),
Neff = effective number of spaces, T = specified period of time (min), L length of enplaning curbside area (m), v = average speed of vehicles in area (m/min), 7 = average service time (min), and a = average influence length of vehicles (m).
A computer program was written to calculate the capacity of the curbside area under different conditions.
The development of the model includes a validation procedure to assess its ability to calculate the dynamic capacity of the enplaning curbside area at different airports. As mentioned earlier, the model for ideal capacity was based on the theory of time-space and there was nothing to validate. The model for calculating practical capacity was based on the theory of traffic operations at the curbs. Therefore, the theoretical results of the model should be compared with the observed data from different fields.
Since the system under consideration was taken to be a two-lane linear curbside area, MIA and TIA were used for the validation process. Because of financial and time constraints, it was decided to use the data that had already been collected for different airports at their request. For TIA a 24-hr survey was done at the enplaning curbside of Terminal 2 on February 19 and 20, 1991, to get the percentage of through traffic. In addition to the percentage of vehicles that did not unload at the curb or that used the 23. short-term parking meters, the total volume of inbound traffic for each 15 min was counted. The validation procedure is summarized as follows:
1. The characteristics of the curbside area such as the total number of spaces and number and the location of doors for each section were obtained from the site. The minimum percentage of traffic that one expects to be parked at any space depends on engineering judgment. To generalize the concept of minimum value, it is suggested that a tenth of the maximum percentage of traffic distribution be considered. Using these numbers the traffic distribution of the whole curb and the effective number of spaces were found.
2. The average service time and the average influence length for the system were computed by means of the modal split model. The 30 km/hr was considered to be the average driving speed of vehicles. Applying these numbers to the capacity model (Equation 18), the practical capacity of the system was obtained.
3. Finally, the value obtained from the model was compared with the maximum volumes of traffic counted during a continuous period of time (e.g., 1 day, week, month, etc.). If the maximum observed value from the field is less than the value obtained from the capacity model, the validation process is complete. This procedure is applied to the two busiest airports in Canada, which meet the assumptions of the model.
Montreal International Airport (Dorval)
The transborder and domestic sections of the enplaning curbside area were considered for validation. The required data
13
for validation were extracted elsewhere (13). The part of the curb length that can be used freely by drivers is 168 m. Using the distributions and the modal split model, the following variables were obtained:
•Effective number of spaces, Neff = 19; •Weighted average service time, T = 1.4 min; •Weighted average influence length of vehicles, a = 8.69
m; •Average driving speed, v = 500 rn/min; and • Specific period of time, T = 60 min.
Substituting these values into Equation 18, the practical dynamic capacity of the system was found as follows:
19(60 -168
) 500
cpractical = ---1-9-(8-.-69-) = 655 vehicles per hour
1.4 + 500
(19)
·Compare this to the maximum observed value of 584 vehicles per hour (vph). This number can be referred to as the maximum number of vehicles that can be handled by the system during 1 hr.
Standard counts of vehicle volumes made by the planning division of MIA using a loop or pneumatic tube detector were used as the observed data. The maximum daily traffic during 1 week was plotted against the practical capacity value and is shown in Figure 6. Although the traffic counts consist of the number of vehicles that stopped at the spaces allocated for official use and through traffic, they are still lower than the capacity value.
Toronto International Airport, Terminal 2
The enplaning curbside area of Terminal 2 was considered for validation. The required data for validation were extracted elsewhere (14). Using the distributions and the modal split model the following values were obtained:
• Effective number of spaces, Nerr = 52; • Length of curbside area, L = 440 m; •Weighted average service time, 7 = 1.69 min; •Weighted average influence length of vehicles, a = 8.07
m; •Average driving speed of vehicles, v = 500 m/min; and •Specific period of time, T = 60 min.
Substituting these values into Equation 18, the practical dynamic capacity of the system was obtained as follows:
cpractical
52(60 -440
) 500
1 69 52(8.07) . + 500
1,215 vph (20)
Compare this to the maximum observed value of 715 vph. This number can be referred to as the practical dynamic capacity of the enplaning curbside area during 1 hr.

14 TRANSPORTATION RESEARCH RECORD 1373
750 Volume (vph)
655 Practical C ad
600
450
300
150
0 Sun. Mon. Tue. Wed.
Day
Thu. Fri. Sat.
FIGURE 6 Comparison of daily peak-hour traffic and capacity at enplaning curbside of MIA.
Two sources of data were used for validation: first, automatic traffic recorder (A TR) counts conducted by the planning division of TIA during 7 continuous days (14); and second, a 24-hr survey in February 1991 just before the opening of Terminal 3. The maximum peak-hour traffic of each day was extracted from the data, and it is shown against the capacity in Figure 7. During the recent survey the total number of vehicles for each 15-min period was counted manually on the approach to the departure curb at Terminal 2. Data were cumulated for each hour, and the results are shown in Figure 8. As shown in both figures, the maximum values are much less than the value obtained from the capacity model. As a result, the model is valid for any airport that meets the assumptions of the model. These results do not necessarily mean that there should not be any congestion problem at these airports. For instance, at TIA, drivers experience congestion
during peak hours at enplaning curbside of Terminal 2 despite excess capacity. This is because of the usage of the third lane as a short-term parking, existence of pedestrian crossing, unequal distribution of airlines inside the terminal building, and curbside mixed operation (i.e., bus, car, taxi, and limousine).
MODEL APPLICATIONS IN DESIGN PROCESS
The findings of the study can also be used to consider the interaction between curb use and terminal layout so as to design a curbside area that achieves a more efficient operation: the terminal design can be optimized by applying the drivers' behavior to the design process. Optimization refers to the process of finding the minimum number of doors and their locations to maximize the efficiency of the curbside area
Volume (vph) 1400.---~~~~~~~~~~~~~~~~~~~~~~~~~
1000r·············································································· ···················································································I
800 - .
600~------------~································=---==~~~~~~~~:::.:===~==:j
400 -···
200 r································································ ···························· ···········································································!
o~~~~~~~~-'-~~~-'-~~~~~~~~~~~~~
Sun. Mon. Tue. Wed. Thu. Fri.
Day
FIGURE 7 Comparison of daily peak-hour traffic and capacity at enplaning curbside of Terminal 2, TIA.
Sat.

Parizi and Braaksma 15
Volume (vph) 1400r-~~~~~~~~~~~~~~~~~~~~~~~~~
1215 1200
1000
800
600
0 4 8
Practical Capacity
12 Hour
·················· .. PM
16 20 24
FIGURE 8 Comparison of hourly traffic volume and capacity at enplaning curbside of Terminal 2, TIA.
at a particular airport. This is achieved by assuming a minimum design value (i.e., a minimum percentage of traffic that one expects to be parked at any parking space) and changing the terminal layout so that none of its curb spaces has a traffic value of less than minimum value. The optimization process is very important in large airports at which there is a high volume of traffic. The results of the optimum design procedure can be used to develop a new method for the planning and design of the curbside area.
CONCLUSIONS
The following conclusions are drawn from this research:
• The ideal and practical capacity of the existing enplaning curbside areas can be determined more realistically with the developed model than with other methods.
• A strong relationship was discovered between the terminal layout and the dynamic capacity of the curb. Physical characteristics of the curb such as number and location of the doors, number of lanes, and length of the curbs should be considered in any capacity calculation.
• Probabilistic functions for door traffic distribution and users' preference of doors (i.e., weighting functions) were found to be binomial and modified binomial distributions.
• From the weighting function, it was found that the values of distribution for a large numbers of y (i.e., a sequential number of doors) are zero, meaning that the number of usable doors is limited. (The term usable refers to the doors that can handle a portion of traffic greater than the minimum design value.)
• The distribution models may be used to find the bottlenecks along the curbside area. If the traffic has not been distributed uniformly, the layout may be modified to increase curb use.
• Increasing the length of the terminal building has a negative effect on the dynamic capacity of the curbside area.
Therefore, to increase the capacity, instead of lengthening the curbside, the whole curbside area should be duplicated in parallel with the existing curb.
• The number of doors or service facilities along the curbside are no longer of architectural interest only. In reality, they are traffic distributors along the curb and if judiciously placed will enhance the operation of the curb.
RECOMMEND A TIO NS
•The model was based on a two-lane linear curbside area. More research should be done in airports with more than two lanes and with and without pedestrian refuge islands.
• The effect of pedestrian refuge islands in multilane curbside areas should be studied, and the percentage of increase in capacity should be determined.
• Since the capacity obtained from the model is limited to a single number under any condition, a consistent level of service beyond which delay and congestion are intolerable should be identified by experts for the curbside of different functional categories. This can be achieved by basing judgments on observations and people's perceptions and reactions to delay and congestion. Therefore, instead of a minimum value as a criterion for practical capacity, a level-of-service framework can be found at different levels of demand.
REFERENCES
1. A Discussion Paper on Level of Service Definition and Methodology for Calculating Airport Capacity. Airport Services Branch, Transport Canada, Ottawa, Ontario, 1979.
2. W. Cherwony and F. Zabawski. Airport Terminal Curbfront Planning. Abrams-Cherwony and Associates, Philadelphia, Pa., 1986.

16
3. P. B. Mandie, E. M. Whitlock, and F. Lamagna. Airport Curbside Planning and Design. In Transportation Research Record 840, TRB, National Research Council, Washington, D.C., 1982.
4. W. Smith and Associates. Airport Curbside Planning Guide. Transportation System Center, Cambridge, Mass., 1980.
5. E. M. Whitlock and E. F. Cleary. Planning Ground Transportation Facilities for Airports. In Highway Research Record 274, HRB, National Research Council, Washington, D.C., 1969.
6. Curb Activity Study Report. Report AK-67-09-246. Airport Facilities Branch, Service Structures Division, Transport Canada, Ottawa, Ontario 1983.
7. A. Turnbull. Airport Terminal Buildings: Processing Curb Methodologies. Ministry of Transport, Downsview, Ontario, Canada, 1973.
8. R. Tilles. Curb Space at Airport Terminals. Traffic Quarterly, Oct. 1973.
TRANSPORTATION RESEARCH RECORD 1373
9. M. S. Parizi. Airport Terminal Frontage Roads Capacity. Master's thesis. Department of Civil Engineering, Carleton University, Ottawa, Ontario, Canada, 1991.
10. N. D. Gugarati. Basic Econometrics (2nd ed.). McGraw-Hill Book Company, New York, N.Y., 1988.
11. J. G. Hahn and S.S. Shapiro. Statistical Models in Engineering. John Wiley and Sons, Inc., New York, N.Y., 1967.
12. J. P. Braaksma and C.-Y. Mo. Effectiveness Measures for Airport Departure Curbs. Transportation Engineering Journal, ASCE, Vol. 104, No. TES, 1978.
13. Ground Transportation Survey: Montreal International Airport (Dorval). Les Aeroports de Montreal, Transport Canada, Montreal, June 1984.
14. DelCan-DeLeuw Cather, Canada, Ltd. 1980 Ground Transportation Survey. Toronto International Airport, Ontario, Canada, May 1982.

TRANSPORTATION RESEARCH RECORD 1373 17
Evolution of Ground Transportation Management as a Major Airport Function
RAY A. MUNDY
Airport organization is discussed, special attention being given t~ the structure of landside management. The past structures of a1rport management are surveyed, the origin of the structures of these organizations is explained, and ways the structures have evolved from 1940 to the present are discussed. With this backgroun? t~e results of a recent U.S. survey on current airport orgarnzat10!1al structures are presented as they pertain to ground transportation management. Organizational literature and theory a:e discussed. as _they pertain to the potential development of a1rport orgamzat1onal structure; specifically, four evolutionary stages of ground transportation management are proposed. It is suggest~d that airpor_t ground transportation officials are repres~nted madequately m the management of U.S. airports as depicted by their representation in the organizational charts. However, this is changing as the management of Iandside activities receives more attention and resource prominence within the overall management of modern airport complexes.
Airport management of the 1940s did not involve the scope of operations that airport managers of today control. The management ranks were lean. Often only two or three key managers controlled most decisions of even larger airports. This was partly due to the size of operations, the lack of amenities, and the substantial influence of airline committees on the management of the airports. .
In the 1940s there were two main trunks in the typical airport organizational chart: airport operations and administration, and airport engineering. This basic decentralized structure has been sustained in some airports, with few variations, into the 1980s as shown by this textbook organizational chart of the 1940s (J).
Several studies on airport management and organization surfaced in the 1940s. They emphasized ways in which the top of the chart interacted with the municipal government. Three such interactions were studied: (a) delegate authority to an existing department of the city government, (b) establish a new department, and (c) vest authority in an independent airport commission (J). However, Frederick and other authors of the period do not address the functionality of the lower-level management structure. Lower-level structure apparently was not deemed important at this time, only the structure of the policy makers was.
Frederick states in his text that there are two types of activities in an airport: (a) aviation activities and (b) nonaviation activities and facilities for the general public. "It is important to maintain functional separation of these types for throughput planning. Mixing of the two has led _to congestion, con-
~ol~ege of Business Administration, Department of Marketing, Logistics, and Transportation, University of Tennessee, 320 Stokely Management Center, Knoxville, Tenn. 37996.
fusion, and inefficiency" (J). That is a strong statement. Unfortunately, the author confuses this issue by his organizational chart (Figure 1), which mixes aviation and nonaviation activities.
Other airport management writers of the period include Froesch and Prokosch. In their book Airport Planning they state that "the two types of traffic, air and ground, must be in balance: otherwise the airport will not function at maximum efficiency" (2). Unfortunately, in the same book of 250 pages, less than 1 page is devoted to ground transportation.
Further inadequate representation of ground transportation is evident in early airport master plans. The typical master plan of the 1940s did not include ground traffic patterns or forecasts of future ground transportation needs. Authors of this period did recognize the need for separation of the airport functions to increase throughput and efficiency, but that recognition was not realized on the organizational charts.
The 1960s saw an expansion of staff operations at airports in general and in landside functions in particular. The use of terminal concessions and other concessionaire agreements began to grow as more traveling amenities were made available.
Airline committees were heavily involved in the financial ?evelopment and management of some major airports, thereby mfluencing the organizational structures of many. These airline committees participated in large capital expansion projects. Officials of the airlines and the airports worked together to find the best possible solution to each community's airground problems. The airport management took charg~ of the day-to-day operations of the airport, but the financing of long-run improvements and major functional additions was often decided with approval of the only airline committee.
In the 1960s, just as in the 1940s, recognition of the landside operations did not result in actual status on the organizational chart. Reese, in his text The Passenger-Aircraft Interface at the Airport Terminal, gives an "ideal" airport organizational chart (3) (see Figure 2). This chart gives very good departmental representation of ground transportation. Not only are there appropriate departments, but each is given importance, as evidenced by its higher level on the hierarchy. However, the authors were unable to find any airports that followed this ideal structure in the 1960s. There is also no mention of landside management structure in Reese's text, only this representation of a possible terminal organization.
Airport textbooks of the 1980s can be divided into three broad categories: airport engineering, airport planning and design, and airport operations and management. The last two categories should give attention to the management structure of the airports. Some texts in these categories give due attention, and some don't. Even those texts that include a chap-

Department of Public Works
Director
Chief Engineer
Airport Manager 1-----~
-----1Engineer In Charge Construction Operations
Rentals Publicity
Accountant Revenue
Expenditures
Maintenance Design
Federal Government
Stenographer Principal Asst. Engineer
Chief Operator Clerk
Control Tower Statistics
Radio Operators
Telephones
Telephone Operators
Police Chief Ground
Regulations Parking
Equip Operators Gardeners Laborers
Supt. Of Maintenance
Building and Field Repair
Boiler Operators Cleaners Watclunen
FIGURE 1 Airport management (I).
Concessions
Airport System
Airline Customs Operations
Information
Stenographer
Asst. Engineer
Suiveys
Transitmen Rodrnen
--------------- - --------------------' I I .. I
Passenger Transport
Passenger Transfer to and from the Aircraft
Passenger Check-in
I I I I
: Syst~m to transfer passengers between the terminal building and 1 the aircraft.
~
FIGURE 2 Ideal airport management organization chart (3).

Mundy
ter on airport management and organization do so from the view of the top of the management hierarchy-that is, they give attention to how the airport is organized within the city government or as a free-standing legal entity created by state legislature. These texts usually are not concerned with the way that the airport managers further down the organizational chart interact. They do not address issues such as
•Which departments should operate which activities? • Which managers should operate which departments? • Which managers should report to whom? • Which manager characteristics are needed to operate each
department?
The authors argue that although top-level organization is important, the intraorganizational structure handles the everyday operation of the airport system. The entire management structure of airports should be researched in order to better understand how to increase the efficiency and effectiveness of our airports.
INDUSTRY SURVEY
Seeking to learn more about current airport management of ground transportation and its related activities, the University of Tennessee, the Airport Operators Council International (AOCI), and the Airport Ground Transportation Association compiled a survey of U.S. airports in 1989. The survey asked questions that sought to identify the level of attention that each airport gave to ground transportation issues. The airports were also asked to submit current organizational charts.
The purpose of the study was to
•Document the present organizational structures of U.S. airports;
•Attempt to relate the functions performed by the ground transportation department to the airport size;
•Understand the relationship of airport structure and the type of airport control (i.e., independent authority versus municipality);
• Understand how airline deregulation has affected airport organization; and
• Determine underlying trends.
The major findings of this study are reported in the following. The survey achieved 66 returns. Seventeen large airports
responded, as did 24 medium-sized and 25 small airports. Thus, there was a good representative sample of large, medium-sized, and small airports as defined by AOCI. Threefourths of the large airports surveyed had a separated ground transportation department. One-third of the medium-sized airports have evolved to include a separate ground transportation department. None of the small U.S. airports has yet evolved to this point.
Some of the returns revealed subjective answers. DallasFort Worth Airport (DFW), for instance, reported no formal landside department. However, it has quite an expanded list of activities and a fairly well developed landside program, though it has no specific department.
19
The questionnaire compiled a self-reported "snapshot" of the current duties of the landside departments. This is summarized in Figures 3 and 4.
As shown, the title used most often for U.S. airport ground transportation managers is director, manager, or supervisor of ground transportation. At midsized airports the title of manager of transportation services was used also; at major airports the title of landside operations manager was used frequently.
The most common duties of these ground transportation departments are also reported in Figures 3 and 4. Day-to-day operations, rules enforcement, and information are performed by the vast majority of these departments. Parking responsibility, contracts administration, access planning, and roadway management are performed by only two-thirds of these departments. However, if one looks at size, most ground transportation departments of major airports perform all these activities. Finally, activities such as access fee collection, security, and lost and found are found in half of the respondents'
Surveys Returned = 66
- 17 Large - 24 Medium - 25 Small
Separate & Distinct Deparunent?
Large 13 8 0
Medium Small
Titles
50% = Dir./Mgr./Supv ./of Ground Transportation 18% =Manager of Transportation Services 18% = Landside Operators Manager 14% = Operators Manager/Director/Coordinator
Answered "No" to separate department but have:
Transportation Manager-Dallas/Ft. Worth Ground Transportation Coordinator-Port Columbus
Duties:
Operators-Day-to-Day Rules Enforcement Information Parking Responsibilities Contracts Access Planning Roadway Management Access Fee Collection Security Lost & Found
Staff Size: (?)
Range - 1 to 108
Salaries of Department Head or Equivalent
Small Airports
Medium Airports
Large Airports
$ 30,000
Range: $22,888 to $45, 000 Average = $32,555
Range: $20,000 to $77 ,000 Average = $40,625
FIGURE 3 Airport commercial ground transportation management study.
76.5% 33.3% 00.0%
83% 83% 80% 57% 66% 63% 63% 49% 46% 40%

20 TRANSPORTATION RESEARCH RECORD 1373
OTHER ~InNIFICANT DUTIES
Af'f'ESS FEE f'OLLErI10N
SErTTRITY
L"~T llr pm TNn
ROADWAY MANAGEMENT
Af't"'ESS PLANNINr.
CONTRACTS
INFORMATION
RI n ES ENFORC'EMENT
PARKINr. RESPONSIBILITIES
OPERATORS-DAY-TO-DAY
Burbank-Glendale-Pasadena A.A. y y y y N N y y y N
Cleveland-Hopkins Int'I Airport y y N N y N N N N N
DFW Airport N y N N N N N N N N y
Dallas Love Field N N y y y y y y y y
Dane Co. Regional A. (Wise) y y y y y y y y y NIA
Daytona Beach Reg. Airport y N y y N N N y y y N
Fairbanks Int'I Airport N N N N N N N N N N N
Jacksonville Int'l Airport y N N y N N y N N y y
Kansas City Int'l Airport y y y y y y y y y y y
Metro Knoxville Airport A. y y y y y y y y y y
Lincoln Municipal Airport y y y y y y y y y y y
Boston Logan Int'l Airport y y y N y N N N N N y
Memphis-Shelby Co. Airport y y y y y y y. N y N y
Rock Island IL Metro A.A. y y y y N y y y y N
Metro Nashville Airport A. y y y y y y N N N N
Ft. Lauderdale/Hollywood Int'l A. y y y y y y y N y y
Gen. Mitchel Int'l Airport y y y y y y y N y y y
Greater Cincinnati Int'l Airport y N y N y y N N N y
City of Palm Springs A.A. y N y y y y y N N N y
Port of Colwnbus Int'l y y y y N N N y N y
Port of Portland y y y y y y y y y y
ROY Airport y y N y N N N N N N
Richmond Int'l Airport N N y y y N y y y y y
Robert Mueller Mun. (Austin, TX) y N y y N y y y y y
Sacramento Co. Airport y y y y N y y N N N y
S.W. Florida Reg. Airport (Lee Co.) y N y y y y N N N y
San Antonio Int'l Airport y N y y y y N N N N
Port of San Diego (Lindberg Field) y y y y y N y N N y N
San Jose Int'l Airport y y y y N y y N N N y
Santa Barbara Municipal y y y y y y y y y N
Springfield Reg. Airport N N N N N N N N N N
Stapleton Int'l Airport y N y y y y y N N N y
Tri-City Reg. A. (Blountville, TN) y N y y y N y y y y
Metro Washington Airport A. y N y y y y y N N N
Will Rodgers World Airport N N y N y y N N N y
Y =Yes N =No
FIGURE 4 Airport-commercial ground transportation management study, individual airport report.
departments. Figure 4 breaks this information down by individual airport.
Staffing for these departments varies greatly in size depending primarily on whether parking is a part of a department's responsibilities. An individual and a single staff person may manage an entire ground transportation department for
a small or medium-sized airport, but larger airport complexes, which manage their own parking and shuttle operations, may have a staff of 100 or more people.
As expected, salaries of ground transportation department heads vary greatly depending on airport size. At small airports the average salary is $30,000 (1989 data). At medium-sized

Mundy
airports the average is $32,555, with a range from $22,888 to $45,000. Finally, major airports have an average salary of $40,625 for ground transportation managers, with a high of $77 ,000 (1989 data).
Although no formal comparison of these salaries with those of other managers within airport administration was made, it is suspected that they are somewhat lower than salaries of either airside or terminal operations managers. This would be indicative of the relative newness of the position or its lack of organizational status within the managerial hierarchy of many U.S. airports.
The relationship of airport structure and type of control (i.e., independent authority versus municipality) proved very difficult to quantify; thus no firm conclusions were reached. It did appear that several of the major airports that were municipally controlled have not developed comprehensive airport ground transportation departments. However, further research into this observation would be needed to ascertain any definitive rationale for this occurrence.
Airline deregulation appears to have affected U.S. airport ground transportation management structure in several ways. Initially, it has focused the attention of airport management to be more self-sufficient and less dependent on airline operating agreements to finance the facility. Thus, more emphasis is being placed on all sources of revenue-especially commercial users of the airport roadway system who historically have paid nothing or very little to use the facility.
This recent attention to ground transportation is more than financial. Airport managers realize that airline deregulation also deregulated airports in that airlines and passengers are free to choose or not choose to use a certain facility. Thus, top managers are paying more attention to the planning, execution, and support of good access and ground transportation systems at their facilities. This often translates into higher salaries and greater status as well as responsibilities for the ground transportation manager.
EVOLUTIONARY TRENDS OF AIRPORT GROUND TRANSPORTATION
As evidenced by trends noted in the survey, airport ground transportation departments are in a period of evolution. Airport boards and general managers are realizing the importance of the landside department to airport revenue and to the operating efficiency of the management structure. We can foresee an elevation of the ground transportation function within the organization. From this review of current U.S. airport organizational charts and ground transportation duties, four distinct evolutionary stages of airport ground transportation management are evident. They are as follows:
1. Subfunction, 2. Beginning structure, 3. Departmentalization, and 4. Full integration.
Stage 1: Subfunction
Ground transportation is still considered to be a subfunction. Landside or groundside reports to the assistant director of
21
operations and employs few, if any, workers. The landside function simply administers contracts and has no input into their drafting. Parking lot and shuttle services are usually operated by concessionaire agreements, and they report to someone in security, administration or operations.
Stage 2: Beginning Structure
Ground transportation begins to gain some structure. Landside has contract agreement responsibility and oversees it on a day-to-day basis. There is typically someone who is vested with the responsibility to "manage the curb."
Stage 3: Departmentalization
Ground transportation now gains departmental representation. Parking and ground transportation are frequently merged. Contract authority has shifted from administration to the groundside department personnel. In this stage we observe that ground transportation is growing in stature, in personnel, and in relation to the other departments in the airport. In Stage 3, planning develops a formal relationship with the landside department. Some of planning time is devoted to solving ground transportation problems, and the groundside department is allowed input into how these problems are solved. Finally, there is usually a formal liaison with the airport police force to enhance the operation of airport roadways for maximum efficiency.
Security Services Sec. Tech. T05( I)
Taxicab Control TC T03(41)
Patrol Shift A Supervisor
Sgt. T09(1)
Assistant Supervisor
Sgt. T09(1)
Patrol Officer T06(6)
Dispatchers T05(2)
Deputy Director of Aviation
Chief Airport Police Division
M09(l)
Operations Officer U. M08(l)
Patrol Shift B Supervisor
Sgt. T09(l)
Assistant Supervisor
Sgt. T09(1)
Patrol Officer T06(6)
Dispatchers T05(2)
Secretary Al4(l)
Investigations Sr. Sgt. Tl 1(1)
Patrol Shift C Supervisor
Sgt. T09(1)
Assistant Supervisor
Sgt. T09(l)
Patrol Officer T06(6)
Dispatchers T05(2)
FIGURE 5 Ground transportation management study, Robert Mueller Municipal Airport, Austin, Tex.

22 TRANSPORTATION RESEARCH RECORD 1373
PRESIDENT
V.P. OPERATION MAINT., & DEVELOPT.
V.P. FlNANCE &ADM.
V.P. MARKETING
& GOVT. AFFAIRS
MGR. PURCHASING
MGR.ACCTG.
DIRECT OF FINANCE
MGR.GROUND TRANS
MGR.INFO
SYSTEM
FIGURE 6 Ground transportation management study, Memphis (Tenn.) International Airport.
Stage 4: Full Integration
In Stage 4, groundside, or "landside," gains equal status with airside and terminal operations, at least on the organizational chart. These departments have full budgetary responsibility. They are responsible for their own planning and may even have planners on their staff. Roadway management security will probably employ their own personnel in addition to the airport's own police force.
Austin Municipal (Figure 5) is an example of a Stage 1 airport. Landside reports to the operations manager and is not identified as a separate department.
Memphis International (Figure 6) is evolving from Stage 1 to Stage 2. The manager of ground transportation has no staff reporting to the position, but he handles responsibility for administering contracts.
Minneapolis_:.St. Paul (Figure 7) is an example of a Stage 2 airport. The ground transportation manager oversees other personnel. The assistant director is at the same level as the fire chief and police chief and reports directly to the airport director.
Charlotte, Seattle-Tacoma, San Antonio, and the Southwest Florida Regional airports are examples of Stage 3 airports (Figures 8-11). Charlotte's organizational chart repre-
AIRPORT DIRECTOR
TECHNICAL ASSISTANT
POLICE CHIEF FIRE CHIEF
SUPERVISOR-
OPS/COMM. CTR.
OFFICE MANAGER
ASSISTANT TO DIRECTOR
GROUND TRANS. MANAGER
SECRETARY
GROUND TRANS.
COORDINATOR
FIGURE 7 Ground transportation management study, MinneapolisSaint Paul (Minn.) Airport.

Mundy
CURBSIDE SUPERVISOR
AIRHOSTffAXI DISPATCH
MANAGER OF PARKING AND TRANSPORTATION
PARKING SUPERVISORS
SHUTTLEBUS OPERATORS
PARKING CASHIERS
FIGURE 8 Ground transportation management study, Charlotte (N.C.)-Douglas International Airport.
sents a clear picture of a Stage 3 airport. Parking and ground transportation functions have been merged into one easily controlled department.
San Antonio and the Southwest Florida Regional airports demonstrate that the evolution of ground transportation isn't necessarily a function of the airport's size. Instead, it can often be a function of the board of directors' recognition of the growing importance of landside operations. In San Antonio, the landside director is given the same level as the directors of operations, airport policy, and fire and rescue. Southwest Florida Regional is a new airport and has had the unique . opportunity to review other airport structures and the importance of landside operations. Currently its function is combined into a single manager of terminal and landside on an equal status with other departments.
DFW and San Francisco (Figures 12 and 13) have fully integrated landside developments and are good examples of Stage 4 airports. At San Francisco the landside department
23
encompasses parking, ground transportation, planning, and engineering; it contracts subfunctional responsibilities. At DFW, the department of transportation is divided into four subfunctions: operations, parking, transportation, and support (which includes engineering and planning).
ORGANIZATIONAL ENVIRONMENT AND NEED FOR CHANGE
Throughout most organizational textbooks there are theories relating to change and dynamic environments and to how organizations must change with their environments in order to operate effectively and efficiently.
Garratt uses an analogy of ecology. In order for an organization to survive in the wake of change, its capacity for learning must be equal to or greater than the change (L ;::::: C). If organizations do not monitor their environment and ad just accordingly, they risk extinction ( 4).
Livingston uses an analogy to chemistry: chemistry procedures break down certain products to determine their chemical makeup; this breakdown allows analytical research on how the product is structured. Organizational patterns can be similarly analyzed (5). The purpose is to
1. Design and construct the best arrangement of units; 2. Design intergroup relationships and the system of com
munication; and 3. Train personnel to operate in the new environment.
The U.S. airport industry is similarly in a dynamic environment. It must adjust if it is to remain effective. Since the 1940s, there have been few revolutionary changes in airport management structure. However, throughout much of this period, the airline industry was controlled largely by regu-
SUPT. OF PARKING AND GROUNDS TRANS.
ASST. SUPT. OF
PARKING AND GROUND
TRANSPORTATION
PARKING ADMIN. STAFF &
G.T. SUPV. ASST. ASST.
CASHIERS
GROUND TRANS.
MANAGER
PARKING ADMIN. PARKING
& ASST. & G.T. SUPV. G.T. SUPV.
BUS DRIVERS
GROUNDT. CONTROL
ISTAFFl ~
PROPERTY ROOM
ADMINISTRATOR
FIGURE 9 Ground transportation management study, Seattle-Tacoma (Wash.) International Airport.

OPERATIONS
DIRECTOR OF AVIATION
AIRPORT SERVICES MGR.
AIRPORT POLICE FIRE, RESCUE GROUND
TRANSPORTATION
FIGURE 10 Ground transportation management study, San Antonio (Tex.) International Airport.
DIRECTOR OF OPERATIONS
OPERATIONS MGR. AIRPORT OPERATIONS AIRPORT OPERATIONS OPERATIONS MGR. GEN. AVIATION & MANAGER
AIRSPACE TERMINAL/LANDSIDE MANAGER
AIRSIDE
AIRPORT OP.
SPECIALIST
AIRPORT OP.
SPECIALIST
G. T.AGENTS AIRPORT OP.
AGENTS
CERTIFICATIONS & EMERGENCY OPS
FIGURE 11 Ground transportation management study, Southwest Florida Regional Airport, Fort Myers.
ASST. DIRECTOR
TRANSPORTATION
(PARKING)
GROUND
TRANSPORTATION
COORDINATOR
GROUND
TRANSPORTATION
AGENT
DIRECTOR OF
TRANSPORTATION
ASST. DIRECTOR
TRANSPORTATION
(OPERATIONS)
AIRTRANS
CENTRAL CONTROL
SUPERVISOR
AIRTRANS
CONTROLLER
AIRTRANS
ASST. CONTROLLER
ASST. DIRECTOR
TRANSPORTATION
(AIRTRANS)
PASSENGER SVC.
SUPERVISOR
PASSENGER SVC.
Sl-ilFf SUPV.
PASSENGER SVC.
AGENT
TRANSPORTATION
ENGINEERING
SUPERVISOR
BUS OPERATIONS
SUPERVISOR
BUS OPERATIONS
Sl-ilFf SUPV.
BUS OPERATOR
FIGURE 12 Ground transportation management study, Dallas-Fort Worth (Tex.) International Airport.

Mundy 25
SR. TRAFFIC ENGINEER
TRAFFIC ENGINEER
PUBLIC PARKING
I CIVIL ENGR.
TRAFFIC
ENGINEERING
I TRAF.ENG.
GROUND TRANS. CONTRACT SVC.
I IND. ENGR. GROUND OP. PASS. INFO.
TRANSIT TRANSIT
PLANNER PLANNER
FIGURE 13 Ground transportation management study, San Francisco (Calif.) International Airport.
lation and thus not allowed to change freely. Since the early 1980s the air industry has not been so constrained; thus, airport organizational structures must be flexible and able to change as their environment changes in order to respond to these changes and to take advantage of the opportunities present in these changes.
CONCLUSIONS
The dynamics of the airport industry today call for more effective organizational structures that allow flexibility and more efficient use of resources. A necessary change is the departmental representation of airports' ground transportation divisions. Such representation will increase airport use and effectiveness in many ways, including
• Increasing throughput to the airside, • Securing appropriate fees for use of airport facilities and
business opportunities, • Providing better management for growing landside activ-
ities, •Facilitating changes and growth, • Giving more attention to landside safety issues, and • Giving due representation in the master plan develop
ment.
Changes will not just happen as a function of growth or expansion. Private industry is more adaptive to change and evolution because its survival depends on it. Airports are public entities and as such are not typically risk takers. It is more difficult for public entities to evolve before reaching a consensus on what they should do.
Most airports will postpone organizational changes until a function is already being performed. They will then adjust their organizational form to coincide with the function. Thus, airport boards of directors should look at organizational structure and periodically decide whether to accelerate this change through early, formal changes.
In these dynamic times, however, one might ask if airports can really wait for their form to catch up with their functions. This author suggests that they cannot with our current growth predictions. Our airport structures must evolve to fully integrated landside-airside-terminal operations. They must delegate landside responsibility, budgeting, and planning to the appropriate department.
The shift toward Stage 4 management structures is growing. Increased revenues are more likely to come from landside operations than from airside or terminal operations in the future. Therefore, the support for Stage 4 airport structures will not only solve the problem but generate income as well.
The progressive evolution of the ground transportation function is exciting. As this evolution continues, airports will appropriate increased funds and personnel to support this expanding landside activity.
REFERENCES
1. J. H. Frederick. Airport Management. Richard D. Irwin, Inc., Homewood, Ill., 1949.
2. C. Froesch and W. Prokosch. Airport Planning. John Wiley and Sons, Inc., New York, N.Y., 1946.
3. P. C. Reese. The Passenger-Aircraft Interface at the Airport Terminal. Graduate thesis. Northwestern University, Evanston, Ill., 1967.
4. B. Garratt. The Learning Organization. Gower Publishing Com-. pany, Brookfield, Vt., 1987.
5. R. T. Livingston. The Engineering of Organization and Management.McGraw-Hill Book Company, Inc., New York, N.Y., 1949.

26 TRANSPORTATION RESEARCH RECORD 1373
Public Transportation for Airport Employees: Q3 Extension into John F. Kennedy International Airport
DANIEL K. BOYLE AND PAUL R. GAWKOWSKI
Public transportation extensions to airports have often focused on the needs of air travelers; the employee market has generally received less attention in ground transportation planning at airports. An extension of a local New York City Tra~sit Aut~ority bus route, the Q3, into John F. Kennedy International Airport (JFK) is described, and the results of a survey of Q3 riders are presented. JFK employees form a stable ridership base, a?d those recently employed are especially dependent on Q3 service. The route extension has been successful in attracting new riders from alternative modes (primarily the automobile). Free transfer privileges with connecting bus routes have been instrumental in establishing a large service area for local bus service to JFK.
Provision of public transportation service to airports has received increased attention in recent years. Much of this attention has focused on the extension of rapid transit lines designed to provide fast, relatively inexpensive connections between the central business district and the airport. Rapid transit extensions support the metropolitan airport's role as a transportation hub and serve the important function of reducing congestion on ground transportation for the air traveler market segment.
The other major role of the metropolitan airport is as an employment center for jobs related to flight service or cargo handling. This role is supported by public transportation that provides convenient access to the airport for employees. The employee market segment has generally received less attention in ground transportation planning at airports than the air traveler market. This market segment is potentially larger and more lucrative, given the daily nature of employee travel. Even the most frequent flyers do not travel to airports five times a week, and the amount of baggage that they carry often precludes rapid transit usage.
To address the travel needs of the employee market at John F. Kennedy International Airport (JFK), the New York City Transit Authority extended the Q3 bus route into the airport in December 1987. This paper describes this extension and presents the results of an onboard survey conducted in October 1990. The survey's purpose was to determine travel and
D. K. Boyle, Brooklyn/Queens/Staten ~s~and Bus Service ~lanning, New York City Transit Authority, 130 L1vmgston Street, Third Floor, Brooklyn, N.Y. 11201. Current affiliation: Center for Urban Transportation Research, College of Engineering, University of South Florida 4202 East Fowler Avenue, ENG 118, Tampa, Fla. 33620. P. R. Ga~kowski, Brooklyn/Queens/Staten Island Bus Service Planning, New York City Transit Authority, 130 Livingston Street, Third Floor, Brooklyn, N.Y. 11201.
work patterns and previous or alternative modes of transportation.
In the next section of the paper, the physical layout, employment patterns, and transportation access at JFK are described. The Q3 routing and its extension into JFK are then presented, and a discussion of the on-board survey design and implementation follows. Survey results are analyzed, and conclusions and implications are presented. The Q3 extension and survey results are of timely interest to other transit agencies considering route extensions to serve airports or other major employment concentrations outside the central business district.
JOHN F. KENNEDY INTERNATIONAL AIRPORT
JFK, in southern Queens along the banks of Jamaica Bay approximately 15 mi from Manhattan (Figure 1), has the highest concentration of employment in New York City outside of the Manhattan central business district. JFK is the nation's leading air cargo gateway, with a 1988 volume of 1.3 million tons. The Port Authority of New York and New Jersey operates the three major commercial airports in the New York metropolitan area: JFK, LaGuardia, and Newark.
Total employment at JFK is approximately 42,000, distributed within the airport as shown in Figure 2. The central terminal area accounts for a significant proportion of total employment at JFK, but most workers are scattered throughout the airport. This dispersion of job locations within the airport makes it somewhat more difficult to serve work trips via public transportation.
JFK is generally not well served by public transportation. The closest rapid transit service is the A-train at the Howard Beach station, outside the airport's border. This station was the terminus for the "Train to the Plane," a premium-fare service that operated from 1978 to 1990. Shuttle buses connected the station to airline terminals, making the trip the "train to the bus to the plane." This service was discontinued in 1990 because of low patronage, high operating costs, and poor equipment utilization. A free bus shuttle from the Howard Beach station to the airline terminals is now operated by the port authority.
Access to JFK by local bus (Figure 3) has been provided primarily by Green Bus Lines, one of the four privately owned local bus companies still operating in Queens County. The major Green Bus route into Kennedy is the QlO, which op-

Boyle and Gawkowski
FIGURE 1 Airport locations in New York City metropolitan area.
erates from Union Turnpike in Kew Gardens (at a rapid transit station served by the E- and F-trains) to the central terminal area, Federal Circle, and the hangar area on the airport grounds. The QlO also serves the Lefferts Boulevard station of the Atrain. Green Bus's Q7 route provides service to Cargo Plaza from the Rockaway Boulevard station on the A-train, and the Q9 route operates into JFK via the QlO route during peak periods only. One transit authority local bus route, the Q3, originated in Jamaica and terminated at the airport periphery on Farmers Boulevard at Rockaway Boulevard, where Green Bus's Q6 route also ended. The Q3 operated only during weekday morning and evening peak periods until December 1987. The Q6 route has since been extended a short distance onto airport grounds to serve the postal facility in the north cargo area.
I I I I I I
4,462 11%
27
Premium-fare coach service to JFK from midtown Manhattan and from LaGuardia Airport is provided by Carey Transportation. Carey also serves the Jamaica Long Island Railroad Station.
Q3 EXTENSION TO JFK
In December 1987 the transit authority extended the Q3 route into 1FK's central terminal area via the north cargo area, previously unserved by public transportation. At the same time, the span of Q3 service was expanded to 21 hr/day, 7 days a week. This extension was not designed as a service for air travelers, since the Q3 routing was a roundabout way to travel between the E and F rapid transit lines and the airport. Instead, the authority anticipated that the extension would be used primarily by airport workers.
At the transit authority's request, the port authority provided a breakdown of home addresses of JFK employees by ZIP code. Figure 4 shows the distribution of employee residences. The concentration of workers in southeast Queens and surrounding areas can be seen readily. Despite their proximity to the airport, these employees had no direct access via public transportation. Transit riders from southeast Queens were required to ride into Jamaica, transfer to another bus or to the subway, and then transfer again to the QlO, ensuring at least a 1-hr and two-fare (often a three-fare) trip.
Figures 5 and 6 show the routing of the Q3 bus. From the 165th Street bus terminal in Jamaica, the Q3 travels along Hillside A venue, serving the 179th Street station, the last stop on the F- and R-lines. At 187th Place, the Q3 turns south and proceeds to JFK primarily via Farmers Boulevard. The route enters the airport at Rockaway Boulevard, its former terminus, and travels through the north cargo and cargo plaza areas into the central terminal area. Minor changes in Q3 routing within the airport have been made since 1987 as a result of roadway construction.
The Q3 is essentially a north-south route, whereas most routes in Queens are oriented east to west. Thus, free transfer privileges are available between the Q3 and every major transit authority and private bus route in southeast Queens as well as many bus routes serving eastern and northern Queens. The Q3 extension provided one-fare access to JFK for most
I I I I I I
4,355 10%
Cargo 1 North Cargo Area ~~ L----r-----------Area
I I
I
/
2,303 6%
Federal : ~, / 18,678 45% Circle J,,.--
/
/ 11,680 / 28% Hangar _____ .,, Area
\ I
\ I \ I
'---/ \
\ \
\ \
\
Central Terminal
Area
FIGURE 2 Distribution of employment by area at JFK, 1986.

G10to KOardan•
Q6to~ Jamaica ~
FIGURE 3 Bus routes serving JFK, 1986.
Jamaica
/
Q3to
Central Terminal
Area
JFK EMPLOYEES
I ~5°o~oTo0 ~~~~5°o~oo I §ii~:~~ i~ ~~~~:~~ 0 2 3
- apprx. 1.9 mi.
FIGURE 4 JFK employees' residences by ZIP code, 1986.

Boyle and Gawkowski
A N
Q3 Legend
•Terminal
G Subway Connection
John F. Kennedy Airport
FIGURE 5 Q3 route in Queens.
I I I I I
29
of eastern Queens, including almost all of southeast Queens. Peak-period headways were shortened from 20 or 25 min to 15 min, and new midday, evening, and weekend service was provided every 30 min.
Extensive marketing activities were undertaken by the transit and port authorities. Community officials were briefed at an early stage. Brochures including Q3 timetables were printed by the transit authority, a first for local bus service in Queens. These were distributed by the port authority to all employers at JFK; the port authority also placed articles about the new service in airport newspapers and newsletters. Direct mailings went out to all households in southeast Queens. On Sunday, December 6, 1987, a special inaugural Q3 bus with local dignitaries on board traveled from the 165th Street bus terminal to JFK, where the port authority hosted an opening-day celebration (incidentally, using the same room in which the Beatles were introduced to America in 1964).
SURVEY DESIGN AND CONDUCT
The extension to JFK and the. longer span of service proved to be an immediate success. Q3 patronage soon increased to the point that additional service was added to the route. Figures 7 and 8 indicate the growth of overall Q3 ridership as well as ridership into JFK; Table 1 shows changes to the Q3 schedule since 1987. This ridership trend is all the more notable when placed against the backdrop of decreasing systemwide trends in bus ridership.
Ideally, an origin-destination survey would have been conducted within 12 months of the start-up of JFK service on the Q3. However, resources for conducting origin-destination surveys within the transit authority were focused during this time on other major changes, such as the opening of the Archer Avenue line. In addition, the Q3 extension opened up employment opportunities at the airport to residents of southeast Queens, but obviously all new employment did not begin in the first 6 or 12 months. Given a reasonably high rate of job turnover at JFK, the delay in surveying riders provided a broader picture in that it included employees who began work at the airport well after the extension.
North Cargo Area L----r------------
/ I
I I
Federal 11 ,.,. ,.,. ' /
.,....,,.,,.. \ I Circl~J.......... , /
- \ I / \ I
/ '---<_ / \
- - - - - J Hangar , Area '
FIGURE 6 Q3 extension into JFK.
\ \
\
Central Terminal
Area

30
1500
1000
500
oL-~~~~-F=-~~~~__._~~~~~"--~~~~
1986 1987 1988 1989 1990
--+-- WEEKDAY --*- SATURDAY ~ SUNDAY
FIGURE 7 Q3 daily ridership, peak load point (6:00 a.m. to 9:00 p.m.).
One ridership count in January 1989 indicated that during the period surveyed (6:00 a.m. to 9:00 p.m.), more passengers were riding the Q3 to the airport than from the airport. The mystery of this imbalance was solved when later evening checks revealed frequent standing loads on buses leaving the airport between 9:00 p.m. and midnight. A 21-hr ride check was requested and scheduled for October 25, 1990. In conjunction with this, a brief survey was prepared to administer to Q3 riders on trips into the airport.
The purpose of the survey was threefold: to determine travel patterns on the Q3, to gain information on JFK employees, and to ascertain previous or alternative modes of travel. Riders were asked where they boarded the Q3 bus and whether they had transferred from another bus or the subway. The survey included questions on frequency of travel on the Q3, employee status at the airport, and length of employment. JFK employees were asked about their previous mode (if they had worked at the airport for at least 3 years) or alternative mode of travel.
The survey was administered on board Q3 buses by traffic checkers and planning staff. Figure 9 shows a copy of the survey form used. All trips going toward JFK were scheduled to be surveyed. The surveyor boarded a JFK-bound Q3 bus at Rockaway Boulevard, the last stop before the airport, identified himself or herself as a transit authority employee and then began to interview riders. Two persons were assigned to buses at particularly busy times. Surveyors altered the pattern
--+-- WEEKDAY --*-SATURDAY ~ SUNDAY
FIGURE 8 Q3 daily ridership into JFK (6:00 a.m. to 9:00 p.m.). (1988 weekend data estimated.)
TRANSPORTATION RESEARCH RECORD 1373
TABLE 1 Q3 Schedule Changes
:::::::::::::::: :-:
~V<jifiH!
Weekday 1987 20 25 Dec 1987 15 30 15 Dec 1988 12 30 15 June 1989 12 20 12 June 1991 10 15 12
Saturday 1987 Dec 1987 30 30 30 Dec 1988 30 30 20 Sept1989 20 20 15
Sunday 1987 Dec 1987 30 30 30 Sept 1989 30 20 30 Sept 1991 30 20 20
of questioning riders, sometimes beginning in the front of the bus and other times in the back.
Table 2 reveals the number of successfully completed interviews, the number of riders approached for information, and total ridership into JFK. The number of riders sampled was below 100 percent because of a few missed trips. Overall, approximately 90 percent of all riders were included in the sample, and the response rate from those surveyed was approximately 70 percent.
The sample was then expanded by time period to match total ridership. Time periods were selected to reflect differing peak/off-peak ridership patterns as well as differing response rates. Four separate time periods covered the morning peak (5:00 to 8:00 a.m.); the midday period (8:00 a.m. to 1:00 p.m.); the afternoon peak, when ridership into the airport was heaviest (1:00 to 4:00 p.m.); and the rest of the day (4:00 p.m. to 1:30 a.m.). Early evening and late evening were similar in terms of ridership patterns and response rates. Table 2 contains expansion factors by time period. Numbers in the remaining tables represent expanded ridership.
SURVEY RESULTS
As expected, most Q3 riders were airport employees, the market for which the service was designed. Peak ridership into the airport in· the morning and afternoon corresponded with shift changes. Most riders came not all the way from Jamaica, the northern terminus of the Q3 route, but boarded along Farmers Boulevard in southeast Queens (Table 3)." The heaviest boarding locations were at major transfer points at Merrick Boulevard (05), Guy Brewer Boulevard (privately operated Qlll and Q113), and Linden Boulevard (04). These three locations accounted for more than 33 percent of JFKbound boardings, and the seven busiest bus stops accounted for more than 60 percent (Table 4). More than 80 percent of Q3 riders use the service at least 5 days a week.
The most significant and interesting findings were those concerning length of employment at JFK, prevalence of trans-

Q3 JFK Survey -- September 25, 1990
1. Where did you get on the Q3?
Name Run Ti.me ____ _
2. Did you transfer from a bus or subway line? If yes, what # ? 3. Bow many days a week do you make this trip? 4. Do you work at JFK Airport? If yes, how long have you worked here?
(If at least 2 1/2 years, ask question 5) (If less than 2 1/2 years, ask question 6) (If no, this is the last question)
5. Bow did you get to work at JFK before the Q3 was extended? 6. Do you ever come to work at JFK some other way than on the Q3?
FIGURE 9 Q3 JFK survey, September 25, 1990.
TABLE 2 Response Rates and Expansion Factors by Time of Day
: oo!Ri:~~~ \H'1~~~.~~ ::u1r\t~~w.~v :i_._~,_-,e._ .. :_:s:. = .. ::~-':···:.'·::. '_ .. s._: ... '.' .. :,· ::::=~w~•~''' '=.!'in~~'Jpk n:H~etj~~~~ <9>:mi# .. ~~~/ =>~~w:::: l=!i!T:F•~~:nn["i
5 a.m. to 8 a.m. 233 178 118 66.3% 1.97
8 a.m. to 1 p.m. 216 216 195 90.3% 1.11
1 p.m. to 4 p.m. 337 316 219 69.3% 1.54
4 p.m.· to 1 :30 a.m. 159 134 60 44.8% 2.65
TOTAL 945 844 592 70.1%

32 TRANSPORTATION RESEARCH RECORD 1373
TABLE 3 Boarding Locations of Q3 Riders into JFK
:~~~ti~~·····················••':•:•:,.,.·.·.·.· . Hillside Avenue 279 29.6
187 Place and Hollis Avenue 64 6.8
m;:~~ilit~r~~~,~ ; , i 1 11 ~i i ~~.~ T.LiWdeW:~~Ll1~~citbli~~vWflillWtT:• · · ,.,., "• •145• • .T::.:1~;~ ·.'.•.'•.• •.'~·:.•.•.•e.·•.':.:r. r.•:.i.:.a.•:.k.••.' '.• B.:·•.•·.•o.'.• u.•',•.1.•e.· .. :.:v.•:.'a.'.• :r.:.: d.L.' ·.• •. • t. :.•o·.··.':.!1.4.'.•4.·,• ... ! R.•.•·.•:.d.<.\ iT/< •• )) :Hi• • <<•• •• /i '/ •:': • \ UT1'75' / ( • '1~•5 ['H9.0Y,:~~~~r·~t¥~1~·A~~~~y~1~~.•~• .,.,, ••• •••:•:::::::'•·••:•·••:··::.·:::•:·.i!i!i!ili\ilii~h· ••••!\!•!•:1~[~ ... :Jifl~~#i*1~d,=1~~f;e#,tr(J~:1::::.:•/:.•,•<'•• < :•: :•:::.:\· •=).:/:·• .. ·•·••.••'i·j.j:j•iii~2·i :•:•::.•:::~.~
Total along Farmers Boulevard
TOTAL
fers from other routes to the Q3, previous modes of travel for long-time employees, and alternative modes for recent employees. Taken together, these findings highlight the most salient factors in the success of the Q3 route extension.
Table 5 reveals the means of access to the Q3 bus. Slightly more than half of the passengers entering the airport transferred from another bus, 47 percent reported no transfer, and only 2.5 percent used the subway to reach the Q3. The low figure for access by subway is not surprising, since the QlO provides a more direct trip to JFK from the Queens Boulevard rapid transit line. Most transferring passengers used a transit authority bus to reach the Q3, but 12 percent of total riders transferred from a private bus route (generally a free transfer), and 3 percent transferred from a Metropolitan Suburban Bus Authority route and paid an additional fare.
The average duration of employment at JFK for Q3 riders was 31.4 months, or slightly more than 2.5 years. Table 6 presents a breakdown of length of employment, with the largest number of Q3 riders falling into the 12- to 35-month cat-
601 63.6
945 100.0
egory (35 percent). The next largest category was less than 1 year, with 29 percent of passengers. Twenty-six percent had worked at the airport for 3 years or more; these riders were already employed at JFK when the Q3 route was extended in December 1987. The remaining 9 percent of riders either did not work at the airport or did not respond to this question.
The previous mode used by long-time airport employees was of particular interest to the authority, since a major argument in favor of the Q3 extension was that it would attract riders who had been using other modes. Table 7 shows the response of long-time employees to this question. The predominant mode previously used was the automobile, with 54 percent reporting that they had traveled to work at the airport by private automobile or by taxi. Only 32 percent had used public transportation, in line with expectations because of the indirect routings before the Q3 extension. The remaining longtime employees reported other modes or did not respond.
The question asked of employees who worked at the airport for less than 3 years concerned alternative rather than pre-
TABLE 4 Heaviest Boarding Locations for Q3 Riders into JFK
R·~~r.$ .• eoa.:: ••.•• •r~iH s::... • .•. : P.~~~~ht •bl' ••• : ••• :: • . ·.·.·,·.··:t:•,•o·.•,'.'~,·.·.·.'.•1,':···:·~.',',•oa·.••,•.•.:.•r•::.'d' ... '1",•.·n•.·.•,:g:.••s,•.•:,:.,:, .. • <<~~<>Ui/I<UU/i/H/UUU ua n
Merrick Boulevard 121 12.8
Guy Brewer Boulevard 117 12.4
Linden Boulevard 107 11.3
165 Street Terminal 72 7.6
187 Place/Jamaica Avenue 64 6.8
Murdock Avenue 60 6.3
Hillside Avenue/179 Street 58 6.1
TOTAL BOARDINGS 945 100.0

Boyle and Gawkowski
TABLE 5 Means of Access to Q3 Bus for Riders into JFK
Subway 23 2.4
Bus 477 50.5
: : f:JAU1fatfi: : < >>>>> >><34~f :<-=-: << : H~6i2 iill#r!~~U~illl-i. 1 :1:11111111-::11::1:1::11:1_11:11~~:; 1:1::111;11111:1111::~11:@ 11:1~~l~ili~/i//lill lllli/!/ii 1 !i!11i:!:1:111:111111;11J~ll ;1:1:1111:1::::111!!!!! 1 ~.~ Walk 442 46.8
No Response 3 0.3
TOTAL 945 100.0
vious modes. The response to this question was very low, indicating the possibility that some of the interviewers misunderstood the instructions and terminated the interview if the respondent was not a long-term employee. According to several interviewers, however, many recent employees perceived no alternative and indicated that the Q3 was their sole means of access to JFK. This supports another major argument in favor of the Q3 extension, that it would expand employment opportunities and serve as a plus in recruitment for JFK-based companies. Of those recent employees who indicated an alternative, 71 percent cited private automobile or taxi and 29 percent mentioned another bus route (Table 8).
To summarize briefly, the survey results have confirmed the importance of the Q3 extension for airport employees, particularly in southeast Queens, who previously did not have convenient access via public transportation. These employees form a stable ridership base; recent employees are especially dependent on Q3 service. The only complaint voiced to the interviewers concerned the infrequent late evening service; the latest Q3 schedule provides additional trips in this time period.
TABLE 6 Length of Employment at JFK
3 or More Years 249 26.3
1 - 2.9 Years 334 35.4
Less Than 1 Year 277 29.3
Not Employed at JFK 75 7.9
No Response 10 1.1
TOTAL 945 100.0
Average Length of Employment: 31.4 months
TABLE 7 Previous Mode Used by LongTime JFK Employees
Automobile 125 50.2
Taxi 10 4.0
Bus or Subway- 57 22.9
Bus and Subway 24 9.6
Other 15 6.0
No Response 18 7.2
TOTAL 249 100.0
CONCLUSIONS AND FUTURE DIRECTIONS
33
The survey results indicate that the extension of the Q3 has been successful in terms of a number of criteria:
•Attracting new riders from previous modes. • Attracting new riders when they are hired at the airport, • Establishing a large service area for local bus service to
JFK through transfers with connecting routes, • Expanding employment opportunities at JFK for resi
dents of southeast Queens, and • Reducing automobile congestion in the airport and on
surrounding roadways.
The extension of the Q3 bus to JFK has demonstrated a significant level of demand for local bus service on the part of airport employees. The success of this extension is measured primarily by its increased ridership, with concomitant increases in service frequency, ever since December 1987.
More broadly, its success can be measured from other perspectives. From a community perspective, the expanded access provided from Queens neighborhoods to a major center of employment opportunities achieves an increasingly elusive
TABLE 8 Alternative Mode Used by Recent JFK Employees
Automobile 61 10.0
Taxi 10 1.6
Bus 29 4.7
No Response 511 83.6
TOTAL 611 100.0

34
goal in this era of job relocation to often distant and inaccessible suburbs. From the perspective of an employer, the expansion of the pool of potential employees within reasonable commuting distance ensures a healthy labor market and provides an important advantage in recruitment efforts.
The major reason for the Q3 success is that the extension supplied a service for which there was obvious demand. Beyond this, a primary factor was the extensive network of routes within a single-transfer ride of JFK via the Q3. The northsouth orientation of the Q3 route was important, because this provided free transfer opportunities with all major southeast Queens bus routes (which are oriented in an east-west direction) along with the Hillside Avenue corridor routes. This importance was demonstrated in Table 5, which showed that more than half of Q3 riders into JFK had transferred from another bus.
The widening of the potential market for local bus service to an airport by choosing a route with many transfer connec-
TRANSPORTATION RESEARCH RECORD 1373
tions has been a major consideration in transit authority planning for other route extensions of a Q3 nature. A Brooklyn bus route (BlO) has been proposed for extension to JFK. The BlO was selected from a number of candidate routes in part because of the number of connections it offers to other Brooklyn bus routes. At LaGuardia Airport in northern Queens, a new route has been proposed to tap potential employee markets in Harlem and (through transfer privileges) upper Manhattan and northwestern Queens. Both of these proposed routes would vastly simplify public transportation access to the airports from the neighborhoods served.
A well-designed local bus route serving a remote employment center and offering extensive connections with other major routes can attract significant ridership. The Q3 route extension has successfully tapped the employee market segment at JFK and has demonstrated the important but less obvious role of the metropolitan airport as a major employment center.

TRANSPORTATION RESEARCH RECORD 1373 35
Planning of Parallel Pier Airport Terminals with Automated People Mover Systems Under Constrained Conditions
S. C. WIRASINGHE AND S. BANDARA
Automated people mover (APM) systems are used in large airport terminals to reduce passenger walking and to improve terminal operation. However, there is a trade-off between passenger convenience and APM cost. If a terminal geometry is selected without the explicit consideration of both factors, it can result in needless passenger walking or increased expenditure for the APM. A method is proposed to determine an optimum geometry for a parallel pier/APM airport terminal with certain constraints. It is capable of restricting the number and the lengths of remote piers to satisfy airline and space requirements. The terminal geometry in terms of the number of piers and their sizes is obtained by minimizing the total cost of the system, which includes the disutility of walking, disutility of using the APM system (riding and access, egress, and waiting time) and the relevant capital and operating costs of the APM, subject to the constraints and the number of aircraft gates. Two case studies, the new Denver and the Atlanta Hartsfield airports, are presented to demonstrate the application of the proposed method. It is shown that the optimum terminal geometry is sensitive to the ratio of the cost of walking per unit time to the cost of riding per unit time, which can be interpreted as the relative disutility of walking. Further, the optimal geometries for the two airports are compared and contrasted with the design geometries.
The increased demand for air transport and specially the increase in hub and spoke operations has resulted in a need for large airport terminals. Some of the larger airports, such as Atlanta and Dallas-Fort Worth, have used automated people mover (APM) systems to reduce walking, especially to improve the level of service for transferring passengers. In a number of recent terminal designs, pier-type terminals with APMs have been considered when the terminal has a high percentage of transfer passengers (e.g., new airports in Denver and Seoul). The best arrangement for a pier-type terminal with an APM is to connect the terminal block to the centers of piers, located parallel to each other, by a below-grade concourse along which the APM is operated (e.g., Atlanta; see Figure 1). This arrangement is preferable because passenger walking distances between piers, and between piers and the terminal block, are essentially eliminated. The operation of the APM vehicles is along a simple linear route, in all-stop mode, at stations centered on each pier. This configuration is also preferable with respect to the aircraft taxiing distances if the terminal is located between two runways. Other advantages are the potential for expansion (number
Department of Civil Engineering, University of Calgary, Calgary, Alberta, Canada TIN 1N4.
and length of piers) and the potential for easy transfer between a rail system (for airport access) and the APM.
Interest in the configurations and geometries of airport terminals has been renewed in recent years. Geometries (i.e., the arrangement of gates and piers) that minimize walking for arriving, departing, hub, and nonhub transfer passengers have been proposed by Bandara (1) arid Bandara and Wirasinghe (2) for satellite and pier-finger terminals, respectively. Robuste (3) undertook a similar analysis for arriving, departing, and hub transfer passengers for centralized pierfinger (remote and attached) and certain other configurations; the remote piers were found to decrease in length with increasing distance from the terminal block. Bandara and Wirasinghe presented guidelines for choosing among satellite, pier-finger, and pier-satellite configurations for nonhub, moderate-hub, and all-hub (wayport) terminal concepts (4). Shen incorporated the effects of an APM in a terminal by setting the distance traveled using the APM equal to zero (5). McKelvey and Sproule compared different intra-airport transportation systems, for two basic unit terminals with 8 and 16 gates and their combinations, taking into account the capital, operating, and maintenance costs and related travel times and walking distances ( 6).
If a parallel pier-type terminal with an APM is to be considered along with other terminal configurations, it is necessary during the early planning stages of an airport to consider the best geometry for each configuration in the comparison. The high cost of APM systems and high disutility of walking makes it essential that a utility-maximizing geometry be chosen for a terminal with an APM, even if a comparison with other configurations is not being made.
Wirasinghe and Bandara have proposed a method to determine the unconstrained geometry for a parallel pier terminal with an APM (Figure 1) that minimizes the sum of the disutilities associated with passenger walking, as well as waiting for and riding the APM system, and the relevant APM capital and operating costs (7). The terminal type considered consists of uniformly spaced remote parallel piers (not necessarily of equal length) and a pier attached to the terminal block. Only the number of gates is prespecified. However, in practice, it may not be possible to implement such a geometry when the number of piers and their lengths are constrained by airline requirements and space availability.
The main objective of this paper is to determine the geometry taking into account any constraint due to airline requirements or space availability. A secondary objective is to

36
y
TERMINAL
BLOCK"--------~
TRANSPORTATION RESEARCH RECORD 1373
xn
l...-APM LINE
• =•=b==-====•= ::::::1-== "'-. s .........-: .. -v--
y
FIGURE 1 Parallel pier-type terminal.
analyze the geometries of an existing parallel pier/ APM terminal (Atlanta) and one under construction (the new airport in Denver, or New Denver).
UNCONSTRAINED GEOMETRY
Wirasinghe and Bandara have considered the optimum unconstrained geometry for a centralized terminal with parallel remote piers and a terminal pier, as shown in Figure 1 (7). It is assumed that the size of the terminal in terms of the planned number of gate positions, G, is known and that all gates are identical and evenly spaced. Gates are located on both sides of all the piers and along the airside of the terminal block. The width of the section of the terminal block at which aircraft are parked on the airside, b, and the spacing between gates, Sg, are known. Piers are arranged parallel to each other at a uniform spacing, S, and the below-grade APM system that connects the piers to the terminal block runs through the middle of each pier. The total airside frontage available for gates is
n
2L = GSg = 4y + b + 2 2: X; (1) i=l
where the x;'s represent the lengths of the remote piers i = 1, . . . n, and y represents the lengths of the half-piers attached to the terminal block (Figure 1).
Passengers are assumed to be uniformly distributed among gates over the life of the terminal and divided into two major groups: those arriving and departing and those transferring. The fraction of transfers with respect to the total number of passengers is defined as P. Transferring passengers are divided into two groups: nonhub and hub, depending on whether they are required to visit the terminal block before departure. The fraction of hub transfers with respect to the total transfers is defined as Q. Hub transfers are further divided into two groups for which a fraction, r, of hub transfers is assumed to depart from a gate in their arrival pier _and the remaining fraction, 1 - r, is assumed to have an equal probability of departing from any gate in the terminal, including the arrival pier.
~/ . STATIONS
REMOTE PARALLEL PIERS
It is assumed that the APM stations are identical and are located at the middle of each remote pier. APM vehicles operate at a known uniform headway. The running time between stations is known, and all the passengers, other than transfers within a pier, will use the APM system.
The objective is to determine the geometry that minimizes the total disutility associated with the terminal/ APM system. The cost components related to the total disutility are divided into user costs and operator costs: user costs include the disutilities associated with walking, level changes, and waiting for and riding the APM; operator costs consist of the relevant APM capital, operating, and maintenance costs. Only the relevant mandatory walking distances within the terminal, which include the walking distance between two gate positions or the walking distance between a gate and an APM station, are taken into account.
The mean disutility of walking is obtained by multiplying the mean walking distance by the perceived mean cost of walking a unit distance, 'Yw· The disutility associated with travel by APM consists of two components: disutility of riding and disutility of access, egress, and waiting for the APM system. The mean disutility of riding is obtained by multiplying the mean riding distance by the mean cost of riding a unit distance, 'YR· The value of 'YR is obtained by dividing the mean cost of riding the APM system per unit time (value of time) by the mean operating speed of an APM vehicle. The passengers who use the APM system will experience the disutility associated with access, egress, and waiting only once during their trips irrespective of the riding distance. The access and egress disutilities are those related to extra walking and level changes (usually using escalators) to get to and from a station. If -y A represents the perceived mean cost associated with access, egress, and waiting per passenger, the mean disutility of access, egress, and waiting per passenger is obtained by multiplying the disutility of access and waiting by the probability that a passenger will use the APM system.
The components of the capital cost-station, line, and fleet costs-are functions of the number of remote piers, n. The costs of the stations at the terminal block and the costs of the piers are excluded because they are essentially common to any terminal geometry. As the operating cost (including maintenance cost) of the APM system can also be expressed as a

Wirasinghe and Bandara
function of the number of remote piers, the total APM cost per passenger, -y0 , is expressed as a function of the number of remote piers.
The geometry of the terminal is defined by the number and lengths of remote piers and the length of the pier connected to the terminal block. The optimum geometry minimizes the total disutility of intraterminal travel. The unknowns are the number of remote piers, n; the lengths of the remote piers, X; for i = 1 to n; and the half length of the terminal pier, y. The trade-off between the user costs and the operator costs indicates that there will be a minimum-disutility solution. If n is assumed to be given, the optimum pier lengths can be obtained by minimizing an objective function (see Appendix A, Equation 2) consisting of the user and operator costs. The optimum geometry for a given configuration can be obtained by comparing the total cost for the optimum geometries for each integer value of n between the lower and the upper bounds.
It is shown that, in general, the optimum geometry consists of a nonuniform set of piers with longer piers toward the terminal block. The optimum geometry is sensitive to the ratio of the cost of walking to the cost of riding per unit time, which can be interpreted as the relative disutility of walking.
CONSTRAINED GEOMETRY
In practice, some major airlines may require their gates to be in a single exclusive pier or want to keep the maximum walking distance below an acceptable limit. Each can be accomplished by fixing certain pier lengths. However, it may not be possible to accomplish both together. Furthermore, land availability or the orientation of runways could govern the number of remote piers and their lengths. The method proposed by Wirasinghe and Bandara is extended here to account for constraints (7).
The number of gates (or equivalently the pier length) for the pier attached to the terminal block and the gates in up to n - 1 consecutive remote piers starting from the one closest to the terminal block (Pier 1) can be prespecified. The search for the optimum solution can be restricted to a specified number of remote piers.
Several parallel pier configurations as shown in Figure 2 are analyzed. The differences among the three configurations are found essentially in the variations of the gate arrangement on the airside of the terminal block and the attached terminal pier.
Parallel Pier Terminal
A parallel pier terminal (Figure 2a) has at least one remote parallel pier and gates along the airside of the terminal block. Furthermore, gates are located on both sides of a terminal block pier.
Modified Parallel Pier Terminal
A modified parallel pier terminal (Figure 2b) is similar to a parallel pier terminal with one exception: gates are located
37
only on the airside of the terminal block pier. The cause is usually the proximity of terminal access roads. This is essentially the Atlanta configuration.
Remote Parallel Pier Terminal
A remote parallel pier terminal (Figure 2c) has no pier or gates attached to the terminal block. The spacing between the first remote pier and the terminal block is reduced in comparison to the parallel pier and modified parallel pier configurations. This is similar to the New Denver configuration.
Let
y = length of half-piers attached to terminal block, b1 = width of terminal block, and xj = length of remote pier that is prespecified, where j = 1,
... m forms n.
When there are gates at the airside of "the terminal block, the number of gates should be specified so that the airside frontage at the terminal block available for gates, b, used in Equation 1, can be calculated. When there are no gates at the terminal block, b becomes zero; otherwise b is equal to b 1•
The terminal configuration in which there is no terminal block pier (Figure 2c) can be obtained by setting the value of y to zero. The configuration in which the terminal block pier has gates only on one side (Figure 2b) can be obtained by specifying the entire pier length as the terminal block width. The proposed model is also applicable when the spacing between the terminal block and Pier 1 is different from the uniform spacing, s, between remote piers for all the configurations discussed. Let S1 be the spacing between the terminal block and Pier 1 and let S0 = S - S1• The objective function that represents the total (user and operator) disutility of the system for a constrained configuration is obtained by modifying the objective function for the unconstrained configuration (see Appendix A, Equation 7).
It can be shown that the geometry for Q = 0 (no hub transfers) can be considered as the lower bound for the optimum solution. When Q = 0, it is also possible to determine the values of y and the remote pier lengths x;. The pier lengths should always be positive, so the maximum number of remote piers, n1m, for a given number of gates can also be calculated. The optimum geometry that represents the lower bound is obtained by comparing the total cost for the solutions for each integer value of n between 1 and n 1m. When the lower bound is known, the optimum geometry is obtained by comparing the total cost for each integer value of n between the lower bound and the value of n that ensures that all optimal remote pier lengths are positive.
The optimum solution for a given n is obtained by solving n + 1 nonlinear simultaneous equations that represent the partial derivatives of the. objective function with respect to each of the pier lengths. These equations are solved numerically using Zeidel's method of iteration [Zuguskin (8)]. A computer program (PP APM) has been developed to determine the optimum constrained or unconstrained geometries

for any of the configurations discussed [Bandara and Wirasinghe (9)].
CASE STUDIES
Two case studies that represent Atlanta Hartsfield and New Denver airports are considered. In the following section, variations in the optimal terminal geometry with respect to user costs and imposed geometrical constraints are discussed.
Cost Components
The average value of time of an air traveler is considered to be $0.75/min in 1990 dollars (7). Assuming that walking will require an additional effort, ranges of values are considered to represent the walk/ride cost ratio with respect to time and to distance. The disutility of walking is considered to be linearly related to the walking distance. It is assumed that riding will be five times faster than walking. Allowing for boarding and alighting at stations, an average APM travel time of 2.4 min/km is considered. Waiting and access cost is calculated
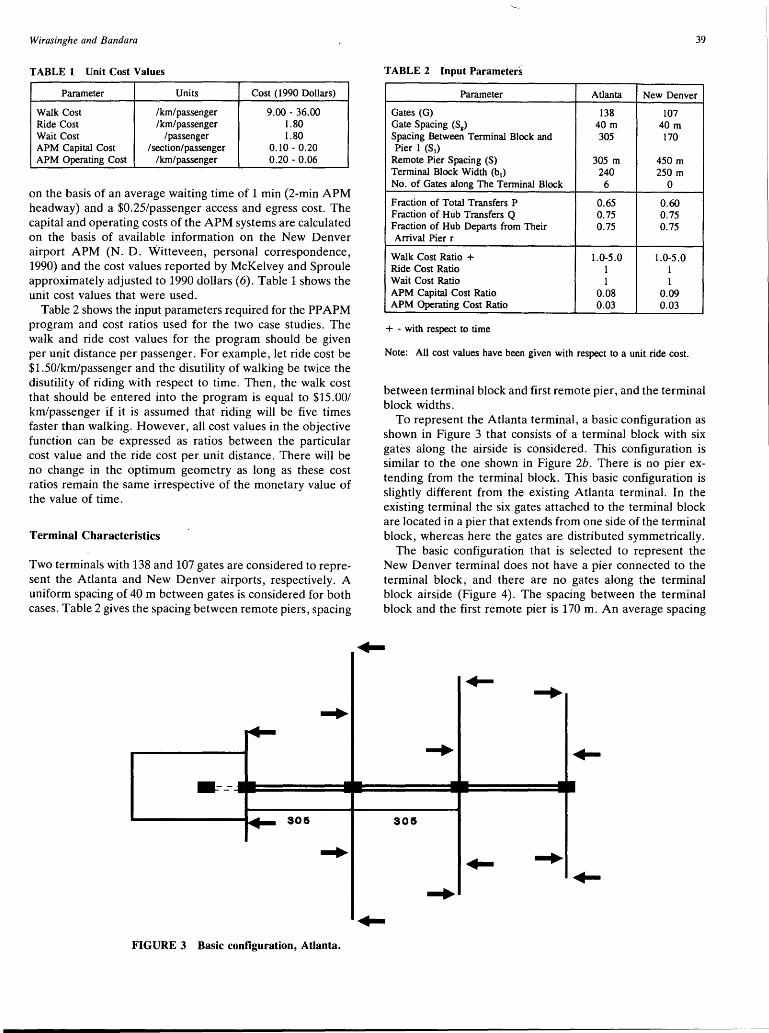
Wirasinghe and Bandara
TABLE 1 Unit Cost Values
Parameter Units Cost (1990 Dollars)
Walk Cost /km/passenger 9.00 - 36.00 Ride Cost /km/passenger 1.80 Wait Cost /passenger 1.80 APM Capital Cost I section/passenger 0.10 - 0.20 APM Operating Cost /km/passenger 0.20 - 0.06
on the basis of an average waiting time of 1 min (2-min APM headway) and a $0.25/passenger access and egress cost. The capital and operating costs of the APM systems are calculated on the basis of available information on the New Denver airport APM (N. D. Witteveen, personal correspondence, 1990) and the cost values reported by McKelvey and Sproule approximately adjusted to 1990 dollars (6). Table 1 shows the unit cost values that were used.
Table 2 shows the input parameters required for the PP APM program and cost ratios used for the two case studies. The walk and ride cost values for the program should be given per unit distance per passenger. For example, let ride cost be $1.50/km/passenger and the disutility of walking be twice the disutility of riding with respect to time. Then, the walk cost that should be entered into the program is equal to $15.00/ km/passenger if it is assumed that riding will be five times faster than walking. However, all cost values in the objective function can be expressed as ratios between the particular cost value and the ride cost per unit distance. There will be no change in the optimum geometry as long as these cost ratios remain the same irrespective of the monetary value of the value of time.
Terminal Characteristics
Two terminals with 138 and 107 gates are considered to represent the Atlanta and New Denver airports, respectively. A uniform spacing of 40 m between gates is considered for both cases. Table 2 gives the spacing between remote piers, spacing
... ... - -- --
~ sos ~ ...
FIGURE 3 Basic configuration, Atlanta.
39
TABLE 2 Input Parameters
Parameter Atlanta New Denver
Gates (G) 138 107 Gate Spacing (Sg) 40 m 40 m Spacing Between Terminal Block and 305 170 Pier 1 (S 1)
Remote Pier Spacing (S) 305 m 450 m Terminal Block Width (b1) 240 250 m No. of Gates along The Terminal Block 6 0
Fraction of Total Transfers P 0.65 0.60 Fraction of Hub Transfers Q 0.75 0.75 Fraction of Hub Departs from Their 0.75 0.75 Arrival Pier r
Walk Cost Ratio + 1.0-5.0 1.0-5.0 Ride Cost Ratio 1 1 Wait Cost Ratio 1 1 APM Capital Cost Ratio 0.08 0.09 APM Operating Cost Ratio 0.03 O.Q3
+ - with respect to time
Note: All cost values have been given with respect to a unit ride cost.
between terminal block and first remote pier, and the terminal block widths.
To represent the Atlanta terminal, a basic configuration as shown in Figure 3 that consists of a terminal block with six gates along the airside is considered. This configuration is similar to the one shown in Figure 2b. There is no pier extending from the terminal block. This basic configuration is slightly different from the existing Atlanta terminal. In the existing terminal the six gates attached to the terminal block are located in a pier that extends from one side of the terminal block, whereas here the gates are distributed symmetrically.
The basic configuration that is selected to represent the New Denver terminal does not have a pier connected to the terminal block, and there are no gates along the terminal block airside (Figure 4). The spacing between the terminal block and the first remote pier is 170 m. An average spacing
... ... ...
-- - -
305 ... ... -+

40 TRANSPORTATION RESEARCH RECORD 1373
..... ... ..... ..... 170 '450
-=== -~ ._
..... FIGURE 4 Basic configuration, New Denver.
of 450 m between remote piers is· used for the calculations. This configuration is similar to the configuration shown in Figure 2c. In the actual New Denver configuration, the gate spacings are not uniform across all piers.
Four groups of configurations, which represent different levels of geometrical constraints as shown in the following, are considered for the analysis. These configurations are compared with respect to different walk/ride cost ratios.
A B c D
E F
Comparison
Configuration
Basic with no additional constraints Basic for existing number of piers Basic with first remote pier length specified No geometrical constraints with gates along
the terminal block airside No constraints and no APM system Actual (existing) geometry
First the basic configurations, A, for both terminals are analyzed for different walk/ride cost ratios between 1 and 5. A walk/ride cost ratio with respect to time of 1 assumes walking will not require an additional effort relative to riding. A high value of 5 is selected as the upper limit to study how the optimum number of remote piers increases with the walk/ride cost ratio.
User and operator costs corresponding to the existing geometry and optimum geometries for the other configurations are obtained for walk/ride cost ratios of 1and2, respectively. A walk/ride cost ratio of 2 is selected as a reasonable value to account for the disutility of walking. Sensitivity of the optimum geometries to the fraction of hub transfers who transfer from the same pier, r, is tested. The results show that the optimum geometries are insensitive to the value of r; to the fraction of total transfers, P; and to the fraction of hub transfers, Q, used for the calculations.
- -~
..... .. Figure 5 shows how the optimum number of piers for the
two terminals increases with the walk/ride cost ratio. However, the rate at which the remote number of piers changes decreases with the walk/ride cost ratio. It is found that the geometries corresponding to walk/ride cost ratios of 1.1 and 1.07 are the closest representations of the actual (existing)
REMOTE PIERS 10~~~~~~~~~~~~~~~~~~~~~--
9
8
7 ++····+····+····+···
6 +···+++··+·+
5 +··+··+·+
4
3 .·
2
1 '--~-'-~--'-~-'-~--'-~~'--~-L-~~~---'--~--'-~--'
1.0 1.4 1.8 2.2 2.6 3.0 3.4 3.8 4.2 4.6
WALK/RIDE COST RATIO
--- ATLANTA ·+···NEW DENVER
FIGURE 5 Number of remote piers versus walk/ride cost ratio.
5.0

Wirasinghe and Bandara
geometries of the Atlanta and New Denver airports, respectively.
Tables 3 and 4 show the optimum number of remote piers, pier lengths, mean walking distance, and total cost of the system for the different configurations considered. Figures 6 and 7 show the variations in walking distance and total cost for the selected configurations.
Atlanta Airport
Referring to Figures 6 and 7 it can be seen that the noconstraint configuration (D) is the best alternative with respect to total cost irrespective of the disutility of walking considered. As expected, any geometrical constraint tends to increase the total cost. The optimum geometry for a walk/ ride cost ratio of 1 is not significantly different from the existing geometry, indicating that the extra disutility of walking has not been considered in the design. The additional tunnel constructed between remote Piers 2 and 3 is a further indication that the existing geometry does not provide low passenger walking distances.
It can be seen that this design can be improved with respect to both the total cost and the passenger walking if the number of remote piers is increased by 2. However, if only passenger walking is considered, the existing configuration (F) and the basic configuration with no constraints (A) become the best alternatives for the walk/ride cost ratios of 1 and 2, respectively. When there is no APM system available, the optimum number of remote piers decreases to 2 while the mean walking distance increases to 552 m (338 m within piers and 214 between piers). It can also be seen that the existing geometry a'nd the basic configuration with four remote piers (B) are
TABLE 3 Optimum Geometries, Atlanta Airport
I I A B c I D E I F I Walk/Ride Cost Ratio = 1
Walking Distance (m) 227 227 226 249 552 225 Total Cost + 2770 2770 2775 2406 2781 Optimum No. of Piers 4 4 4 3 2 4 Terminal Block 6 6 6 38 58 6 Pier 1 38 38 35 37 54 35 Pier 2 35 35 37 34 35 34 Pier 3 32 32 32 30 32 Pier 4 28 28 29 32
Walk/Ride Cost Ratio = 2
Walking Distance (m) 154 225 163 167 225 Total Cost + 3661 3901 3694 3372 3904 Optimum No. of Piers 6 4 6 5 4 Terminal Block 6 6 6 24 6 Pier 1 26 36 35 26 35 Pier 2 25 34 23 25 34 Pier 3 24 33 22 23 32 Pier 4 22 30 19 22 32 Pier 5 20 18 19 Pier 6 17 16
+ Cost in $ = Cost x Ride cost per unit distance/ 1000
41
TABLE 4 Optimum Geometries, New Denver Airport
I A B c I D
Walk/Ride Cost Ratio = 1
Walking Distance (m) Total Cost+ Optimum No. of Piers Terminal Block Pier 1 Pier 2 Pier 3 Pier 4
241 241 2765 2465
3 3
37 37 36 36 34 34
188 254 2769 2166
4 2 37
35 38 26 32 25 21
Walk/Ride Cost Ratio = 2
Walking Distance (m) Total Cost + Optimum No. of Piers Terminal Block Pier 1 Pier 2 Pier 3 Pier 4 Pier 5
146 241 160 3695 3970 3715
5 3 5
23 22 22 21 19
37 36 34
35 20 19 17 16
155 3111
4 23 24 23 20 17
+ Cost in $ = Cost x Ride cost per unit distance/ 1000
EI _F_
439
2 39 48 20
248 2784
3
35 44 28
249 4027
3
35 44 28
the least preferable alternatives with respect to total cost, especially if the walk/ride cost ratio is 2. In Figure 8 the optimum geometries in terms of the number of gates for Configurations A and B and the overall best configuration, D, are compared to the existing geometry.
New Denver Airport
The no-constraint configuration is the best alternative with respect to the total cost; the existing geometry is the least preferable. This design could also be improved by adding two more piers. If it is necessary to have only three remote piers, the design could be improved by making the pier lengths more uniform.
The best alternatives with respect to walking for walk/ride cost ratios of 1 and 2 are configurations C and A, respectively. The optimum geometry when there is no APM available has two remote piers, and the mean walking distance is 660 m (278 m within piers and 160 m between piers). In Figure 9 the optimum geometries for Configurations A, B, and Dare compared with the existing geometry.
CONCLUSIONS
In general, the optimum geometry consists of a nonuniform set of piers with longer piers toward the terminal block. A configuration with a terminal block pier is the best alternative with respect to total cost of the system. The optimum geometry is sensitive to the disutility of walking, that is, the ratio of the cost of walking to the cost of riding per unit time. Because costly APMs are installed presumably to reduce the disutility of walking, it is essential that this disutility is explicitly considered in the design.

m 400.0~~~~~~~~~~~~~~~~~~~
350.0.
A B C D E F
Configuration
~ Walk/Ride =
m 400.0.--~~~~~~~~~~~~~~~~~~
350.0
300.0.
A B C D E F
Configuration
WIIl Walk/Ride = 2
FIGURE 6 Variation in walking distance: left, Atlanta; right, New Denver.
Cost units 4500~~~~~~~~~~~~~~~~~~~~
4000
3000
2500
2000
A B C D F
Configuration
~ Walk/Ride = 1
Cost units 4500.--~~~~~~~~~~~~~~~~~~----,
A B C D F
Configuration
mtJ Walk/Ride = 2
FIGURE 7 Variation in total cost: left, Atlanta; right, New Denver.

Wirasinghe and Bandara
I
(38) (35) (32) (28)
I
I I I I I
I I I
I I : I
(6) I I I
I I I
I I' n I I I I
I
I 1 u I I I I
I I
6 (6] I I I I
I I I I
I I
I I
I : (24] :(26] :(25] '(22]
32 32
(38) (35) (32) (28) I
(6)
~-~.h,-tt-n~-----~__,1-'-!+-~~+'-+l~~-+'-+l .__ _ __.1,LJ
6 (6)
I (36] I [34] (33] (30] 35 34 32 32
(3,8) (37) (34) (30)
I I I I
I
I; I
I: I
6: I
:(24] :(26) :(25] t23] (22]
35 34 32 32
-- EXISTING ()
COST RATIO = 1
=[ =l = COST RATIO = 2
(20] [1 7]
(1 9]
FIGURE 8 Comparison of Atlanta configurations: top, basic, no constraints; middle, basic, four piers; bottom, unconstrained.
It can be seen that the disutility of walking has not been explicitly taken into account in the designs of Atlanta and New Denver terminals. However, for the Atlanta airport the existing geometry is not significantly different from the constrained optimum geometry if the number of remote piers is fixed a priori at four. The New Denver design can also be improved by increasing the number of piers or adjusting the number of gates in each of the three existing remote piers. However, the nonuniform gate spacing across piers used in the actual design has not been considered in this study.
The proposed method is useful in determining the number of remote piers and their lengths subject to any geometrical constraints. The ability to assess the sensitivity of the selected geometry to the uncertain input parameters is also useful in making a decision.
REFERENCES
1. S. Bandara. Optimum Geometries for Satellite Type Airport Terminals. In Transportation and Traffic Theory (M. Koshi, ed.). Elsevier, New York, N.Y., 1990, pp. 409-428.
2. S. Bandara and S. C. Wirasinghe. Optimum Geometries for Pier Type Airport Terminals. Journal of Transportation Engineering, ASCE, Vol. 118, No. 2, 1992, pp. 187-206.
3. F. Robuste. Centralized Hub-Terminal Geometric Concepts I: Walking Distance. Journal of Transportation Engineering, ASCE, Vol. 117, No. 2, 1991, pp. 143-158.
(37) (36) (34)
: (23] : (22] (22] (21]
35 44 28
(37) (36) (34)
I I
(37] (36] (34]
35 44 28
(37) (38) (32)
I I
I I
I
I I
I I
I I: I
1: I
I I I
I I
I
: (23] :(24] I (23] (20] (1 I
7]
35 44 28
EXISTING ()
COST RATIO = 1
__ [_]_COST RATIO= 2
FIGURE 9 Comparison of New Denver configurations: top, basic, no constraints; middle, basic, three piers; bottom, unconstrained.
43
(19]
4. S. Bandara and S. C. Wirasinghe. Walking Distance Minimization for Airport Terminal Concepts. Transportation Research, Vol. 26A, No. 1, 1992, pp. 59-74.
5. L. D. Shen. Airport Terminal Designs With Automated People Movers. In Transportation Research Record 1273, TRB, National Research Council, Washington, D.C., 1990, pp. 30-39.
6. F. X. McKelvey and W. J. Sproule. Applications for Intra-Airport Transportation Systems. In Transportation Research Record 1199, TRB, National Research Council, Washington, D.C., 1988, pp. 49-63.
7.- S. C. Wirasinghe and S. Bandara. Remote Pier Airport Terminals With APM Systems. Department of Civil Engineering, University of Calgary, Canada (in preparation).
8. V. L. Zaguskin. Handbook of Numerical Methods for the Solution of Algebraic and Transcendental Equations. Pergamon Press, New York, N.Y., 1961.
9. S. Bandara and S. C. Wirasinghe. PPAPM Computer Program. Department of Civil Engineering, University of Calgary, Alberta, Canada, 1991.
APPENDIX A
INPUT PARAMETERS
The input parameters that are required for the PP APM programs are as follows. The same notations have been used in the following equations.

44
Terminal Characteristics
•Total number of gates-G •Spacing between gates-Sg • Spacing between the terminal block and the first remote
pier-S1
•Spacing between remote piers-S • Number of remote piers for which the lengths are spec-
ified-j • Minimum number of remote piers • Maximum number of remote piers • Optimum number of remote piers-n •Number of gates along the terminal block (if there are
gates)-gb •Width of the terminal block (if there are no gates)-b1
• Number of gates in the terminal block pier (if length is specified)-g1
• Number of gates in each of the length-specified piers-
Passenger Characteristics
• Fraction of total transfers-P • Fraction of hub transfers (with respect to total trans
fers)-Q • Fraction of hub transfers that are known to depart from
their arrival pier-r
Cost Components
•Walking cost per passenger per kilometer-)'w •Riding cost per passenger per kilometer--yR •Waiting and access cost per passenger--yA • Capital cost per passenger per remote pier-'Yc • Operating and maintenance cost per passenger per ki
lometer--y M
TOTAL COST FOR UNCONSTRAINED CONFIGURATION (7)
+ [1 + P - PQ(l + r)]"YA + n)'O (2)
TRANSPORTATION RESEARCH RECORD 1373
where
y = gcS/4
and
F(y) = L + 3by2 + b2y + -(8 3 b3) 3 12
TOTAL COST FOR CONSTRAINED CONFIGURATION
Zm = '?'{ (1 + P - 2PQ{t. ~ n x2 b2]
+ i =t+ 1 i + y2 + by + b tY + 8
+ PQr Lt, q + J, ¥ + Fm(y)]
+ PQ(l - r) [ ± ~ + ± ~ -± x; - ± x; i=1 2 i=j+1 2 i=16L i=j+16L
+Ct.~+ ;t ~) (2y(b, + y) + ~') +Ffl(2y+~)]}+ ~{(l+P
- 2PQ)[ Ct. x! + ;t x1)us - s.)]} + PQ(l - r)l:[ s(t, {t, (i - k)x,
+ ,t., (k - i)x, + ,t., (k - i)x,)
+ ;~t, x;Ct, (i -" k)x, + ,~+, (i - k)x,
+ ,t., (k - i)x,)
+ ( L - ;t, X; + J., xXt, ix;+ J, ix;)) + (2s0 (L -±x; + _± x;)(±x; + ± x;))]
- t=I 1=1+1 t=I 1=1+1
+ [1 + P - PQ(l + r)]'YA + m-y0
(3)
(4)
(5)
(6)
(7)

Wirasinghe and Bandara
where
m= {n -n
if there are geometrical constraints otherwise
2L GSg = 4y + b + 2(± X; + -. i X;) 1=! 1=1+1
and
(83y3 b3) + 2b,y2 + by2 + b2y + -
12
(8)
(9)
(10)
(11)
45
The term in the first square bracket in Equations 2 and 7 represents the mean walking distance within piers for arriving, departing, and nonhub transfer passengers. The terms in the second and third square brackets represent the mean walk for r and 1 - r fractions of hub transfers respectively. The terms in the last two square brackets represent the mean riding distance between piers for arriving, departing, and nonhub transfers and hub transfers, respectively. The last two terms in Equations 2 and 7 represent the mean waiting and access cost per passenger and the operator cost per passenger, respectively.