transportation & logistics | dat index shows spot truck freight volume, rates dip following a...
TRANSCRIPT

www.harriswilliams.de
Harris Williams & Co. Ltd is a private limited company incorporated under English law having its registered office at 5th Floor, 6 St. Andrew Street, London EC4A 3AE, UK, registered withthe Registrar of Companies for England and Wales under company number 7078852. Directors: Mr. Christopher Williams, Mr. Ned Valentine, Mr. Paul Poggi and Mr. Thierry Monjauze,authorised and regulated by the Financial Conduct Authority.
Harris Williams & Co. Ltd Niederlassung Frankfurt (German branch) is registered in the Commercial Register (Handelsregister) of the Local Court (Amtsgericht) of Frankfurt am Main,Germany, under registration number HRB 96687, having its business address at Bockenheimer Landstrasse 33-35, 60325 Frankfurt am Main, Germany. Permanent Representative(Ständiger Vertreter) of the Branch Niederlassung: Mr. Jeffery H. Perkins.
TRANSPORTATION & LOGISTICS
0
INDUSTRY UPDATE │ SEPTEMBER 2015
PAGE |
www.harriswilliams.de
TRANSPORTATION AND LOGISTICS OVERVIEW
1
CONTENTS
M&A TRANSACTIONS
PUBLIC MARKETS OVERVIEW
STOCK PRICE PERFORMANCE
OUR GROUP
CONTACTS
UNITED STATES
Frank MountcastleManaging [email protected]+1 (804) 915-0124
Jason BassManaging [email protected]+1 (804) 915-0132
Joe ConnerManaging Director [email protected]+1 (804) 915-0151
Jeff BurkettDirector [email protected] +1 (804) 932-1334
Jershon JonesDirector [email protected]+1 (804) 932-1356
Jeff KiddVice President [email protected] +1 (804) 915-0178
EUROPE
Jeffery PerkinsManaging Director [email protected]+49 (0) 69 3650638 00
TRANSPORTATION & LOGISTICS
INDUSTRY UPDATE │ SEPTEMBER 2015
TRUCKING | DAT INDEX SHOWS SPOT TRUCK FREIGHT VOLUME, RATES DIP
Following a common seasonal pattern, spot market freight volume declined 8.8percent month over month in August, according to the DAT North AmericanFreight Index. The Index declined from July to August in four of the past 10 years.This year’s fall freight season, which sometimes begins in mid-August, appears tobe starting a few weeks later, the company reported.
Trucking News
MARINE | RECORD NY-NJ PORT VOLUME BODES WELL FOR PEAK SEASON
The Port of New York-New Jersey posted double-digit container growth again inJuly, breaking the import record it set in May and illustrating how U.S. West Coastdiversions are positioning the top U.S. East Coast port for a healthy peak season.The port saw overall traffic jump 14.1 percent on a year-over-year basis to 588,918twenty-foot-equivalent units in July.
Journal of Commerce
AIR | AIR CARGO VOLUMES DROP, AS CHINA’S ECONOMY STUMBLES
Airports from Seattle to Amsterdam are reporting a falloff in cargo traffic to andfrom Asia, in what transportation executives and analysts say is a worrying sign forthe health of global trade. The data, released in recent days by the various airportauthorities, marked the end a months-long stretch of rapid growth in air-freightvolume across the U.S. and Europe.
Wall Street Journal
RAIL | MOST RAILROADS WON’T MEET SAFETY TECHNOLOGY DEADLINE
Congress set a deadline of Dec. 31 for freight and commuter rail companies toinstall technology, which is known as positive train control, after a Californiapassenger train accident in 2008 killed 25 people. But the new report by theGovernment Accountability Office, the investigative arm of Congress, found thatthe vast majority of railroads would not meet that deadline.
New York Times
LOGISTICS | DELIVERY FIRMS FACE STRUGGLE TO FIND HOLIDAY WORKERS
For the past two years, Amazon.com Inc., Wal-Mart Stores Inc., Target Corp. andother big retailers have been flinging up warehouses and distribution centersacross the country to get their online orders to customers faster. In the comingholiday sales season, that building spree could come back to bite them—and thecompanies that deliver their packages.
Wall Street Journal
HARRIS WILLIAMS & CO. DEAL SPOTLIGHT
Harris Williams & Co. announces the acquisition of A.StuckiCompany, a portfolio company of Quad-C Management,by Stone Canyon Industries. A.Stucki is a privately heldcompany comprised of 17 global locations that are focusedon the engineering, reconditioning, machining andmanufacturing of railcar and industrial parts.
Press Release
A.Stucki Company
WHAT WE’RE READING
a portfolio company of
has been acquired by

PAGE |
M&A TRANSACTIONS
2
RECENT M&A TRANSACTIONS1,2
TRANSPORTATION & LOGISTICS
INDUSTRY UPDATE │ SEPTEMBER 2015
Announced Sector Target Business Description Acquirer
9/22/2015 Rail A.Stucki Company Designs, manufactures, reconditions and supplies railcar dynamic
control products for the rail transportation market.
Stone Canyon Industries
9/9/2015 Logistics Eastern Connection
Operating, Inc.
Prov ides transportation and logistics serv ices. Dicom Transportation
Group, L.P.
9/9/2015 Trucking Con-way Inc. Prov ides transportation, logistics, and supply chain management
serv ices to various manufacturing, industrial, and retail customers in
North America and internationally.
XPO Logistics, Inc.
8/27/2015 Air TrumpCard Inc. Prov ides air freight serv ices, particularly domestic heavyweight air
and expedited LTL freight.
Magnate Worldwide, LLC
8/24/2015 Rail Regional Rail, LLC Acquires and operates shortlines, regional railroads, and switching
serv ices in the United States.
Lev ine Leichtman Capital
Partners
8/18/2015 Trucking Sawyers Transport
Limited
Provides road haulage serv ices to businesses in Europe. AGRO Merchants Group
8/17/2015 Logistics Ozburn-Hessey Logistics,
LLC
Provides third party logistics serv ices, including warehousing &
fulfillment, transportation management, custom brokerage, and
international transportation.
Geodis S. A.
8/10/2015 Trucking Hornady Transportation
LLC
Provides flatbed trucking serv ices to customers on the east coast of
the United States.
Daseke, Inc.
8/4/2015 Logistics Hallcon Corporation Canadian provider of specialty outsourced serv ices to the railway
and transit sectors in North America.
Novacap
8/4/2015 Logistics Courier Express
Enterprises LLC
Asset-free provider of B2B last mile serv ices with over 1,000
dedicated delivery prov iders.
Dicom Transportation
Group, L.P.
7/31/2015 Logistics Coyote Logistics, LLC Non-asset based truckload, LTL, and intermodal serv ice provider. United Parcel Serv ice,
Inc.
7/30/2015 Logistics North & South Logistics,
Inc.
Prov ides freight brokerage, focusing on LTL, truckload, and
intermodal freight logistics, throughout the continental United States.
Transport United, Inc.
7/28/2015 Trucking Stagecoach Cartage
and Distribution, LP.
Prov ides regional, intermodal, and over-the-road truckload serv ices
and warehousing and trans-loading solutions.
Roadrunner Transportation
Systems, Inc.
7/27/2015 Logistics SFO Shuttle Bus
Company and Loop
Transportation
Provides employee commuter serv ices as well as airport shuttle
serv ices.
Hallcon Corporation
7/27/2015 Rail Faiveley Transport S.A. International manufacturer and supplier of equipment for the
railway industry.
Westinghouse Air Brake
Technologies Corporation
7/22/2015 Logistics BearWare Inc. Prov ides freight tracking and related solutions for specialty retail
shippers.
The Descartes Systems
Group Inc
7/21/2015 Logistics EXTRA Express Cerritos,
Inc.
Asset-light prov ider of B2B last mile serv ices based in Los Angeles,
CA.
Dicom Transportation
Group, L.P.
7/20/2015 Equipment Allstate Utility Trailers Inc. Prov ides utility trailers, cargo trailers, car trailers, and dump trailers,
parts, and accessories nationwide.
Mobile Mini, Inc.
7/16/2015 Logistics eBay Enterprise, Inc. eBay Enterprise handles warehousing and logistics for third-party
sellers.
Permira Advisers Ltd

PAGE |
5.4x
6.0x
8.0x
9.4x
9.8x
Transportation
Equipment
Trucking
Rail & Rail Services
Marine
Logistics Providers
PUBLIC MARKETS OVERVIEW
3
TRANSPORTATION & LOGISTICS
TEV / LTM EBITDA TEV / 2015E EBITDA
AVERAGE REVENUE GROWTH (2011 – 2014) AVERAGE REVENUE GROWTH (2014 – 2016P)
AVERAGE EBITDA GROWTH (2011 – 2014) AVERAGE EBITDA GROWTH (2014 – 2016P)
INDUSTRY UPDATE │ SEPTEMBER 2015
5.9x
5.5x
7.6x
8.3x
9.8x
Transportation
Equipment
Trucking
Marine
Rail & Rail Services
Logistics Providers
3.5%
6.4%
7.5%
8.7%
11.5%
Marine
Logistics Providers
Trucking
Transportation
Equipment
Rail & Rail Services
(2.4%)
4.2%
5.8%
5.9%
6.5%
Marine
Transportation
Equipment
Logistics Providers
Rail & Rail Services
Trucking
5.5%
7.4%
7.5%
13.8%
17.5%
Logistics Providers
Transportation
Equipment
Marine
Trucking
Rail & Rail Services
8.3%
12.3%
14.7%
14.9%
15.1%
Rail & Rail Services
Logistics Providers
Trucking
Marine
Transportation
Equipment

PAGE |
(33.7%)
(29.9%)
(20.6%)
(9.4%)
(8.8%)
Marine
Rail & Rail Services
Transportation Equipment
Trucking
Logistics Providers
(10.6%)
(4.7%)
(4.5%)
(2.1%)
(0.8%)
Transportation
Equipment
Marine
Logistics Providers
Trucking
Rail & Rail Services
STOCK PRICE PERFORMANCE
4
TRANSPORTATION & LOGISTICS
(Indexed to September 16, 2014)
TRAILING TWELVE MONTHS
MEDIAN % CHANGE (1 MONTH) MEDIAN % CHANGE (12 MONTH)
INDUSTRY UPDATE │ SEPTEMBER 2015
(40%)
(30%)
(20%)
(10%)
0%
10%
20%
Sep-16-2014 Dec-16-2014 Mar-16-2015 Jun-16-2015 Sep-16-2015
Logistics Providers Trucking Rail and Rail Services
Marine Transportation Equipment S&P 500 Index

PAGE |
OUR GROUP
Harris Williams & Co. is a leading advisor to the transportation and logistics M&A market. Our Transportation & LogisticsGroup serves companies in a broad range of attractive niches, including third-party logistics (3PL), truck, rail, marineand air transportation, transportation equipment, and the automotive and heavy duty vehicle market.
TRANSPORTATION & LOGISTICS
RECENTLY CLOSED T&L TRANSACTIONS
DEEP EXPERIENCE ACROSS T&L SECTORS
MARINE TRANSPORTATION
NICHE TRANSPORTATION
TRANSPORTATION EQUIPMENT
RAIL & RAIL SERVICES
AUTOMOTIVE & HEAVY DUTY
VEHICLE
THIRD-PARTY LOGISTICS
AIR TRANSPORTATION
5
INDUSTRY UPDATE │ SEPTEMBER 2015
a portfolio company of
has been acquired byhas been acquired by
a portfolio company of
has been acquired by
a portfolio company of
and
in partnership with
and
RCL Services Group
has sold
tohas been acquired by
a portfolio company of
has been acquired by
a portfolio company of
has been acquired by
a portfolio company of
has been acquired by
a portfolio company of
a portfolio company of
has been acquired by
a portfolio company of
has been acquired by
a portfolio company of
has acquired
a portfolio company of
has been acquired by

Energy, Power & Infrastructure
IndustrialsHealthcare & Life Sciences
Transportation & Logistics
Aerospace, Defense & Government
Services
Business Services
Building Products & Materials
Technology, Media & Telecom
Specialty Distribution
Consumer
PAGE |
HARRIS WILLIAMS & CO. OFFICE LOCATIONS
UNITED STATES EUROPE
BostonTwo International Place24th FloorBoston, Massachusetts 02110Phone: +1 (617) 482-7501Fax: +1 (617) 482-7503
Cleveland1900 East 9th Street20th FloorCleveland, Ohio 44114Phone: +1 (216) 689-2400Fax: +1 (216) 689-2401
Minneapolis222 South 9th StreetSuite 3350Minneapolis, Minnesota 55402Phone: +1 (612) 359-2700Fax: +1 (612) 359-2701
Richmond (Headquarters)1001 Haxall Point9th FloorRichmond, Virginia 23219Phone: +1 (804) 648-0072Fax: +1 (804) 648-0073
San Francisco575 Market Street31st FloorSan Francisco, California 94105, USAPhone: +1 (415) 288-4260Fax: +1 (415) 288-4269
FrankfurtBockenheimer Landstrasse 33-3560325 FrankfurtGermanyPhone: +49 069 3650638 00Fax: +49 069 3650638 01
London63 Brook StreetLondon W1K 4HS, EnglandPhone: +44 (0) 20 7518 8900Fax: +44 (0) 20 7526 2187
NETWORK OFFICES
Beijing
Hong Kong
Mumbai
New Delhi
Shanghai
Transportation & Logistics
Harris Williams & Co. has a broad range of industry expertise, which creates powerful opportunities.Our clients benefit from our deep-sector experience, integrated industry intelligence andcollaboration across the firm, and our commitment to learning what makes them unique. For moreinformation, visit our website.
OUR FIRM
TRANSPORTATION & LOGISTICS
6
INDUSTRY UPDATE │ SEPTEMBER 2015

PAGE |
PUBLIC COMPARABLES
7
TRANSPORTATION & LOGISTICSINDUSTRY UPDATE │ SEPTEMBER 2015
Logistics ProvidersAgility Public Warehousing Company KSC $2,262 $1.95 (4.8%) (33.1%) $2.87 68.1% 10.1x 10.4x 8.8x 7.9x 7.4xAir Transport Services Group, Inc. $871 $8.69 (4.5%) 9.3% $10.96 79.3% 5.0x 5.1x 4.5x 4.4x 4.0xAtlas Air Worldwide Holdings, Inc. $2,408 $37.15 (11.1%) 6.8% $59.47 62.5% 7.9x 8.2x 6.2x 6.0x 6.1xCH Robinson Worldwide Inc. $10,675 $66.79 (0.7%) 0.1% $77.49 86.2% 14.4x 15.1x 12.5x 11.7x 11.0xDeutsche Post AG $35,442 $25.97 (6.8%) (22.4%) $34.75 74.7% 8.4x 9.3x 9.7x 7.2x 6.5xDSV A/S $6,956 $36.68 1.2% 21.3% $38.76 94.6% 11.2x 12.9x 14.6x 13.0x 12.6xEcho Global Logistics, Inc. $847 $21.17 (14.7%) (11.4%) $34.35 61.6% 19.3x 17.5x NM 13.2x 9.1xExpeditors International of Washington Inc. $7,923 $46.11 (4.3%) 11.4% $50.08 92.1% 11.6x 13.1x 11.1x 10.5x 10.0xFedEx Corporation $44,945 $143.47 (8.1%) (9.1%) $185.19 77.5% 7.0x 7.2x 6.2x 6.5x 5.8xForward Air Corp. $1,433 $42.69 (8.8%) (8.0%) $57.65 74.0% 12.2x 13.2x 10.8x 9.8x 8.1xHub Group Inc. $1,390 $37.78 (3.6%) (7.0%) $44.00 85.9% 10.9x 11.1x 10.1x 10.9x 9.3xJB Hunt Transport Services Inc. $9,916 $75.57 (0.8%) 2.6% $93.50 80.8% 11.1x 12.2x 9.9x 9.4x 8.4xKuehne + Nagel International AG $14,826 $127.14 (5.0%) (2.5%) $152.84 83.2% 13.7x 17.1x 14.0x 14.1x 13.3xLandstar System Inc. $2,985 $66.75 (0.1%) (7.7%) $81.80 81.6% 14.9x 12.0x 11.4x 11.0x 10.1xPanalpina World Transport Holding Ltd. $2,468 $114.50 (7.6%) (14.6%) $152.12 75.3% 17.5x NM 15.8x 12.4x 9.7xRoadrunner Transportation Systems, Inc. $1,227 $19.84 (11.2%) (22.4%) $28.51 69.6% 12.1x 11.8x 9.0x 8.0x 7.4xRyder System, Inc. $9,478 $77.94 (3.8%) (14.2%) $100.64 77.4% 6.1x 5.9x 5.6x 5.3x 4.9xTransForce Inc. $3,106 $18.18 7.9% (24.1%) $23.80 76.4% 10.0x 10.6x 8.0x 8.0x 7.4xUnited Parcel Service, Inc. $96,295 $98.26 (0.9%) 0.1% $114.40 85.9% 12.3x 14.2x 11.6x 9.8x 9.2xUniversal Truckload Services Inc. $768 $19.75 (1.9%) (16.6%) $29.06 68.0% 8.8x 8.9x 6.6x 6.5x 6.1xUTi Worldwide Inc. $1,155 $5.55 (26.1%) (49.1%) $14.75 37.6% NM NM NM NM NM World Fuel Services Corp. $3,007 $37.11 (3.9%) (8.8%) $58.50 63.4% 11.0x 14.0x 9.7x 10.0x 8.8xXPO Logistics, Inc. $6,828 $29.46 (15.9%) (23.7%) $50.96 57.8% NM NM NM 15.9x 7.7x
Median (4.5%) (8.8%) 76.4% 11.1x 11.9x 9.8x 9.8x 8.3xTrucking
ArcBest Corporation $636 $26.64 (9.6%) (28.7%) $47.52 56.1% 6.9x 6.4x 3.7x 3.4x 2.9xCeladon Group Inc. 1,050 17.84 (7.4%) (9.8%) 29.15 61.2% 7.4x 10.2x 8.9x 7.8x 6.2xCon-way Inc. 2,992 47.50 35.7% (5.0%) 51.25 92.7% 6.8x 5.9x 6.0x 5.6x 5.1xCovenant Transportation Group, Inc. 547 21.57 (4.3%) 27.9% 36.82 58.6% 6.4x 9.0x 4.9x 4.5x 4.2xHeartland Express, Inc. 1,730 20.43 1.3% (16.4%) 27.96 73.1% 12.5x 10.5x 8.3x 7.1x 6.6xKnight Transportation Inc. 2,321 26.86 4.7% (1.0%) 34.73 77.3% 11.1x 12.2x 8.5x 7.6x 6.8xMarten Transport Ltd. 610 17.70 (2.1%) (3.6%) 24.92 71.0% 5.7x 7.1x 5.0x 4.5x 4.1xOld Dominion Freight Line Inc. 5,763 63.89 (6.3%) (9.4%) 81.48 78.4% 12.3x 11.8x 9.0x 8.5x 7.4xP.A.M. Transportation Services, Inc. 372 44.20 6.8% 31.1% 67.61 65.4% 6.5x 8.5x 6.1x NA NASaia, Inc. 955 32.92 (13.1%) (34.9%) 57.60 57.2% 10.2x 8.4x 5.9x 5.5x 4.8xSwift Transportation Company 4,092 17.62 (11.8%) (10.7%) 29.44 59.9% 7.8x 9.3x 6.6x 6.0x 5.5xUniversal Truckload Services Inc. 768 19.75 (1.9%) (16.6%) 29.06 68.0% 8.8x 8.9x 6.6x 6.5x 6.1xUSA Truck Inc. 324 22.05 12.5% 25.9% 32.14 68.6% 7.2x 7.0x 5.2x 5.1x 4.9xWerner Enterprises Inc. 2,058 27.15 1.3% 8.1% 33.42 81.3% 6.2x 7.5x 5.9x 5.3x 4.9xYRC Worldwide Inc. 1,398 14.70 (15.2%) (29.3%) 25.40 57.9% 10.9x 7.8x 5.0x 4.1x 3.6x
Median (2.1%) (9.4%) 68.0% 7.4x 8.5x 6.0x 5.5x 5.0x
Stock PerformanceStock Price Change from 52-Week TEV / EBITDA
($ in millions except per share data) TEV Current Prior Month Prior Year High % of High Sep-14 Mar-15 Current 2015E 2016P
Transportation & Logistics
TEV / LTM EBITDA as of
PAGE |
PUBLIC COMPARABLES
8
TRANSPORTATION & LOGISTICSINDUSTRY UPDATE │ SEPTEMBER 2015
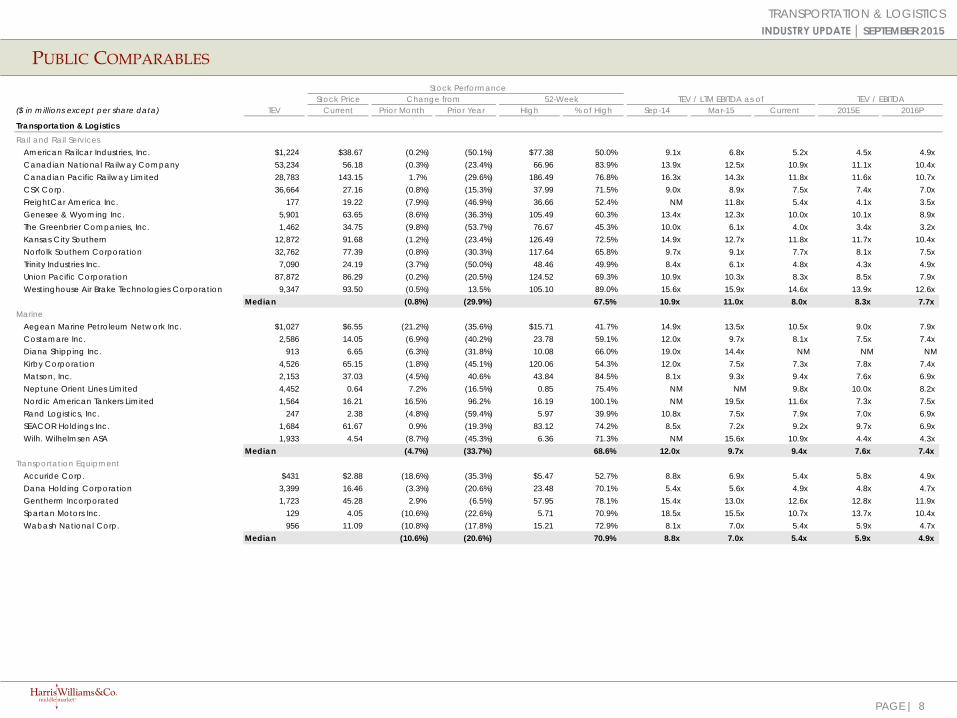
Rail and Rail ServicesAmerican Railcar Industries, Inc. $1,224 $38.67 (0.2%) (50.1%) $77.38 50.0% 9.1x 6.8x 5.2x 4.5x 4.9xCanadian National Railway Company 53,234 56.18 (0.3%) (23.4%) 66.96 83.9% 13.9x 12.5x 10.9x 11.1x 10.4xCanadian Pacific Railway Limited 28,783 143.15 1.7% (29.6%) 186.49 76.8% 16.3x 14.3x 11.8x 11.6x 10.7xCSX Corp. 36,664 27.16 (0.8%) (15.3%) 37.99 71.5% 9.0x 8.9x 7.5x 7.4x 7.0xFreightCar America Inc. 177 19.22 (7.9%) (46.9%) 36.66 52.4% NM 11.8x 5.4x 4.1x 3.5xGenesee & Wyoming Inc. 5,901 63.65 (8.6%) (36.3%) 105.49 60.3% 13.4x 12.3x 10.0x 10.1x 8.9xThe Greenbrier Companies, Inc. 1,462 34.75 (9.8%) (53.7%) 76.67 45.3% 10.0x 6.1x 4.0x 3.4x 3.2xKansas City Southern 12,872 91.68 (1.2%) (23.4%) 126.49 72.5% 14.9x 12.7x 11.8x 11.7x 10.4xNorfolk Southern Corporation 32,762 77.39 (0.8%) (30.3%) 117.64 65.8% 9.7x 9.1x 7.7x 8.1x 7.5xTrinity Industries Inc. 7,090 24.19 (3.7%) (50.0%) 48.46 49.9% 8.4x 6.1x 4.8x 4.3x 4.9xUnion Pacific Corporation 87,872 86.29 (0.2%) (20.5%) 124.52 69.3% 10.9x 10.3x 8.3x 8.5x 7.9xWestinghouse Air Brake Technologies Corporation 9,347 93.50 (0.5%) 13.5% 105.10 89.0% 15.6x 15.9x 14.6x 13.9x 12.6x
Median (0.8%) (29.9%) 67.5% 10.9x 11.0x 8.0x 8.3x 7.7xMarine
Aegean Marine Petroleum Network Inc. $1,027 $6.55 (21.2%) (35.6%) $15.71 41.7% 14.9x 13.5x 10.5x 9.0x 7.9xCostamare Inc. 2,586 14.05 (6.9%) (40.2%) 23.78 59.1% 12.0x 9.7x 8.1x 7.5x 7.4xDiana Shipping Inc. 913 6.65 (6.3%) (31.8%) 10.08 66.0% 19.0x 14.4x NM NM NMKirby Corporation 4,526 65.15 (1.8%) (45.1%) 120.06 54.3% 12.0x 7.5x 7.3x 7.8x 7.4xMatson, Inc. 2,153 37.03 (4.5%) 40.6% 43.84 84.5% 8.1x 9.3x 9.4x 7.6x 6.9xNeptune Orient Lines Limited 4,452 0.64 7.2% (16.5%) 0.85 75.4% NM NM 9.8x 10.0x 8.2xNordic American Tankers Limited 1,564 16.21 16.5% 96.2% 16.19 100.1% NM 19.5x 11.6x 7.3x 7.5xRand Logistics, Inc. 247 2.38 (4.8%) (59.4%) 5.97 39.9% 10.8x 7.5x 7.9x 7.0x 6.9xSEACOR Holdings Inc. 1,684 61.67 0.9% (19.3%) 83.12 74.2% 8.5x 7.2x 9.2x 9.7x 6.9xWilh. Wilhelmsen ASA 1,933 4.54 (8.7%) (45.3%) 6.36 71.3% NM 15.6x 10.9x 4.4x 4.3x
Median (4.7%) (33.7%) 68.6% 12.0x 9.7x 9.4x 7.6x 7.4xTransportation Equipment
Accuride Corp. $431 $2.88 (18.6%) (35.3%) $5.47 52.7% 8.8x 6.9x 5.4x 5.8x 4.9xDana Holding Corporation 3,399 16.46 (3.3%) (20.6%) 23.48 70.1% 5.4x 5.6x 4.9x 4.8x 4.7xGentherm Incorporated 1,723 45.28 2.9% (6.5%) 57.95 78.1% 15.4x 13.0x 12.6x 12.8x 11.9xSpartan Motors Inc. 129 4.05 (10.6%) (22.6%) 5.71 70.9% 18.5x 15.5x 10.7x 13.7x 10.4xWabash National Corp. 956 11.09 (10.8%) (17.8%) 15.21 72.9% 8.1x 7.0x 5.4x 5.9x 4.7x
Median (10.6%) (20.6%) 70.9% 8.8x 7.0x 5.4x 5.9x 4.9x
Stock PerformanceStock Price Change from 52-Week TEV / EBITDA
($ in millions except per share data) TEV Current Prior Month Prior Year High % of High Sep-14 Mar-15 Current 2015E 2016P
Transportation & Logistics
TEV / LTM EBITDA as of

PAGE |
PUBLIC COMPARABLES
9
TRANSPORTATION & LOGISTICSINDUSTRY UPDATE │ SEPTEMBER 2015
Revenue Avg. Revenue Growth EBITDA Avg. EBITDA Growth($ in millions) 2011 2012 2013 2014 2015E 2016P '11-14 '14-16P 2011 2012 2013 2014 2015E 2016P '11-14 '14-16P
Transportation & Logistics
Logistics ProvidersAgility Public Warehousing Company KSC $4,775 $5,039 $4,873 $4,633 $4,622 $4,834 (1.0%) 2.1% $199 $254 $296 $265 $285 $305 10.0% 7.3%Air Transport Services Group, Inc. 730 607 580 590 603 627 (6.9%) 3.2% 181 163 158 179 198 213 (0.3%) 8.9%Atlas Air Worldwide Holdings, Inc. 1,384 1,632 1,643 1,785 1,873 1,897 8.8% 3.1% 203 296 307 344 384 383 19.1% 5.5%CH Robinson Worldwide Inc. 10,336 11,359 12,752 13,470 13,880 14,858 9.2% 5.0% 720 751 731 797 914 971 3.4% 10.4%Deutsche Post AG 68,631 73,191 75,621 68,547 68,605 71,149 (0.0%) 1.9% 3,384 4,129 5,116 4,469 4,905 5,456 9.7% 10.5%DSV A/S 7,639 7,937 8,439 7,896 7,915 8,211 1.1% 2.0% 498 519 543 486 533 567 (0.8%) 8.0%Echo Global Logistics, Inc. 603 758 884 1,173 1,555 2,039 24.9% 31.8% 23 27 27 36 66 92 16.5% 59.7%Expeditors International of Washington Inc. 6,162 5,992 6,080 6,565 7,013 7,506 2.1% 6.9% 655 571 600 644 753 797 (0.6%) 11.2%FedEx Corporation 39,304 42,680 44,287 45,567 47,609 50,100 5.1% 4.9% 4,506 5,367 6,112 6,417 6,891 7,705 12.5% 9.6%Forward Air Corp. 509 584 652 781 977 1,058 15.4% 16.4% 97 104 107 127 149 176 9.4% 17.8%Hub Group Inc. 2,752 3,124 3,374 3,571 3,619 3,845 9.1% 3.8% 112 134 138 135 124 145 6.4% 3.5%JB Hunt Transport Services Inc. 3,678 4,058 4,527 5,083 6,271 6,996 11.4% 17.3% 658 759 830 926 1,056 1,180 12.1% 12.9%Kuehne + Nagel International AG 17,351 18,699 19,290 17,618 21,259 22,442 0.5% 12.9% 1,038 979 1,070 987 1,057 1,111 (1.7%) 6.1%Landstar System Inc. 2,594 2,735 2,628 3,145 3,377 3,594 6.6% 6.9% 204 223 201 250 272 297 6.9% 9.0%Panalpina World Transport Holding Ltd. 6,954 7,227 7,589 6,752 6,498 6,720 (1.0%) (0.2%) 220 92 161 150 199 259 (11.9%) 31.3%Roadrunner Transportation Systems, Inc. 844 1,073 1,361 1,873 2,106 2,255 30.5% 9.7% 54 81 99 121 154 168 30.9% 17.9%Ryder System, Inc. 6,051 6,257 6,419 6,639 6,662 7,028 3.1% 2.9% 1,290 1,396 1,459 1,628 1,780 1,908 8.1% 8.3%TransForce Inc. 2,378 2,822 2,620 2,817 3,287 3,374 5.8% 9.4% 313 392 318 361 387 412 4.9% 6.8%United Parcel Service, Inc. 53,105 54,127 55,438 58,232 58,629 61,764 3.1% 3.0% 7,830 3,201 8,868 6,864 9,751 10,449 (4.3%) 23.4%Universal Truckload Services Inc. 991 1,037 1,033 1,192 1,157 1,200 6.3% 0.3% 84 96 105 115 118 127 11.1% 5.0%UTi Worldwide Inc. 4,550 4,914 4,608 4,436 4,284 3,794 (0.8%) (7.5%) 183 213 146 84 96 73 (22.9%) (6.9%)World Fuel Services Corp. 34,623 38,945 41,562 43,386 33,237 36,497 7.8% (8.3%) 291 287 301 319 303 346 3.0% 4.2%XPO Logistics, Inc. 177 279 702 2,357 6,638 11,612 NM NM 3 (25) (20) 95 413 755 NM NM
Total $276,120 $295,078 $306,963 $308,106 $311,675 $333,399 6.4% 5.8% $22,746 $20,009 $27,672 $25,797 $30,789 $33,894 5.5% 12.3%Trucking
ArcBest Corporation $1,908 $2,066 $2,300 $2,613 $2,708 $2,885 11.1% 5.1% $82 $70 $104 $155 $187 $215 23.5% 17.9%Celadon Group Inc. 467 475 489 615 888 1,029 9.6% 29.3% 89 103 100 97 136 173 3.1% 33.4%Con-way Inc. 5,290 5,580 5,473 5,806 5,693 5,969 3.2% 1.4% 386 428 427 493 528 577 8.5% 8.2%Covenant Transportation Group, Inc. 512 527 539 579 711 756 4.2% 14.3% 63 71 65 89 123 129 11.8% 20.6%Heartland Express, Inc. 529 546 582 871 766 814 18.1% (3.4%) 132 138 149 208 245 262 16.3% 12.2%Knight Transportation Inc. 697 752 792 926 1,236 1,370 9.9% 21.6% 169 184 192 239 305 340 12.3% 19.2%Marten Transport Ltd. 604 638 659 673 684 753 3.7% 5.8% 97 101 110 115 136 149 5.9% 14.0%Old Dominion Freight Line Inc. 1,904 2,135 2,338 2,788 3,023 3,348 13.6% 9.6% 326 396 460 587 678 767 21.6% 14.3%P.A.M. Transportation Services, Inc. 284 298 313 317 NA NA 3.7% NA 29 41 50 55 NA NA 23.7% NASaia, Inc. 1,030 1,099 1,139 1,272 1,254 1,328 7.3% 2.2% 65 107 126 145 172 193 30.3% 15.6%Swift Transportation Company 3,779 3,976 4,118 4,299 4,305 4,695 4.4% 4.5% 549 573 577 583 675 744 2.0% 13.0%Universal Truckload Services Inc. 991 1,037 1,033 1,192 1,157 1,200 6.3% 0.3% 84 96 105 115 118 127 11.1% 5.0%USA Truck Inc. 411 512 555 602 535 560 13.6% (3.6%) 33 20 35 60 64 64 22.0% 3.6%Werner Enterprises Inc. 2,003 2,036 2,029 2,139 2,144 2,284 2.2% 3.3% 311 318 296 318 390 415 0.7% 14.3%YRC Worldwide Inc. 4,869 4,851 4,865 5,069 4,881 5,124 1.4% 0.5% 49 198 199 197 341 384 NM NM
Total $25,277 $26,529 $27,225 $29,761 $29,983 $32,114 7.5% 6.5% $2,466 $2,843 $2,994 $3,455 $4,098 $4,540 13.8% 14.7%

PAGE |
PUBLIC COMPARABLES
10
TRANSPORTATION & LOGISTICSINDUSTRY UPDATE │ SEPTEMBER 2015
Revenue Avg. Revenue Growth EBITDA Avg. EBITDA Growth($ in millions) 2011 2012 2013 2014 2015E 2016P '11-14 '14-16P 2011 2012 2013 2014 2015E 2016P '11-14 '14-16P
Transportation & Logistics
Rail and Rail ServicesAmerican Railcar Industries, Inc. $519 $712 $751 $733 $871 $818 12.2% 5.6% $55 $145 $179 $204 $271 $249 NM 10.5%Canadian National Railway Company 8,881 9,952 9,954 10,478 9,572 10,191 5.7% (1.4%) 4,112 4,624 4,568 4,900 4,770 5,117 6.0% 2.2%Canadian Pacific Railway Limited 4,970 5,568 5,631 5,582 5,147 5,510 3.9% (0.6%) 1,378 1,778 2,190 2,434 2,477 2,700 20.9% 5.3%CSX Corp. 11,795 11,763 12,026 12,669 12,133 12,527 2.4% (0.6%) 4,446 4,523 4,577 4,764 4,922 5,235 2.3% 4.8%FreightCar America Inc. 487 677 290 599 840 841 7.1% 18.5% 12 41 (8) 17 43 54 12.2% NMGenesee & Wyoming Inc. 829 875 1,569 1,639 2,036 2,261 25.5% 17.4% 252 277 534 574 590 659 31.6% 7.2%The Greenbrier Companies, Inc. 1,174 1,736 1,685 2,121 2,647 2,830 21.8% 15.5% 97 152 145 237 427 472 34.5% 41.0%Kansas City Southern 2,098 2,239 2,369 2,577 2,466 2,667 7.1% 1.7% 772 872 962 1,106 1,093 1,233 12.7% 5.6%Norfolk Southern Corporation 11,172 11,040 11,245 11,624 10,729 11,231 1.3% (1.7%) 4,082 4,036 4,169 4,522 4,034 4,388 3.5% (1.5%)Trinity Industries Inc. 2,938 3,812 4,365 6,170 6,818 6,803 28.1% 5.0% 575 730 963 1,400 1,642 1,430 34.6% 1.1%Union Pacific Corporation 18,508 19,686 20,684 22,560 22,494 23,721 6.8% 2.5% 7,341 8,505 9,223 10,657 10,270 11,208 13.2% 2.6%Westinghouse Air Brake Technologies Corporation 1,968 2,391 2,566 3,044 3,370 3,620 15.7% 9.0% 334 436 485 588 672 743 20.8% 12.4%
Total $65,339 $70,451 $73,136 $79,795 $79,123 $83,019 11.5% 5.9% $23,455 $26,119 $27,987 $31,403 $31,213 $33,488 17.5% 8.3%Marine
Aegean Marine Petroleum Network Inc. $6,965 $7,259 $6,335 $6,662 $4,470 $4,604 (1.5%) (16.9%) $75 $85 $75 $98 $115 $136 9.1% 17.7%Costamare Inc. 382 386 414 484 491 509 8.2% 2.5% 236 238 258 318 345 353 10.4% 5.4%Diana Shipping Inc. 256 221 164 176 161 175 (11.8%) (0.1%) 166 124 53 50 32 33 (32.9%) (18.8%)Kirby Corporation 1,850 2,113 2,242 2,566 2,218 2,280 11.5% (5.7%) 445 509 582 647 581 611 13.3% (2.8%)Matson, Inc. 1,463 1,560 1,637 1,714 1,891 2,109 5.4% 10.9% 142 175 172 203 280 304 12.8% 22.3%Neptune Orient Lines Limited 9,211 9,512 8,831 8,617 6,279 6,182 (2.2%) (15.3%) (90) 96 131 294 464 521 NM NMNordic American Tankers Limited 95 131 244 351 292 297 NM NM 10 13 (21) 60 217 201 NM 83.1%Rand Logistics, Inc. 98 109 119 129 149 144 9.9% 5.6% 16 28 25 29 35 36 23.3% 11.0%SEACOR Holdings Inc. 1,032 1,308 1,247 1,319 1,159 1,322 8.5% 0.1% 154 165 194 241 175 248 16.3% 1.4%Wilh. Wilhelmsen ASA 309 395 325 285 2,383 2,501 NM NM 147 227 154 140 451 458 NM NM
Total $21,661 $22,993 $21,559 $22,303 $19,493 $20,123 3.5% (2.4%) $1,299 $1,658 $1,624 $2,080 $2,694 $2,901 7.5% 14.9%Transportation Equipment
Accuride Corp. $805 $795 $643 $705 $720 $717 (4.3%) 0.8% $74 $65 $43 $75 $87 $90 0.2% 9.9%Dana Holding Corporation 7,544 7,224 6,769 6,617 6,258 6,552 (4.3%) (0.5%) 720 753 706 705 723 769 (0.7%) 4.4%Gentherm Incorporated 370 555 662 811 882 992 30.0% 10.6% 46 67 84 135 144 170 42.6% 12.4%Spartan Motors Inc. 426 471 470 507 549 573 6.0% 6.3% 14 16 6 9 12 17 (12.6%) 34.3%Wabash National Corp. 1,187 1,462 1,636 1,863 2,025 2,012 16.2% 3.9% 33 108 142 161 203 210 NM 14.3%
Total $10,331 $10,506 $10,179 $10,504 $10,434 $10,846 8.7% 4.2% $888 $1,008 $981 $1,084 $1,169 $1,256 7.4% 15.1%

PAGE |
TRANSPORTATION & LOGISTICS
SOURCES
TRANSPORTATION & LOGISTICS
INDUSTRY UPDATE │ SEPTEMBER 2015
1. Capital IQ.
2. MergerMarket.
Harris Williams & Co. (www.harriswilliams.com and www.harriswilliams.de) is a preeminent middle market investment bank focused on the advisory needs of clients worldwide. The firm has deep industry knowledge, global transaction expertise, and an unwavering commitment to excellence. Harris Williams & Co. provides sell-side and acquisition advisory, restructuring advisory, board advisory, private placements, and capital markets advisory services.
Harris Williams & Co. Ltd is a private limited company incorporated under English law having its registered office at 5th Floor, 6 St. Andrew Street, London EC4A 3AE, UK, registered with the Registrar of Companies for England and Wales under company number 7078852. Directors: Mr. Christopher Williams, Mr. Ned Valentine, Mr. Paul Poggi and Mr. Thierry Monjauze, authorised and regulated by the Financial Conduct Authority.
Harris Williams & Co. Ltd Niederlassung Frankfurt (German branch) is registered in the Commercial Register (Handelsregister) of the Local Court (Amtsgericht) of Frankfurt am Main, Germany, under registration number HRB 96687, having its business address at Bockenheimer Landstrasse 33-35, 60325 Frankfurt am Main, Germany. Permanent Representative (Ständiger Vertreter) of the Branch Niederlassung: Mr. Jeffery H. Perkins.
The information and views contained in this report were prepared by Harris Williams & Co. (“Harris Williams”). It is not a research report, as such term is defined by applicable law and regulations, and is provided for informational purposes only. It is not to be construed as an offer to buy or sell or a solicitation of an offer to buy or sell any financial instruments or to participate in any particular trading strategy. The information contained herein is believed by Harris Williams to be reliable, but Harris Williams makes no representation as to the accuracy or completeness of such information. Harris Williams and/or its affiliates may be market makers or specialists in, act as advisers or lenders to, have positions in and effect transactions in securities of companies mentioned herein and also may provide, may have provided, or may seek to provide investment banking services for those companies. In addition, Harris Williams and/or its affiliates or their respective officers, directors and employees may hold long or short positions in the securities, options thereon or other related financial products of companies discussed herein. Opinions, estimates and projections in this report constitute Harris Williams’ judgment and are subject to change without notice. The financial instruments discussed in this report may not be suitable for all investors, and investors must make their own investment decisions using their own independent advisors as they believe necessary and based upon their specific financial situations and investment objectives. Also, past performance is not necessarily indicative of future results. No part of this material may be copied or duplicated in any form or by any means, or redistributed, without Harris Williams’ prior written consent.
Copyright© 2015 Harris Williams & Co., all rights reserved.
DISCLOSURES
11