transportation ghg emissions in developing countries.: the case of lebanon
TRANSCRIPT
Transportation GHG emissions in developing countries.The case of Lebanon
M. El-Fadel a,*, E. Bou-Zeid b
a American University of Beirut, Faculty of Engineering and Architecture, 850 Third Avenue, New York 10022, USAb American University of Beirut, P.O. Box 110236/1500, Beirut Lebanon
Received 23 February 1999
Abstract
This paper evaluates the contribution of the road transport sector, in a typical small developing country,to global greenhouse gas emissions. An inventory of transport emissions, using the IntergovernmentalPanel on Climate Change methodology, is presented for the base year 1997. The Motor Vehicle EmissionInventory computer based model, with inputs adjusted to the ¯eet and conditions at hand, is used to predictcontributions of di�erent classes of vehicles and to forecast the corresponding emissions for the year 2020.Emissions reduction and the sensitivity to changes in factors such as ¯eet age, ¯eet technology, averagespeed and travel volume are assessed. Scenarios are developed to explore the feasibility and bene®ts of twodi�erent mitigation approaches. The ®rst approach stresses the reduction potential of measures related tothe ¯eet age and new technology application. The second addresses the e�ectiveness of transport planningand demand reduction in mitigating emissions. The air quality impact of these scenarios is presented. Theresults bring to light the essence of the problem that technical improvements alone, in the existing ¯eet, willnot be able to o�set impacts due to the growth in future travel demand. Policy settings to counterbalancethe increase in emissions are investigated in that context. Ó 1999 Elsevier Science Ltd. All rights reserved.
Keywords: Climate change; Greenhouse gases; Transport emissions; MVEI; Developing country
1. Introduction
Anthropogenic emissions of greenhouse gases (GHG) led, over the past 100 years, to a con-siderable increase in the concentration of these gases in the atmosphere. These GHG act as ablanket that retains solar heat in the atmosphere. Elevated concentrations of GHG cause in-creased atmospheric heat retention. This creates higher global temperatures or what is more
Transportation Research Part D 4 (1999) 251±264www.elsevier.com/locate/trd
* Corresponding author.
1361-9209/99/$ ± see front matter Ó 1999 Elsevier Science Ltd. All rights reserved.
PII: S1361-9209(99)00008-5
commonly known as global warming. This process is suspected to cause adverse environmentalconsequences including coastal zones ¯ooding and deserti®cation. Both ¯ooding and deserti®-cation are likely to a�ect the country of Lebanon signi®cantly since it is located at the border ofdesert regions and more than 60% of its economic activity lies in a narrow coastal plain along theMediterranean sea (ERM, 1995).
Lebanon is a relatively small developing country in the Middle East region. Its area is about10,400 km2 with a population estimated at 3.5 million people. The country's economy was se-verely damaged by 17 years of civil unrest that ended in 1990. Infrastructure rehabilitation anddevelopment has been at the forefront of reconstruction activities particularly improvement of thetransportation sector. A good transportation network is a necessity to the service-orientedeconomy in Lebanon and is expected to generate high travel demand compared to other countrieswith similar Gross Domestic Product (GDP).
2. Transportation emissions
The transportation sector is commonly known to result in signi®cant atmospheric emissions ofnumerous GHG including carbon dioxide CO2, methane CH4, nitrous oxide N2O, nitrogen oxidesNOx, carbon monoxide CO, sulfur dioxide SO2 and non-methane volatile organic compoundsNMVOC (FCCC, 1997; Faiz, 1993; TRB, 1997). Carbon dioxide emissions are by far the mostsigni®cant. In Lebanon, the transportation sector contributes 25% as CO2 equivalent of the totalGHG emissions (UNDP, 1998). This contribution is even more pronounced in some countries. Forinstance, the transportation sector in California emits 43% as CO2 equivalent of the total GHGemissions (CEC, 1991). These numbers do not include emissions associated with fuel productionactivities which amount to 15% as CO2 of the total GHG emissions in the case of California.
Energy use for transport resulted in 1.3 Gt of Carbon emissions in 1990 (IPCC, 1996a). Thisrepresents about 15% of the worldwide GHG emissions (FCCC, 1997; Faiz, 1993). This contri-bution is projected to increase signi®cantly in the future as reported in the projections of Annex 1countries to the Framework Convention on Climate Change (FCCC). Annex 1 countries performcontinuously updated emission inventories, set mitigation targets and make their climate changeprograms data available to the FCCC. For 18 developed countries 1 included in the Annex 1,transportation emissions grew by 6.6% from 1990 to 1995 compared to a 1.2% increase in totalGHG emissions for the same period. Consequently, for these countries, the contribution of thetransport sector to global GHG emissions (excluding land use change and forestry) grew from21.5 to 28% from 1990 to 1995 (FCCC, 1997). On-road vehicle emissions, particularly in devel-oping countries, constitute the greater portion of emissions from transport related activities. InLebanon, for instance, on-road vehicle emissions amount to 99% of total emissions from thetransport sector (UNDP, 1998).
The 1973 oil crises coupled with concerns about tailpipe emissions impact on ambient airquality led developed countries (US, Europe and Japan) to impose strict regulations on vehicle
1 Austria, Belgium, Canada, Czech Republic, Finland, France, Germany, Iceland, Ireland, Monaco, Netherlands,
New Zealand, Norway, Slovakia, Sweden, Switzerland, United Kingdom and United States.
252 M. El-Fadel, E. Bou-Zeid / Transportation Research Part D 4 (1999) 251±264

fuel economy and gas emission rates. In order to meet these regulations, manufacturers wereforced to introduce design changes that improve engine e�ciency and reduce emissions. Thesemeasures resulted in a decrease in vehicle GHG emission factors; however, the total GHGemissions continued to increase due primarily to the rapid growth of the vehicle ¯eet and traveldemand. At present, improved technology has moderated the rate of increase of GHG emissions.Future predictions however, indicate that technology improvements may not keep pace with theincrease in travel demand (FCCC, 1997; Faiz, 1993; Wade et al., 1994). Therefore, the total GHGemissions may increase signi®cantly in the future. Estimates indicate that worldwide CO2 emis-sions from motor vehicles could increase by 50% from their 1993 level by the year 2010 (Faiz,1993).
3. Previous work and present needs
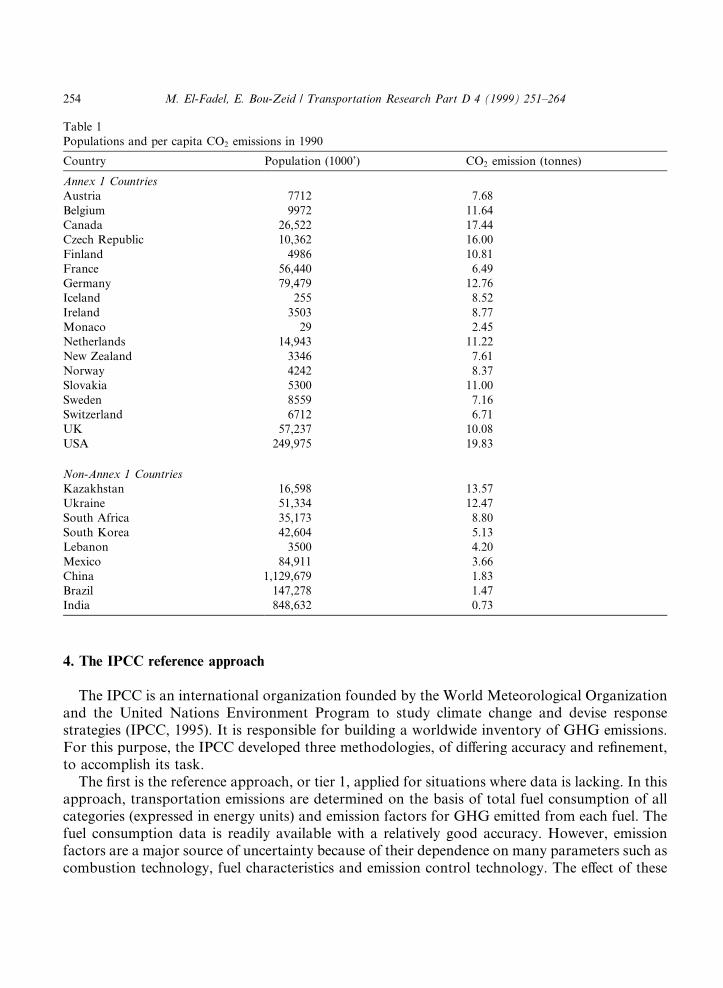
Global environmental concerns particularly potential climate change from GHG emissionshave been at the forefront of current research work in the past decade (IPCC, 1995). Signi®cante�orts and resources have been dedicated to understand the dynamics of the earth's climate andexplore new policies or technologies to decrease GHG emissions. At present, large discrepanciesexist between developed and developing countries. For example, the 18 countries (listed previ-ously), representing around 10% of the world population emit around 45% of global GHG. Theper capita emissions of GHG for these developed countries and other less developed or developingcountries are shown in Table 1 for the year 1990 (FCCC, 1997; Wade et al., 1994).
Attention has been allocated to future emissions from large developing countries such as India,China or Brazil. The global contribution of smaller developing nations has generally not beencharacterized. The ®rst step in that direction is the preparation of an inventory of GHG emissionsby sources and removals by sinks for individual countries. Such an e�ort was recently undertakenin Lebanon in a ful®llment of the Framework Convention on Climate Change (FCCC), rati®ed bythe country in 1994. The work was limited to the development of an inventory, with 1994 as a baseyear, using the Intergovernmental Panel on Climate Change (IPCC) reference approach (IPCC,1996b) without addressing mitigation measures. Plans to develop such measures are under study.In this paper, several mitigation scenarios to reduce GHG emissions from the transportationsector are considered. These scenarios are intended as a guide for future policy settings or miti-gation programs. At present, no mitigation e�orts are applied and the prediction of possiblepolicies in the future is highly uncertain. Therefore, the scenarios are not an assessment of theimpacts of determinate policies.
The IPCC reference approach was used, with the year 1997 as base year, to validate nationalGHG emission estimates obtained through computer simulations. These simulations were per-formed using the Motor Vehicle Emission Inventory (MVEI) model as originally developed by theCalifornia Air Resources Board and modi®ed to re¯ect the Lebanese situation. Emission pro-jections were conducted for the year 2020 and mitigation scenarios, including technological im-provements and policy settings, were compared with a no mitigation alternative. The impacts ofthese scenarios on ambient air quality were also considered. These impacts are particularly im-portant in urban areas such as the capital Beirut where 50% of the transportation activity in theentire country is located.
M. El-Fadel, E. Bou-Zeid / Transportation Research Part D 4 (1999) 251±264 253
4. The IPCC reference approach
The IPCC is an international organization founded by the World Meteorological Organizationand the United Nations Environment Program to study climate change and devise responsestrategies (IPCC, 1995). It is responsible for building a worldwide inventory of GHG emissions.For this purpose, the IPCC developed three methodologies, of di�ering accuracy and re®nement,to accomplish its task.
The ®rst is the reference approach, or tier 1, applied for situations where data is lacking. In thisapproach, transportation emissions are determined on the basis of total fuel consumption of allcategories (expressed in energy units) and emission factors for GHG emitted from each fuel. Thefuel consumption data is readily available with a relatively good accuracy. However, emissionfactors are a major source of uncertainty because of their dependence on many parameters such ascombustion technology, fuel characteristics and emission control technology. The e�ect of these
Table 1
Populations and per capita CO2 emissions in 1990
Country Population (1000') CO2 emission (tonnes)
Annex 1 Countries
Austria 7712 7.68
Belgium 9972 11.64
Canada 26,522 17.44
Czech Republic 10,362 16.00
Finland 4986 10.81
France 56,440 6.49
Germany 79,479 12.76
Iceland 255 8.52
Ireland 3503 8.77
Monaco 29 2.45
Netherlands 14,943 11.22
New Zealand 3346 7.61
Norway 4242 8.37
Slovakia 5300 11.00
Sweden 8559 7.16
Switzerland 6712 6.71
UK 57,237 10.08
USA 249,975 19.83
Non-Annex 1 Countries
Kazakhstan 16,598 13.57
Ukraine 51,334 12.47
South Africa 35,173 8.80
South Korea 42,604 5.13
Lebanon 3500 4.20
Mexico 84,911 3.66
China 1,129,679 1.83
Brazil 147,278 1.47
India 848,632 0.73
254 M. El-Fadel, E. Bou-Zeid / Transportation Research Part D 4 (1999) 251±264
parameters is not easily quanti®able and requires country speci®c information which is typicallylacking in developing countries. The last two approaches are for countries that have collected, orhave adequate resources to collect, the data needed to perform in-depth inventories.
Note that the IPCC methodology adopts the concept of double counting of carbon emissions(IPCC, 1996b). The method assumes that all the carbon in the fuel is converted to CO2, thencounts the CO and VOC emissions independently as an additional source of carbon emissions.This may introduce di�erences between the IPCC approach and models that do not double count(like MVEI), especially when the combustion process emits large amounts of non-CO2 carbon.The double counting in the IPCC approach can be avoided by modifying the tier 1 method. Theusage of double counting is justi®ed to account for the ultimate conversion of all carbon into CO2
while re¯ecting the higher radiative forcing potential of other gases.The reference approach was used to estimate the GHG emissions for the year 1997. The total
emissions were estimated at approximately 6940 Gg of CO2 equivalent (the amount of CO2 that, ifreleased into the atmosphere, will have the same global warming e�ect as the mixture of gasesactually released). CO2 equivalent emission for a gas is obtained by multiplying the emissions ofthat gas by its Global Warming Potential (GWP). The GWP of a gas is de®ned as the time in-tegrated radiative forcing resulting from the instantaneous release of a unit mass of the gas intoday's atmosphere expressed relative to a reference gas. This factor is gas speci®c and depends onthe time scale (limits of the integral). GWP values of di�erent gases have been constantly modi®edby the IPCC to re¯ect the improved understanding of the dynamics of radiative forcing in theatmosphere. The values remain uncertain and research is needed to incorporate all the processesa�ecting radiative forcing in the estimation of GWP.
The GWP values will continuously vary in the future as the concentration of the GHG in theatmosphere change and induce changes in the dynamics of the radiative forcing process. In thispaper, a 100-year period is adopted and the GWP values are based on the IPCC guidelines of 1990to 1996. GWP values for indirect greenhouse gases (CO and NOx) were used. Although they maynot be highly accurate, these GWPs still are a valuable tool for the incorporation of all emissionsinto one single number. This is mostly important when assessing mitigation measures that reducethe emissions of some gases and increase the emissions of other gases. The e�ect of indirectgreenhouse gases is not easy to model since these gases do not contribute to radiative forcing buttheir presence a�ect the concentrations of important components such as ozone. GWPs used inthis paper are expressed below.
The IPCC reference approach indicates that CO2 emissions account for about 60% of thepotential radiative forcing (atmospheric heat retention capacity) resulting from the transport
GHG 100-year GWPCO2 1CO 2NMVOC 4CH4 24.5NOx 40N2O 320
M. El-Fadel, E. Bou-Zeid / Transportation Research Part D 4 (1999) 251±264 255
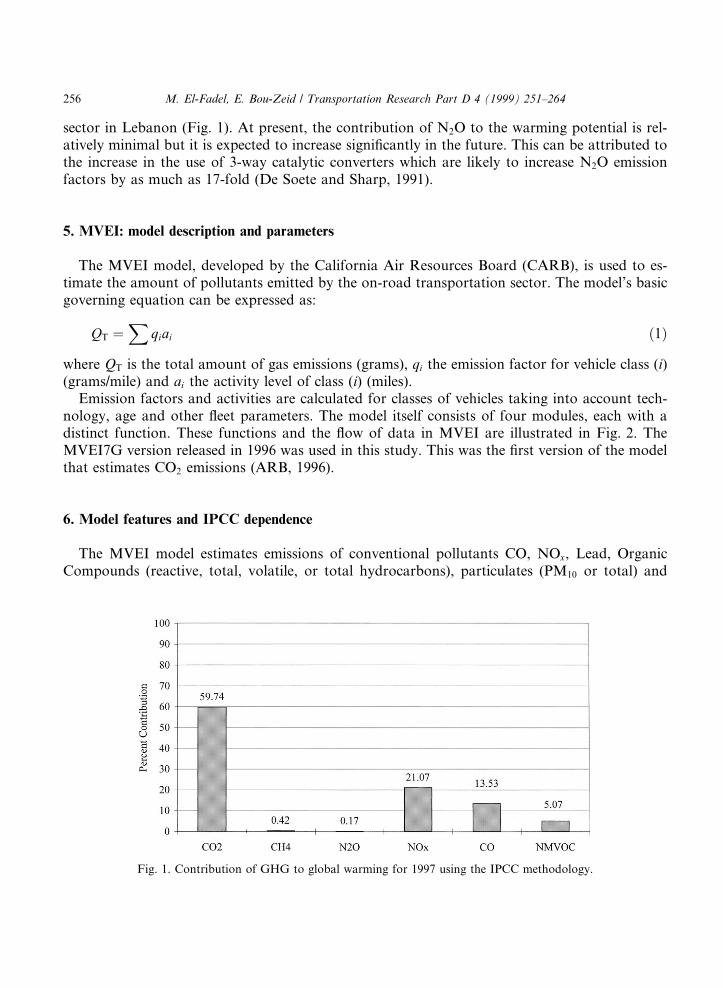
sector in Lebanon (Fig. 1). At present, the contribution of N2O to the warming potential is rel-atively minimal but it is expected to increase signi®cantly in the future. This can be attributed tothe increase in the use of 3-way catalytic converters which are likely to increase N2O emissionfactors by as much as 17-fold (De Soete and Sharp, 1991).
5. MVEI: model description and parameters
The MVEI model, developed by the California Air Resources Board (CARB), is used to es-timate the amount of pollutants emitted by the on-road transportation sector. The model's basicgoverning equation can be expressed as:
QT �X
qiai �1�where QT is the total amount of gas emissions (grams), qi the emission factor for vehicle class (i)(grams/mile) and ai the activity level of class (i) (miles).
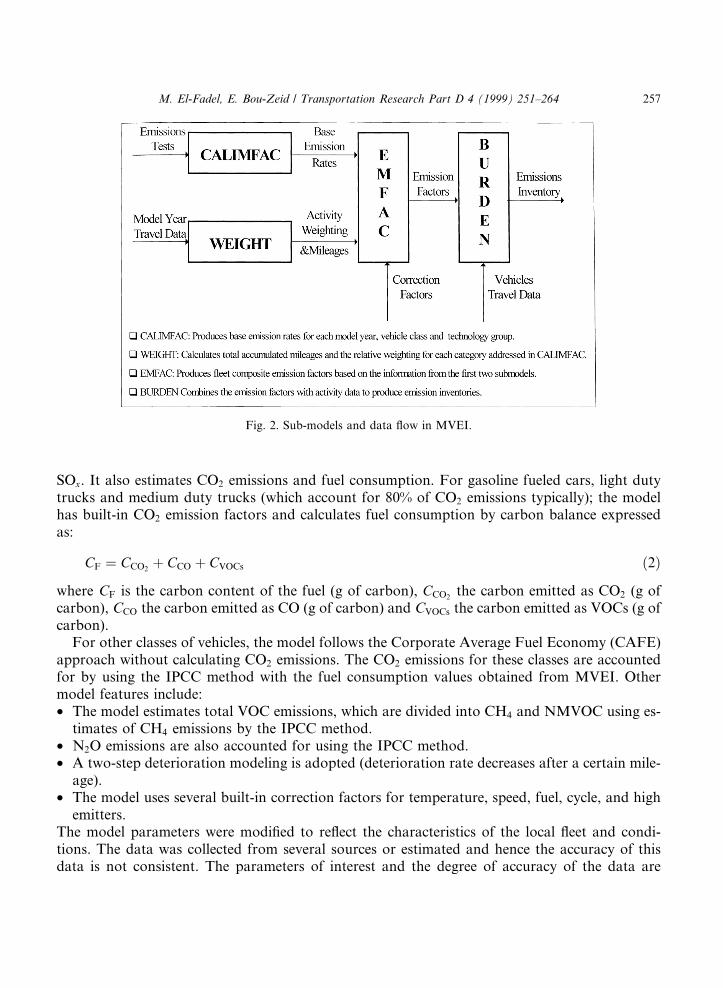
Emission factors and activities are calculated for classes of vehicles taking into account tech-nology, age and other ¯eet parameters. The model itself consists of four modules, each with adistinct function. These functions and the ¯ow of data in MVEI are illustrated in Fig. 2. TheMVEI7G version released in 1996 was used in this study. This was the ®rst version of the modelthat estimates CO2 emissions (ARB, 1996).
6. Model features and IPCC dependence
The MVEI model estimates emissions of conventional pollutants CO, NOx, Lead, OrganicCompounds (reactive, total, volatile, or total hydrocarbons), particulates (PM10 or total) and
Fig. 1. Contribution of GHG to global warming for 1997 using the IPCC methodology.
256 M. El-Fadel, E. Bou-Zeid / Transportation Research Part D 4 (1999) 251±264
SOx. It also estimates CO2 emissions and fuel consumption. For gasoline fueled cars, light dutytrucks and medium duty trucks (which account for 80% of CO2 emissions typically); the modelhas built-in CO2 emission factors and calculates fuel consumption by carbon balance expressedas:
CF � CCO2� CCO � CVOCs �2�
where CF is the carbon content of the fuel (g of carbon), CCO2the carbon emitted as CO2 (g of
carbon), CCO the carbon emitted as CO (g of carbon) and CVOCs the carbon emitted as VOCs (g ofcarbon).
For other classes of vehicles, the model follows the Corporate Average Fuel Economy (CAFE)approach without calculating CO2 emissions. The CO2 emissions for these classes are accountedfor by using the IPCC method with the fuel consumption values obtained from MVEI. Othermodel features include:· The model estimates total VOC emissions, which are divided into CH4 and NMVOC using es-
timates of CH4 emissions by the IPCC method.· N2O emissions are also accounted for using the IPCC method.· A two-step deterioration modeling is adopted (deterioration rate decreases after a certain mile-
age).· The model uses several built-in correction factors for temperature, speed, fuel, cycle, and high
emitters.The model parameters were modi®ed to re¯ect the characteristics of the local ¯eet and condi-tions. The data was collected from several sources or estimated and hence the accuracy of thisdata is not consistent. The parameters of interest and the degree of accuracy of the data are
Fig. 2. Sub-models and data ¯ow in MVEI.
M. El-Fadel, E. Bou-Zeid / Transportation Research Part D 4 (1999) 251±264 257
shown below. The accuracy was characterized as low, medium or high since numerical quan-ti®cation of this accuracy is not feasible. Note that projections of policy related parameters, likeinspection and maintenance programs, is at best uncertain and the accuracy depicted is for thecurrent situation.
a (TEAM, 1994a; TEAM, 1994b; Dar Al-Handasah, 1994 and EDL, 1994).b (AUB, 1996).c (Faiz et al., 1996 and IPCC, 1996b).d These parameters were assumed according to the scenario.
7. Simulation scenarios
Several simulations were conducted to evaluate GHG emissions under di�erent mitigationscenarios ranging from a do-nothing scenario to the introduction of various technological im-provements and policy setting. A description of each scenario and its purpose are summarized inTable 2. All scenarios are compared to the base conditions in the years 1997 and 2020.
8. Simulation results
Simulation results for the di�erent scenarios are evaluated in terms of the total mass ofemissions expressed as CO2 equivalent. Table 3 summarizes the percent contribution of each gasto total CO2 equivalent emissions and the total quantities of the various GHG emitted. Figs. 3and 4 illustrate the percent contribution of each gas to total CO2 equivalent emissions for thedi�erent scenarios and the total GHG emissions, respectively.
Data category AccuracyActivity volumes a i.e. vehicle miles traveled and starts. mediumActivity distribution by time period a mediumTemperature data b highFleet populations a mediumBasic emission rates c mediumClean fuels phase-in dates d highInspection and maintenance program in place d highLead and sulfur content in fuel highAge distributions a mediumMileage accrual rates a mediumDistribution ratios of vehicles with or without catalytic converter and dieselversus gasoline d
low
Fuel delivery system technology split: carburetor, point or throttle body fuelinjection d
low
Average speed distribution a medium
258 M. El-Fadel, E. Bou-Zeid / Transportation Research Part D 4 (1999) 251±264

8.1. Scenario 1
For the base year 1997, a relatively good agreement was obtained between the IPCC estimationmethod and MVEI (4145 Gg of CO2/year for the IPCC method versus 3940 Gg of CO2/year using
Table 2
Scenario's description and relevance
Scenario Description Purpose
1 Base conditions for the year 1997 Check MVEI model calibration
versus IPCC results and
produce base-year emissions
levels.
2 Projection for 2020 Project the GHG emissions in
2020 if no aggressive mitigation
measures are adopted. This
scenario mainly serves as a
benchmark against which
emission reduction realized in
scenarios 3 and 4 are assessed.
Business-as-usual scenario
Growth in ¯eet number is 2.5±3% per year
Growth in activity per passenger car is 1.5% per year
I/M program equivalent to 1984 program in California
N2O emission factor of scenario 1 was multiplied by 5
due to increased use of catalytic converters (de Soete et al.,
1991; Wade et al., 1994)
3 I/M and clean fuel program equivalent to 1996 enhanced
program in California
Assess the maximum possible
reduction in emission from
technological improvementAverage ¯eet age reduced by 5 years from scenario 2
All gasoline vehicles are equipped with catalytic
converters
N2O emission factor of scenario 1 was multiplied by 10
4 ``Best technology'' conditions as in scenario 3 Study the e�ect of travel
improvement and management
plans on GHG emissions.
Assess the feasibility of a
reduction to 1997 levels in 2020
Average speed in time periods with congestion increased
by 8 km/h
Reduction in passenger car activity compensated by
better urban planning and increase in public transport
activity
Table 3
Total GHG emissions and percent contribution to global warming
GHG Scenario 1 Scenario 2 Scenario 3 Scenario 4
% Gg/year % Gg/year % Gg/year % Gg/year
CO2 66.47 3940.00 77.59 9126.00 85.38 6897.00 83.29 5390.00
CH4 0.48 1.16 0.54 2.60 0.55 1.82 0.52 1.37
N2O 0.21 0.04 1.17 0.43 2.47 0.62 2.44 0.49
NOx 18.91 28.03 13.06 38.39 8.93 18.03 11.06 17.89
CO 11.61 344.03 6.60 388.00 2.41 97.37 2.41 78.09
NMVOC 2.32 34.34 1.05 30.94 0.26 5.27 0.28 4.58
M. El-Fadel, E. Bou-Zeid / Transportation Research Part D 4 (1999) 251±264 259
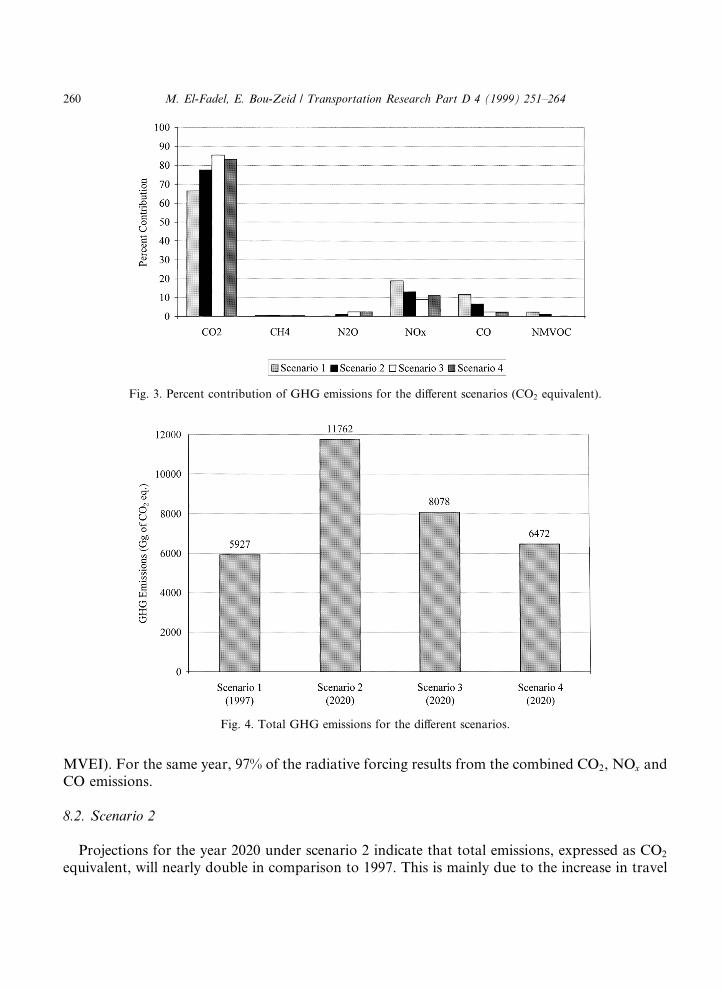
MVEI). For the same year, 97% of the radiative forcing results from the combined CO2, NOx andCO emissions.
8.2. Scenario 2
Projections for the year 2020 under scenario 2 indicate that total emissions, expressed as CO2
equivalent, will nearly double in comparison to 1997. This is mainly due to the increase in travel
Fig. 4. Total GHG emissions for the di�erent scenarios.
Fig. 3. Percent contribution of GHG emissions for the di�erent scenarios (CO2 equivalent).
260 M. El-Fadel, E. Bou-Zeid / Transportation Research Part D 4 (1999) 251±264
demand and limited emission reduction measures. This is the likely future scenario based on thecurrent level of awareness regarding air pollution problems. Under this scenario, the CO2 con-tribution will increase from 66.5% to 77.6% of the total GHG emissions.
To assess the bene®ts of standard ¯eet technology improvement from 1997 to 2020, a simu-lation was conducted with activity levels and ¯eet populations as projected for the year 2020 butusing 1997 ¯eet technology (i.e. 1997 emission rates). The total GHG emissions in 2020 wouldhave increased by an additional 8% approximately, if the ¯eet technology during the 1997±2200period remained unchanged.
8.3. Scenario 3
In scenario 3, a reduction of 31% below business-as-usual (scenario 2) was proven to be fea-sible. In this scenario, CO2 contributes 85% of the total GHG emissions and N2O emerges as thethird largest contributor to the global warming. A sensitivity analysis indicated that the combinede�ect of average age reduction by ®ve years, inspection/maintenance and fuels improvementprograms yielded minor reductions in emissions. The major factor that contributed to the re-duction was the change in ¯eet technology increasing the percentage of gasoline vehicles equippedwith catalytic converter from 50% to 100%.
Note that MVEI assumes that vehicles equipped with catalytic converters are correlated withan improvement in average fuel e�ciency. While catalytic converters do not directly improve fuele�ciency, their presence indicates a better-than-average ¯eet technology. Emission factors in themodel are fairly sensitive to changes in average speed. However, the normal range of averagespeed variation in the country is relatively narrow to introduce appreciable emission variation.Inspection and maintenance programs and improved fuels reduce the non-CO2 emissions sig-ni®cantly. However, their impact on total GHG emissions remain minor.
8.4. Scenario 4
This scenario builds on the improvement achieved in scenario 3 to maintain 1997 emissionlevels relatively constant. While the increase in average speed by up to 8 km/h during congestionperiods has little e�ect on reducing emissions, activity reduction of private passenger cars byshifting to public transport and improved urban planning (which reduces trip length) may have agreater potential. In the MVEI model, emissions are assumed directly proportional to activitylevels (Eq. (1)). To compensate for the reduction in the activity of passenger cars, the total activityof buses was increased by 1 km for each reduction of 25 km in total car activity. It was found thatthe activity per car should be reduced to 7800 km/car/year. This traveled distance is relatively lowin comparison with current driving mode which amount to no less than 10,000 km/car/year in1997 and projected at 14,000 km/car/year for 2020 (EDL, 1994). Hence the feasibility of such areduction is questionable.
Alternatively, if the activity is kept constant, at 10,000 km/car/year, from 1997 to 2020 (whichmeans that the growth occurs only in the number of vehicles without an increase in the activity ofvehicles) a 10% increase in GHG emissions to 6471 Gg of CO2 equivalent/year is expected to occurin the year 2020 in comparison to 1997. This is consistent with lower limits of the global emissionsprojections of the IPCC for the year 2020. These projections indicate an increase in transport
M. El-Fadel, E. Bou-Zeid / Transportation Research Part D 4 (1999) 251±264 261
emissions in 2020 ranging from 8 to 107% from the 1990 levels depending on the mitigationmeasures implemented (IPCC, 1996a).
9. Comparative assessment and air quality impacts
At the current rate of environmental legislation and enforcement in Lebanon, which is rela-tively similar to many developing countries, scenario 2 is likely to prevail in the future. This willresult in a 100% increase in GHG emissions in 2020 from their 1997 levels. This is consistent withWorld Bank projections of 50% average increase by 2010 (Faiz, 1993). Scenario 3 indicated thatsubstantial improvements can be accomplished through measures that aim at improving the ¯eettechnology.
Concerns about ambient air quality may indeed bring about strict regulations on ¯eet condi-tions and vehicle activity. Such regulations will assist in reducing GHG emissions, but greaterbene®ts can be introduced if reducing GHG is set as a primary target. The current trend is to-wards more transport demand as tra�c conditions improvement (through investment in the in-frastructure) and economic revival are likely to unleash suppressed trips (TEAM, 1994b).Furthermore, urban planning is heading towards the ``business city center and residentialsuburbs'' model that results in longer trips.
The e�ects of di�erent scenarios on pollutant emissions were considered. The trends of CO andNOx emissions are similar. They increase from 1997 to 2020 if scenario 2 is applied. The imple-mentation of scenarios 3 and 4 will reduce the emission of these pollutants due to the enforcementof inspection and maintenance programs, improved fuels, and utilization of catalytic converters.This reduction results in emission levels well below the 1997 levels, especially for CO emissions,which were reduced to 22% of their current level. NMVOCs are reduced even in scenario 2 due tothe application of regulations equivalent to those applied in 1984 in California. These regulationsreduce VOC emissions by evaporation. N2O emissions rises in all scenarios due to the wider use ofcatalytic converters which increase the emission rates of this pollutant. SO2 emissions are de-pendent on the fuel sulfur content. Prediction of regulation enforcement on sulfur content isuncertain.
10. Regulatory aspects and future needs
The simulated scenarios are highly dependent on regulation enactment and enforcement thatwould improve the state of the Lebanese vehicle ¯eet and moderate the increase in travel demand.In this regard, previous investigations (Staudte et al., 1997) demonstrated that institutional andregulatory reforms are greatly needed. Based on simulation results, it is evident that passengercars will contribute 85% approximately of the total gasoline consumption (equivalent to 75% oftotal fuel consumption in the road transport sector) in 2020. Among the various transportationactivities, the road transport sector will still be the most signi®cant GHG emitter. Road travelactivity will increase more rapidly than aircraft and freight activity.
The current taxation system is based primarily on vehicle model year. It imposes higher taxeson newer models which are generally more e�cient and contribute less emissions. This tends to be
262 M. El-Fadel, E. Bou-Zeid / Transportation Research Part D 4 (1999) 251±264
the case in many developing countries thus giving an incentive to buy or keep older, cheaper cars.Moreover, pollution control devices such as catalytic converters are taxed similarly to other spareparts. Such tax structure should be modi®ed to encourage the purchase of fuel e�cient, lesspolluting cars. On the other hand, pollution control devices should bene®t of special low taxes.
In addition, controlled inspection and maintenance (I/M) programs are non-existent. The or-ganization of a new I/M program is critical. This program should insure the good tuning ofengines, the repair of pollution control systems, and the optimization of the vehicle's fueleconomy; factors that signi®cantly a�ect the emissions of the ¯eet.
The maximum attainable improvement in the ¯eet technology (scenario 3) will still be insuf-®cient to compensate for the travel volume increase expected if no travel management is intro-duced. Therefore, the public transport sector should be modernized, improved and marketed.Dedicated bus lanes would render public transport more reliable and attractive. Moreover, theurban areas should be made friendly to non-motorized transport. Bicycle lanes and improvedsidewalks have the potential to make considerable contributions to mitigation e�orts.
Tax incentives and public policies should move urban planning in a direction of mixed, com-mercial and residential, zones. This will reduce trip length, which has been in net increase inLebanon in the last few years. However, the impact of these policies on energy consumptionshould ®rst be assessed. More aggressive mitigation measures, such as alternative fuels or electriccars, would need new infrastructures and large capital investments. These measures are not likelyto be adopted or attempted at a large scale, at least not in the near future.
11. Summary and conclusions
Mitigation measures to reduce GHG emissions from the road transportation sector in Lebanonwere investigated. Improvement of the ¯eet by inspection and maintenance programs, fuel qualityregulations and other policies can reduce the projected radiative forcing of GHG emissions by31% in 2020 compared to a slower and less aggressive legislation. Nevertheless, travel volumeincrease was found to be more important than technology improvements in the ¯eet. Hence theneed to reduce activity volume, mainly through better urban planning and improved publictransport, if the emissions are to be held at a relatively constant level.
The IPCC methodology (reference approach) was used to estimate emission levels and checkcomputer based simulations using MVEI. Although it was not devised to estimate GHG emis-sions, the MVEI model proved to be a useful tool in conducting sensitivity analysis and what-ifscenarios. Emission factors of other GHGs (CH4, N2O) are however not incorporated in thecurrent version of MVEI and future developments are needed in this regard.
References
ARB, 1996. Methodology for estimating emissions from on-road motor vehicles (6 volumes). Technical Support
Division, Mobile Source Emission Inventory Branch, Air Resources Board, California Environmental Protection
Agency, California.
AUB, 1996. Weather data summary for the year 1996. Department of Mechanical Engineering, American University of
Beirut, Beirut, Lebanon.
M. El-Fadel, E. Bou-Zeid / Transportation Research Part D 4 (1999) 251±264 263
CEC, 1991. Global climate change: potential impacts and policy recommendations (2 volumes). California Energy
Commission, Sacramento, CA.
Dar Al-Handasah (Shair & Partners), 1994. Maintenance and rehabilitation of Lebanon road network. phase report.
Council for Development and Reconstruction, Beirut, Lebanon.
De Soete, G., Sharp, B., 1991. Nitrous oxide emissions: modi®cations as a consequence of current trends in industrial
fossil fuel combustion and in land use. European Commission, EUR 13473 EN, Luxembourg.
EDL, 1994. Study for planning of re®neries in Lebanon. Electricit�e du Liban (French), Ministry of Hydraulic and
Electric Resources, Beirut, Lebanon.
Environmental Resources Management, 1995. Lebanon: assessment of the state of the environment. Technical Report
of the METAP-World Bank, Ministry of the Environment, Beirut, Lebanon.
Faiz, A., 1993. Automotive emissions in developing countries: relative implications for global warming, acidi®cation
and urban air quality. Transportation Research Part A 27A (3), 167±186.
Faiz, A., Weaver, C.S., Walsh, M.P., 1996. Air pollution from motor vehicles: standards and technologies for
controlling emissions. The International Bank for Reconstruction and Development ± The World Bank.
Washington DC.
FCCC, 1997. Tables of inventories of anthropogenic emissions and removals for 1990±1995 and projections up to 2020.
Framework Convention on Climate Change, United Nation. Seventh Session of the Subsidiary Body for
Implementation, Bonn, Germany.
IPCC, 1995. Climate change 1994: radiative forcing of climate change and an evaluation of the IPCC IS92 emission
scenarios. IPCC Special Report to the First Session of the Conference of the Parties to the UN FCCC. Working
Groups I and III, Intergovernmental Panel on Climate Change. Cambridge University Press, Cambridge, UK.
IPCC, 1996a. Technologies, policies and measures for mitigating climate change. IPCC Technical Paper, Working
Group II, IPCC, London, UK.
IPCC, 1996b. The Revised 1996 IPCC guideline for national greenhouse gas inventory. Reference Manual (3 volumes).
Intergovernmental Panel on Climate Change, London, UK.
Staudte, M., Rau, M., El-Fadel, M., 1997. Urban air quality monitoring program for the Greater Beirut Area,
Lebanon. A report by the Transtec-Fitchner Consortium to the Ministry of Environment, Beirut, Lebanon.
TEAM International, 1994a. Greater Beirut transportation plan, data collection. Report No. 4. Council for
Development and Reconstruction, Beirut, Lebanon.
TEAM International, 1994b. Greater Beirut transportation plan, household survey results. Report No. 9. Council for
Development and Reconstruction, Beirut, Lebanon.
UNDP, 1998. The ®rst national inventory of greenhouse gas emissions by sources and removals by sinks. UNDP,
Ministry of Environment, Beirut, Lebanon.
TRB, 1997. Towards a sustainable future: addressing the long-term e�ects of motor vehicle transportation on climate
and ecology. Special Report 251. Committee for a Study on Transportation and a Sustainable Environment,
Transportation Research Board, National Research Council. Washington DC.
Wade, J., Holman, C., Fergusson, M., 1994. Passenger car global warming: Current and projected levels in the UK.
Energy Policy 22 (6), 509±522.
264 M. El-Fadel, E. Bou-Zeid / Transportation Research Part D 4 (1999) 251±264