transportation analysis jj cavanaugh desirae dunn josh powell 1
TRANSCRIPT

1
Transportation AnalysisJJ CavanaughDesirae DunnJosh Powell
2
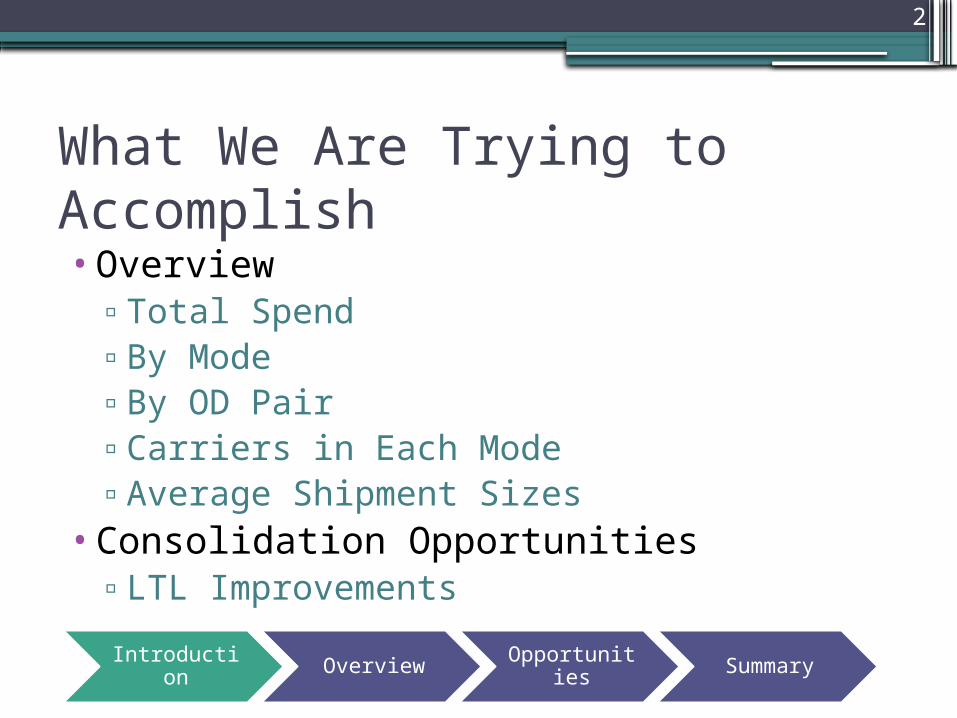
What We Are Trying to Accomplish•Overview
▫Total Spend▫By Mode▫By OD Pair▫Carriers in Each Mode▫Average Shipment Sizes
•Consolidation Opportunities▫LTL Improvements
Introduction Overview Opportunities Summary
3
Introduction
Overview
Opportunities Summary

4
Spend by Mode
LTL59.75%
TL26.26%
SP10.43%
IM3.40%
Air0.15%Mode Spend
LTL $100,320,342
TL $44,099,975
SP $17,519,928
IM $5,712,837
Air $257,283
Total $168,000,000
Introduction Overview Opportunities Summary

5
Most Valuable Carriers
135874062.13581%
32036302.32
19%
Most Variable Carriers
Other
Carrier NameFreight
PaidCarrier Type
1 USF HOLLAND INC $ 32,202,459 LTL
2SOUTHEASTERN FREIGHT LINES INC $ 20,484,588 LTL
3 CROUSE CARTAGE $ 17,013,543 TL4 NEW PENN MOTOR EXPRESS $ 13,546,279 SP
5OLD DOMINION FREIGHT LINE INC $ 6,207,804 TL
6U S XPRESS ENTERPRISES INC $ 5,647,193 LTL
7 USF BESTWAY $ 5,554,183 TL
8AMERICAN FREIGHTWAYS INC $ 4,910,105 TL
9 WATKINS MOTOR LINES INC $ 4,824,316 LTL
10BULLOCKS EXPRESS TRANS INC $ 3,617,057 LTL
11 VIKING FREIGHT SYSTEM $ 3,573,925 IM12 USF REDDAWAY TRUCK LINE $ 3,441,433 LTL13 ESTES EXPRESS LINES INC $ 3,421,973 LTL
14CARTER & SONS FREIGHTWAYS INC $ 3,358,866 LTL
15 SWEENEY TRANSPORTATION $ 2,949,194 LTL16 PRESTON TRUCKING CO $ 2,568,849 LTL17 RC TRANSPORT $ 2,552,284 LTL
Introduction Overview Opportunities Summary

6
Top Carriers LTL
Other20%
USF HOLLAND INC32%
SOUTHEAST-ERN FREIGHT
LINES INC20%
U S XPRESS ENTERPRISES
INC6%
WATKINS MO-TOR LINES INC
5%
BULLOCKS EXPRESS
TRANS INC4%
USF REDDAWAY TRUCK LINE
3%
ESTES EXPRESS LINES INC
3%
CARTER & SONS FREIGHTWAYS INC
3%
SWEENEY TRANSPORTATION3%
The top 9 out of 41 carriers have approximately 80% of LTL spend
These are our A and B Customers
Introduction Overview Opportunities Summary
7
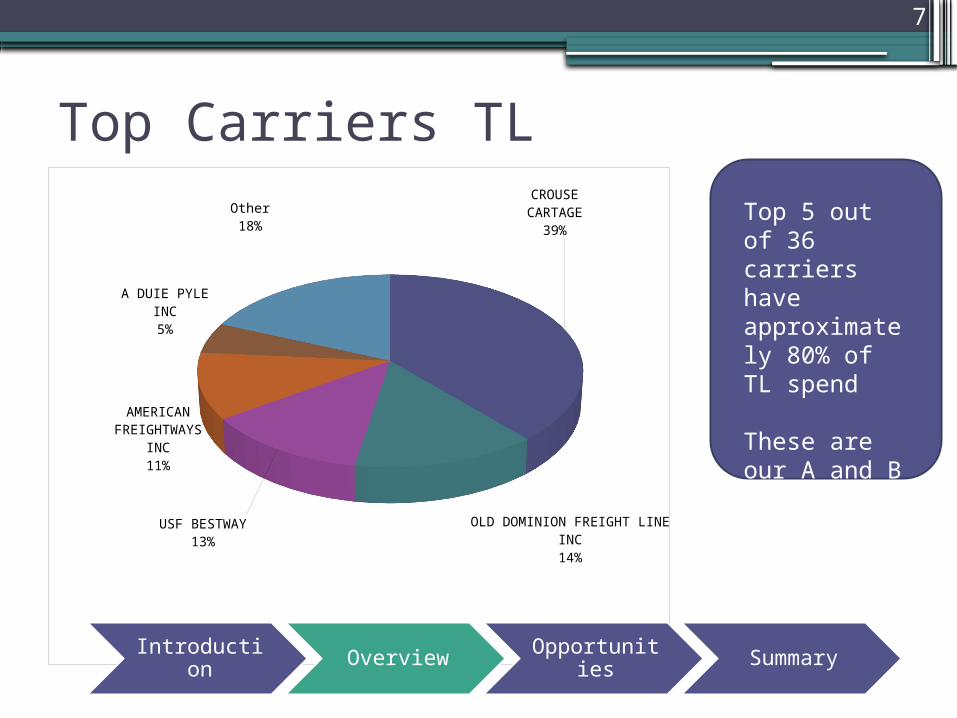
Top Carriers TLCROUSE CARTAGE
39%
OLD DOMINION FREIGHT LINE INC
14%
USF BESTWAY13%
AMERICAN FREIGHT-WAYS INC
11%
A DUIE PYLE INC5%
Other18%
Top 5 out of 36 carriers have approximately 80% of TL spend
These are our A and B customers
Introduction Overview Opportunities Summary

8
Other Carrier Modes•Small Parcel
▫Top carrier is responsible for approximately 77% of SP spend
•Intermodal▫Top carrier is responsible for approximately
63% of IM spend•Air
▫Top carrier is responsible for approximately 52% of Air spend
Introduction Overview Opportunities Summary

9
Top Carriers by Loads Moved
HMES
CRSE
TNT1USXI
WW
ATEXLA
BEXT
CFFWPYLE
VERN
0
5000
10000
15000
20000
25000
30000
Number of Loads
Carrier SCAC Codes
Loads
Our top 19 carriers handle 80% of the loads moved
This is only 21% of our total carriers
This is directly related to most valuable carriers
Introduction Overview Opportunities Summary

10
Top LTL Carriers by Loads Moved
HMES SEFL USXI WWAT RETL EXLA SWEY BEXT RCTV CFFW0
5000
10000
15000
20000
25000
30000
Number of Loads
Carrier SCAC Codes
Loads
Top 10 carriers handle 80% of loads moved
Introduction Overview Opportunities Summary

11
Top TL Carriers by Loads Moved
CRSE TNT1 ODFL ARFW PYLE CRCR0
2000
4000
6000
8000
10000
12000
14000
16000
Number of Loads
Carrier SCAC Codes
Loads
The top 6 carriers handle 80% of loads moved
This is only 17% of TL carriers
Introduction Overview Opportunities Summary

12
Introduction
Opportunities
Overview Summary

13
Spend by Lane•Top 3 OD Pairs
1. Cranbury, NJ to Charlotte, NC Approximately $735,000
2. Cleveland, OH to Milton, PA Approximately $546,000
3. Macon, GA to Charlotte, NC Approximately $492,000
Introduction Overview Opportunities Summary
14
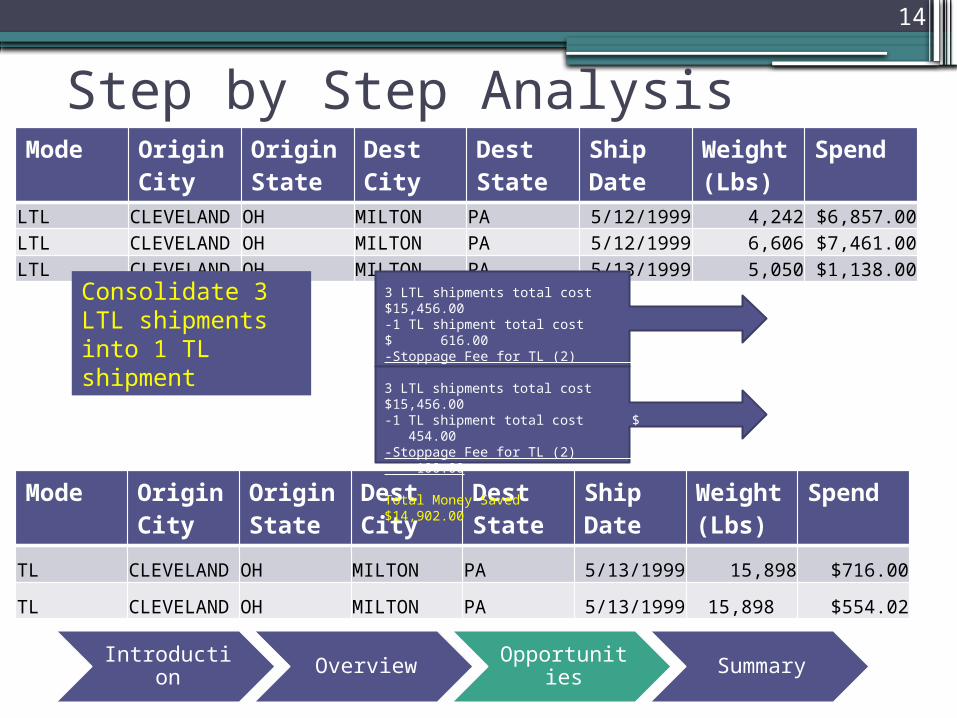
Step by Step AnalysisMode Origin
CityOrigin State
Dest City
Dest State
Ship Date
Weight (Lbs)
Spend
LTL CLEVELAND OH MILTON PA 5/12/1999 4,242 $6,857.00LTL CLEVELAND OH MILTON PA 5/12/1999 6,606 $7,461.00LTL CLEVELAND OH MILTON PA 5/13/1999 5,050 $1,138.00
Mode Origin City
Origin State
Dest City
Dest State
Ship Date
Weight (Lbs)
Spend
TL CLEVELAND OH MILTON PA 5/13/1999 15,898 $716.00
TL CLEVELAND OH MILTON PA 5/13/1999 15,898 $554.02
3 LTL shipments total cost $15,456.00-1 TL shipment total cost $ 616.00-Stoppage Fee for TL (2) $ 100.00
Total Money Saved $14,740.00
3 LTL shipments total cost $15,456.00-1 TL shipment total cost $ 454.00-Stoppage Fee for TL (2) $ 100.00
Total Money Saved $14,902.00
Consolidate 3 LTL shipments into 1 TL shipment
Introduction Overview Opportunities Summary

15
Consolidation Opportunities
1. Cranbury, NJ to Charlotte, NC Consolidated 152 shipments into 51
shipments2. Cleveland, OH to Milton, PA
Consolidated 78 shipments into 27 shipments
3. Macon, GA to Charlotte, NC Consolidated 98 shipments into 36
shipmentsIntroduction Overview Opportunitie
s Summary
16
Carrier Consolidation
•Drop carriers carrying less than 1% of freight paid▫Give this business to those carrying top
80%•LTL
▫Will reduce number of carriers from 41 to 14
•TL▫Will reduce number of carriers from 36 to
12Introduction Overview Opportunitie
s Summary

17
Current Spend vs. Consolidated Spend
Cranbury,NJ to Charlotte,NC
Cleveland, OH to Milton, PA
Macon, GA to Charlotte,NC
$-
$100,000.00
$200,000.00
$300,000.00
$400,000.00
$500,000.00
$600,000.00
$700,000.00
$800,000.00
Current SpendConsolidated SpendSensitivity
Current spend could be drastically reduced by consolidating LTL shipments into TL shipments
Introduction Overview Opportunities Summary

18
Savings
Cranbury,NJ to Charlotte,NC
Cleveland, OH to Milton, PA
Macon, GA to Charlotte,NC
$-
$100,000.00
$200,000.00
$300,000.00
$400,000.00
$500,000.00
$600,000.00
$700,000.00
SavingsSavings 2
NJ – NC$621K - $644K
OH – PA$490K - $503K
GA – NC$429.5K
Introduction Overview Opportunities Summary

19
S.W.O.T. Analysis of Consolidation•Strengths
▫Substantial savings▫Manage less carriers
•Weaknesses▫Higher lead times
•Opportunities▫Possibly better rates from top carriers
•Threats▫Top carriers may not run certain routes
that smaller carriers doIntroduction Overview Opportunities Summary

20
Introduction
Summary
Overview Opportunities

21
Summary
•LTL shipments are the largest percentages of our costs▫Consolidation is key▫Reduces costs
•Remove unnecessary carriers▫Give top carriers a reason to meet your
demands •80/20 rule
▫More volume = Better service and better rates

22
Questions