transport pathways of microphytobenthos-originating organic carbon in the food web of an
TRANSCRIPT

MARINE ECOLOGY PROGRESS SERIESMar Ecol Prog Ser
Vol. 284: 97–108, 2004 Published December 21
INTRODUCTION
The microphytobenthos provides a large amount oforganic carbon to coastal shallow water ecosystems(MacIntyre et al. 1996). The estimates of its annual pri-mary production from intertidal sediments in estuariesrange from 29 to 314 g C m–2, comparable to the pro-duction estimates for estuarine phytoplankton, rangingfrom 7 to 875 g C m–2 (Underwood & Kromkamp 1999).
This benthic microalgal production is generally consid-ered to vary with shore type. The microalgal film on ahard surface can be extremely productive on rockyshores, in contrast with sediment shores or exposedsandy beaches, where phytoplankton produced in situor imported are a comparatively more important inputof energy into the ecosystem (Raffaelli & Hawkins1999). It is also supposed that this microalgal film onthe hard surface can be more productive than macro-
© Inter-Research 2004 · www.int-res.com*Email: [email protected]
Transport pathways of microphytobenthos-originating organic carbon in the food web
of an exposed hard bottom shore in the Seto Inland Sea, Japan
Noriyuki Takai1,*, Akemi Yorozu2, Terumi Tanimoto3, Akira Hoshika3, Kiyoshi Yoshihara4
1Shimoda Marine Biological Station, College of Bioresource Sciences, Nihon University, Shimoda 415-0014, Japan2Graduate School of Biosphere Science, Hiroshima University, Higashi-Hiroshima 739-8528, Japan
3National Institute of Advanced Industrial Science and Technology (AIST), Kure 737-0197, Japan4Department of Marine Science and Resources, College of Bioresource Sciences, Nihon University, Fujisawa 252-8510, Japan
ABSTRACT: Benthic microalgal production has been clarified to be comparable to water column pro-duction in coastal shallow water ecosystems. The present study examined carbon transport pathwaysfrom microphytobenthos to predators in a food web of an exposed hard bottom shore in the SetoInland Sea of Japan in winter, noting the intermediary role of suspension feeders in the carbon trans-port. Natural abundances of carbon and nitrogen stable isotopes were examined for epilithic organicmatter (EOM), suspended particulate organic matter (SPOM), a macroalga, molluscs, crustaceansand fish. All the heterotrophs, including herbivores, suspension feeders and carnivores, showed highδ13C signatures of –15.5 to –9.7‰, relative to the δ13C of –20.7 to –19.7‰ for the SPOM collected fromthe offshore surface water as an indicator of phytoplankton. At the shoreline point, the SPOM showedhigh δ13C values of –16.0 to –13.0‰, overlapping with the values of –15.4 to –12.6‰ for the EOMindicative of microphytobenthos collected at the low sea level points, and abundantly includedmicroalgae of the same species found in the epilithic matter. It was thus considered that resuspensionof 13C-enriched microphytobenthos increased the δ13C of SPOM in the surf zone and consequentlyincreased the δ13C of the suspension feeders through their feeding on the suspended matter. The δ15Nof carnivores, which overlapped in δ13C with these primary consumers, markedly increased with thetrophic position. These results indicate that, not only grazing, but also suspension feeding functionedas transport pathways of the 13C-enriched microphytobenthos in the food web.
KEY WORDS: Microphytobenthos · Carbon source · Shore · Food web · δ13C · δ15N
Resale or republication not permitted without written consent of the publisher

Mar Ecol Prog Ser 284: 97–108, 2004
algae on more exposed rocky shores (Raffaelli & Haw-kins 1999).
Our concern here is what kind of primary consumersplay intermediary roles in the transport of organiccarbon from the microphytobenthos to top predators inshore ecosystems. de Jonge & van Beusekom (1992)suggested that half of the food of benthic suspensionfeeders in an estuary consisted of resuspended micro-phytobenthos, based on the proportion of microphyto-benthos in the suspended matter. Kamermans (1994)found that percentages of benthic algal cells includedin stomachs of both suspension- and deposit-feedingbivalves in a tidal flat showed significant positive cor-relations with the cell percentages in the bottom layerwater, but low correlations with the cell percentages atthe sediment surface. This would mean that thesebivalves consumed the microphytobenthos via resus-pension of the microphytobenthos. On the other hand,the results of stable isotope tracer-addition experi-ments and analyses of natural isotope abundancesindicated that the food source of primary consumers ina tidal flat was planktonic algae for the suspensionfeeders and microphytobenthos for the deposit feeders(Herman et al. 2000, Middelburg et al. 2000). It is likelythat the kinds of intermediate players differ amongdifferent ecosystems.
Recently, Takai et al. (2002) indicated that fish, smallbenthic crustaceans and Japanese oysters Crassostreagigas inhabiting an island shore in the western SetoInland Sea of Japan were mainly dependent on carbonfrom benthic primary production, on the basis of thecarbon and nitrogen stable isotope signatures. How-ever, this investigation did not clarify the kinds of ben-thic plants contributing to these littoral consumers northe process of carbon transfer from the plants to pri-mary consumers. In the present study, we examinedthe stable isotope distributions of the organisms inhab-iting this shore site to demonstrate the carbon supplyfrom microphytobenthos to heterotrophs and elucidatethe transport pathways of the microphytobenthos-originating carbon in the food web.
Carbon and nitrogen stable isotope ratios of an animalhave been increasingly used to obtain time-integratedinformation on its feeding habits and on the organiccarbon transport through aquatic food webs (Wada et al.1987, Fry 1988). The δ13C value shows a slight enrich-ment of 1‰ or less for an animal during a single feedingprocess (DeNiro & Epstein 1978, Rau et al. 1983). Thisconservative nature of δ13C along a food chain can pro-vide information on the carbon sources of high trophicconsumers in aquatic food webs. On the other hand, 15Nexhibits stepwise enrichment of 3 to 4‰ from prey topredator (DeNiro & Epstein 1981, Minagawa & Wada1984). Interpretation of consumers δ15N relative to an ap-propriate baseline δ15N value provides a quantitative
measure of their trophic position. The δ13C–δ15N map inan ecosystem can thus show a schematic food webstructure on a corresponding food base.
The δ13C of marine primary producers is mainly dis-tributed from –27 to –8‰ for macroalgae, from –15 to–3‰ for seagrasses, from –20‰ to –10‰ for microphy-tobenthos and from –24 to –18‰ for phytoplankton intemperate regions (Fry & Sherr 1984). Specifically, theaverage of δ13C data from the literature was reportedto be 5‰ higher in benthic algae than in phytoplank-ton (France 1995). These general δ13C distributions ofthe primary producers apply to the distributions inHiroshima Bay as well: the δ13C mainly ranged from–23 to –11‰ for macroalgae, from –17 to –13‰ forepilithic organic matter (0.7 to 125 µm) (an indicator ofepilithic microalgae) and from –23 to –19‰ for partic-ulate organic matter (0.7 to 125 µm) (an indicator ofphytoplankton) in the offshore surface (Takai et al.2001, 2002). Based on these δ13C distributions of theprimary producers, we identified the carbon sources ofthe heterotrophs in the exposed hard bottom shoreecosystem of an uninhabited and undeveloped islandin the western Seto Inland Sea in winter.
MATERIALS AND METHODS
Sampling. Hiroshima Bay is located in the westernarea of the Seto Inland Sea of Japan, with an areaof about 1000 km2 and an average depth of 24 m(Fig. 1a). The standing stock of chlorophyll a (chl a) inthe surface layer (0 to 10 m) of the water column hasbeen reported to be 47.4 mg m–2 in the bay, remark-ably higher than the average (25.7 mg m–2) of theoverall area of the Seto Inland Sea (Tada et al. 1998).The chl a standing stock of the microphytobenthoshas scarcely been investigated in the Seto Inland Sea,but Ono et al. (1999) recently found a high chl a con-centration of 32.5 to 193 mg m–2 for the surface sedi-ment of Hiroshima Bay in October and January. Withregard to macrophytes, Anonymous (1994) has re-ported that seaweed beds exist in an area of 2059 haalong the Hiroshima district, but the standing stock ofphotosynthesis pigments and the carbon budget havenot precisely been evaluated.
We collected epilithic organic matter (EOM), sus-pended particulate organic matter (SPOM) and shoreanimals at low tides from Koguro-Kamijima Island(Fig. 1). This island is uninhabited and undeveloped,with shores mostly consisting of rock and sand. Allsamples were collected on 22 December 2000, exceptfor the molluscs and barnacles Pollicipes mitella, whichwere collected on 22 February 2000.
The EOM was collected at 4 sea-level points (Pts. A,B, C and D) at this shore site (Fig. 1b). We brushed the
98

Takai et al.: Transport pathways of microphytobenthos-originating carbon
surfaces of rocks at Pts. A, B and C and the surfaces ofsubmerged stones at Pt. D. This brush was churned inseawater, which had been filtrated through precom-busted (450°C, 2 h) GF/F filters in advance, in order towash the EOM off into the seawater. A part of thiscloudy water was fixed with glutaraldehyde (5%) formicroscopic observation of the microalgae included inthe EOM after it was sieved through a 125 µm meshsieve. The other portion of the cloudy water waswashed through 125, 63, 32 and 15 µm mesh sieves, inorder to collect EOM in the size ranges of 63 to 125 µm,32 to 63 µm and 15 to 32 µm. The water filtered througha 15 µm mesh sieve was further passed through pre-combusted GF/F filters, in order to collect particles of0.7 to 15 µm. We collected 1 sample for each combina-tion of sampling points and particle-size fractions.
The SPOM was collected from seawater samples thatwere drawn from a tide pool point (P), a shoreline point
(Q), the surface of a 2 m depth point (R), the bottom ofa 2 m depth point (R') and an offshore surface point (S)(Fig. 1). The water was drawn with a Van-Dorn watersampler from Pt. R' and with a bucket from the otherpoints. A part of the water (2 l) was fixed with gluta-raldehyde (5%) for microscopic observation of themicroalgae included in the SPOM after it was sievedthrough a 125 µm mesh sieve. The SPOM particles inthe size ranges of 63 to 125 µm, 32 to 63 µm, 15 to32 µm and 0.7 to 15 µm were collected in the same wayas the EOM particles. The SPOM in the surface watercollected at Pts. R and S were separated into 15 to125 µm and 0.7 to 15 µm particles, since the particleswere not abundantly included in the surface water andthus the particles of the 15 to 125 µm fraction could notbe separated into 3 more detailed size fractions. Wecollected 1 sample for each combination of samplingpoints and particle-size fractions.
99
130°E 140°E
40°N
30°N
34°00'N
132°30'E132°00'E
20
20
10020
Hiroshima Bay
Kure
10 km
Hiroshima
100 m
Koguro-Kamijima Island
Pt. S
Pts. R, R'
Pts. A, B, C, D, P, Q
(a)
(b)
offshore
distance (m)
sea
leve
l (m
)
Pt. B Pt. CPt. D
Pt. A
sea surface
Pt. P
Pt. Q
0 1 2 3 4 5 6 7 8 90
1
2
3
4
studyarea
Seto Inland Sea
Pacific Ocean
Fig. 1. Study area. (a) Koguro-Kamijima Island. Isobaths are shown with short dashed lines for 20 m and long dashed lines for100 m. (b) Transect of the shore site where the suspended particulate organic matter (Pts. P and Q; open squares) and the epilithic
organic matter (Pts. A, B, C and D; open circles) were collected

Mar Ecol Prog Ser 284: 97–108, 2004
Small benthic crustaceans were collected from thesurfaces of the stones, macroalgae and the shells ofbivalves in littoral and sublittoral zones at the shoresite. In particular, the crustaceans collected in the sub-littoral zone were the epiphyton inhabiting the sur-faces of Sargassum macroalgae. Molluscs and barna-cles were collected from the surfaces of rock mass inthe littoral zone. Fish were captured with a throw netin the sublittoral zone.
Stable isotope analyses. The samples were stored at–20°C. The isotope ratios of the crustaceans were ana-lyzed for mixed individuals (the whole body) in amphi-pods and decapods and for adductor muscles in barna-cles. Muscles of the fish were excised from the trunkbehind a pectoral fin. Tissues that were analyzed forthe molluscs differed with the species, since there areinterspecific differences for the quantity of the musclesthat can be collected from feet and adductor muscles.Feet were excised from chitons Liolophura japonicaand gastropods, except centipede shells Serpulorbisimbricatus, for analyses. The whole soft tissue wasexamined for S. imbricatus, since we could not identifythe kinds of tissues in the anatomical process. Theadductor muscles of bivalves were analyzed. The feetof the gastropods lipped periwinkles Monodonta labioand turban shells Lunella coronata coreensis wereanalyzed after being mixed with the feet of other indi-viduals of the same kind. Yorozu (2000) confirmed thatthe stable isotope ratios of bivalves collected in sum-mer were not significantly different between feet andadductor muscles, thus justifying the use of data fromthese 2 muscle tissues. The leaf of the macroalga Sar-gassum horneri, to which the small crustaceans in thesublittoral zone attached, was also analyzed.
These tissues were dried at 60°C and ground to afine powder. The animal tissues were defatted with achloroform:methanol (2:1) solution. The EOM andSPOM were exposed to the vapor of concentrated HClfor a day in order to eliminate carbonates and weresubsequently dried in a vacuum desiccator. Stable iso-tope ratios of carbon and nitrogen were measured witha MAT 252 mass spectrometer (Finnigan MAT) cou-pled with an elemental analyzer (Carlo Erba). Isotoperatios, δ13C and δ15N, are expressed as per mil devia-tions from the standard as defined by the followingequation:
δ13C, δ15N = [Rsample/Rstandard – 1] × 1000 (‰)
where R = 13C/12C or 15N/14N. Belemnite (PDB) andatmospheric nitrogen were used as the isotope stan-dards for carbon and nitrogen, respectively. The ana-lytical precision for the isotopic analyses was ± 0.28‰for both δ13C and δ15N.
Statistical analyses. We performed Friedman’s testfor the EOM and SPOM and the Kruskal-Wallis test for
the molluscs in the statistical analyses of isotopic val-ues. The statistical analyses for the crustaceans couldnot be performed, because the decapods and barna-cles were short of the number of samples analyzed forstable isotope ratios. The statistical analyses for theSPOM were performed among the samples collectedat Pts. P, Q and R'; the data of the samples at Pts. R andS were excluded from the statistical analyses, since theSPOM collected at Pts. R and S could not be separatedinto 4 size fractions. In the Kruskal-Wallis test for themolluscs, the species whose isotope ratios were ana-lyzed for only 1 sample were excluded from the statis-tical analyses.
Calculation of the test statistic (χr2 for the Friedman’s
test and H for the Kruskal-Wallis test) and determina-tion of critical values for the statistic were performedaccording to Ichihara (1990). We also referred to Zar(1996) for the correction of the test statistic concerningtied ranks. The number of the groups compared (a) andthe sampling blocks (b) was described for the Fried-man’s test.
RESULTS
Stable isotope ratios of EOM and SPOM
The stable isotope ratios of the EOM ranged from–18.1‰ (Pt. A, 63 to 125 µm) to –12.6‰ (Pt. D, 63 to 125µm) for δ13C and from 3.8‰ (Pt. A, 63 to 125 µm) to9.8‰ (Pt. D, 15 to 32 µm) for δ15N (Figs. 2 & 3). The δ15Nof the EOM increased toward lower sea-level points(Friedman's test, χr
2 = 12.0, a = 4, b = 4, p < 0.01), whilesuch a significant location-related isotopic change wasnot found for δ13C (Friedman's test, χr
2 = 3.9, a = 4, b =4). Significant difference for the δ15N was also foundamong the size fractions of the EOM (Friedman’s test,χr
2 = 11.1, a = 4, b = 4, p < 0.01); the δ15N of the EOMwas significantly higher in smaller size groups. On theother hand, no significant particle size-related isotopicchange was found for δ13C (Friedman’s test, χr
2 = 0, a =4, b = 4). The δ13C values were higher in smaller sizefractions at the higher sea-level points (A and B) andhigher in larger fractions at the lower sea-level points(C and D).
The stable isotope ratios of the SPOM ranged from–20.7‰ (Pt. S, 0.7 to 15 µm) to –13.0‰ (Pt. Q, 32 to63 µm and 63 to 125 µm) for δ13C and from 6.6‰ (Pt. R,0.7 to 15 µm) to 9.8‰ (Pt. P, 0.7 to 15 µm) for δ15N(Figs. 2 & 3). The δ13C of the SPOM varied with thelocation. The δ13C at the offshore surface point (S)showed the lowest values of –20.7 to –19.7‰, while theδ13C at the shoreline point (Q) was the highest (–16.0 to–13.0‰). There was a significant location-related dif-ference among 3 points (P, Q and R') (Friedman's test,
100

Takai et al.: Transport pathways of microphytobenthos-originating carbon
χr2 = 6.5, a = 3, b = 4, p < 0.05). A significant difference
was also found for δ15N among the 3 points (P, Q andR') (Friedman’s test, χr
2 = 7.6, a = 3, b = 4, p < 0.05). Onthe other hand, significant particle size-related differ-ences were not found for either δ13C or δ15N of theSPOM (Friedman’s test; δ13C, χr
2 = 2.0, a = 4, b = 3;δ15N, χr
2 = 1.2, a = 4, b = 3).
Species compositions of microalgae
Species compositions of the microalgae in the EOMwere strikingly different among the sampling points(Table 1). Blue-green algae, Homoeothrix sp. andPleurocapsales sp., occupied as much as 82.2% of themicroalgae collected at the highest sea-level point (A),
while species diversity and percentage of diatom spe-cies obviously increased at the lower points (C and D).The diatom group consisted mainly of the generaNitzschia, Cocconeis, Amphora, Navicula, Gomphone-ma, Grammatophora, Achnanthes and Thalassiosira.Nitzschia sp. 1, which was the most abundant speciesat Pts. B and C, was a small-sized species closely re-sembling Nitzschia frustlum.
Species compositions of the microalgae in the SPOMalso showed striking local variation (Table 1). Only 3species, Plagioselmis sp., Kephyrion spirale and Pyra-mimonas sp., occupied 86.6% of the suspended micro-algae collected at the tide pool point (P) and only2 species, Chaetoceros sociale and Plagioselmis sp.,occupied 90.7% at the offshore surface point (S). Bycontrast, the microalgae collected from the shoreline
101
A
B
C
D
P
Q
R
R'
S
a: 0.7–15 µm; b: 15–32 µm; c: 32–63 µm; d: 63–125 µm; b': 15–125 µm
SPOM
EOM
-21.0 -20.0 -19.0 -18.0 -17.0 -16.0 -15.0 -14.0 -13.0 -12.0
-21.0 -20.0 -19.0 -18.0 -17.0 -16.0 -15.0 -14.0 -13.0 -12.0
littoral
Sealevel (m)
1
0
2
3
4
δ13C (‰)
a
a
a
a
a
b
b'
b'
b
b
c
c
c
d
d
d
a
a
a
a
b
b
b
b
c
c
c
c
d
d
d
d
Fig. 2. δ13C distributions of the epilithic organic matter col-lected at the 4 sea-level points (A, B, C and D) and the sus-pended particulate organic matter collected at a tide poolpoint (P), a shoreline point (Q), a 2 m depth point (surface, R),a 2 m depth point (bottom, R') and an offshore surface point(S). One sample was collected for each combination of sam-
pling points and particle-size fractions
A
B
C
D
P
Q
R
R'
S
a: 0.7–15 µm; b: 15–32 µm; c: 32–63 µm; d: 63–125 µm; b': 15–125 µm
SPOM
EOM
littoral
Sealevel (m)
1
0
2
3
4
3.0 4.0 5.0 6.0 7.0 8.0 9.0 10.0 11.0 12.0
δ15N (‰)
3.0 4.0 5.0 6.0 7.0 8.0 9.0 10.0 11.0 12.0
a
a
a
a
b
b
b
b
c
c
c
c
d
d
d
d
a
a
a
a
a
b
b'
b'
b
b
c
c
c
d
d
d
Fig. 3. δ15N distributions of the epilithic organic matter col-lected at the 4 sea-level points (A, B, C and D) and the sus-pended particulate organic matter collected at a tide poolpoint (P), a shoreline point (Q), a 2 m depth point (surface, R),a 2 m depth point (bottom, R') and an offshore surface point(S). One sample was collected for each combination of sam-
pling points and particle-size fractions

Mar Ecol Prog Ser 284: 97–108, 2004
point (Q) and the bottom of the 2 mdepth point (R') included a large num-ber of diatom species. The microalgaeat Pt. Q consisted mainly of the diatomsThalassiosira, Cocconeis, Chaetoceros,Skeletonema, Achnanthes, Gompho-nema, Amphora, Nitzschia and Berke-leya.
The microalgae in the epilithic mattercollected at Pts. B, C and D were abun-dantly found in the turbid water col-lected in the surf zone (Pts. Q and R')(Table 1). Particularly, 41.1% (12 spe-cies) of the suspended microalgae col-lected at the shoreline point (Q) were thesame species as the microalgae collectedfrom the epilithic matter. The water atPt. Q also included Thalassiosira spp.(24.6%), Amphora spp. (5.1%), Nitzschiaspp. (5.0%), Cocconeis spp. (2.9%), Nav-icula spp. (2.2%) and Diploneis spp.(0.9%), which were found in the epilithicmatter. On the other hand, Plagioselmissp., Kephyrion spirale, Pyramimonas sp.and Chaetoceros sociale, predominant inthe calm water collected at the tide poolpoint (P) and at the offshore surface point(S), were scarcely found in the epilithicmatter.
Stable isotope ratios of benthicinvertebrates
The stable isotope ratios of the mol-luscs collected on 22 February 2000markedly varied according to speciesin both δ13C and δ15N (Table 2). Therewere significant differences amongchitons Liolophura japonica, limpetsCellana nigrolineata, warty murex Rei-shia clavigera, centipede shells Ser-pulorbis imbricatus, ark shells Barbatiavirescens, and Japanese oysters Cras-sostrea gigas (Kruskal-Wallis test; δ13C,H = 58.3, df = 5, p < 0.001; δ15N, H =54.3, df = 5, p < 0.001). Herbivorousspecies, e.g. L. japonica, limpet Cellanatoreuma, C. nigrolineata, lipped peri-winkle Monodonta labio, and Lunellacoronata coreensis (turban shell),showed wide δ13C variation, rangingfrom –13.7 ± 0.8‰ for C. nigrolineata to–10.2‰ for C. toreuma, in contrast tothe small variation of δ15N (10.6‰ for
102
Table 1. Percentage compositions of microalgal cells (<125 µm) in the epilithicorganic matter (EOM) collected at 4 sea-level points (A, B, C and D) and in thesuspended particulate organic matter (SPOM) collected at a tide pool point (P),a shoreline point (Q), a 2 m depth point (surface, R), a 2 m depth point (bottom,R') and an offshore surface point (S) on 22 December 2000. The number of
colonies or filaments was counted for blue-green algae
Species EOM SPOMA B C D P Q R R' S
DINOPHYCEAEProrocentrum dentatum 0.9Prorocentrum minimum 0.0Protoperidinium bipes 0.6Protoperidinium sp. 0.0CHRYSOPHYCEAEKephyrion spirale 31.5 7.8 2.8 1.0Distephanus speculum
var. octonarius 0.6 0.1 0.0Dictyocha fibula 0.1 0.1CRYPTOPHYCEAEPlagioselmis sp. 43.3 0.2 29.4 6.5 29.9BACILLARIOPHYCEAEThalassiosira rotula 0.2 0.1Thalassiosira spp. 0.2 6.9 5.4 0.6 24.6 27.7 6.3 3.8Corethron hystrix 0.3 0.0Melosira nummuloides 0.4 0.6 0.5 0.1Coscinodiscus spp. 0.3 0.5 3.6Rhizosolenia setigera 0.6 0.1Rhizosolenia stolterfothii 0.5Eucampia zodiacus 0.2 0.7Hemiaulus sinensis 0.1Chaetoceros affine 0.5 1.4 0.1Chaetoceros curvisetum 0.5Chaetoceros debile 0.7 2.5 0.2Chaetoceros didymum 0.2Chaetoceros sociale 1.5 5.9 15.5 60.8Chaetoceros spp. 7.6 12.0Ditylum brightwellii 0.7 0.2 0.1Grammatophora marina 3.3 6.1 2.2 1.3 1.7Achnanthes brevipes 0.1 11.7 6.6 4.7 3.8 0.5Achnanthes longipes 2.6 2.8 3.0 0.6 5.8 1.1Amphora bigibba 0.2Amphora lineolata 0.3Amphora ventricosa 1.0 6.1Amphora spp. 0.1 0.1 6.9 10.0 5.1 2.8Navicula duerrenbergiana 5.1 10.0 0.5 1.4Navicula gregaria 0.4Navicula johanrosii 0.2Navicula perminuta 1.2 4.7 2.9Navicula platyventris 0.2 0.2Navicula ramosissima 5.7 3.3Navicula spp. 0.2 0.2 5.1 3.4 0.6 2.2 0.2 2.8 0.1Pleurosigma spp. 1.1 0.2 0.1Nitzschia coarctata 1.6 0.3 0.5 0.2Nitzschia longissima 0.6 0.3 0.0Nitzschia pungens 0.3 0.0Nitzschia valdestriata 2.3Nitzschia vidovichii 0.4Nitzschia sp.1 9.4 49.9 10.0 4.0 4.3Nitzschia spp. 0.1 0.3 9.0 8.1 2.2 5.0 0.5 4.6 0.1Berkeleya rutilans 1.9 1.0 3.6Biddulphia sp. 1.7Cocconeis pseudomarginata 0.1 1.4 10.0 1.1 3.6 Cocconeis scutellum 0.4 4.8 7.4 11.4 5.6Cocconeis spp. 5.7 2.9 4.9 Diploneis spp. 0.6 0.3 0.9 0.5Gomphonema exiguum
var. minutissimum 8.1 5.4 5.8 1.1Odontella sinensis 0.2 0.3Paralia sulcata 1.1 3.6Skeletonema costatum 6.5 1.9

Takai et al.: Transport pathways of microphytobenthos-originating carbon
C. toreuma to 11.2‰ for M. labio) (Fig. 4). On the otherhand, suspension-feeding species, e.g. S. imbricatus,B. virescens, C. gigas and variegated cardita Carditavariegata, showed wide δ15N variation, ranging from7.8 ± 0.6‰ for S. imbricatus to 12.0‰ for C. variegata,in contrast to the small variation in δ13C (from –15.2 ±0.2‰ for C. gigas and –15.2‰ for C. variegata to –14.9± 0.2‰ for S. imbricatus). The δ13C and δ15N of the car-nivorous species R. clavigera and Reishia bronni(murex shell) were distributed in the relatively narrowranges of –13.8‰ to –13.7 ± 0.5‰ and 13.5 ± 0.6‰ to
14.1‰, respectively. These carnivorousgastropods had clearly higher δ15Nthan the herbivores and suspensionfeeders.
The small benthic crustaceans, bothamphipods and decapods, collected on22 December 2000 had δ13C distributedin a narrow range of –15.0 to –12.8‰(Table 3). The barnacles Pollicipesmitella collected on 22 February 2000also showed a similar δ13C value of–15.4‰. On the other hand, these crus-taceans had a δ15N differing accordingto species; the δ15N value determinedfor multiple individuals was 4.3 to 9.1‰for amphipods, 11.4 to 11.7‰ for de-capods and 14.7‰ for barnacles. Thedistribution of the amphipods on theδ13C–δ15N map was similar to that ofSerpulorbis imbricatus, while the distri-bution of the decapods was similar tothe distributions of the gastropods Cel-lana nigrolineata and Monodonta labioand the bivalves Barbatia virescens,
Crassostrea gigas and Cardita variegata (Figs. 4 & 5).The barnacles overlapped with the fish on the map.The isotopic values of the macroalga Sargassumhorneri, to which the small crustaceans in the sublit-toral zone attached, were –17.4‰ for δ13C and 5.3‰ forδ15N.
Takai et al. (2002) reported the stable isotope dis-tributions for the small benthic crustaceans that werecollected at this shore site; amphipods were collectedfrom 10 August 1999 to 12 October 2000 and deca-pods were collected on 30 June 2000 and 30 August
103
Table 1 (continued)
Species EOM SPOMA B C D P Q R R' S
Stephanopyxis palmeriana 0.4Synedra tabulata 3.3 1.7 0.5Trachyneis aspera 0.8Licmophora abbreviata 0.6 1.0Mastogloia sp. 0.2Stauroneis smithii 0.6Surirella sp. 0.2Bacillariophyceae spp. 1.9 0.6PRASINOPHYCEAEPyramimonas aff. amylifera 0.1Pyramimonas sp. 11.8 22.5 8.5 2.4EUGLENOPHYCEAEEutreptiella sp. 0.6 0.1 0.1CYANOPHYCEAEOscillatoria sp. 2.9 0.1 0.1 2.8 0.1Calothrix sp. 0.1 0.2 0.1Chamaesiphon sp. 5.8 0.1 0.2Homoeothrix sp. 60.8 17.0 0.4Chroococcaceae sp. 2.0Stigonemataceae sp. 2.0 0.3Pleurocapsales sp. 21.4 12.3 2.2 1.2CHLOROPHYCEAEChlorophyceae sp. 0.1
Table 2. Number of individuals analyzed (n), shell length (mm) and carbon and nitrogen stable isotope ratios (‰) for molluscs col-lected at the shore site of Koguro-Kamijima Island on 22 February 2000. Isotope ratios of Monodonta labio and Lunella coronatacoreensis were analyzed for mixed individuals. Number of individuals mixed is shown in parentheses for these species (feeding
modes: HE, herbivorous; CA, carnivorous; SU, suspension feeding)
Species n Shell length δ13C δ15N Feeding mode
PolyplacophoraChiton Liolophura japonica 15 32–58 –10.8 ± 0.6 10.7 ± 0.4 HE
GastropodaLimpet Cellana toreuma 1 36 –10.2 10.6 HELimpet Cellana nigrolineata 11 44–59 –13.7 ± 0.8 10.9 ± 0.6 HELipped periwinkle Monodonta labio 1(7) 14–21 –13.5 11.2 HETurban shell Lunella coronata coreensis 1(10) 21–24 –11.6 10.7 HEWarty murex Reishia clavigera 15 21–33 –13.7 ± 0.5 13.5 ± 0.6 CAMurex shell Reishia bronni 1 45 –13.8 14.1 CACentipede shell Serpulorbis imbricatus 12 30–67 –14.9 ± 0.2 7.8 ± 0.6 SU
BivalviaArk shell Barbatia virescens 4 31–38 –15.1 ± 0.2 11.0 ± 0.4 SUJapanese oyster Crassostrea gigas 13 33–54 –15.2 ± 0.2 11.1 ± 0.3 SUVariegated cardita Cardita variegata 1 30 –15.2 12.0 SU

Mar Ecol Prog Ser 284: 97–108, 2004
2000 (Fig. 5). For amphipods, δ13C ranged from –17.3to –12.5‰ and δ15N ranged from 6.7 to 9.8‰, and,for small decapods, δ13C ranged from –16.9 to–15.7‰ and δ15N from 11.4 to 11.8‰. Thus, the iso-topic distributions of the small benthic crustaceansshowed only small seasonal variations, justifying theuse of data from 2 different months, December andFebruary, for these comparisons.
Stable isotope ratios of fish
The fish collected on 22 December 2000 had a δ13Cranging from –15.2 to –14.0‰ and a δ15N from 14.3 to15.1‰ (Table 4). The δ13C values of these 7 fish sampleswere very similar to those of all the suspension-feedingmolluscs and the small benthic crustaceans (Figs. 4 &5). They also overlapped in δ13C with the herbivorousgastropods Cellana nigrolineata and Monodonta labio,while the high δ13C of the other herbivorous species, Li-olophura japonica, C. toreuma, and Lunella coronatacoreensis, were far from the δ13C distribution of the fish.On the other hand, the fishes had clearly higher δ15Nthan the invertebrates, except for the barnacles(14.7‰).
Takai et al. (2002) reported the stable isotope distrib-utions of the fishes that were collected at this shore sitefrom 15 June 1999 to 30 June 2000 (Figs. 4 & 5). Thesefishes had δ13C values mainly distributed from –17.0 to–13.0‰ and δ15N values from 14.0 to 16.0‰, except forthe peculiarly low δ13C values (–18.6 to –17.0‰) ofjuveniles of the black rockfish Sebastes inermis collec-ted in June. Thus, like the small benthic crustaceans,the isotope ratios of the fish did not vary much amongdifferent seasons.
DISCUSSION
Resuspension of the microphytobenthos in thesurf zone
The horizontal distance between the tide pool point(P) and the shoreline point (Q) was only about 3 m, butthe stable isotope distribution of the SPOM was differ-ent between these points (Figs. 2 & 3). The δ13C distri-bution of the SPOM at the tide pool point (P) was closerto the distribution of the SPOM at the offshore surfacepoint (S), while the SPOM collected at the shorelinepoint (Q) and the 2 m depth point (bottom, R') over-lapped in δ13C with the EOM collected at the lowersea-level points (B, C and D). This result suggests thatthe 13C-enriched SPOM in the surf zone originatedfrom the 13C-enriched EOM on the hard bottom.
The species compositions of the microalgae supportthis inference based on stable isotope abundance(Table 1). The microalgal species included in the epilithicmatter were abundantly found in the suspended mattercollected at the shoreline point (Q) and the 2 m depthpoint (bottom, R'). By contrast, those algal species foundin the epilithic matter were hardly present in the sus-pended matter collected at the tide pool point (P). It wasthus inferred that the organic matter produced by themicrophytobenthos increased the δ13C values of theSPOM in the surf zone through its resuspension.
104
H
7.0
5.0
3.0
δ15N
(‰
)
17.0
15.0
13.0
11.0
9.0
-21.0 -19.0 -17.0 -15.0 -13.0 -11.0 -9.0
Suspension feeders Herbivores
Carnivores
δ13C (‰)
A A
AAAA AA
A
AA
AA
AA BC
C
C
C
C
C
CCC C
C DE
H
H
HH
HH
H
H
F FF
FFF
F
F
F
FFF
F
I
I
I I
J
JJJ
JJ
JJJ
JJJJ
K
HH
A
B
C
D
E
F
G
H
I
J
K
Liolophura japonica
Cellana toreuma
Cellana nigrolineata
Monodonta labio
Lunella coronata coreensis
Reishia clavigera
Reishia bronni
Serpulorbis imbricatus
Barbatia virescens
Crassostrea gigas
Cardita variegata
EOM (Pt. D)
EOM (Pt. C)
SPOM (Pt. Q)
SPOM (Pt. R')
Fish
Young-of-the-year of black rockfishin June (Takai et al. 2002)
The other black rockfish(Takai et al. 2002)
All fish except black rockfish(Takai et al. 2002)
HH
F
F
G
Fig. 4. δ13C–δ15N map for molluscs at the shore site of Koguro-Kamijima Island. Isotopic distributions of the epilithic organicmatter collected at Pts. C and D, the suspended particulateorganic matter collected at Pts. Q and R' and the fish collectedat this shore site are shown besides the molluscan distribu-tion. Reference data reported by Takai et al. (2002) are alsoshown for fish as mean values (±SD). See ‘Results’ for infor-
mation about these organisms
Takai et al.: Transport pathways of microphytobenthos-originating carbon
Carbon transfer from microphytobenthos toherbivorous molluscs
The δ13C of herbivorous molluscs, which scrape offepilithic matter with radulae, varied, reflecting thewide δ13C variations of the EOM (Fig. 4). Although thehigh δ13C in Liolophura japonica and Cellana toreumaappeared to be distributed somewhat far away fromthe δ13C of the EOM, this δ13C difference may becaused by the difference of the sampling dates and/orthe slight positional difference between the samplingpoints of the EOM and the molluscs; the δ13C ofthe EOM might be higher at the site where these13C-enriched molluscs were collected. These herbivo-rous molluscs are generally supposed to feed on themicroalgae attached to the hard bottom (Tsuchiya1988), while the microalgal films on hard surfaces con-sist of not only microalgae, but also organic molecules,heterotrophic bacteria, fungi, protistans and the earlystages of macroalgae (Raffaelli & Hawkins 1999). It is
likely that such diverse components ofthe microalgal films led partly to thevaried δ13C values of the EOM and con-sequently those of the herbivorousmolluscs.
The herbivorous molluscs had δ15Ndistributed in a narrow range, from 9.7to 11.7‰ (Fig. 4). Compared with theδ15N values of 7.5 to 8.7‰ for the EOMcollected in the midlittoral zone of theshore (Pt. C), the average δ15N of theherbivores was 2.0 to 3.2‰ higher forLiolophura japonica (10.7 ± 0.4‰), 1.9to 3.1‰ higher for Cellana toreuma
(10.6‰), 2.2 to 3.4‰ higher for C. nigrolineata (10.9 ±0.6‰), 2.5 to 3.7‰ higher for Monodonta labio (11.2‰)and 2.0 to 3.2‰ higher for Lunella coronata coreensis(10.7‰). This δ15N difference of 1.9 to 3.7‰ betweenthe herbivores and the EOM corresponds to the differ-ence of 0.56 to 1.1 in trophic level, calculated on thebasis of 3.4‰ increase per trophic level (Minagawa &Wada 1984, Vander Zanden et al. 1997). It is likely thatthe δ15N signatures were a very close reflection of thesimple feeding relationship between the herbivorousmolluscs and the epilithic microalgae.
Carbon transfer from microphytobenthos to suspension-feeding molluscs and small
benthic crustaceans
The isotopic signatures of suspension-feeding mol-luscs, Barbatia virescens, Crassostrea gigas and Car-dita variegata, were similar to those of the herbivorous
105
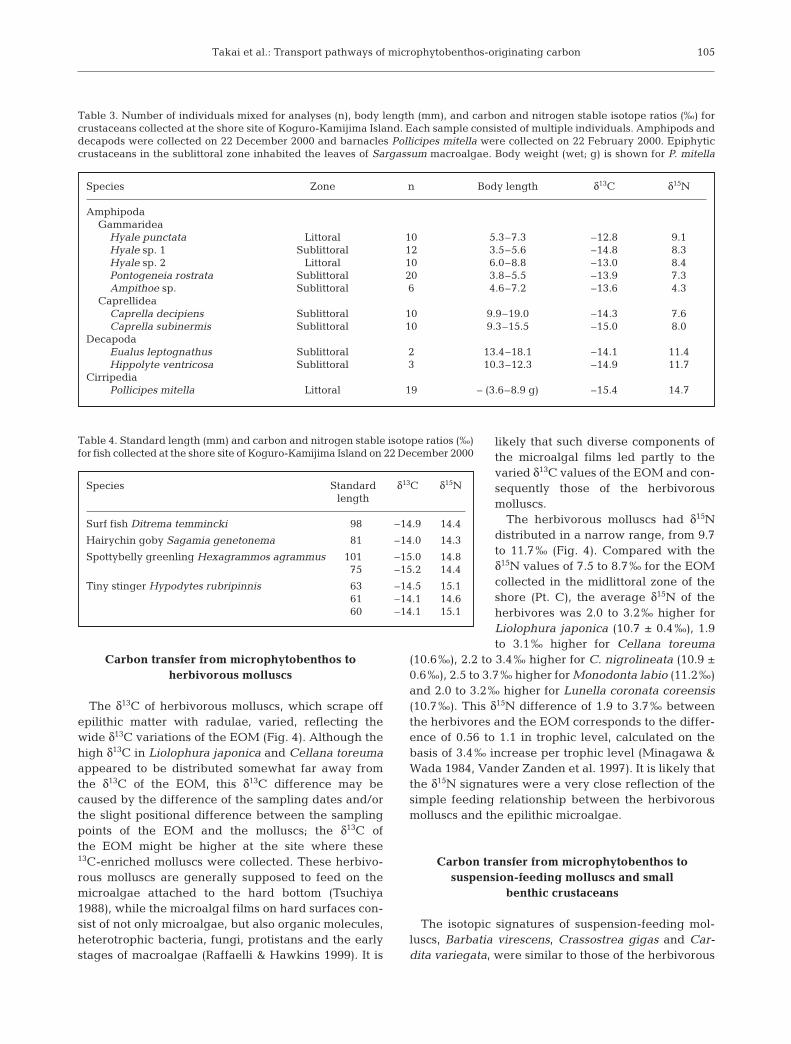
Table 3. Number of individuals mixed for analyses (n), body length (mm), and carbon and nitrogen stable isotope ratios (‰) forcrustaceans collected at the shore site of Koguro-Kamijima Island. Each sample consisted of multiple individuals. Amphipods anddecapods were collected on 22 December 2000 and barnacles Pollicipes mitella were collected on 22 February 2000. Epiphyticcrustaceans in the sublittoral zone inhabited the leaves of Sargassum macroalgae. Body weight (wet; g) is shown for P. mitella
Species Zone n Body length δ13C δ15N
AmphipodaGammaridea
Hyale punctata Littoral 10 5.3–7.3 –12.8 9.1Hyale sp. 1 Sublittoral 12 3.5–5.6 –14.8 8.3Hyale sp. 2 Littoral 10 6.0–8.8 –13.0 8.4Pontogeneia rostrata Sublittoral 20 3.8–5.5 –13.9 7.3Ampithoe sp. Sublittoral 6 4.6–7.2 –13.6 4.3
CaprellideaCaprella decipiens Sublittoral 10 9.9–19.0 –14.3 7.6Caprella subinermis Sublittoral 10 9.3–15.5 –15.0 8.0
DecapodaEualus leptognathus Sublittoral 2 13.4–18.1 –14.1 11.4Hippolyte ventricosa Sublittoral 3 10.3–12.3 –14.9 11.7
CirripediaPollicipes mitella Littoral 19 – (3.6–8.9 g) –15.4 14.7
Table 4. Standard length (mm) and carbon and nitrogen stable isotope ratios (‰)for fish collected at the shore site of Koguro-Kamijima Island on 22 December 2000
Species Standard δ13C δ15Nlength
Surf fish Ditrema temmincki 98 –14.9 14.4
Hairychin goby Sagamia genetonema 81 –14.0 14.3
Spottybelly greenling Hexagrammos agrammus 101 –15.0 14.875 –15.2 14.4
Tiny stinger Hypodytes rubripinnis 63 –14.5 15.161 –14.1 14.660 –14.1 15.1
Mar Ecol Prog Ser 284: 97–108, 2004
gastropods Cellana nigrolineata and Monodonta labio(Fig. 4). Such isotope distributions indicate that thesesuspension feeders depended on microphytobenthos-originating organic matter as well as herbivorousgastropods for food sources in spite of the differencein their feeding styles. They probably feed on13C-enriched organic matter resuspended in the surfzone.
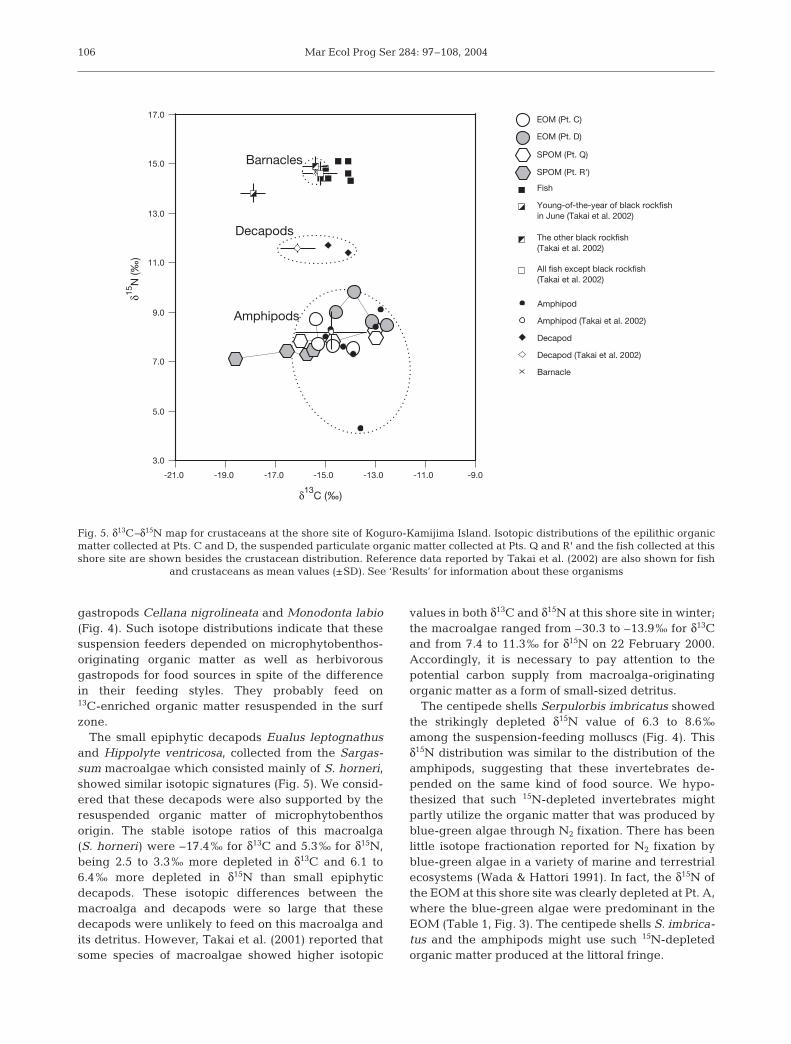
The small epiphytic decapods Eualus leptognathusand Hippolyte ventricosa, collected from the Sargas-sum macroalgae which consisted mainly of S. horneri,showed similar isotopic signatures (Fig. 5). We consid-ered that these decapods were also supported by theresuspended organic matter of microphytobenthosorigin. The stable isotope ratios of this macroalga(S. horneri) were –17.4‰ for δ13C and 5.3‰ for δ15N,being 2.5 to 3.3‰ more depleted in δ13C and 6.1 to6.4‰ more depleted in δ15N than small epiphyticdecapods. These isotopic differences between themacroalga and decapods were so large that thesedecapods were unlikely to feed on this macroalga andits detritus. However, Takai et al. (2001) reported thatsome species of macroalgae showed higher isotopic
values in both δ13C and δ15N at this shore site in winter;the macroalgae ranged from –30.3 to –13.9‰ for δ13Cand from 7.4 to 11.3‰ for δ15N on 22 February 2000.Accordingly, it is necessary to pay attention to thepotential carbon supply from macroalga-originatingorganic matter as a form of small-sized detritus.
The centipede shells Serpulorbis imbricatus showedthe strikingly depleted δ15N value of 6.3 to 8.6‰among the suspension-feeding molluscs (Fig. 4). Thisδ15N distribution was similar to the distribution of theamphipods, suggesting that these invertebrates de-pended on the same kind of food source. We hypo-thesized that such 15N-depleted invertebrates mightpartly utilize the organic matter that was produced byblue-green algae through N2 fixation. There has beenlittle isotope fractionation reported for N2 fixation byblue-green algae in a variety of marine and terrestrialecosystems (Wada & Hattori 1991). In fact, the δ15N ofthe EOM at this shore site was clearly depleted at Pt. A,where the blue-green algae were predominant in theEOM (Table 1, Fig. 3). The centipede shells S. imbrica-tus and the amphipods might use such 15N-depletedorganic matter produced at the littoral fringe.
106
7.0
5.0
3.0
δ15N
(‰)
17.0
15.0
13.0
11.0
9.0
-21.0 -19.0 -17.0 -15.0 -13.0 -11.0 -9.0
δ13C (‰)
Barnacles
Decapods
AmphipodsAmphipod
Amphipod (Takai et al. 2002)
Decapod
Decapod (Takai et al. 2002)
Barnacle
EOM (Pt. D)
EOM (Pt. C)
SPOM (Pt. Q)
SPOM (Pt. R')
Fish
Young-of-the-year of black rockfish in June (Takai et al. 2002)
The other black rockfish (Takai et al. 2002)
All fish except black rockfish (Takai et al. 2002)
Fig. 5. δ13C–δ15N map for crustaceans at the shore site of Koguro-Kamijima Island. Isotopic distributions of the epilithic organicmatter collected at Pts. C and D, the suspended particulate organic matter collected at Pts. Q and R' and the fish collected at thisshore site are shown besides the crustacean distribution. Reference data reported by Takai et al. (2002) are also shown for fish
and crustaceans as mean values (±SD). See ‘Results’ for information about these organisms

Takai et al.: Transport pathways of microphytobenthos-originating carbon
Carbon transport to predators
The carnivorous gastropods Reishia clavigera andR. bronni had δ13C values similar to those of the herbiv-orous gastropod species Cellana nigrolineata andMonodonta labio and those of the bivalve species Bar-batia virescens, Crassostrea gigas and Cardita varie-gata (Fig. 4). The average δ15N of R. clavigera (13.5 ±0.6‰) was 2.6‰ higher than that of C. nigrolineata,2.3‰ higher than that of M. labio, 2.5‰ higher thanthat of B. virescens, 2.4‰ higher than that of C. gigasand 1.5‰ higher than that of C. variegata. The δ15Nvalue of R. bronni (14.1‰) was 3.2‰ higher than thatof C. nigrolineata, 2.9‰ higher than that of M. labio,3.1‰ higher than that of B. virescens, 3.0‰ higherthan that of C. gigas and 2.1‰ higher than that ofC. variegata. Judging from the 3.4‰ increase pertrophic level (Minagawa & Wada 1984, Vander Zandenet al. 1997), R. clavigera and R. bronni had trophicpositions estimated to be 0.76 and 0.94 higher thanthose of C. nigrolineata, 0.68 and 0.85 higher thanthose of M. labio, 0.74 and 0.91 higher than those ofB. virescens, 0.71 and 0.88 higher than those ofC. gigas and 0.44 and 0.62 higher than those of C. var-iegata. The Reishia species is generally supposed tofeed on molluscs inhabiting the littoral zone (Tsuchiya1988). The Reishia species at this shore site would takein the microphytobenthos-originating organic matterthrough this prey–predator relationship with lowertrophic positional molluscs.
The stable isotope distribution of the 7 fish sampleswas slightly more depleted in δ13C and more enrichedin δ15N relative to the carnivorousReishia gastropods (Fig. 4). Conse-quently, the δ13C values were lower inthese fish than in the herbivorous gas-tropods and close to those in thebivalves and the small benthic deca-pods. The Reishia gastropods can makea hole in the shell of the limpets with aradula to feed on them, while it wouldbe difficult for the fish to feed onlimpets clinging to the hard surface. Itwas thus inferred that both or either ofthe bivalves and the small benthiccrustaceans were more important asfood sources for the fish than the her-bivorous gastropods. These 7 fish sam-ples had an average δ15N of 14.7 ±0.3‰, which is 2.7 to 4.3‰ higher thanthat of the bivalves (10.4 to 12.0‰) andthe small benthic decapods (11.4 to11.7‰). These differences correspondto a change of 0.79 to 1.3 in trophiclevel, calculated on the basis of 3.4‰
increase per trophic level (Minagawa & Wada 1984,Vander Zanden et al. 1997). These δ15N signaturessupport the inference that bivalves and small benthicdecapods are important food sources for the fish.
In the present study, all heterotrophs showed clearlyhigher δ13C signatures of –15.5 to –9.7‰ relative tothose of –20.7 to –19.7‰ for the SPOM in the offshoresurface water. It was suggested that this 13C enrich-ment was caused by the inflow of microphytobenthos-originating organic matter into the food web of theexposed hard bottom shore via multiple pathways,such as herbivorous and suspension-feeding molluscsand small benthic crustaceans (Fig. 6). Since theisotope distributions of the fish and the small benthiccrustaceans analyzed in the present study were consis-tent with the year-long isotopic values of these hetero-trophs (Takai et al. 2002), it was expected that thesetransport pathways may function effectively all yearround. These transport pathways might also be effec-tive in different exposed shore areas that consist of ahard bottom, but whether or not they apply to 'shel-tered' hard bottom shores is unknown. In the future,the relationship between the topographical features ofhard bottom shores and the roles of primary consumersin the shore food webs should be investigated in detail.
Acknowledgements. We thank E. Wada for his critical read-ing of this manuscript. We are grateful to K. Imamura for hiscooperation in the identification of the molluscs, and S. Ishida,T. Kurihara and S. Handa, for their useful advice in the prepa-ration of this manuscript. We are also grateful to 3 anonymousreviewers for their valuable comments on the manuscript.
107
Fig. 6. Schematic diagram of the carbon transport from microphytobenthos topredators in the food web of the exposed hard bottom shore at Koguro-Kamijima
Island

Mar Ecol Prog Ser 284: 97–108, 2004
This study was supported by a grant from Japan Science andTechnology Corporation and Open Research Center Projectof Nihon University promoted by the Ministry of Education,Culture, Sports, Science and Technology of Japan.
LITERATURE CITED
Anonymous (1994) The report of the marine biotic environ-ment survey in the 4th national survey on the natural envi-ronment, Vol 2. Algal and sea-grass beds. Marine ParksCenter of Japan, Tokyo (in Japanese)
de Jonge VN, van Beusekom JEE (1992) Contribution ofresuspended microphytobenthos to total phytoplankton inthe Ems estuary and its possible role for grazers. Neth JSea Res 30:91–105
DeNiro MJ, Epstein S (1978) Influence of diet on the distribu-tion of carbon isotopes in animals. Geochim CosmochimActa 42:495–506
DeNiro MJ, Epstein S (1981) Influence of diet on the distribu-tion of nitrogen isotopes in animals. Geochim CosmochimActa 45:341–351
France RL (1995) Carbon-13 enrichment in benthic comparedto planktonic algae: foodweb implications. Mar Ecol ProgSer 124:307–312
Fry B (1988) Food web structure on Georges Bank from stableC, N, and S isotopic compositions. Limnol Oceanogr 33:1182–1190
Fry B, Sherr EB (1984) δ13C measurements as indicators ofcarbon flow in marine and freshwater ecosystems. ContribMar Sci 27:13–47
Herman PMJ, Middelburg JJ, Widdows J, Lucas CH, HeipCHR (2000) Stable isotopes as trophic tracers: combiningfield sampling and manipulative labelling of foodresources for macrobenthos. Mar Ecol Prog Ser 204:79–92
Ichihara K (1990) Statistics for bioscience—practical tech-nique and theory. Nankodo, Tokyo (in Japanese)
Kamermans P (1994) Similarity in food source and timing offeeding in deposit- and suspension-feeding bivalves. MarEcol Prog Ser 104:63–75
MacIntyre HL, Geider RJ, Miller DC (1996) Microphyto-benthos: the ecological role of the ‘secret garden’ ofunvegetated, shallow-water marine habitats. I. Distribu-tion, abundance and primary production. Estuaries 19:186–201
Middelburg JJ, Barranguet C, Boschker HTS, Herman PMJ,Moens T, Heip CHR (2000) The fate of intertidal micro-phytobenthos carbon: an in situ 13C-labeling study. LimnolOceanogr 45:1224–1234
Minagawa M, Wada E (1984) Stepwise enrichment of 15Nalong food chains: further evidence and the relationbetween δ15N and animal age. Geochim Cosmochim Acta48:1135–1140
Ono K, Yamamoto T, Hashimoto T (1999) Importance of ben-thic algal production in Hiroshima Bay. The abstract of theJOS fall meeting in 1999. The Oceanographic Society ofJapan, Tokyo, p 249 (in Japanese)
Raffaelli D, Hawkins S (1999) Intertidal ecology, 2nd edn.Kluwer Academic Publishers, Dordrecht
Rau GH, Mearns AJ, Young DR, Olson RJ, Schafer HA,Kaplan IR (1983) Animal 13C/12C correlates with trophiclevel in pelagic food webs. Ecology 64:1314–1318
Tada K, Monaka K, Morishita M, Hashimoto T (1998) Stand-ing stocks and production rates of phytoplankton andabundance of bacteria in the Seto Inland Sea, Japan.J Oceanogr 54:285–295
Takai N, Hoshika A, Imamura K, Yorozu A, Tanimoto T, Mi-shima Y (2001) Distribution of carbon and nitrogen stableisotope ratios in macroalgae in Hiroshima Bay. Jpn J Ecol51:177–191 (in Japanese with English abstract)
Takai N, Mishima Y, Yorozu A, Hoshika A (2002) Carbonsources for demersal fish in the western Seto Inland Sea,Japan, examined by δ13C and δ15N analyses. LimnolOceanogr 47:730–741
Tsuchiya M (1988) II. Ecology and environment. 1. Food rela-tionship and environmental characteristics. 11. Life styleand environment. In: Kurihara Y (ed) Ecology and eco-technology in estuarine-coastal areas. Tokai UniversityPress, Tokyo, p 43–54 (in Japanese)
Underwood GJC, Kromkamp J (1999) Primary production byphytoplankton and microphytobenthos in estuaries. AdvEcol Res 29:93–153
Van der Zanden MJ, Cabana G, Rasmussen JB (1997) Com-paring trophic position of freshwater fish calculated usingstable nitrogen isotope ratios (δ15N) and literature dietarydata. Can J Fish Aquat Sci 54:1142–1158
Wada E, Hattori A (1991) Nitrogen in the sea: forms, abun-dances, and rate processes. CRC Press, Boca Raton, FL
Wada E, Terazaki M, Kabaya Y, Nemoto T (1987) 15N and 13Cabundances in the Antarctic Ocean with emphasis on thebiogeochemical structure of the food web. Deep-Sea Res34:829–841
Yorozu A (2000) Environmental characteristics of shores inHiroshima Bay inferred from carbon and nitrogen stableisotope ratios of shellfish. MSc thesis, Hiroshima Univer-sity, Higashi-Hiroshima, (in Japanese)
Zar JH (1996) Biostatistical analysis, 3rd edn. Prentice-HallInternational, London
108
Editorial responsibility: Otto Kinne (Editor), Oldendorf/Luhe, Germany
Submitted: November 20, 2003; Accepted: July 29, 2004Proofs received from author(s): December 9, 2004