transport and logistics time motion and …pdf.usaid.gov/pdf_docs/pnadz463.pdftransport and...
TRANSCRIPT

TRANSPORT AND LOGISTICS TIME MOTION AND COST STUDY FINAL REPORT
FINAL REPORT
FINAL REPORT
Wednesday, June 20, 2012
This publication was produced for review by the United States Agency for International Development. It was prepared by Deloitte Consulting LLP.
TRANSPORT AND LOGISTICS TIME MOTION AND COST STUDY FINAL REPORT
USAID ECONOMIC PROSPERITY INITIATIVE (EPI)
CONTRACT NUMBER: AID-114-C-10-00004
DELOITTE CONSULTING LLP
USAID/CAUCASUS
WEDNESDAY, JUNE 20, 2012
DISCLAIMER:
The author’s views expressed in this publication do not necessarily reflect the views of the United States Agency for International Development or the United States Government.
ECONOMIC PROSPERITY INITIATIVE (EPI) i
DATA
Author(s):ACT Research
Reviewed By:
Vakhtang Marsagishvili, EPI Transport and Logistics Activity Manager
Alan Saffery, EPI Manufacturing and Service Sectors Component Lead
Name of Component: Manufacturing and Service Sectors
Practice Area: Transport and Logistics
Key Words: transport and logistics, transport, logistics, air, sea, rail, road, trucks, freight, cargo

ECONOMIC PROSPERITY INITIATIVE (EPI) ii
ABSTRACT This document is the final report on the Transport and Logistics Time Motion and Cost Study prepared for Deloitte Consulting LLP in the framework of USAID Economic Prosperity Initiative (EPI) by ACT Research.
Transport and logistics is one of the strategic sectors of Georgia. It can be pivotal and catalytic to a broad segment of the economy. In order to fully understand its potential impact on the economy, it was critical to make an assessment of the transportation and logistics sector, which has been identified as a crosscutting sector that the EPI will focus on.
In order to condcut a deep assessment of transport and logistics value chains and develop a strategy work plan in this sector it is critical to obtain baseline data using statistically relevant methodology. Unfortunately, there was no such recorded data in this sector until recently. Taking these considerations into account the research was arranged, planned, and then implemented from April till July, 2011.
The main purpose of ACT’s research was to design and develop statistically relevant methodology for a baseline measurement of transport and logistics-related factors between specific transport nodes within Georgia and then conduct a baseline survey according to the developed methodology.
The main objectives of the baseline survey were to study the timing, costs, availability, quality, and reliability of transportation and logistics in Georgia.
For this purpose ACT Research has developed an optimal research approach, which include the following main components: (a) Desk Research (in order to obtain and analyze secondary data pertaining to the nodes that are to be studied in the scope of this project), (b) Surveys of Transport and Logistics (Warehousing and Distribution) Companies (all transport and warehousing companies were studied) and (c) Tracking the Actual Transportation Process using GPS Tracking Devices.
Besides these main components, ACT has also developed a visual map, in which all transportation and logistics companies operating in Georgia are represented.
According the survey results a major part of the transport, cargo-handling and distribution is located in three main region/cities of Georgia. These are Tbilisi, Samegrelo-Zemo Svaneti (with Poti as its center), and Adjara region (with Batumi as its center).
Different types of transportation service are available in Georgia (truck/road, rail, sea, and air). The average amount of goods/freight transported during one year by companies is 18,800 tons. The cost of transporting goods one kilometer with one truck within the territory of Georgia is USD 1.88 on average, and similarly the cost of transporting freight for one kilometer with one freight car (rail) within the territory of Georgia is USD 2.56 on average.
The average time (measured by GPS) needed for trucks to move to several destinations is: 17.8 hours – (Poti-Sadakhlo), 12.5 hours – (Tbilisi-Poti/Poti – Tbilisi), 13.8 hours (Tbilisi-Batumi)
Warehousing companies operating in Georgia use various types of storage (dry, cold-frozen, bulk) for keeping goods. The average price of storing goods is USD 2.30 (1 ton/day) in dry storages, USD 6.70 (1 ton/day) for cold-frozen storages and USD 0.40 (1 m3/day) for bulk
ECONOMIC PROSPERITY INITIATIVE (EPI) iii
storage. Based on the survey results the full-potential capacity of all warehousing companies in Georgia is 1,477,690 tons. The average capacity of a company is 3,307 tons (the average number does not include data for the Poti sea port).
Port/airport-handling companies along with various services provide loading/unloading services. On average the loading/unloading time for one truck is two hours and the cost for liquid, bulk, and general cargo is USD 13, USD 9, and USD 12, respectively.
ECONOMIC PROSPERITY INITIATIVE (EPI) iv
ABBREVIATIONS
ACT ACT Research (Market research & consulting company)
EPI Economic Prosperity Initiative
FTF Face to Face
GEOSTAT National Statistics office of Georgia
GIS Geographic Information System
GPS Global Positioning System
USAID United States Agency for International Development

ECONOMIC PROSPERITY INITIATIVE (EPI) v
CONTENTS
I. EXECUTIVE SUMMARY ..................................................................................... 1
II. APPENDICES ..................................................................................................... 4
A. BACKGROUND ....................................................................................... 5
B. METHODOLOGY ..................................................................................... 7
C. SURVEY RESULTS ............................................................................... 13
TRANSPORT AND LOGISTICS TIME MOTION AND COST STUDY FINAL
ECONOMIC PROSPERITY INITIATIVE (EPI) 1
I. EXECUTIVE SUMMARY Transport and logistics is one of the strategic sectors of Georgia. It can be pivotal and catalytic to a broad segment of the economy. In order to fully understand its potential impact on the economy, it was critical to make an assessment of the transportation and logistics sector and it has been identified as a crosscutting sector that EPI will focus on.
The main role of ACT research in the frame of this project was to design and develop a statistically relevant methodology for baseline measurement of transport and logistics-related factors between specific transport nodes within Georgia and conduct the baseline survey according to the elaborated methodology.
The main objectives of the baseline survey were to study the timing, costs, availability, quality, and reliability of transportation and logistics in Georgia.
The main components of the applied methodology were:
Desk research (in order to obtain and analyze secondary data1 pertaining to the nodes that are to be studied in the scope of this project);
Surveys of transport and logistics (warehousing and distribution) companies (all transport and warehousing companies were studied) and
Tracking the actual transportation process by GPS.
In addition to this, ACT developed the visual map where information about nodes and companies is attached.
TRANSPORTATION AND LOGISTICS MARKET IN GEORGIA According to the database obtained from GEOSTAT, 631 transport and 333 logistics companies were registered in Georgia, but after actualization of this database, 303 transport companies and 82 warehousing, courier and port/airport handling companies are functioning currently in Georgia. All these companies are presented on the visual map developed by ACT.
In the process of goods/freight transportation, the nodes (airports, ports, terminals) located on the main transportation routes play an important role. The following nodes are of great importance in Georgia:
Tbilisi International Airport
Batumi International Airport
Kutaisi Airport
Mestia airport
1 The principal source of secondary data used in desk research was GEOSTAT (National Agency of statistics).

TRANSPORT AND LOGISTICS TIME MOTION AND COST STUDY FINAL
ECONOMIC PROSPERITY INITIATIVE (EPI) 2
Poti Sea Port
Batumi Sea Port
Khulevi Terminal
Sarpi
Sadakhlo
Tsiteli Khidi
PERFORMANCE METRICS OF TRANSPORT AND LOGISTICS COMPANIES A major portion of the target group companies (transport, cargo-handling, and distribution) is located in three main regions (cities) of Georgia. These are Tbilisi, Samegrelo-Zemo Svaneti with center at Poti, and Adjara region with center at Batumi (approximately 85% of companies are located here).
The average number of employees in the transport companies is 17, cargo-handling companies is 35, and distribution companies is 85.
Different types of transportation service are available in Georgia (truck/road, rail, sea, air). Most frequently goods/freight are transported by road/truck. Eighty-five percent of transport companies in Georgia provide transportation service by truck/road. These companies use different kind of trucks: dry, refrigerated, bulk, container, and automobile trucks. In more than half of the cases of freight forwarding, container trucks are used (52%). The type of container is 40’ and 20’ standard in most cases (86%). The average amount of goods/freight transported during one year by companies is 18,800 tons.
Warehousing companies use various types of storages for keeping goods. In particular, dry storage (85%), cold-frozen storage (26%), and bulk storage (51%). The average price of storing goods is USD 2.30 (1 ton/per day) in dry storage, USD 6.70 (1 ton/per day) for cold-frozen storage, and USD 0.40 (1 m3/per day) for bulk storage.
The whole potential capacity of all warehousing companies in Georgia based on survey results is 1,477,690 tons. The average capacity of a company is 3,307 tons (the average number does not include the data for Poti sea port).
Port/airport-handling companies along with various services provide load/unloading services. On average the load/unloading time for one truck is two hours and the cost for liquid, bulk, and general cargo is USD 13, USD 9, and USD 12 respectively.
The survey results showed that most transported/distributed/loaded/unloaded cargo in Georgia is construction materials and food products.
Seventy-five percent of distribution companies handle the goods supplied by transport companies. The majority of these companies (74%) are satisfied with the performance of transport companies. Transport companies are late on average in 17% of product supply cases and the duration of delay is on average five days. The main reasons for delays are technical problems of transport facilities and natural conditions (weather).
TRANSPORT AND LOGISTICS TIME MOTION AND COST STUDY FINAL
ECONOMIC PROSPERITY INITIATIVE (EPI) 3
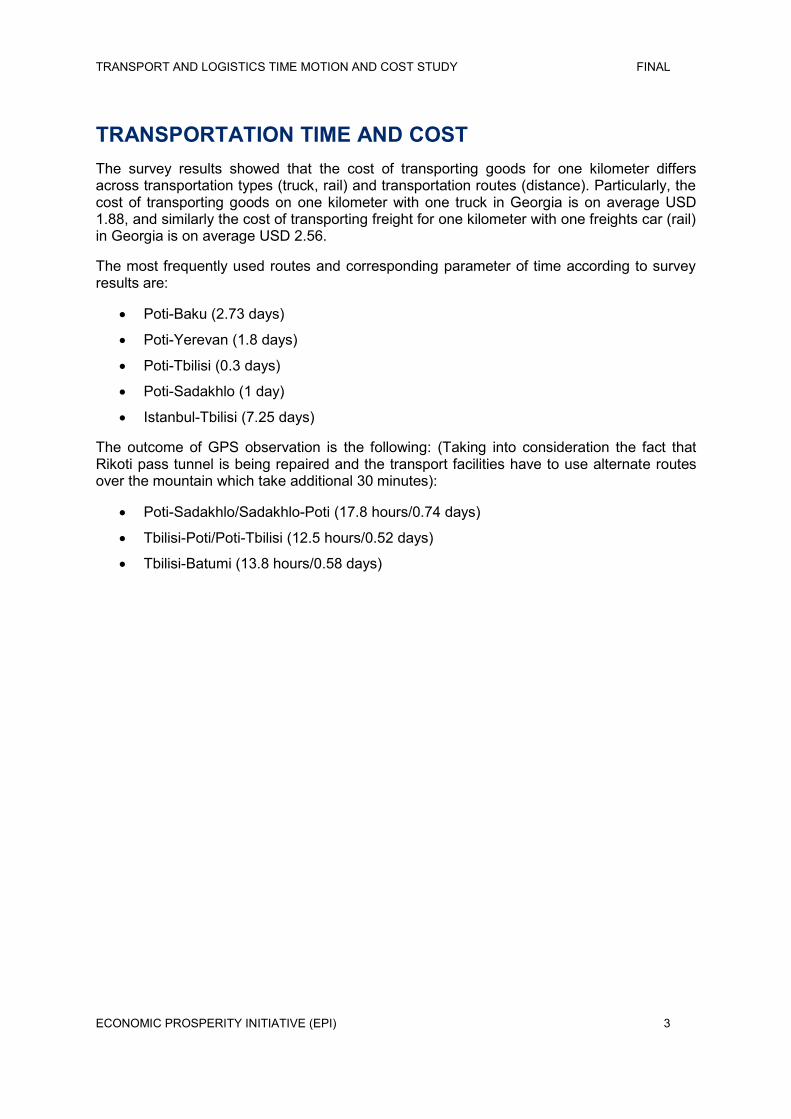
TRANSPORTATION TIME AND COST The survey results showed that the cost of transporting goods for one kilometer differs across transportation types (truck, rail) and transportation routes (distance). Particularly, the cost of transporting goods on one kilometer with one truck in Georgia is on average USD 1.88, and similarly the cost of transporting freight for one kilometer with one freights car (rail) in Georgia is on average USD 2.56.
The most frequently used routes and corresponding parameter of time according to survey results are:
Poti-Baku (2.73 days)
Poti-Yerevan (1.8 days)
Poti-Tbilisi (0.3 days)
Poti-Sadakhlo (1 day)
Istanbul-Tbilisi (7.25 days)
The outcome of GPS observation is the following: (Taking into consideration the fact that Rikoti pass tunnel is being repaired and the transport facilities have to use alternate routes over the mountain which take additional 30 minutes):
Poti-Sadakhlo/Sadakhlo-Poti (17.8 hours/0.74 days)
Tbilisi-Poti/Poti-Tbilisi (12.5 hours/0.52 days)
Tbilisi-Batumi (13.8 hours/0.58 days)

TRANSPORT AND LOGISTICS TIME MOTION AND COST STUDY FINAL
ECONOMIC PROSPERITY INITIATIVE (EPI) 4
II. APPENDICES A. BACKGROUND
B. METHODOLOGY
C. SURVEY RESULTS
D. ADDITIONAL INFORMATION

TRANSPORT AND LOGISTICS TIME MOTION AND COST STUDY FINAL
ECONOMIC PROSPERITY INITIATIVE (EPI) 5
A. BACKGROUND Because of its strategic geographic location for business and cross-country trade, Georgia has been experiencing a growing transportation and logistics sector. Thanks to this emphasis on the sector, Georgian infrastructure has kept up the development despite the turmoil of war and the effects of the world economic crisis that it has undergone since 2008. This is confirmed by significantly increased traffic flows in recent years. According to the Road Department data, the traffic flows have almost doubled in 2010 compared to 2006 (See table below).
AADT2 (Anual Average Daily Traffic) (2006-2010 year)
YEAR SECTION Car Mini Buses<15, PickUPs
Buses & Trucks
Trailers & > 3 axels
Sum
2006 Igoeti km 56 6,755 2,230 617 429 10,031
2007 Igoeti km 56 7,826 1,508 665 564 10,564
2008 Igoeti km 56 8,773 1,860 697 566 11,896
2009 Igoeti km 56 8,502 1,881 647 498 11,528
2010 Igoeti km 56 12,266 2,409 1,035 779 16,489
The current processes in the country – the ongoing process of infrastructure development (highway construction) and modernizing the sector (check-points, customs) – undoubtedly contribute to this dynamic of growth.
EPI accordingly also views the importance of the transportation and infrastructure sectors as very high for the country’s economic development potential. Development of the transportation and mechanics is intertwined with the development of any other business/economic initiative, be it agriculture, tourism, trade, etc. Considering these factors, seeing the crucial potential of this sector for the economy at large, EPI sees it necessary to perform an assessment of the transportation and logistics sector.
In order to make a deep assessment of transport and logistics and develop the strategy work plan in this sector it is critical to obtain baseline data using statistically relevant methodology. Unfortunately, there were no such data in this sector until now. Taking into account the lack of the above mentioned data the survey research was planned.
The main purpose of the research was to design and develop statistically relevant methodology for baseline measurement of transport and logistics-related factors between
2 Source – Road Department of Georgia

TRANSPORT AND LOGISTICS TIME MOTION AND COST STUDY FINAL
ECONOMIC PROSPERITY INITIATIVE (EPI) 6
specific transport nodes within Georgia and conduct the baseline survey according to this methodology.
The main objectives of baseline survey were to study the timing, costs, availability, quality, and reliability of transportation and logistics in Georgia.
The main issues studied during the survey are listed below:
Significant transportation nodes in Georgia (Georgian sea ports, airports, origin/destination rail and road routes)
Transport, warehousing, port/airport-handling and distribution companies and their performance metrics
Performance metrics include the specific information as shown below:
Service type (air, sea, rail, road)
Types of transport facilities (dry, refrigerated, container, bulk)
Tonnage of the company, goods/freight served
Transportation directions (origin, final destination)
Transportation time and cost (cost of transporting good for 1 km)
Types of warehouses (dry, cold/frozen, bulk)
Price of storing goods at warehouses (1 ton/per day, 1 m²/per day, 1 m³/per day)
Loading/unloading time and cost
In addition, it should be mentioned that the study used objective measures of time and distance such as GPS.
Information obtained as a result of this methodology allowed us to determine the exact route and distance covered by transport facilities (trucks) in Georgia (between main nodes).
In order to better visualize the data, ACT has offered EPI to attach the companies’ exact coordinates (latitude / longitude), the photos, profiles, and sizes of the companies to the map. This will allow for easily sensing the size, location, and distance between companies in the given sector.

TRANSPORT AND LOGISTICS TIME MOTION AND COST STUDY FINAL
ECONOMIC PROSPERITY INITIATIVE (EPI) 7
B. METHODOLOGY Desk research At the initial stage of the project the desk research was applied. The purpose of the desk research was to obtain and analyze secondary data pertaining to the nodes that were to be studied in the scope of this project (Georgian sea and airports, origin/destination rail and road routes). In addition, the database of transport, warehousing, courier, port-handling and distribution companies were obtained.
The principal source of secondary data used in desk research was GEOSTAT and Road Department of Georgia.
Survey of Transport and Logistics (Warehousing and Distribution) Companies INSTRUMENT AND TECHNIQUE
Face-to-face interviews were used for the survey. The length of an interview was approximately 30-40 minutes. In order to develop the structured questionnaire ACT conducted four in-depth interviews with target segment companies in advance. This helped to arrive at the outline of the questionnaire in close cooperation with the expert of the respective component of EPI and later tested in the pilot survey. A special guide was prepared for the above-mentioned in-depth interviews.
PILOT STUDY AND FINAL INSTRUMENT
In order to finalize the questionnaire, the pilot study (five interviews) was carried out in Tbilisi. Upon completion of the interviews, the data was sent to EPI in order to check the relevance of the data with the basic model. After receiving some specific comments from EPI about the questionnaires, five more interviews were conducted and the instrument of the survey was finalized.
Depending on the specification of the target segment organizations, three different kinds of questionnaires were made.
Content of Questionnaires:
Questionnaire 1 (transport companies):
General information about the company (legal status, number of employees, time of operation on the market, information about branches)
Performance metrics (types of transport facilities, goods/freight served, tonnage of the company, transportation directions)
Concrete case of transportation (origin, final destination, check-points on the border of Georgia, transportation time, transportation cost, cost of transporting good on 1 km)
Questionnaire 2 (warehousing, courier, and port-handling companies):

TRANSPORT AND LOGISTICS TIME MOTION AND COST STUDY FINAL
ECONOMIC PROSPERITY INITIATIVE (EPI) 8
General information about the company (legal status, number of employees, time of operation on the market, information about branches)
Performance metrics (types of transport facilities, goods/freight served, tonnage of the company, transportation directions, types of warehouses, number and size of warehouses, price of load/unloading, price of storing goods at warehouses)
Questionnaire 3 (distribution companies):
General information about the company (legal status, number of employees, time of operation on the market, information about branches)
Performance metrics (types of transport facilities, goods/freight distributed, tonnage of the company, types of warehouses, number and size of warehouses)
Testing level of satisfaction (satisfaction level of distributor companies in terms of services provided to them by other logistics and transportation companies)
INTERVIEWERS’ TRAINING
Training about the questionnaires was conducted on 16-17 May by the project manager to the interviewers who were selected according to their specialization and experience. On this training they learned in detail (a) the subject of the study, (b) the study tools, and (c) the sampling design. Interviewers were provided with all the materials needed for the field works, such as:
Addresses of the companies
Sampling guideline
Technical report form
Questionnaires
The practical part of the training concentrated on conducting simulated interviews and later holding an additional discussion of each component of the questionnaire. The total number of interviewers was 35. Twenty interviewers in Tbilisi, four interviewers in Kvemo Kartli, five interviewers in Adjara, three interviewers in Imereti, and three interviewers in Samegrelo region.
SAMPLING DESIGN
ACT recommended the sampling design presented below.
Sampling method – stratified random sampling
Sample frame – the database of companies obtained from GEOSTAT (business register)
Target segment – The target segment of the survey comprises three different groups of companies:
1) Transport companies
2) Warehousing, courier, port-handling companies
3) Distribution companies
TRANSPORT AND LOGISTICS TIME MOTION AND COST STUDY FINAL
ECONOMIC PROSPERITY INITIATIVE (EPI) 9
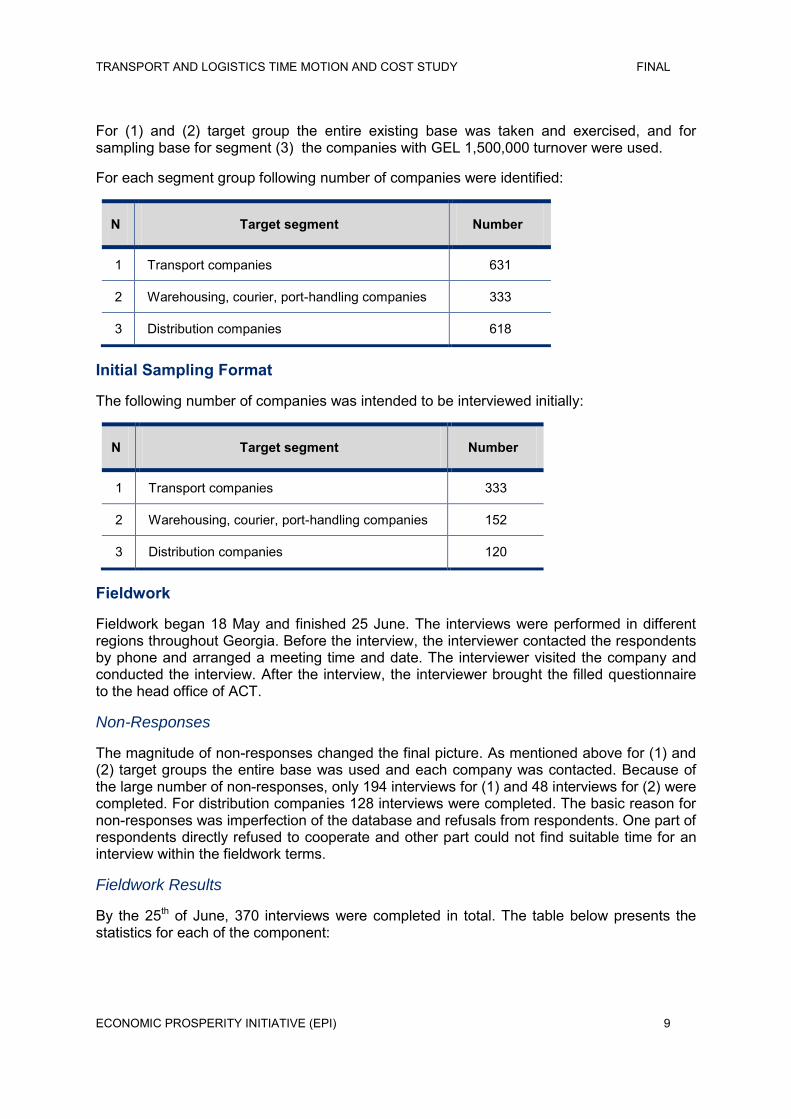
For (1) and (2) target group the entire existing base was taken and exercised, and for sampling base for segment (3) the companies with GEL 1,500,000 turnover were used.
For each segment group following number of companies were identified:
N Target segment Number
1 Transport companies 631
2 Warehousing, courier, port-handling companies 333
3 Distribution companies 618
Initial Sampling Format
The following number of companies was intended to be interviewed initially:
N Target segment Number
1 Transport companies 333
2 Warehousing, courier, port-handling companies 152
3 Distribution companies 120
Fieldwork
Fieldwork began 18 May and finished 25 June. The interviews were performed in different regions throughout Georgia. Before the interview, the interviewer contacted the respondents by phone and arranged a meeting time and date. The interviewer visited the company and conducted the interview. After the interview, the interviewer brought the filled questionnaire to the head office of ACT.
Non-Responses
The magnitude of non-responses changed the final picture. As mentioned above for (1) and (2) target groups the entire base was used and each company was contacted. Because of the large number of non-responses, only 194 interviews for (1) and 48 interviews for (2) were completed. For distribution companies 128 interviews were completed. The basic reason for non-responses was imperfection of the database and refusals from respondents. One part of respondents directly refused to cooperate and other part could not find suitable time for an interview within the fieldwork terms.
Fieldwork Results
By the 25th of June, 370 interviews were completed in total. The table below presents the statistics for each of the component:

TRANSPORT AND LOGISTICS TIME MOTION AND COST STUDY FINAL
ECONOMIC PROSPERITY INITIATIVE (EPI) 10
Organizations Components
Transport companies
Warehousing, courier, port-handling
companies
Distribution companies
Completed interviews 194 48 128
Refusals 109 34 74
Abolished/temporarily doesn't function
256 133 39
Not satisfy sampling demands 72 118 24
Total Contacted 631 333 265
Fieldwork Quality Control
Monitoring of field work was conducted by the control group. Quality assurance was enforced through (1) checking completed questionnaires by field coordinators and project manager (100%), (2) checking randomly selected completed questionnaires by phone and asking previously worked-out control questions to respondents (30%), and (3) interviewers’ daily reports.
The Quality Control Group checked the interviews on the following aspects:
Authenticity of conducting interviews and asking all questions
Relevancy criterion of respondents
Logic of answers to some specific questions in the questionnaire (transportation costs, time etc.)
Data Processing
After the field work (including quality control and questionnaire editing components) coding process was organized by the field manager and the open-ended questions were coded by coding specialists. The code-book frame for the project was developed during the pilot study.
Data Entry Procedure - For data entry and archiving of the corresponding documentation, the following procedures were performed:
1. Receipt of revised and coded (open-ended questions) questionnaires from the field department
2. Distribution of questionnaires to the data-entry operators
3. Collecting the entered questionnaire.
The data were entered in SPSS 15.0 by four data entry operators.

TRANSPORT AND LOGISTICS TIME MOTION AND COST STUDY FINAL
ECONOMIC PROSPERITY INITIATIVE (EPI) 11
SPSS software has effective tools to identify errors. Database Specialists apply template SPSS procedures and macros designed by the ACT Database Department. Macros are designed in SPSS syntax language and are applied to filter the data. \
The final database was converted in the Excel format and presented in the manner requested by the EPI project team.
Attaching the survey information to the map for visualization
In addition to interviews during fieldwork, two qualified ACT team members provided with GPS devices and cameras identified the companies of target segments (all transport, warehousing, and distribution companies participating in the survey) in Tbilisi as well as in regions of Georgia. Two or three photos were taken on each company and the coordinates (longitude and latitude) were defined. ACT intends to attach this information along with the other important characteristics (profile, size) of the companies to the Geographic Information System (GIS) map for visualization.
ACT involved GIS expert Giorgi Japaridze in this stage of survey.
Faced challenges and mitigation measures
There were a number of companies from the database which were out of business or temporarily non-operational. ACT obtained this data from the National Statistics Office of Georgia and considered it carefully. This problem was solved by contacting the respondent. If the company appeared to be out of business, the next respondent was contacted.
Some of the companies did not satisfy sampling demands. Information about this fact was obtained from the first contact to respondents by means of filter questions. If the company did not match the sampling requirements the next respondent was contacted.
In the database that was purchased from GEOSTAT some companies’ addresses were unclear, whether they were actual or juridical. The interviewer contacted the respondent and clarified if these two addresses coincided, and if not then obtained the actual address.
During the fieldwork there were some difficulties about arranging the interviews with respondents as they were busy or the relevant person in the company was not available at the time. The interviewer contacted the respondents several times or even visited the companies several times in order to find a suitable time for the respondent and conduct the interview properly.
Sometimes there were problems from respondents giving some specific information, such as prices as they deemed it to be confidential. Before the interview, the interviewer assured the respondents that any information they gave would be kept confidential. Respondents’ answers would be analyzed on an aggregate basis and their personal information would not be disclosed under any circumstances. Despite this some respondents still refused to be open. In addition to this some companies, especially small ones did not possess the information about price making factors at all.
TRACKING THE ACTUAL TRANSPORTATION PROCESS BY GPS

TRANSPORT AND LOGISTICS TIME MOTION AND COST STUDY FINAL
ECONOMIC PROSPERITY INITIATIVE (EPI) 12
In parallel to fieldwork, active negotiations were carried out concerning the installation of GPS trackers on the trucks. One hundred two observations were conducted in total. Ninety-seven cases were analyzed in the report, five of them were finished by 15 July and were not taken into account during analysis.
GPS tracking devices are used for tracking the actual transportation process. The observation provided information about the current location of a truck, the distance between any two geographical points, the speed used for transportation between these two points, coordinates of places where and timing when trucks stop. The observations were conducted throughout Georgia only.
Data obtained by GPS was analyzed by ACT database specialists. The observation data is presented in Excel format and its electronic version is attached to the document.
CHALLENGES FACED AND MITIGATION MEASURES
Purchasing GPS trackers – According to the contract, ACT had to hire specific configuration GPS trackers from a GPS service providing company. But some problems arose from this contractor and ACT was obliged to start negotiations with another supplier and purchased 20 GPS trackers at the beginning of June.
It was difficult to reach an agreement with truck owners about the installation of GPS devices. The respondents had no wish to install the trackers in their cars. ACT used all its resources (involvement of specially trained group of people, use of personal ties with companies’ managers) for implementing 100 trackers.
Force majeure situation: the process of observation by GPS trackers was impeded because of flood and landslide on Rikhoti Pass. This was the main reason for the delay of fieldwork by two weeks.

TRANSPORT AND LOGISTICS TIME MOTION AND COST STUDY FINAL
ECONOMIC PROSPERITY INITIATIVE (EPI) 13
C. SURVEY RESULTS Below are the results of the survey about the transport, warehousing, courier, port-handling, and distribution companies. These include (1) general information about the companies: operating time on the market, number of employees, location of company’s head office and branches; (2) Performance metrics: types of transportation service and types of ownership of transport facilities, annual tonnage of companies, transportation routes, time, and cost. (3) Types of goods served, amount of goods loaded/unloaded during one year, capacity of warehouses, rates of service of these companies, etc.
Here are descriptive analyses of all important and interesting parameters.
TRANSPORT AND LOGISTICS COMPANIES - STATISTICS According to the database obtained from GEOSTAT, 631 transport and 333 logistics companies were registered in Georgia, but after actualization of this database, 303 transport companies and 82 warehousing, courier, and port/airport handling companies are functioning currently in Georgia, others have changed their profile or stopped functioning at the current moment.
In the process of goods/freight transportation the nodes (airports, ports, terminals) located on the main transportation routes play an important role. The following nodes are of great importance in Georgia:
Tbilisi International Airport
Batumi International Airport
Kutaisi Airport
Mestia airport
Poti Sea Port
Batumi Sea Port
Khulevi Terminal
Sarpi
Sadakhlo
Tsiteli Khidi
Their locations are presented on the visual map developed by ACT in the frame of this project (see below the picture of visual map).

TRANSPORT AND LOGISTICS TIME MOTION AND COST STUDY FINAL
ECONOMIC PROSPERITY INITIATIVE (EPI) 1
Figure 1: Visual Map
TRANSPORT AND LOGISTICS TIME MOTION AND COST STUDY FINAL
ECONOMIC PROSPERITY INITIATIVE (EPI) 1
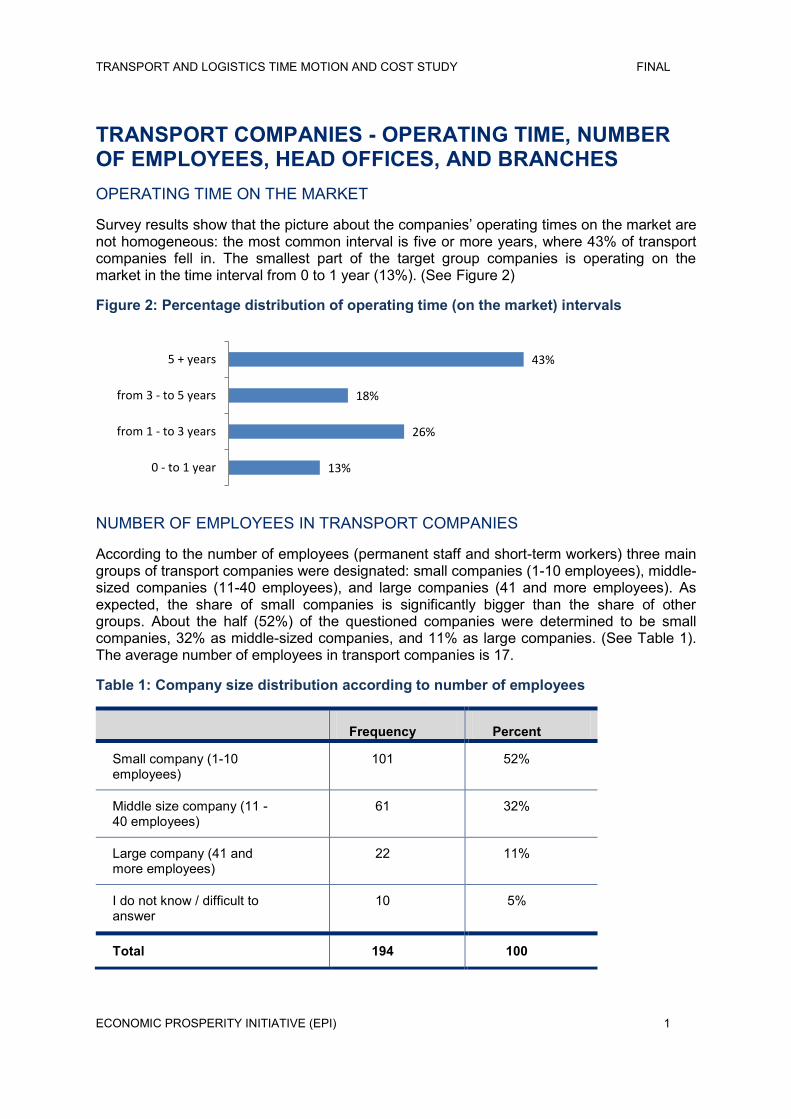
TRANSPORT COMPANIES - OPERATING TIME, NUMBER OF EMPLOYEES, HEAD OFFICES, AND BRANCHES OPERATING TIME ON THE MARKET
Survey results show that the picture about the companies’ operating times on the market are not homogeneous: the most common interval is five or more years, where 43% of transport companies fell in. The smallest part of the target group companies is operating on the market in the time interval from 0 to 1 year (13%). (See Figure 2)
Figure 2: Percentage distribution of operating time (on the market) intervals
NUMBER OF EMPLOYEES IN TRANSPORT COMPANIES
According to the number of employees (permanent staff and short-term workers) three main groups of transport companies were designated: small companies (1-10 employees), middle-sized companies (11-40 employees), and large companies (41 and more employees). As expected, the share of small companies is significantly bigger than the share of other groups. About the half (52%) of the questioned companies were determined to be small companies, 32% as middle-sized companies, and 11% as large companies. (See Table 1). The average number of employees in transport companies is 17.
Table 1: Company size distribution according to number of employees
Frequency Percent
Small company (1-10 employees)
101 52%
Middle size company (11 - 40 employees)
61 32%
Large company (41 and more employees)
22 11%
I do not know / difficult to answer
10 5%
Total 194 100
13%
26%
18%
43%
0 - to 1 year
from 1 - to 3 years
from 3 - to 5 years
5 + years

TRANSPORT AND LOGISTICS TIME MOTION AND COST STUDY FINAL
ECONOMIC PROSPERITY INITIATIVE (EPI) 2
HEAD OFFICES AND BRANCHES
Head offices of the transport companies are congregated in three main cities of Georgia: more than half (57%) of the companies’ head offices are located in the capital Tbilisi, one fifth (20%) and 9% are situated in the sea cities Poti and Batumi respectively, the rest 14% of the companies are scattered through various cities and towns of Georgia. (See Figure 3)
Figure 3: Location of head offices
One fifth (19%)of companies have branches apart from the head office. (See Figure 4)
Figure 4: Percentage distribution of companies having branches
The distribution trend of companies’ branches is more or less similar to the distribution of head offices.
1%
1%
1%
1%
1%
1%
1%
1%
1%
1%
2%
2%
9%
20%
57%
Zugdidi
Rustavi
Zestaponi
Gori
Kaspi
Borjomi
Khashuri
Mtshketa
Akhmeta
Tskhaltubo
Khelvachauri
Kutaisi
Batumi
Poti
Tbilisi
19%
81%
branches
no branches
TRANSPORT AND LOGISTICS TIME MOTION AND COST STUDY FINAL
ECONOMIC PROSPERITY INITIATIVE (EPI) 3
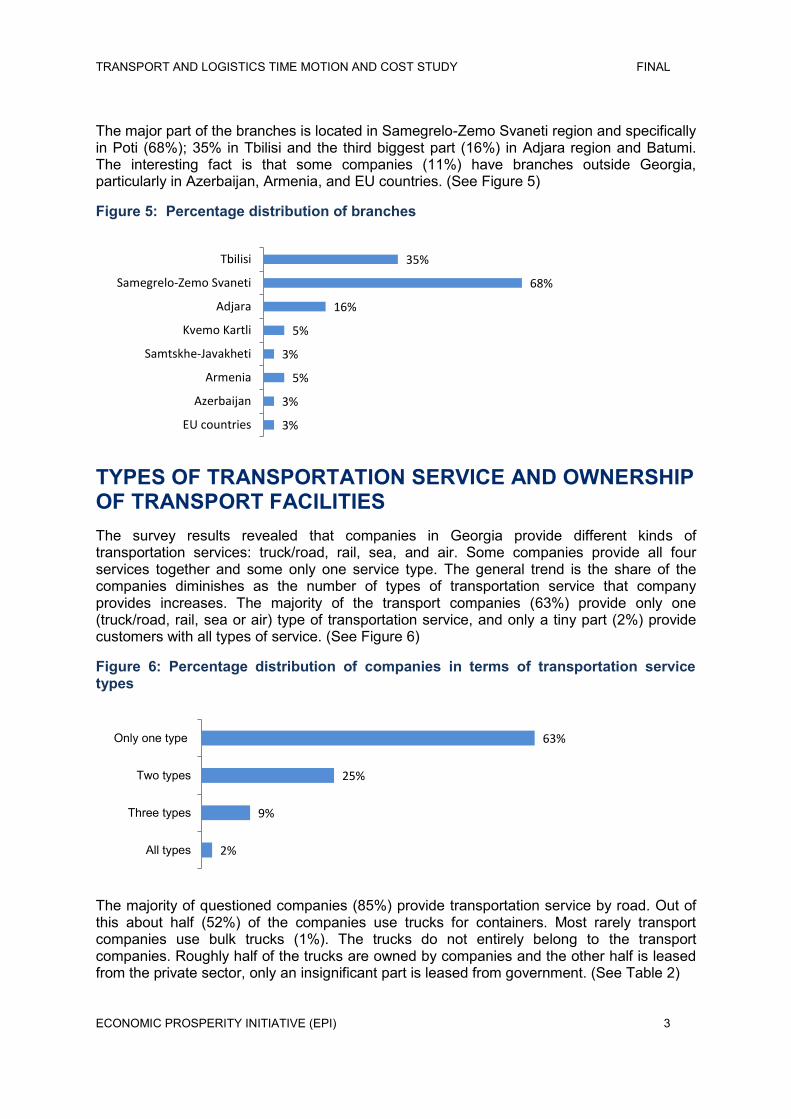
The major part of the branches is located in Samegrelo-Zemo Svaneti region and specifically in Poti (68%); 35% in Tbilisi and the third biggest part (16%) in Adjara region and Batumi. The interesting fact is that some companies (11%) have branches outside Georgia, particularly in Azerbaijan, Armenia, and EU countries. (See Figure 5)
Figure 5: Percentage distribution of branches
TYPES OF TRANSPORTATION SERVICE AND OWNERSHIP OF TRANSPORT FACILITIES The survey results revealed that companies in Georgia provide different kinds of transportation services: truck/road, rail, sea, and air. Some companies provide all four services together and some only one service type. The general trend is the share of the companies diminishes as the number of types of transportation service that company provides increases. The majority of the transport companies (63%) provide only one (truck/road, rail, sea or air) type of transportation service, and only a tiny part (2%) provide customers with all types of service. (See Figure 6)
Figure 6: Percentage distribution of companies in terms of transportation service types
The majority of questioned companies (85%) provide transportation service by road. Out of this about half (52%) of the companies use trucks for containers. Most rarely transport companies use bulk trucks (1%). The trucks do not entirely belong to the transport companies. Roughly half of the trucks are owned by companies and the other half is leased from the private sector, only an insignificant part is leased from government. (See Table 2)
3%
3%
5%
3%
5%
16%
68%
35%
EU countries
Azerbaijan
Armenia
Samtskhe-Javakheti
Kvemo Kartli
Adjara
Samegrelo-Zemo Svaneti
Tbilisi
2%
9%
25%
63%
All types
Three types
Two types
Only one type

TRANSPORT AND LOGISTICS TIME MOTION AND COST STUDY FINAL
ECONOMIC PROSPERITY INITIATIVE (EPI) 4
A little less than one third of the transport companies provide transportation service by rail. They use different kind of freight cars/goods vans. Here it should be mentioned that all railway cars/vans belong to Georgian Railway and other transport companies hire from them.
Around one third of companies provide transportation service by sea. Different kinds of ferries are used during transport. The ferry for container is used in half of the transportation cases by sea (53%). Similar to railroad, almost none of the companies own the ships (just 4.5% for container ferries), whereas the greater part is for cases, which are leased from government or private sector.
Only 7% of transport companies provide transportation service by air. As the results showed, the companies in Georgia who transport freight by air do not possess aircraft entirely (only 24%). Most of them hire aircraft (52%). (See Table 2)
Table 2: Percentage distribution of types of transportation service and types of ownership of transport facilities
Types of transport facilities % Number of
transport facilities
(all)
Own % Leased from government
%
Leased from
private person
%
Do not know
%
Truc
k/R
oad
85 %
Dry 34 696 54.6 0.4 43.1 1.9
Refrigerated 11 223 31.4 0.0 67.3 1.3
Bulk (Tank) 1 25 24.0 0.0 68.0 8.0
For containers 52 1068 22.8 0.9 75.4 0.9
For automobiles 2 33 93.9 0.0 3.0 3.0
Rai
l 2
8 %
For containers 7 450 100 0.0 0.0 0
For bulk freight 33 2000 100 0.0 0.0 0
Tank cars 20 1206 100 0.0 0.0 0
For ordinary freight (open, half-open)
33 2011 100 0.0 0.0 0
Platform car (for transporting technique)
7 410 100 0.0 0.0 0
Sea
30 %
Ferry for containers 53 44 4.5 9.1 59.1 27.3
Ferry for railway cars 27 22 0.0 4.5 54.5 40.9
Ferry for trucks 20 17 0.0 0.0 82.4 17.6
Air7
%
Aircraft 100 29 24.1 3.4 48.3 24.1

TRANSPORT AND LOGISTICS TIME MOTION AND COST STUDY FINAL
ECONOMIC PROSPERITY INITIATIVE (EPI) 5
In the shaded cells the railway cars/vans all belong to Georgian Railway and all other transport companies hire from them.
CONTAINER TYPES & TONNAGE OF TRANSPORT COMPANIES From survey results, it is seen that during transport in half of the cases, companies transport various kinds of goods with containers. Most commonly, transport companies use 40’ (87%) and 20’ (86%) standard containers. In addition to this, other kinds of containers are also used. (See Figure 7)
Figure 7: Percentage distribution of container types
Transport companies significantly differ from each other in terms of amount of transported goods during one year. Five key intervals were designed according to survey results: 0-1,000 tons, 1,001-5,000 tons, 5,001-20,000 tons, 20,001-100,000 tons, and greater than 100,001 tons. Moreover no sharply leading interval was expressed. Survey results showed that the percentages were equally distributed among all intervals. The exception would be the interval greater than 100,001 tons with the least share (7%) (See Figure 8)
Figure 8: Percentage distribution of companies’ annual tonnage
The average amount of goods/freight transported in one year by a company is 18,800 tons.
16%
22%
25%
28%
29%
86%
87%
45’ highcube
40’ highcube refrigerated
20’ refrigerated
40’ refrigerated
40’ highcube
20’ standard
40’ standard
1%
13%
20%
14%
23%
22%
7%
Refused to answer
I do not know/it is difficult for me to…
0 - 1000 tons
1001 - 5000 tons
5001 - 20000 tons
20001 - 100000 tons
100001 + tons

TRANSPORT AND LOGISTICS TIME MOTION AND COST STUDY FINAL
ECONOMIC PROSPERITY INITIATIVE (EPI) 6
TYPES OF GOODS/FREIGHT & TRANSPORTATION ROUTES TYPES OF GOODS /FREIGHT
During the survey besides the companies’ tonnage ACT project team analyzed the distribution of types of transported goods/freight. The prevalent type of good is construction materials which were transported by 64 percent of transport companies. Following types of freight are food materials and household technique with the shares 48% and 40% respectively. The least portion got logging (13%) and oil (5%). (See diagram 2.3.5 a)
Figure 9: Percentage distribution of transported goods/freight
TRANSPORTATION ROUTES
The major part of the target group companies (63%) are focused on international as well as domestic transportation simultaneously. Less than one third (27%) of companies do only domestic transportation and 10% of target group companies are specified in transporting goods only abroad. (See Figure 10)
Figure 10: Distribution of transportation routes (percentage)
7%
5%
13%
20%
23%
23%
26%
30%
32%
40%
48%
64%
Other
Oil
Logging
Automobiles
Wine
Alcohol drinks (cognac, vodka etc)
Furniture
Everyday goods (vessel, hygienic items…
Agricultural products
Household technique
Food products
Construction materials
27%
63%
10% Only within Georgia
Within Georgia andabroad
Only abroad

TRANSPORT AND LOGISTICS TIME MOTION AND COST STUDY FINAL
ECONOMIC PROSPERITY INITIATIVE (EPI) 7
From Georgia, goods/freight are being transported to various countries. Specifically two countries stand out from others: Armenia and Azerbaijan. Goods to these two countries are transported by 65% and 58% of transport companies respectively. In third place is Turkey (36%). This outcome is not surprising because all of these countries are neighbors of Georgia and transportation processes among these countries are rather dense. The share of EU countries is 32% and the share of US is 7%, which is the least portion. (See Figure 11)
Figure 11: Distribution of transportation directions (countries)
TRANSPORTATION PRICE-MAKING & COST OF TRANSPORTING GOODS FOR 1 KILOMETER The survey results revealed that plenty of factors have influence on making of transportation costs. The most prevalent factor is cost of fuel, 80 percents of respondents take it into consideration while charging for the transportation service. Also important factors are cost of drivers’ salaries (46%) and cost of load/unload service (34%). For transport companies who carry goods with railroad the rates of Georgian Railway is one of the most significant factors as they hire goods vans from Georgian Railway. Other important aspects are cost of insurance (31%) and cost using the service of other mediator companies (23%). (See Figure 12)
Figure 12: Percentage Distribution of factors affecting transportation price
3% 7%
8% 12% 12%
15% 17%
18% 18%
31% 32%
36% 58%
65%
other US
Kirghizia Turkmenistan
China Kazakhstan
Russia Belarus
Baltic countries Ukraine
EU countries Turkey
Azerbaijan Armenia

TRANSPORT AND LOGISTICS TIME MOTION AND COST STUDY FINAL
ECONOMIC PROSPERITY INITIATIVE (EPI) 8
PARTICULAR TRANSPORTATION CASES
In the frame of the survey, particular transportation cases were considered separately. Origin, final destination, transportation time, and cost of the particular route were identified. Below the results of several of the most frequently occurring transportation cases are summarized. The Absolute majority of these cases were executed during May and June, so the parameters are actual and relevant.
In total, 273 cases of transportation of goods/freight were considered. As it was expected import has the biggest portion (32%) and the smallest share comes from export (17%). (See Figure 13)
Figure 13: Percentage distribution of transportation types in terms of export, import transit and internal races
Below in Table 3 are the most frequent transportations cases. For each case, the origin and final destination, transportation type (road, rail), average number of days needed for transportation, and average cost of transportation for one unit of transport facility (truck, goods van) are indicated. For example, transportation of goods/freight from Poti to Baku by
4% 3%
1% 1% 1% 1% 1% 1% 1% 2% 2% 2%
5% 6%
18% 19% 19%
21% 23%
31% 34%
46% 80%
I do not know/it is difficult…
income-tax
Customer's requirements
Service of port-handling…
Business trip costs
Currency exchange rates
Cost of preparing…
Cost of using the service…
Cost of custom service
Cost of using the service…
Cost of load/unload service
Cost of fuel
17%
32%
26%
26%
export
import
transit
Internal transportations

TRANSPORT AND LOGISTICS TIME MOTION AND COST STUDY FINAL
ECONOMIC PROSPERITY INITIATIVE (EPI) 9
road takes on average 2.73 days and average transportation cost is USD 1,438. Transportation from Warsaw to Tbilisi with trucks on average takes 9.5 days and costs USD 6,460 for one truck. (See Table 3)
Table 3: Particular transportation cases
Transportation routes
Transportation types
Number of cases
Average number of days needed
for transportation
Average transportation cost for 1 unit
transport facility (USD)
Poti-Baku Truck/Road 13 2.73 1438
Rail 4 4.75 1700
Poti-Tbilisi Truck/Road 25 0.3 747
Rail 5 1.25 1055
Poti-Yerevan Truck/Road 13 1.8 1305
Rail 4 2.75 1000
Istanbul-Tbilisi Truck/Road 5 7.25 2350
Poti-Gardabani Rail 5 1.85 1464
Poti-Sadakhlo Truck/Road 3 1 752
Rail 1 2 650
Warsaw-Tbilisi Truck/Road 4 9.5 6460
One of the most important parameters of the study was the cost of transporting goods for 1 kilometer. The survey results showed that this parameter varied according to transportation types (truck, rail). Particularly, the cost of transporting goods for 1 kilometer with one truck is on average USD 1.88 and similarly the cost of transporting freight for 1 kilometer with one goods van (rail) is USD 2.65.
TRANSPORTATION TIMING BETWEEN SPECIFIC NODES (GPS RESULTS) In the frame of the survey GPS devices were used to observe particular transportation cases in order to track actual transportation time and distance between specific nodes in Georgia. Ninety-seven cases of goods transportation were considered. The table below shows the results of the observation process, which includes most important and frequently used routes, origin and destination of the route, distance between the nodes, time needed to cover the distance, and average transportation speed. For example distance between Poti and Sadakhlo is 394 km and transport facilities need on average 17.8 hours to move from origin to destination (this time include break times during transportation process. See detail

TRANSPORT AND LOGISTICS TIME MOTION AND COST STUDY FINAL
ECONOMIC PROSPERITY INITIATIVE (EPI) 10
information in attached Excel file – GPS observation results). Average speed of motion on this route is 48 km/hour.
Table 4: GPS observation results
Transportation Route Distance (km)
Average Time (hour)
Average Speed of Motion (km/h)
Poti – Tbilisi/Tbilisi - Poti 323 12.5 48
Poti – Sadakhlo/Sadakhlo-Poti 394 17.8 45
Poti – Tsiteli Khidi 389 43 42.6
Tbilisi - Batumi 407 13.8 47.4
Tbilisi – Sadakhlo/Sadakhlo -Tbilisi 68 1.6 47.9
Note: Due to repair process on Rikoti tunnel the average time is increased by 0.5 hours
By means of GPS devices along with transportation time and distance time spent on check-points on the border of Georgia was analyzed. Specifically, trucks were held on Sadakhlo (border to Armenia) check-point on average for 1.5 hours and on Tsiteli Khidi (border to Azerbaijan) for 4.5 hours.
PORTS AND CHECK POINTS ON THE BORDER OF GEORGIA During the transportation process transport facilities cut the Georgian border in different places. It can be ports, airports, and check-points. In all places transport facilities and goods pass through different procedures. These procedures can include preparing the juridical documents, parking on the sea port/check point territory, freight loading/unloading, freight storing, service of carrying the transport facilities on the ferry, etc. All of these procedures are connected with time and financial costs. In Table 5 the most important ports and checkpoints in terms of these parameters were analyzed.
After analyses of the results, it turned out that Batumi sea port, Poti sea port, and Tbilisi airport are connected with greater time and financial expenses. Namely, it takes on average 32, 31, and 8 hours to pass all the procedures at Batumi sea port, Poti sea port and Tbilisi airport and it costs USD 851, USD 233, and USD 112 respectively. In other check-points (Gardabani, Sadakhlo, Sarpi, and Tsiteli khidi) the situation is simpler: Average time needed to pass the procedures is 6 hours and average cost is USD 19. (See Table 5)
Table 5: Ports and check points on the border of Georgia
Name of port/airport/check-
point
Number of cases
considered
Average number of hours needed for procedures
Average cost of procedures
(USD)
Tbilisi Airport 11 8 112
Batumi Sea Port 25 32 851

TRANSPORT AND LOGISTICS TIME MOTION AND COST STUDY FINAL
ECONOMIC PROSPERITY INITIATIVE (EPI) 11
Poti Sea Port 54 31 233
Gardabani (Railway) 20 5 3
Sadakhlo (Railway) 10 5 17
Sadakhlo 33 5 24
Sarpi 49 11 15
Tsiteli Khidi 28 5 34
COURIER AND PORT-HANDLING COMPANIES (OPERATING TIME, HEAD OFFICES & BRANCHES, NUMBER OF EMPLOYEES) OPERATING TIME
The survey results revealed that more than half (60%) of the target group companies are operating on the market five or more years. The rest of the firms are more or less equally distributed through different time intervals. (See Figure 14)
Figure 14: Period of performance of companies on the market
NUMBER OF EMPLOYEES
The average number of workers in a company is 35. This parameter is greater than analogous parameter for transport companies (17) and less than distribution companies (98).
The survey showed that the share of companies gradually decreases as the number of employees in the company increases. The portion of small companies is 40% and the portion of large companies is 23%. (See table 6)
Table 6: company size distribution according to number of employees
Frequency Percent
Small company (1-10 employees) 19 40%
Middle size company (11 - 40 employees)
14 29%
15%
15%
10%
60%
0 - to 1 year
from 1 - to 3 years
from 3 - to 5 years
5 + years
TRANSPORT AND LOGISTICS TIME MOTION AND COST STUDY FINAL
ECONOMIC PROSPERITY INITIATIVE (EPI) 12
Large company (41 and more employees)
11 23%
I do not know / difficult to answer 4 8%
Total 194 100
HEAD OFFICE AND BRANCHES
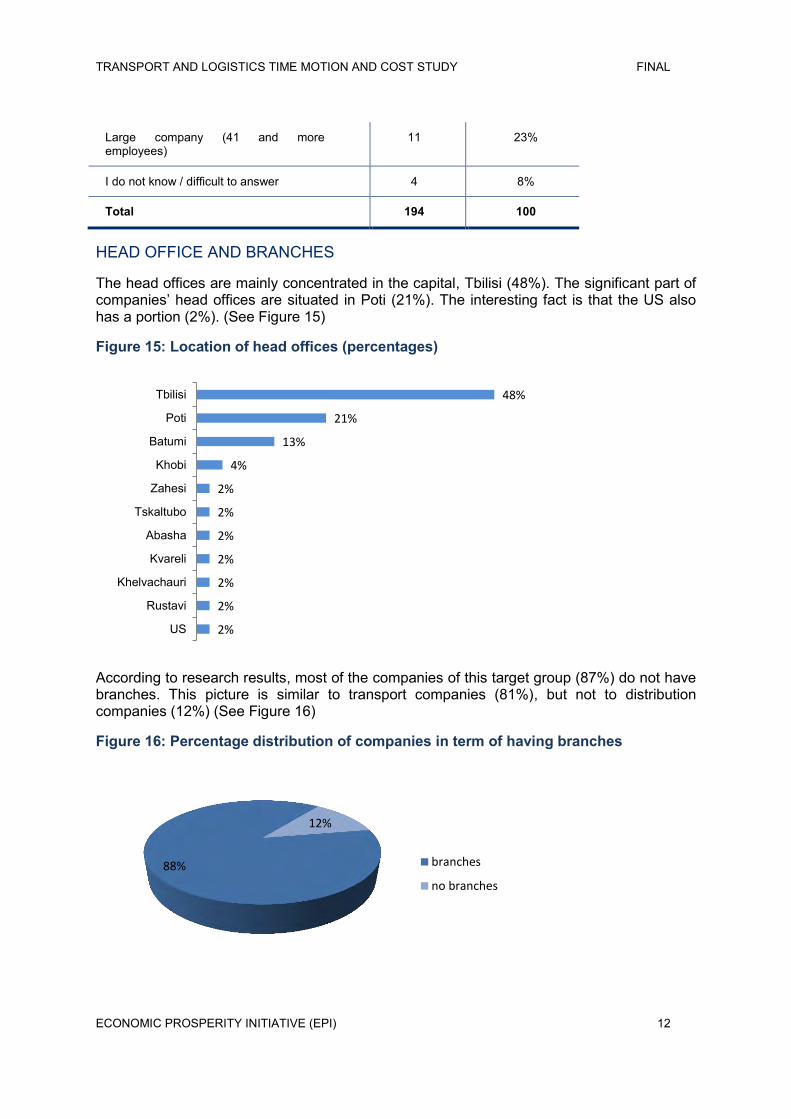
The head offices are mainly concentrated in the capital, Tbilisi (48%). The significant part of companies’ head offices are situated in Poti (21%). The interesting fact is that the US also has a portion (2%). (See Figure 15)
Figure 15: Location of head offices (percentages)
According to research results, most of the companies of this target group (87%) do not have branches. This picture is similar to transport companies (81%), but not to distribution companies (12%) (See Figure 16)
Figure 16: Percentage distribution of companies in term of having branches
2%
2%
2%
2%
2%
2%
2%
4%
13%
21%
48%
US
Rustavi
Khelvachauri
Kvareli
Abasha
Tskaltubo
Zahesi
Khobi
Batumi
Poti
Tbilisi
88%
12%
branches
no branches
TRANSPORT AND LOGISTICS TIME MOTION AND COST STUDY FINAL
ECONOMIC PROSPERITY INITIATIVE (EPI) 13
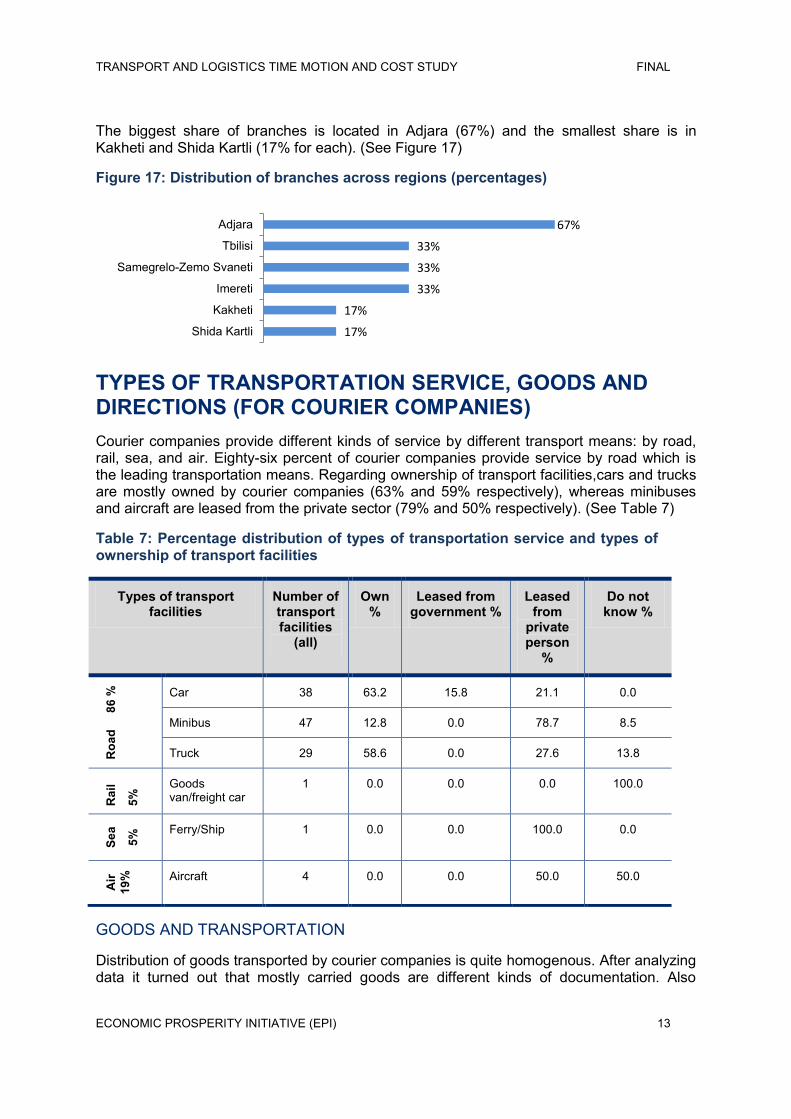
The biggest share of branches is located in Adjara (67%) and the smallest share is in Kakheti and Shida Kartli (17% for each). (See Figure 17)
Figure 17: Distribution of branches across regions (percentages)
TYPES OF TRANSPORTATION SERVICE, GOODS AND DIRECTIONS (FOR COURIER COMPANIES) Courier companies provide different kinds of service by different transport means: by road, rail, sea, and air. Eighty-six percent of courier companies provide service by road which is the leading transportation means. Regarding ownership of transport facilities,cars and trucks are mostly owned by courier companies (63% and 59% respectively), whereas minibuses and aircraft are leased from the private sector (79% and 50% respectively). (See Table 7)
Table 7: Percentage distribution of types of transportation service and types of ownership of transport facilities
Types of transport facilities
Number of transport facilities
(all)
Own %
Leased from government %
Leased from
private person
%
Do not know %
Roa
d
86
%
Car 38 63.2 15.8 21.1 0.0
Minibus 47 12.8 0.0 78.7 8.5
Truck 29 58.6 0.0 27.6 13.8
Rai
l 5%
Goods van/freight car
1 0.0 0.0 0.0 100.0
Sea
5% Ferry/Ship 1 0.0 0.0 100.0 0.0
Air
19
%
Aircraft 4 0.0 0.0 50.0 50.0
GOODS AND TRANSPORTATION
Distribution of goods transported by courier companies is quite homogenous. After analyzing data it turned out that mostly carried goods are different kinds of documentation. Also
17%
17%
33%
33%
33%
67%
Shida Kartli
Kakheti
Imereti
Samegrelo-Zemo Svaneti
Tbilisi
Adjara

TRANSPORT AND LOGISTICS TIME MOTION AND COST STUDY FINAL
ECONOMIC PROSPERITY INITIATIVE (EPI) 14
significant shares hold household technique (43%) and mail-type parcels (38%). (See Figure 18)
Figure 18: Percentage distribution of goods carried by courier companies
Courier companies transport goods to various final destinations. Most frequently they carry goods within Georgia (62%). (See Figure 19)
Figure 19: Percentage distribution Transportation directions
After considering this portion (Georgian territory) in more detail, it is seen that domestic region’s shares are more or less equally distributed. The biggest share has Tbilisi and Imereti (76% each) and the smallest share has three regions: Racha-Lechkhumi and Kvemo Svaneti, Kvemo Kartli, and Samtskhe-Javakheti (29% each). (See Figure 20)
5%
5%
5%
5%
14%
19%
24%
38%
43%
57%
Art pieces
Pharmaceuticals/Drugs
Transformer
Firewood
Furniture
Everyday goods (vessel, hygienic…
Food products
Mail-type parcels
Household technique
Documentation (Letters etc)
62% 19%
19% Only within Georgia
Within Georgia andabroad
Only abroad

TRANSPORT AND LOGISTICS TIME MOTION AND COST STUDY FINAL
ECONOMIC PROSPERITY INITIATIVE (EPI) 15
Figure 20: Percentage distribution across regions of Georgia
PERFORMANCE METRICS OF WAREHOUSING AND STEVEDORING COMPANIES Cargo handling companies provide different kinds of services. These services can include loading/unloading, packing, preparing juridical documents, and warehousing. Some companies provide a single type of service and some several types of services simultaneously. About 90% of cargo-handling companies provide warehousing services and only 23% provide packing services. Half of the questioned companies do not have diverse profiles and concentrate only one specific service (see Figure 21).
Figure 21: Percentage distribution of companies in terms of transportation service types provided by them
29%
29%
29%
35%
35%
47%
53%
59%
65%
76%
76%
Samtskhe-Javakheti
Kvemo Kartli
Racha-Lechkhumi and Kvemo Svaneti
Guria
Mtskheta-Mtianeti
Shida Kartli
Kakheti
Samegrelo-Zemo Svaneti
Adjara
Imereti
Tbilisi
23%
27%
50%
90%
Packing
Preparing the juridicaldocuments
Load/unloading
Warehousing

TRANSPORT AND LOGISTICS TIME MOTION AND COST STUDY FINAL
ECONOMIC PROSPERITY INITIATIVE (EPI) 16
Stevedoring companies are mainly operating in the biggest ports and airports of Tbilisi. The survey showed that more than half (56%) of the companies are operating in Poti sea port, 38% are concentrated in Batumi sea port, and 31% are at Tbilisi airport. (See Figure 22)
Figure 22: Distribution of performance place of stevedoring companies
GOODS/FREIGHT SERVED BY PORT/AIRPORT STEVEDORING COMPANIES The survey results revealed that the most frequently served (loaded/unloaded, packed) type of good is food products which were named by 88% of target group companies. Along with food products, the important shares are agriculture products and construction material at 56% each. (See Figure 23)
Figure 23: Percentage distribution of Goods/freight served by port/airport stevedoring companies
17%
10%
23%
50%
four typers
three types
two types
one type
31%
38%
56%
Tbilisi airport
Batumi port
Poti port

TRANSPORT AND LOGISTICS TIME MOTION AND COST STUDY FINAL
ECONOMIC PROSPERITY INITIATIVE (EPI) 17
LOADING/UNLOADING TIME, COST, AND TONNAGE The process of loading/unloading is connected to specific time and financial costs. These parameters differ across types of transport facilities to/from which the freight is loaded/ unloaded and across types of freight. The survey results identified the average measures of these parameters. For example, loading one truck requires two hours, and loading 1 ton of bulk cargo costs USD 9. (See Table 9)
Table 8: Average measures of load/unload time and cost
Type of transport facility
Load/Unload time for 1 unit
(hour)
Type of cargo Load/Unload price for 1 ton
(USD)
Truck 2 Liquid cargo 13
Goods van/Freight car 1 Bulk cargo (grains, metal scrap and other)
9
Ship 22 General cargo (in bags, in boxes, in barrels and other)
12
Aircraft 2
The interesting measure of a company’s capability is how much goods/freight they can serve (load/unload, pack) during a certain period of time. The survey results are shown in Table 9.
Table 9: Average amount of cargo served (load/unload, pack) during a specified period of time
Amount of cargo (tons)*
Served during last month (May) 23369
6%
6%
6%
19%
25%
25%
31%
31%
44%
44%
44%
56%
56%
88%
Scrap Coal
Fertilizer Oil
Automobiles Logging
Everyday goods (vessel, hygienic items… Wine
Furniture Household technique
Alcohol drinks (cognac, vodka etc) Construction materials
Agricultural products (fruits, vegetables) Food products
TRANSPORT AND LOGISTICS TIME MOTION AND COST STUDY FINAL
ECONOMIC PROSPERITY INITIATIVE (EPI) 18
Served during last year (2010) 318460
Potential to serve during one year 423470
*These numbers do not include the data for Poti sea port.
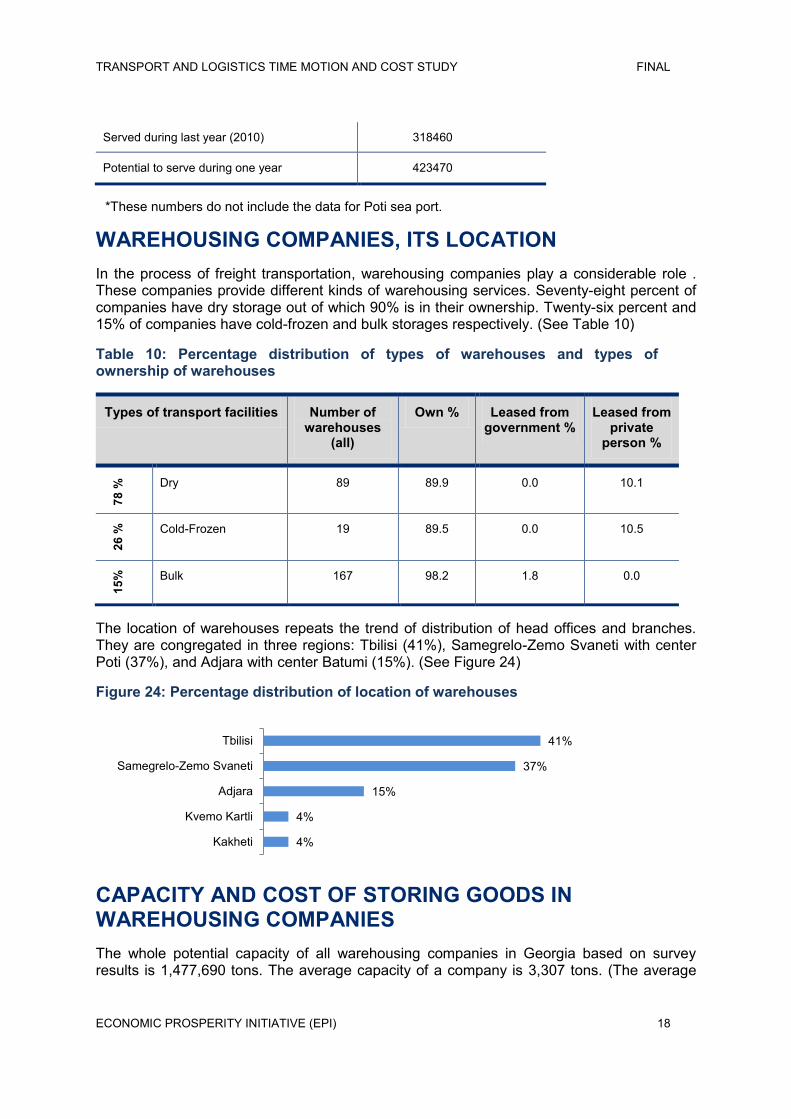
WAREHOUSING COMPANIES, ITS LOCATION In the process of freight transportation, warehousing companies play a considerable role . These companies provide different kinds of warehousing services. Seventy-eight percent of companies have dry storage out of which 90% is in their ownership. Twenty-six percent and 15% of companies have cold-frozen and bulk storages respectively. (See Table 10)
Table 10: Percentage distribution of types of warehouses and types of ownership of warehouses
Types of transport facilities Number of warehouses
(all)
Own % Leased from government %
Leased from private
person %
78 %
Dry 89 89.9 0.0 10.1
26 %
Cold-Frozen 19 89.5 0.0 10.5
15%
Bulk 167 98.2 1.8 0.0
The location of warehouses repeats the trend of distribution of head offices and branches. They are congregated in three regions: Tbilisi (41%), Samegrelo-Zemo Svaneti with center Poti (37%), and Adjara with center Batumi (15%). (See Figure 24)
Figure 24: Percentage distribution of location of warehouses
CAPACITY AND COST OF STORING GOODS IN WAREHOUSING COMPANIES The whole potential capacity of all warehousing companies in Georgia based on survey results is 1,477,690 tons. The average capacity of a company is 3,307 tons. (The average
4%
4%
15%
37%
41%
Kakheti
Kvemo Kartli
Adjara
Samegrelo-Zemo Svaneti
Tbilisi

TRANSPORT AND LOGISTICS TIME MOTION AND COST STUDY FINAL
ECONOMIC PROSPERITY INITIATIVE (EPI) 19
number does not include the data for Poti sea port). The picture of average size of warehouses is as follows:
Type of warehouse Average Size
Dry 953 m2
Cold-Frozen 140 m2
Bulk 1422 m3
Type of warehouses Average price USD
Dry 2.3 (1ton/per day)
Cold-frozen 6.7 (1ton/per day)
Bulk 0.4 (1m3/per day)
The interesting fact is that the storage price of goods in cold-frozen warehouses is approximately three times higher than the storage price of dry warehouses.
DISTRIBUTION COMPANIES - OPERATING TIME, HEAD OFFICES AND BRANCHES, AND NUMBER OF EMPLOYEES The analysis of distribution companies includes general parameters such as the number of employees, location of head offices, and distribution of branches countrywide; secondly the specific parameters characterizing the performance of companies like types of transport facilities, types of goods served, types of warehouses and finally testing the level of satisfaction of distribution companies.
The picture of age of distribution companies is similar to transport, warehousing, courier, and port-handling companies. Namely the share of companies who are operating on the market five or more years is prevalent and includes 65% of distribution companies. The smallest portion (2%) includes young companies who fall into the interval 0 – 1 years. (See Figure 25)
Figure 25: Percentage distribution of operating time (on the market) intervals
2%
14%
19%
65%
0 - to 1 years
from 1 - to 3 years
from 3 - to 5 years
5 + years

TRANSPORT AND LOGISTICS TIME MOTION AND COST STUDY FINAL
ECONOMIC PROSPERITY INITIATIVE (EPI) 20
The picture of employees in the distribution companies is quite diverse. Fifty-eight percent of questioned companies are large companies and 12% are small companies. (See Table 11)
Table 11: Number of employees of distribution companies
Frequency Percent
Small company (1-10 employees)
15 12%
Middle size company (11 - 40 employees)
35 30%
Large company (41 and more employees)
75 58%
Total 128 100 %
The average number of employees in the distribution companies is 98.
HEAD OFFICE AND BRANCHES
As mentioned above, during the study 128 distribution companies were interviewed. Out of 128 companies, an absolute majority of 127 companies (99%) have their head office in Tbilisi. Only one company has a head office in Kutaisi.
It is worth noting that a significant portion of distribution companies (88%) have branches apart from head offices. (See Figure 26)
Figure 26: Percentage distribution of companies in term of having branches
Unlike the distrubtion of head offices, the distribution of branches is rather diverse. The branches are located in every region of Georgia and even abroad. The leading regions are Tbilisi, Imereti, and Adjara with the shares 57%, 53%, and 49% respectively. As it was expected Armenia and Azerbaijan received the smallest shares with 2% each. (See Figure 27)
Figure 27: Percentage distribution of branches
88%
12%
branches
no branches

TRANSPORT AND LOGISTICS TIME MOTION AND COST STUDY FINAL
ECONOMIC PROSPERITY INITIATIVE (EPI) 21
PERFORMANCE METRICS OF THE DISTRIBUTION COMPANIES On the basis of survey data it can be concluded that almost every distribution company (97%) provides service with cars, minibuses, or trucks. Approximately 74% of these transport facilities are in ownership of distribution companies. Others are leased from third parties.
A small portion of companies use railway, sea, or air during distribution, at 11%, 12% and 7% respectively. Unlike road transport facilities, the majority of these transportation means are leased from the private sector (77%) (See Table 12)
Table 12: Percentage allocation of types of distribution service and types of ownership of distribution facilities
Types of transport facilities
% Number of transport facilities
(all)
Own %
Leased from government
%
Leased from
private person
%
Do not know
%
Roa
d
97
%
Car 32 302 82.5 0.0 16.2 1.3
Minibus 40 383 83.3 1.3 14.9 0.5
Truck 28 260 51.9 1.2 45.0 1.9
Rai
l
11%
Goods van/freight car
100 18 16.7 5.6 55.6 22.2
Sea
12%
Ferry/
Ship
100 20 5.0 5.0 85.0 5.0
2%
2%
4%
6%
10%
10%
10%
16%
20%
27%
49%
53%
57%
Armenia Azerbaijan
Racha-Lechkhumi and Kvemo Svaneti Mtskheta-Mtianeti
Guria Kvemo Kartli
Samtskhe-Javakheti Shida Kartli
Kakheti Samegrelo-Zemo Svaneti
Adjara Imereti Tbilisi

TRANSPORT AND LOGISTICS TIME MOTION AND COST STUDY FINAL
ECONOMIC PROSPERITY INITIATIVE (EPI) 22
Air
7
%
Aircraft 100 9 0.0 0.0 88.9 11.1
DIVISION OF COMPANIES IN TERMS OF PRODUCTION SOURCE
The survey results show that distribution companies have different sources of production. Mostly the companies distribute production supplied by transport companies (75%) and only a small part (24%) distribute production from their own manufacturing. (See Figure 28)
Figure 28: Division of companies in terms of production source
GOODS SERVED
According to survey results the four most frequently distributed goods were identified:
Food products (23%)
Household technique (14%)
Everyday goods (clothes, vessel, hygienic items etc) (11%)
Medicines/Medical materials (11%)
Figure 29: Percentage distribution of goods served
24%
34%
75%
Production from own manufacture
Production from other manufacture
Production supplied by transportcompanies
4% 1%
2% 2% 2% 2% 2% 2%
3% 3% 3% 3% 3%
5% 7%
11% 11%
14% 23%
other Hunting cartridges
Natural Gas Juices / Lemonade
Wine Books
Perfumes / Cosmetics / Facial, body… Furniture
Oil Press
Computer hardware Agricultural products (fruits, vegetables)
Medical technologies/equipment Construction materials
Alcohol drinks (cognac, vodka etc) Medicines /Medical materials
Everyday goods (clothes, vessel,… Household technique
Food products
TRANSPORT AND LOGISTICS TIME MOTION AND COST STUDY FINAL
ECONOMIC PROSPERITY INITIATIVE (EPI) 23
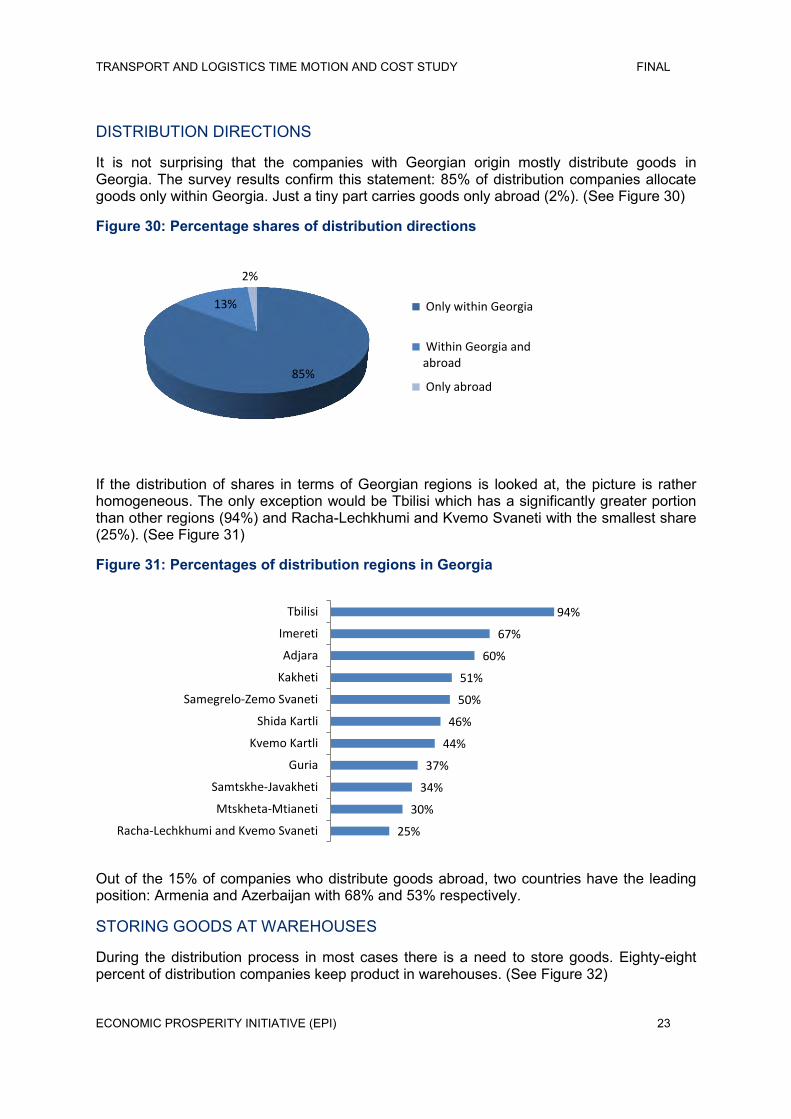
DISTRIBUTION DIRECTIONS
It is not surprising that the companies with Georgian origin mostly distribute goods in Georgia. The survey results confirm this statement: 85% of distribution companies allocate goods only within Georgia. Just a tiny part carries goods only abroad (2%). (See Figure 30)
Figure 30: Percentage shares of distribution directions
If the distribution of shares in terms of Georgian regions is looked at, the picture is rather homogeneous. The only exception would be Tbilisi which has a significantly greater portion than other regions (94%) and Racha-Lechkhumi and Kvemo Svaneti with the smallest share (25%). (See Figure 31)
Figure 31: Percentages of distribution regions in Georgia
Out of the 15% of companies who distribute goods abroad, two countries have the leading position: Armenia and Azerbaijan with 68% and 53% respectively.
STORING GOODS AT WAREHOUSES
During the distribution process in most cases there is a need to store goods. Eighty-eight percent of distribution companies keep product in warehouses. (See Figure 32)
85%
13%
2%
Only within Georgia
Within Georgia andabroad
Only abroad
25%
30%
34%
37%
44%
46%
50%
51%
60%
67%
94%
Racha-Lechkhumi and Kvemo Svaneti
Mtskheta-Mtianeti
Samtskhe-Javakheti
Guria
Kvemo Kartli
Shida Kartli
Samegrelo-Zemo Svaneti
Kakheti
Adjara
Imereti
Tbilisi

TRANSPORT AND LOGISTICS TIME MOTION AND COST STUDY FINAL
ECONOMIC PROSPERITY INITIATIVE (EPI) 24
Figure 32: Shares of Distribution companies who store goods at warehouses and who do not
TYPES OF WAREHOUSES
Distribution companies, depending on the type of goods, use different kind of warehouses. These are dry, cold-frozen, and bulk warehouses. Most of the companies use dry warehouses (92%) and only a small part use cold-frozen (10%) and bulk (7%) warehouses. The majority of these warehouses are owned by companies (78%) and the rest are leased from third parties. (See Table 13)
Table 13: Percentage distribution of types of warehouses and types of ownership of warehouses
Types of transport facilities
Number of warehouses
(all)
Own %
Leased from government %
Leased from
private person
%
Do not know %
92%
Dry 231 67.5 3.0 29.0 0.4
10%
Cold-Frozen 22 77.3 0.0 22.7 0.0
7 %
Bulk 122 98.4 0.8 0.0 0.8
TONNAGE OF DISTRIBUTION COMPANIES
An interesting indicator of a company’s size is tonnage of the company. In this case this would be the amount of goods that the company can store in every warehouse together. Forty percent of the companies that have warehouses had no answer to how much goods they could store. Seventeen percent have capacity of up to 50 tons and 13% from 51 to 100 tons. The percentages for the other capacities are distributed more or less equally. The average tonnage among the companies that have warehouses is 1,941 tons. (See Figure 33)
Figure 33: Percentage distribution of companies’ tonnage
88%
12% Store goods inwarehouses
Do not storegoods inwarehouses
TRANSPORT AND LOGISTICS TIME MOTION AND COST STUDY FINAL
ECONOMIC PROSPERITY INITIATIVE (EPI) 25
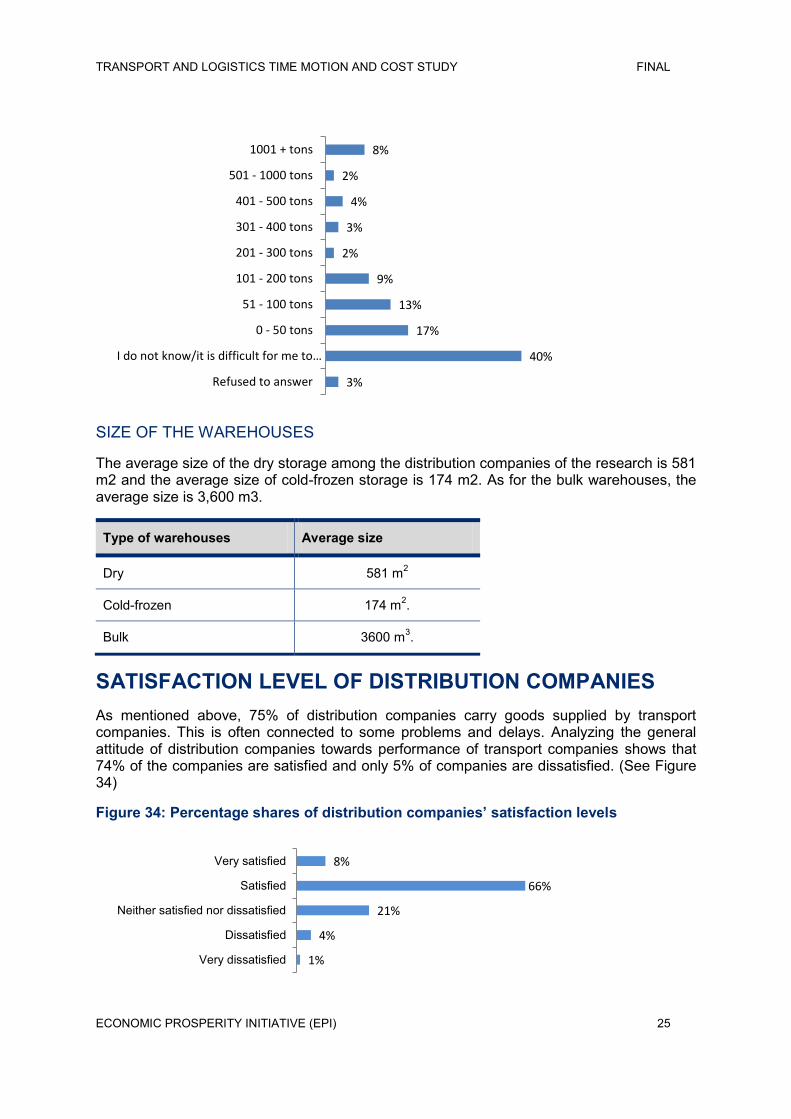
SIZE OF THE WAREHOUSES
The average size of the dry storage among the distribution companies of the research is 581 m2 and the average size of cold-frozen storage is 174 m2. As for the bulk warehouses, the average size is 3,600 m3.
Type of warehouses Average size
Dry 581 m2
Cold-frozen 174 m2.
Bulk 3600 m3.
SATISFACTION LEVEL OF DISTRIBUTION COMPANIES As mentioned above, 75% of distribution companies carry goods supplied by transport companies. This is often connected to some problems and delays. Analyzing the general attitude of distribution companies towards performance of transport companies shows that 74% of the companies are satisfied and only 5% of companies are dissatisfied. (See Figure 34)
Figure 34: Percentage shares of distribution companies’ satisfaction levels
3%
40%
17%
13%
9%
2%
3%
4%
2%
8%
Refused to answer
I do not know/it is difficult for me to…
0 - 50 tons
51 - 100 tons
101 - 200 tons
201 - 300 tons
301 - 400 tons
401 - 500 tons
501 - 1000 tons
1001 + tons
1%
4%
21%
66%
8%
Very dissatisfied
Dissatisfied
Neither satisfied nor dissatisfied
Satisfied
Very satisfied
TRANSPORT AND LOGISTICS TIME MOTION AND COST STUDY FINAL
ECONOMIC PROSPERITY INITIATIVE (EPI) 26
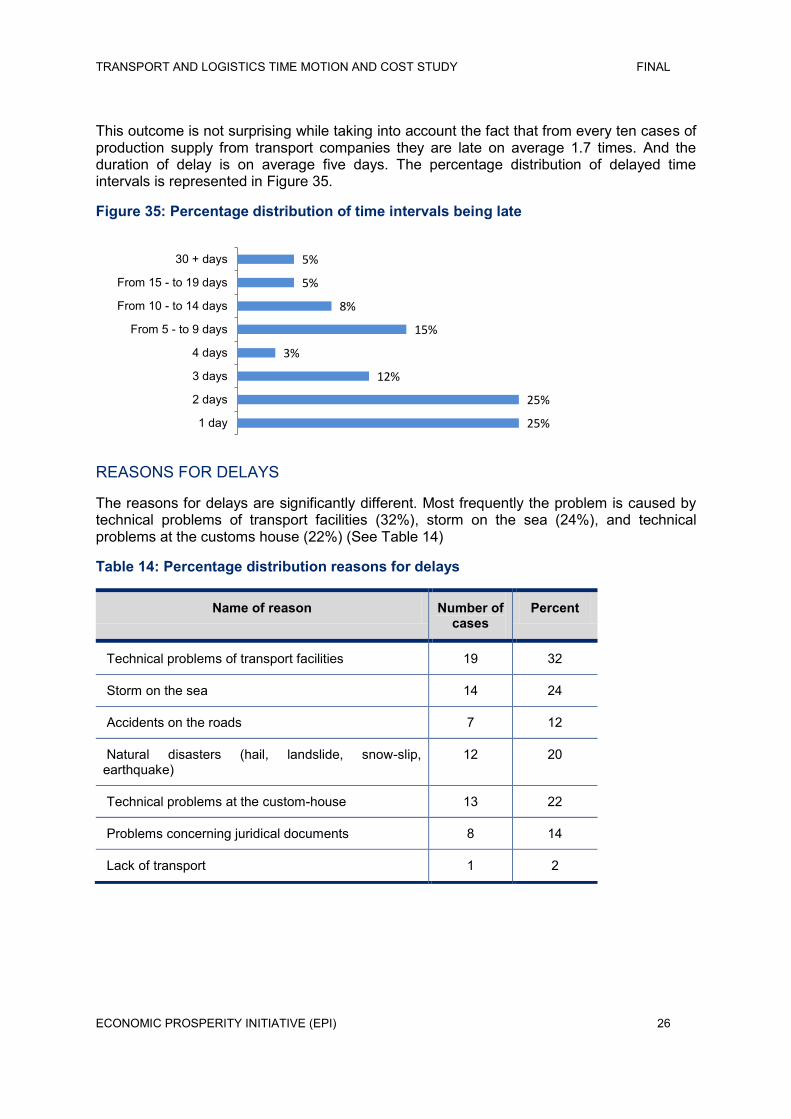
This outcome is not surprising while taking into account the fact that from every ten cases of production supply from transport companies they are late on average 1.7 times. And the duration of delay is on average five days. The percentage distribution of delayed time intervals is represented in Figure 35.
Figure 35: Percentage distribution of time intervals being late
REASONS FOR DELAYS
The reasons for delays are significantly different. Most frequently the problem is caused by technical problems of transport facilities (32%), storm on the sea (24%), and technical problems at the customs house (22%) (See Table 14)
Table 14: Percentage distribution reasons for delays
Name of reason Number of cases
Percent
Technical problems of transport facilities 19 32
Storm on the sea 14 24
Accidents on the roads 7 12
Natural disasters (hail, landslide, snow-slip, earthquake)
12 20
Technical problems at the custom-house 13 22
Problems concerning juridical documents 8 14
Lack of transport 1 2
25%
25%
12%
3%
15%
8%
5%
5%
1 day
2 days
3 days
4 days
From 5 - to 9 days
From 10 - to 14 days
From 15 - to 19 days
30 + days

TRANSPORT AND LOGISTICS TIME MOTION AND COST STUDY FINAL
USAID Economic Prosperity Initiative (EPI) 6 Samgebro St.
Tbilisi, Georgia
Phone: +995 32 43 89 24/25/26
Fax: +995 32 43 89 27