transport and climate change week · change week clean, marketable, smart - enabling governments in...
TRANSCRIPT
Transport and Climate
Change Week
Clean, Marketable, Smart -
Enabling governments in transforming mobility
27th September 2018
Transforming mobility in London:the changing role of city government
John Barry27.10.18
10/2/2018 3
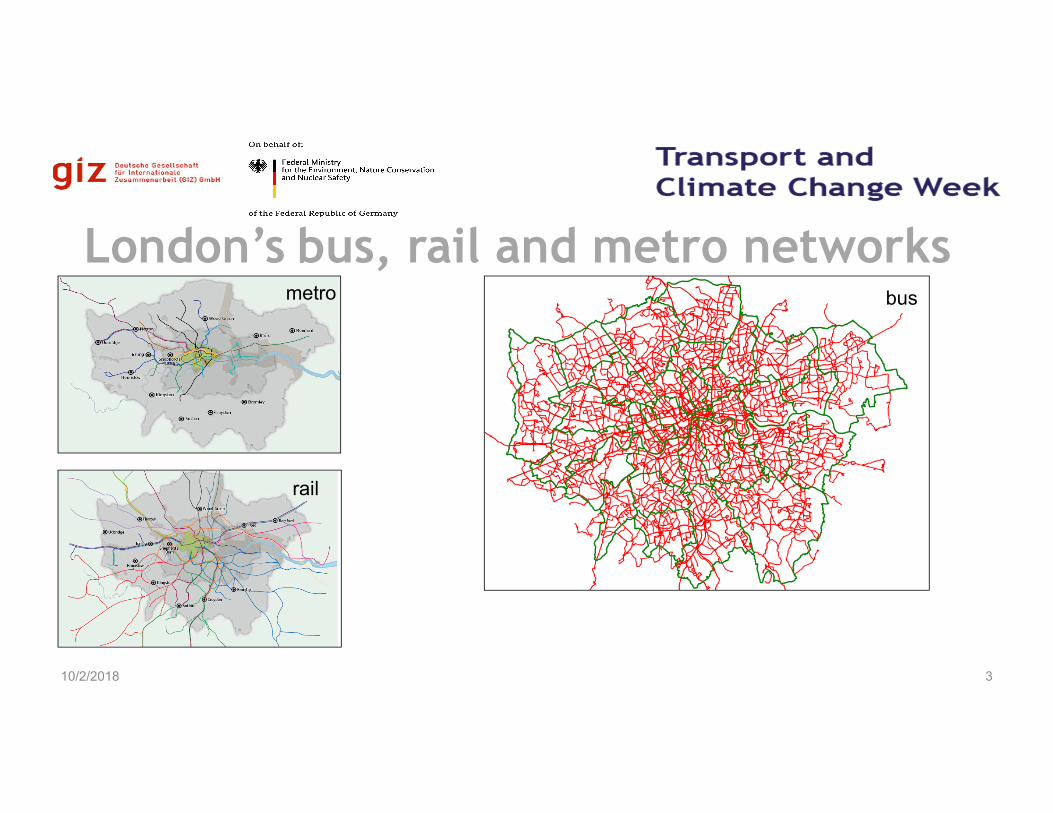
busmetro
rail
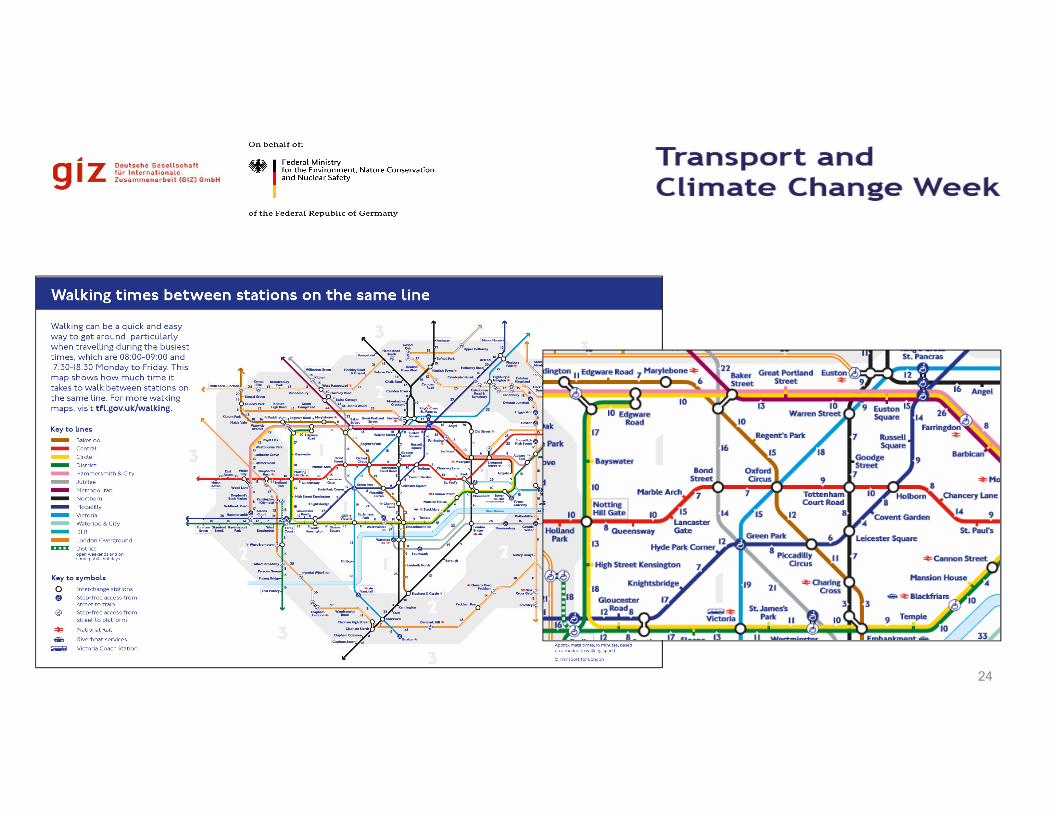
London’s bus, rail and metro networks
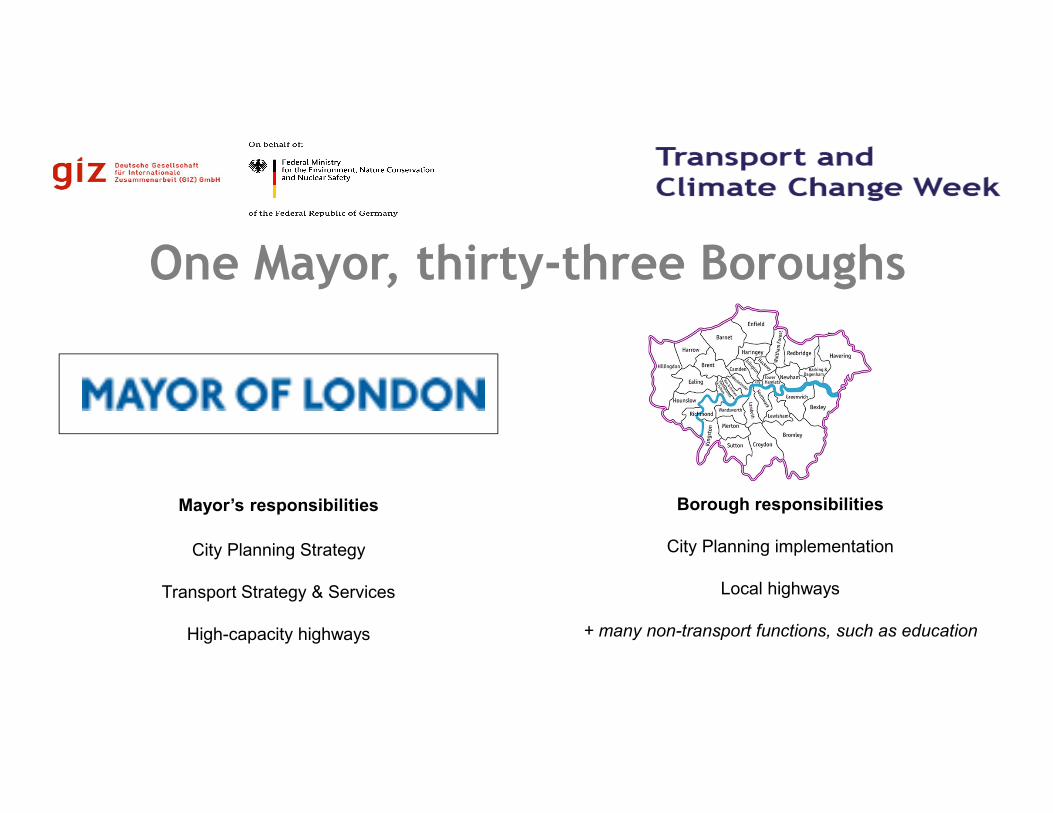
Mayor’s responsibilities
City Planning Strategy
Transport Strategy & Services
High-capacity highways
Borough responsibilities
City Planning implementation
Local highways
+ many non-transport functions, such as education
One Mayor, thirty-three Boroughs
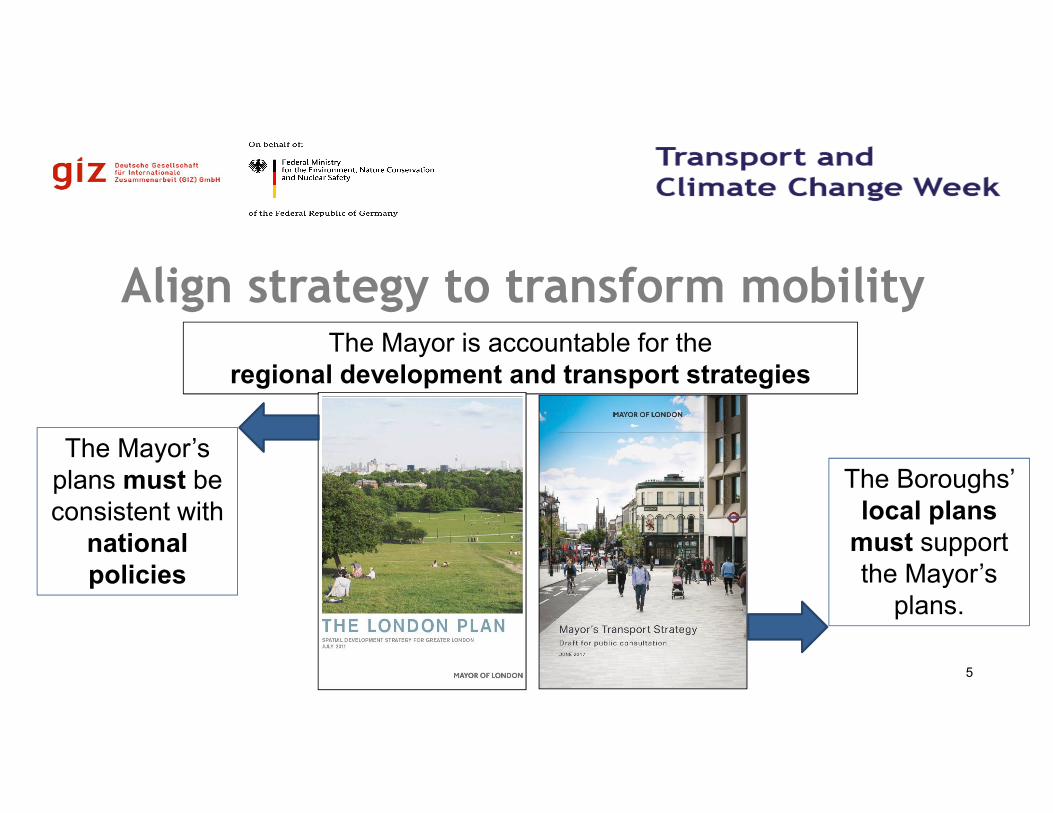
The Mayor is accountable for the
regional development and transport strategies
The Boroughs’
local plans
must support
the Mayor’s
plans.
The Mayor’s
plans must be
consistent with
national
policies
5
Align strategy to transform mobility
6
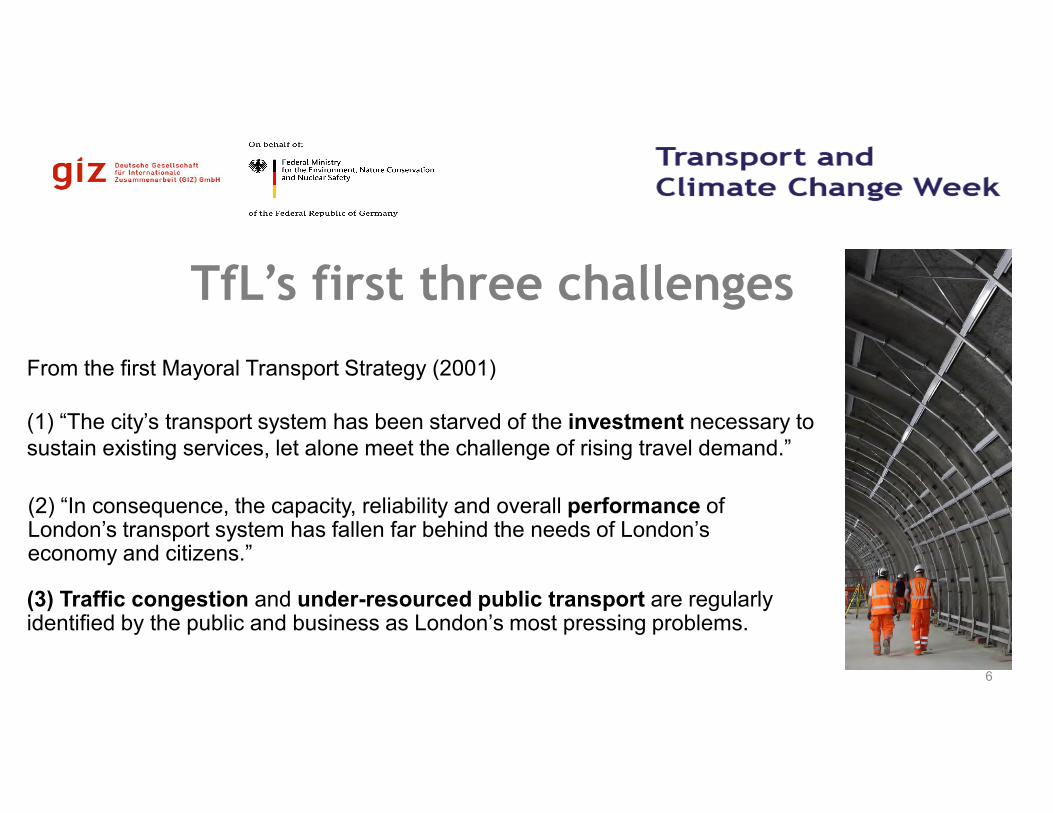
TfL’s first three challenges
(1) “The city’s transport system has been starved of the investment necessary to
sustain existing services, let alone meet the challenge of rising travel demand.”
(2) “In consequence, the capacity, reliability and overall performance of London’s transport system has fallen far behind the needs of London’s economy and citizens.”
(3) Traffic congestion and under-resourced public transport are regularly identified by the public and business as London’s most pressing problems.
From the first Mayoral Transport Strategy (2001)
7
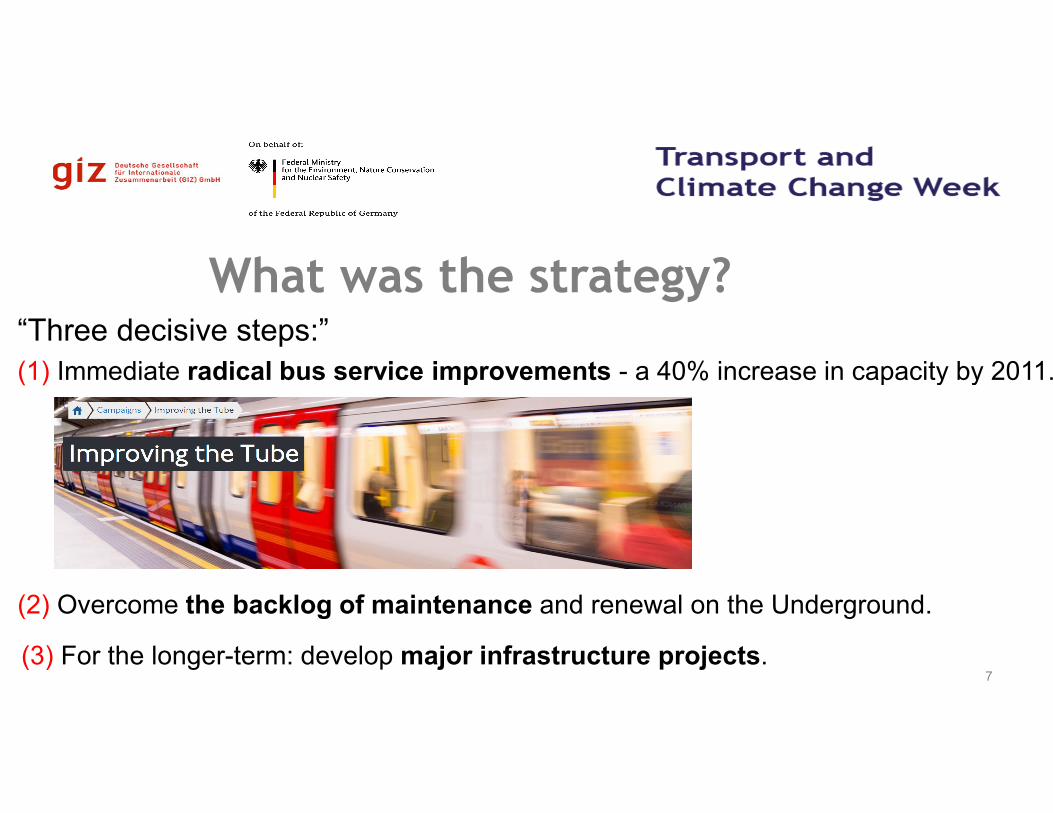
What was the strategy?
(1) Immediate radical bus service improvements - a 40% increase in capacity by 2011.
(2) Overcome the backlog of maintenance and renewal on the Underground.
(3) For the longer-term: develop major infrastructure projects.
“Three decisive steps:”
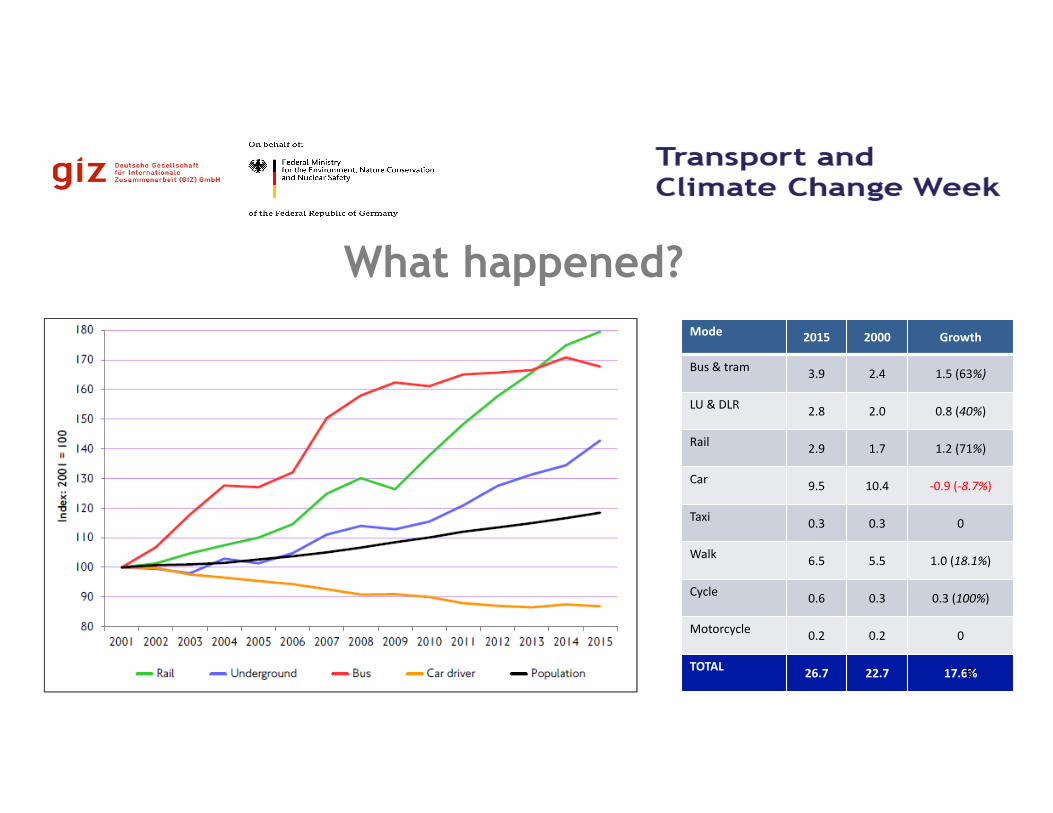
Mode2015 2000 Growth
Bus & tram3.9 2.4 1.5 (63%)
LU & DLR2.8 2.0 0.8 (40%)
Rail2.9 1.7 1.2 (71%)
Car9.5 10.4 -0.9 (-8.7%)
Taxi0.3 0.3 0
Walk6.5 5.5 1.0 (18.1%)
Cycle0.6 0.3 0.3 (100%)
Motorcycle0.2 0.2 0
TOTAL26.7 22.7 17.6%
What happened?
8
10/2/2018 9
Innovative tactics were used …
0,00
50,00
100,00
150,00
200,00
250,00
300,00
350,00
400,00
450,00
500,00
0
1000
2000
3000
4000
5000
6000
7000
8000
9000
10000
1963
1965
1967
1969
1971
1973
1975
1977
1979
1981
1983
1985/8
61987/8
81989/9
01991/9
21993/9
41995/9
61997/9
81999/0
02001/0
22003/0
42005/0
62007/0
82009/1
02011/1
22013/1
42015/1
62017/1
82019/2
02021/2
2
Bus-k
m o
pera
ted p
er
year(
mill
ions)
Passenger-
km
per
year
(mill
ions)
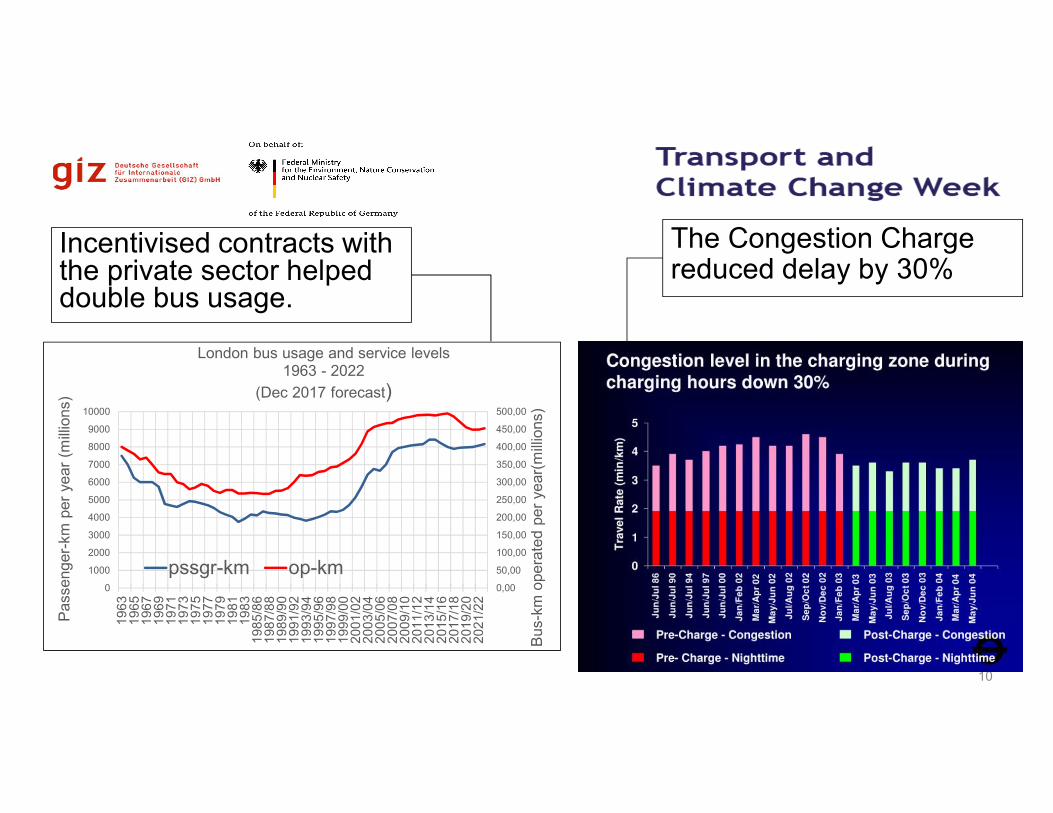
London bus usage and service levels1963 - 2022
(Dec 2017 forecast)
pssgr-km op-km
Incentivised contracts with the private sector helped double bus usage.
10
The Congestion Charge reduced delay by 30%
11
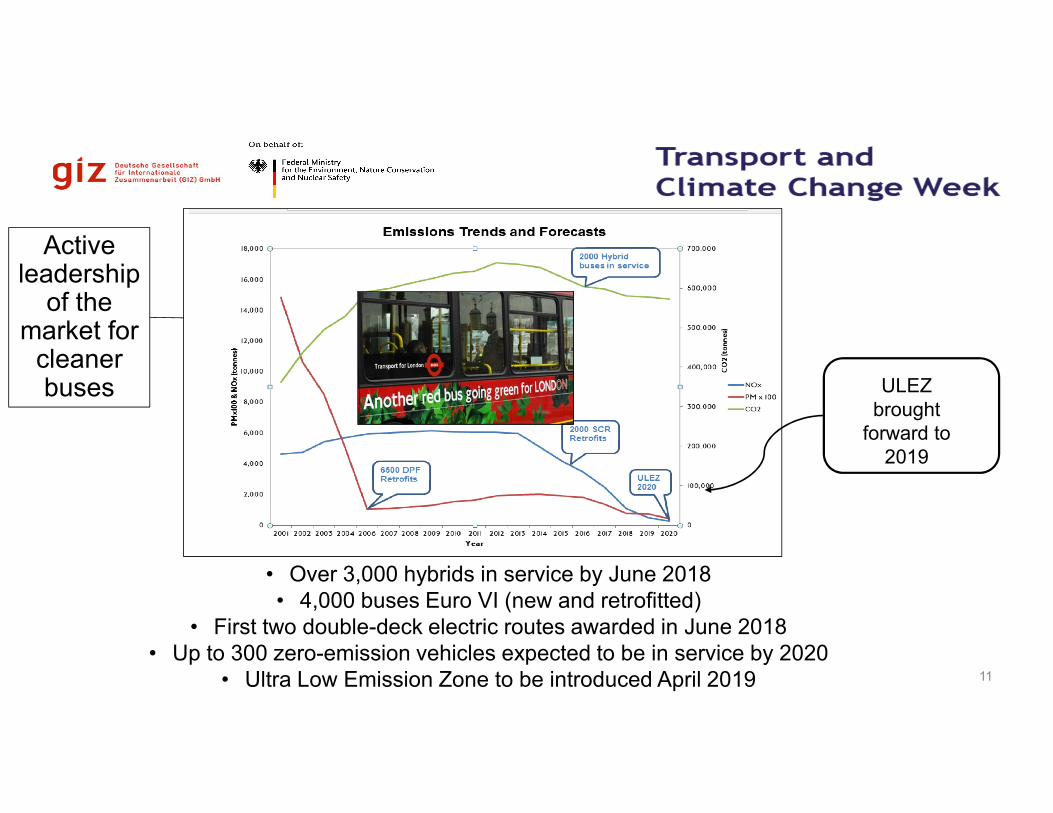
• Over 3,000 hybrids in service by June 2018
• 4,000 buses Euro VI (new and retrofitted)
• First two double-deck electric routes awarded in June 2018
• Up to 300 zero-emission vehicles expected to be in service by 2020
• Ultra Low Emission Zone to be introduced April 2019
ULEZ
brought
forward to
2019
Active leadership
of the market for
cleaner buses
10/2/2018 12
Four factors made it achievable …
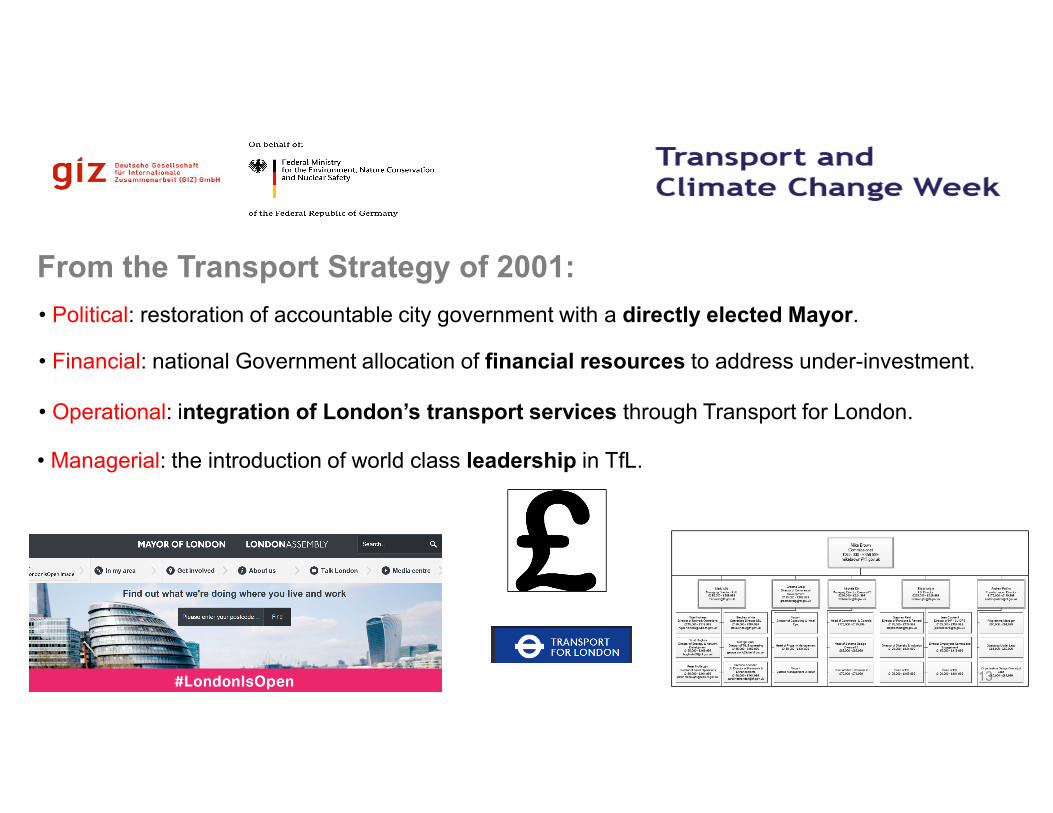
• Financial: national Government allocation of financial resources to address under-investment.
13
From the Transport Strategy of 2001:
• Political: restoration of accountable city government with a directly elected Mayor.
• Operational: integration of London’s transport services through Transport for London.
• Managerial: the introduction of world class leadership in TfL.
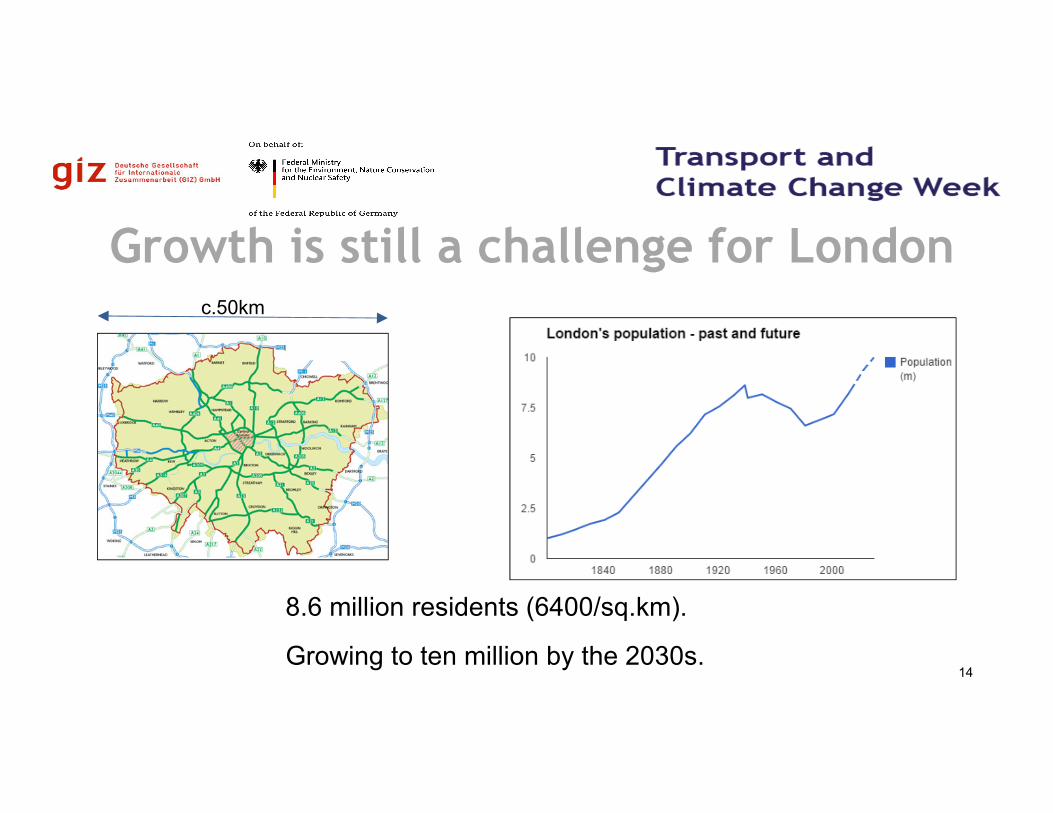
8.6 million residents (6400/sq.km).
Growing to ten million by the 2030s.
c.50km
Growth is still a challenge for London
14
10/2/2018 15
New challenges are emerging …
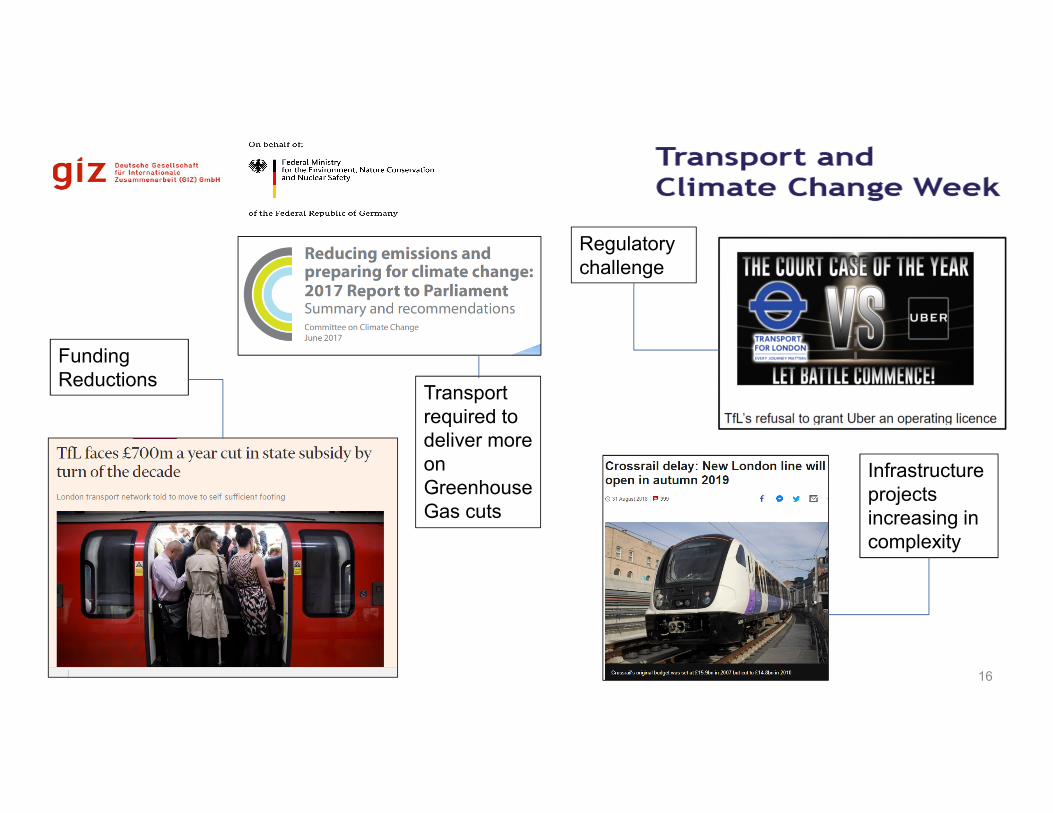
16
Funding
Reductions
Regulatory
challenge
Infrastructure
projects
increasing in
complexity
Transport
required to
deliver more
on
Greenhouse
Gas cuts
10/2/2018 17
How will London meet the new
challenges?
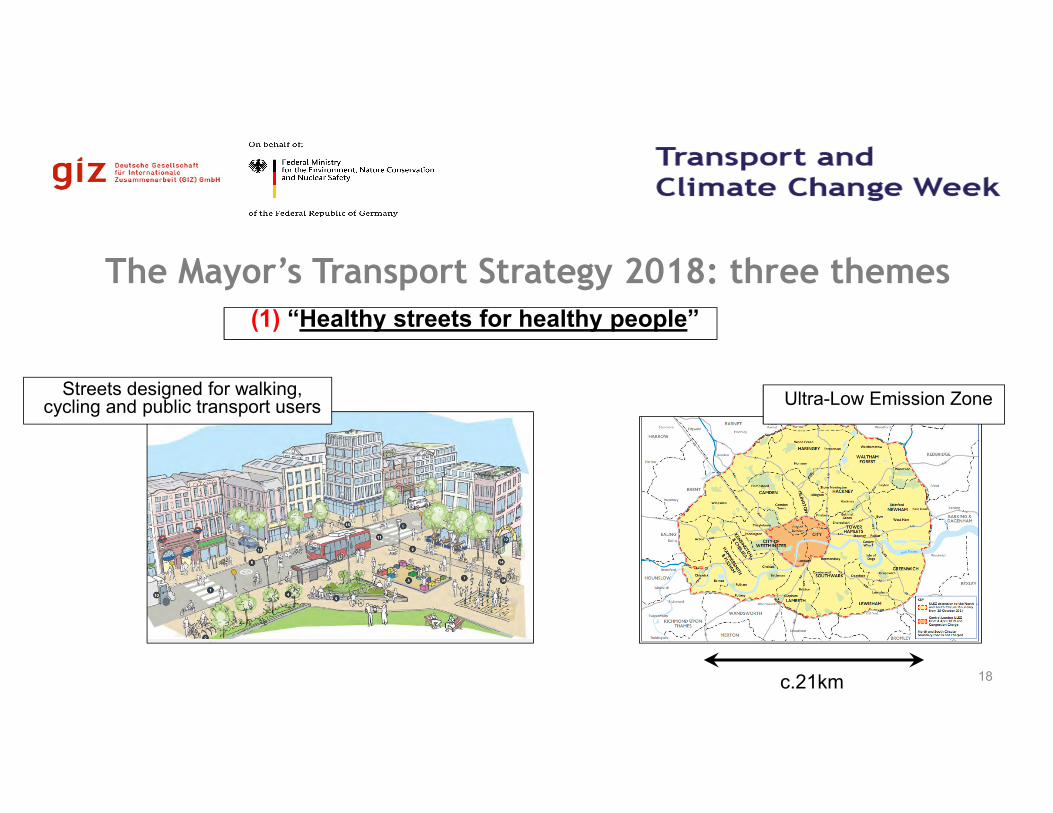
The Mayor’s Transport Strategy 2018: three themes
18
(1) “Healthy streets for healthy people”
Ultra-Low Emission Zone
c.21km
Streets designed for walking, cycling and public transport users
19
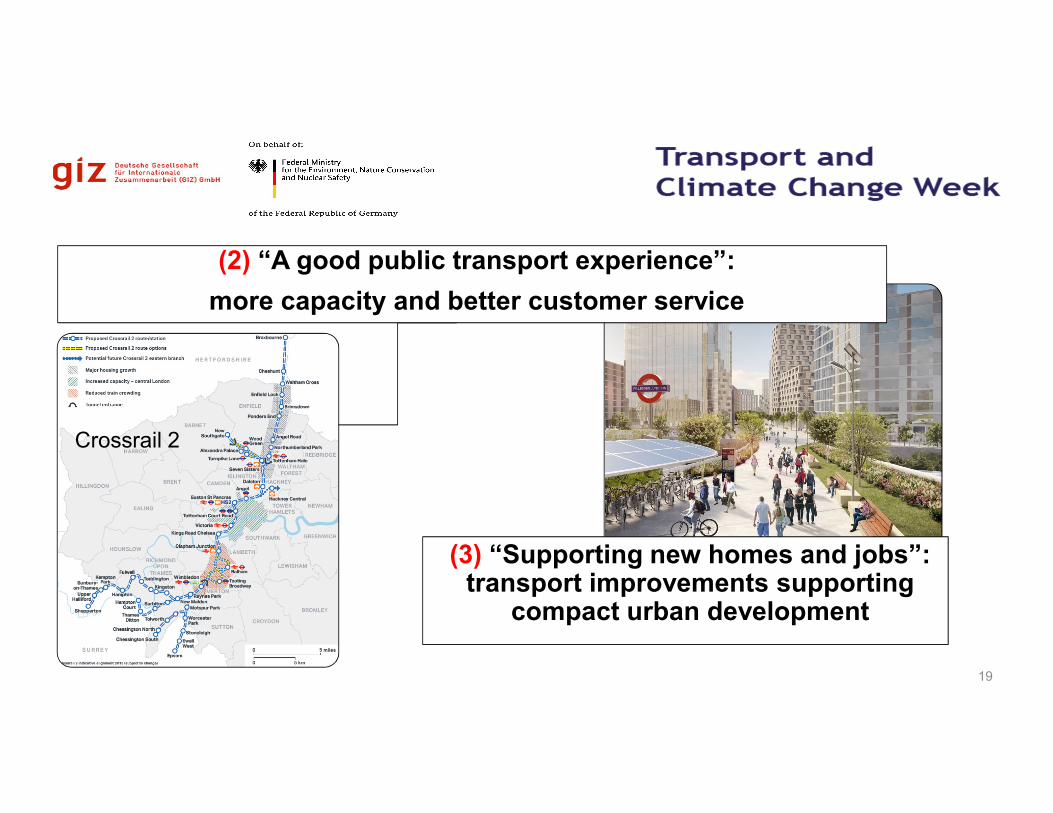
Crossrail 2
(2) “A good public transport experience”:
more capacity and better customer service
(3) “Supporting new homes and jobs”: transport improvements supporting
compact urban development
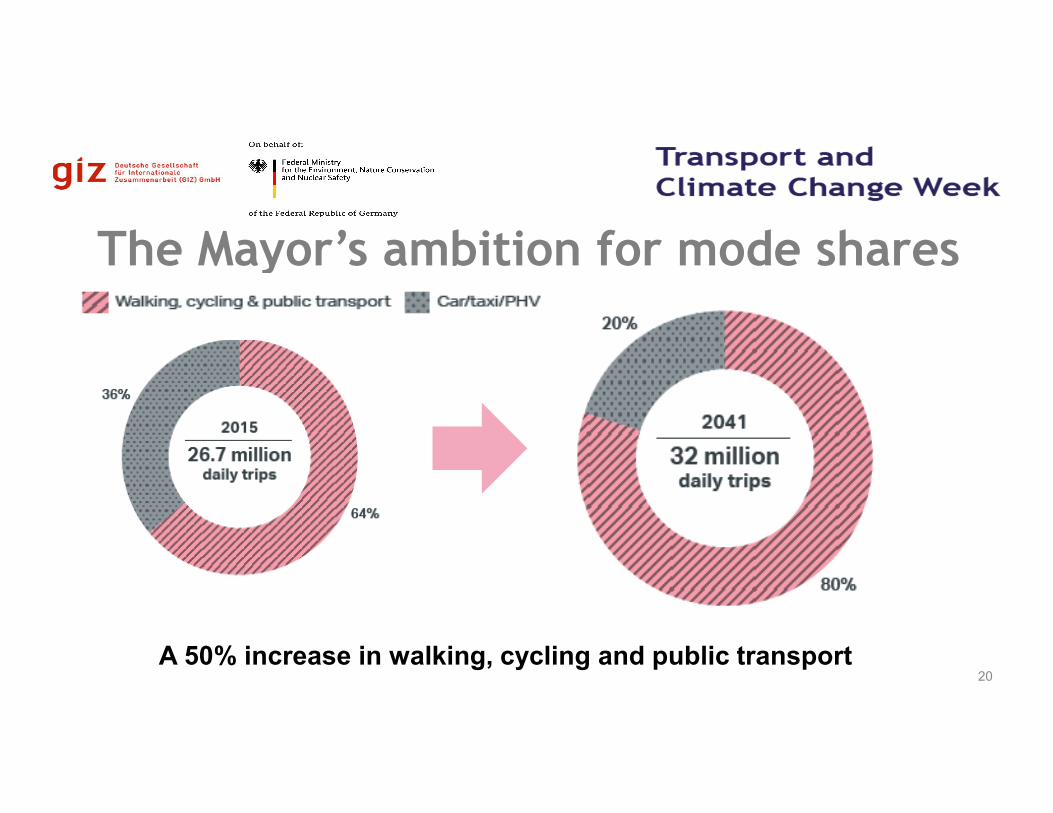
The Mayor’s ambition for mode shares
A 50% increase in walking, cycling and public transport20
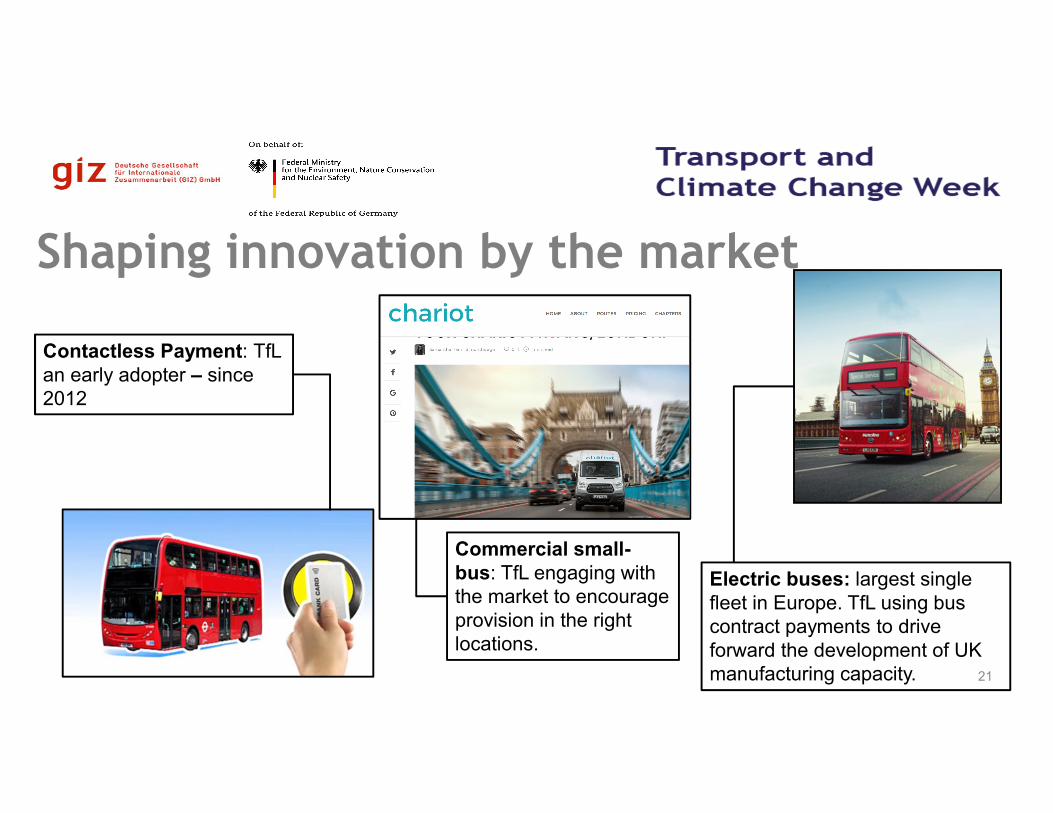
Shaping innovation by the market
21
Electric buses: largest single
fleet in Europe. TfL using bus
contract payments to drive
forward the development of UK
manufacturing capacity.
Contactless Payment: TfL
an early adopter – since
2012
Commercial small-
bus: TfL engaging with
the market to encourage
provision in the right
locations.
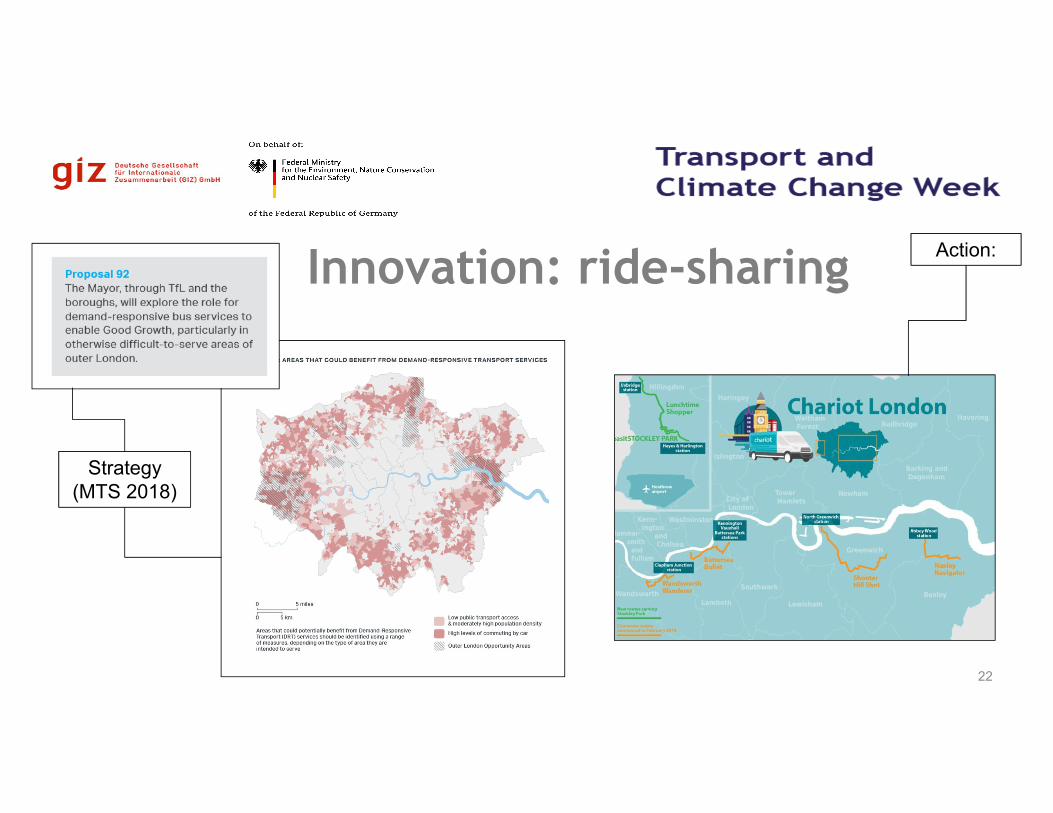
Innovation: ride-sharing
22
Strategy
(MTS 2018)
Action:
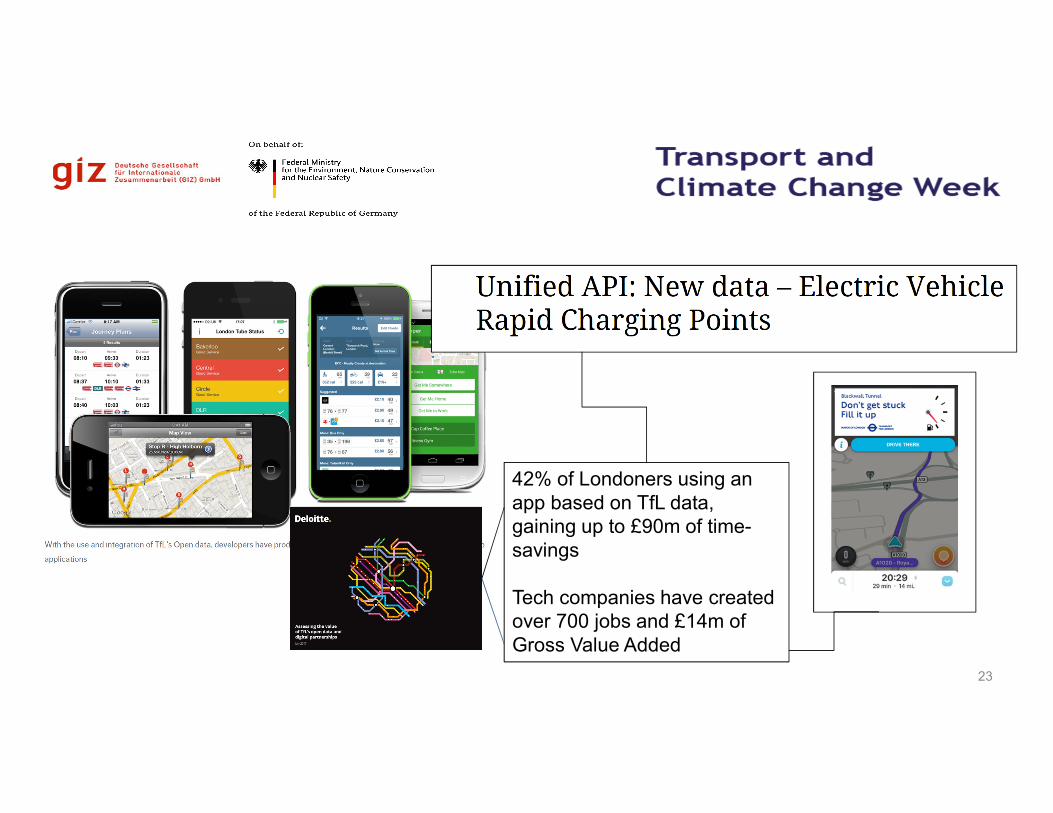
23
42% of Londoners using an
app based on TfL data,
gaining up to £90m of time-
savings
Tech companies have created
over 700 jobs and £14m of
Gross Value Added
24
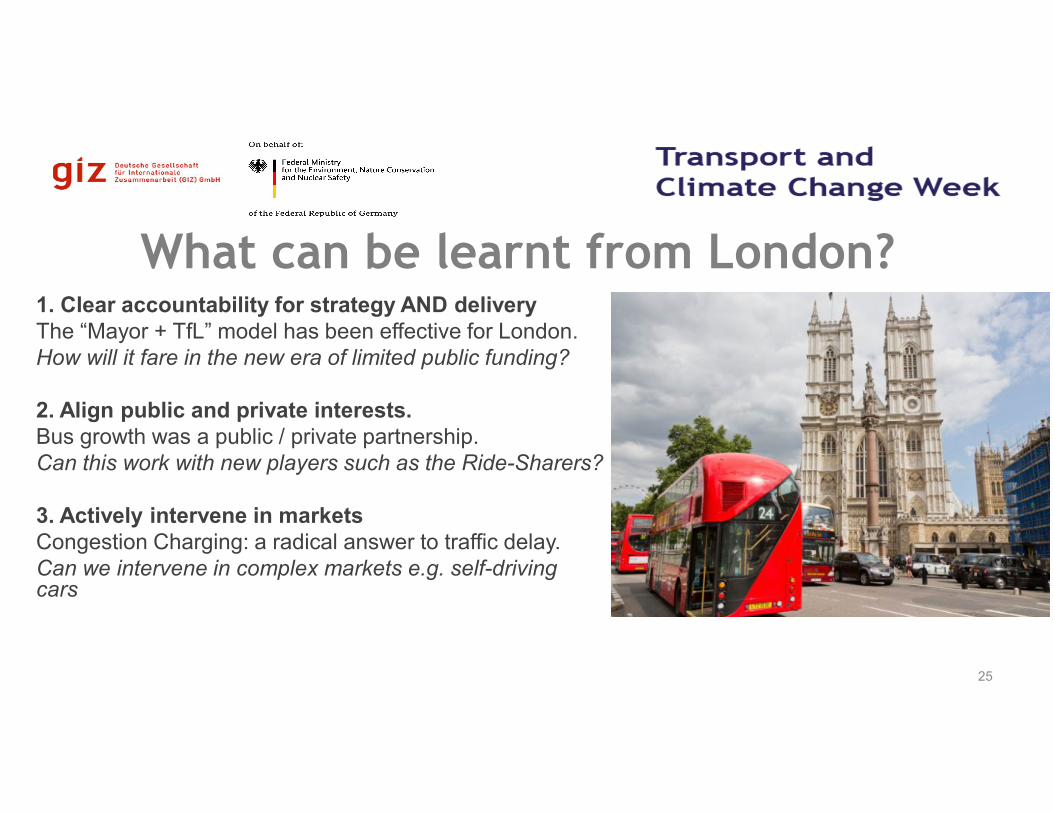
What can be learnt from London?1. Clear accountability for strategy AND delivery
The “Mayor + TfL” model has been effective for London.
How will it fare in the new era of limited public funding?
2. Align public and private interests.
Bus growth was a public / private partnership.
Can this work with new players such as the Ride-Sharers?
3. Actively intervene in markets
Congestion Charging: a radical answer to traffic delay.
Can we intervene in complex markets e.g. self-driving cars
25