transport an affordable transition to sustainable and
TRANSCRIPT

A report by the Energy Technologies Institute
Transport An affordable transition to sustainable and secure energy for light vehicles in the UK

2 Energy Technologies Institute www.eti.co.uk
Acknowledgements
The ETI would like to thank:
• Our industry (BP, Caterpillar, EDF, E.ON, Rolls-Royce, Shell) and UK Government members for their contributions to the report. We would especially like to thank the Department for Transport for their invaluable support in analysing the UK National Travel Survey data.
• The members of our Strategy Advisory Group who have been invaluable in helping to deliver this report, the projects, data and analyses that underpin it – Steve Skippon (Shell), John Rogerson (BP), Sarah Bee (EDF), Joachim Brandt (E.ON), Ian Turner (OLEV) & Robert Evans (Cenex)
• Our project partners (including members EDF, E.ON) that delivered the projects and their findings which underpin this report; including: Aberdeen University, Arup, Element Energy, IBM, Imperial College Consultants, University of Leeds, Ricardo, Shell, Sussex University, Transport Research Laboratory and UK Power Networks.
Disclaimer
The information in this document is the property of Energy Technologies Institute LLP and may not be copied or communicated to a third party, or used for any purpose other than that for which it is supplied without the express written consent of Energy Technologies Institute LLP.
This information is given in good faith based upon the latest information available to Energy Technologies Institute LLP, no warranty or representation is given concerning such information, which must not be taken as establishing any contractual or other commitment binding upon Energy Technologies Institute LLP or any of its subsidiary or associated companies.
For further information, please contact the ETI at [email protected]
Alternatively, visit www.eti.co.uk
Acknowledgements

3 Energy Technologies Institute www.eti.co.uk
Executive Summary
Context
The UK has committed to a legally binding obligation to cut greenhouse gas emissions by 80% by 2050 (against 1990). The primary issue is atmospheric concentration of CO2 which, once emitted, remains in the atmosphere for up to two centuries1. Consequently, minimising cumulative CO2 emissions is at least as important as the 2050 obligation.
The Energy Technologies Institute (ETI) is a public-private partnership between global energy and engineering companies and the UK Government. Our role is to bring together engineering projects that accelerate the development of affordable, secure and sustainable technologies that helps the UK address its long term emissions reductions targets as well as delivering nearer term benefits.
Light vehicles contribute around 16% of UK CO2 emissions[14]2, and are a major factor in congestion and urban air quality. Light vehicles will remain central to UK mobility in 2050, so transforming the energy infrastructure is essential to emissions reduction.
Cutting transport carbon emissions is expensive compared to most other sectors. Innovation in other parts of the energy generation system such as the development of biomass electricity generation with carbon capture and storage could allow some fossil fuel to still be used in light vehicles in 2050. This could amount to approximately 40% of the 2010 energy mix. This is likely to significantly reduce the overall cost of carbon reduction.
To make energy affordable, capital costs need to be amortised over long payback periods (often 20+ years) with low investment risk and high utilisation at scale. A century of evolution created an efficient energy infrastructure which any new solution must compete with.
1 CO2 emitted to the atmosphere will remain there for 60-200 years[48]
2 Denominator includes international aviation and shipping
Executive Summary
4 Energy Technologies Institute www.eti.co.uk
Executive Summary
Key Findings
The most important finding is that UK energy and climate change goals can be achieved without needing consumers to compromise on expectations for light vehicles.
The least risk, least cost, evolutionary pathway is defined in this report for developing the UK energy infrastructure for light vehicles. This path is highly likely to achieve UK energy and climate change goals for 2050 and minimise atmospheric concentration of CO2 from cumulative emissions. It retains significant market flexibility to continually optimise choices during this transition period. In summary, the pathway comprises:
• Continued ambition in EU emissions legislation for light vehicles to drive change
• Rapid increases in the efficiency of conventional vehicles (including hybridisation)
• Moving back to gasoline rather than diesel for the liquid fossil fuel in light vehicles
• Upgrading the UK oil supply system to increase resilience and balance outputs3
• Introducing and growing the volume of plug-in hybrid electric vehicles4
• Installing 3kW home recharge points only when someone buys a plug-in vehicle
• Adapting electric distribution regulations to ensure efficient network upgrades5
• Developing the market and systems for ‘smart’ energy demand management.
• Targeting almost zero emissions from electricity generation by 2030
• Setting clear long-term sustainability criteria for bio-fuels to support innovation
• Focusing primary vehicle energy research on advanced, sustainable bio-fuels6
• Defining a clear fuel standard to manage the transition to high blend bio-fuels
• Making new vehicles available now ready for high blend bio-fuels in the mid 2020’s
• Ensuring a level playing field – carbon linked taxes, including on electricity7
• Creating long-term stability of policy to give investors confidence
• Ensuring policy balances the costs equitably between different segments in society7
Executive Summary
3 Potentially to process alternative crude oil types, increase storage, upgrade light fractions and enable bio-fuel compatibility
4 Plug-in hybrid electric vehicle refers to any vehicle with a dual electric / liquid fuel supply capability
5 Further work is needed to define the specific regulatory amendments required
6 Research and development is key for sustainable biofuel. A conservative minimum of 10% is assumed for the pathway
7 Further work is required to determine viable policy options to achieve a level playing field and equitable distribution of costs

5 Energy Technologies Institute www.eti.co.ukExecutive Summary
Most of the fundamental technology building blocks are already in development or early commercialisation, providing confidence this can be achieved. There are significant UK industry opportunities:
• Exploiting strong existing UK energy and automotive capabilities in liquid fuels and electricity systems; and vehicle design, development and manufacture
• Creating new UK capabilities in biofuels and smart energy demand management
Ongoing costs from 2050 are likely to be modest compared with a ‘do nothing’ option. However, transition costs to reach that point will be significant. Government policies can help smooth the impact of transition costs on motorists and help ensure UK industrial opportunities.
Public vehicle recharging infrastructure is a very high risk investment and is unlikely to be needed to meet the UK’s 2050 energy and climate change goals. Our research suggests pure battery electric vehicles are also unlikely to meet mass-scale needs; even with very extensive public infrastructure. Nonetheless, there are potential niche roles for both and the pathway defined in this report does not close-down these options.
Hydrogen energy infrastructure for light vehicles is a potentially important ‘insurance’ option 8. However, investment risks are significantly higher. It is unlikely to achieve a lower cost outcome for the UK than the pathway summarised above and detailed in this report, alongside alternative pathways. A hydrogen based path will also be slower to impact emissions, resulting in higher atmospheric CO2 concentration due to the cumulative emissions by 2050; requiring many years after 2050 to offset. It is only likely to be needed if all the following conditions are true (then requiring deployment from 2025)[2]:
1. Biomass electricity generation with CCS is not expected to be successful (hence fossil fuel must be almost eliminated for light vehicles); and
2. Insufficient sustainable bio-fuel is expected to be available (hence leading to a need to phase out mass-scale liquid fuel infrastructure, given the first condition); and
3. The UK’s 2050 greenhouse gas reduction target is sustained above 75%.
There will be socially differentiated impacts on different motorists at different times during the transition. Government policy can help manage these effects. For example:
• Reduced volumes of liquid fuel sales will threaten the market viability of the current ‘universal coverage’ of locally competing refuelling stations, especially in rural areas.
• Not everyone will be able to affordably access electric fuel for vehicles. This section of society will be most sensitive to liquid fuel prices which are likely to carry a scarcity premium.
• During any transition period, the least affluent who depend on older (hence higher carbon emitting) cars will be most susceptible to carbon based taxes on fuels.
Executive Summary
8 Hydrogen may be used in other sectors as well, but this report is on use in transport. Use in other sectors is unlikely to change the case for use in transport. Even if not needed to meet 2050 goals, hydrogen may still be important after that. Continuing to mature hydrogen technology through projects such as UKH2Mobility[42] is critical to making informed decisions

6 Energy Technologies Institute www.eti.co.ukGlossary
Term Definition
BEV Pure Battery Electric Vehicle; powered by external electricity only
CCS Carbon Capture and Storage technology
DfT Department for Transport
DNO Distribution Network Operator
EMR Electricity Market Reform
ESME ETI’s Energy System Modelling Environment engineering design tool
ETI Energy Technologies Institute
FCV Fuel Cell Vehicles
Gasoline Petrol – used interchangeable in the context of this report
GHG GreenHouse Gas emissions (includes methane, CO2, etc)
ICE Internal Combustion Engine
Light vehicle General term, covering cars, vans, ambulances, etc
Motor Spirit Petrol – used interchangeable in the context of this report
NEDC New European Drive Cycle
NOx Nitrogen Oxides
NTS National Travel Survey (from the Department for Transport)
Parc The mix of vehicles currently operating within the UK
PHEV Plug-in Hybrid Electric Vehicle; similar to a RE-EV, a vehicle that can be powered by external electricity or liquid fuel
Plug-in Vehicle A generic term covering PHEVs, RE-EVs and BEVs
Rapid recharge A high power electrical connection for vehicle recharging; for example, sized to recharge up to 100 miles range within 30mins.
Recharge point Any place where a vehicle can be recharged; includes both conductive (physical) and inductive (wireless) energy transfer connections.
RE-EV Range Extended Electric Vehicle; similar to a PHEV, a vehicle that can be powered by external electricity or liquid fuel
Standard recharge A dedicated connection point for plug-in vehicle recharging, but at the same power capacity of a standard domestic socket; around 3kW.
V2G Vehicle to Grid; the use of vehicle batteries as a controllable demand or storage asset to support the electricity grid (in return for payment).
Glossary

7 Energy Technologies Institute www.eti.co.ukContents
Contents
Chapter 1 Light Vehicles in Context
1–1 What are the three aspects of energy system design? 09
1–2 How did UK mobility develop to its current form? 11
1–3 How might UK mobility develop in the coming decades? 15
1–3–1 What are the drivers and constraints to change? 15
1–3–2 So what could UK mobility look like by 2050? 18
1–3–3 What does changing mobility mean for light vehicles? 20
Chapter 2 Buying and using light vehicles in the UK
2–1 How do UK people think about buying cars? 21
2–2 How and why do UK people use cars and how might this change? 25
2–3 How are light commercial vehicles bought and used? 30
2–4 What is driving automotive industry change? 30
2–5 How is the UK vehicle market shaped by global products? 32
Chapter 3 Energy infrastructure design considerations
3–1 What is the current energy infrastructure for light vehicles? 37
3–2 What is important in designing future liquid fuel infrastructure? 40
3–3 What is important in designing electric infrastructure for light vehicles? 42
3–3–1 Where should recharge points be located? 43
3–3–2 What rate of transfer is required at recharge points? 47
3–3–3 Is there a role for supplementary public recharging? 48
3–3–4 How should recharging be integrated into the system? 50
3–3–5 What is the role of conductive and inductive connections? 57
3–4 What is important in designing hydrogen infrastructure for light vehicles? 57
Chapter 4 Energy infrastructure destinations and paths to 2050
4–1 How do the economics / carbon benefits of the options compare? 62
4–1–1 More mature options: fossil, bio and hybrid electric 62
4–1–2 Less mature options: more bio-fuel, pure electric and H2 65
4–2 Least cost and risk path: a combination of liquid and electric fuels 67
4–3 Insurance option: hydrogen fuel for light vehicles 74
4–4 How much will it cost and when will the carbon benefits be seen? 76

8 Energy Technologies Institute www.eti.co.ukReport structure
Report structure
This report is structured in four chapters. The first explores the wider mobility and high level energy system contexts for light vehicles. The importance of carbon reduction in other energy sectors is emphasised as the costs are relatively lower than for carbon reduction in the light vehicle sector. It shows that the least cost route to meeting overall UK energy and climate change goals involves a continued role for fossil fuels in the energy mix for light vehicles in 2050. This chapter also shows that light vehicles are almost certain to remain central to UK mobility in 2050.
The second chapter focuses in on how light vehicles are bought and used, and how this may change in future years. It highlights that most light vehicles are required to undertake very diverse journeys, even though their average usage is generally biased towards short distances with less than two occupants. It concludes that this diverse pattern of use is highly likely to continue out to 2050. It highlights the important role of EU emissions legislation in driving change in the automotive industry, and details the range of potential vehicle side technology developments out to 2050.
The third chapter explores the design of energy infrastructures for light vehicles, starting with an examination of the characteristics of the current energy infrastructure. It details the key technical considerations and relevant cost components required to design future liquid, electric or hydrogen infrastructures in the UK. It highlights the importance of integrated whole systems thinking in designing future energy infrastructure.
The final chapter draws together the details presented in chapter one to three to evaluate the different energy options against one another and in combinations. It concludes that there is a need to make a choice on what combination of energy infrastructures to build to meet long-term UK needs.. It shows that a fossil, bio and electric fuel energy mix for light vehicles is likely to meet UK energy and climate change goals at the least cost. Hydrogen is identified as a potentially important ‘insurance’ technology. It defines the key activities that need to take place to manage an affordable transition to sustianable and secure energy for light vehicles in the UK.
Chapter 1 Light Vehicles in Context
Chapter2 Buying and Using Light Vehicles in the UK
Chapter 4 Energy Infrastructure Destinations and Paths to 2050
Chapter 3 Energy Infrastructure Design Considerations

9 Chapter 1 Energy Technologies Institute www.eti.co.uk
1-1 What are the three aspects of energy system design?
Energy system design is a trade-off. Increasing security of supply and increasing environmental sustainability both impact on affordability. The Light vehicle sector is one of the most expensive in which to cut carbon emissions. Biomass electricity generation with carbon capture and storage can help significantly reduce the overall cost to the UK economy.
Energy system design inevitably requires a trade-off between affordability, security of supply and the sustainable use of resources (including equitable distribution between different segments of society). There is no energy system design in which all three dimensions can be maximised simultaneously; both sustainability and security have an impact on cost. UK society must collectively decide where its priorities rest.
Figure 1: Pragmatic Balancing for Energy System Design
Over a century of evolution, the free market has been successful in delivering the least cost light vehicle and energy supply system for the UK’s needs. However, historically, sustainability and security have not been well reflected in the market or in the primary measure of UK economic performance (Gross Domestic Product). For the free market to stimulate innovation and evolve the UK’s light vehicle and energy supply system to be more sustainable and secure over the coming decades, the relevant factors (such as CO2 emissions) need to be measured and paid for within the market. However, this will impact on affordability (otherwise it would already have been delivered by the market as the least cost solution).
To most UK people, affordability is the most important dimension to them even more so in times of economic difficulty. This is especially the case for light vehicles, because they have become so central to the UK way of life. Consequently, significant effort will be required to build and maintain the political capital required for the decades it will take to successfully adapt the market to achieve security and sustainability.
Our strategy development is focused on determining the most credible contender technologies and their routes to market for the future UK energy system within defined security and sustainability constraints:
• An 80 percent reduction in greenhouse gas emissions by 2050
• Maintaining or reducing the level of risk to UK security of supply
Chapter 1 Light Vehicles in Context
Energy security and sustainability need to be balanced with affordability
Energy security and sustainability have historically been externalities and not reflected well in decisions
Sustainability
AffordabilitySecurity
Our peer reviewed Energy System Model seeks the lowest cost solution

10 Chapter 1 Energy Technologies Institute www.eti.co.uk
Our internationally peer reviewed Energy System Modelling Environment (ESME) is an engineering design tool that allows us to evaluate the best combinations of technologies to deliver affordable, secure and low carbon energy across power, heat, transport and the infrastructure that binds them. It is underpinned by extensive data from our technology development projects and from proprietary industry data from our Industry Members (BP, Caterpillar, EDF, E.ON, Rolls Royce and Shell) and the UK Government.
Figure 2: The Energy Systems Modelling Environment (ESME)
Our analysis provides confidence that UK energy and climate change goals for 2050 can be achieved. An affordable, secure and sustainable energy system can be successfully engineered by 2050.
Transport emerges from this analysis as one of the most expensive sectors in which to cut carbon emissions. Technologies for carbon reduction in the light vehicle sector generally sit towards the margin of being worthwhile at an 80% reduction in greenhouse gas emissions. The level of technology change required is very susceptible to the carbon reduction achieved in other (much cheaper) sectors and the commitment to an 80% cut in emissions as opposed to, say, 75%.
The electricity sector emerges as one of the least expensive sectors in which to cut carbon emissions, and many electricity generating assets are approaching the end of their economic life over the next twenty years. Furthermore, emissions reduction in the electricity sector is a fundamental underpinning to emissions reduction in other sectors; the electrification of heat and mobility, for example. An affordable target for the electricity sector is therefore almost zero CO2 emissions by 2030[2]. The government’s planned Electricity Market Reforms (EMR) aim to deliver substantial new investment in low carbon generating capacity[1].
Biomass and carbon capture and storage (CCS) emerge from our analysis as critical technologies for the UK with a fundamental impact on the required emissions reduction from light vehicles. Biomass electricity generation combined with CCS could deliver a significant carbon ‘credit’9, thereby reducing the carbon reduction required in the transport sector.
• If bio-CCS power can be deployed to its fullest extent, the energy system for light vehicles could retain around 40% of the 2010 energy mix as fossil fuel in 2050[2].
• If deployment of bio-CCS is not successful, direct fossil fuel use would have to be largely eliminated from light vehicles by 2050 to achieve the 80% overall reduction in GHG emissions target[2].
Power
Buildings
Transport
Industry
Infrastucture
Demand Scenarios
Energy System Blueprints
Global Parameters
Technology Profi les
Energy Resources
Affordable, secure and sustainable energy, can be achieved
Electricity is a lower cost sector to decarbonise and underpins carbon reduction opportunities in the buildings and transport sectors
Bioenergy is critical to minimising cost for light vehicle carbon reduction
9 The biomass ‘credit’ is identified in ESME separately to the electricity sector (with CCS, combustion is near zero emissions).

11 Chapter 1 Energy Technologies Institute www.eti.co.uk
Figure 3: ESME – Balancing Carbon Reduction between Sectors to Minimise Overall Cost[2]
The built environment shapes mobility needs for the coming decades
1-2 How did UK mobility develop to its current form?
The mid 20th century was a significant turning point for the UK built environment, after which it was increasingly built around the flexibility of light vehicles. The long lifecycle of the built environment 10 fundamentally shapes UK mobility needs for the coming decades.
The need for mobility is driven by three types of decision: collective strategic, individual strategic and operational.
Collective strategic decisions include:
• Urban planning decisions, such as where to locate business parks, shopping centres, residential estates.
• Transport infrastructure decisions, such as where to build roads, train lines and train stations.
• Energy infrastructure decisions, such as the location and coverage of refuelling stations and the capacity of electricity networks.
Individual strategic decisions include:
• Decisions about where to live/work/etc and whether or not to own a car (and what type of car) or other mobility asset (such as a bicycle). Such individual decisions are often a compromise within a household (e.g. where both partners work at different locations).
Operational decisions are heavily constrained by the history of strategic decisions and available time and money, but include:
• Decisions on taxation, subsidies and incentives to influence day-to-day choices of individuals and businesses.
• Peoples’ individual decisions about whether to make a particular journey and what mode of travel to use from the available options.
10 ‘Built environment’ refers to the man made buildings, roads, infrastructures, supply systems, etc in which society exists
0
100
200
300
400
500
600
2009(Historic)
2050(Base Case)
2050(No Bio CCS)
International Transport
Domestic Transport
of which Light Vehicles
Buildings
Electricity Sector
Industry
Bio-credits
of which Biofuel Credits
Best estimate target for light vehicle carbon reduction
But without Bio-CCStarget is signifi cantly lower, permitting almost no fossil fuel use
Mt
CO
2/ye
ar

12 Chapter 1 Energy Technologies Institute www.eti.co.uk
Efforts to change peoples’ travel behaviour are inevitably slow to take effect since, in reality, operational decisions are heavily constrained by the history of strategic decisions; people have limited freedom in their operational decision making without major long-term lifestyle changes.
The built environment is shaped around the strategic decisions on what type of transport infrastructure to build. In turn, the built environment (and the use of it) is then reliant upon that transport infrastructure.
The lifecycle of assets in the built environment is typically well over 100 years. Consequently, the history of strategic decisions that led to the design of the current UK built environment will fundamentally shape the UK’s mobility needs for the coming decades.
The mid 20th century was a significant turning point for UK transport infrastructure, in which the UK expanded the road network and scaled back the rail network. Consequently:
• Nearly 400 billion person-miles are travelled by car each year; around 10 times more than by rail and around 20 times more than by bus/coach[3].
• The majority (75%) of households now own at least one car, with around a third of households having access to more than one car; a total parc of over 28m cars[3].
• Around 80% of car buyers consider their car essential to their life[4].
• The majority of short distance goods movement is by light commercial vehicles[4]. However, light commercial vehicles represent a small share of light vehicle travel. Passenger cars are dominant. Cars are therefore the main focus of the analysis in this report.
Light goods vehicles are however becoming a more significant transport component, having grown at a faster rate than passenger car travel demand over the last decade.
Cars dominate UK mobility; 10 times more person-miles than by train and 20 times more than by bus/coach
Light commercial vehicle use is growing rapidly
Figure 4: Miles Travelled per Person by Transport Mode[3]
Figure 5: Total Miles Travelled in the UK by Transport Mode (1949 to 2011)[3]
Mile
s tr
avel
led
per p
erso
n
0
1000
2000
3000
2005 2006 2007 2008 2009
4000
6000
5000
7000
8000
Other Public
Surface Rail / Underground
Bus
Other Private
Motorcycle
Car Passenger
Car Driver
Bicycle
Walk
Tota
l veh
icle
mile
s(B
illio
n m
iles
per y
ear)
50.0
0
100.0
150.0
194
9
195
2
195
5
195
8
1961
196
4
196
7
197
0
197
3
1976
197
9
198
2
198
5
198
8
1991
199
4
199
7
20
00
20
03
20
06
20
09
200.0
300.0
250.0
350.0
Pedal cycles
Goods vehicles
Light vans
Buses and coaches
Motorcycles
Cars and taxis

13 Chapter 1 Energy Technologies Institute www.eti.co.uk
• The automotive industry is a major employer (nearly half a million jobs) and contributor to the UK economy (exporting £8.9bn of finished goods annually)[5].
• The UK liquid fuel industry is also a major employer (over 150,000 people in the downstream business, excluding those in upstream exploration and production) and contributor to the UK economy (around 6.3% of tax receipts are from liquid fuel sales)[7].
• The UK has a major road network (‘A’ roads and motorways) of around 30,000 miles, in addition to the minor road network of around 200,000 miles[3]. This is in contrast to only around 20,000 miles of rail track (a decline from its mid 20th century peak)[8].
• Only around a third of UK car mileage is in urban areas[3]. Over two thirds of UK mileage is on motorways and major “A” roads.
• The UK built environment includes a large number of out of town shopping and business parks, drawing people in to shop and work from diverse locations many miles around.
• ‘Commuter towns’ and ‘commuter belt’ suburbs are an increasingly significant feature of the UK built environment, with a high density of housing and very little local employment.
• Rural and some regional rail networks have relatively low utilisation (with limited times of service) and require subsidy[9].
As the UK has become more affluent, longer journeys and leisure journeys have become increasingly important.
• Leisure, shopping and personal business now account for around two thirds of all person-miles travelled in the UK.
• For leisure purposes, cars tend to have a much higher occupancy than for commuting/business purposes (which is little more than one person per car). This diversity of car use drives ‘peak’ vehicle usage and heavily influences peoples’ choice on which car(s) to buy; this topic is explored in later chapters.
Light vehicles and their fuels employ well over half a million UK people
The UK road network is over ten times longer than the rail network
Out of town business and retail parks, and ‘commuter’ towns, depend on the flexibility of light vehicles
Figure 6: UK Road Length and Usage[3]
0 0
50 50
100 100
150 150
200 200
250 250
300 300
Minor urban road
Minor rural road
Urban A road
Rural A road
Motorway
Thou
sand
s m
iles
of ro
ad
Billi
on v
ehic
le m
iles
per y
ear
Lenght of road network Road usage

14 Chapter 1 Energy Technologies Institute www.eti.co.uk
• There are signs domestic travel demand growth is saturating in the affluent segments of UK society. Increasing wealth in the less affluent segments of society is enabling them to grow towards a more equitable standard.
• Air travel is the fastest growing travel mode, although it is still dominated by a relatively small proportion of the population. Around half the population take no flights at all in a given year[3].
0%
10%
20%
30%
40%
50%
60%
None One Two Three Four Five or more
2003
2004
2005
2006
2007
2008
2009
2010
2011
Figure 7: Number of Miles Travelled in the UK per Person by Journey Purpose[3]
Figure 8: Number of People Making Trips by Air (Inbound / Outbound Count as One Trip)[3]
0
500
1000
1500
Com
mut
ing
/ Bu
sine
ss
Educ
atio
n / E
scor
t ed
ucat
ion
Shop
ping
Oth
er e
scor
t /
Pers
onal
bus
ines
s
Leis
ure
Oth
er
2000
3000
2500
Other Public
Surface Rail / Underground
Bus
Other Private
Motorcycle
Car Passenger
Car Driver
Bicycle
Walk
Aver
age
occu
pant
spe
r veh
icle
1
1.5
2
2.5
All
purp
oses
Mile
s tr
avel
led
per p
erso
n

15 Chapter 1 Energy Technologies Institute www.eti.co.uk
Increasing affluence has enabled more freedom of choice
Peoples’ lives are becoming more geographically dispersed
Energy cost is increasingly affecting peoples’ choices
1-3: How might UK mobility develop in the coming decades?
Increasing affluence has enabled more people to benefit from mobility. Light vehicles will almost certainly remain central to UK mobility in 2050, especially outside urban areas. Increasing mobility needs to fit in ever more crowded urban areas and limited road space, be faster, be less polluting, make less noise and injure fewer people.
1-3-1: What are the drivers and constraints to change?
UK mobility has transformed significantly over the last four decades and, new drivers of change and constraints are emerging that will also shape UK mobility over the next four decades.
Increasing disposable income has a significant effect on discretionary journeys. For many years now, an average of around 15% of household disposable income has been spent on motoring[10]. The increasing affluence of the poorer segments of UK society has enabled them to enjoy more flexibility in their choices of when, where and how to travel.
It is reasonable to expect disposable income to grow and peoples’ freedom of choice to increase.
An increasing range of goods, services and delivery routes is giving people ever more choice to use their time and money. This trend is likely to have a profound effect over the coming decades on the choices people make, potentially resulting in less time spent travelling in favour of other activities.
The importance of light commercial vehicles for home delivery is likely to continue to grow significantly as the role of internet shopping continues to grow.
A potentially important side effect of more goods and services is that cars may become less significant as a symbol for expressing individuality and status. Alternative symbols may emerge. There is no evidence that such a change is underway, however11.
An increasing geographic spread of peoples’ lives has been taking place for many years, as people choose to live and work further apart and have increasingly dispersed social circles.
Choices on where to live are an inherent compromise between the needs of members of a household.
• The type of work and working environment (or quality of school) are increasingly important to peoples’ choices.
• The UK built environment has developed with an inherent separation between ‘commuter’ suburbs and workplaces.
• Social networking (from the telephone onwards) has enabled people to build and maintain wider social circles.
This trend is unlikely to be reversed. It has resulted in people travelling ever further afield. Increased personal mobility will almost certainly remain central to the UK way of life in 2050.
The increasing cost of energy relative to other goods and services is making people think more carefully about their choices[11]. This trend is likely to continue as the UK becomes increasingly dependent on imported energy supplies in the face of aggressive growth in global energy demand[11].
This increasing cost of energy may significantly reduce travel, especially ‘discretionary’ travel amongst the least affluent, but it will not change peoples’ underlying need for that mobility. Efficiency and alternative fuels are highly likely to become central to peoples’ vehicle purchase choices in the years ahead.
11 There are some potential indicators; fewer young people obtain driving licenses as early as they did a decade or so ago, for example. However, this may be interpreted as people delaying learning to drive until closer to when they plan to own a car.

16 Chapter 1 Energy Technologies Institute www.eti.co.uk
Available time is a fundamental constraint on how much people travel
Diesel vehicles are currently more detrimental to local air quality than gasoline vehicles
Air, noise and environment pollution are increasingly recognised as significant issues
Transport is responsible for around a quarter of the UK’s CO2 emissions
Limited time is a fundamental and universal constraint. For many years, around 4.5% of the average persons’ year has been spent travelling. Most of this time is spent on shorter distance travel.
Congestion is increasingly affecting journey times, especially in major urban centres. Intelligent Transport Systems, such as managed motorway speed limits and traffic information services, are helping to mitigate congestion, but individuals’ annual travel will nevertheless be increasingly constrained.
Congestion is however far from universally accepted by UK people as a problem – around two thirds don’t see it as a serious concern for towns and cities and around four fifths don’t see it as a serious concern for motorways[12]. This creates a significant political barrier to less popular schemes (e.g. road use pricing).
Political barriers to new infrastructure are limiting the traditional solution to congestion being implemented – the building of more road or rail capacity. Although there is a growing group of people – currently about a third of the population[12] – which are not very concerned about the impact of new transport infrastructure, a vocal minority is enough to be a major obstacle to construction.
This is especially significant for the rate at which the rail sector can realistically take over some of the mileage currently completed by road. The rail network would inevitably require very substantial expansion (as discussed a little later in this Chapter) in the face of strong public opposition.
Air quality and noise pollution in urban centres continues to be a significant issue affecting local authorities. Significant improvements have been made, but air quality remains very poor in some urban centres where the density of emissions is high and the built environment blocks the wind flows to disperse emissions[13].
Whilst a relatively small contributor overall at the UK national level[14], diesel road vehicles are one of the primary causes of high air pollution concentrations in dense urban areas[15].
Vehicle technologies that reduce noise levels in urban centres (primarily caused by engine noise as road speed is low) are likely to be increasingly attractive for major urban centres.
Air quality remains a significant issue for a majority of UK people[12], creating a high level of public support for technology measures to help reduce pollution. However, the number of people concerned by it has been falling[12]. Consequently, more drastic steps – such as the prohibition of some vehicles from urban centres – may find it much more challenging to secure sufficient public support.
Regulations governing the emission of pollutants from light vehicles are almost certain to become ever more stringent.
Carbon emissions and climate change is increasingly recognised by the scientific community as one of the most significant issues facing humanity. Transport is a major contributor; currently around a quarter of total UK emissions[14].
According to Department for Transport statistics over two thirds of UK car mileage is on motorways and major ‘A’ roads. Consequently, motorways and ‘A’ roads need to be the focus for carbon emissions reduction, whereas the air quality and congestion drivers mostly influence change in urban centres.
However, there are a significant number of people for whom the contribution of transport to climate change is not a concern.This is currently around a third, an increase from around a fifth in 2005 (12), Consumer research shows that the majority of those that are concerned are not willing to pay more to reduce their carbon emissions [4] [16] – in other words, they believe someone else should do something about it.
Policies which will impact on cost therefore face a struggle to secure sufficient long-term political capital over the long timescale required to drive change. This is especially so for light vehicles, since ultra low carbon vehicle technologies are expensive and sit towards the margin of being worthwhile at a greenhouse gas emissions reduction target of 80%[2].

17 Chapter 1 Energy Technologies Institute www.eti.co.uk
Ann
ual c
ar
sale
s (m
n)
-
1990
1995
20002005
2010
2015
20202025
20302035
20402045
2050
1
2
3
4
5
Historic annual sales data
Future sales estimate – Most likely
Future sales estimate – Minimum
Future sales estimate – Maximum
Prob
abili
ty
dist
ribut
ion
Total cars in the UK Parc in 2050 (mn)
030 32 33 35 36 38 39 41 43 44 46
0.02
0.06
0.04
0.1
0.08
Political barriers to tackling climate change create risks for long-term infrastructure investors
Political barriers to tackling climate change are very likely to continue to constrain the achievable rate of emissions reduction from light vehicles. The consequent uncertainty on the ability of the Government to sustain an 80% emissions reduction goal rather than, say, a 75% goal creates significant risk for long term investment in fixed infrastructure assets.
Decreasing availability and adequacy of home parking, especially in urban centres, is acting as a constraint on the rate of growth in car ownership. It is therefore unlikely that growth in car ownership will continue at its historic rate. Its future growth is more likely to be linked to growth in population rather than a growth in ownership of second and third cars in the household.
Revenue from the automotive industry continues to be significant in the UK, both for jobs and the balance of trade. This is almost certain to remain critical to policy decisions. Any policies which significantly undermine the importance of light vehicles are unlikely to gain the political support required for implementation.
Sustainable use of material resources is becoming ever more important, driven by ever more stringent legislation. The value of recycling also continues to grow as demand for raw materials pushes prices up. This trend will have a significant impact on automotive industry product strategies, particularly on the viability of difficult or expensive to recycle materials.
Safety and road traffic accidents continue to have an important influence on vehicle and road design, but road traffic accidents remain a significant cause of serious injuries and death.
Perceived safety risks are a significant barrier to walking and cycling. However a number of local authorities are working to reduce these risks such that this is likely to be less of a barrier in future.
Figure 9: Historic car sales[3] and estimate of future sales / parc size (assumes constant scrappage)
18 Chapter 1 Energy Technologies Institute www.eti.co.uk
2008
2009
2010
2001
2002
2003
2004
2005
2006
2007
1994
1995
1996
1997
1998
1999
2000
0
5%
-10%
10%
-5%
15%
20%
25%
30%
35%
Cum
ulat
ive
chan
ge in
regi
onal
tr
affi c
from
199
3
Nor
th E
ast
Major fuelprice protests;fuel price ~20%higher than year earlier
First full year with congestion charge
Start of economic downtown
Nor
th W
est
York
shire
and
the
Hum
ber
East
Mid
land
s
Wes
t M
idla
nds
East
of E
ngla
nd
Gre
ater
Lon
don
Sout
h Ea
st
Sout
h W
est
Wal
es
Scot
land
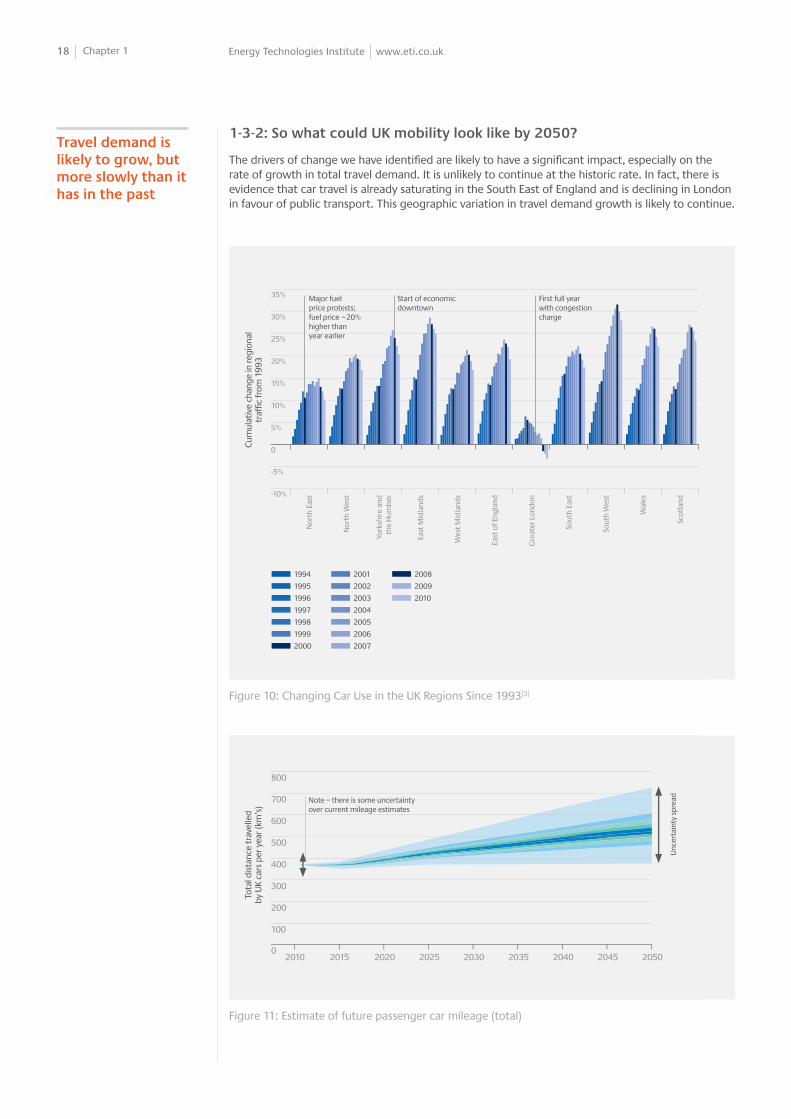
1-3-2: So what could UK mobility look like by 2050?
The drivers of change we have identified are likely to have a significant impact, especially on the rate of growth in total travel demand. It is unlikely to continue at the historic rate. In fact, there is evidence that car travel is already saturating in the South East of England and is declining in London in favour of public transport. This geographic variation in travel demand growth is likely to continue.
Tota
l dis
tanc
e tr
avel
led
by U
K ca
rs p
er y
ear (
km’s
)
Note – there is some uncertainty over current mileage estimates
Unc
erta
inty
spr
ead
02010 2015 2020 2025 2030 2035 2040 2045 2050
100
200
300
400
500
600
700
800
Figure 11: Estimate of future passenger car mileage (total)
Travel demand is likely to grow, but more slowly than it has in the past
Figure 10: Changing Car Use in the UK Regions Since 1993[3]

19 Chapter 1 Energy Technologies Institute www.eti.co.uk
Passenger cars are likely to be far less welcome in major urban centres in the future. This is primarily due to congestion and safety. Air quality is less likely to be a significant driver, given the technology available to mitigate emissions. However, light commercial vehicles are likely to be an increasingly critical feature in major urban centres.
• More cycling and walking would be desirable and could help to reduce car use for shorter local journeys. The impact on light vehicle use for other journeys will be very limited.
• Investment in local tram and light rail schemes is an important and desirable route to enabling mass transit in major urban areas with high population density. They are unsuitable as solutions for areas of lower population density due to inherent low utilisation, so the impact on light vehicle use at the national level will be very limited.
• Local bus schemes are a desirable and cost effective means to tackle congestion. They reduce energy consumption for transport when they operate with high utilisation. However, in areas of lower population density, their utilisation is unlikely to be sufficient to displace the importance of passenger cars.
• Park and ride schemes are a useful and desirable means to reduce car use within dense urban areas. There are many urban areas where such schemes could operate to help tackle congestion. However, the impact on light vehicle use at the national level will be very limited.
For longer journeys the increasing use of long distance coaches and the rail sector are both important and desirable developments. However, their inherent constraints will limit their impact on the importance of light vehicles for UK mobility by 2050.
• The long distance coach sector has significant growth potential using the same infrastructure as cars (person-miles by bus/coach is currently a twentieth of that by car[3]). However, high utilisation is important if coaches are to have a positive impact on energy consumption – and carbon emissions. The routes over which they can usefully operate are therefore inherently limited.
The long-distance rail sector has significant potential to grow, replacing some long distance car journeys. However, it can only afforably operate between major urban centres where high population densities create high utilisation. Studies have shown there is potential for doubling the use of rail, partly through investment in new capacity and partly through better utilisation of existing rail system capacity. Around ten times as many person-miles are currently travelled in cars than by rail[3] so the impact of a doubling in rail use would therefore only affect car use by around 10%. This would likely be more than offset by overall growth in travel demand.
Increasingly vocal political opposition to constructing new rail infrastructure is unlikely to permit a major shift from road to rail by 2050.
Moving beyond road transport, air travel is the fastest growing transport mode[3]. Increasing disposable income against fixed ‘disposable time’ is driving this trend and it is likely to continue. Since cars generally do not compete with air travel for the same types of journeys, the impact on car use will be very limited. However, in a carbon constrained world, emissions from the aviation sector directly reduce the available headroom for emissions from light vehicles.
More cycling and walking is very desirable and could cut car use in urban centres
A gradual shift to trains, trams and buses would be desirable, but will have little impact on cars by 2050
Bus and coach use has real potential to grow, but the impact on 2050 car use will be small
Air travel is likely to grow, implying a need to cut more carbon from light vehicles

20 Chapter 1 Energy Technologies Institute www.eti.co.uk
1-3-3: What does changing mobility mean for light vehicles?
The developments in UK mobility discussed above may have a profound effect on the use of passenger cars in major urban centres over the next four decades. However, the impact on the UK’s dependence on light commercial vehicles and passenger cars away from these centres is likely to be much more modest. The ownership and use of light vehicles will almost certainly evolve:
• The flexibility of light vehicles will remain essential for many journeys in many areas of the UK – to travel between the UK’s decentralised residential areas, workplaces and amenities.
• People will continue to make day-to-day decisions on how to travel based on marginal costs, which will continue to favour using the car (for car owners) instead of other travel modes12.
• Ad hoc urban car hire schemes may make cars more accessible to those living in large urban centres. However, such schemes will continue to have a high cost relative to the marginal cost of a person using the car they already own. They are unlikely to be a viable solution to the range or size limits of certain vehicle types for the mass market.
• The universal coverage of energy infrastructure will remain critical, such that vehicle energy stores can be quickly refilled en route.
• Growth in car ownership is unlikely to continue at the historic rate, constrained by available space for home parking and population.
• Growth in car use is unlikely to continue at the historic rate, constrained by available time and road space.
• Vehicle use will continue to be very variable, sometimes with only one occupant, and sometimes fully occupied and with luggage.
• People may choose to buy smaller cars in future, but the UK car parc is already dominated by small to medium cars, so there is less UK potential for energy consumption to be reduced this way.
• Light vehicles are likely to be more efficient and use alternative fuels.
• Cars and car journeys may be shared more often, although the logistics of different peoples’ travel needs and their individual preferences will limit the overall impact.
• Light commercial vehicle use is likely to increase significantly, as the role of services in the UK economy continues to expand and internet shopping and home grocery deliveries become increasingly commonplace. The alternative travel modes for passenger car use previously discussed are unlikely to be suitable alternatives for the majority of light commercial vehicle uses.
It is possible that people can be persuaded to behave differently in the interests of reducing the environmental impact of vehicle use; for example driving at lower speeds on the motorway. Vehicle automation technologies may create new opportunities to improve the efficiency with which vehicles are used. However, there is very little evidence on which to base any analysis of the potential energy consumption benefits.
Consequently, behaviour change and vehicle automation are excluded from the analysis in this report. They may of course both deliver additional benefits beyond those determined later in this report.
Vehicle ownership and use is developed further in the next chapter.
The flexibility of light vehicles will remain essential to UK mobility
Light vehicles are likely to be more efficient and use alternative fuels
12 Once someone has decided to buy a car, the marginal cost of its subsequent use is relatively low; conversely, trains, buses, etc generally need to recover their capital and other costs within the ticket price. This has a significant impact on peoples’ choices – trains, buses, etc are often not cost competitive with the marginal cost of using a car. This is compounded by many marginal costs for car use not being considered in decisions; depreciation and insurance due to extra mileage, for example.
21 Chapter 2 Energy Technologies Institute www.eti.co.uk
The first two sections of this chapter of the report are focused on car use. This is because the majority of energy demand for light vehicles is used in cars and because the breadth and depth of data on car use is much greater than for light commercial vehicles. The third section expands this analysis to consider light commercial vehicle ownership and use.
2-1: How do UK people think about buying cars?
People buy cars primarily for the purposes of meeting very variable daily mobility needs. For many consumers their choices are heavily influenced by emotions. Even fleet buyers depend on private buyers’ emotions, to ensure residual resale value.
Peoples’ decision to buy a car is influenced by:
• The ability for a car to meet their household’s actual and perceived mobility needs relative to other mobility options.
• Practical constraints, such as the space to park it.
The choice of whether to buy a new, nearly new or older car is fundamentally shaped by disposable income and access to capital.
• New cars are generally sold to the most affluent members of society and fleet buyers, as are the largest cars.
• Private new car buyers tend to hold onto their vehicle for several years. Fleet buyers tend to sell their cars quickly; partly due to the higher annual mileage. Hence, most of the ‘nearly new cars’ for sale are a flow-down from fleet sales.
• Around half of new cars in the UK are sold to fleets, but only ~8% of the UK parc is in a fleet[3]. The average business user travels around twice the annual mileage of a private user[18]. Hence, ~85% of energy consumed by cars is by private users. Private users are the dominant driver of energy system design for cars.
• The majority of people buy nearly new or old cars, with the least affluent dependent on the oldest cars. Their buying choices are constrained by the choices of new car buyers, which in turn are influenced by their expectations on residual value (especially important for fleet buyers).
Chapter 2 Buying and Using Light Vehicles in the UK
Fleets buy half of new cars, but sell them quickly (only 8% of the parc is in a fleet); ~85% of energy for cars is by private owners

22 Chapter 2 Energy Technologies Institute www.eti.co.uk
Parc
tota
l ann
ual m
iles
(bill
ion
[1x1
09 ] m
iles)
Vehicle age (years)
0 1 2 3 4 5 6 7 8 9 10 11 12
2
4
6
8
10
12
14
16
18
20
28% of mileage
33% of mileage
19% of mileage
Some vehicles are pre-registered or sold on within fi rst year
4th
3rd
2nd
1st 10th+ owner
9th
8th
7th
6th
5th
20% of mileage
Beyond the decision to buy a car and the fundamental constraints of disposable income and access to capital, there are very variable attitudes to car purchase. There are three critical aspects (in order of decreasing significance):
• Instrumental factors: Practical functionality aspects, such as whether it is large enough and whether it is perceived to be safe and of good quality.
• Symbolic factors: The expression a car makes about its owner in terms of social status, social conscience, personal values.
• Affective factors: Feelings evoked by owning and using the car.
To design an effective energy system, especially during the early phase-in period, it is critical to understand the needs and expectations of the different consumer segments as they differ very significantly.
In 2009 we commissioned the most in-depth study of mainstream consumer attitudes to ultra low carbon vehicles completed to date[4] [16] [17] (the study finished in mid 2011). The study included:
• Extensive literature review.
• Reference to insights from the Technology Strategy Board Ultra Low Carbon Vehicle Demonstrator programme.
• Research with mainstream UK consumers, provided with a pure electric or plug-in hybrid electric vehicle to give them experience of using the products.
• In-depth surveys and a quantitative choice experiment with mainstream UK consumers with recent experience of buying a new or nearly new car. This involved circa 3,000 full respondents.
Our consumer research revealed eight unique consumer segments[4]:
• Plug in Pioneers – A very early adopter group.
• Zealous Optimists – Early adopters of plug-in vehicles generally.
• Willing Pragmatists – Early adopters of plug-in hybrid electric vehicles specifically.
Figure 12: Breakdown of the UK Car Parc by Vehicle Age, Owner and Annual Mileage[3]
Emotions have a significant influence on peoples’ purchasing choices
ETI completed the most extensive research so far on mainstream attitudes to low carbon vehicles

23 Chapter 2 Energy Technologies Institute www.eti.co.uk
• Anxious Aspirers – A group enthusiastic about plug-in vehicles generally, but who have strong actual and perceived constraints to adoption.
• Uninspired Followers – A sceptical group without strong opinions but a lack of enthusiasm about plug-in vehicle technology.
• Conventional Sceptics – A sceptical group who question the benefits of plug-in vehicles.
• Image-conscious Rejecters – A decidedly negative group who like very little about plug-in vehicles.
• Company Car Drivers – who show signs of openness towards plug-in vehicles, particularly plug-in hybrid electric vehicles and particularly as a second car (although the choice experiment indicates significant barriers to converting ‘interest’ to ‘purchase’).
The first three consumer segments (around a quarter of new and nearly new car buyers) are willing to pay a premium over a conventional vehicle for a plug-in hybrid electric vehicle with the same instrumental attributes. This highlights the importance of affective and symbolic motivations for vehicle choice.
However, consumers are far less convinced about choosing a pure electric vehicle over a conventional vehicle (citing legitimate concerns such as limited range, practicality of recharging, as well as some symbolic concerns such as ‘embarrassment’). Only the ‘Pioneers’ are willing to pay a premium (less than the premium they are willing to pay for a plug-in hybrid electric vehicle); the remainder would require a significant saving relative to a conventional vehicle before considering such a purchase.
Mainstream attitudes to plug-in hybrid electric vehicles are very positive, but most have strong reservations about pure electric vehicles
Figure 13: Consumer Segmentation of the Market for Low Carbon Vehicles[4]
Interested consumers
Reluctantconsumers
Pioneers
Earliest purchasers
Zealous optimists
Willing pragmatists
Anxious aspirers
Uninspired followers
Conventional sceptics
Image conscious rejecters
Companycar drivers

24 Chapter 2 Energy Technologies Institute www.eti.co.uk
Figure 14: Consumer Willingness to Pay for Low Carbon Cars Relative to Conventional Cars[16]
Require a discount over a conventional vehicle before willing to consider purchase
Increasing discount
Willing to pay a premiumover a conventional vehicle
Company car drivers
Image conscious rejecters
Conventional sceptics
Uninspired followers
Anxious aspirers
Willing pragmatists
Zealous optimists
Pioneers
Pure battery electric vehicle Plug-in hybrid electric vehicle
Increasing premium
The ‘Pioneer’ segment is a particularly interesting segment, as they are likely to be the first adopters of plug-in vehicles. They differ from the other groups in a number of significant ways. This suggests it would be very unwise to design the energy system around observations of their behaviour.
• They are generally very affluent. They also tend to drive long distances, use public transport modes frequently and have a tendency towards larger, higher status cars.
• Symbolic and affective values are both very important. This is a key driver of their willingness to pay more than for an equivalent conventional car.
° They are very image conscious, and generally see plug-in vehicles as a symbol projecting environmental respect.
° They find pleasure in the novelty of new technologies.
• Future savings on running costs are more important to the Pioneers than the upfront capital cost. This is in contrast to other consumer groups, who are unwilling to buy a car with the same total cost of ownership if the upfront cost is higher.
An overarching finding from the consumer research is the lack of importance most consumers place on carbon emissions in their purchase decision. Even though many say the environment is important to them, very few are willing to pay more for environmental benefits. Only Pioneers exhibit a willingness to pay more for a lower carbon product. Consequently, there is little value to be gained from promoting the carbon status of ‘low carbon vehicles’ beyond the niche Pioneer segment.
However, there are a number of attributes associated with plug-in vehicles that consumers do value much more significantly some of which can be exploited in the design of the energy system.
• Acceleration performance is valued very highly by consumers. The constant torque acceleration of electric drive vehicles can be a significant influence on consumer choice[16].
• Independence from oil and price volatility is highly valued. Consumer research suggests it is not the actual price per se that impacts on perception, but the rate of price rises[4]. An energy system business model with the ability to offer greater certainty on future costs could have significant influence on consumer choice.
• Convenience of home charging (i.e. not having to visit petrol stations so often) is seen as a substantial benefit of plug-in vehicles[4]. Solutions which make this easier – inductive recharging13, for example – would help to emphasise this benefit.
13 Inductive recharging refers to transfer of electricity across a small air gap, with an electrically powered coil permanently fixed into the parking space and a matching one on the vehicle to ‘collect’ the energy; i.e. overcoming the hassle of ‘plugging-in’
‘Pioneers’ differ from mainstream consumers – the energy system should not be designed around their behaviours
The majority of consumers are unwilling to pay anything more for carbon reduction
Business models offering greater certainty on energy costs could help uptake

25 Chapter 2 Energy Technologies Institute www.eti.co.uk
For carbon to have a more direct effect on peoples’ buying choices, it must be converted into a monetary value (either through taxation or carbon penalties embedded into product prices).
2-2: How and why do UK people use cars and how might this change?
UK people use their cars for a wide range of activities, from driving on their own to work each day, to taking the family on holiday. People need this level of flexibility from the cars they buy, even if they only occasionally use its full capability. The energy system will need to continue to enable the refilling of car energy stores quickly and universally across the UK.
The UK has one of the most extensive datasets of current travel patterns of any nation, generated from detailed household travel diaries. We have worked with the Department for Transport to analyse this data, focusing on the 2007 to 2010 data (a dataset of 23,589 households and 1.25 million car journeys).
Car travel patterns in the UK can be segmented in to a number of dimensions, which reveals important differences. Some will have a material impact on energy system design.
Small cars vs. larger cars: Large cars are used much more heavily than small cars, particularly during their first few years. The data also shows they are used for an equally wide range of journeys; including journeys well over 200 miles. There is no discernible difference in the energy supply needs (other than total energy consumption). All vehicle sizes require sufficient range for long-distance journeys and the capability to be replenished quickly en route.
There is a trend towards the average vehicle size becoming smaller. This may continue as energy costs rise, but it is unlikely to impact fundamental energy infrastructure needs (other than total consumption).
New cars vs. older cars: The chart above shows that new cars tend to be used much more heavily than older cars. The data also shows that newer cars tend to be used for more long-distance journeys.
Given the importance of reliability to heavy users, this trend is likely to continue. It is therefore essential to design the future energy system for the whole vehicle lifecycle; not the average or that of its first owner. This demonstrates both an opportunity for cost optimisation and a significant hurdle for market entry of new vehicle types with range constraints. The usage profile is more demanding when the car is new.
For example, as shown in the chart below, the battery size in a plug-in hybrid electric vehicle could be reduced (if the battery doesn’t degrade significantly) or significant battery degradation can be accepted without impacting on range achieved in electric mode.
All vehicle sizes require their energy store to be quickly replenished en route
Newer cars are used for more long journeys and travel more miles each year; whole lifecycle optimisation is key
Figure 15: Annual Car Mileage by Age for Small / Medium / Large Cars[18]
Ann
ual m
ileag
e (m
iles)
Vehicle age (years)
00 1 2 3 4 5 6 7 8 9 10
2,000
4,000
6,000
8,000
10,000
12,000
14,000
16,000
Large sized cars
Medium sized cars
Small - medium sized cars
Small sized cars
Carbon must be monetised to impact decisions

26 Chapter 2 Energy Technologies Institute www.eti.co.uk
Cars predominantly used for business vs. private use: Cars used predominantly for business are used much more heavily and much more frequently for very long distance, multi-leg journeys (>100miles per leg of the journey).
Given that around half of new cars are sold to fleets, but quickly sold on to private owners, which we discussed previously, this creates a significant hurdle for introducing vehicles into the parc. This is especially so for pure battery electric vehicles, where sufficient battery capacity is needed for the very long distance trips while in the business use stage of the car’s lifecycle, even though it may be excessive for the private use stage.
To minimise cost to society, the vehicle energy store and energy system design need to be optimised for whole car lifecycles.
Business cars travel twice as far and are used for many more long distance trips than private cars
Demanding business requirements creates a lifecycle hurdle for later private use
Figure 16: Trade-off of Plug-in Vehicle Electric Range Against Vehicle Age[18]
Figure 17: Average Annual Mileage for Private and Company Cars[18]
Figure 18: Distribution of Trip Lengths (Per Leg of a Journey) for Private and Company Cars[18]
Prop
orti
on o
f mile
age
com
plet
ed in
ele
ctric
mod
e
Vehicle battery size (electric range in miles)
0% 10 20 30 40 50 60 70 80 90 100 110 120
20%
40%
60%
80%
100%
All vehicles age groups
Vehicles less than 3 years old
Vehicles 2 to 10 years old
Vehicles over 8 years old
Fewer miles in electric mode in earliest years offset by more miles in later years
Alternatively, the battery can degrade without impacting on mileage in electric mode
Design target – average of cars’ lifecycle
All cars
Annual mileage (miles)0 5,000 10,000 15,000
Cars used for company business (regardless of ownership)
Cars only used for private activites (including commuting)
<5 miles
<10 miles
<25 miles
<100 miles
>100 miles
Proportion of journeys
Trip
leng
th
(per
leg
of jo
urne
y)
0% 10% 20% 30% 40% 50% 60% 70%
Cars only used for private activites (including commuting)
Cars used for company business (regardless of ownership)

27 Chapter 2 Energy Technologies Institute www.eti.co.uk
Cars that travel low mileages vs. high mileages: The NTS data reveals there are a significant proportion of UK cars that have a low annual mileage (<5,000 miles per year) in every vehicle age band. This is particularly true of smaller cars. This suggests low annual mileage cars could be a unique vehicle segment (presently around 17%). This creates a potential opportunity for vehicle types that may be less robust to heavy use.
However, the NTS data also reveals that even low annual mileage cars make long distance trips occasionally during the year.
The data can be segmented in many ways, but there does not appear to be a significant segment which only ever travels short distances. There is always likely to be a niche in this category, but we do not see it as a significant segment affecting energy system design. This is likely to continue to be the case and the energy system design will need to support the vast majority of vehicles making some long-distance trips.
Cars located in urban / suburban / rural home locations: The purpose of journeys varies very little between urban and rural locations. Rural based cars do tend to have a higher annual mileage, but this difference is accounted for by a skew in shorter journeys (those under 50 miles). Medium- and long-range plug-in hybrid electric vehicles14 would have a similar performance for both urban and rural owners’ needs. Short-range14 plug-in hybrid electric vehicles may achieve a lower proportion of their mileage in electric mode for rural based owners. However, the total energy consumption is likely to be noticeably higher for rural based cars.
The underlying cause of rural based cars having a higher annual mileage is the distance to local amenities. It is consequently likely to continue, but has little impact on energy system design other than total consumption.
It is quite possible that, with increasing investments in public transport, other large urban centres of the country will follow the path of London and see a greater shift away from the car in favour of light rail, trams and buses. Any reduction in car use in those urban centres will not reduce the dependence of rural communities and smaller towns on the car.
It will be critical for the energy system and associated government policies to maintain equity between rural and urban communities.
Even low annual mileage cars are used for occasional long distance travel
Figure 19: Round-trip Distances (Multi-leg) for Low, Medium and High Annual Mileage Cars[18]
14 Figure 28 in Chapter 2-5 defines these plug-in hybrid electric vehicle types
<25 miles
<50 miles
<100 miles
<150 miles
<200 miles
>200 miles
Proportion of mileage within each mileage band
Roun
d-tr
ip d
ista
nce
from
hom
e
0% 10% 20% 30% 40% 50% 60% 70%
Cars with an annual mileage above 10k miles
Cars with an annual mileage between 5k and 10k miles
Cars with an annual mileage below 5k miles

28 Chapter 2 Energy Technologies Institute www.eti.co.uk
Aggregate daily car use varies by +/– 20%, but an individual’s daily car use is very difficult to predict
Figure 20: Distribution of Journey Lengths for Urban and Rural Based Cars[18]
Figure 21: Variation in Daily Travel Demand through the Year[18]
Variation in driving travel between days: The overall number of miles travelled at the weekend is lower than on a weekday. The highest aggregate travel demand is on a Friday. Energy consumption is therefore higher during the week. This is unlikely to be sufficiently significant to fundamentally affect energy system design, but the system will need to remain tolerant to larger energy demand on some days of the week than others. Of more significance to the energy system is the fact that people have a greater tendency to refuel their vehicle on certain days of the week. This peak in demand is currently easily managed by the large storage and throughput capacity of modern refuelling stations.
While aggregate UK travel doesn’t vary that much between days, the data does show how variable an individuals’ travel patterns can be from one day to the next. Some journeys are quite predictable, e.g. commuting, while other journeys are far more difficult to extract patterns in individual behaviour. This presents a significant challenge for any automated energy demand management system.
Seasonal variation in travel: There is a significant increase in longer distance trips during the summer months. This has potentially significant implications for energy system design to allow sufficient peak capacity for more long distance travel in summer. We will explore this in more detail in the next chapter. The tendency for longer trips in the summer months is primarily a result of private users taking day trips and holidays. This variation in car use during the year is very likely to continue and may grow with increasing affluence.
<5 miles
<10 miles
<25 miles
<50 miles
>50 miles
Proportion of trips within area group
Trip
leng
th(P
er le
g of
jour
ney)
0% 10% 20% 30% 40% 50% 60% 70%
Rural based cars
Semi-urban based cars
Urban based cars
0.70.80.911.11.21.3
Mul
tipl
ier
(ave
rage
day
= 1
)
Janu
ary
Febr
uary
Mar
ch
Apr
il
May
June July
Aug
ust
Sept
embe
r
Oct
ober
Nov
embe
r
Dec
embe
r
Daily travel demand [2010 traffi c statistics] (average day = 1)
29 Chapter 2 Energy Technologies Institute www.eti.co.uk
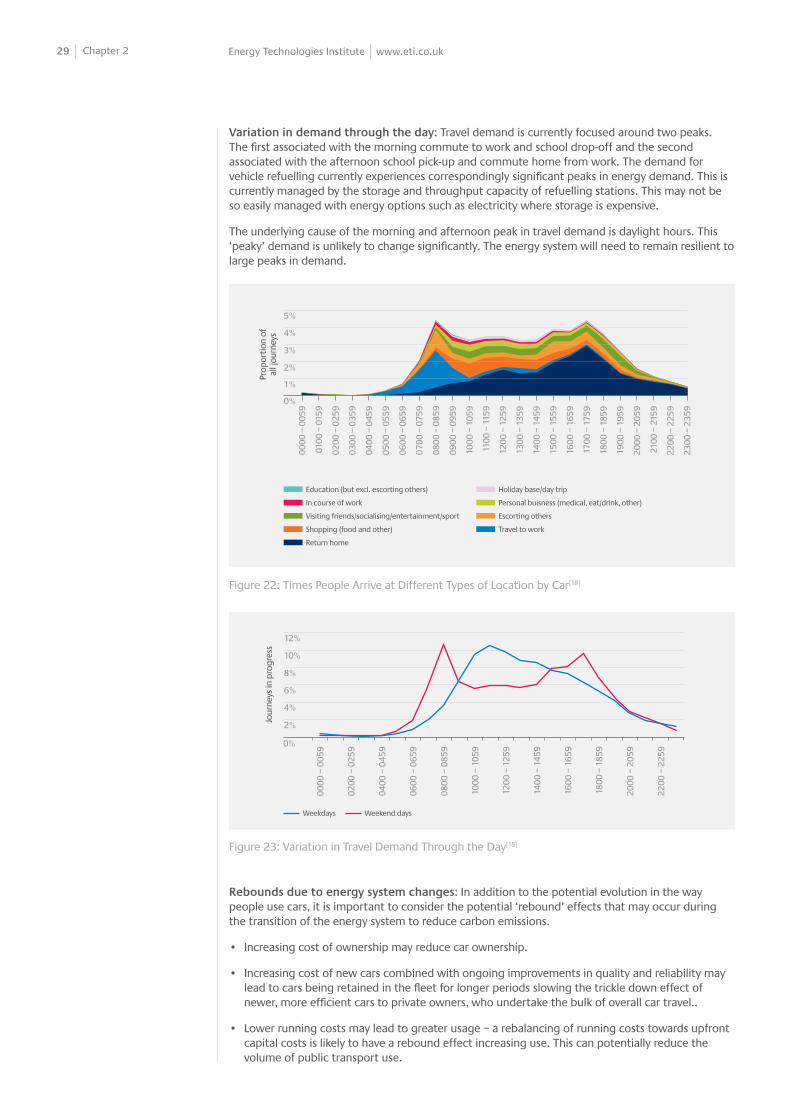
Variation in demand through the day: Travel demand is currently focused around two peaks. The first associated with the morning commute to work and school drop-off and the second associated with the afternoon school pick-up and commute home from work. The demand for vehicle refuelling currently experiences correspondingly significant peaks in energy demand. This is currently managed by the storage and throughput capacity of refuelling stations. This may not be so easily managed with energy options such as electricity where storage is expensive.
The underlying cause of the morning and afternoon peak in travel demand is daylight hours. This ‘peaky’ demand is unlikely to change significantly. The energy system will need to remain resilient to large peaks in demand.
Rebounds due to energy system changes: In addition to the potential evolution in the way people use cars, it is important to consider the potential ‘rebound’ effects that may occur during the transition of the energy system to reduce carbon emissions.
• Increasing cost of ownership may reduce car ownership.
• Increasing cost of new cars combined with ongoing improvements in quality and reliability may lead to cars being retained in the fleet for longer periods slowing the trickle down effect of newer, more efficient cars to private owners, who undertake the bulk of overall car travel..
• Lower running costs may lead to greater usage – a rebalancing of running costs towards upfront capital costs is likely to have a rebound effect increasing use. This can potentially reduce the volume of public transport use.
Figure 22: Times People Arrive at Different Types of Location by Car[18]
Figure 23: Variation in Travel Demand Through the Day[18]
Prop
orti
on o
fal
l jou
rney
s
0000
– 0
059
0700
– 0
759
1400
– 1
459
0100
– 0
159
0800
– 0
859
1500
– 1
559
0200
– 0
259
0900
– 0
959
1600
– 1
659
0300
– 0
359
1000
– 1
059
1700
– 1
759
0400
– 0
459
1100
– 1
159
1800
– 1
859
2100
– 2
159
0500
– 0
559
1200
– 1
259
1900
– 1
959
2200
– 2
259
0600
– 0
659
1300
– 1
359
2000
– 2
059
2300
– 2
359
1%
0%
2%
3%
4%
5%
Holiday base/day trip
Personal buisness (medical, eat/drink, other)
Escorting others
Travel to work
Education (but excl. escorting others)
In course of work
Visiting friends/socialising/entertainment/sport
Shopping (food and other)
Return home
0%
2%
4%
8%
6%
10%
12%
Jour
neys
in p
rogr
ess
Weekdays Weekend days
0000
– 0
059
1400
– 1
459
0800
– 0
859
0200
– 0
259
1600
– 1
659
1000
– 1
059
0400
– 0
459
1800
– 1
859
1200
– 1
259
2200
– 2
259
0600
– 0
659
2000
– 2
059

30 Chapter 2 Energy Technologies Institute www.eti.co.uk
2-3: How are light commercial vehicles bought and used?
The ownership and use of light commercial vehicles is in many ways similar to passenger cars – a heavily segmented market of buyers, changing ownership and requirements through the vehicle lifecycle and very diverse travel patterns.
Light commercial vehicles are a relatively small share of energy consumption in light vehicles. However, it has been growing at a faster rate than passenger cars and is likely to continue to do so as internet shopping and home grocery delivery become ever more popular.
Unlike for the passenger car sector, there is very limited data on the market structure, its segmentation or the usage patterns. A more in-depth study of light commercial vehicle ownership and use would be beneficial, particularly given the potential for its share of light vehicle energy consumption to grow from its relatively small share today.
However, some broad conclusions can be drawn at this stage to inform energy system design[19]:
• There are multiple size categories for light commercial vehicles: car derived vans, small vans and large vans.
• There are numerous ownership and use segments. For example:
° Local delivery vehicles: Individual journeys are short, but are made back-to-back with very short breaks between. Journey requirements are more likely to be predictable, with the potential to specify the maximum range requirement at the time of purchase. Most vehicles are likely to be bought new.
° Construction vehicles: Journeys are likely to be very diverse, with some long distance journeys and many shorter distance journeys. The journey requirements are likely to be difficult to predict at the time of purchase. Vehicles are likely to be bought new by large companies. Many self employed or small size building firms are likely to purchase vehicles second hand.
° Rental vehicles: Journeys are almost impossible to predict. There is a requirement for most vehicles to travel very long distances. Vehicles are likely to be almost entirely bought from new, but sold on quickly due to heavy wear and tear.
° Specialist vehicles: Light commercial vehicles are bought for a multitude of specialist tasks. The journey requirements for many of these vehicles will be well understood at the time of purchase, and are likely to be very diverse.
• There are three types of buyer: (1) major fleet buyers of new vehicles; (2) independent buyers of new vehicles; and (3) independent buyers of second hand vehicles.
• Arguably, the light commercial vehicle sector is more economically ‘rational’ than for the passenger car sector. Decisions are likely to be more heavily influenced by instrumental factors than affective and symbolic motivations.
• The majority of the market is served by just a few vehicle manufacturers (Ford and Vauxhall dominate in the UK), with the remainder made up of a very diverse mix of niche providers.
Light commercial vehicles are likely to be increasingly important
Existing data on light commercial vehicle use is limited; enhanced data in DfT statistics would be very valuable
Travel patterns for most light commercial vehicles are likely to be at least as demanding as for large cars
2-4: What is driving automotive industry change?
EU Emissions legislation has proved to be a very effective mechanism for driving automotive industry change. The collective effect of current policies has an impact on vehicle manufacturer product strategies of well over £1,000 per tonne CO2.
Since the 1970’s oil crises, most major nations have sought to improve the efficiency of vehicles through policy. The recognition of air quality issues associated with cars and the availability of technology to reduce such pollution has led to similar legislation across nations to reduce other pollutant emissions. In very recent years, this legislation has become much more stringent in Europe, Japan and the USA.

31 Chapter 2 Energy Technologies Institute www.eti.co.uk
The current EU policy landscape is placing a significant emphasis on low carbon vehicles with minimal air quality impacts.
EU emissions regulation for passenger cars[20] and light commercial vehicles[21] has been very successful. This is in conjunction with similar global legislation in the US and Japan in driving automotive industry change . Other policy measures are less effective, due to limited confidence in their long-term existence (such as vehicle subsidies), their treatment as revenue raising measures as opposed to explicit carbon taxes (such as fuel duty) or due to their scale being too small (such as exemption from London congestion charging).
Long-term certainty of the policy landscape is critical, given the long timeframes for vehicle development and production.
[23]
The characteristics of specific policies have a profound effect on the development of vehicle manufacturer product strategies, which may not be related to the lowest cost route to carbon reduction. EU CO2 emissions legislation[20] [21] [15], as an example, has three key features fundamentally affecting outcomes:
• The exclusion of emissions from electricity generation, hydrogen production or liquid fuel production.
Consequently, electricity and hydrogen fuelled vehicles are implied to have a much larger carbon reduction than will be the case until the electricity grid is decarbonised and sources of carbon neutral hydrogen are available – both of which are unlikely until the late 2020s.
Similarly, there is no recognition of the positive role bio-fuels can play in reducing the carbon intensity of liquid fuels. Vehicle manufacturers are not presently incentivised to produce or promote their vehicles as ‘bio-fuel compatible’.
The current policy landscape is driving significant automotive industry change
It is important policies take a whole lifecycle approach and measure pollutants in close to real-world conditions
New technology research and development
Development and production from demonstrated technologies (~5 years)
Commitment to manufacture (5++ years)
15 EU CO2 emissions legislation imposes a penalty on vehicle manufacturers if the average emissions of all the vehicles they sell (on a g/km basis) exceeds a fixed target. The penalty is €95 x the number of vehicles sold x the excess emissions above the target. Given the large volume of vehicles sold within Europe, the penalty can quickly reach the multi-billion Euro level.
• The use of a standardised drive cycle which is a simplified representation of real-world driving patterns and excludes the use of ancillary heating, cooling, lighting and other equipment.
As a specific example, the oversimplification of the regulated drive cycle (the New European Drive Cycle [NEDC]) has led to particularly large deviations between theoretical and real-world NOx emissions for diesel passenger cars. Gasoline passenger cars, however, appear to perform much more closely to the regulatory limits under real-world operation[15].
Due to increasing dieselisation of passenger cars, the dramatic real-world improvements in gasoline NOx emissions have been largely offset by more diesel cars in the parc.

32 Chapter 2 Energy Technologies Institute www.eti.co.uk
• All vehicles are treated equally – vehicle weight being the only thing affecting the CO2 emissions target. This omits the differing usage patterns of different vehicle types/sizes and resulting differences in emissions.
Large cars travel higher mileages than small cars[18] so a greater overall carbon reduction is achieved from a given percentage efficiency improvement in a large car than a small car.
2-5: How is the UK vehicle market shaped by global products?
The UK is too small a market to demand unique mass-market vehicle designs. The product portfolio available in the UK is dependent on decisions taken globally. Global legislation is however driving change; the Automotive Council has a consensus plan.
The vehicle market has become increasingly global over the past few decades, with broadly the same products and platform technologies being available across the world. This is partly a reflection of the large costs of developing and bringing a new vehicle platform into production. This means the UK is dependent on similar legislative environments around the world driving automotive industry change.
In 2009, the UK’s Automotive Council developed an industry consensus roadmap on a portfolio of vehicle technologies to meet the challenge of these increasingly demanding legislative targets. The core themes of the Automotive Council technology roadmap are:
• Efficiency – hybridisation, light-weighting, enhanced aerodynamics, improved engines and power-train
• Bio-fuels
• Electrification – pure electric and plug-in hybrid electric vehicles
• Hydrogen fuel cell and internal combustion engine vehicles
Figure 24: Real-world NOx Emissions vs. Regulatory NEDC Emissions[15]
0
0.5
1
2
1.5
2.5
3
Emissions target
Euro 0 Euro 2Euro 1 Euro 3 Euro 4 Euro 5
Petrol car NOx emissions
Diesel car NOx emissions
Real-world measured value
NEDC regulatory value
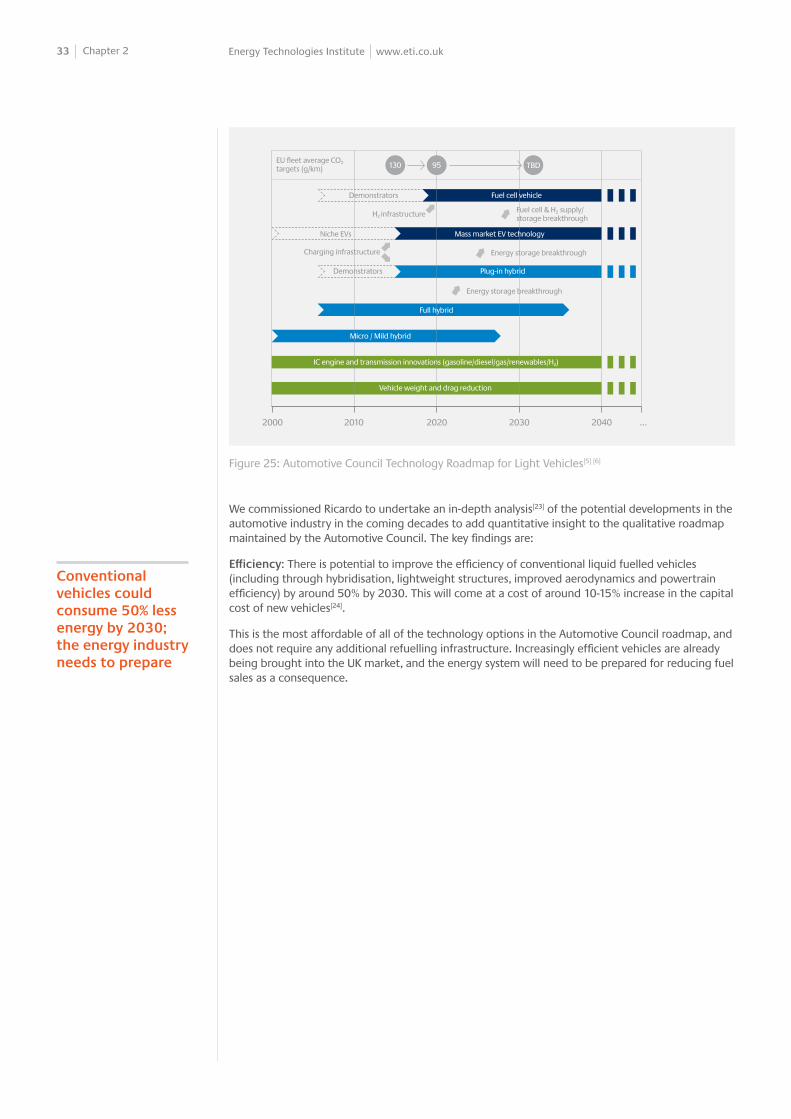
33 Chapter 2 Energy Technologies Institute www.eti.co.uk
We commissioned Ricardo to undertake an in-depth analysis[23] of the potential developments in the automotive industry in the coming decades to add quantitative insight to the qualitative roadmap maintained by the Automotive Council. The key findings are:
Efficiency: There is potential to improve the efficiency of conventional liquid fuelled vehicles (including through hybridisation, lightweight structures, improved aerodynamics and powertrain efficiency) by around 50% by 2030. This will come at a cost of around 10-15% increase in the capital cost of new vehicles[24].
This is the most affordable of all of the technology options in the Automotive Council roadmap, and does not require any additional refuelling infrastructure. Increasingly efficient vehicles are already being brought into the UK market, and the energy system will need to be prepared for reducing fuel sales as a consequence.
Figure 25: Automotive Council Technology Roadmap for Light Vehicles[5] [6]
Conventional vehicles could consume 50% less energy by 2030; the energy industry needs to prepare
2000 2010 2020 2030 2040 ...
Vehicle weight and drag reduction
IC engine and transmission innovations (gasoline/diesel/gas/renewables/H2)
Micro / Mild hybrid
Full hybrid
Plug-in hybridDemonstrators
Demonstrators
Niche EVs Mass market EV technology
Fuel cell vehicle
Energy storage breakthrough
Energy storage breakthrough
Fuel cell & H2 supply/storage breakthrough
Charging infrastructure
H2 infrastructure
EU fl eet average CO2 targets (g/km) 130 95 TBD

34 Chapter 2 Energy Technologies Institute www.eti.co.uk
Figure 26: Efficiency Potential of Future Light Vehicles[23] 16
16 The NEDC is known to underestimate energy consumption, so the data used in the modelling work presented later in this report has been calibrated appropriately
17 Bio-fuels generally have less energy per litre than fossil fuel, so the percentage energy share will be below 7% / 10%
Bio-fuels: Bio-fuels can be incorporated into existing conventional vehicle designs with relative ease and a very low cost. Some materials need to be changed to achieve compatibility (e.g. fuel lines) and some other adjustments may be needed, for which there are additional vehicle-side costs (in the order of £10s).
The regulations on the automotive industry in Europe currently do not transfer any benefits to vehicle manufacturers for incorporating the extra costs for compatibility. Consequently, bio-fuel in the UK is currently limited to a blend of 7% of the volume of diesel and 10% of the volume of gasoline17.
Electrification: Electrification, through either pure electric vehicles and/or plug-in hybrid electric vehicles, is a more expensive vehicle technology. The primary cost drivers are the battery and motor components[24].
Plug-in hybrid electric vehicles could satisfy much of a vehicles usage in electric mode, with the liquid fuel mode providing for the longer distance uses as required.
Our analysis of the UK National Travel Survey shows that a mid size vehicle with a 40-50 mile range (a little more than the currently sold GM Volt / Vauxhall Ampera, for example) and just a single 3kW home recharging point could complete around 75% of its mileage in electric mode[18]. Plug-in hybrid electric vehicles are therefore an evolutionary technology, with limited dependence on major upfront capital investment for infrastructure.
Bio-fuels could be incrementally added, if vehicles were compatible; but there is currently no incentive for manufacturers
40
20
0
2010
2013
2016
2019
2022
2025
2028
2031
2034
2037
2040
2043
2046
2049
60
80
100
120
140
160
Tank
-to-
whe
el C
O2 e
mis
sion
s (g
/km
)[NED
C te
st c
ycle
]
Example for a typical category C car (e.g. VW Golf)
‘Standard’ drive-train
Full hybrid drive-train
Increasing hybridisation
Gasoline fuelled
Diesel fuelled

35 Chapter 2 Energy Technologies Institute www.eti.co.uk
For the purposes of developing the energy infrastructure requirements to meet UK energy and climate change goals, three different electric ranges for plug-in vehicles have been defined for small, medium and large cars. These are shown in the table below. For example, reading from the chart above: for a medium sized plug-in hybrid electric vehicle to complete 75% of its mileage in electric mode, it would require an electric range of 45 miles.
18 The NEDC calculation (Regulation No. 101 of the Economic Commission for Europe of the United Nations) has an assumed average distance travelled between recharging (25km) for all vehicle size categories.
Figure 27: Trade-off between Range and Electric Mode Usage for a Plug-in Vehicle[18] 18
Figure 28: PHEV Range Definitions
Plug-in hybrid electric vehicles are highly likely to feature in the future, and the energy industry needs to prepare
0%10
Prop
orti
on o
f mile
age
com
plet
ed in
ele
ctric
mod
e
Vehicle battery size (electric range in miles)
PHEV range extender kicks-in (indicates there are journeys that can’t be completed in a BEV)
20 30 40 50 60 70 80 90 100 110 120
20%
40%
60%
80%
100%
All vehicle sizes
Small sized vehicles
Small-medium sized vehicles
Medium sized vehicles
Large sized vehicles
NEDC (regulatory calculation)
Short range 50% to electric
Vehicle electric range (for current UK travel patterns)
Medium range
75% to electric
85% to electricLong range
Target Small car
10 miles
35 miles
55 miles
15 miles
45 miles
80 miles
25 miles
65 miles
115 miles
Large carMedium car

36 Chapter 2 Energy Technologies Institute www.eti.co.uk
For pure battery electric vehicles, range is a significant issue. There is no discernible car usage segment which only ever travels short distances – but there will be a small niche. Therefore, for pure battery electric vehicles to go beyond a niche proposition and compete with the other options, a sufficient ‘useful’ range19 for at least two hours of high speed motorway driving (on a very cold and wet winter night) will need to be achieved, in addition to a capability to replenish the vehicle energy store quickly when away from the home or depot.
It is not currently evident this capability can be achieved from affordable pure electric vehicles by 2050. We will explore in greater detail later, but it is not evident that it is necessary either in order to meet UK energy and climate change targets.
However, there is a high probability pure battery electric vehicles will be available from manufacturers (if only as a derivative option of a plug-in hybrid electric vehicle) and there will be a niche of interested consumers. The energy system therefore needs to be flexible to a future ‘upgrading’ of plug-in hybrid electric vehicles to pure battery electric vehicles.
While costs for electrification are significant, they are expected to reduce. The costs of conventional vehicles are expected to increase as efficiency technologies are added. Consequently, electrification is likely to become cost competitive over time.
It is not evident pure battery electric vehicles can provide the capability needed or are necessary to meet the UK 2050 energy and climate change goals
Hydrogen is potentially an important technology, but its risks need to be reduced
19 The rate of energy consumption of electric vehicles is increased at cruising speed and with ancillaries such as heating, air conditioning and lighting turned on. The ‘useful’ range is the achievable range under the worst case driving conditions.
20 Costs for pure electric vehicles are not shown, since they depend on the desired vehicle range (hence battery size). For a ‘useful’ range to meet most users’ needs, the costs are expected to be significantly higher than for a plug-in hybrid vehicle.
Figure 29: Cost of Future Vehicles – Illustrative Data presented for a Medium Sized Vehicle (e.g. a VW Golf)[24] 20
Hydrogen: Hydrogen fuelled vehicles are the highest risk technology within the Automotive Council roadmap, with significant risks to both vehicle and infrastructure costs. Risks are especially difficult to manage for the energy industry given the need for upfront investment and the dependence on future vehicle sales.
Hydrogen vehicles could come in the form of Internal Combustion Engines (ICEs) or Fuel Cells. A number of vehicle demonstrators have been built, showing technical feasibility[25], but there remains very significant uncertainty on hydrogen storage costs and fuel cell costs. A number of infrastructure trials have also been run, again demonstrating technical feasibility[26], but the costs for deployment (and the resulting fuel price) remain highly uncertain.
There are also significant energy system cost and technical feasibility uncertainties, which are discussed later in this report.
Although not explicitly part of the Automotive Council roadmap, hydrogen range extended electric vehicles (replacing the liquid fuel engine with a hydrogen powered one) are an option but would require an electricity and hydrogen combination infrastructure.
2015
2025
2035
2050
2015
2025
2035
2050
2015
2025
2035
2050
2015
2025
2035
2050
$15k
$10k
2015
2015
2015
2025
2025
2025
2035
2035
2035
2050
2050
2050
Mas
s pr
oduc
ed v
ehic
le p
urch
ase
Cos
t (e
xcl.
taxe
s, s
ubsi
dies
, etc
)
Short range PHEV
Medium range PHEV
Long range PHEV
ConventionalICE
ConventionalICE hybrid
$20k
$25k
$30k
$35k
$40k
$45k
Upper estimate
Most likely estimate
Lower estimate
Fuel cell Hydrogen ICE

37 Chapter 3 Energy Technologies Institute www.eti.co.uk
3-1: What is the current energy infrastructure for light vehicles?
The UK’s liquid fuel infrastructure that dominates the energy system for light vehicles would cost up to £100bn and take decades to replace. But the landscape is changing; domestic oil supplies are dwindling and refineries are suboptimal for current demand.
The key components of the energy infrastructure for light vehicles are:
• Crude oil exploration and production
• Crude oil distribution (pipelines, tankers, export/import terminals)
• Crude oil storage
• Refineries for converting crude oil into petroleum products
• Petrochemical co-products facilities, using refinery by-products
• Product distribution (pipelines, regional terminals, road tankers)
• Petroleum product storage (generally within refineries, refuelling stations, terminals, etc rather than a separate part of the system)
• Refuelling stations
The energy infrastructure for light vehicles is interdependent with the energy infrastructure for heavy duty vehicles and aviation, as well as the petrochemicals industry.
UK passenger cars are almost entirely fuelled by gasoline or diesel fuels. The balance has been shifting in recent years. As efficiency becomes increasingly important, there has been a tendency for people to buy more diesel cars[3]. Light commercial vehicles are mostly fuelled by diesel.
Until 2005, the UK had been a net exporter of crude oil since the 1970s. This landscape is changing, and the UK is now a net importer of crude oil. This trend is unlikely to be reversed, so the UK is increasingly susceptible to the energy security risks of the global market. For various operational and economic reasons the UK still exports a significant volume of crude oil and imports the equivalent quantity from elsewhere in return.
Chapter 3 Energy Infrastructure Design Considerations
Since 2005, the UK has been a net importer of crude oil
20%
2001 2004 2007 2010
40%
60%
80%
100%
Gasoline cars in UK Pac
Diesel cars in UK Parc
[3]
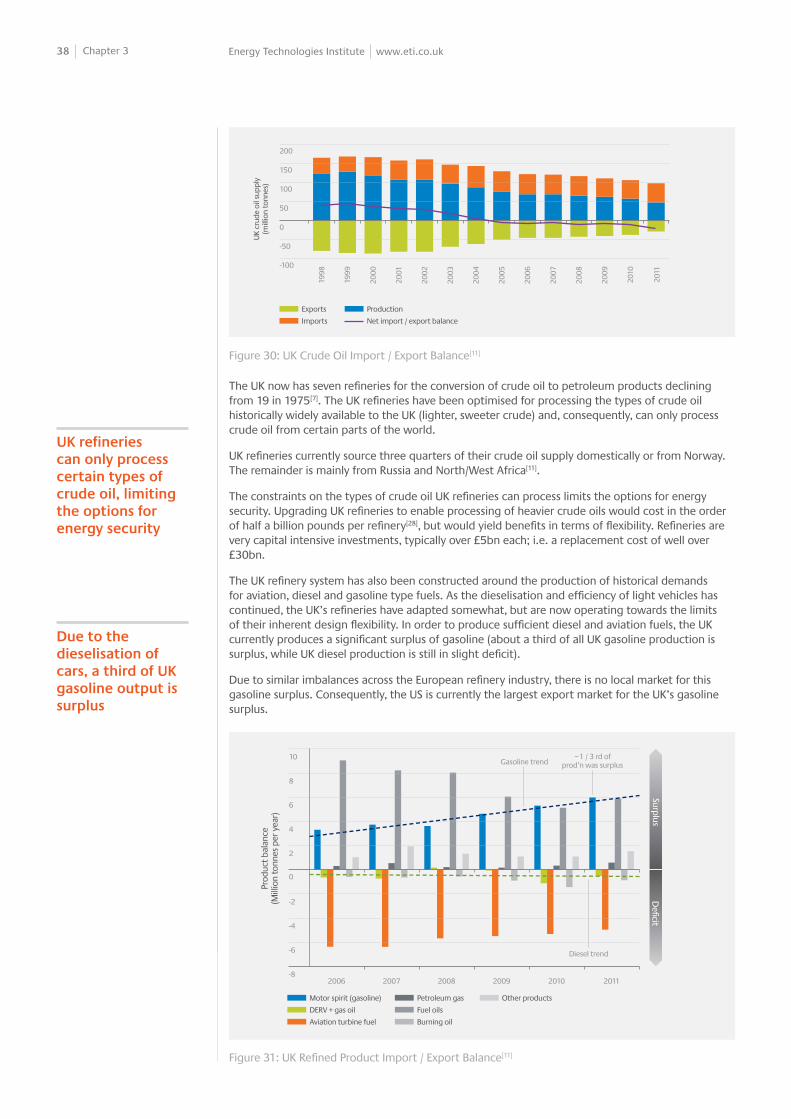
38 Chapter 3 Energy Technologies Institute www.eti.co.uk
The UK now has seven refineries for the conversion of crude oil to petroleum products declining from 19 in 1975[7]. The UK refineries have been optimised for processing the types of crude oil historically widely available to the UK (lighter, sweeter crude) and, consequently, can only process crude oil from certain parts of the world.
UK refineries currently source three quarters of their crude oil supply domestically or from Norway. The remainder is mainly from Russia and North/West Africa[11].
The constraints on the types of crude oil UK refineries can process limits the options for energy security. Upgrading UK refineries to enable processing of heavier crude oils would cost in the order of half a billion pounds per refinery[28], but would yield benefits in terms of flexibility. Refineries are very capital intensive investments, typically over £5bn each; i.e. a replacement cost of well over £30bn.
The UK refinery system has also been constructed around the production of historical demands for aviation, diesel and gasoline type fuels. As the dieselisation and efficiency of light vehicles has continued, the UK’s refineries have adapted somewhat, but are now operating towards the limits of their inherent design flexibility. In order to produce sufficient diesel and aviation fuels, the UK currently produces a significant surplus of gasoline (about a third of all UK gasoline production is surplus, while UK diesel production is still in slight deficit).
Due to similar imbalances across the European refinery industry, there is no local market for this gasoline surplus. Consequently, the US is currently the largest export market for the UK’s gasoline surplus.
UK refineries can only process certain types of crude oil, limiting the options for energy security
Due to the dieselisation of cars, a third of UK gasoline output is surplus
Figure 30: UK Crude Oil Import / Export Balance[11]
Figure 31: UK Refined Product Import / Export Balance[11]
-50
-100
1998
1999
2003
2009
2001
2007
2005
2011
2000
2004
2010
2002
2008
2006
UK
crud
e oi
l sup
ply
(mill
ion
tonn
es)
0
50
100
150
200
Exports
Imports
Production
Net import / export balance
2006 20092007 20102008
Diesel trend
Gasoline trend ~1 / 3 rd of prod’n was surplus
2011
Prod
uct
bala
nce
(Mill
ion
tonn
es p
er y
ear)
0
2
-8
4
-6
6
-4
8
-2
10
Motor spirit (gasoline)
DERV + gas oil
Aviation turbine fuel
Petroleum gas
Fuel oils
Burning oil
Other products
Defi cit
Surplus

39 Chapter 3 Energy Technologies Institute www.eti.co.uk
In addition to producing transport fuels, refineries also produce essential petrochemical products from specific fractions of the crude slate – fractions generally not suitable for direct use as transport fuels. This includes solvents, lubricants, bitumen, feedstock for plastics, feedstock for paints, etc. If transport fuel consumption is reduced, the knock-on impact on the petrochemicals industry will need to be evaluated and mitigated. It is currently unclear how such issues can be managed.
Storage is an essential part of the transport energy infrastructure, partly for reasons of energy security and partly for reasons of managing the variations in demand through the system.
Refineries and import terminals provide a significant amount of storage for crude oil and refined products, in addition to a number of dedicated storage terminals. This provides 62.5 days of storage capacity for the UK – a requirement as a member of the International Energy Agency. This would be 90 days if the UK had no domestic oil production.
The seven refineries in the UK are distributed around the coast (for access to import terminals) and are also supported by additional coastal terminals for the receipt of imported refined products. From these refineries and import terminals, a network of around 50 major inland oil distribution terminals[27] is supplied by 3,000 miles of pipeline (51% of the volume), rail (15%) and sea (34%)[7]. Some fuels are piped directly to large users, like airports.
The distribution of refineries around the coast limits the extent of the required pipeline network. There is little requirement for transporting fuels from one side of the UK to the other. However, this set up also means there is limited redundancy within the system. Failures of the supply system have occasionally occurred (following the Buncefield accident, for example), but local storage capacity provides some resilience.
From regional distribution terminals, the final stage of the journey is generally completed by road tanker, with each vehicle typically transporting around 30,000 litres.
Petrochemicals are now an essential by-product of transport fuel production
Storage of crude oil and refined products is critical to security
Bulk movement of fuels is by pipeline, rail and sea; road tankers are generally only used for local distribution
Figure 32: Uses of Refined Petroleum Products[11]
Mot
or s
pirit
DER
V
Gas
oil
Avia
tion
tu
rbin
e fu
el
Fuel
oils
Petr
oleu
m
gase
s
Burn
ing
oil
Oth
er
prod
ucts
2011
Dom
esti
c co
nsum
ptio
n (m
illio
ns o
f ton
nes) 20
25
-
5
10
15
Other
Energy industry use
Industrial use
Transport

40 Chapter 3 Energy Technologies Institute www.eti.co.uk
In terms of refuelling infrastructure, the UK has a network of 8,700 refuelling stations. Each station distributes an average of nearly five million litres of fuel per year[29]. The storage capacity varies, but a typical high throughput refuelling station will have four to five days of storage capacity at the normal rate of consumption. Each refuelling pump can typically deliver 5-15MW. A modern high throughput refuelling station typically costs around £2m[29]; placing the cost well over £10bn to replace the current network.
Figure 33: Number of Refuelling Stations and Their Throughput[29]
3-2: What is important in designing future liquid fuel infrastructures?
In a declining market, billions of pounds needs to be invested in UK liquid fuel infrastructure to increase storage, enable the processing of heavier crude oil, maximise aviation and diesel fuel and minimise gasoline fuel outputs from refineries ensuring compatibility through the chain with high proportions of bio-fuel in the liquid fuel mix.
Optimum utilisation of the crude oil fractions: One of the most important features in designing any future liquid fuel system is to ensure the different petroleum products are in balance with the bounds of flexibility provided by refineries and the fundamental constraints of the particular type of crude oil supply. In a world of increasing efficiency and alternative fuels in the light vehicle sector, there will be a number of knock-on impacts on the liquid fuel industry.
Aviation continues to be the fastest growing mode of transport. Aviation consumes only certain fractions of the crude slate leaving other fractions to find alternative uses.
1997
9000
8000
2.5
2.0
3.0
3.5
4.0
4.5
5.0
10000
11000
12000
13000
14000
15000
16000
1998
1999
2000
2001
2002
2003
2004
2005
2006
2007
2008
2009
2010
2011
Num
ber o
f ref
uelli
ng
stat
ion
site
s
Aver
age
site
thro
ughp
ut
(mill
ion
litre
s pe
r yea
r)
Number of refuelling station sites
Av. site throughput (millions litres per year)
Grangemouth
Humber
Lindsey
FawleyPembroke
Milford Haven
Stanlow
[27]

41 Chapter 3 Energy Technologies Institute www.eti.co.uk
Bio-fuels in the aviation sector may help to supplement fossil fuels, but it is unlikely that bio-fuels can feasibly replace aviation fuels entirely. Bio-fuel use in the aviation sector is even more challenging than for the land transport sector:
• Due to international treaties there is no tax in aviation fuel. This generally hinders financial viability.
• The fuel quality and safety standards required for aviation fuels are necessarily very stringent, which causes additional cost for the processing of bio-fuels for aviation use.
Heavy duty vehicles (off-road and on-road) generally require less volatile fractions of crude oil, partly for safety reasons and partly for reasons of efficient combustion in a compression ignition engine.
In addition to efficiency, it is possible that two future developments may reduce the demand for crude oil based fuels for heavy duty vehicle applications – bio-fuels and the use of natural gas.
However, the constraints on sustainable feedstock availability for diesel type bio-fuel appear to be more challenging than for gasoline type bio-fuel. Bio-fuels are unlikely to be sufficient to entirely replace fossil based diesel and natural gas will only be suitable for some applications.
As a result of aviation and diesel fuel demand, there is likely to remain a significant supply of lighter fractions of crude oil (gasoline, LPG, etc) and heavier fractions (fuel oils, etc). Historically, these have been put to use in other sectors of the economy.
While technically possible, it is not currently evident that the lighter fractions of crude oil could affordably be converted to fuels suitable for aviation or heavy duty vehicle use. Combining lighter molecules into heavy molecules is very energy intensive.
It is however more feasible to break-down the heavier fractions of crude oil. Fuel oil may be upgraded to diesel instead of being used for electricity generation, for example. The investment per refinery is significant -estimated at ~£500m per refinery[28].
Flexibility for processing different crude oil types: As the UK becomes increasingly dependent on imported crude oil, the value of flexibility in the types of crude oils UK refineries can process increases. There may therefore be value in upgrading UK refineries to enable processing of heavier, sourer crude oil supplies.
Crude oil and refined product storage capacity: As UK domestic oil production reduces, the importance of storage to UK energy security will increase. Investment in additional storage capacity may be prudent.
Maintaining sufficient refuelling infrastructure: The UK distribution and refuelling infrastructure will require a similar level of coverage to that provided by the current system. Especially if some level of local competition is to be maintained in the retailing of fuels and some level of redundancy is to be maintained in the pipeline network to avoid catastrophic single-point failure risks.
However, as liquid fuel consumption falls, the capital and operating cost of refuelling and distribution infrastructure becomes a more significant proportion of the cost of retail fuels. It will be decreasingly affordable to provide refuelling infrastructure as widely available as it is today. This will affect system resilience – the ease with which people can access energy and the level of local competition. This is especially significant for rural areas (some refuelling stations in rural Scotland already require subsidy).
‘Dual fuel’ vehicle solutions like plug-in hybrid electric vehicles offer potential resilience – for example, if electricity capacity is low due to periods of extreme cold weather and/or low wind power availability.
Balancing the use of petroleum products is critical to cost effective energy
Research is needed into the best use of the different fractions of crude oil in a low carbon world
Research is needed into the value of improving energy security through refinery flexibility and storage
Maintaining sufficient retail fuel infrastructure will be a challenge, especially in rural areas
The peak system capacity for liquid fuels may need to be sustained, even though average usage will plummet

42 Chapter 3 Energy Technologies Institute www.eti.co.uk
For the resilience to exist this requires that sufficient peak capacity is available in the liquid fuel infrastructure. It is quite possible that the peak capacity of the liquid fuel infrastructure will need a similar level of capacity to that available today, even though the average capacity needed may be dramatically less.
To exploit this value of availability, the business model of the liquid fuel industry would need to fundamentally shift from one based entirely on recovering costs through utilisation of assets to one where some costs are recovered through the provision of ‘availability’. This is a similar position to the electricity market where occasional use generating plant and storage is not used sufficiently to justify economic investment purely on a utilisation basis.
Bio-fuel blending and vehicle parc compatibility: The volume of sustainable bio-fuel that is likely to be available is very difficult to predict. But an estimate of 5% (potentially up to 10%) of road transport energy consumption by 2020 is considered possible[30]. Any development of the market beyond that depends on the deployment of more advanced technologies. For the UK, bio-fuel is likely to be predominantly imported, as UK biomass would most effectively be used in combination with CCS for power generation[31].
However, as liquid fuel sales decline, a given volume of bio-fuel will become an increasing proportion of the mix around the mid 2020s. Conservative levels of bio-fuel penetration will breach the levels at which compatibility in the infrastructure and on vehicles becomes important. Investment through the energy chain to ensure compatibility with bio-fuels will be essential.
3-3: What is important in designing electric infrastructure for light vehicles?
Electrification of vehicles can be an affordable source of future energy for light vehicles, based primarily around home and depot recharge points at up to 3kW. But electrification will not be suitable for everyone. Electricity demand needs to constantly match generation. So intelligent systems will be essential to balance the system cost effectively.
We have worked with the Department for Transport to develop a model of UK travel patterns derived from the National Travel Survey – focusing on the 2007 to 2010 data (a detailed database of 1.25 million car journeys from 23,589 households). This model of UK travel patterns has been used to test infrastructure design options for electrification.
The electrical installation in most domestic dwellings could support two 3kW22 recharge points23
or one 7kW recharge point. Some older properties with lower capacity supplies may require an upgrade to the incoming supply[32].
There are fewer constraints for public, workplace or commercial depot recharge points. Using the same ‘standard’ power levels of 3kW or 7kW would be a sensible approach.
Higher power levels would be feasible in some locations where direct connection of high capacity cabling to a local substation would be affordable. This could enable a recharge of up to a 100 mile range within 30 minutes (depending on vehicle compatibility, of course).
Bio-fuel compatibility through the energy chain will be needed by the mid 2020s
Most domestic dwellings could accommodate two 3kW or one 7kW recharge point
22 3kW is the same capacity as a standard domestic plug socket
23 ‘Recharge point’ includes both conductive (physical) and inductive (wireless) energy transfer connections

43 Chapter 3 Energy Technologies Institute www.eti.co.uk
Power (kW) Range Per Hour*
Domestic Workplace Public
3.1kW 10 miles √ √ √
3.8kW 13 miles √ √ √
7.7kW 25 miles √ √ √
69kW# 230 miles ? √
‘Standard’ grades of recharging point (3kW and 7kW) for home and work place deployment are likely to quickly reduce in cost, levelling off at an installed cost of <<£1k[33] (depending on local earth connection requirements). It should be noted that this is for a dedicated plug-in vehicle connection (with safety interconnectors, support for demand control capability, etc). Unless prohibited – it isn’t currently – some owners may simply opt to use an existing plug-socket.
‘Public’ recharge points, on-street in residential areas, will be more expensive due to the operating environment. This is expected to fall quickly to an installed cost of around £4k per post (which could support two cars).
‘Rapid’ (to recharge up to 100 miles range within 30 minutes) recharge point costs are heavily dependent on the cost of connection to the electricity network. This is expected to fall quickly to an installed cost of around £16k plus the costs for network connection. A new distribution network connection for a single ‘rapid’ recharging point is likely to be very expensive. It is more likely that a cluster of ‘rapid’ recharge points would be needed to justify the costs of a new network connection.
3-3-1: Where should recharge points be located?
Given the range of different recharging points that could be deployed, the first key question is where to locate them.
Our analysis of the National Travel Survey has shown that the most frequently visited location for cars is the home, followed by the workplace. However, less than half of cars regularly visit a workplace. The other locations people visit are visited far less frequently; therefore could not comprise the core of an adequate recharging infrastructure.
‘Rapid’ recharging (100miles in 30mins) could be achieved with a dedicated 3 phase supply
The first key question is where to locate recharge points
Figure 34: Cost Estimate (£ [2010]) for Different Recharge Point Options[33]
* Based on typical consumption of 3.3 miles per kWh; varies by season, vehicle, journey, driver, etc# 69kW is used as an example of a ‘rapid’ recharging option (a direct three phase connection); it is not a fixed
constraint
Home* / work up to 7.7kW (~25mi / hr)
Public access up to 7.7kW (~25mi / hr)
‘Rapid’ rechargepoints (~200mi / hr)
£5K0 £10K £15K £20K £25K £30K £35K
Installed cost per bay (excluding any new grid connection,if needed, and ‘upstream’ network reinforcement)
2010 installed cost per bay
2050 installed cost per bay
* This cost is for a dedicated home recharge point (with safety interconnectors, demand control capability, etc).Unless prohibited (it isn’t currently), some users may just use an existing garage plug socket.

44 Chapter 3 Energy Technologies Institute www.eti.co.uk
Analysis of the Communities and Local Government survey of housing and parking arrangements reveals that around half of UK properties are owner/occupier properties with off-street parking. The occupier has full autonomy to arrange for a recharging point to be installed at the time of buying the vehicle.
Half of UK properties are owner-occupier with off-street parking
Figure 35: How Frequently Each Car Arrives at Different Locations Each Week[18]
Figure 36: Peoples’ Parking Arrangements at Domestic Dwellings[34]
20%
40%
60%
80%
100%
0%At least once Three +
Arrivals of a given vehicle at a given location each week
Prop
orti
on o
f par
c
Seven + Fourteen +
Home
Workplace
Food shopping location
Other shopping location
Eat / drink location
Off-street parking – owner / occupier
On-street parking only – ‘inadequate’
On-street parking only – ‘adequate’
Off-street parking – a fl at / apartment
Off-street parking – rented, but not a fl at / apartment

45 Chapter 3 Energy Technologies Institute www.eti.co.uk
Urban centres have the least adequate parking, making them less suited to plug-in vehicles
Figure 37: Variation in Parking Arrangements between Urban and Rural Areas[34]
The next group of dwellings are either rental properties or flats with communal parking arrangements. In these locations, recharging point deployment should be fairly straightforward, but the occupier has no autonomy. It is likely some form of regulation or incentive will be needed to encourage landlords to deploy the necessary hardware for vehicle recharging. This does not need to be tackled until a solid home recharging infrastructure is available in owner/occupier homes with off-street parking.
The last group of dwellings have no off-street parking provision and would require some form of on-street recharging point deployment in order to be able to recharge a plug-in vehicle at home. It is likely some form of coordinated investment would be needed (almost certainly involving local authorities) to deploy the necessary infrastructure. This is essential if electrification of light vehicles needs to penetrate further into the market than off-street parking permits. Again this would not need to occur until a solid network of home recharging points at homes with off-street parking is established.
Around half of the properties reliant on on-street parking have ‘inadequate’ parking. Here it would be extremely difficult to make any provision for recharging point access. This is particularly the case in major urban centres. It is likely these consumers will not be able to have home recharging infrastructure availability.
For communal parking arrangements and on-street recharging arrangements, some form of billing mechanism will need to be implemented.
It is unlikely there will be multiple competing physical recharge points on residential streets. There is unlikely to be local competition for the recharge point hardware asset outside a person’s home. Given this likely lack of competition, some form of price regulation for hardware rental is very likely to be necessary for on-street recharge point locations. This potentially also applies to communal parking arrangements.
For light commercial vehicles to use electric power, charge point installation at depots would be needed. Technically, this should present fewer challenges than for home installations. However, many commercial premises are rented, which may create a barrier to obtaining access to suitable recharging infrastructure.
Using our model of travel patterns, developed in collaboration with the Department for Transport, the proportion of mileage that could be completed in an electrified vehicle with a given battery range can be determined. In the following chart, this is segmented by different recharging point location options. This reveals that:
All dwellings
Rural dwellings
Village centre dwellings
Rural residential dwellings
Suburban residential dwellings
Other urban centre dwellings
City centre dwellings
0% 20% 40% 60% 80% 100%
Proportion of the dwellings
Garage
Other off street parking
Adequate on street parking
Inadequate on street parking
No parking provision

46 Chapter 3 Energy Technologies Institute www.eti.co.uk
Homes and commercial depots are the most important location for recharging points
Recharging point costs per vehicle will increase as adequacy of parking decreases
• Home recharging offers the most significant opportunity, followed by the workplace – but only for those cars that are regularly used to travel to a workplace.
• Public access recharge points would not add significantly to energy use in electric mode (and hence potential carbon reduction) for those with either a home or work recharge point.
• Even with recharge points at home, work and public access locations, there is still a significant number of journeys that cannot be completed in electric mode. This is because the majority of people need their vehicle occasionally for longer journeys. Recharging infrastructure is unlikely to solve the range limitations of pure battery electric vehicles.
• Most consumers do not visit the types of location where public recharge points could be installed often enough and for long enough for it to provide the core of their energy needs. Public recharging infrastructure is very unlikely to enable access to vehicle electrification for those where access cannot be arranged at home or work. Plug-in vehicles cannot be a single universal solution for low carbon cars suitable for everyone.
Given the cost for recharge points and the locations where they could be deployed, a cost curve for the infrastructure for plug-in vehicles can be estimated. For the purposes of estimation, it is reasonable to assume that each on-street and workplace recharge point could serve two vehicles (with two sockets), which significantly reduces the cost. For workplace recharge points it is likely they will be difficult to efficiently target only to those users that do not already have a home recharge point. A significant degree of duplication is very likely to increase the effective cost per vehicle.
The increasing difficulty (and hence cost) of deploying recharge points for a given vehicle increases as plug-in vehicle penetration increases. This increasing marginal cost of adding each extra vehicle to the parc will have a significant impact on the economics of plug-in vehicles against other options for those without off-street parking where a recharge point can easily be installed. Other vehicle technology options are likely to be increasingly attractive for people living in these locations.
Figure 38: Trade-off in Plug-in Vehicle Electric Mode Usage with Different Recharge Points[18] 24
24 Mileage in different modes can’t be translated directly to CO2 emissions; overall system performance has to be considered
10%
0%10
Prop
orti
on o
f mile
age
com
plet
ed in
ele
ctric
mod
e
Vehicle battery size (electric range in miles)
PHEV range extender kicks-in (indicates there are journeys that can’t be completed in a BEV)
20 30 40 50 60 70 80 90 100 110 120
20%
30%
40%
50%
60%
70%
80%
90%
100%
Able to recharge everywhere
A recharge point at both home and work*
Home recharge point only
Work recharge point only*
* Only for cars regularly travelling to a workplace (<50%)

47 Chapter 3 Energy Technologies Institute www.eti.co.uk
There is no real benefit from an energy transfer rate above 3kW at home or work
Recharge point installation at commercial depots is expected to be at the lower end of the scale of cost for home recharge point installation, given there are likely to be fewer challenges in most cases and recharge points can be well targeted for specific vehicles to minimise redundancy.
3-3-2: What rate of transfer is required at recharge points?
The second key question is what rate of energy transfer is required? Parking durations at both home and work generally far exceed the required recharge duration. There would therefore be negligible impact on energy consumption from a rate of energy transfer above 3kW -the normal power capacity of a domestic socket.
Figure 39: Cost of Recharge Point Deployment per Vehicle (Illustrative)
Figure 40: Plug-in Vehicle Electric Mode Use as a Function of Energy Transfer Rate[18] 25
25 Assuming users will actually plug-in the vehicle when at home/work; electric mode use would fall if not regularly plugged-in
£500
£1,000
£2,000
100%
Recharge point cost per vehicle
‘Plug-in’ share of cars in the parc
Some of the earliest adopters may just use an existing electric socket (although this may have safety risks)
3kW off-street home recharge point
Work
On-street home
Inadequate parking
20%
0%
0%
20%
40%
40%
60%
60%
80%
80%
100%
100%
Prop
orti
on o
f mile
age
com
plet
ed
in e
lect
ric m
ode
Vehicle battery size (electric range in miles)
10 20 30 40 50 60 70 80 90 100 110 120
Always fully charged
7kW recharge rate
3kW recharge rate
Usage based around a home recharge point only
Usage based around a work recharge point only

48 Chapter 3 Energy Technologies Institute www.eti.co.uk
Consumers do subjectively value public recharging infrastructure
3-3-3: Is there a role for supplementary public recharging?
The third key question is whether there is scope for supplementary recharging infrastructure, to add benefits to the energy system market proposition to consumers?
It is evident from the analysis of UK travel patterns that public recharging infrastructure would not add significantly to electricity consumption beyond that achieved with a home or depot recharge point.
However, such ‘objective’ analysis of travel patterns undervalues the importance of the ‘subjective’ value people place in public recharging infrastructure. Our consumer research programme showed that all consumer segments currently value the availability of public recharging infrastructure, including the early adopter ‘Pioneers’.
The research also showed that consumers recognised they were unlikely to use it significantly – unless it was almost free, of course – as many of the current schemes are. As people gain more experience with plug-in vehicles, the ‘subjective’ importance placed on public recharging infrastructure is likely to become more closely aligned with the ‘objective’ analysis. Its subjective value is likely to decline over time. It is not evident that a public recharging infrastructure is a necessity requiring public sector intervention such that it leads vehicle uptake.
The value placed on the availability of a public recharging infrastructure is much stronger for pure battery electric vehicles, but would also support plug-in hybrid vehicle adoption.
For any public recharging infrastructure to have an impact on adoption, it must be very highly publicised.
Revisiting the model of UK travel, a more subtle question on infrastructure design can be asked: how could ‘rapid’ recharging points fit into the usage of a plug-in vehicle?
The National Travel Survey data can be used to show the time of day plug-in vehicles would run out of electricity, assuming they leave home fully recharged26.
Figure 41: Value Consumers Place on Public Recharging Infrastructure Availability[16]
Premium Pioneers are willing to pay over a conventional vehicle
Public recharging availability ‘premium’
Pion
eer c
onsu
mer
s(e
arlie
st a
dopt
ers)
Willingness to pay – PHEV
Willingness to pay – BEV
Willingness to pay if only a home charging point is available
Willingness to pay if the home charging point is supplementedby public recharging points

49 Chapter 3 Energy Technologies Institute www.eti.co.uk
A ‘rapid’ recharge network could add value to the PHEV proposition, but the risks are high
The profile is very flat and indicates ‘rapid’ recharge points could operate as an additive component of a recharging infrastructure business model with a relatively smooth stream of custom. Consumers would need to break journeys. Motorway service stations are the prime example of where this is already the case.
Clearly the risks are significant. Manufacturers may not make compatible vehicles, given the extra component costs and risks to battery life; consumers may not choose to pay for the extra vehicle-side components or accept the risks to battery life; health and safety risks may be prohibitive; etc. Furthermore, it is very unlikely to add anything much to the achievable carbon reduction from plug-in vehicle deployment. There does not appear to be a case for Government intervention.
However, a very rough assessment of the potential finances suggests that ‘rapid’ recharging cannot simply be dismissed. It may become cost competitive with liquid (or hydrogen) fuel in the longer-term at certain locations once there is an established vehicle parc. This is of course if it is compatible.
It should be noted that it is very unlikely to be economic at all times of the day/year (especially late afternoon / evening in mid winter when other electricity demand is at its peak).
This indicates that the energy system should be designed with the capability for ‘rapid’ recharging to be added in the future. It is speculative and might never actually happen.
Figure 42: The Potential for Utilisation of ‘Rapid’ Recharging Points[18] 26
26 For a medium-size, medium-range plug-in hybrid electric vehicle (ref. Figure 28 in Chapter 2-5)
40
60
80
100
120
140
160
20
-
0:00 –
1:00
1:00 –
2:00
2:00 –
3:00
3:00 –
4:00
4:00 –
5:00
5:00 –
6:00
6:00 –
7:00
7:00 –
8:00
8:00 –
9:00
9:00 –
10:0
0
10:0
0 – 11
:00
11:0
0 – 12
:00
12:0
0 – 13
:00
13:0
0 – 14
:00
14:0
0 – 15
:00
15:0
0 – 16
:00
16:0
0 – 17
:00
17:0
0 – 18
:00
18:0
0 – 19
:00
20:00 –
21:0
0
20:00 –
21:0
0
21:0
0 – 22:0
0
22:00 –
23:00
23:00 –
0:00
Num
ber o
f car
s sw
itchi
ng fr
om e
lect
ric
to li
quid
fuel
mod
e (0
00’s
)
Time of day for switch to liquid fuel mode (plot for a ‘typical’ day)
Average ~110,000 cars per hour
Nominal 13 hour operating window

50 Chapter 3 Energy Technologies Institute www.eti.co.uk
• At 69kW (a dedicated three phase connection), a plug-in vehicle with a range of up to 100miles could be fully recharged in under 30mins.
• Therefore, 55,000 recharge points could provide for 110,000 cars running out of electricity per hour.
• Spread at every 30 miles on the main motorway and ‘A’ road network would require 1,000 separate sites; i.e. 55 recharge points per site.
• Assuming a cost of £16k per recharge point (ref. Figure 34), and an average network connection cost of £0.5m for the site, the total capital outlay would be a little under £1.5bn.
• Assuming:
° A utilisation of 25% during the main 13hour operating window, and zero utilisation outside it; and
° Capital is depreciated over a ten year period at a discount rate of 10%.
Then a mark-up of around 25% on the underlying cost of electricity would be sufficient to break-even.
• With the next cheapest option for consumers being liquid fuel (or hydrogen), the achievable mark-up may be much higher.
This analysis is dependent on a reasonably high level of utilisation of the rapid recharging infrastructure. This is unlikely to be the case while the vehicle parc is gradually built.
The commercial justification for an energy company for early investment would be primarily to secure the best positioning for a future market. Vehicle manufacturers may have a broader business case, on the basis of increasing the price consumers are willing to pay for plug-in vehicles.
Based on these assumptions, the impact on the wider electricity system, if all vehicles running out of electricity were to use ‘rapid’ recharging infrastructure, would be around 4GW. At most points in time, this is unlikely to present a major challenge to the electricity system, but there will undoubtedly be days and times when there is no capacity at all without very substantial (£bn’s) investment in extremely low utilisation generation or storage capacity. Due to its very low utilisation, such peak electricity generating plant tends to be low efficiency (hence higher CO2 emitting).
Consequently, ‘rapid’ recharging points are unlikely to be an affordable solution to the limited range of pure electric vehicles.
3-3-4: How should recharging be integrated into the system?
The fourth key question is how to integrate vehicle recharging into the electricity system? Even if the majority of vehicles were to be plug-in vehicles, the total electricity demand would be less than 20% of current annual electricity consumption. Other developments in electricity demand – the electrification of heat in particular – are likely to have a much more profound effect on the electricity system. These other developments are leading to a much stronger case for developing and deploying solutions for the better integration of energy demands with the energy supply system.
There are already a number of large scale programmes working to do this, including our own Smart Systems and Heat programme[35]. It is highly unlikely a separate integration system will be appropriate for vehicle recharging. The key challenges and opportunities are discussed in the following paragraphs.
‘Rapid’ recharging is unlikely to be an affordable solution to the range limit of pure electric vehicles.

51 Chapter 3 Energy Technologies Institute www.eti.co.uk
Extremely low utilisation peak capacity: Electricity supply must meet demand at any instant in time. Unlike the liquid fuel infrastructure, there is currently very limited storage capacity to ‘buffer’ the system. The consequence of insufficient supply – or the ability to control demand – would be a catastrophic failure of the entire electricity system.
Therefore, any increase in peak electricity demand (even if it only occurs once every few years) will require additional capacity in either storage or generation. Also, electricity storage is much more expensive than liquid fuel storage. It is generally much cheaper to store the raw feedstock and build additional generating plant than to store electricity.
The chart below shows that the generation / storage capacity to meet demand over 55GW is required far less than 1% of the time. This peak electricity is extremely expensive to make available. The implications for vehicle recharging are especially significant for rapid recharge points. The business model would either need to accept it is unavailable for several hours in midwinter afternoons / evenings or include significant additional low utilisation generation / storage capacity in its cost base.
Growing electrification of major energy demands such as heat: It is important to set plug-in vehicle recharging in context against wider developments in electricity demands. The most significant of these is the electrification of heat, since heat demand is much more variable through the year than general electricity demand. It is therefore likely the difference between winter and summer electricity demand will grow.
Electricity supply must meet demand at any instant – storage to ‘buffer’ the system is much more expensive than for liquid fuel
The seasonal difference in electricity demand is likely to grow
Figure 43: UK Electricity Demand from 2008 to 2011 (GigaWatts)[36]
Figure 44: Margin for Vehicle Recharging on a High Demand Day (20th Dec 2010)[36]
2.0%
1.0%
0.0%20 22 24 26 28 30 32 34 36 38 40 42 44 46 48 50 52 54 56 58 60
3.0%
4.0%
5.0%
6.0%
7.0%
Freq
uenc
y of
occ
urre
nce
Aggregate UK electricity demand (GW)
Capacity for demand over 55GW is essential, but needed <<1% of time
00:00 04:00 08:00 12:00 16:00 20:00
10
20
30
40
50
60
Elec
tric
ity
dem
and
(GW
)
Time of day
Average daily demand for majority of car parc powered by electricity Upper estimate Lower estimate
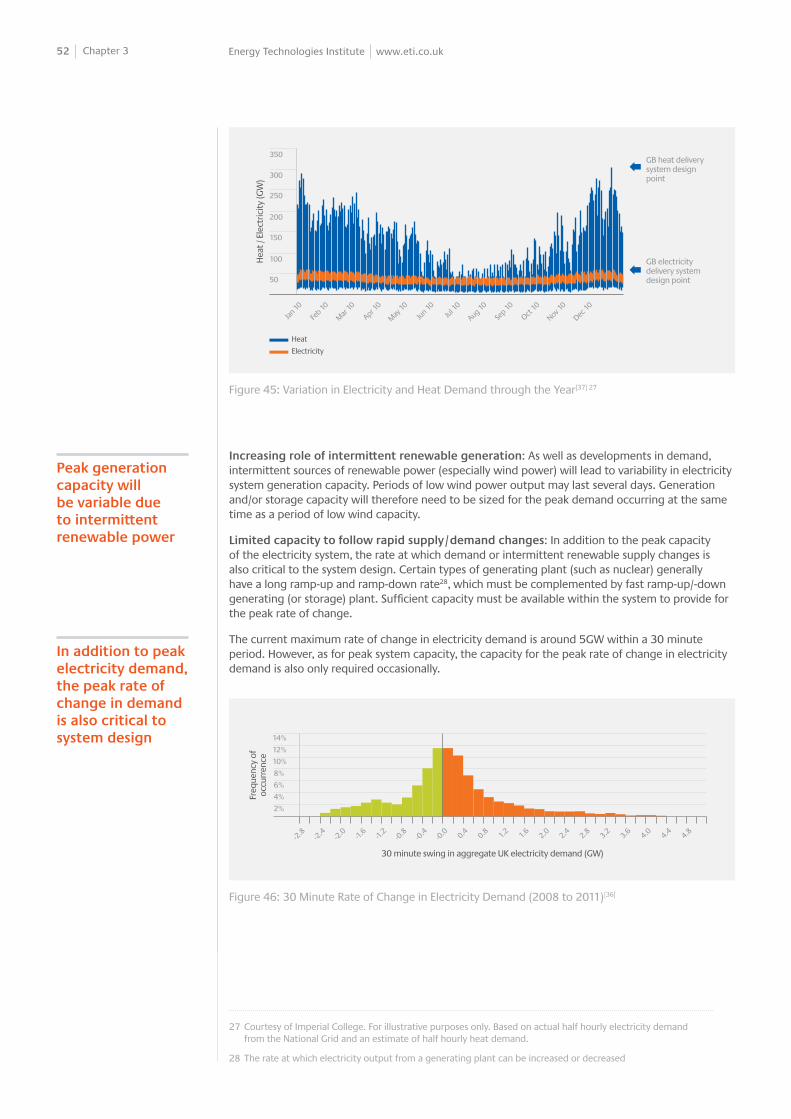
52 Chapter 3 Energy Technologies Institute www.eti.co.uk
Figure 45: Variation in Electricity and Heat Demand through the Year[37] 27
Figure 46: 30 Minute Rate of Change in Electricity Demand (2008 to 2011)[36]
Increasing role of intermittent renewable generation: As well as developments in demand, intermittent sources of renewable power (especially wind power) will lead to variability in electricity system generation capacity. Periods of low wind power output may last several days. Generation and/or storage capacity will therefore need to be sized for the peak demand occurring at the same time as a period of low wind capacity.
Limited capacity to follow rapid supply/demand changes: In addition to the peak capacity of the electricity system, the rate at which demand or intermittent renewable supply changes is also critical to the system design. Certain types of generating plant (such as nuclear) generally have a long ramp-up and ramp-down rate28, which must be complemented by fast ramp-up/-down generating (or storage) plant. Sufficient capacity must be available within the system to provide for the peak rate of change.
The current maximum rate of change in electricity demand is around 5GW within a 30 minute period. However, as for peak system capacity, the capacity for the peak rate of change in electricity demand is also only required occasionally.
Peak generation capacity will be variable due to intermittent renewable power
In addition to peak electricity demand, the peak rate of change in demand is also critical to system design
350
200
250
300
150
100
50
Hea
t / E
lect
ricit
y (G
W)
GB heat delivery system design point
GB electricity delivery system design point
Jan 10
Feb 10
Mar
10
Apr 10
May
10
Jun 1
0Ju
l 10
Aug 10
Sep 10
Oct 10
Nov 10
Dec 10
Heat
Electricity
14%
8%
10%
12%
6%
4%
2%
Freq
uenc
y of
oc
curr
ence
30 minute swing in aggregate UK electricity demand (GW)
-2.8
-2.4
-2.0 -1.
6-1.
2-0
.8-0
.4-0
.0 0.4 0.8 1.2 1.6 2.0 2.4 2.8 3.2 3.6 4.0 4.4 4.8
27 Courtesy of Imperial College. For illustrative purposes only. Based on actual half hourly electricity demand from the National Grid and an estimate of half hourly heat demand.
28 The rate at which electricity output from a generating plant can be increased or decreased

53 Chapter 3 Energy Technologies Institute www.eti.co.uk
Limited capacity of the distribution network: In addition to the challenges of generation, the distribution network does not have enough capacity for all dwellings to draw their maximum power demand simultaneously. The network is sized assuming everyone has different patterns of behaviour. An increase in local peak demand will trigger a need for significant investment in the electricity network or in local storage capacity[38].
However, distribution network operators are not generally permitted to proactively invest in new system capacity without proven demand. For plug-in vehicle uptake this will be a real challenge. It is almost impossible to predict accurately (to the level of a specific piece of distribution network hardware) when and where vehicles will be adopted. The majority of the cost for network reinforcement is in labour. Incrementally adding extra capacity to a given network as new demands arise will be a much more expensive approach than adding surplus capacity to cater for potential future needs that may then not arise.
Correlation in the days and times people plug vehicles in: To understand the challenges of vehicle recharging demand management, it is useful to consider the times that people arrive at different locations and could ‘plug-in’ (as shown in Figure 22 in Chapter 2). This indicates there is a high probability people will plug-in their vehicle at home in the evening or at work in the morning at the same time as the peak in other electricity demands. Since vehicles tend to be parked for very long durations, there is an opportunity to manage the timing of when the vehicle is actually recharged.
There is a likelihood that there will be some correlation in the days people choose to plug-in their vehicle. Sunday evening in preparation for the commute to work, may be a day when more people choose to ‘plug-in’. There is already evidence of this from early trials[40].
Opportunity for electricity and liquid fuel supply integration: The internal combustion engine and liquid fuel store of a plug-in hybrid electric vehicle has the potential to add significant resilience to the energy system for light vehicles.
In periods with consecutive days of high heat demand and/or low wind power output, the internal combustion engine provides the option not to use electricity for vehicles and use liquid fuel instead.
It is likely to be much cheaper to maintain sufficient peak capacity in the liquid fuel system than to build and maintain sufficient peak capacity in the electricity system. Liquid fuel is much cheaper to store than electricity.
Some level of distribution network reinforcement is likely to be needed
Peoples’ travel patterns will lead to ‘plugging-in’ being focused around the current electricity peaks
Plug-in hybrid vehicles add resilience – liquid fuel could be used on occasional days with low electricity system capacity
Figure 47: Potential Costs for Electricity Distribution System Reinforcement for Plug-in Vehicles[39]
16
14
12
10
8
6
4
2
0
20212023
20252027
20292031
20332035
20372039
20412043
20452047
2049
Cum
ulat
ive
netw
ork
rein
forc
emen
t co
st (£
bn)
Worst case recharging patterns
Recharging always overnight
High uptake of plug-in vehicles
Medium uptake of plug-in vehicles
Low uptake of plug-in vehicles

54 Chapter 3 Energy Technologies Institute www.eti.co.uk
This resilience opportunity can only exist if:
• The business models of energy supply actors and the contractual arrangements with consumers permit it.
• The electricity system incorporates the necessary demand management functionality.
• There is sufficient peak capacity in the liquid fuel infrastructure, with sufficient demand management to avoid lengthy queues.
Need for electricity demand control and supply hybridisation: Given the challenges and opportunities presented, some form of electricity demand control is likely to be essential to better utilise the capacity of the electricity system. Liquid fuel demand management would also be a very valuable addition to enable the energy system resilience of plug-in hybrid electric vehicles to be fully exploited to minimise the need for very occasional use peak electricity generation or storage capacity.
From the characteristics outlined, the following key requirements for vehicle energy demand management can be derived:
Electricity demand management must be a key feature, and may need to include liquid fuel demand management
Figure 48: UK-level State of Charge of PHEV Batteries after Days without Recharging29
Figure 49: Effect of Not Using Electricity in Periods of Low Capacity on the Liquid Fuel System29
29 For a car parc of 28million plug-in hybrid electric vehicles with batteries sized sufficient for75% of their use to be in electric mode. The minimum/maximum uncertainty reflects uncertainty on energy consumption rate under real-world drive cycles.
0.1
0
0.2
0.3
0.4
0.5
0.6
System state of charge (after days of high electricity demand and low wind)
Tota
l sys
tem
bat
tery
st
ate
of c
harg
e (T
Wh)
1 day 2 days 3 days 4 daysFully chargedsystem
Max
Min
0.1
0.2
0.3
0.4
0.5
0.6
0.7
0.8
0.9
1
Liquid fuel demand (after days of high electricity demand and low wind)
Dai
ly li
quid
fuel
co
nsum
ptio
n (T
Wh)
1 days 2 days 3 days 4 daysFully charged batteries
Max
Min
0

55 Chapter 3 Energy Technologies Institute www.eti.co.uk
1. Provide choice to users (consumers and fleets). The need for day-to-day interaction with demand management systems should be optional (e.g. automated by default).
2. Provide clarity, certainty and simplicity to users (consumers and fleets). Users are likely to expect to know, upfront, how much energy for their vehicle will cost.
3. Minimise swings in aggregate electricity demand to maximise generation efficiency.
4. Minimise and guarantee the maximum peak aggregate UK electricity demand.
5. Accommodate variability in generation capacity due to intermittent renewables.
6. Maximise the throughput of the distribution network and minimise detrimental harmonics; minimise and guarantee any increases in local peak demands.
7. Provide data for long-term planning of electricity distribution network capacity.
8. Work in harmony with vehicle battery management systems.
9. Work in harmony with variability of consumers’ travel demands and plug-in times.
10. Minimise the necessary peak capacity of liquid fuel infrastructure for the (relatively rare) occasions when there may be insufficient electricity system capacity.
11. Provide sufficient incentives for each of the key actors to make the necessary investments/adjustments.
12. Accommodate uncertainty on vehicle adoption, usage behaviour and future change.
An evaluation of the potential electricity demand profiles under a range of electricity demand management options is shown in the accompanying chart. This indicates that simple static tariffs and timers are unlikely to meet the requirements outlined above – in particular the rate of change in electricity demand.
It is therefore likely that a more dynamic control system will be required. It is not yet clear how a market framework can be created to achieve such demand management that would be an attractive proposition to consumers and all other actors (such as vehicle manufacturers who may incur warranty liabilities for battery life due to changes in recharging profiles).
It does not appear that the current market framework is likely to make dynamic energy demand management business models viable. Further work is required to understand the issues and to design suitable market frameworks. Potential issues include:
• Time of use billing: Meters are currently manually read only a few times a year, so customers do not pay directly for the costs of peak system capacity or demand fluctuation – the costs are shared equally amongst all electricity consumers.
• Cost of carbon: The true cost of carbon is not currently internalised into the cost of electricity
• Split incentives: The direct benefits of demand management are in the electricity industry, but action is needed from multiple actors with no direct benefits
Simple tariffs and timers will not meet the key requirement to minimise the rate of change in electricity demand

56 Chapter 3 Energy Technologies Institute www.eti.co.uk
To integrate ‘rapid’ recharging at service stations, the system control is likely to need to prevent usage at the midwinter afternoon peak
Figure 50: Electricity Demand Under Several Demand Management System Design Options29
29 For a car parc of 28million plug-in hybrid electric vehicles with batteries sized sufficient for75% of their use to be in electric mode. The minimum/maximum uncertainty reflects uncertainty on energy consumption rate under real-world drive cycles.
The potential requirement to integrate ‘rapid’ (to recharge up to 100 miles range within 30 minutes) recharging at some point in the future adds an additional dimension of complexity to the system integration challenge:
• The potential to significantly increase the midwinter afternoon peak electricity demand by several Giga-Watts.
• The potential to increase swings in electricity demand. Although the randomness of peoples’ arrival at different locations is likely to smooth the effect at the national level, there is greater potential for detrimental harmonics at the local level of the electricity distribution system.
To avoid the high costs of significant additional electricity generation or storage capacity for the occasional peak periods, it is likely ‘rapid’ recharging will need sufficient system-level control to avoid it being used during peak electricity demand periods.
This occasional unavailability has the consequence that ‘rapid’ recharging can only be seen as a value-add to the plug-in hybrid electric vehicle proposition rather than a cure for the range limitation of a pure battery electric vehicle.
Apart from seeing plug-in vehicles as a challenge for integration into the electricity system, they may also present opportunities for improving the efficiency of the system. There are two key services plug-in vehicles could provide to the electricity system: frequency balancing services and reserve services.
The change in energy consumption rate for frequency balancing services is small, so would have little (if any) impact on the car user’s experience of the recharging process. It does however require very fast system control. This would impact on the cost and complexity of the electricity demand management system(s).
Reserve services are partly an aspect that electricity demand management will need to provide – the ability to reduce demand as required. The other aspect of reserve services – the ability for vehicle batteries to be used as ‘storage’ (so called ‘vehicle to grid’, or V2G) – is not essential and the economics are far from clear.
20%
40%
60%
80%
100%
120%
20%
40%
60%
80%
100%
120%
00:0
0 –
01:0
001
:00
– 02
:00
02:0
0 –
03:0
003
:00
– 04
:00
04:0
0 –
05:0
005
:00
– 06
:00
06:0
0 –
07:0
007
:00
– 08
:00
08:0
0 –
09:0
009
:00
– 10
:00
10:0
0 –
11:0
011
:00
– 12
:00
12:0
0 –
13:0
013
:00
– 14
:00
14:0
0 –
15:0
015
:00
– 16
:00
16:0
0 –
17:0
017
:00
– 18
:00
18:0
0 –
19:0
019
:00
– 20
:00
20:0
0 –
21:0
021
:00
– 22
:00
22:0
0 –
23:0
023
:00
– 00
:00
50%
00:00 05:0015 minute intervals
60%
70%
80%
00:0
0 –
01:0
001
:00
– 02
:00
02:0
0 –
03:0
003
:00
– 04
:00
04:0
0 –
05:0
005
:00
– 06
:00
06:0
0 –
07:0
007
:00
– 08
:00
08:0
0 –
09:0
009
:00
– 10
:00
10:0
0 –
11:0
011
:00
– 12
:00
12:0
0 –
13:0
013
:00
– 14
:00
14:0
0 –
15:0
015
:00
– 16
:00
16:0
0 –
17:0
017
:00
– 18
:00
18:0
0 –
19:0
019
:00
– 20
:00
20:0
0 –
21:0
021
:00
– 22
:00
22:0
0 –
23:0
023
:00
– 00
:00
%
%
60%
‘Park and Charge’ unmanaged vehicle recharging
Agg
rega
te fo
reca
st U
K el
ectr
icit
y de
man
d (G
W)
1 Simple midnight timermanaged vehicle recharging
2
Staged overnight timer (hourly blocks) managed vehicle recharging
3 Dynamic ‘smart’ managementof vehicle recharging
4
Forecast average weekday demand for vehicle recharging
Forecast average weekday aggregate base electricity demand

57 Chapter 3 Energy Technologies Institute www.eti.co.uk
The UK has a hydrogen industry, but it is negligible compared with the scale needed for mass-market transport use
Inductive connections are likely to be available and need to be supported
3-3-5: What is the role of conductive & inductive connections?
An important secondary question for electric vehicle infrastructure design is the choice between inductive vs. conductive electrical connections. There is likely to be a business case for manufacturers introducing plug-in vehicles into the market to at least provide inductive connections as a product option – primarily to enhance the proposition by providing a more seamless user experience. This development is not critical from an energy system point of view, but needs to be noted to ensure there are no obstacles created in the process of designing the energy system. There is however some potential advantage of inductive recharging from an energy system point of view. By reducing hassle for consumers, vehicles are more likely to be plugged in regularly, maximising their use in electric mode and giving greater flexibility to electricity demand management.
3-4: What is important in designing hydrogen infrastructure for light vehicles?
Unlike electrification, hydrogen could potentially replace conventional fuel entirely. But there are huge technical and economic hurdles to overcome. Carbon capture and storage will be critical to affordable ‘green’ hydrogen production.
The UKH2Mobility project[42] is developing a more in depth understanding of the UK specific issues associated with the potential role of hydrogen for transport. That project is yet to report its findings, but a high level overview of the key issues for hydrogen infrastructure is presented below.
There is currently a hydrogen infrastructure in the UK, used primarily in the production of ammonia and in the petroleum refinery industry. The scale of this existing infrastructure is very small compared to the scale required to satisfy even just a quarter of the 2050 UK light vehicle parc’s energy consumption. Most hydrogen is produced on site or nearby to the usage site, so there is very little pipeline infrastructure. The purity of hydrogen is not an issue for most current hydrogen uses, but is a key issue for use in fuel cells. Consequently, most current production capacity is unlikely to be suitable for fuel cell vehicles without upgrades.
Current hydrogen production is not ‘green’. It is mostly produced from natural gas, with the removed carbon being released into the atmosphere as CO2. Depending on conversion, compression / liquefaction and distribution losses and efficiency of use in the vehicle, the overall whole lifecycle carbon emissions may be slightly improved (with the efficiency of a fuel cell), or slightly worsened (with an internal combustion engine).
Figure 51: Electricity System Balancing Services[41]
Balancing service*
Speed of Response
Minimum Capacity
Minimum Delivery Period
Frequency Response < 30 sec 10MW3MW
30mins
Fast Reservel < 2 sec 50MW 15mins
Short-term Operating Reserve
< 20 mins (ideal)(up to 4 hours)
3MW 120mins
* Balancing services can be achieved by short notice controlled variations in electricity supply or demand

58 Chapter 3 Energy Technologies Institute www.eti.co.uk
Hydrogen vehicles are unlikely to be a route to reduce CO2 until CCS infrastructure is built (the 2030s)
Electrolysis is important for on-site production of H2 for niche usage
Biomass, coal and natural gas (all with CCS) are the most affordable routes for central H2 production
30 Based on a quarter of the 2050 parc being hydrogen fuelled. The fuel consumption error bar reflects uncertainty due to the choice between hydrogen combustion engines or fuel cells, the energy consumption rate, number of vehicles in the parc, etc.
Figure 52: UK Hydrogen Industry Scale vs. Scale Required for a Quarter of Cars in 2050[43] 30
Figure 53: Hydrogen Energy Value Chain
In future, hydrogen may be produced via multiple routes. However, the use of biomass represents an attractive opportunity if carbon can be captured and stored, given the ability to contribute carbon ‘credits’. Steam methane reforming of natural gas or gasification of coal, both in combination with carbon capture and storage, also represent attractive options given their maturity and relatively low cost.
Hydrogen infrastructure is therefore dependent on the deployment of a carbon capture and storage infrastructure – which might also be needed for the electricity generation sector. This dependency is unlikely to be ready before 2030, so a rapid deployment of hydrogen infrastructure before then would deliver limited carbon benefits.
Electrolysis is a very expensive technology for mass scale hydrogen production relative to the much cheaper options noted previously. Given the efficiency of electricity generation, transmission and electrolysis, it is also a highly inefficient energy chain. It has the following key advantages that keep it an important technology for small scale niche applications of hydrogen:
• Provided the electricity used is carbon neutral, then it is able to produce hydrogen with a similar carbon content to the fossil routes with carbon capture and storage;
• It is a mature technology and therefore low risk;
• Electricity production uses a diverse range of feedstock so, provided there is sufficient redundancy in electricity generation, it has potentially higher energy security than the fossil routes
• There is an extensive electricity distribution network that means carbon neutral hydrogen can be produced on-site which, for niche uses, avoids the need for costly hydrogen pipeline networks.
Merchant (distributed availability)
By-product (of chemical production processes)
Captive (produced on or near site of use; e.g. refi neries)
100 20 30 40 50 60 70 80
UK hydrogen production capacity (TWh/year)
Current UK hydrogen production capacity
Required hydrogen production capacity for a quarter of UK
light vehicles in 2050
CO2 capture,distributionand
storageH2 production
Feedstock forH2 production
H2 productstorage and
distribution system
H2 retailinfrastructure
Feedstock resources don’t require signifi cant scale-up:– Biomass (very limited current UK energy system use)– Natural gas (current UK energy system usage of 1024 TWh per year)– Coal (current UK energy system usage of 383 TWh per year)
Negligible current industrial scale
Small current industrial scale
Negligible current industrial scale
No current industry

59 Chapter 3 Energy Technologies Institute www.eti.co.uk
Trials and detailed planning will be needed to give confidence in any decision to invest £10bns in UK H2 infrastructure
Geographic constraints have a significant impact on hydrogen infrastructure cost
On-site steam methane reforming is a known technology and has been used in hydrogen vehicle trials in the USA. Since the on-site production of CO2 cannot be stored, the technology cannot enable the level of carbon reduction required and is not considered further in this report.
Photoelectrolysis, biophotolysis, fermentation and thermolysis technologies are all far less mature and the potential costs are therefore very unclear. There is currently no evidence they will produce a cost of energy lower than that of the cheapest routes noted above.
The desired system capacity, geographic constraints and the market structure have a significant effect on the overall design of the most affordable hydrogen energy infrastructure:
• For small scale niche use, the cost of a pipeline network would be prohibitive. In which case, hydrogen must either be liquefied and transported by road or produced on-site via electrolysis.
• For larger scale deployment for vehicles, geographic constraints have a significant effect on infrastructure cost. For example:
° Biomass, coal and natural gas conversion plants all need to be located for access to their feedstock, access to a CO2 pipeline for storage, access to suitable geology for H2 storage and access to the energy demand locations (either via pipeline or tanker).
° There is a balance to be struck between the number of conversion plants and their geographic dispersion and the capacity of pipeline network required (or capacity of the liquid tanker fleet).
• Refuelling system capacity could be much smaller than the current network of refuelling stations, but there are profound impacts on local competition. There is a fundamental market design question as to whether local competition or regulated pricing is the best route to value for money.
The University of California Davis has done considerable work examining the potential costs for a hydrogen production, distribution and refuelling infrastructure for the USA. This is believed to be the most extensive analysis for hydrogen infrastructure for light vehicles anywhere in the world.
Taking the UC Davis model, we have input UK geography in place of US geography to explore the potential costs for different system designs. While uncertainty is very high, especially given the geographic constraints influencing the number of hydrogen production plants, length of pipelines and scale of the hydrogen fleet required, this nonetheless is a useful guide on the potential scale of investment to be anticipated.
This analysis suggests a capital investment of somewhere into the low tens of billions of pounds needs to be considered. Much more detailed UK specific planning will be required to ensure the most appropriate system is designed for UK needs with a minimised total cost of ownership. There is currently very little experience of hydrogen infrastructure or vehicle operation in the UK and a demonstration programme to develop understanding of the challenges would be necessary before hydrogen could be confidently selected for the UK energy system for light vehicles.
Figure 54: Routes to Hydrogen Production[44]
Hydrogen
Electrolysis
Electricity Chemical conversion
Mechanical energy FermentationPhoto-electrolysis
Heat Biomass
Nuclear energy Renewable energy
CO2
Fossil energy
Thermolysis of water Biophotolysis
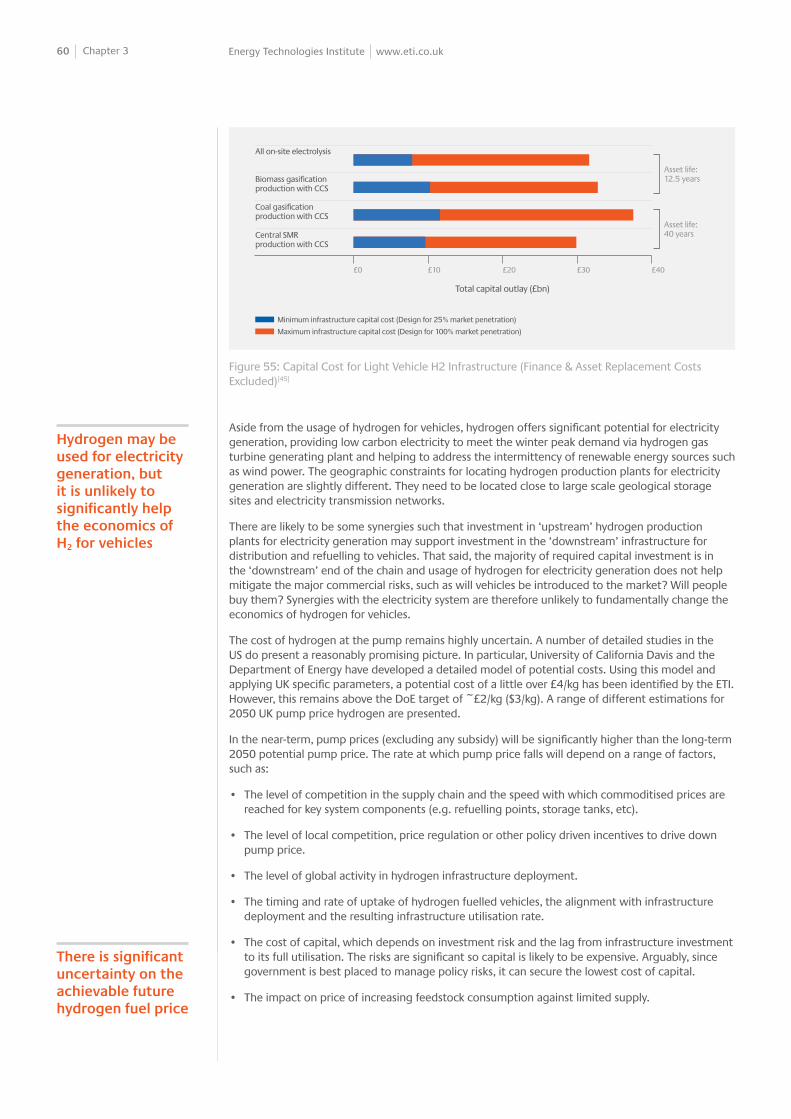
60 Chapter 3 Energy Technologies Institute www.eti.co.uk
There is significant uncertainty on the achievable future hydrogen fuel price
Hydrogen may be used for electricity generation, but it is unlikely to significantly help the economics of H2 for vehicles
Aside from the usage of hydrogen for vehicles, hydrogen offers significant potential for electricity generation, providing low carbon electricity to meet the winter peak demand via hydrogen gas turbine generating plant and helping to address the intermittency of renewable energy sources such as wind power. The geographic constraints for locating hydrogen production plants for electricity generation are slightly different. They need to be located close to large scale geological storage sites and electricity transmission networks.
There are likely to be some synergies such that investment in ‘upstream’ hydrogen production plants for electricity generation may support investment in the ‘downstream’ infrastructure for distribution and refuelling to vehicles. That said, the majority of required capital investment is in the ‘downstream’ end of the chain and usage of hydrogen for electricity generation does not help mitigate the major commercial risks, such as will vehicles be introduced to the market? Will people buy them? Synergies with the electricity system are therefore unlikely to fundamentally change the economics of hydrogen for vehicles.
The cost of hydrogen at the pump remains highly uncertain. A number of detailed studies in the US do present a reasonably promising picture. In particular, University of California Davis and the Department of Energy have developed a detailed model of potential costs. Using this model and applying UK specific parameters, a potential cost of a little over £4/kg has been identified by the ETI. However, this remains above the DoE target of ~£2/kg ($3/kg). A range of different estimations for 2050 UK pump price hydrogen are presented.
In the near-term, pump prices (excluding any subsidy) will be significantly higher than the long-term 2050 potential pump price. The rate at which pump price falls will depend on a range of factors, such as:
• The level of competition in the supply chain and the speed with which commoditised prices are reached for key system components (e.g. refuelling points, storage tanks, etc).
• The level of local competition, price regulation or other policy driven incentives to drive down pump price.
• The level of global activity in hydrogen infrastructure deployment.
• The timing and rate of uptake of hydrogen fuelled vehicles, the alignment with infrastructure deployment and the resulting infrastructure utilisation rate.
• The cost of capital, which depends on investment risk and the lag from infrastructure investment to its full utilisation. The risks are significant so capital is likely to be expensive. Arguably, since government is best placed to manage policy risks, it can secure the lowest cost of capital.
• The impact on price of increasing feedstock consumption against limited supply.
Figure 55: Capital Cost for Light Vehicle H2 Infrastructure (Finance & Asset Replacement Costs Excluded)[45]
Minimum infrastructure capital cost (Design for 25% market penetration)
Maximum infrastructure capital cost (Design for 100% market penetration)
£10£0 £20 £30 £40
Total capital outlay (£bn)
Central SMRproduction with CCS
Coal gasifi cation production with CCS
Biomass gasifi cation production with CCS
Asset life:40 years
Asset life:12.5 years
All on-site electrolysis

61 Chapter 3 Energy Technologies Institute www.eti.co.uk
Estimates of 2050 Pump Price for Hydrogen for Vehicles
Source for Estimate Price per kg Price per kWh
McKinsey ‘Powertrains for Europe’ study report (@1.25 / £)[46]
£3.52/kg 10.57p/kWh
ETI internal estimate using UC Davis / US DoE hydrogen infrastructure model[45]
£4.19/kg 12.58p/kWh
ETI project estimate (Economics and Carbon Benefits project, led by Arup)[47]
Low: £6.18High: £7.42
Low: 18.56pHigh: 22.28p
The end application for hydrogen in vehicles needs to be specific and hydrogen fuel quality standards need to be defined. For fuel cells, impurities in the fuel can easily destroy the fuel cell. This is not the case for hydrogen internal combustion engines. Therefore, the former requires a much higher quality standard than the latter. Increasing fuel quality drives increasing cost. It will be necessary to decide what level of fuel quality is appropriate.
Apart from fuel quality and the volume of hydrogen consumption, the energy system design can otherwise be resilient to the split of hydrogen fuel cell vs. hydrogen internal combustion engine vehicles; it is a relatively unimportant issue.
Hydrogen quality is an important energy cost driver and needs early standards

62 Chapter 4 Energy Technologies Institute www.eti.co.uk
4-1: How do the economics / carbon benefits of the options compare?
Efficiency is the lowest cost and quickest technology to deploy, followed by bio-fuels, electrification and then hydrogen. A combination of technologies is likely to be needed, but it is unlikely to be affordable to support all energy options in 2050. The UK will need to make choices on which energy infrastructures to invest in.
Each energy infrastructure costs in the order of £10bn’s to build and adds significant additional ongoing operations and maintenance costs. To achieve the least cost solution for low carbon light vehicles in 2050, choices need to be made on which energy infrastructure(s) to build where.
Energy infrastructures also have lifecycles of many decades, so significant foresight is required in the decisions taken on which energy infrastructure(s) to build.
The emissions reduction required in the light vehicle sector depends on the emissions reduction achieved in other (cheaper) sectors. Biomass electricity generation with carbon capture and storage was highlighted as an especially important technology due to its ability to ‘consume’ CO2 from the atmosphere. If successful, it would enable the UK to meet its energy and climate change goals at the least cost by retaining approximately 40% of 2010 light vehicle energy consumption as fossil fuel in 2050. If not, fossil fuel would need to be largely eliminated from light vehicles by 2050.
This Chapter compares the different technology options on the vehicle and infrastructure side. First, the more mature technology options that are already in production are considered, since there can be a high degree of confidence on cost and performance; efficient conventional vehicles and plug-in hybrid electric vehicles, fuelled by fossil, bio and electric fuels. Given the significant technical feasibility risks and cost uncertainties for hydrogen, pure battery electric vehicles and more ambitious volumes of bio-fuel, these are considered separately later in this Chapter.
Both behaviour change and vehicle automation are out of scope for this report, but we recognise both may deliver a further reduction in CO2 emissions.
4-1-1: More mature options: fossil, bio and hybrid electric
It is important to consider the relative economics of different technology options not only on the basis of the destination ‘in 2050’, but also on the basis of cumulative cost and emissions ‘by 2050’. This is partly to reflect the transitory costs – the learning curve effects and infrastructure deployment – and partly because CO2 remains in the atmosphere for up to two centuries31 after it is emitted. A small but early emissions reduction can have the same effect on atmospheric CO2 concentration as a large, but late emissions reduction.
The following charts show the costs/emissions of light vehicles in 2050 and the cumulative emissions in the period to 2050 as a result of five different design options.
1. ‘Do nothing’: The option against which the other design options can be compared, assuming no further change after 2015 (actions to meet EU emissions legislation for 2015 are already underway).
2. ‘Limited bio-fuel only’: The ‘do nothing’ design option, but with up to 10% of 2010 light vehicle energy consumption available as bio-fuels by 205032 with a slow increase over the decades).
Chapter 4 Energy Infrastructure Destinations and Paths to 2050
Duplicate infrastructures add significant costs, so choices need to be made on which one(s) to build
31 CO2 emitted to the atmosphere today will remain there for a period of 60-200 years[48]
32 Bio-fuels must be sustainable. 10% is a very conservative volume, assuming very limited growth over the decades to 2050.

63 Chapter 4 Energy Technologies Institute www.eti.co.uk
3. ‘Efficiency measures and limited bio-fuel’: Efficient conventional vehicles (including hybrids) only, with all new vehicles increasing in efficiency (at the rate shown in Figure 26 in Chapter 2), together with limited bio-fuels as per option (2).
4. ‘Plug-in hybrid electric vehicles and limited bio-fuel’: Plug-in hybrid electric vehicles with gradually increasing range from short- to long-range as battery costs fall33 (supported by both off-street and on-street home recharge points, and some workplace recharge points in the later decades) gradually growing to 65-85% of the parc by 2050, together with limited bio-fuels as per option (2), but without improvements to conventional vehicle efficiency.
5. ‘Plug-in hybrid vehicles, efficiency and limited bio-fuel’: A combination of option (4), together with efficient conventional vehicles as per option (3) for the remainder of the parc and limited bio-fuels as per option (2).
The charts present the results of a Monte Carlo analysis of specific design options (the ‘controllable’ aspects of the design space, such as the electric range of a plug-in hybrid electric vehicle) with the scatter covering the boundaries of uncertainty (the ‘uncontrollable’ aspects of the design space, such as the number of miles travelled in vehicles).
Key conclusions from this analysis of different options are:
• Bio-fuels offer the potential to reduce carbon at a low cost, but with a constrained impact given anticipated limits on the availability of sufficient and suitable arable land.
• Efficient conventional vehicles have the potential to reduce cost in 2050 through lower energy consumption, but with a cost ‘hump’ during the transition period such that the cost on a cumulative basis is roughly flat relative to the ‘do nothing’ design option.
• Efficiency measures and bio-fuels alone are unlikely to be sufficient to meet UK energy and climate change goals.
• A parc comprised primarily of plug-in hybrid electric vehicles has the potential to achieve a lower level of carbon emissions in 2050 than a parc comprise primarily of efficient conventional vehicles. They will be harder and slower to deploy than more efficient conventional vehicles, so the cumulative carbon emissions of both options are comparable by 2050.
• A combination of efficient conventional vehicles and plug-in hybrid electric vehicles has the potential to deliver a sufficient carbon reduction, provided that biomass power generation with CCS is successful. The expected cost increase for plug-in hybrid electric vehicles in 2050 is also likely to be partly offset by cost savings from efficient conventional vehicles.
• The cost in 2050 for this combination of technologies is a modest increase relative to the ‘do nothing’ design option. Even without a carbon price, there appears to be a cheaper design option than the ‘do nothing’ option. An efficient conventional vehicle parc. This suggests the vehicle market might naturally become increasingly efficient over the coming decades, which indicates a high carbon price will be needed to drive required changes beyond efficiency measures.
• The transition costs in the period to 2050 are significant for all design options, but especially so for plug-in hybrid electric vehicles. These costs partly relate to infrastructure investment, but more significantly reflect the learning curve effect – new technologies add cost, which gradually falls as the technologies improve and the supply chain matures.
A combination of efficient conventional vehicles and plug-in hybrid vehicles has the potential to meet the target
The extra system cost in 2050 is modest, but transition costs are much more significant
33 Plug-in hybrid electric vehicle range definitions are presented in Figure 28 in Chapter 2-5
Transition costs are significant; cost/benefit analyses need to evaluate both the destination and cumulate cases

64 Chapter 4 Energy Technologies Institute www.eti.co.uk
60%
50%
40%
30%
20%
10%
0%
-10%
-20%
-30%
-40%
-80%-100% -60% -40% -20% 0% 20% 40% 60%
Cos
t in
205
0 re
lati
ve to
ave
rage
of ‘
do n
othi
ng’
Carbon emissions in 2050 relative to average of ‘do nothing’
%
%
%
%
%
%
%
%
%
%
%
PHEVs, effi ciency measures and limited bio
PHEVs and limited bio only
Effi ciency measures and limited bio only
‘Limited bio’ only (up to10% of 2010 light vehicleenergy consumption)
‘Do nothing’ (and phase out existing bio-fuel)
5
1
4
3
2
50%
40%
30%
20%
10%
0%
-10%
-20%
-30%
-50%-60% -40% -30% -20% -10% 0% 10% 20% 30% 40%
Cum
ulat
ive
cost
[201
0 to
205
0] re
lati
ve to
ave
rage
of ‘
do n
othi
ng’
Cumulative carbon emissions relative to average of ‘do nothing’
PHEVs, effi ciency measures and limited bio
PHEVs and limited bio only
‘Limited bio’ only (up to10% of 2010 light vehicleenergy consumption)
‘Do nothing’ (and phase out existing bio-fuel)
5
1
4
3
2
Effi ciency measuresand limited bio only
Figure 56: Comparison of the Low Carbon Options for Light Vehicles ‘In 2050’
Figure 57: Cumulative Comparison of Low Carbon Options for Light Vehicles ‘By 2050’

65 Chapter 4 Energy Technologies Institute www.eti.co.uk
4-1-2: Less mature options: more bio-fuel, pure electric and H2
If biomass power generation with carbon capture and storage is not successful then the target for emissions from light vehicles in 2050 needs to be almost zero. The lowest risk technologies we have set out will then be insufficient to achieve that much more challenging target. The technology options to go beyond the combination of plug-in hybrid electric vehicles and efficient conventional vehicles are all significantly higher risk:
• Increased volume of sustainable bio-fuels.
• Pure battery electric vehicles.
• Hydrogen fuel cell or internal combustion engine vehicles.
More bio-fuel in light vehicles: Our analysis of bio energy[31] is evaluating the UK land space, the effect of land use change on carbon emissions and the value chain for UK biomass. This research has shown clearly that the majority of the UK’s available biomass would most cost effectively be used for electricity generation at central plant where it can be combined with carbon capture and storage to create a carbon ‘credit’. This increases the available headroom for residual emissions from light vehicles in 2050. If biomass power generation with CCS is unsuccessful, this may (depending on the cause) make more UK biomass available for conversion to transport fuel.
The availability of biofuel for UK light vehicles remains highly uncertain for a wide range of reasons, such as:
• Competition with other uses for UK biomass and land space.
• Access to secure and affordable import supplies of biofuel.
• Sustainability of various feedstock sources and land types.
• The outcome of significant ongoing innovation investments.
Up to around 30% of 2010 light vehicle energy consumption as bio-fuel (less with lower travel demand growth) would be enough to reach the required level of carbon reduction if used in combination with plug-in hybrid electric vehicles and efficient conventional vehicles.
Pure battery electric vehicles: For pure battery electric vehicles to go beyond a core of plug-in hybrid electric vehicles and efficient conventional vehicles with limited bio-fuels would require:
• Home, depot and workplace infrastructure for everyone: Plug-in vehicles cannot be expected to rely mainly on a public recharging infrastructure.
Provision of home, depot and work recharging infrastructure for almost every vehicle would therefore become essential. This would incur significant additional costs for resolving the most challenging of on-street and workplace parking arrangements to ensure adequate recharging provision.
• Sufficient electric range: A sufficient real-world electric range would need to be achieved to meet the most demanding of driving patterns. It is not evident that this requirement can be met with pure battery electric vehicles.
• A ‘rapid’ recharging network: A network of ‘rapid’ recharging points would be required to support extended range journeys away from the home. Additional electricity generation or storage capacity would be needed such that ‘rapid’ recharge points could be used even in the deep midwinter peak of other electricity demands.
It is unlikely pure battery electric vehicles will be able to meet the transport needs of a sufficient number of people (i.e. everyone) to reach the more challenging target of almost zero emissions from cars in 2050.
Bio-fuel could go much further, incrementally added to existing liquid fuel systems with low transition costs
If biomass power with CCS is unsuccessful, higher risk technologies will be needed
Pure battery electric vehicles are unlikely to meet everyone’s needs as a universal technology to eliminate fossil fuel
33 Plug-in hybrid electric vehicle range definitions are presented in Figure 28 in Chapter 2-5

66 Chapter 4 Energy Technologies Institute www.eti.co.uk
Hydrogen: Hydrogen infrastructure is a significant investment risk for the energy industry because of the heavy dependency on long term policy and vehicle manufacturer and consumer choices. It does not currently appear likely that hydrogen could offer a lower cost solution to meet UK 2050 energy and climate change goals than a combination of plug-in hybrid electric vehicles and efficient conventional vehicles (using a combination of biofuel and fossil fuel).
Given that the technology maturity of hydrogen fuelled vehicles is significantly lower and there is currently no infrastructure, they will be slower to deploy than a combination of plug-in hybrid electric vehicles and efficient conventional vehicles. A hydrogen vehicle based path is likely to produce significantly more cumulative CO2 emissions by 2050. Given that CO2 remains in the atmosphere for up to two centuries31, it will take many years of a deeper CO2 emissions reduction after 2050 to offset these cumulative emissions.
Investment in hydrogen infrastructure for light vehicles for the 2050 timeframe is therefore only a rational economic choice if fossil fuel must be eliminated and bio-fuel is not available. Many in the automotive sector have previously assumed all infrastructures can be maintained in parallel. If hydrogen is needed for light vehicles, it is likely to be most affordably used in combination with electric fuel.
The choice between fuel cell or internal combustion engine vehicles is a generally unimportant one for energy system design. The exception is in its influence on the fuel quality required which has a significant impact on energy price and so early standards are important.
For hydrogen to become a realistic contender technology, significant research, development and demonstration investments will be required to reduce risk to an acceptable level for a long-term infrastructure investment commitment to be made.
In summary: There are two particular technologies with a profound impact on the required 2050 energy system design for light vehicles:
• Bio-mass electricity generation with CCS has potential to create a substantial ‘carbon credit’ (at relatively low cost), opening headroom for some fossil fuel to remain for light vehicles in 2050 (~40% of the 2010 energy mix)[2].
• Bio-fuels, in combination with efficient engines and plug-in hybrid electric vehicles, could meet the majority of liquid fuel needs for light vehicles in 2050 if up to 30% of 2010 energy consumption is available as sustainable, low carbon bio-fuels.
If either of these bio-energy technologies proves successful at sufficient scale, with sufficient affordable, secure and sustainable global resource availability, an electric and liquid fuel infrastructure would provide an affordable energy system for light vehicles in 2050 and meet UK energy and climate change goals at the least cost.
It appears unlikely that hydrogen could deliver a significantly cheaper outcome than the electric and liquid fuel infrastructure mix. Even though the emissions in 2050 could be lower, the cumulative emissions by 2050 from a hydrogen based path are likely to be significantly higher due to the slower rate of deployment from less mature technologies. This requires many years of a deeper carbon reduction after 2050 to offset. There are also significant risks to hydrogen infrastructure investment – will policy be sustained for long enough, will enough other nations follow a similar path for vehicles to become affordable, will vehicle manufacturers develop and market the vehicles at a suitable price and will consumers adopt them at sufficient scale?
It appears it is only necessary to take the infrastructure investment risks for hydrogen for the 2050 timeframe if neither of the two bio-energy technologies identified are widely deployed, and the UK greenhouse gas emissions reduction target is maintained above 75%.
In a world where hydrogen infrastructure for cars is required, liquid fuel must be phased out for cars because it would be unacceptable as fossil-fuel and not available as bio-fuel. The vehicle parc will however take a period of at least 20 years to transition. Maintaining the liquid fuel system with rapidly declining utilisation and building a hydrogen infrastructure with initially very low utilisation during this period adds significantly to the overall cost and complexity.
The liquid fuel infrastructure is likely to need to be phased out in a hydrogen world
Hydrogen is an important ‘insurance’, in case biomass power with CCS is unsuccessful and there is insufficient bio-fuel
Least cost and risk path: a liquid and electric fuels mix
A choice is needed between an electric / liquid fuel or an electric / hydrogen fuel infrastructure for light vehicles
31 CO2 emitted to the atmosphere today will remain there for a period of 60-200 years[48]

67 Chapter 4 Energy Technologies Institute www.eti.co.uk
For the desired energy system to be achieved by 2050, the UK will need to be on a clear trajectory to either an electric / liquid fuel mix or an electric / hydrogen fuel mix infrastructure by 2025. This is due to the time taken to build infrastructure, turn-over the parc, develop new vehicles, commission factories and achieve consumer acceptance.
If it becomes necessary to veer away from the least cost path of an electric / liquid fuel mix and towards the insurance path of electric / hydrogen fuel instead, Government intervention is likely to be required. This is in order to achieve a sufficiently rapid infrastructure deployment to achieve sufficient vehicle uptake by 2050. It is not currently evident that the energy industry is sufficiently incentivised to even invest in the necessary innovation and planning for a hydrogen infrastructure to exist as a real insurance option for 2025.
4-2: Least cost and risk path: a combination of liquid and electric fuels
Efficient conventional vehicles fuelled by gasoline (instead of diesel) and biofuel, together with plug-in hybrid electric vehicles with 3kW off-street home recharge points offer the lowest cost path to meet UK energy and climate change goals. Investment in liquid fuel infrastructure will be needed to maximise diesel/aviation fuel output.
It appears likely a combination of fossil, bio and electric fuels for light vehicles can meet UK energy and climate change targets in the least cost, least risk way. It would be prudent to focus effort on giving these fuels the greatest chance of success.
A key strength of this least cost path is the flexibility to ‘course correct’ as time goes on given that it is largely based on incremental adaptations to existing infrastructure assets rather than the wholesale creation of a new one. The key aspects of the pathway are described below.
Figure 58: Market Development for Low Carbon Energy Infrastructure for Light Vehicles by 2050
An electric / liquid fuel infrastructure is likely to meet UK energy and climate change goals at the lowest cost
NOW 2025 2050
Market
develo
pment
Mar
ket
develo
pmen
t
Investment in hydrogen infrastructure R&D now should focus on its value as an insurance option
Majority hydrogen fuel
Low
High
Insurance option:Hydrogen / electric mix(phase out liquid fuel)
Majority electric fuel
Majority electric fuel
Least cost and risk path:Liquid / electric mix
Majority liquid fuel (fossil and bio)
Incr
easi
ng ri
sk /
unce
rtai
nty

68 Chapter 4 Energy Technologies Institute www.eti.co.uk
Internalise the cost of carbon: It is essential that the cost of carbon is reflected in the market. EU CO2 emissions legislation is already doing this for the automotive industry. It will continue to drive automotive industry change if the long-term target is continually reduced. It appears the current penalty level is sufficient, given the forecast costs for both efficiency and plug-in hybrid electric vehicle technologies. There are nonetheless opportunities to improve the effectiveness of the legislation:
• Improve the standardised drive-cycle to better reflect real-world driving and use of ancillary heating, cooling and lighting.
• Segment the calculation34 for plug-in hybrid electric vehicle emissions by vehicle size to reflect differing usage patterns and hence distances between recharges.
• Weight the contribution of different vehicle size categories to parc emissions to reflect the higher annual mileage of larger cars.
• Reflect whole lifecycle emissions; including from fuel production, such as electricity and hydrogen, and vehicle production and disposal35.
• Manufacturers should be given credit for making vehicles compatible with high blend bio-fuels, to prepare the parc for the mid 2020s.
The cost of carbon is however not currently reflected in the supply of fuels36. This undermines the case for long-term investment to lower the carbon intensity of the fuel supply. The Renewable Transport Fuels Obligation37 has been effective at helping to internalise the cost. However, there is no long-term target beyond 2013/14 (and associated financial penalty) and it is limited to bio-fuels.
Ensure a level playing field: EU CO2 emissions legislation is notionally technology neutral, but there are significant distortions within it: whole lifecycle emissions are neglected and certain vehicle types are given a ‘super-credit’ – a multiplier on their calculated benefit. Different fuel types are taxed at very substantially different levels. Fuel duty is applied more heavily on bio-fuel than fossil fuel38, while electricity receives no duty and a very low VAT rate. Given the widespread availability of electricity, it may not be possible to apply duty/tax in the same way as for other light vehicle fuels, given the implied need to prevent the use of “standard tax” electrical outlets.
A key feature of the liquid / electric fuel path is flexibility for the market to determine the balance between components of the solution; managing uncertainty on technology development, consumer preference, etc. For the market to work effectively and minimise the cost to the UK economy, it is critical that a level playing field is created between the options. Further work is required to determine the optimal combination of policies.
34 The emissions calculation (Regulation No. 101 of the Economic Commission for Europe of the United Nations) has an assumed average distance travelled between recharging (25km) for all plug-in hybrid electric vehicle size categories.
35 The legislation currently assumes hydrogen and electricity are zero carbon fuels, even though significant emissions may occur during production, while the effect of bio-fuels on reducing the lifecycle carbon emissions from liquid fuel is neglected.
36 Fuel duty is generally perceived by the energy industry as a revenue raising measure, not a carbon tax; a perception reinforced by application of fuel duty to bio-fuels. Business cases generally assume it will be applied to new fuels.
37 The RTFO is the key UK mechanism for regulating liquid fuel suppliers to increase the penetration of bio-fuels.
38 Fuel duty is applied equally per litre of bio-fuel or fossil fuel sold, but the energy content of a litre of bio-fuel is generally lower so the duty on bio-fuels is higher per unit of energy.
The cost of carbon must be internalised into the market to drive change
EU CO2 emissions legislation can be improved to optimise the outcome
Current policy is an unlevel playing field, which needs to be rebalanced for the least cost outcome to occur

69 Chapter 4 Energy Technologies Institute www.eti.co.uk
Build long-term investor confidence: It is critical to set targets / penalties at least a decade ahead of the desired outcome given the time taken to bring new technologies, products and infrastructures to market and secure a return on their investment.
The energy industry has fewer opportunities to manage risk than the automotive industry. It requires an even higher degree of confidence over a longer time horizon (once built, it is generally not possible to relocate or repurpose an energy infrastructure). A key strategic feature of the liquid / electric fuel path is avoiding large scale, high risk capital energy infrastructure investment ahead of vehicle adoption when there is demonstrable demand for it:
• Home recharge points and network upgrades can occur incrementally when and where vehicles are bought.
• Systems for better integration of electricity supply / demand are needed for other reasons and investment is already underway.
• Bio-fuel can incrementally be added into the liquid fuel blend, provided that the vehicle parc is compatible at that point in time.
Rapidly increase the efficiency of conventional vehicles: Efficiency (including hybridisation, improved power-train, improved aerodynamics, lightweight structures, etc) is the quickest and least cost route to reducing carbon emissions. It has an important role in minimising atmospheric CO2 concentration due to cumulative emissions, which makes it a valuable investment regardless of other developments. It is expected the majority of vehicle manufacturers will do this as their primary solution to meeting 2020 EU CO2 emissions legislation targets.
Use gasoline instead of diesel for light vehicles: There is a need to make efficient use of all fractions of crude oil. Currently, a third of gasoline production is surplus and of declining value, while diesel production remains in deficit and is of increasing value. Our previous commentary in Chapter 3 showed that this surplus is likely to worsen.
If the surplus is not used in the UK, it will be exported to those nations with less ambitious plans to tackle carbon emissions. This negates apparent carbon benefits the UK economy has paid for. These national differences create inherent market distortion, so policy is likely to be needed to help mitigate the imbalance.
The fossil fuel component of the liquid / electric fuel path should therefore be met by gasoline not diesel, requiring a reversal of the current trend.
There is a potential incidental benefit from reversing this trend. There appear to be more sustainable routes to producing gasoline type bio-fuels than diesel-type bio-fuels. But there is little investment incentive to produce more of a gasoline surplus.
Introduce plug-in hybrid electric vehicles: Short-range plug-in hybrid electric vehicles (~50% use in electric mode) are reasonably affordable in the near-term. As battery costs improve due to learning during scale-up, the battery size (and resulting percentage use in electric mode) can gradually be increased. The optimum battery size can be left to the market to determine over the coming years. This is if a level playing field is created.
Carbon benefits from plug-in hybrid electric vehicles are predicated on decarbonisation of the electricity supply. An affordable target for the electricity sector is zero CO2 emissions by 2030. The primary purpose for early introduction of plug-in hybrid electric vehicles is to start developing the market and maturing the technologies and supply chain. Some vehicle manufacturers are already starting to do this.
If the target under EU CO2 emissions legislation continues to fall at its current trajectory, plug-in hybrid electric vehicles are likely to be a key part of the core product portfolio of most vehicle manufacturers by around 2020.
This path avoids high risk upfront capital energy infrastructure investment
Dieselisation of light vehicles needs to be completely reversed to make best use of crude oil fractions
Plug-in hybrid electric vehicles with 3kW home recharge points could cut CO2 emissions by >75%

70 Chapter 4 Energy Technologies Institute www.eti.co.uk
Install 3kW home recharge points on demand: The optimum recharging infrastructure for a plug-in hybrid electric vehicle is a 3kW home recharge point. Other infrastructure (such as public recharge points) is not necessary. A solid market can be built around the 50% of owner/occupier homes with off-street parking. The need to take capital infrastructure investment risks upfront can therefore be minimised. Installation can be arranged as a low cost component of the sales package for each vehicle.
Once this market begins to saturate, recharging points may need to be provided at other property types in the longer-term (2030+). It becomes increasingly expensive to install recharging points at these locations and the need will depend on how the market develops. Depending on the emissions reduction achieved in other sectors and the availability of sustainable bio-fuels, it may not be cost effective.
• Tenanted properties, where the split incentive between tenant and landlord may be a barrier to access. In this case, some level of policy intervention may be required.
• On-street residential recharge points (for those without off-street parking) and/or workplace recharge points (for those where access cannot be adequately arranged at home). There are significant risks in this type of investment, which Government policy intervention may need to help overcome.
‘Rapid’ public recharging cannot simply be dismissed. Although it is very unlikely to add much to the achieved CO2 emissions reduction or be an affordable solution to the range limit of pure battery electric vehicles; relative to the next alternative available to a plug-in hybrid electric vehicle owner when they refuel, it may be cost competitive in the long-term in certain niches.
It is therefore important to plan for its potential future integration into the energy system if a commercial business case emerges, but there does not appear to be a case for Government policy intervention.
Optimise upgrading of electricity distribution networks: Electricity distribution network reinforcement is likely to be needed in some areas. However, due to the difficulty of forecasting localised vehicle uptake and recharging behaviour, combined with a lack of instrumentation in the existing network to determine capacity headroom, it will remain almost impossible to predict with any accuracy which network assets will require reinforcement, when and by how much to meet long-term needs. The distribution network business model will need to accept a much higher degree of uncertainty in its forward planning and investment commitments than it does today.
Given the current way in which electricity distribution network operators are regulated, there are risks to whether network operators will invest and whether they will do so in the most cost effective way. The regulator has an important facilitating role in ensuring the market functions effectively. Further work is required to determine the optimum strategy and regulatory framework for managing the uncertainty to minimise costly repeated incremental upgrades.
Increase the integration of energy supply and demand: There are various challenges and significant cost opportunities from tighter integration of electricity supply and demand. There are also system resilience and peak capacity cost reduction opportunities from tighter integration of electric and liquid fuels supply for light vehicles.
The most important first step is to develop the appropriate market frameworks. Some of the enabling steps are already underway (the deployment of Smart Meters and the Data Communications Company infrastructure, for example). Further work is required to determine the required market framework, enabling standards, consumer propositions and business models. There are significant research and development opportunities for the supporting technologies and control algorithms.
Recharge points beyond owner-occupier homes with off-street parking are not needed for at least 10+ years
Research and development for advanced sustainable bio-fuels is critical
39 3kW is the same capacity as a standard domestic plug socket

71 Chapter 4 Energy Technologies Institute www.eti.co.uk
Create and maximise the bio-fuel opportunity: For bio-fuels to have a role, they must be sustainable. The first priority is to set clear, long-term sustainability criteria to underpin innovation. Then, the optimum proportion of bio-fuel can be left to the market to determine.
Research and development is needed to fully exploit the high value of the bio-fuel opportunity, including academic led research and industry led development. In the liquid / electric fuel path, this is the most significant research and development opportunity on the energy side.
A key enabler to realising the full potential of the bio-fuel opportunity is to ensure the parc is compatible with high blend bio-fuels by the mid 2020s. Given that vehicles typically last well over a decade, it is important to sell and promote compatible vehicles now. However, a fuel grade standard for ‘high blend bio-fuel’ has not been fixed as yet, nor has a timetable for its introduction or phasing out of the current low blend bio-fuel grade. While multiple grades could be introduced over the period to 2050, each one needs to be maintained for legacy vehicles so it would be preferable to make the transition just once. In a similar way to the transition from leaded to unleaded gasoline the Government has an important role to play in leading this transition.
The business case for sustainable bio-fuel investment is strong if the cost of carbon is reflected in prices. It also needs long-term confidence in the underpinning policies and for there to be a level playing field between options.
Invest in the oil supply system: Significant investment is needed:
• To configure refineries for maximum aviation and diesel and minimum gasoline fuel outputs. The low liquid fuel consumption of the liquid / electric fuel path is unlikely to consume all the surplus gasoline produced due to diesel and aviation fuel demand.
• Potentially to increase the diversity of crude oils the UK refinery system can process – to increase the diversity of usable supply sources and hence improve energy security.
• To prepare the distribution system for high blend bio-fuels.
• Potentially to increase storage capacity for crude oil and/or refined products, given the declining domestic crude oil supply and consequent energy security risks.
There are however significant risks as to whether industry will invest in UK operations or overseas instead due to very low profitability of the UK downstream oil industry[28]. If the energy security advantages of a domestic refining industry are to be maintained, some level of Government policy support may be needed. Further work is needed to determine the optimal policy options. Further research is needed on the optimum uses of the crude oil fractions in a low carbon world, and potentially to develop advance refinery technologies for upgrading light fractions to aviation and diesel fuels and/or technologies to put the light fractions to alternative uses.
Given the importance of the petrochemicals industry and the effect reducing transport fuel demand may have, research into advanced technologies for their future supply may be valuable.
Balance the costs equitably: There are significant risks to equity between different segments of society, especially during the transition period. There is a significant role for policies to help manage the impact of the transition across society. Further work is required to determine the optimal combination of policies to mitigate the future issues that are likely to arise, including a need for new sociology research to inform the design of publicly acceptable policy.
Develop better statistics: The Department for Transport’s National Travel Survey and other statistics have proved invaluable in developing this strategy. However, the data for passenger cars is far more extensive than for light commercial vehicles. The latter is likely to increase significantly in the coming years, so a similar level of statistical data will be important to help inform development.
Significant investment will be required to upgrade the oil supply system

72 Chapter 4 Energy Technologies Institute www.eti.co.uk
0%
25%
50%
75%
100%
2010 2020 2030 2040 2050
Marketfl exibility
Liquid fuelled only
PHEV (liquid)
NOTE: Niche (short distance) consumers may opt for a BEV, but this woulddisplace PHEVs and would not impact carbon or energy system design.
OPTION – viability depends on 2035+ compatibility of vehicles and user willingness to break journeys
OPTION – depends on economics relative to bio-fuels in 2030+
55%
to 6
5%
60%
to 8
0%
65%
to 8
5%
Infr
astr
uctu
re
3kW recharge points in communal home parking
Integration systems for demand control + communal / on-street / work access control
3kW points on-street (for w/o off-street only)
Compatibility grade liquid fuels (<B7 and <E10)
3kW points at work (for w/o home point only)
Upgraded refi neries for max diesel and aviation fuel output
Supplementary‘rapid’ rechargepoints
Increasingly effi cient ICEs and hybrids – low-bio tolerant
Vehi
cles
Shar
e of
par
c
Plug-in hybrid vehicles with increasing electric range
3kW recharge points in homes and commercial depots
‘Decarbonised’ electricity
High bio-blend liquid fuels (>B7 and >E10)
Effi cient ICEs and hybrids – high-bio tolerant
‘Reinforced’ electricity network
NOTE: Shift back towards gasoline vehicles needed to balance refi nery outputs
0% 0%
20% 20%
40% 40%
60% 60%
80% 80%
100% 100%
Ener
gy re
lati
ve to
20
10 (T
Wh
/ yea
r)
2020
2020
2010
2010
2025
2025
2015
2015
2030
2030
2035
2035
2040
2040
2045
2045
2050
2050
Total energy in H2 mode
Total energy in electric mode
Total energy in bio-gasoline
Total energy in fossil-gasoline
Total energy in bio-diesel
Total energy in fossil-diesel
Low biofuel (80% reduction in emissions)*
High biofuel (~95% reduction in emissions)
* Depending on the relative costs of carbon reduction in other sectors, this may be signifi cantly more than necessary to meet UK 2050 energy and climate change goals. The ETI ESME analysis, as discussed in Part 1, suggests a 60% CO2 reduction from light vehicles may be suffi cient. If so, the more expensive components of electrifi cation (going beyond those homes with off-street parking and increasing plug-in hybrid electric vehicle battery sizes to ‘long-range’) may not be necessary.
Figure 59: Market Development for Low Carbon Energy Infrastructure for Light Vehicles by 2050
Figure 60: Energy Consumption in the Electric / Liquid path to 2050

73 Chapter 4 Energy Technologies Institute www.eti.co.uk
0
500
1000
1500
3000
2000
3500
2500
4000
Nor
th E
ast
Nor
th W
est
York
shire
and
th
e H
umbe
r
East
Mid
land
s
Wes
t M
idla
nds
East
Gre
ater
Lon
don
Sout
h Ea
st
Sout
h W
est
Wal
es
Scot
land
Nor
ther
n Ire
land
Litr
es o
f ret
aile
d
liqui
d fu
el p
er s
q. k
m.
Most areas will have a similar demand density to that of Scotland currently, where retail infrastructure provision in the rural areas is fi nancially problematic already.
Current
2050
0
0
1995
1995
2000
2000
2005
2005
2010
2010
2015
2015
2020
2020
2025
2025
2030
2030
2035
2035
2040
2040
2045
2045
2050
2050
0
0
1
1
2
2
3
3
4
4
5
5
6
6
5000
5000
10000
10000
15000
15000
Num
ber o
f re
fuel
ling
stat
ion
site
sN
umbe
r of
refu
ellin
g st
atio
n si
tes
If the number of stations remains constant, their throughput will fall signifi cantly...
But if throughput is to remain constant, the number of stations will need to fall signifi cantly...
Aver
age
site
thro
ughp
ut(m
illio
n lit
res
per y
ear)
Aver
age
site
thro
ughp
ut(m
illio
n lit
res
per y
ear)
Around 1 station for every 3,500 cars or 1 station in every 10 square miles
Number of refuelling station sites Number of refuelling station sites (future) Av. site throughput [million litres per year] Av. site throughput [million litres per year] (future)
Around 1 station for every 17,500 cars or 1 station in every 45 square miles
Figure 61: Liquid Fuel Consumption per Square Kilometre40
Figure 62: Impact of Declining Fuel Consumption on Refuelling Stations and/or their Throughput
40 Scaling of current liquid fuel demand distribution[3]

74 Chapter 4 Energy Technologies Institute www.eti.co.uk
4-3: Insurance option: hydrogen fuel for light vehicles
The risk and cost of hydrogen for light vehicles is only needed if the bio-energy opportunities are not expected to be successful. They will need to be virtually decarbonised. Fossil fuel would no longer be acceptable and bio-fuel would not be available. Liquid fuel for light vehicles would need to be phased out.
There are risks to the success of an electric / liquid fuel mix for the energy infrastructure for light vehicles in meeting the UK energy and climate change targets. In particular hydrogen fuel for vehicles may be the only way to meet UK energy and climate change goals if the following conditions are all true:
1. Biomass electricity generation with CCS is not expected to be successful (hence fossil fuel must be almost eliminated for light vehicles); and
2. Insufficient sustainable bio-fuel is expected to be available (leading to a need to phase out mass-scale liquid fuel infrastructure, given the first condition); and
3. The UK’s 2050 greenhouse gas reduction target is sustained above 75%.
There is also a risk to UK industrial positioning if other nations decide to progress with hydrogen energy for light vehicles, with the consequence being that the UK may lose out on any industrial opportunities that arise.
The UK has a choice as to whether to accept these risks or to develop hydrogen as an ‘insurance’ option to mitigate the risk. It may, however, be possible for the UK to ‘buy-in’ at a later date if other nations do progress with developing the hydrogen option in any case. There is a choice for the UK as to whether to focus its resources into giving the electric / liquid fuel path the greatest chance of success or to split its resources to simultaneously develop hydrogen as an insurance option.
The key components of developing hydrogen as an insurance option and then deploying it into the market as an adaptation to the least cost electric / liquid fuel path already described are:
• Investment from now in research, development and planning for hydrogen infrastructure and vehicle technologies. On the infrastructure side, the focus needs to be on:
° Systems integration and optimisation – fuel quality and fuel pressure standards.
° Cost reduction in the supply chain, including on-site storage of high pressure hydrogen, refuelling station point development.
° Safety and planning constraints for refuelling station sites location and operation.
On the vehicle side, the focus needs to be on:
° Systems integration and optimisation.
° High pressure storage of hydrogen on vehicles.
° Hydrogen conversion to motive power through fuel cells or combustion engines.
• Phasing-in hydrogen production, distribution and refuelling infrastructure from 2025, together with a gradual phasing-in of hydrogen fuelled vehicles.
• Gradual phasing-out of liquid fuel for light vehicles. Given the length of time taken to transition the vehicle parc (vehicles typically last well over a decade), the liquid fuel infrastructure will need to be maintained in parallel for a period of around 20 years. This adds significantly to any overall cost of transition.
It may be better for the UK to focus on giving the liquid fuel / electric path the greatest chance of success

75 Chapter 4 Energy Technologies Institute www.eti.co.uk
H2 ICEs
H2 FCVs
0%
25%
50%
75%
100%
2010
2020
2030
2040
2050
Marketfl exibility
Liquid fuelled only
PHEV (H2)
H2 fuelled only
Currently unclear whether H2 ICEs or FCVs most cost effective; impact on H2 volume rather than fundamental infrastructure design
Hydrogen / electric plug-in hybrid vehicles
Phase out liquid fuelled light vehicles
Phase out liquid fuels for light vehicles
Investment in hydrogen vehicle research, development and planning
Investment in hydrogen infrastructure research, development and planning
Infr
astr
uctu
re
‘Upstream’ H2 production/distribution systems
H2 refuelling stations
Vehi
cles
Shar
e of
par
c
0%
20%
40%
60%
80%
100%
Ener
gy re
lati
ve to
201
0
(TW
h / y
ear)
2020
2010
2025
2015
2030
2035
2040
2045
2050
Total energy in H2 mode
Total energy in electric mode
Total energy in bio-gasoline
Total energy in fossil-gasoline
Total energy in bio-diesel
Total energy in fossil-diesel
Figure 63: Deviation from the Electric / Liquid Fuel Path to Deploy the Insurance Option of Hydrogen
Figure 64: Energy for the Electric / Hydrogen Path (~95% Emissions Reduction)
The Government may need to explicitly support the deployment of a hydrogen infrastructure if it is to occur sufficiently rapidly from 2025 to impact on the UK light vehicle system by 2050. A possible future policy choice (around 2025) may be to invest in the initial infrastructure, from which the private sector can take over its ongoing development, or to provide incentives or guarantees for private sector investment.
It does not currently appear likely the energy industry will invest sufficiently in innovation, development and planning to make hydrogen a realistic insurance option for mass-scale infrastructure deployment by 2025. Given the relatively low probability that a hydrogen infrastructure will be required for light vehicles, this is unlikely to be overcome by internalising the cost of carbon into the cost of the energy supply for light vehicles. There is a near-term choice for Government policy:
A high level of Government support is likely to be needed to make hydrogen a credible insurance option by 2025

76 Chapter 4 Energy Technologies Institute www.eti.co.uk
• Invest in hydrogen infrastructure research, development and planning for light vehicles from now to 2025 to create a credible insurance option and maintain UK industrial positioning for future opportunities in hydrogen energy for light vehicles; or
• Accept there is a risk carbon emissions reduction for light vehicles may not be quite sufficient by 2050 – impacting overall 2050 carbon emissions reduction by a few percent – and that UK industry may not be well positioned to exploit any future opportunities.
The German hydrogen energy programme presents an interesting case study on the sort of programme that may be needed if the UK wishes to become a serious contender[49]:
4-4: How much will it cost and when will the carbon benefits be seen?
The costs in 2050 for a low carbon light vehicle system are likely to be modest (~5% increase compared with ‘do nothing’), however the transition costs to reach that point are much more significant. The cost of private sector borrowing, especially for infrastructure, depends heavily on industry confidence in the long-term stability of government policy.
The following chart shows additional cost and carbon reduction relative to a ‘do nothing’ design solution (i.e. no technological improvement beyond that which is already in progress for meeting the current regulatory target for vehicle sales in 2015). The technologies have been ranked in order of cost, with the lowest cost design solution being efficient internal combustion engine vehicles (including conventional hybrids). Energy cost savings enable this least cost design solution to yield a cost reduction in 2050 (albeit with a significant transition cost hurdle) and around a halving of carbon emissions.
As efficient conventional vehicles are displaced from the vehicle mix in favour of plug-in hybrid electric vehicles with progressively larger batteries, the overall cost for vehicles and their energy is likely to increase.
The chart demonstrates that additional ongoing costs from 2050 are likely to be relatively modest. But there are significant transition costs. As infrastructure investments are made and new technologies are added to vehicles, costs are likely to escalate significantly. Once these investments have been made and production costs have fallen due to learning curve effects, costs will fall again and stabilise sometime after 2050.
To progress to a deeper level of carbon reduction from light vehicles would require either an increase in the available bio-fuel supply for light vehicles or the deployment of a hydrogen infrastructure. This is only necessary if sufficient headroom cannot be opened for light vehicles by greater emissions reductions in other sectors. A good example is the potential for negative carbon emissions from biomass electricity generation in combination with carbon capture and storage. Both bio-fuel availability and hydrogen viability have significant uncertainties, so are not shown in the diagram.
For the last step of carbon reduction through high biofuels or hydrogen, the room left for further carbon reduction is small. The marginal cost of carbon abatement is likely to be high and the effective cost of carbon to drive this last change is likely to need to be very high.
“The focus of German activity is the National Organization for Hydrogen, or NOW. NOW was conceived as a public-private collaboration and is managed by a board that includes major industrial and public sector institutions. It was given a national mandate by the German government in 2005, with 10-year funding that provides certainty and stability.
NOW coordinates the National Innovation Program for Hydrogen and Fuel Cells (NIP), which has grown into a €1.4 billion ($1.87 billion) program, with roughly 30% of the funds spent on research and 70% on demonstration programs. Just over half of NIP funding supports transportation applications...”

77 Chapter 4 Energy Technologies Institute www.eti.co.uk
Figure 65: The Marginal Economics and CO2 Benefits of Electric / Liquid Path Relative to ‘Do Nothing’41
41 ETI analysis (£ [2010]; for energy consumption and new car capital; no discounts or interest applied, finance costs excluded)
Financing costs are excluded from the chart above (to provide clarity on the underlying technology costs), which potentially has a very significant effect on the end cost for carbon reduction. Greenhouse gas emissions reduction is a pure policy objective, viewed from the perspective of commercial investors. Sustaining confidence in the right mix of government policy drivers over the decades required for a successful transition is critical to the cost of capital. As is some level of collaboration between the energy and automotive industries.
The automotive industry has numerous opportunities to manage risk. Vehicles can be built to order, sold in different market territories; many of the technologies are transferrable between different vehicle types, etc. Conversely, the energy industry has few opportunities to manage risk. Once built, it is generally not possible to relocate or repurpose an energy infrastructure. The energy industry is dependent on (and its cost of capital is heavily influenced by):
• Stability of the long-term policy landscape to secure a return on investment over a 20+ year time horizon;
• Vehicle manufacturer choices as to which vehicle types to introduce to market, where, when and at what price; and
• Consumer choices on which vehicles to buy, where and when.
The timing component of these major risks is crucial for large scale energy infrastructure projects. Vehicles arriving to market, or bought by consumers, later than planned creates a backlog of capital financing costs that rapidly erodes any chance of eventually making a profitable return.
The infrastructure risks are inherently higher for more revolutionary step change transformations in the energy infrastructure; such as that required for hydrogen. It is highly likely that investment in hydrogen energy infrastructure for light vehicles will incur a much higher cost of capital than the more evolutionary path of a fossil, bio and electric fuel mix for light vehicles.
Cost of capital for infrastructure impacts consumer prices; perceived risk is critical
2020
2025
2030
2035
2040
2045
2050
-10%
-5%
0%
5%
10%
15%
20%
25%
120%
0%
20%
40%
60%
80%
100%
Upgrade from ‘do nothing’ to effi cient ICEs and limited bio-fuel
Add electric infrastructure (network reinforcement, recharge points)
Add short range PHEVs
Upgrade to medium range
Upgrade to long range
+ / -
Cos
t(f
rom
‘do
noth
ing’
)C
arbo
n re
duct
ion
(fro
m 2
010)
Costs for extra carbon reduction with high bio-fuel or H2 are highly uncertain
Extra carbon reduction would require high bio-fuels or H2Reference: residual emissions

78 Chapter 4 Energy Technologies Institute www.eti.co.uk
An important secondary factor associated with the cost of carbon reduction and the transition pathway is equity between different segments of society. The key issues include:
• Increased costs may reduce the affordability of light vehicles.
• The least affluent generally have little access to capital and depend on older vehicles (those that are higher carbon emitters during the transition period), so will be more susceptible to carbon taxes. The proportion of income spent on fuel duty is already twice as high in the poorest 20% as the richest 20% of the population[10].
• Those without off-street parking will have more practical constraints to electric recharge point access, so will remain dependent on liquid fuels (carrying a scarcity or carbon premium).
• Rural communities may be at risk of losing refuelling station provision as the population density is too low. This is already the case in parts of rural Scotland, requiring Government subsidy. In the first instance, closures undermine local competition and hence affordability.
Increasing cost of ownership and use will impact affordability of travel, especially during transition

79 Energy Technologies Institute www.eti.co.ukReferences
[1] Electricity Market Reform https://www.gov.uk/government/policies/maintaining-uk-energy-security--2/supporting-pages/electricity-market-reform
[2] ETI Energy System Modelling Environment (ESME); September 2012 http://www.eti.co.uk/technology_strategy/energy_systems_modelling_environment/
[3] Department for Transport official statistics https://www.gov.uk/government/organisations/department-for-transport/about/statistics
[4] Identification of Relevant Consumer Segments; April 2011 ETI Consumers and Vehicles project deliverable 1.3-6
[5] An Independent Report on the Future of the Automotive Industry in the UK (New Automotive Innovation and Growth Team (NAIGT)); 2009 http://www.bis.gov.uk/files/file51139.pdf
[6] Automotive Council Technology Roadmaps http://www.automotivecouncil.co.uk/what-we-do/reports/
[7] Statistical Review 2012; UK Petroleum Industry Association (UKPIA); June 2012 http://www.ukpia.com/Libraries/Download/Stats_review_2012.sflb.ashx
[8] Network Rail http://www.networkrail.co.uk/
[9] Realising the Potential of GB Rail; May 2011 http://www.rail-reg.gov.uk/server/show/ConWebDoc.10401
[10] National Statistics http://www.statistics.gov.uk/hub/index.html
[11] Digest of UK Energy Statistics (DUKES); DECC https://www.gov.uk/government/organisations/department-of-energy-climate-change/series/
digest-of-uk-energy-statistics-dukes
[12] British Social Attitudes Survey 2011: Attitudes to Transport; March 2012 https://www.gov.uk/government/publications/british-social-attitudes-survey-2011-attitudes-
to-transport
[13] ETI Analysis of data from the UK-AIR Data Archive http://uk-air.defra.gov.uk/data/
[14] National Atmospheric Emissions Inventory http://naei.defra.gov.uk/
[15] Trends in NOx and NO2 Emissions and Ambient Measurements in the UK; July 2011 http://uk-air.defra.gov.uk/reports/cat05/1108251149_110718_AQ0724_Final_report.pdf
[16] Quantifying Consumer Behaviour; June 2011 ETI Consumers and Vehicles project deliverable 1.4 8A
[17] Consumer Based Uptake and Usage Model; June 2011 ETI Consumers and Vehicles project deliverable 1.4 8B
[18] ETI Analysis of the UK National Travel Survey / ETI Light Vehicle Usage Models
[19] LCV Scoping Study – Phase 1: Review of Published Literature; August 2006 http://assets.dft.gov.uk/publications/pgr-freight-research/pgelcvstudy.pdf
References

80 Energy Technologies Institute www.eti.co.uk
[20] Reducing CO2 Emissions from Passenger Cars (EU Legislation) http://ec.europa.eu/clima/policies/transport/vehicles/cars/index_en.htm
[21] Reducing CO2 Emissions from Vans (EU Legislation) http://ec.europa.eu/clima/policies/transport/vehicles/vans/index_en.htm
[22] UK Automotive Council http://www.automotivecouncil.co.uk/
[23] Future Capability and Performance of Vehicles; May 2011 ETI Consumers and Vehicles project deliverable 1.1 6
[24] Vehicle Cost Driver Analysis; January 2011 ETI Consumers and Vehicles project deliverable 1.2 5
[25] Fuel Cell Vehicles (From Auto Manufacturers); November 2012 http://www.fuelcells.org/wp-content/uploads/2012/02/carchart.pdf
[26] International Hydrogen Fueling Stations; January 2013 http://www.fuelcells.org/wp-content/uploads/2012/02/h2fuelingstations-world1.pdf
[27] UK Refining & Product Distribution Terminals; July 2012 http://www.ukpia.com/Libraries/Download/UK_map_of_refineries_and_terminals_-_July_2012.sflb.ashx
[28 Downstream Oil – Short-term Resilience and Longer-term Security of Supply; April 2010 https://www.gov.uk/government/uploads/system/uploads/attachment_data/file/69758/1779-downstream-oil-short-term-resilience.pdf
[29] Petroleum Industry Overview; http://www.ukpia.com/industry_information/industry-overview.aspx
[30] The Gallagher Review of the Indirect Effects of Biofuels Production; July 2008; http://webarchive.nationalarchives.gov.uk/20110407094507/http://renewablefuelsagency.gov.uk/sites/renewablefuelsagency.gov.uk/files/_documents/Report_of_the_Gallagher_review.pdf
[31] ETI Bioenergy Programme
[32] Charging Network Requirements; March 2011 ETI Electricity Distribution and Intelligent Infrastructure project deliverable SP2/E.ON/04
[33] Costs and Supply Chain Analysis; 2011 ETI Electricity Distribution and Intelligent Infrastructure project deliverable SP2/E.ON/05
[34] ETI Analysis of the English Housing Survey https://www.gov.uk/government/publications/english-housing-survey-2009-to-2010-household-report
[35] ETI Smart Systems and Heat Programme
[36] ETI Analysis of National Grid Metered Half-hourly Electricity Demands (2008 to 2011 data) http://www.nationalgrid.com/uk/Electricity/Data/Demand+Data/
[37] Comparison of Heat and Electricity Demand Variability Across a Year (Domestic and Commercial) – 2010; R Sansom, Imperial College
[38] ETI Energy Storage and Distribution Programme
[39] Electricity Distribution Network Assessment and Analysis; April 2011; ETI Electricity Distribution and Intelligent Infrastructure project deliverable SP2/EDFEN/04
[40] EVs – Meeting the Demand (Presentation by David Densley of SSE); February 2012
References

81 Energy Technologies Institute www.eti.co.uk
[41] Bucks for Balancing: Can Plug-in Vehicles of the Future Extract Cash – and Carbon – from the Power Grid? http://www.ricardo.com/Documents/Downloads/White%20Paper/Plug%20In%20Vehicle%20of%20Future/Bucks%20for%20balancing%20-%20can%20plug-in%20vehicles%20of%20the%20future%20extract%20cash%20%E2%80%93%20and%20carbon%20%E2%80%93%20from%20the%20power%20grid.pdf
[42] UKH2Mobility: Synopsis of Phase 1 Results; February 2013 http://news.bis.gov.uk/imagelibrary/downloadmedia.ashx?MediaDetailsID=6299
[43] ETI Analysis of data in the Roads2HyCom report ‘Industrial Surplus Hydrogen and Markets and Production’; March 2007
[44] Adapted from John A. Turner, Science, 285, 687 (1999) for EU-HFP-SRA
[45] ETI Analysis of UC Davis Hydrogen Model (Steady-State City Hydrogen Infrastructure System Model (SSCHISM)) http://steps.ucdavis.edu/research/tracks/hydrogen-1
[46] A Portfolio of Power-trains for Europe: a Fact-based Analysis http://ec.europa.eu/research/fch/pdf/a_portfolio_of_power_trains_for_europe_a_fact_based__analysis.pdf
[47] Scenario Development Final Report; May 2011 ETI Economics and Carbon Benefits project deliverable WS3/ARUP/10
[48] Open University Technical Data Manual T862
[49] 2011 Fuel Cell Technologies Market Report; July 2012 http://www1.eere.energy.gov/hydrogenandfuelcells/pdfs/2011_market_report.pdf
References