transmission investment benefit-cost evaluation ...€¦ · transmission investment benefit-cost...
TRANSCRIPT

TRANSMISSION INVESTMENT BENEFIT-COST EVALUATION: “REASONABLENESS ASSESSMENT” OF TRANSMISSION INVESTMENT COST
ALLOCATION IN SPP
prepared by
Mathew J. Morey Christensen Associates Energy Consulting LLC
prepared for
Lincoln Electric System
Nebraska Public Power District
Omaha Public Power District
September 16, 2011

ChristensenAssociatesEnergyConsultingLLC Pagei
TABLE OF CONTENTS
EXECUTIVE SUMMARY .......................................................................................................... 1
1. PURPOSE OF THIS REPORT ............................................................................................. 4
2. PRINCIPLES FOR TRANSMISSION COST ALLOCATION ......................................... 5 2.1. The Net Economic Benefits of Electricity Production and Consumption .................... 5 2.2. Quantifying the Net Benefits of Transmission Investments ......................................... 7 2.3. Quantifying the Distribution of Net Benefits ................................................................ 9
2.3.1. Changes in Consumer Surplus (Use Value) ................................................... 9 2.3.2. Reduced Expected Outage Costs (Reliability Costs) ..................................... 9 2.3.3. Reduced Environmental Costs (Environmental Cost) ................................... 9 2.3.4. Changes in Generator Profits (Generation Profits) ...................................... 10 2.3.5. Reduced Generation Capital Costs (Generation Capital Costs) .................. 10
2.4. FERC Order No. 1000 ................................................................................................ 10
3. THE WHITE PAPER’S PROPOSAL ................................................................................ 13 3.1. Overview of the White Paper’s Approach .................................................................. 13
3.1.1. Three-Tiered Benefits Evaluation ................................................................ 13 3.1.2. Four-Stage Benefits Estimation ................................................................... 14 3.1.3. Benefit-Cost Ratio Thresholds ..................................................................... 14 3.1.4. Mitigation Approaches ................................................................................. 15
3.2. Assessment of the White Paper’s Approach ............................................................... 15 3.2.1. A Plethora of Benefits .................................................................................. 15 3.2.2. Zonal Benefit-Cost Tests ............................................................................. 17 3.2.3. Managing Risk and Uncertainty in Net Benefit Tests ................................. 18 3.2.4. Mitigation of Zonal Benefit-Cost Imbalances ............................................. 20
4. CONCLUSION AND RECOMMENDATIONS ................................................................ 22
APPENDIX A. BACKGROUND ON SPP’S TRANSMISSION COST ALLOCATION AND THE RARTF ...................................................................................................................... 23
A.1. SPP’s Transmission Cost Allocation History .............................................................. 23 A.2. The Regional Allocation Review Task Force .............................................................. 24
APPENDIX B. SPP’S COST ALLOCATION METHODS .................................................... 25 B.1. Overview of Past and Present Allocation Methods ..................................................... 25
B.1.1. Reliability Upgrades and Generation Interconnections ............................... 25 B.1.2. Balanced Portfolio Upgrades ....................................................................... 25 B.1.3. Highway/Byway Cost Allocation ................................................................. 26
B.2. Assessment of SPP’s Current Cost Allocation Method ............................................... 27

ChristensenAssociatesEnergyConsultingLLC Page1
TRANSMISSION INVESTMENT BENEFIT-COST EVALUATION: “REASONABLENESS ASSESSMENT” OF TRANSMISSION INVESTMENT COST
ALLOCATION IN SPP
EXECUTIVE SUMMARY
The Southwest Power Pool (SPP) recently issued a White Paper on transmission cost allocation and transmission project benefit estimation, including a “reasonableness assessment” for identifying and resolving any zonal inequities created by SPP’s present Highway/Byway zonal transmission cost allocation method. The Nebraska utilities (Lincoln Electric System (LES), Nebraska Public Power District (NPPD), and Omaha Public Power District (OPPD)) asked Christensen Associates Energy Consulting (CA Energy) to review the White Paper’s proposals for conducting a “reasonableness assessment and to suggest alternatives to or variations of these proposals.
Building on elements of the White Paper’s proposed approach, this paper lays out an economic framework defining a “reasonableness assessment” focused on quantifiable financial metrics that can support a relatively straightforward net benefits test for inequities in zonal transmission cost allocations. We endorse in principle the White Paper’s proposal to use zonal transfers or a similar form of reconciliation of zonal cost allocations to mitigate allocation inequities, though the methods that we propose to accomplish this differ from those of the White Paper, such as adjusting cost allocations associated with future projects while the initial inequity exists.
As a matter of economic efficiency and in compliance with the recent Order No. 10001 of the Federal Energy Regulatory Commission (FERC), transmission cost allocations should reflect the benefits of the transmission investments for which costs are being recovered; and the benefit estimates that underlie the cost allocations should be the very same benefits that are quantified as part of the transmission planning process. Because the SPP’s “Highway/Byway” method allocates costs primarily on the basis of transmission facilities’ voltage levels, however, it can and often will create a mismatch between benefits and costs that needs to be resolved through an ongoing “reasonableness assessment” process. Fortunately, this latter process can be designed to achieve a reasonable match between benefits and costs.
To address transmission cost allocation equity issues, the White Paper considers a wide range of benefit metrics and proposes a complex method for conducting a benefit-cost test to identify zonal cost allocation inequities. It identifies three specific options for mitigating inequities.
The White Paper’s proposed test has the right idea; compare benefits and costs over time for easily quantified metrics and some metrics less easily quantified. And the White Paper’s proposed list of mitigation approaches includes an economically efficient solution achieved through some variant of the “zonal transfers” concept, such as used previously by SPP to address inequities in cost allocations for Balanced Portfolios, and which can be adapted in a variety of ways to address inequities created by zonal cost allocations under the Highway/Byway method.
1 Federal Energy Regulatory Commission, Order No. 1000, Transmission Planning and Cost Allocation by Transmission Owning and Operating Public Utilities, 18 CFR Part 35, Docket No. RM10-23-000, July 21, 2011 (Order No. 1000).

ChristensenAssociatesEnergyConsultingLLC Page2
With modifications to the Staff’s proposed approach, a “reasonableness assessment” can be conducted that will satisfy the criteria of simplicity, efficiency, and fairness. Our proposed “reasonableness assessment” consists of:
Financial quantification of benefit metrics for each SPP zone over a reasonable time frame, with benefit metrics representing reliability, economic, and public policy objectives, and generally in keeping with the “conservative” and “moderate” tiers of the White Paper’s proposed approach;
Calculation of a present discounted net benefit (i.e., benefit minus cost) value for each SPP zone;
Accounting for uncertainty in zonal net benefit values in two ways:
o scenario analysis that produces an expected zonal net benefit value (i.e., an average net benefit value based on probability weighted scenario outcomes), and
o probability weighting of zonal net benefit values to account for the increasing uncertainty associated with net benefit values computed at time points further out in time;
A net benefit test of whether a zone’s expected net benefit-to-cost ratio is sufficiently below 1.0 to warrant mitigation (i.e., where a zone appears to be an outlier),2 with test thresholds below 1.0 set to avoid triggering mitigation unnecessarily; and
Mitigation by means of zonal transfers or some similar zonal cost allocation reconciliation mechanism, such as choosing not to assign costs to some zones that may continue to present significantly low expected net benefit-to-cost ratios.
Our approach seeks to reduce some of the complexity that we perceive is created by the White Paper’s approach. Our recommended approach considers financially quantifiable benefit metrics that are generally consistent with the “conservative” and the “moderate” tiers defined in the White Paper. Our proposal avoids qualitative benefit metrics that add a layer of subjectivity and arbitrariness to a “reasonableness assessment” that is already difficult when based solely on financially quantifiable metrics. Consequently, our recommendations are as follows.
Exclude from the benefit-cost analysis the “broad” tier metrics because either: a) they do not correspond to the benefits delivered by a transmission line when brought into service, which is what the analysis is all about; b) they do not represent benefits at all; or c) they are already captured in the “conservative” and “moderate” tier metrics.
Base any net benefits test on a zonal net benefits measure that incorporates, in a single value, all financially quantifiable metrics.
Compute zonal net benefits on an expected present discounted basis. This avoids the complexity of the multi-tiered, multi-staged testing approach proposed in the White Paper.
2 The definition of “sufficiently below 1.0” and “zonal outlier” will be subject to some unavoidable arbitrariness, guided by principles of efficiency and fairness.
ChristensenAssociatesEnergyConsultingLLC Page3
Measure the distribution of expected zonal net benefits as part of the quantification of upgrade benefits during the transmission planning process, making the “reasonableness assessment” an integral part of the ex ante planning process, which is consistent with FERC’s expressed policy position in Order No. 1000.
Design the decision rule that determines when mitigation occurs so that it accounts for the inevitable variability in the estimate of zonal net benefits across a range of scenarios and over time. This will reduce the risk of falsely identifying zonal inequities
Because a “reasonableness assessment” will be conducted every three years, set in place any reconciliation of zonal imbalances for only three years. The mitigation of a zonal misalignment necessarily should address the instances where a zone will bear in the immediate future a disproportionate share of the costs of transmission projects that are known to be brought into service within the ensuing three-year period. If the misalignment is found to remain at the time of the next “reasonableness assessment,” mitigation continues, otherwise, it may be adjusted according to the estimate of expected net benefits.
The benefits measured on a zonal basis in a “reasonableness assessment” of transmission cost allocations should include:
Reliability (Expected Outage) Benefits measured using Loss of Load Expectation (LOLE) multiplied by the Value of Lost Load. 3
Environmental Benefits based on environmental goals or public policy mandates for the zone and ability to achieve those goals.
Generation Operating Cost Benefits measured by Adjusted Production Cost (APC). Generation Capital Cost Benefits measured by changes in planned generation. Transmission Capital Cost Benefits measured by the value of delayed or avoided
transmission projects.
3 If a reliability standard is too restrictive, reliability rules may require an upgrade that does not satisfy the general rule that benefits exceed costs. The reliability standard may trump the benefit-cost analysis. In such cases, the estimated reliability benefit of the upgrade should be raised until benefits do exceed costs because a higher benefit is implied by the reliability standard; and the costs of the upgrade should be allocated accordingly, as described in Section 2.3.2.
ChristensenAssociatesEnergyConsultingLLC Page4
1. PURPOSE OF THIS REPORT
The challenges of transmission investment cost allocation have vexed electricity regulators and market participants since the passage of the Energy Policy Act of 19924 set the stage for the U.S. power industry restructuring that continues to this day. FERC has attempted to address the cost allocation issue through a number of major orders, notably including Order No. 888 in 19965 and Order No. 1000 just this year. FERC’s orders, with some guidance from court rulings, have laid down general principles for cost allocation, including non-discrimination among transmission customers and allocation among customers according to some measure of the benefits that they receive from transmission service. FERC has allowed Regional Transmission Organizations (RTOs) wide latitude in implementing these principles. Consequently, the power industry has addressed the challenges of transmission cost allocation through approaches that have varied widely across regions and have changed dramatically over time within individual regions.
Like other RTOs, SPP has been searching for solutions to the transmission cost allocation problem. SPP’s approach has changed over time, and it has recently created a Regional Allocation Review Task Force (RARTF) to consider further refinements in its approach.
The purpose of this report is to assist the Nebraska Utilities in formulating their positions with respect to issues under consideration by the RARTF. Section 2 of this report provides a framework for assessing the reasonableness of transmission cost allocation methods, with an emphasis on finding methods for allocating transmission investment costs among SPP transmission owners in a manner that is commensurate with the benefits that they receive from such investments. Section 3 then reviews and evaluates the methods proposed by the RARTF and SPP Staff for assessing the reasonableness of cost allocations made under the Highway/Byway rules. Section 4 offers a conclusion and recommendations for how best to approach a “reasonableness assessment” and mitigate benefit-cost inequities. For those unfamiliar with RARTF and SPP’s past and current transmission cost allocation methods, Appendices A and B provide brief overviews of these subjects.
In short, the purpose of this report is to provide the Nebraska Utilities with an independently developed set of ideas about reasonable approaches to transmission cost allocation issues. The goal of this report is to sweep away some of the confusion that has characterized the debate over the past decade and a half, and to provide a firm foundation for the ideas that the Nebraska Utilities can bring to their discussions with other SPP members within the RARTF meeting process.
4 See particularly Title VII. 5 Federal Energy Regulatory Commission, Order No. 888, Promoting Wholesale Competition Through Open Non-discriminatory Services by Public Utilities, 75 FERC ¶ 61,080, Docket No. RM95-8-000, April 24, 1996.
ChristensenAssociatesEnergyConsultingLLC Page5
2. PRINCIPLES FOR TRANSMISSION COST ALLOCATION
Given the bedrock principle that transmission upgrade costs should be borne by the beneficiaries of those upgrades, the benefit information provided by the transmission planning process should serve as a foundation for identifying beneficiaries and quantifying the benefits that they receive. This section begins with a discussion of the net economic benefits of electricity production and consumption. It then addresses how transmission upgrades change benefits and costs, explains how changes in benefits and costs may be quantified, and discusses how to quantify the changes in benefits that accrue to various market participants. The section concludes with a summary of some of the principles for transmission cost allocation that have been promulgated by FERC in Order No. 1000.
2.1. The Net Economic Benefits of Electricity Production and Consumption
The benefits of electricity consumption are measured by the use values that consumers derive from electricity. This is ordinarily quantified by demand curves that represent consumers’ willingness to pay for electricity. The net benefit that consumers derive from electricity – called “consumer surplus” – is equal to the amount by which use values exceed consumers’ payments for electricity.
The net benefit of electricity generation is measured by generators’ profits from the sale of electricity. Profits equal revenues minus operating costs (particularly fuel costs) and capital costs. Revenues minus operating costs are called “producer surplus.” Over the life of a generation investment, producer surplus needs to exceed capital costs if the generation firm is to make a profit.
Figure 1 depicts consumer surplus and producer surplus for a single hour for a situation in which generation and load are located in the same place. Supply, which increases with price, is denoted by upward-sloping line S; and demand, which falls with price, is denoted by downward-sloping line D. In the absence of market power, the market price (P) and the quantity produced and consumed (Q) are both determined by the intersection of the supply and demand curves.

ChristensenAssociatesEnergyConsultingLLC Page6
Figure 1 Illustration of Consumer Surplus and Producer Surplus in One Hour
In Figure 1, consumer surplus is measured by the triangle CS, which is the amount by which the use value of electricity (as measured by the demand curve D) exceeds the price that consumers must pay. Producers’ incremental operating costs are indicated by the supply curve S: for level of production Q, operating costs equal the area of the trapezoid OC. Producers’ surplus is measured by triangle PS, which is the amount by which price exceeds incremental operating costs.
The net benefits that consumers derive from electricity are compromised by the possibility of power outages. The reduction in net benefits is measured by expected outage costs, which are quantified by multiplying some measure of outage quantities (Loss of Load Expectation (LOLE)) by some measure of the costs that consumers incur when an outage happens (e.g., Value of Lost Load (VOLL)). One way of expressing expected outage costs is as follows:
Expected Outage Costs = LOLE × VOLL (1)
LOLE, which is expressed in MWh, can be quantified by production costing simulation models. VOLL, which is expressed in dollars per MWh unserved, has been quantified by numerous (and often inconsistent) studies that differentiate value by customer type.6
Generation production and consumption raise environmental concerns. The concerns that are related to air quality can be quantified according to the cost of emissions. For those emissions that are traded through markets (e.g., SOx), there are market prices for each ton of emissions.
6 A value-of-lost-load study could be performed for the SPP region or SPP could rely on value estimates that can be obtained from the academic studies conducted in the past, perhaps updated to account for inflation or factors (like customer mix) that are particular to SPP.
Price
P
CS
PS
Q
S
D
OC
Quantity
ChristensenAssociatesEnergyConsultingLLC Page7
For those emissions that are not traded through markets, prices need to be estimated. In either case, these air-related environmental costs can be quantified, albeit with some imprecision.7
Transmission congestion costs are not an additional category of costs. Transmission congestion costs arise from the fact that, unlike the situation depicted in Figure 1, generators and loads are usually not located in the same place. They should be quantified by generation costs: higher transmission congestion leads to higher generation costs. As discussed below, transmission upgrades do create benefits by reducing congestion; but these benefits are measured by reductions in generation costs.
In summary, the net benefits of electricity are captured by the following equation:
Net Benefit = Use Value – Expected Outage Costs – Environmental Costs
– Generation Operating Costs – Generation Capital Costs
– Transmission Capital Costs – Transmission Operating Costs (2)
where Use Value is measured assuming that all load is served.
2.2. Quantifying the Net Benefits of Transmission Investments
A transmission upgrade creates positive net benefits when it increases the Net Benefit shown in equation 2. That is, a transmission benefit creates positive net benefits if and only if the following equation holds true:
ΔUse Value – ΔExpected Outage Costs – ΔEnvironmental Costs
– ΔGeneration Operating Costs – ΔGeneration Capital Costs
> ΔTransmission Capital Costs + ΔTransmission Operating Costs (3)
where Δ indicates “change of.”8 Equation 3 says that a transmission upgrade provides positive net benefits when it induces an increase in Use Value plus reductions in Expected Outage Costs, Environmental Costs, Generating Operating Costs, and Generating Capital Costs that sum to a greater amount than the capital and operating costs of the transmission upgrade. Quantifying the net benefits of a transmission upgrade thus requires quantifying the net benefits of each of the five variables on the left-hand side of equation 3 along with a sixth benefit of reduced transmission capital and operating costs (if any) that are netted out in computing the right-hand side variable of equation 3.
Increased Use Value. Transmission upgrades can change consumers’ use values by allowing or inducing (through changed retail electricity prices) changes in the quantities of electricity consumed. Transmission upgrades may allow load growth in areas where load growth might not otherwise be possible. They may reduce downstream prices and increase upstream prices, thus inducing load increases for downstream consumers and
7 SPP’s documents mention land-use benefits of transmission (e.g., less land degradation) in cases wherein transmission may reduce generation needs. On the other hand, transmission lines also have negative land-use impacts. Because transmission arguably has both positive and negative land-use impacts and because the impacts are difficult to quantify, the text excludes these impacts from its discussion. 8 Except for the change in Use Value, changes in the other variables on the left-hand side of equation 3 will generally be negative.

ChristensenAssociatesEnergyConsultingLLC Page8
load reductions for upstream consumers.9 Quantifying increased Use Value requires: a) forecasts of the effects of transmission upgrades on power availability and on locational marginal prices (LMPs); b) information on the extent and manner in which consumers are exposed to LMPs; and c) estimates of the relationship of loads to prices. If load is assumed to be fixed, then transmission upgrades yield no change in Use Value.
Reduced Expected Outage (Reliability) Costs. Transmission upgrades can increase power system reliability by reducing the probability and/or extent of outages. Expected Outage Costs can be quantified as described in Section 2.1. Production cost simulation models, with and without a particular transmission upgrade, can be used to quantify the changes in expected unserved energy that are due to that upgrade.
Reduced Environmental Costs. Transmission upgrades can increase market access for low-emission generation resources (e.g., wind-power generation).10 The change in environmental costs due to an upgrade can be quantified as the sum of: a) the change in MWh dispatch for each generating unit due to the upgrade; times b) tons of emissions per MWh produced; times c) the price of emissions (in dollars per ton). In cases in which emissions reductions occur due to an environmental mandate like a Renewable Portfolio Standard (RPS), the price of emissions would be measured according to the prices of Renewable Energy Credits (RECs) or according to estimates of the emissions values implicit in the environmental mandate.
Reduced Generation Operating Costs. Transmission upgrades can reduce generating operating costs by allowing lower-cost generation to substitute for higher-cost generation. Production cost simulation models, with and without a particular transmission upgrade, can be used to quantify the change in generators’ operating costs.
Reduced Generation Capital Costs. Transmission upgrades can delay, reduce, or eliminate the need for some generation investments. Quantifying this benefit requires use of combined generation and transmission planning models.
Increased Transmission Capital and Operating Costs. Transmission upgrades entail capital expenditures and operating costs that can be forecast ex ante with reasonable accuracy and that are known ex post with great accuracy.
A transmission upgrade should be undertaken if and only if it satisfies equation 3.11 Since the variables in equation 3 can be quantified for the purpose of evaluating transmission investments, it should be possible to identify the groups of market participants (at least by zone) who benefit from each of the categories of benefit represented by those variables.
9 If a transmission upgrade increases power flows from location A to location B, location A is said to be “upstream” for the upgrade while location B is “downstream.” 10 Upgrades can also increase market access for higher-emission, low-cost coal generation. 11 If a reliability standard is too restrictive, reliability rules may require an upgrade that does not satisfy equation 3. The reliability standard may trump the benefit-cost analysis. In such cases, the estimated reliability benefit of the upgrade should be raised until equation 3 is satisfied because a higher benefit is implied by the reliability standard; and the costs of the upgrade should be allocated accordingly, as described in Section 2.3.2.

ChristensenAssociatesEnergyConsultingLLC Page9
2.3. Quantifying the Distribution of Net Benefits12
This section provides guidelines for quantifying the distribution among market participants of each of the five types of net benefits, generally represented by variations of the five variables on the left-hand side of equation 3. From the perspective of market participants, however, some of the benefits look different than from the perspective of the transmission planner; so some of the benefit types described below are slightly different than those described above.
After beneficiaries are identified and benefits are quantified, transmission upgrade costs should be allocated among beneficiaries or groups of beneficiaries in proportion to their benefits. The relevant benefits are the sums of those described for each of the following five types; and the cost allocation should be proportional to the sums.
2.3.1. Changes in Consumer Surplus (Use Value)
For consumers in a particular zone, transmission upgrades change consumer surplus in two ways. First, by changing LMPs, they change consumers’ bills on the consumption that would occur without the upgrades. Second, changes in LMPs may change loads and give consumers either more Use Value (for load increases) or less Use Value (for load decreases). Because retail consumers tend to be insulated from wholesale LMPs and because demand tends to be inelastic (i.e., demand changes very little with price changes), the first type of change in consumer surplus dominates the second.
Therefore, as a practical matter, for each zone, it is sufficient to calculate the change in consumer surplus as the sum, over periods within the life of the upgrade, of the product of: a) the forecast load for that zone; times b) the reduction in LMPs for that zone. Consumers in zones that enjoy LMP reductions are beneficiaries of the upgrade and should be allocated a share of the costs of the upgrade. Consumers in other zones would not be allocated a share of the upgrade costs based upon the consumer surplus impacts of the upgrade.
2.3.2. Reduced Expected Outage Costs (Reliability Costs)
Production cost simulation models can be used to quantify LOLE by zone. Zones for which a transmission upgrade reduces LOLE enjoy a benefit equal to the product of the zonal reduction in LOLE times the VOLL. Consumers in such zones are beneficiaries of the upgrade and should be allocated a share of the costs of the upgrade. Consumers in other zones would not be allocated a share of the upgrade costs based upon the reliability impacts of the upgrade.
2.3.3. Reduced Environmental Costs (Environmental Cost)
The Reduced Environmental Costs due to a transmission upgrade can be quantified as the sum of the change in MWh dispatched for each generating unit due to the upgrade times tons of emissions per MWh produced times the price of emissions (in dollars per ton). These benefits arguably apply to one of the following geographic regions: to the state (if any) that has the
12 Many of the ideas in this section (and in this paper) reflect those of W.W. Hogan, Transmission Benefits and Cost Allocation, Mossavar-Rahmani Center for Business and Government, Harvard University, May 31, 2011. Professor Hogan is not responsible for any errors that appear in this paper.

ChristensenAssociatesEnergyConsultingLLC Page10
Public Policy Requirements that have led to the need for the upgrade; or to a zone that benefits from the Reduced Environmental Costs.
2.3.4. Changes in Generator Profits (Generation Profits)
For generators in a particular zone, transmission upgrades change profits in two ways. First, by changing LMPs, they change revenues on the production that would occur without the upgrades. Second, changes in LMPs will often induce generators to increase output (for price increases) or reduce output (for price reductions). Both types of profit changes may be significant. In the extreme, a transmission upgrade may give a generator market access that the generator would otherwise partially or entirely lack, in which case the second type of profit change will dominate.
Generators in zones that have LMP increases or that gain market access are beneficiaries of the upgrades that raise LMPs or create market access – these generators should be allocated a share of the costs of the upgrade. Generators in other zones would not be allocated a share of the upgrade costs. As a practical matter, it is possible to forecast profit increases on a generator-specific basis and to allocate transmission upgrade costs accordingly. Indeed, this would be the most efficient approach for allocating upgrade costs.13
2.3.5. Reduced Generation Capital Costs (Generation Capital Costs)
For planned generation additions in a particular zone, transmission upgrades can change the planned generation capacity needed to serve load reliably (e.g., capacity to satisfy planning reserve margins and to serve transmission losses) or can eliminate some planned generation capacity altogether because the upgrade enables remotely located generation to access zonal load. Thus, transmission projects can result in capacity savings in two ways: (1) where transmission loss reductions translate to reductions in the amount of capacity reserves required to maintain system reliability, and (2) where transmission upgrades relieve congestion and thereby lower the overall planning reserve margin requirement, which can be represented in terms of a reduction in planned generation capacity. Avoided generation capacity can be quantified using a generic estimate of overnight construction cost.
2.4. FERC Order No. 1000
FERC’s policy on transmission cost allocation is laid out in its recent Order No. 1000. FERC is adamant about the need for the allocation to reflect benefits:
Failing to address the allocation of costs for these transmission facilities in a way that aligns with the evaluation of benefits through the transmission planning process could lead to needed transmission facilities not being built, adversely impacting ratepayers.14
13 The SPP region is dominated by vertically integrated utilities serving native load customers. Measurable zonal benefits would reflect both Adjusted Production Costs and changes in generator profits. 14 Order No. 1000, ¶ 499.

ChristensenAssociatesEnergyConsultingLLC Page11
FERC clearly recognizes that, because the benefits of transmission investments are quantified in the transmission planning process, the transmission planning process should be the touchstone for determining cost allocation:
…establishing a closer link between transmission planning and cost allocation will ensure that rates for Commission-jurisdictional service appropriately account for benefits associated with new transmission facilities.15
…it is through the planning process that benefits, which are central to cost allocation, can be assessed.16
…the benefits of any such transmission project should have been clearly identified prior to the allocation of any related costs.17
…a central underpinning to our reforms in this Final Rule is the closer alignment of transmission planning and cost allocation.18
FERC’s policy expressed in Order No. 1000 seems skeptical of Highway/Byway-type approaches toward transmission cost allocation:
We are not persuaded to adopt a rebuttable presumption that the costs of extra-high voltage facilities, such as 345 kV and above, should be allocated widely across a transmission planning region.19
If public utility transmission providers and their stakeholders in a transmission planning region reach a consensus that the costs of extra-high voltage facilities, such as 345 kV and above, should be allocated widely and that this would result in a distribution of costs that is at least roughly commensurate with the benefits received, and support this conclusion with evidence, they may submit the method to the Commission on compliance.20
Order No. 1000 provides transmission cost allocation principles that are consistent with the ideas expressed elsewhere in this paper. In particular, the cost allocation should reflect benefits, and the benefits that underlie the cost allocation should be the very same benefits that are quantified as part of the transmission planning process.
FERC also signaled a policy position that strongly favors ex ante benefit-cost analysis that informs transmission cost allocations going forward as part of the transmission planning process.
This Final Rule sets forth the Commission’s requirements regarding the development of regional and interregional cost allocation methods and does not address matters of cost recovery. We disagree with Arizona Public Service Company, however that incumbent utilities may be unreasonably burdened by the
15 Order No. 1000, ¶ 500. 16 Order No. 1000, ¶ 559. 17 Order No. 1000, ¶ 563. 18 Order No. 1000, ¶ 582. 19 Order No. 1000, ¶ 713. 20 Order No. 1000, ¶ 714.
ChristensenAssociatesEnergyConsultingLLC Page12
potential of cost allocation for transmission facilities developed by third party developers. For any proponent of a transmission facility, whether an incumbent or a nonincumbent, to have the costs of a transmission facility allocated through the regional cost allocation method or methods, its transmission facility first must be selected in the regional transmission plan for purposes of cost allocation. This in turn requires a determination that the transmission project is an efficient or cost-effective solution pursuant to the processes the transmission providers in the region have put in place, including consultation with stakeholders. Therefore, the benefits of any such transmission project should have been clearly identified prior to the allocation of any related costs.21
21 Order No. 1000, ¶ 563.

ChristensenAssociatesEnergyConsultingLLC Page13
3. THE WHITE PAPER’S PROPOSAL
To assist the RARTF and stakeholders in developing benefit-cost analysis methods and to help resolve cost allocation inequities, SPP Staff researched transmission cost allocation and transmission project benefit estimation practices in the U.S., with an emphasis on RTOs. A result of that research is the White Paper22 on cost allocation and benefit assessment, including a “reasonableness assessment,” and proposed avenues for resolving identified zonal inequities. This section summarizes parts of the White Paper and provides our thoughts regarding the quality of the proposals contained in that paper.
3.1. Overview of the White Paper’s Approach
The White Paper lists several quantitative and qualitative metrics for gauging the benefits of transmission projects, all of which need to be evaluated within a comprehensive economic benefits framework, which will be taken up in Section 3.2.
The White Paper focuses on methods for evaluating whether the cost allocation (i.e., distribution of transmission investment costs) achieved through the approved tariff methods corresponds reasonably well with the benefits received by those parties bearing the costs. It also defines a method for determining when zonal benefits may be out of line with allocated costs, and proposes ways of correcting a misallocation of benefits and costs on a zonal basis.
The White Paper provides a list of twenty two benefits of transmission investment projects. Many of these items can be quantified through the application of a Security Constrained Economic Dispatch (SCED) model together with other transmission planning tools, which we will discuss in Section 3.2.
The White Paper recommends that the “reasonableness assessment” contain four components:
a three‐tiered evaluation (quantification and monetization) of benefits,
a four-stage evaluation of transmission projects over an assumed 40-year project lifespan,
a benefit-cost test scheme to trigger mitigation of zonal benefit-cost imbalances, and
multiple approaches to mitigation.
These components are discussed below.
3.1.1. Three-Tiered Benefits Evaluation
The White Paper recommends that the analysis estimate benefits in stages, with the estimated benefits building cumulatively over the three stages.23 The White Paper labels the three stages as “conservative,” “moderate,” and “broad.” Each stage adds incrementally to the types of transmission project benefits that are quantified (and monetized), when possible. The conservative approach considers the following benefits:
Dispatch Savings 22 Southwest Power Pool Staff, Regional Allocation Review Task Force White Paper, August 2011 (White Paper). 23 White Paper, Section 3.2.

ChristensenAssociatesEnergyConsultingLLC Page14
Loss Reductions Interconnection Improvements Avoided Transmission (Reliability) Projects Applicable Environmental Impacts Reduction in Required Operating Reserves
The moderate approach considers all of the foregoing benefits, plus the following:
Meeting State and Utility Goals and Standards Positive Impact on Capacity Required for Losses Improvements in Reliability (Qualitative)24
o Value of Improved ATCs o Value of Backstop for Catastrophic Events
The broad tier considers all of the foregoing benefits, plus the following:
Overall economic output during construction Overall jobs impact during construction Additional earnings related to construction jobs impact Overall economic output during operation Overall jobs impact during operation Additional earnings related to operation jobs impact Tax benefits to the state
3.1.2. Four-Stage Benefits Estimation
The White Paper recommends a four-stage approach to estimating the benefits listed in the preceding subsection.25 The four stages refer to four sample years of the three-tiered analysis: year one, year six (projects included in ITP Near-Term plan), year ten (projects included in the ITP10), and year twenty (projects included in the ITP20).26 The objective of this approach is to estimate the distribution of benefits over time and therefore to gain some understanding of how that distribution will change with changes in various drivers of benefits, not the least of which would be additional transmission investment brought into service. The stages also coincide with SPP’s planning timelines.
3.1.3. Benefit-Cost Ratio Thresholds27
The White Paper recommends benefit-cost ratio thresholds that would trigger a correction for identified imbalances in the alignment of allocated costs and derived benefits across the zones. 24 We propose to replace qualitative metrics for reliability with quantifiable financial metrics such as those discussed in Section 2.3.2. 25 White Paper, Section 3.3. 26 Section II.8.e to Attachment O of the SPP OATT requires SPP to use a financial modeling time frame of 40 years (with the last 20 years provided by a terminal value). 27 White Paper, Section 3.4.
ChristensenAssociatesEnergyConsultingLLC Page15
The threshold values vary across the three benefit tiers, and are set at 0.8, 0.9, and 1.0 for the “conservative,” “moderate,” and “broad” tiers, respectively. For each tier, the achieved values are calculated as the average of the values computed for each of the four sample years of the four-stage benefits estimation. Mitigation is triggered when at least two of the benefit tier averages fall below their respective threshold values.
3.1.4. Mitigation Approaches
The White Paper recommends three avenues for mitigating misalignments between transmission expansion project’s cost allocation and estimated benefits. For “deficient” zones, those with at least two out of three low benefit-cost ratios, all three avenues aim to raise the ratios to approximately one or above:28
Acceleration of already planned upgrades that bestow benefits to a deficient zone;
Approval of selected new upgrades that bring benefits to a deficient zone; and
Financial settlements (“Zonal Transfers”) that shift cost responsibility from deficient zones to other zones.
All of these approaches are intended to increase the benefit-cost ratio for any zone whose ratios are found in the “reasonableness assessment” to fall below the thresholds. The proposed mitigation approaches are not mutually exclusive.29
3.2. Assessment of the White Paper’s Approach
Overall, the White Paper offers an overly broad and partly duplicative list of benefits, and it avoids taking a stand among competing tests of potential inequities in cost allocation. The result is a set of tests that allow for inequities to continue in the face of evidence of their existence.
This section begins with a critique of the White Paper’s catalog of benefits. It then discusses appropriate tests, explains how uncertainty should affect the implementation of those tests, and recommends efficient approaches to mitigation for zonal imbalances.
3.2.1. A Plethora of Benefits
All of the benefits of transmission upgrades are of the five types listed and described in Section 2.2 of this paper. The benefits described by the White Paper (particularly at pages 7-10) are either of the five types or are not benefits at all.
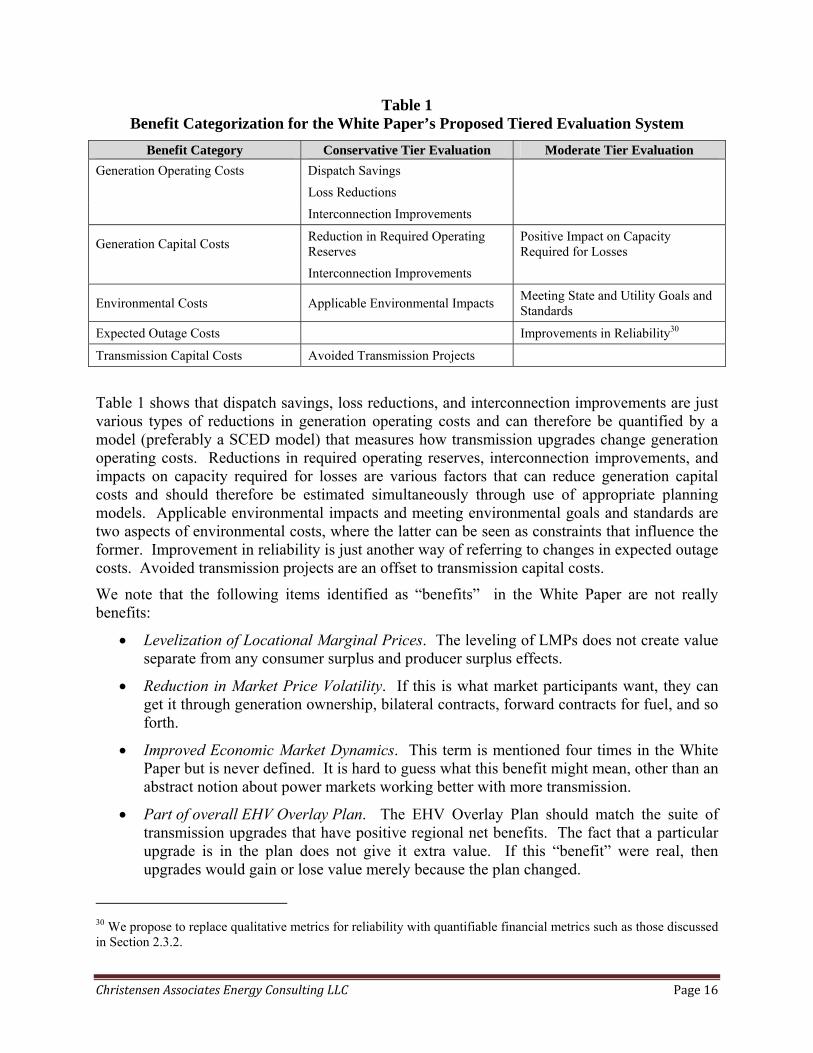
To begin with, the proposed ”broad” tier “benefits” should not be included in an evaluation because they are not benefits associated with the value creation or cost reductions brought about by the integration of the line with the network and/or because they are transfers among parties. Table 1 therefore looks only at the White Paper’s proposed benefits under the ”conservative” tier and the “moderate” tier, and places these benefits into the categories we defined in Section 2.2.
28 White Paper, pp. 15-16. 29 The White Paper makes no mention of mutual exclusivity, and there is no logical reason that the three approaches need be mutually exclusive.
ChristensenAssociatesEnergyConsultingLLC Page16
Table 1 Benefit Categorization for the White Paper’s Proposed Tiered Evaluation System
Benefit Category Conservative Tier Evaluation Moderate Tier Evaluation
Generation Operating Costs Dispatch Savings
Loss Reductions
Interconnection Improvements
Generation Capital Costs Reduction in Required Operating Reserves
Positive Impact on Capacity Required for Losses
Interconnection Improvements
Environmental Costs Applicable Environmental Impacts Meeting State and Utility Goals and Standards
Expected Outage Costs Improvements in Reliability30
Transmission Capital Costs Avoided Transmission Projects
Table 1 shows that dispatch savings, loss reductions, and interconnection improvements are just various types of reductions in generation operating costs and can therefore be quantified by a model (preferably a SCED model) that measures how transmission upgrades change generation operating costs. Reductions in required operating reserves, interconnection improvements, and impacts on capacity required for losses are various factors that can reduce generation capital costs and should therefore be estimated simultaneously through use of appropriate planning models. Applicable environmental impacts and meeting environmental goals and standards are two aspects of environmental costs, where the latter can be seen as constraints that influence the former. Improvement in reliability is just another way of referring to changes in expected outage costs. Avoided transmission projects are an offset to transmission capital costs.
We note that the following items identified as “benefits” in the White Paper are not really benefits:
Levelization of Locational Marginal Prices. The leveling of LMPs does not create value separate from any consumer surplus and producer surplus effects.
Reduction in Market Price Volatility. If this is what market participants want, they can get it through generation ownership, bilateral contracts, forward contracts for fuel, and so forth.
Improved Economic Market Dynamics. This term is mentioned four times in the White Paper but is never defined. It is hard to guess what this benefit might mean, other than an abstract notion about power markets working better with more transmission.
Part of overall EHV Overlay Plan. The EHV Overlay Plan should match the suite of transmission upgrades that have positive regional net benefits. The fact that a particular upgrade is in the plan does not give it extra value. If this “benefit” were real, then upgrades would gain or lose value merely because the plan changed.
30 We propose to replace qualitative metrics for reliability with quantifiable financial metrics such as those discussed in Section 2.3.2.

ChristensenAssociatesEnergyConsultingLLC Page17
3.2.2. Zonal Benefit-Cost Tests
A test of whether zonal project benefits and allocated costs are misaligned should be based on a measure of the discounted net present value of project benefits for a zone z {z = 1,…,Z}. Given a discount rate r and zonal benefit metrics Bzjt and zonal cost metrics Czjt for transmission projects j (j = 1…,J)31 for time t (t = 1,…T), the net benefit NBz for zone z should be estimated according to the following equation:
t j
tzjtzjtz rCBNB 1 z = 1,…,Z (4)
The test for determining whether mitigation is appropriate is derived straightforwardly from equation 4: mitigate zone z when NBz < 0. Equation 4 also clearly defines the appropriate level of mitigation for zone z, if the objective is to raise zone z’s benefit-to-cost ratio to 1.0.
Equation 4 can form the basis of as broad or narrow a test of benefit-cost misalignment as desired, subject to the limitation that benefit and cost metrics are financially quantifiable. Using that equation, a “conservative” test can be constructed that uses all of the most easily quantified metrics; or a “moderate” test can be constructed if more benefit metrics are added that may not be financially quantified as easily. The reduction of financially quantifiable metrics to one net benefit measure (i.e., NBz) simplifies the task of testing for misalignment. It accommodates the White Paper’s tiered approach without creating the complications of competing tests across several tiers and multiple test outcomes over “stages” that require resolution through some arbitrary rule such as “mitigate whenever two out of three average test outcomes are ‘fail’.”
The White Paper’s proposed test for zonal misaligned transmission project benefits and costs involves a level of complexity that is unnecessary for the task. First, the proposed test’s “tiered” approach to estimating benefits complicates the identification of zones that might require mitigation. This tiered approach creates competing tests that require a rule to resolve differences in test outcomes across the tiers. If the benefit metrics listed in either the “conservative” tier or the “moderate” tier are worth computing and considering in an estimate of net benefits, they should be considered together in one aggregate (i.e., composite) estimate, such as captured in NBz.
Second, estimating a net benefit for a zone at T different time points (e.g., the White Paper has four such points) without discounting to arrive at a single net benefit estimate requires inventing some method for reducing the four net benefit estimates for each tier to a single number, such as through a simple arithmetic average that weights each net benefit equally without discounting.32 Rather strangely, the simple average gives as much weight to net benefits twenty years in the future as it gives to net benefits in the present. Because of uncertainty about whether estimated net benefits will actually materialize and because of “reasonableness assessments” being updated every three years, it does not make sense to give equal weight to estimates of net benefits as far out as twenty years. The mitigation of a zonal misalignment necessarily should address the
31 We understand that the approach taken in SPP, as elsewhere, is to analyze the benefits of a portfolio of transmission projects rather than individual projects. Equation 4 has been written as a generic computation but can be modified easily to accommodate the portfolio-based approach. 32 The White Paper makes no mention of discounting or of present values.
ChristensenAssociatesEnergyConsultingLLC Page18
instances where a zone will bear in the immediate future a disproportionate share of the costs of transmission projects that are known to be brought into service within the ensuing three-year period. If the misalignment is found to remain at the time of the next “reasonableness assessment,” mitigation continues, otherwise, it may be adjusted according to the estimate of NBz.
3.2.3. Managing Risk and Uncertainty in Net Benefit Tests33
Zonal mitigation may be undertaken when the benefit-cost ratio (Bzjt/Czjt) for zone z in time t lies below some threshold value of 1.0 or less. Threshold values can vary with the degree of uncertainty or difficulty in estimating benefits: the greater the degree of uncertainty in the estimates of net benefits, the lower the threshold may need to be set (relative to 1.0) to reduce the risk that the test falsely indicates a misalignment that should be mitigated. False test outcomes pose a risk of inappropriate shifts in cost responsibility that are nearly as serious as leaving initial allocation inequities unmitigated.
The White Paper proposes that zonal mitigation be undertaken when the benefit-cost ratio is less than the threshold values of 0.8, 0.9, or 1.0 for the “conservative,” “moderate,” and “broad” tiers, respectively. These proposed thresholds are arbitrary because they bear no relationship to the uncertainty in benefit-cost ratios. In particular, there is no reason to believe that uncertainty falls with the number of benefit categories included in the analysis, as implied by the White Paper’s proposed test.
The treatment of uncertainty in constructing net benefit tests is particularly relevant in view of the long life of projected transmission investments. Because uncertainty increases with the length of timeframe considered for estimation of net benefit values (e.g., 10 years vs. 20 years), a lower threshold value can be justified for net benefit estimates based on a transmission planning process with a longer time horizon than for one that takes a shorter forward look, in contrast to the White Paper’s proposed threshold values that do not vary with the length of the timeframe. With the passage of time, there will be many changes in conditions that could shape both the benefits and the costs of planned transmission projects.
The emphasis on uncertainty in constructing net benefit tests arises from the ex ante perspective that a “reasonableness assessment” must take.34 Therefore, estimated prospective net benefits should be based on a range of possible outcomes for those variables used in the benefits modeling about which there is uncertainty. A set of scenarios should be examined and the net benefits outcomes estimated. A probability weighted net benefit (i.e., an expected net benefit) would be calculated for each zone and the net benefit test actually conducted using the expected net benefit.
The calculation of net benefits and corresponding cost allocation as adjusted to account for zonal benefit-cost imbalances should be based on the expected values of the net benefits by zone. 33 “Uncertainty” refers to a lack of knowledge about what will or will not happen in the future. In estimating transmission project benefits and costs, “uncertainty” is expressed as variability in the discounted present value of net benefits based on an assumed probability distribution for scenarios that define variations in the terms appearing in equation 4. 34 An ex ante perspective is also appropriate for cost allocation. A “reasonableness assessment” is not necessary if cost allocation is determined ex ante and guided by an examination of zonal expected net benefits.
ChristensenAssociatesEnergyConsultingLLC Page19
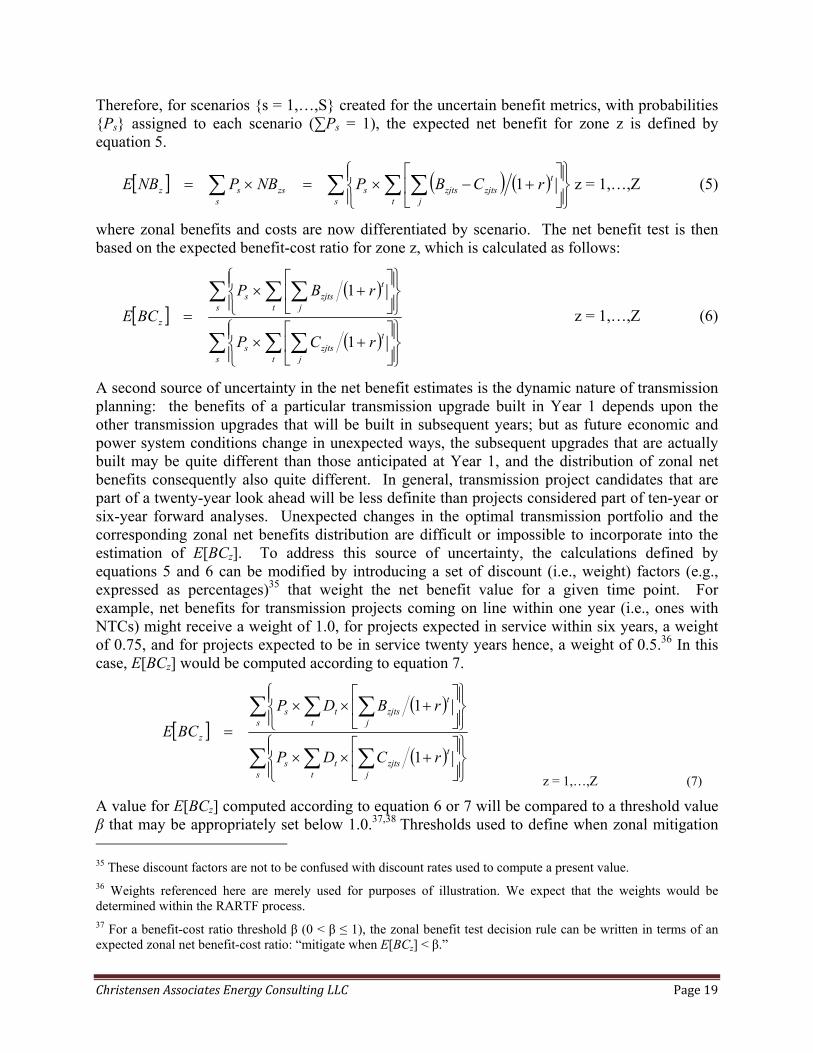
Therefore, for scenarios {s = 1,…,S} created for the uncertain benefit metrics, with probabilities {Ps} assigned to each scenario (∑Ps = 1), the expected net benefit for zone z is defined by equation 5.
s t j
tzjtszjtss
szssz rCBPNBPNBE 1 z = 1,…,Z (5)
where zonal benefits and costs are now differentiated by scenario. The net benefit test is then based on the expected benefit-cost ratio for zone z, which is calculated as follows:
s t j
tzjtss
s t j
tzjtss
z
rCP
rBP
BCE
1
1
z = 1,…,Z (6)
A second source of uncertainty in the net benefit estimates is the dynamic nature of transmission planning: the benefits of a particular transmission upgrade built in Year 1 depends upon the other transmission upgrades that will be built in subsequent years; but as future economic and power system conditions change in unexpected ways, the subsequent upgrades that are actually built may be quite different than those anticipated at Year 1, and the distribution of zonal net benefits consequently also quite different. In general, transmission project candidates that are part of a twenty-year look ahead will be less definite than projects considered part of ten-year or six-year forward analyses. Unexpected changes in the optimal transmission portfolio and the corresponding zonal net benefits distribution are difficult or impossible to incorporate into the estimation of E[BCz]. To address this source of uncertainty, the calculations defined by equations 5 and 6 can be modified by introducing a set of discount (i.e., weight) factors (e.g., expressed as percentages)35 that weight the net benefit value for a given time point. For example, net benefits for transmission projects coming on line within one year (i.e., ones with NTCs) might receive a weight of 1.0, for projects expected in service within six years, a weight of 0.75, and for projects expected to be in service twenty years hence, a weight of 0.5.36 In this case, E[BCz] would be computed according to equation 7.
s t j
tzjtsts
s t j
tzjtsts
z
rCDP
rBDP
BCE
1
1
z = 1,…,Z (7)
A value for E[BCz] computed according to equation 6 or 7 will be compared to a threshold value β that may be appropriately set below 1.0.37,38 Thresholds used to define when zonal mitigation 35 These discount factors are not to be confused with discount rates used to compute a present value. 36 Weights referenced here are merely used for purposes of illustration. We expect that the weights would be determined within the RARTF process. 37 For a benefit-cost ratio threshold β (0 < β ≤ 1), the zonal benefit test decision rule can be written in terms of an expected zonal net benefit-cost ratio: “mitigate when E[BCz] < β.”

ChristensenAssociatesEnergyConsultingLLC Page20
should take place need to be set sufficiently below 1.0 so that they avoid triggering mitigation for zones that appear to have benefit-to-cost ratios modestly below 1.0. Values for β can also be used as a means to address the two sources of uncertainty discussed in this section. For example, if β values in the range of 0.5 to 0.75 were considered, higher values from the range may signify greater confidence in the zonal net benefits estimates used in the test, while less confidence (i.e., greater uncertainty) around the estimates of E[BCz] might warrant a value chosen from the lower end of the range.
Dealing with uncertainty is a standard part of the risk analysis associated with investment decisions. Treatment of uncertainty is not simple, but it is unavoidable. The investment decision, cost allocation rules, and “reasonableness assessment” can all make use of the expected values of benefits and costs across a range of conditions. The scenario analysis is an approximation, but this is not fatal for either a “reasonableness assessment,” the determination of a mitigated cost allocation, or the determination of an initial cost allocation scheme that aligns expected costs and benefits and therefore satisfies the “beneficiaries pay” principle. The existence of uncertainty does not imply or require cost socialization, nor does it undermine a “reasonableness assessment” of an existing cost allocation rule, such as SPP’s Highway/Byway approach.
3.2.4. Mitigation of Zonal Benefit-Cost Imbalances
When the estimated expected net benefit E[NBz] for a particular zone z falls below 0 (i.e., E[BCz] < 1), mitigation may be required to bring cost allocation into line with the “beneficiaries pay” principle. As described above, the White Paper proposes three avenues for mitigation of benefit-cost imbalances.
The first two approaches seek to “equalize” benefit-cost ratios by adding upgrades that will raise benefits relative to costs for deficient zones, while presumably leaving benefit-cost ratios for non-deficient zones relatively unchanged. The implicit rationale associated with these two approaches can be reduced to a mantra: “Build transmission until benefit-cost ratios for all zones exceed one.”
These two benefit equalization approaches make benefits the center of attention when the real problem lies with the allocation of costs to zones. The first two proposed avenues (acceleration of already planned upgrades and approval of new upgrades) are not consistent with the “beneficiaries pay” principle because they do not directly address the identified misalignment for the planned transmission projects. From an economic perspective, they are not as efficient a solution to the problem as the third avenue, financial settlements (zonal transfers or some other form of reconciliation of zonal cost allocation) that shift cost responsibility from deficient zones
38 From a statistical perspective, the net benefit test determines whether E[NBz] lies significantly below zero. Therefore, an alternative approach to conducting the test would be to compare a standardized E[NBz] to a threshold value drawn from a well-known distribution. The decision rule would become in this case: “apply mitigation when E[NBz] < (σNBz × Kα),” where σNBz is an estimated standard deviation of NBz and Kα is a standardized threshold value drawn from a distribution (e.g., standard normal distribution) given a value of α (0 < α < 1). The standard deviation can be estimated using the distribution of S values for NBz produced by the scenario analysis, given probabilities {Ps}. The threshold value Kα is chosen such that the probability of observing E[NBz]/σNBz < Kα equals α under the hypothesis that the underlying true value of E[NBz] is 0.0. The equivalent test using the expected benefit-to-cost ratio E[BCz] would mitigate when (E[BCz]/σBCz) < Kα., The α is typically equal to 0.05 or 0.10, but could be larger if desired. The level of α depends on how conservative the evaluator wants to be in conducting the test.

ChristensenAssociatesEnergyConsultingLLC Page21
to non-deficient zones.39 Furthermore, accelerated and unplanned zonal transmission projects conflict with the “optimal” transmission expansion path produced by SPP’s ITP process: if it were efficient to accelerate or approve such projects, they would already be part of the ITP.
The problem for SPP is that the Highway/Byway method may fail to properly align expected costs with expected benefits for at least some transmission projects (such as Priority Projects). The Highway/Byway’s approach to cost allocation, which allocates transmission project costs to the SPP region on a postage stamp basis, potentially creates the misalignment problem. Fixing this misalignment requires an adjustment that should be both consistent with the ITP process and efficient in leaving unaltered the transmission project portfolio that was found through the transmission planning process to maximize regional net benefits.
The White Paper’s first two avenues are not consistent with an efficient ITP process. Application of either approach would require replacing the optimal transmission portfolio initially selected with a less beneficial portfolio. If the incremental upgrades that are to be added to align zonal benefits and costs were beneficial, they would have been included in the optimal portfolio chosen initially. Furthermore, by creating an upgrade-based benefits adjustment, these first two avenues implicitly add Z* constraints to the traditional economic transmission expansion planning model in order to identify an “optimal” transmission expansion plan that will “balance” zonal net benefits.40 These constraints require that the net benefit for each zone (i.e., NBz) be non-negative.
The zonal “balancing” upgrades of the first two avenues cannot be determined in isolation from the existing ITP process. Instead, the entire exercise of transmission planning performed to identify the initial “optimal” transmission expansion plan would need to be revisited to determine a new “balanced” optimal expansion plan. This complicates an already enormously complicated non-linear programming problem. It will add transmission projects whose sole purpose is to balance zonal benefits with Highway/Byway allocated costs. The resulting transmission expansion plan will not be the efficient (i.e., the lowest-cost) expansion plan to satisfy reliability, economic and public policy objectives.
In contrast, a financial settlements approach (e.g., zonal transfers or an alternative method of reconciling benefit-cost imbalances, such as discounted zonal cost allocations discussed in footnote 39) leaves the optimal transmission portfolio untouched, takes the resulting zonal expected net benefits as the starting point (given the zonal cost allocations defined by Highway/Byway cost allocation rules), and shifts the costs from zones with benefit-cost ratios E[NBz] significantly below 1.0 to zones with benefit-cost ratios greater than 1.0. If the White Paper is to be followed at all in this regard, it should be via some cost allocation reconciliation approach similar in spirit to this third avenue, which would include the possibility that a zone suffering from a continuing imbalance not receive subsequent allocations until the inequity is resolved. 39 An alternative to zonal transfers, in cases where E[BCz] > 0, would be to apply a discount factor (i.e., a value between 0 and 1) to a zone’s cost allocation to raise E[BCz] to the threshold value β, if not all the way to 1.0; a value of 0 would do away with cost allocation for the zone. When E[BCz] < 0 (i.e., estimated benefits are negative), discounting costs will help but will not fully compensate the zone, in which case a zonal transfer may be a reasonable solution. 40 Z* stands for the number of zones requiring mitigation of cost allocation inequities. Z* < Z (the total number of zones).

ChristensenAssociatesEnergyConsultingLLC Page22
4. CONCLUSION AND RECOMMENDATIONS
The White Paper proposes a complex approach to conducting a “reasonableness assessment” of the allocation of costs achieved through the application of the Highway/Byway rules in the SPP tariff. Such an approach is neither necessary nor desirable. A net benefits test based on a zonal expected present discounted net benefit value embraces all the elements that the White Paper’s multi-tiered, multi-staged, averaged benefit-to-cost ratio test attempts to capture. Furthermore, such a net benefits test enables uncertainty to appropriately shape the threshold for use in the decision rule, avoiding the inherent problems with competing test outcomes and arbitrary and most likely controversial decision rules.
As long as SPP continues to use the Highway/Byway cost allocation method, there is a significant potential for zonal misalignments of benefits and allocated costs. A method similar in concept to the zonal transfers originally used for the Balanced Portfolio approach, which could include discounting of subsequent allocations, would be the most efficient way to mitigate the resulting zonal imbalances that are identified by the “reasonableness assessment.” Because a “reasonableness assessment” will be conducted every three years, any reconciliation of zonal imbalances should be set in place for only three years. As Professor Hogan has stated, the zonal (financial) transfer concept (“winners” pay “losers”) first used as part of the Balanced Portfolio approach is “consistent with the principle that beneficiaries pay and costs are not socialized… [and] it does conform to support … efficient transmission investment and illustrates an application of the beneficiary pays principle using existing planning tools.”41
41 Hogan, op cit, p. 21.

ChristensenAssociatesEnergyConsultingLLC Page23
APPENDIX A. BACKGROUND ON SPP’S TRANSMISSION COST ALLOCATION AND THE RARTF
This section provides brief overviews of SPP’s transmission cost allocation history and of the RARTF.
A.1. SPP’s Transmission Cost Allocation History
SPP was created in 1941 and became an RTO in 2004. Until it became an RTO, SPP’s transmission owners recovered their costs according to traditional cost allocation practices, which meant that nearly all of their costs were recovered from customers in their own service territories while only a small fraction was recovered from outside entities that used their networks. The presumption was that customers within a service territory are the primary beneficiaries of the services rendered by transmission facilities within that service territory.
Since it became an RTO, SPP has taken the broader view that transmission facilities often do, in fact, serve customers over a wider geographic area than just the service territory in which they are located. For the limited types of transmission upgrades that have easily identifiable beneficiaries – namely generation interconnections and sponsored upgrades – costs are allocated solely to those beneficiaries (i.e., the interconnecting generators and sponsors). For all other network upgrades, however, costs have been shared among multiple parties as follows:
Until June 2010, all costs of Balanced Portfolio (economic) projects were allocated across the whole SPP footprint on a postage stamp basis, with transfers among zones arranged to assure that no zone had a benefit-cost ratio below one. Two-thirds of the costs of reliability upgrades were recovered from customers within the zone in which the upgrade was located while one-third was recovered from all SPP customers. The Balanced Portfolio approach satisfied the following two criteria:
o The net present value of benefits was equal to or greater than the net present value of costs over a ten-year period.
o For each individual zone, the sum of the net present value of zonal benefits was equal to or greater than the sum of the net present value of zonal costs, over the same 10-year period.
Since June 2010, the costs of all other network upgrades have been recovered according to a “Highway/Byway” cost allocation method established by the Regional State Committee (RSC) and approved by SPP’s Board and FERC.42 Costs are measured according to transmission upgrades’ Annual Transmission Revenue Requirements (ATRRs). The costs of upgrades over 300 kV are recovered from all SPP customers, and are allocated among SPP’s zones according to each zone’s Load Ratio Share (LRS) expressed as a percentage of the aggregate regional load. The costs of upgrades below
42 Federal Energy Regulatory Commission, Order Accepting Tariff Revisions, Docket No. ER10-1069-000, June 17, 2010.

ChristensenAssociatesEnergyConsultingLLC Page24
100 kV are recovered solely from customers within the zone in which the upgrade is located. The costs of upgrades at intermediate voltage levels are recovered one-third from all SPP zones (on an LRS basis) and two-thirds from customers in the zone where the upgrade is located.
The SPP tariff requires that SPP review the Highway/Byway cost allocation method and its allocation factors at least every three years. The RSC has the authority to require definition of analytic methods and to recommend cost allocation adjustment if a review shows an imbalanced cost allocation (i.e., benefits less than costs) to one or more zones. Beginning in 2015, SPP members have the right to ask the SPP Market and Operations Policy Committee (MOPC) for relief from imbalances.
A.2. The Regional Allocation Review Task Force
The RARTF is responsible for satisfying SPP’s Open Access Transmission Tariff requirement that “The Transmission Provider shall review the reasonableness of the regional allocation methodology and factors (X% and Y%) and the zonal allocation methodology at least once every three years…”43 By December 20, 2011, the RARTF must produce a final report that recommends the following:
a methodology for quantifying the current and cumulative long‐term equity of the current transmission cost allocation on each SPP Pricing Zone and Balancing Authority;
a threshold for determining inequitable impacts on an SPP Pricing Zone or Balancing Authority; and
possible solutions for mitigating any inequitable impacts.
Based upon the methods eventually adopted by SPP, SPP Staff will satisfy the OATT requirement for using the Base Plan Zonal ATRR to determine zonal charges for Base Plan Upgrades issued a Notification to Construct (NTC) after June 18, 2010.44
43 The requirement appears in Southwest Power Pool, Open Access Transmission Tariff, Sixth Revised Volume No. 1, (OATT) Attachment J, Section III.D. RARTF’s responsibility is defined by Southwest Power Pool, Regional Allocation Review Task Force Charter, June 9, 2011. 44 OATT, Attachment H, Section I.

ChristensenAssociatesEnergyConsultingLLC Page25
APPENDIX B. SPP’S COST ALLOCATION METHODS
This appendix provides an overview of SPP’s past and current cost allocation methods. It also provides a brief assessment of SPP’s current Highway/Byway cost allocation method.
B.1. Overview of Past and Present Allocation Methods
This section briefly describes the methods used by SPP over the past decade to allocate the costs of transmission projects and upgrades.
B.1.1. Reliability Upgrades and Generation Interconnections
Beginning in 2005, SPP allocated the costs of Reliability Upgrades (i.e., Base Plan Upgrades (BPUs)) and of upgrades related to the designation of new or changed generation resources (over $100,000) one third to the SPP region on a postage stamp basis and two thirds to SPP zones based on an identification of beneficiaries according to positive (incremental) MW-mile impacts.45 BPUs costing $100,000 or less were allocated to the zone in which the upgrade was located.
In 2009, SPP modified the allocation factors specifically for BPUs resulting from transmission service requests that are associated with designated wind generation resources. When the BPU associated with a wind resource is located in the same zone as the transmission customer's point of delivery, costs are allocated one-third regionally and two-thirds zonally according to MW-mile impacts. When the BPU associated with a wind generation resource is located in a different zone than the transmission customer's point of delivery, costs are allocated two-thirds regionally and one-third to the transmission customer.46
B.1.2. Balanced Portfolio Upgrades
In January 2008, the RSC approved a “Balanced Portfolio” approach under which a group of projects is evaluated simultaneously for an upcoming 10-year period. Under this approach, SPP and its stakeholders consider alternative portfolios based on inputs from stakeholders and on SPP’s evaluation of existing transmission congestion.
45 Base Plan Upgrades are defined as upgrades that are included in and constructed pursuant to the SPP Transmission Expansion Plan in order to ensure the reliability of the Transmission System. They include Service Upgrades required for new or changed Designated Resources to the extent allowed in Attachment J to the SPP Tariff. See SPP Tariff at Attachment J, section III.B 46 Note the illogical asymmetry: if the BPU is located near the transmission customer’s point of delivery, the customer gets only a share of two-thirds of the cost; but if the BPU is located far from the point of delivery, the customer gets a full one-third of the cost. In many instances, the customer will pay more for upgrades that are located farther from the customer than for those that are located close to the customer.

ChristensenAssociatesEnergyConsultingLLC Page26
A Balanced Portfolio provides each SPP pricing zone with benefits that exceed the costs allocated to that zone via a region-wide postage stamp rate. This approach assures that transmission allocation results in “no losers,” but it does not attempt to equalize the benefit-to-cost ratio for all zones. Achieving such a result is difficult because various zones are at different levels of transmission “robustness” relative to savings that can be achieved through reducing congestion via transmission upgrades. Spreading around upgrades geographically might help, but may not ever achieve a balance.
To be included in a Balanced Portfolio, an economic upgrade must involve transmission facilities at the 345 kV level or higher. Lower-voltage facilities may be included if needed to deliver benefits from higher-voltage facilities. Although SPP’s Cost Allocation Working Group recommended that an economic upgrade’s cost for facilities below 345 kV should not exceed the cost for facilities at or above 345 kV, this voltage restriction could be waived if lower-voltage upgrade facilities are necessary to balance the portfolio.
When an economic upgrade created benefit-to-cost ratios less than one for some zones, the solution was to reduce the transmission costs recovered through the zonal rates of the deficient zones (i.e., zones in which allocated costs exceed estimated benefits) and recover these instead through the region-wide (postage stamp) rate. Thus, transfers move some of the upgrade cost that would be collected from deficient zones to the entire region, resulting in reduced revenue requirement for deficient zones and a reduction in benefits to all other zones. In this way, “winners” compensate “losers.”
B.1.3. Highway/Byway Cost Allocation
In April 2010, SPP filed its Highway/Byway method proposal at FERC. The proposal was designed to address the issue of how to allocate the costs of high-voltage (HV) transmission projects (e.g., 500 kV and 765 kV in particular) that to some extent are driven by environmental concerns and by state and federal public policy on renewable portfolio standards. The proposal revised the definition of BPUs to include high-priority upgrades (Priority Projects) but excluded Balanced Portfolios that are approved for construction by the SPP Board of Directors.
The Highway/Byway approach abandoned the previous distinction between reliability-based and economic-based transmission projects for the purpose of cost allocation. The MW-mile analysis for costs allocated to zones was eliminated. Costs of certain upgrades that operate at two different voltages (e.g., transformer equipment) are now based on the facilities’ lower operating voltage.
Under the Highway/Byway method, BPU costs are allocated according to the voltage level of the upgrade as follows:
costs of facilities operating at 300 kV and above are allocated 100 percent across the SPP region on a postage stamp basis;
costs of facilities operating above 100 kV and below 300 kV are allocated one-third on a regional postage stamp basis and two-thirds to the zone in which the facilities are located; and
costs of facilities operating at or below 100 kV are allocated 100 percent to the zone in which the facilities are located.

ChristensenAssociatesEnergyConsultingLLC Page27
The Highway/Byway approach applies to Priority Projects, transmission projects resulting from the Integrated Transmission Plan (ITP), and BPUs that are developed after June 19, 2010, including BPUs associated with a Designated Resource, and that are not included in a Balanced Portfolio.
SPP supported the shift from its Balanced Portfolio approach to the Highway/Byway method with two sets of analyses that demonstrated a use distinction between higher-voltage facilities (i.e., highway facilities) and lower-voltage facilities (byway facilities).
Its Transmission Distribution Analyses showed that particular transmission facilities predominately carry regional power flows, and therefore fulfill more of a “highway” function compared to other facilities that carry flows at the “local” level. These analyses also showed that Extra High Voltage (EHV) facilities were far more responsive to interzonal flows (including through transactions) than were lower-voltage facilities.
Its Injection-Withdrawal Transmission Utilization Analysis estimated the portions of transmission line flows that are due to local generation serving local load rather than due to regional, non-local transactions.
Both sets of studies led SPP to conclude that higher-voltage transmission facilities primarily support regional service while lower-voltage facilities primarily support local service. Thus, these studies were used to justify the Highway/Byway’s allocation of higher-voltage transmission costs to the SPP region on a postage stamp basis.
B.2. Assessment of SPP’s Current Cost Allocation Method
Professor Hogan offers this assessment of the cost allocation method that SPP had until June 2010 and the one that it has had since that time:
The Southwest Power Pool (SPP) previously used a transmission decision making and cost allocation methodology that focused on a portfolio of transmission projects. An important feature of the SPP approach exploited the vertical integration of the participants and their ownership of generation needed to serve the load. This avoids the distinction between the benefits to load and the benefits to generation, as the benefits are merged in one organization. In deciding on expansions and allocating the costs, the SPP Balanced Portfolio Model (BPM) uses the language of cost socialization with system wide postage stamp rates and additional locational charges. However, this is misleading because a key part of the analysis and negotiation is to rebalance the mix of local charges and system wide charges until the benefits exceed the costs for each participant and the parties agree on the expansion portfolio and cost allocation. Therefore, the SPP BPM model is consistent with the principle that beneficiaries pay and costs are not socialized. The SPP balanced portfolio approach is essentially voluntary and the beneficiaries pay…
This example of a beneficiary pays model was later replaced by the SPP Highway/Byway approach that assigns costs to different regions according to the voltage level of the transmission facilities. The Highway/Byway model socializes the cost of lines above 300 kV, splits the cost for intermediate lines, and assigns the full cost to the local zone for lines below 100 kV. The justification cites
ChristensenAssociatesEnergyConsultingLLC Page28
power flows over the lines. But the power flows reflect only the impact of different impedances of different voltage levels, not the distribution of benefits which are driven by quite different factors such as transmission constraints… [T]he effect of the same line and constraint can be dramatically different at different locations. The power flows do not describe the distribution of benefits.47
It is difficult to disagree with Professor Hogan’s conclusions. For generation interconnections and sponsored upgrades, SPP is reasonably allocating costs to beneficiaries; in such cases, it is easy to identify the beneficiaries. For the other network upgrades, however, the Highway/Byway cost allocations – entirely to all of SPP for high-voltage lines, entirely to the local zone for low-voltage lines, and a one-third/two-thirds split between all of SPP and local zones on intermediate-voltage lines – are not based upon analyses of the distribution of benefits of transmission upgrade costs. Rather, they are based on generic analyses of flow patterns that reveal little about the distribution of benefits for specific transmission projects. Even more tellingly, they are not based on analyses of how transmission upgrades, individually or on average, affect consumer surplus by zone, expected outage costs by zone, generator profits by zone, or generator investment by zone.
An estimate of the distribution of an upgrade’s benefits over that upgrade’s life is critical to understanding whether the allocation of costs under the current method properly aligns costs with beneficiaries. Such an estimate of the degree to which costs are allocated to beneficiaries is called a “reasonableness assessment.” A “reasonableness assessment” should be performed automatically, as part of the integrated transmission planning (ITP) process, for all proposed transmission projects that are candidates for approval by the SPP Board. When the ITP process estimates the aggregate benefits of an upgrade, SPP automatically obtains much (if not all) of the information needed to estimate the expected distribution of benefits among zones. On the basis of that benefit distribution, adjustments can be made to zonal cost allocations produced by the Highway/Byway method.
47 Hogan, op cit, pp. 21-22. Footnotes and citations have been removed from this passage.