transition period water take report 2012–13 to …...transition period water take report 2012‒13...
TRANSCRIPT

Transition Period Water Take Report 2012–13 to 2015–16
Report on Cap compliance and transitional
SDL accounting
November 2017

Transition period water take report 2012‒13 to 2015‒16
Published by the Murray–Darling Basin Authority
MDBA publication no: 39/17
ISBN (online): 978-1-925599-45-9
© Murray–Darling Basin Authority 2017
With the exception of the Commonwealth Coat of Arms,
the MDBA logo, trademarks and any exempt
photographs and graphics (these are identified), this
publication is provided under a Creative Commons
Attribution 4.0 licence.
https://creativecommons.org/licenses/by/4.0
The Murray‒Darling Basin Authority’s preference is that you attribute this publication (and any Murray‒
Darling Basin Authority material sourced from it) using the following wording within your work:
Title: Transition Period Water Take Report 2012–13 to 2015–16: Report on Cap compliance and
transitional SDL accounting
Source: Licensed from the Murray‒Darling Basin Authority under a Creative Commons Attribution
4.0 Licence
Accessibility
The Murray‒Darling Basin Authority makes its documents and information available in accessible formats.
On some occasions the highly technical nature of the document means that we cannot make some
sections fully accessible. If you encounter accessibility problems or the document is in a format that you
cannot access, please contact us.
Acknowledgement of the Traditional Owners of the Murray–Darling Basin
The Murray−Darling Basin Authority pays respect to the Traditional Owners and their Nations of the
Murray−Darling Basin. We acknowledge their deep cultural, social, environmental, spiritual and economic
connection to their lands and waters.
The guidance and support received from the Murray Lower Darling Rivers Indigenous Nations, the
Northern Basin Aboriginal Nations and our many Traditional Owner friends and colleagues is very much
valued and appreciated.
Aboriginal people should be aware that this publication may contain images, names or quotations of
deceased persons.
Cover image: Grain harvesting with rice crop in the foreground. Coonoong Station near Jerilderie, New
South Wales
GPO Box 1801, Canberra ACT 2601
1800 230 067
mdba.gov.au

Transition period water take report 2012‒13 to 2015‒16
Foreword
Sustainable diversions limits (SDLs) are the key element of the Basin Plan.
The SDLs that are set in the Basin Plan provide a new balance between consumptive and
environmental water uses in the Basin. They come into effect in 2019 and thus we are now in a
seven-year transition period through to the implementation of these new limits.
Critical to the implementation and enforcement of the SDLs is a system of accounts to keep track
of how much water is taken from the rivers, valleys and groundwater systems of the Basin and
how this compares with the limits specified in the Basin Plan, as they apply in the year in
question.
This report presents a set of accounts for the water use in the Basin for the first four years of the
transition period (2012–13 to 2015–16). While there are no compliance consequences during the
transition period, for the first time, accounts consistent with Basin Plan arrangements have been
assembled for surface water and groundwater use. For groundwater, this is the first set of
comprehensive accounts at the Basin scale ever assembled.
These accounts keep track of the water recovery in the Basin as efforts to ‘bridge the gap’ to the
SDLs continue. Diversion limits for each year have been adjusted to reflect this progress with
water recovery.
The report shows that surface water diversions were within the limits that would have applied
given the progress with water recovery. There may be some interest in the ‘credits’ that appear to
be accruing in these accounts, though this should be tempered by the considerations raised in
the report. In any case, more accurate methods for generating the annual limits will emerge from
the water resource plans now under preparation and the formal compliance account will
commence with a balance of zero come 2019.
For groundwater, diversions were within the limits in the Basin Plan. One issue that arises in
New South Wales can be explained from a more detailed examination of the situation in that
groundwater system. This usefully provides further insight into the development of water
resource plans for groundwater.
The report also serves to benchmark the extent of metering in the Basin. For surface water, 70%
of water used was metered. For groundwater, 78% of water used was metered. This benchmark
provides a basis from which improvements in metering accuracy and extent can now be
tracked. Reducing the proportion of unmetered take is an area where further improvements in
these accounts can be made, recognising the need for cost effectiveness considerations in
relation to certain forms of take (e.g., runoff dams) and a number of recommendations are made
in relation to this issue. The report also benchmarks the extent to which various forms of water
use are estimated on an annual basis. Again, this provides a baseline from which we can
improve.
The report serves as a ‘dress rehearsal’ for the formal Register of Take that will commence with
the 2019–20 water year following the accreditation of water resource plans, and comes three
years ahead of when such accounts are formally required.

Transition period water take report 2012‒13 to 2015‒16
The report also provides an assessment of current state compliance with the Murray–Darling
Basin Cap on surface water diversions. This assessment expands on the Cap Register
maintained and published separately by the MDBA (Murray–Darling Basin Authority).
Finally the report provides a comprehensive account of all the Held Environmental Water
throughout the Basin for the first time.
I would like to thank each of the Basin states and the Commonwealth Environmental Water
Holder for their contribution to this important work which represents a major step forward in Basin
Plan implementation.
The Hon Neil Andrew AO
Chair

Transition period water take report 2012‒13 to 2015‒16
Page 1
Contents
Foreword .................................................................................................................................. 2
Executive summary .................................................................................................................. 7
1. Introduction ...................................................................................................................... 14
1.1. About this report .................................................................................................... 14
1.2. Explanation of key concepts and terminology used ............................................... 17
1.3. Trial assessment of water take under the sustainable diversion limit water
accounting and compliance framework ............................................................................... 21
1.4. Trial reporting of availability and use of environmental water ................................ 23
Part 1: Current compliance arrangements Implementation of the Murray–Darling Basin Cap on
Diversion .................................................................................................................................... 25
2. The Murray–Darling Basin Cap on Diversions ................................................................. 26
2.1. How the Cap works ............................................................................................... 26
2.2. Cap compliance reporting ..................................................................................... 28
2.3. Compliance with the Cap ...................................................................................... 29
2.4. The status of Cap models ..................................................................................... 33
2.5. Annual Cap targets ............................................................................................... 35
2.6. Operation of the Cap post 30 June 2019 ............................................................... 36
2.7. Cap Register 1 July 1997 to 30 June 2016 ............................................................ 36
Part 2: Trial assessment of annual water availability and take under the sustainable diversion
limit water accounting and compliance rules .............................................................................. 46
3. Purpose of the trial .......................................................................................................... 47
3.1. How the SDL water accounting and compliance framework operates ................... 49
4. Water availability ............................................................................................................. 53
4.1. Surface water ........................................................................................................ 53
4.2. Groundwater ......................................................................................................... 53
4.3. Climate and storages ............................................................................................ 54
5. Annual actual take 2012–13 to 2015–16 .......................................................................... 64
5.1. Actual take ............................................................................................................ 64
5.2. Surface water annual actual take .......................................................................... 66
5.3. Groundwater annual actual take ........................................................................... 78
5.4. Recommendations ................................................................................................ 81
6. Allocations and trade ....................................................................................................... 82
6.1. Allocations ............................................................................................................ 82
6.2. Water Trade within the Basin ................................................................................ 88

Transition period water take report 2012‒13 to 2015‒16
Page 2
7. Permitted take and indicative compliance ........................................................................ 94
7.1. Water authorised for use versus annual permitted take ......................................... 95
7.2. Surface water annual permitted take ..................................................................... 96
7.3. Surface water transitional diversion limits (TDLs) .................................................. 98
7.4. Groundwater permitted take ................................................................................ 101
7.5. Groundwater transitional diversion limits (TDLs) ................................................. 101
7.6. Transition assessment of actual take against permitted take and the TDL .......... 104
Part 3: Environmental water availability and use ...................................................................... 109
8. Environmental water ...................................................................................................... 110
8.1. Determining the long-term average annual volume of HEW ................................ 111
8.2. Commencement of environmental water data reporting ...................................... 112
8.3. Available held environmental water entitlements ................................................. 113
8.4. Surface water HEW ............................................................................................ 113
8.5. Groundwater HEW .............................................................................................. 128
8.6. Held environmental water authorised for use and actual use .............................. 130
8.7. Planned Environmental Water ............................................................................. 138
9. Data improvements to date and future work .................................................................. 139
9.1. Data improvements over the period and ongoing limitations ............................... 139
9.2. Improving data collection and handling ............................................................... 139
9.3. Developing suitable models ................................................................................ 140
9.4. Recommendations .............................................................................................. 140
10. Appendix 1: Surface water SDL trial water take account ............................................ 141
11. Appendix 2: Groundwater SDL trial water take account ............................................. 149
12. Appendix 3: Status of Cap models ............................................................................. 170
13. Appendix 4: State nominated methods for annualising environmental water recovery
under the Cap arrangements ................................................................................................ 174
14. Appendix 5: Environmental water adjustment under the trial of SDL water accounting
and compliance .................................................................................................................... 176
15. Appendix 6: Surface water SDL resource units .......................................................... 178
16. Appendix 7: Groundwater SDL resource units............................................................ 179
17. Appendix 8 – Core concepts and useful links ............................................................. 182
18. Glossary ...................................................................................................................... 187

Transition period water take report 2012‒13 to 2015‒16
Page 3
Tables
Table 1 Comparison of the key features of Cap and sustainable diversion limit water accounting
and compliance .......................................................................................................................... 16
Table 2 Cumulative Cap balances (GL) by state as at 30 June for each year 2012–13 to 2015–
16 ............................................................................................................................................... 30
Table 3: Annual Cap adjustments for trade (GL) ........................................................................ 38
Table 4: Annual Cap adjustments for environment (GL) ............................................................. 39
Table 5: Annual Cap targets adjusted for trade and environment (GL) ....................................... 40
Table 6: Annual diversions (GL) ................................................................................................. 41
Table 7: Annual Cap credits (GL) ............................................................................................... 42
Table 8: Cumulative Cap credits (GL) ........................................................................................ 43
Table 9: Cap Register — for Metropolitan Adelaide, South Australia (GL) .................................. 44
Table 10: Difference in cumulative Cap credits between Cap Register, 2014–15 and Cap
Register, 2015–16 (GL) .............................................................................................................. 45
Table 11 Percentage volumes in storage as at 30 June in the northern and southern Basin over
the period 2012–13 to 2015–16 .................................................................................................. 63
Table 12 Basin and state scale surface water permitted take, actual take, annual credits and
transitional adjusted cumulative balance (all in GL) 2012–13 to 2015–16 .................................. 68
Table 13 Surface water annual actual take (GL) by different forms of take and the level of
certainty for each SDL resource unit, water year 2012–13* ........................................................ 69
Table 14 Surface water annual actual take (GL) by different forms of take and the level of
certainty for each SDL resource unit, water year 2013-14* ......................................................... 70
Table 15 Surface water annual actual take (GL) by different forms of take and the level of
certainty for each SDL resource unit, water year 2014-15* ......................................................... 71
Table 16 Surface water annual actual take (GL) by different forms of take and the level of
certainty for each SDL resource unit, water year 2015-16* ......................................................... 72
Table 17 Basin and state scale percentage of surface water annual actual take that is metered73
Table 18 Managed aquifer re-charge volumes 2012–13 to 2015–16 ......................................... 81
Table 19 Surface water authorised (GL) from 2012–13 to 2015–16 .......................................... 83
Table 20 Proportion of actually taken as surface water authorised from 2012–13 to 2015–16 ... 84
Table 21 Basin State authorised groundwater (allocation and carryover) for the period 2012–13
to 2015–16 ................................................................................................................................. 87
Table 22 Total surface water allocation trade (GL) across the Basin: consumptive and
environmental uses .................................................................................................................... 89
Table 23 Surface water allocation total trade (GL): between consumptive and environmental
uses ........................................................................................................................................... 91
Table 24 Total groundwater allocation trade volumes (GL) at Basin and state scales 2012–2013
to 2015–2016. Total includes trade within, into and out of SDL resource units ........................... 93
Table 25 Surface water BDLs, bridging the gap (BtG) recovery at 1 July and transitional
diversion limits (GL) at SDL resource unit scale 2012–13 to 2015–16 ........................................ 99
Table 26 Groundwater transitional diversion limits (TDLs) in SDL resource units subjected to
water recovery of HEW under 'bridging the gap' for 2012–13 to 2015–16 ................................ 102
Table 27 Groundwater transitional diversion limits (TDLs) in SDL resource units that had
entitlements reduced under the NSW ASGE Program for 2012–13 to 2015–16 ....................... 103
Table 28 Basin scale surface water TDL, transitional annual permitted take, annual actual take,
transitional annual credits and cumulative balance for 2012–13 to 2015–16. All values in GL. . 105

Transition period water take report 2012‒13 to 2015‒16
Page 4
Table 29 Basin scale groundwater TDL/permitted take, annual actual take, transitional annual
credits and TDL cumulative balance for 2012–13 to 2015–16. All values in GL. ....................... 107
Table 30 Total surface water held environmental water (HEW) entitlements available as at 30
June for the period 2012 to 2016 .............................................................................................. 115
Table 31 Total surface water HEW that contributes to ‘bridging the gap’ as at 30 June for the
period 2012 to 2016 ................................................................................................................. 124
Table 32 Difference between 30 June and 1 July bridging the gap HEW by SDL resource units at
the commencement of water years 2012–13 through to 2015–16 ............................................ 127
Table 33 Held environmental water (HEW) deducted from BDL to determine TDL as at 1 July
2012 to 2015 ............................................................................................................................ 128
Table 34 Total available groundwater HEW by state as at 30 June for the period 2014 to 2016
................................................................................................................................................. 128
Table 35 HEW authorised for use in 2013–14, 2014–15 and 2015–16 for each SDL resource unit
................................................................................................................................................. 131
Table 36 Surface water HEW used in 2013–14, 2014–15 and 2015–16 for each SDL resource
unit ........................................................................................................................................... 133
Table 37 Surface water HEW used as a percentage of water authorised in 2013–14, 2014–15
and 2015–16 for each SDL resource unit ................................................................................. 134

Transition period water take report 2012‒13 to 2015‒16
Page 5
Figures
Figure 1 Timing of compliance arrangements during transition period and beyond ................... 17
Figure 2 Basin scale annual Cap targets, annual diversions, annual and cumulative balances 1
July 1997 to 30 June 2016 ......................................................................................................... 28
Figure 3 Basin scale surface water transitional diversion limit, annual permitted take, annual
actual take, annual credits and adjusted cumulative balance 2012–13 to 2015–16 .................... 52
Figure 4 Groundwater Basin scale transitional diversion limit, annual actual take, and annual
credits and cumulative balance 2012–13 to 2015–16 ................................................................. 52
Figure 5 Murray–Darling Basin rainfall deciles highest to lowest on record 2012–13 to 2015–16
................................................................................................................................................... 54
Figure 6 Basin rainfall decile ranges 1 July 2012 to 30 June 2013 ............................................. 55
Figure 7 Basin temperature deciles 1 July 2012 to 30 June 2013 .............................................. 55
Figure 8 Basin rainfall deciles 1 July 2013 to 30 June 2014 ...................................................... 57
Figure 9 Basin temperature deciles 1 July 2013 to 30 June 2014 .............................................. 57
Figure 10 Basin rainfall deciles 1 July 2014 to 30 June 2015 .................................................... 59
Figure 11 Basin temperature deciles 1 July 2014 to 30 June 2015 ............................................ 59
Figure 12 Basin rainfall deciles 1 July 2015 to 30 June 2016 .................................................... 61
Figure 13 Basin temperature deciles 1 July 2015 to 30 June 2016 ............................................ 61
Figure 14 River Murray System active storage volumes for the period June 2000 to June 2016.
Graph shows the sum of active storage in Dartmouth and Hume Reservoirs, Lake Victoria and
the Menindee Lakes Storage...................................................................................................... 63
Figure 15 Basin scale surface water transitional diversion limit, annual permitted take, annual
actual take, annual credits and adjusted cumulative balance 2012–13 to 2015–16 .................... 66
Figure 16 Basin and state scale annual actual take (GL) from watercourses 1983–84 to 2015–16
................................................................................................................................................... 75
Figure 17 Annual actual take (GL) from watercourses for Queensland, Australian Capital
Territory and South Australia only 1983–84 to 2015–16 ............................................................. 75
Figure 18 Basin scale groundwater BDL, SDL, TDL and actual take 2012–13 to 2015–16 ........ 79
Figure 19 Surface water allocation trade volumes 2012–13 to 2015–16, including total trade,
consumptive to consumptive, environment to environment, consumptive to environment and
environment to consumptive ...................................................................................................... 89
Figure 20 Surface water allocation trade volumes 2012–13 to 2015–16, consumptive to
environment and environment to consumptive only .................................................................... 90
Figure 21 Basin and state scale surface water annual permitted take (GL) 2012–13 to 2015–16
................................................................................................................................................... 97
Figure 22 Basin scale TDL, transitional annual permitted take, annual actual take and
transitional credits and cumulative TDL credits 2012–13 to 2015–16 ....................................... 106
Figure 23 Groundwater Basin scale transitional diversion limit, annual actual take, and annual
credits and cumulative balance 2012–13 to 2015–16 ............................................................... 108
Figure 24 Total available held environmental water (HEW) entitlements as at 30 June by
recovery program for the period 2004 to 2016. ......................................................................... 120
Figure 25 Proportions of total HEW available as owned by the different environmental water
holders (volumes in GL LTDLE) ............................................................................................... 121
Figure 26 Location of available HEW entitlements by state as at 30 June for each year 2012–13
to 2015–16 ............................................................................................................................... 122

Transition period water take report 2012‒13 to 2015‒16
Page 6
Figure 27 Bridging the gap ‘available’ HEW as compared to the of total ‘available’ HEW as at 30
June 2012–13 to 2015–16 ........................................................................................................ 123
Figure 28 Surface water HEW authorised and how it has been utilised at a Basin scale 2013–14
to 2015–16 ............................................................................................................................... 135
Figure 29 Comparison of consumptive and HEW carryover as a proportion of end of year actual
storage 2012–13 to 2015–16 – at a Basin scale ....................................................................... 136

Transition period water take report 2012‒13 to 2015‒16
Page 7
Executive summary
This report summarises diversions from the Murray–Darling Basin (the Basin) for the water years
2012–13 to 2015–16 inclusive, as reported by the Basin states1 under two frameworks: the
existing Cap on surface water diversions, and the broader scope of the Water Act 2007 (Cth) and
the 2012 Murray–Darling Basin Plan (the Basin Plan). It also reports on environmental water held
and used for that period.
The report also sets out the Murray–Darling Basin Authority’s (MDBA) assessment of Basin state
compliance with the Murray–Darling Basin Cap on surface water diversions for the water years
2012–13 to 2015–16 inclusive. The assessment has been conducted in accordance with the
requirements of Schedule E to the Murray–Darling Basin Agreement. In this regard, this report
provides the assessment of state compliance with the Cap previously published by the MDBA in
the Water Audit Monitoring Reports.
The report also sets out for the same water years, the results of an ongoing trial of the water
accounting and compliance arrangements — including with respect to the reporting of
environmental water — that will be in place from 1 July 2019 under the Basin Plan. The trial has
no compliance status as the sustainable diversion limits (SDLs) on which the trial is based do not
come into force until 1 July 2019. The commencement of the SDLs is subject to the accreditation
of Basin state water resource plans.
Water is a limited resource in the Basin. There are many demands on the available water coming
from agriculture, industry, towns, individuals and the environment. Robust and transparent water
accounting and compliance is essential to ensure:
the volume of water actually taken from the Basin does not exceed the volume of
water permitted to be taken
water is used in accordance with the relevant rules
rights to water are protected
investment certainty for irrigated agriculture
outcomes from environmental water recovery investments are realised
the water needs of water dependent ecosystems can be met.
Water accounting and compliance has been applied at a Basin-wide scale since 1995.
In 1995, the Murray–Darling Basin Ministerial Council introduced the Murray–Darling Basin Cap
on surface water diversions (the Cap) to protect and enhance the riverine environment and
protect the rights of water users. The Cap introduced long-term limits on how much water could
be taken from rivers in 24 designated river valleys (Cap valleys).
The Cap accounting relates to surface water diversions from the main stem of watercourses
(regulated and un-regulated rivers and streams). In most cases, the long-term Cap limit for each
valley is determined in reference to the 1993–94 level of development in that valley (that is, the
diversions through the water infrastructure and rules in place at that time).
1 The term ‘Basin states’ refers to Queensland, New South Wales, the Australian Capital Territory, Victoria, and South Australia.

Transition period water take report 2012‒13 to 2015‒16
Page 8
The Cap requires Basin states to limit the volume of surface water diverted from designated
valleys so that the relevant long-term Cap limit is not exceeded. States must report annually to
the MDBA on the volumes of water that were permitted to be taken under annual Cap targets and
the volumes that were actually taken. The annual accounts of use against the Cap limits are
formally recorded in a Cap Register which is maintained and published by the MDBA.
The Basin Plan set SDLs in accordance with the Water Act. SDLs represent the maximum long-
term annual average volumes of water that can be taken on a sustainable basis from Basin water
resources. To achieve the surface water SDLs, the Basin Plan requires that the baseline
diversion limit (BDL) is reduced by a long-term average annual volume of 2,750 GL2. In contrast,
the overall groundwater SDL is set higher than the BDL as there are some under-utilised
groundwater systems where take may be increased sustainably and made available for future
use3.
The Australian Government has committed to achieve this reduction through investment in water
recovery. This recovery, known as ‘bridging the gap’, is being prioritised through investment in
irrigation infrastructure projects rather than direct purchase of entitlements from willing sellers.
Importantly, the Basin Plan SDL water accounting and compliance framework expands the Cap
accounting to cover all forms of water take defined in the Basin Plan. That is, for surface water,
water take from watercourses and regulated rivers, by runoff dams, by floodplain harvesting, by
commercial plantations (net take) and under basic rights. The SDL water accounting and
compliance framework also includes all groundwater use in the Basin which was not included
under the Cap.
The making of the Basin Plan has set in train a seven-year process of transition (2012–13 to
2018–19) from Cap-based to SDL water accounting and compliance in the Basin. While some of
the reporting components of the SDL water accounting and compliance framework commenced
in 2012, the Cap remains the only Basin-wide water take compliance regime that is in force.
The SDL water accounting and compliance framework puts in place clear limits and establishes a
foundation for enforcement to ensure that over time, annual actual take of Basin water resources
for consumptive use does not exceed the SDLs. The Basin Plan specifies 29 surface water SDLs
and 81 groundwater SDLs throughout the Basin. The resources covered by each SDL is known
as an SDL resource unit.
The MDBA and Basin states are using the transition period to trial the types of water reporting,
accounting and compliance methods and processes that will need to be in place from 1 July 2019
to ensure the arrangements will be fit for purpose on commencement. The trial is necessary
because the scope of the change from Cap to SDL is substantial and the new approach is best
‘bedded down’ through a trial ahead of it applying formally.
Because the trial is presenting transitional SDL accounts based on the volume of change from
the BDL toward the SDL, the report uses the term ‘transitional diversion limits’ (TDLs) rather than
SDLs. The TDLs generally represent progress on bridging the gap as at the start of each water
2 This volume is subject to change through amendments to the Basin Plan arising from the northern Basin Review and the operation
of SDL adjustment mechanism. 3 The methods on how groundwater SDLs were set can be found in report: The proposed Groundwater Baseline and Sustainable Diversion Limits: Methods report

Transition period water take report 2012‒13 to 2015‒16
Page 9
year (1 July). TDLs are being used because in most cases the water recovery required under the
Basin Plan is not yet complete so the SDL cannot be used under the trial.
Were an SDL resource unit to be fully recovered, the TDL would equal the SDL; were recovery
yet to commence, the TDL would equal the BDL which generally represents 2009 levels of use
adopted as the baseline for the Basin Plan.
The introduction to this report sets out the approach taken, a description of key concepts under
both the Cap and the SDL water accounting and compliance framework, and the objectives of the
trial. The Cap Register appears at the end of Part 2. The key data used for the trial assessment
of water take at SDL resource unit level is included at Appendix 1 (surface water) and Appendix 2
(groundwater).

Transition period water take report 2012‒13 to 2015‒16
Page 10
Summary findings
Cap compliance (refer to Part 1)
1. All Cap valleys in which a cumulative balance is the basis of compliance have remained
compliant over the reporting period.
2. Cap compliance is assessed at the valley level however it is worth noting that at the Basin
State scale, all states have maintained cumulative Cap credits.
3. Cap reporting data indicates an exceedance of the 2014–15 and 2015–16 annual Cap
targets in the Queensland Moonie Cap valley. In accordance with Schedule E of the
Murray–Darling Basin Agreement, the MDBA has established an Independent Audit Group
to conduct a special audit into the potential non-compliance with the long-term Cap in this
Cap valley.
4. Ten Cap valleys do not have an accredited Cap model in place. Compliance in these ten
valleys is either being assessed against models that were provisionally accredited and
have since lapsed or — in the case where a model has not been presented for
accreditation — against existing arrangements in accordance with Schedule E of the
Murray–Darling Basin Agreement. On the other hand, there are three valleys —
Queensland Warrego, Paroo, and Nebine — that have an accredited SDL model in place.
Trial of the SDL water accounting and compliance framework (refer to Part 2)
Surface water
5. Over the four year reporting period, consumptive take from surface water averaged about
11,250 GL per year. Basin-wide, annual actual consumptive take decreased each year in
response to increasingly dry conditions, reduced water availability (annual allocations plus
carryover) and increases in held environmental water entitlements.
6. Over the reporting period, no surface water SDL resource unit recorded a cumulative
balance that was greater than the compliance threshold of -20% or more of the relevant
transitional diversion limit.
7. Across the Basin over the reporting period, between 64% and 73% of annual actual
consumptive take from all forms of surface water take was metered. For watercourses and
regulated rivers, between 89% and 92% of Basin-scale annual actual take was metered.
The reported data does not indicate the type or standard of metering. Reducing the
proportion of unmetered take is an area where further improvements in these accounts can
be made, recognising the need for cost effectiveness considerations in relation to certain
forms of take (e.g., runoff dams). This report makes a number of recommendations in
relation to this issue (refer section 5.4).
8. The levels of metering varies between the northern and southern Basin: between 25% and
51% of all forms of surface water take was metered in the northern Basin, while between
77% and 84% was metered in the southern Basin. Despite this difference in proportion of
metered take, the volume of unmetered water take is roughly similar in the northern and
southern Basin due to the larger volumes used in the southern Basin.

Transition period water take report 2012‒13 to 2015‒16
Page 11
9. Where actual take is not measured, it is reported using long-term average estimates. In
almost all cases, the estimates are those set out in Schedule 3 of the Basin Plan or Water
resource assessments for without-development and baseline conditions (MDBA 2011).
These estimates give no expression to observed annual weather conditions or water
availability for the year in question. Basin-wide between 20% and 30% of actual take was
reported using these long-term estimates.
Groundwater
10. Over the reporting period actual take from groundwater across the Basin averaged
1,430 GL per year. At the Basin scale, transitional groundwater annual credits over the
reporting period were 2,220 GL in 2012–13, 2,030 GL in 2013–14, 1,846 GL in 2014–15
and 1,843 GL in 2015–16. The cumulative balance at 30 June 2016 was 7,939 GL.
The amount of groundwater take that was reported as metered was 78% across the Basin.
11. Over the reporting period, all groundwater SDL resource units but one recorded a
cumulative balance that was less than the compliance threshold of -20% or more of the
relevant transitional diversion limit.
The New South Wales Lower Gwydir Alluvium SDL resource unit recorded a cumulative
balance that was in debit by more than 20% of the relevant transitional diversion limit.
Further analysis indicates that if the reporting period were extended to include data from
2016–17, the cumulative balance will return to a debit less than 20% as of 30 June 2017.
This highlights the importance of states accounting for changes in annual actual take from
SDL resource units in the development of the method for determining annual permitted take
that will be applied in the relevant water resource plan.
Reporting and accounting methods
12. As part of the trial, improvements have been made to the methods used under Cap to
adjust annual permitted take to account for environmental water recovery. These are an
important step toward better protection of the long-term value of recovered entitlements.
Further improvements are possible.
13. The processes used by Basin states to collect and report water take data and those used
by the MDBA to receive and assess that data are predominantly manual, labour intensive,
time consuming, and prone to human error. This contributes to the ongoing challenge that
Basin states face in providing annual reporting data within the statutory time frames, which
in turn delays the timely assessment of that reporting data. Potential improvements to these
methods of collection and processing have been identified which will be pursued in the
coming years.
Trial reporting of environmental water availability and use (refer to Part 3)
14. Under section 32 of the Water Act, the MDBA must identify and account for held
environmental water in the Murray–Darling Basin each year. Part 3 of this report addresses
this requirement.

Transition period water take report 2012‒13 to 2015‒16
Page 12
Surface water
15. At a Basin scale, the total volume of available held environmental surface water increased
from 1,880 GL (in long-term average volume terms) as at 30 June 2012 to 2,787 GL as at
30 June 2016.
This volume includes both held environmental water recovered before 30 June 2009 as
well as held environmental water that contributes to bridging the gap between the BDL and
the SDL.
16. The volume of available held environmental surface water that contributes to bridging the
gap and to determining the TDLs increased by 605 GL (in long-term average volume terms)
between 1 July 2012 (1,087 GL) and 1 July 2015 (1,692 GL).4
17. The long-term diversion limit equivalence (LTDLE) factors being used to estimate the long-
term average volumes of surface water recovered to bridge the gap are those adopted by
the Murray–Darling Basin Ministerial Council in November 2011.
These factors were derived from a number of sources and further work is required to
ensure a consistent set of factors is used across the Basin. Accordingly, it is anticipated
that some of the estimates of the long-term diversion limit equivalence of held
environmental water will change based on the assumptions used by Basin states to
prepare water resource plans for accreditation.
18. Annual environmental water authorised for use (allocation plus carryover) increased each
year despite the annual decrease in total volumes of water authorised for use (consumptive
plus environmental). This is a function of the increase in the total held environmental pool
as a result of ongoing water recovery.
19. The volume of held environmental surface water used, increased each year.
20. Carryover of held environmental water allocations from one year to the next was a feature
of environmental water use over the reporting period. At a Basin scale, available data
indicates held environmental water that was carried over to the next water year was
between 6% and 7% of water in storage, whereas consumptive carryover was between
23% and 26% of water in storage.
Groundwater
21. The total volume of held environmental groundwater increased from 0 GL as at
30 June 2012 to 8.96 GL at 30 June 2016.
22. Bridging the gap is only required in two groundwater SDL resource units: the Queensland
Upper Condamine Alluvium (Central Condamine Alluvium) and Upper Condamine Alluvium
(Tributaries). The total target recovery volume is 40.4 GL by 30 June 2019.
The total volume of held environmental groundwater that contributes to bridging the gap
was 2.36 GL as at 30 June 2016.
4 The transitional diversion limit in a particular year is determined by subtracting held environmental water that contributes to bridging the gap available at 1 July of that year from the relevant BDL.

Transition period water take report 2012‒13 to 2015‒16
Page 13
Recommendations
MDBA recommends that to prepare for the commencement of SDL water accounting and
compliance from 1 July 2019, the following actions are prioritised.
1. Improving the methods for estimating volumes of annual permitted and annual actual take.
The current use of long-term average estimates for up to 30% of take (i.e. take by
floodplain harvesting, runoff dams, commercial plantations (net take) and under basic
rights) provides a benchmark from which improvements can be made. Improvements in this
area will enhance the integrity of the SDL water accounting and compliance framework.
New methods that give some expression to annual weather conditions and water
availability in the relevant SDL resource unit should be investigated over the remainder of
the transition period so that they can be applied from 1 July 2019 wherever possible.
Similarly, other lines of evidence that provide the ability to identify any growth in these
forms of take should also be developed.
2. Increasing the proportion of actual take that is measured across the Basin to an agreed
standard.
The integrity of the SDL water accounting and compliance framework is enhanced
wherever actual take is measured rather than modelled or estimated. Identifying and taking
advantage of cost effective ways of increasing the proportion of measured take, particularly
where that measurement is consistent with an agreed national standard, will increase the
overall integrity of the framework as well the levels of public confidence in the accounting
and compliance arrangements.
3. Improving the methods for adjusting annual permitted take to account for environmental
water recovery.
During the transition period, an improved methodology — as compared with that used for
Cap purposes — has been developed to account for environmental water recovery in the
annual permitted take volume. This methodology will be superseded by more sophisticated
methods that are expected to be developed by Basin states in the preparation of their water
resource plans (WRPs).
The MDBA will work with Basin states throughout the transition period so that the best available
methods for environmental water adjustment are incorporated into water resource plans.
This is fundamental to maintaining the long-term value of the water that has been
recovered to bridge the gap and hence achieve the SDLs. It is also essential in providing
certainty to consumptive and environmental entitlement holders.
4. Adoption of automated reporting tools where possible to improve the timeliness, accuracy
and efficiency of reporting and assessment.
The MDBA is developing a new automated SDL reporting tool that will enhance the
timeliness, accuracy and reporting outputs available from the annual assessment of state
reporting data. Making data more readily accessible for further interrogation will also be
progressed.

Transition period water take report 2012‒13 to 2015‒16
Page 14
1. Introduction
1.1. About this report
This report summarises the diversion of water from the Murray–Darling Basin for the four water
years5 from 2012–13 to 2015–16 inclusive, as reported by the Basin states under two
frameworks: the existing Cap on surface water diversions and the broader scope of the Water
Act and Basin Plan. It also reports on environmental water held and used for that period.
The report sets out the Murray–Darling Basin Authority’s (MDBA) assessment of Basin state6
compliance with the Murray–Darling Basin Cap on surface water diversions.
In addition it summarises the results of an ongoing trial of the SDL water accounting and
compliance arrangements that will be in place from 1 July 2019 under the Basin Plan. This trial
has no compliance status as the sustainable diversion limits (SDLs) on which it is based do not
come into force until 1 July 2019. The commencement of the SDLs is subject to the accreditation
of Basin State water resource plans.
Table 1 provides a comparison of the key features of Cap and SDL water accounting and
compliance.
All methods and analysis have been undertaken consistent with the requirements of Schedule E
to the Murray–Darling Basin Agreement and/or the 2012 Basin Plan. Any amendments to the
Basin Plan that are made will be incorporated in subsequent reporting.
To avoid doubt, the amendments proposed to the Basin Plan in late 2016 to give effect to recent
reviews of groundwater sustainable diversion limits and the Northern Basin Review are not
incorporated into this report. Similarly, the amendments currently being progressed in relation to
the operation of the SDL Adjustment Mechanism are not incorporated in this report.
The purpose of this report is to:
1. meet the MDBA’s ongoing commitment to report on annual Basin state compliance with the
Cap in accordance with Schedule E to the Murray–Darling Basin Agreement (see Part 1)
2. document the results of a trial assessment of the availability and take of water for
consumptive use since commencement of the Basin Plan. The trial assessment uses the
SDL water accounting and compliance rules that are due to be in force from 1 July 2019
(see Part 2)
3. document the trial reporting of availability and use of held environmental water and planned
environmental water (see Part 3)
5 For the purpose of Cap and SDL water accounting, a water year commences on 1 July and ends on the following 30 June. 6 The term ‘Basin states’ refers to Queensland, New South Wales, the Australian Capital Territory, Victoria, and South Australia.

Transition period water take report 2012‒13 to 2015‒16
Page 15
4. document progress made to date by the MDBA and the Basin states to put in place
methods and processes to ensure monitoring and reporting of compliance with the SDL will
be fit-for-purpose from 1 July 2019 (see Parts 2 and 3)
5. document the areas where further work is required to ensure the SDL water accounting and
compliance rules can be implemented as intended from 1 July 2019 (see Part 4).
All views expressed in this report are solely those of the MDBA unless stated otherwise.
This report is set out under four parts:
Part 1: Current compliance under the Cap on surface water diversions.
Part 2: Trial assessment of annual water availability and take under the SDL water accounting
and compliance framework.
Part 3: Environmental water availability and use.
Part 4: Future work.

Transition period water take report 2012‒13 to 2015‒16
Page 16
Table 1 Comparison of the key features of Cap and sustainable diversion limit water accounting and compliance
Key features Cap on diversions Sustainable diversion limit water accounting and compliance
Relevant statute
Schedule E to the Murray–Darling Basin Agreement 2008
Water Act 2007 (Cth) and Basin Plan 2012
In force from 1994–95 2012–13 for reporting.
1 July 2019 for compliance
Areas covered 24 Cap valleys — not all Basin areas included
29 surface water SDL resource units
81 groundwater SDL resource units
Long-term limit Limited diversions to 1993–94 levels of development (some exceptions) for each Cap valley. Called ‘long-term Cap Limit’
Set at an environmentally sustainable level of take for each SDL resource unit. Called sustainable diversion limits (SDLs).
For the trial, transitional diversion limits (TDLs) are used.
TDL = baseline diversion limit (BDL) – bridging the gap water recovery as at 1 July each year.7
Annual limit Annual consumptive take limited by ‘annual Cap target’
Annual consumptive take limited by ‘annual permitted take’
Type of water use affected
Surface water that is diverted from regulated rivers and watercourses
All forms of surface water take (watercourses, regulated rivers, runoff dams, floodplain harvesting, commercial plantations (net take) and basic rights)
Groundwater take
Accredited models/ methods
Cap models prepared by states to determine annual Cap target
Model independently review
Model approved by MDBA subject to review outcomes
SDL models/methods to determine annual permitted take developed by states consistent with Basin Plan requirements
Assessed by MDBA as part of water resource plan
Accredited by Commonwealth Minister for Water
For the trial, adjusted Cap models and long-term estimates are used
Compliance approach
Annual diversions subtracted from annual Cap target
Annual debits or credits recorded in Cap Register
Annual debits/credits added each year to give cumulative balance (in most valleys)
Compliance investigation triggered if cumulative balance is a debit of 20% or more of long term Cap (in most valleys)
Annual actual take subtracted from annual permitted take
Annual debits or credits recorded in Register of Take
Annual debits/credits added each year to give cumulative balance for all SDL resource units
Compliance investigation triggered if cumulative balance is a debit of 20% or more of SDL and state does not have a ‘reasonable excuse’
7 For the New South Wales Intersecting Streams SDL resource unit, TDL is being set at the SDL until issues with the long-term volume of water entitlements recovered in this resource unit are resolved.

Transition period water take report 2012‒13 to 2015‒16
Page 17
1997-9
8
1998-9
9
……
…
2011-1
2
2012-1
3
2013-1
4
2014-1
5
2015-1
6
2016-1
7
2017-1
8
2018-1
9
2019-2
0
2020-2
1
2021-2
2
2022-2
3
SDL compliance in force
Trial of SDL compliance
Cap compliance in forcea
a Cap compliance will continue (indicated by pale blue shading) after 1 July 2019 subject to any decisions of the
Murray–Darling Basin Ministerial Council.
Figure 1 Timing of compliance arrangements during transition period and beyond
This report uses best available data as submitted by Basin states, the River Management
Division of the MDBA and the Commonwealth Environmental Water Holder (for held
environmental water availability and use). Both the Cap Register in Part 2 of this report and the
‘transitional assessment four-years-on-a-page’ at Appendix 1 and 2, have been prepared using
this data and are the primary data sources for this report.
1.2. Explanation of key concepts and terminology used
The following expands on the key features from Table 1 to describe in more detail, the
fundamental concepts under both the Cap and sustainable diversion limit water accounting and
compliance frameworks. These concepts will be referred to frequently in the report.
Specified geographical areas in which management of water resources must be undertaken in
accordance with the relevant Basin-scale water accounting and compliance arrangements:
Referred to as ‘designated river or Cap valleys’ under the Cap and as ‘water resource plan areas’
and ‘SDL resource units’ under the sustainable diversion limit water accounting and compliance
framework. These are the geographical areas defined under each framework that contain the
water resources that are subject to the arrangements under each framework. There are 24 Cap
valleys set out in Schedule E. There are a total of 110 surface water and groundwater SDL
resource units across the Basin contained within 36 water resource plan areas. Maps of the
surface water and groundwater SDL resource units are provided at Appendix 5 and 6.
Long-term average diversion limits:
Referred to as the ‘long-term diversion Cap’ under the Cap and as the ‘sustainable diversion limit’
under the sustainable diversion limit water accounting and compliance framework. The long-term
average limits represent long-term average annual volumes of consumptive use that are not to
be exceeded. The long-term reference period used for the Cap is generally the climatic
conditions experienced over the period 1891 to 1997. For SDLs, the period 1985 to 2009 is used
(known as the Basin Plan ‘historical climate conditions’).

Transition period water take report 2012‒13 to 2015‒16
Page 18
Permitted take:
Referred to as the ‘annual diversion target’ or ‘Cap target’ under the Cap framework and as
‘annual permitted take’ under the SDL framework. Permitted take is the annual volume of water
calculated according to the methods set out under either the Cap or SDL rules that was permitted
to be used for consumptive purposes in a Cap valley or SDL resource unit in a given water year
under the Cap or SDL arrangements. The volume is determined after the end of the water year
as it needs to take account of things like the climate conditions of the year in question, water
trade and environmental water recovery as well as the long-term limit and water access rules.
It is important to understand that permitted take under these compliance frameworks is not the
same as the volume of water that is ‘authorised’ for use each year by the Basin states through
things like available water determinations in New South Wales or seasonal determinations in
northern Victoria. The Cap and also the SDL are limits on what is actually taken, not on what is
allocated. This is discussed further in Part 2.
Actual take:
Referred to as ‘diversions’ under the Cap and as ‘annual actual take’ under the SDL framework.
Actual take is the annual volume of water calculated according to the methods set out under
either the Cap or SDL rules that was actually used for consumptive purposes in a Cap valley or
SDL resource unit. It is also calculated after the end of the water year so that all water use in the
relevant year can be accounted for.
Annual balance:
The annual balance is the difference between annual permitted take and annual actual take in a
particular water year. Depending on whether it is positive or negative, it is referred to as an
‘annual credit’ or an ‘annual debit’ under both frameworks. For example, if permitted take for a
Cap valley or SDL resource unit was 50 GL in a particular year and actual take in that year was
45 GL, the annual balance would be a credit of 5 GL. If permitted take was 45 GL and actual take
was 50 GL the annual balance would be a debit of -5 GL.

Transition period water take report 2012‒13 to 2015‒16
Page 19
Cumulative balance:
Referred to as ‘cumulative Cap credits’ or ‘debits’ under the Cap and as the ‘cumulative balance’
under the SDL framework.8 The cumulative balance is the sum of each year’s annual balance
over time. For example, if the annual balances for a Cap valley or SDL resource unit over a four
year period were 5 GL, 5 GL, -5 GL and 5 GL, the cumulative balance for each year — assuming
the cumulative balance commences at zero in the first year — would be 5 GL, 10 GL, 5 GL, and
10 GL. The cumulative balance is an accounting tool, it does not represent an actual volume of
water that is directly allocated for use in subsequent years.
For the Cap, the cumulative balance generally commences at zero in the 1997–98 water year
(and thus 2015–16 represents the nineteenth year of accounts).9 For the SDL, the cumulative
balance will commence from the 2019–20 water year with a starting balance of zero. For the
purpose of the trial Register of Take that is being maintained during the transition period,
cumulative balances are calculated from 2012–13 for the sole purpose of illustrating how this
feature of the account will operate from 2019.
Under the SDL water accounting and compliance framework, the cumulative balance for surface
water is adjusted each year to reflect the net effect of any acquisition and disposal of held
environmental water entitlements.
The cumulative balance is central to the compliance tests under both frameworks. In summary, if
a Cap valley or SDL resource unit has a cumulative balance volume that is a debit of 20% or
more of the long-term limit for that valley or SDL resource unit, it triggers the arrangements for
determining if there has been non-compliance with the long-term limit. The different compliance
tests are discussed further in Parts 1 and 2 of this report.
It is important to understand that neither the Cap nor the sustainable diversion limit water
accounting and compliance framework are set up to identify the illegal take of water by individual
water entitlement holders. For example, if an entitlement holder is stealing water by
disconnecting their meter when pumping from the river, that water take will not be recorded and
will not appear in the data reported by Basin states to the MDBA.
Also, if an entitlement holder is taking water outside their access conditions (for example
pumping from the river when a flow trigger has not yet been met) this will not show up explicitly in
these accounts as only annual totals are used. It is expected that both such circumstances would
be managed under compliance procedures established by the Basin state, complemented by
those of the MDBA.
8 Some Cap valleys do not use a cumulative balance – e.g. Queensland Moonie – and Cap compliance is based on the annual credit/debit. Or, as in the case of the SA Metro-Adelaide and associated country areas Cap valley, compliance is based on a set volume over the most recent five-year period. Different compliance tests also apply for these Cap valleys 9 Due to negotiations associated with establishing the Cap, some cap valleys started later (Murray–Darling Basin Council in 2007 agreed to apply Cap from 2007–08 in Queensland and the Australian Capital Territory’s Cap was agreed by the Council in May 2008).

Transition period water take report 2012‒13 to 2015‒16
Page 20
Authorised [Allocated] water:
This refers to the amount of water made available each year by Basin states under state water
planning frameworks through mechanisms such as available water determinations moderated by
valley use limits where these apply (e.g. the limit placed on the crediting and debiting of water
accounts in accordance with the relevant New South Wales water sharing plan).
Depending on the relevant Basin state arrangements, authorised water can include things like:
the announced annual allocation volume and net carryover from the previous year in regulated
systems, allocation against entitlements in unregulated systems and subsequent periods of
access against those entitlements, floodplain harvesting, use of supplementary entitlements and
allowances for losses in diversions from the river to a delivery point.
Volumes cited in the text of this report are measured in gigalitres for each year and in most cases
have been rounded to the nearest whole number. Volumes cited in tables and figures are
generally rounded to either one or two decimal places depending on the size of the smallest
volume being reported.
In submitting their data for each water year covered by this report, Basin states also provided
narrative reports. These reports provide the state view of the context for water availability and
use for that year. These narrative reports can also be accessed from the MDBA web site.

Transition period water take report 2012‒13 to 2015‒16
Page 21
1.3. Trial assessment of water take under the sustainable diversion limit water
accounting and compliance framework
The trial of the sustainable diversion limit water accounting and compliance framework is
discussed in Part 2. The trial is a ‘proof of concept’ to establish and test the types of
arrangements that will need to be in place from 1 July 2019 to manage compliance with the
SDLs.
The objectives of the trial are to:
1. Develop and test the arrangements that Basin states and the Commonwealth Environmental
Water Holder (CEWH) will use to prepare and submit data to the MDBA as required under
section 71 and 32 of the Water Act 2007 and Matter 9 of Schedule 12 of the 2012 Basin
Plan.
2. Develop and test the arrangements that the MDBA will use to receive, assess and report on
the data submitted by Basin states and the CEWH. Noting that there are no compliance
consequences during the trial.
3. Identify where current gaps or weaknesses in the test arrangements are and the
improvements needed to enhance the overall integrity of the SDL water accounting and
compliance framework.
4. Demonstrate what SDL compliance reporting might look like in terms of how data can be
assessed and presented when the rules are fully in force.
Because the trial is a proof of concept, there may be instances where the data reported and
conclusions drawn from that data change between years as better information becomes
available. The trial should draw out instances where generating better information can improve
reporting during the trial as well as the development of the accredited arrangements that will be
applied from 1 July 2019. Consistent with this approach, future transitional water take reports will,
where practical to do so, update data from previous years where new or more accurate data
becomes available.
1.3.1. Data reporting methodology
Cap reporting is well established and the data reported by Basin states is usually generated
using accredited Cap models and/or the output of observed (metered) or estimated water take.10
However, Basin states are in the early stages of developing how to collect and report water take
data under the SDL water accounting and compliance rules. The SDL water accounting methods
that will apply under accredited water resource plans have — in all but one case — not yet been
completed.11
10 Not all Cap valleys have an accredited Cap model. See Section 2.4 for further details. 11 The Queensland Warrego, Paroo, Nebine water resource plan was accredited by the Commonwealth Minister for Water on 15 June 2017. It includes a method for determining annual permitted and annual actual take under the sustainable diversion limit water accounting and compliance rules.

Transition period water take report 2012‒13 to 2015‒16
Page 22
This means that in the trial assessment, the data reported for permitted and actual take under the
SDL water accounting rules may be incomplete, based on estimates of long-term average
volumes and/or the outputs of Cap models that have been adjusted as necessary to the relevant
BDL. This is particularly so with data on permitted and actual take by interception activities and
New South Wales basic landholder rights.12 These forms of take have historically not been
routinely estimated, modelled or measured. See Section 3.1.2 for more information.
MDBA considers that this an appropriate approach during the transition period as Basin states
are still developing the SDL models that will be used to determine annual permitted take under
accredited water resource plans. This approach represents use of the best available information.
12 Interception activities include water take by runoff dams, floodplain harvesting, and commercial plantations (net take). NSW has estimates of basic landholder rights in all water sharing plans.

Transition period water take report 2012‒13 to 2015‒16
Page 23
1.4. Trial reporting of availability and use of environmental water
Detailed discussion of the assessment of the volumes of environmental water available,
authorised and used over the period is provided at Part 3.
There are five ‘headline’ held environmental water volumes dealt with in this report.
Available held environmental water
The total volume of entitlements as at 30 June in any year that have actually been transferred to
an environmental water holder and are available to receive allocation. This volume includes three
components: 1. entitlements recovered prior to the Basin Plan or entitlements recognised as
providing environmental benefits when the baseline diversion limit (BDL) was set; 2. entitlements
recovered after the BDL was established that are not gap-bridging because they do not form part
of consumptive water; and 3. entitlements recovered to bridge the gap from BDL to SDL.
Held environmental water that contributes to bridging the gap
The component of available held environmental water that represents entitlements that have
been recovered to bridge the gap between the BDL and the SDL. This is distinct from the
volumes of held environmental water jointly reported by the MDBA and the Department of
Agriculture and Water Resources as ‘progress toward bridging the gap’. Those volumes include
entitlements that have been secured under a contract but have yet to be transferred to the
Commonwealth Environmental Water Holder.
Held environmental water that determines the transitional SDL (TDL)
The component of ‘gap bridging’ held environmental water that was available as at 1 July in each
water year. This is the volume that is deducted from the relevant BDL to determine the TDL and
hence annual permitted take for the relevant year of the trial.13
Held environmental water authorised for use
The volume calculated after the end of the water year that could have been used in the water
year as a result of all allocations, announced periods of access, carryover available from the
previous year etc.
Held environment water actual use
The component of held environmental water authorised that was actually used during the year in
question.
As discussed earlier, TDLs are the long-term limits being used during the trial of the SDL water
accounting and compliance framework. This approach provides for the calculation of the long-
term diversion limits appropriate to the water year in question for each SDL resource unit during
the trial. In turn, the TDL is then used as the basis for determining the annual permitted take for
each SDL resource unit during the transition period.
13 For the New South Wales Intersecting Streams SDL resource unit, TDL is being set at the SDL until issues with the long term volume of water entitlements recovered in this resource unit are resolved.

Transition period water take report 2012‒13 to 2015‒16
Page 24
Comprehensive reporting of annual data on the availability and use of held environmental water
under the requirements of the Water Act 2007 and the Basin Plan was first provided for the
2013–14 water year. For surface water, the total long-term volume of available held
environmental water had increased to 2,787 GL as at 30 June 2016.
This volume is generally made up of three components:
The first is the environmental water that has been modelled as available to the Basin
under baseline conditions (that is, levels of development as at 30 June 2009) through a
range of state-based and joint recovery programs (875 GL).
The second is the water recovery completed up to the end of the reporting period to
‘bridge the gap’ between the baseline diversion limit and the sustainable diversion limit
(1,709 GL being the proportion of the 2,080 GL that had been recovered and that was
actually available for environmental purposes at the start of the 2015–16 water year).
The third is the environmental water that has been recovered up to the end of the
reporting period but that does not contribute to bridging the gap as it represents volumes
of water that were not previously available to the consumptive pool (e.g. volumes
recovered as a result of projects that reduce evaporation).
The 2012 Basin Plan sets the reduction volume from BDL to SDL at 2,750 GL for surface water
diversions. The volume may change through the operation of the Sustainable Diversion Limit
Adjustment Mechanism or through an amendment to the Basin Plan (as has been proposed to
occur following the Northern Basin Review).
All held environmental water volumes quoted in this report are generally the long-term average
volumes estimated using factors adopted by the Murray–Darling Basin Ministerial Council in
November 2011. These factors were derived from a number of sources and further work is
required to ensure a consistent set of factors is used across the Basin. Accordingly, it is
anticipated that some of the estimates of available held environmental water will change based
on the assumptions used by Basin states to prepare water resource plans for accreditation. This
issue is discussed further at section 8.1.

Transition period water take report 2012‒13 to 2015‒16
Page 25
Part 1:
Current compliance arrangements
Implementation of the Murray–Darling
Basin Cap on Diversion
2012–13 to 2015–16

Transition period water take report 2012‒13 to 2015‒16
Page 26
2. The Murray–Darling Basin Cap on Diversions
Limits on water take at a Basin scale were first introduced in 1995 when the Murray–Darling
Basin Ministerial Council agreed to introduce the Murray–Darling Basin Cap on Diversions of
surface water (the Cap). Prior to this, any limits on take were a function of the relevant Basin
State water sharing and allocation arrangements.
The Cap was introduced in response to increasing levels of take from the Basin’s watercourses.
It was recognised at the time that increases in the levels of take could not be sustained over the
long term as they were impacting on the health of the riverine environment and undermining the
reliability of existing entitlements.
As noted by the Ministerial Council in 2000:
Since the original June 1995 decision of the Murray–Darling Basin Ministerial Council to
introduce a Cap on diversions, all forms of consumptive [surface] water use in the Basin
have been included under the Cap. However, in the initial phase of Cap implementation
the focus was on the development of Cap management arrangements, including
accounting of diversions, for the major extractive uses (e.g. river pumpers, gravity
diversions).14
The Cap arrangements are set out under Schedule E to the Murray–Darling Basin Agreement
2008 and can only be changed through agreement by all members of the Ministerial Council.
The Cap accounting that has been developed thus far applies only to consumptive surface water
diversions from watercourses (regulated and unregulated rivers). Expansion of Cap accounting
arrangements to cover all forms of surface water diversions as per the original decision of the
Ministerial Council will now be achieved through the implementation of the SDL accounting
framework under the Basin Plan.
In most cases, the long-term Cap limit for a designated Cap valley is set as the long-term
average volume of water that would have been diverted under the 1993–94 level of development.
This includes the water sharing rules and infrastructure in place at that time.
2.1. How the Cap works
Schedule E identifies the designated Cap river valleys in each Basin state and the long-term Cap
limit for each of those valleys. There are 24 Cap valleys in total.
The Cap arrangements require the Basin states and the MDBA (for the River Murray upstream of
South Australia) to develop analytical models that will determine an annual Cap target for each
valley. The models must demonstrate that the annual Cap targets, if run over the relevant
historical climate sequence — usually 1 January 1891 to 30 June 1997 — will achieve the long-
term Cap limit.
The analytical models must be independently reviewed. The MDBA then accredits these models
based on the outcomes of the review and the ability of the models to ‘fairly determine the relevant
annual diversion (Cap) target given the climate conditions experienced in any year’ (cl 11(5) of
Schedule E). Basin states then use the models to inform water sharing arrangements for each
14 Murray-Darling Basin Ministerial Council 2000. Review of the Operation of the Cap Overview Report, page 25. Available at: https://www.mdba.gov.au/sites/default/files/pubs/overview-report-mdbc-Aug-2000-w-4-companion-papers.pdf]

Transition period water take report 2012‒13 to 2015‒16
Page 27
Cap valley that aim to ensure that over the long term, annual diversions will not exceed the long-
term Cap limit. The status of Cap models is discussed at section 2.4 and Appendix 3.
To enable assessment of Cap compliance, Basin states are required to provide an annual report
to the MDBA that includes, for each designated Cap valley, data relating to:
a) diversions made within and to the Cap valley
b) water entitlements, announced allocations of water and declarations which permit use of
flows within the Cap valley and
c) trading of water entitlements/allocations within, to or from the Cap valley.
States must also report on their compliance with each annual Cap target for the relevant water
year. The annual reporting data is required to be provided within four months of the end of each
water year.
The MDBA uses the data provided by the Basin states to verify the Basin state assessment of
Cap compliance. The MDBA first applies the relevant adjustments for trade in and out of a Cap
valley and the agreed adjustments for environmental water recovery in the valley to the annual
Cap target for each valley as determined by the relevant Cap model. State data on diversions is
then compared against the adjusted annual Cap target.
If annual diversions are less than the adjusted annual Cap target, an annual credit is recorded in
the Cap Register. If annual diversions are more than the annual Cap target, an annual debit is
recorded. The Cap Register is the formal record of annual diversions and Cap compliance in the
Basin and provides details for every designated Cap valley since 1997–98. The Cap Register for
the period up to 30 June 2016 is provided at the end of Part 1 and is also available on the MDBA
website https://www.mdba.gov.au/publications/mdba-reports/water-take-compliance-reports.
For most Cap valleys, the compliance assessment works on the basis that the annual debits
and/or credits in each valley are added to those from the previous year to create a continuous
cumulative balance.15 For example, assuming the cumulative balance in a valley was zero at the
start of a four-year period, if the annual credits/debits over that period were 5 GL, 5 GL, -5 GL
and 5 GL, then the cumulative balance recorded at the end of year four would be a credit of
10 GL.
The cumulative balance is also recorded in the Cap Register and if that balance is a debit of 20%
or more of the long-term Cap limit, Schedule E requires the MDBA to arrange for an independent
audit of Cap implementation in the affected valley. If the independent audit confirms that actual
take has exceeded the long-term Cap, the MDBA must make a declaration of the exceedance
and advise the Murray–Darling Basin Ministerial Council of the breach.
The Minister of the state in which the breach occurred must then advise the Ministerial Council
about how it will address the issue.
15 Some Cap valleys do not use a cumulative balance – e.g. Queensland – Moonie, Warrego, Paroo and Nebine – and Cap compliance is based on the annual credit/debit. Or, as in the case of SA Metro-Adelaide and associated country areas Cap valley, compliance is based on a set volume over the most recent five-year period.

Transition period water take report 2012‒13 to 2015‒16
Page 28
At the Basin scale, Figure 2 shows how annual Cap targets, annual diversions, annual
credits/debits and the cumulative balance have progressed over the period 1 July 1997 to
30 June 2016.
Figure 2 Basin scale annual Cap targets, annual diversions, annual and cumulative balances 1 July 1997 to 30 June 2016
2.2. Cap compliance reporting
The Cap took full effect from 1 July 1997. However, reporting on Cap implementation has been
underway since 1994–95. Up to and including the 2011–12 water year, the outcomes of the
annual assessment of Cap compliance by the MDBA (and previously by the Murray–Darling
Basin Commission) were presented in annual Water Audit Monitoring Reports.
Annual reports on Cap implementation were also prepared by the Independent Audit Group
established under Schedule E. Both sets of reports are available through the MDBA website at:
https://www.mdba.gov.au/publications/mdba-reports/water-take-compliance-reports.
The annual reports of the Independent Audit Group also contain information about any special
audits that were conducted and any recommendations for improvements to Cap implementation.
With the commencement of the Basin Plan, Transition Period Water Take Reports will replace
annual Cap reporting through Water Audit Monitoring Reports. Cap compliance will continue to
be reported for as long as the Cap is in place but will be combined with reporting on the trial of
the SDL water accounting and compliance framework.
-2,000
-
2,000
4,000
6,000
8,000
10,000
12,000
14,000
16,000
18,000
Div
ersi
on
s (G
L)
Water Year
Annual Cap credits/debits Annual Cap target Diversions Cumulative balance

Transition period water take report 2012‒13 to 2015‒16
Page 29
2.3. Compliance with the Cap
The Cap register at section 2.7 shows that diversions (annual actual take) have generally been
below the annual Cap targets over each of the four years of the reporting period. There have
been some instances where annual actual take has exceeded the annual Cap target. For most
valleys, these annual debits have been offset by existing cumulative balance credits.
The one instance where this has not been the case is in the Queensland Moonie Cap valley.
Section 2.3.1 discusses actions underway to assess possible non-compliance with the long-term
Cap limit in that valley.
While Cap compliance applies at the valley scale, Table 2 shows that a state scale, all Basin
states have maintained cumulative Cap credits over the period. Although Table 2 represents
information for the period of this report (2012–13 to 2015–16), Cap credits/debits have accrued
since 1997-98. As shown in Figure 2 the actual diversions were within a reasonable range of
annual targets for the period prior to 2008–09. The growth in the cumulative balance (i.e. Cap
credits) has been a feature of the period 2008–09 to 2014–15. The possible reasons for this
pattern of usage are outlined in this section.

Transition period water take report 2012‒13 to 2015‒16
Page 30
Table 2 Cumulative Cap balances (GL) by state as at 30 June for each year 2012–13 to 2015–16
State Long-
term Cap Year
Annual Cap target
Diversions Annual balance
Cumulative balance as at
30 June
Queenslanda 1,068.69 2012–13 1,810.76 1,419.46 391.30 1,599.72
2013–14 793.02 770.48 22.54 1,617.61
2014–15 567.24 468.06 99.18 1,693.97
2015–16 444.33 359.72 84.61 1,759.77
NSW 6,363.16 2012–13 7,332.07 6,319.81 1,015.57 6,101.74
2013–14 5,937.97 5,062.60 878.68 6,980.42
2014–15 3,644.80 3,731.75 -83.65 6,896.78
2015–16 3,181.11 2,820.38 364.05 7,260.82
ACT 40.5 2012–13 45.25 18.66 26.60 169.28
2013–14 45.23 18.76 26.47 195.75
2014–15 43.40 16.99 26.41 222.16
2015–16 46.86 20.10 26.76 248.92
Victoria 3,902.59 2012–13 3,539.90 2,969.95 569.95 5,072.61
2013–14 3,444.69 2,517.38 927.31 5,999.92
2014–15 3,214.64 2,579.09 635.55 6,635.47
2015–16 2,029.19 2,481.41 -452.22 6,183.25
South Australiab
724.1 2012–13 816.15 522.09 294.06 1,400.86
2013–14 823.70 442.85 380.84 1,535.24
2014–15 860.31 500.87 359.44 1,540.85
2015–16 893.66 597.47 296.19 1,499.50 a Annual balances do not sum to cumulative balances in Queensland due to the operation of cl 16 of Schedule E, where only two Cap valleys in Queensland run a cumulative balance. b For this table to be consistent with data reported in the Cap Register, certain treatments have been used in relation to the Metropolitan Adelaide and associated country areas component of the SA state totals. The long-term Cap for Metropolitan Adelaide and associated country areas is 650 GL over any period of five years. To determine the long-term Cap for all of South Australia as set out in this table, an average volume of 130 GL for Metropolitan Adelaide and associated country areas has been used. The annual Cap target for Metropolitan Adelaide and associated country areas is 650 GL minus actual diversions for the previous four years.
The state scale cumulative balance volumes shown in Table 2 and the valley scale balances
shown in the Cap Register (Table 8) represent the differences reported by states over time
between modelled annual targets and actual water use behaviour under state water sharing
arrangements. There is not a direct relationship between the cumulative balances and volumes
of real water that remain in storage at the end of each water year.
In this context, it is important to note that both the annual Cap credits/debits and cumulative
balance volumes are determined after the end of each water year once climate conditions and
water availability for the year are known. In contrast, water allocation decisions are generally
made by Basin states periodically from the commencement of each water year.
Basin states do not make allocation decisions based on the cumulative Cap credits that may be
available. These decisions are made in response to actual water availability factors like: starting
water storage conditions, water reserve commitments, carryover commitments, forecast inflows,
forecast evaporation, forecast demand and allocation priority rules. Depending on these factors,

Transition period water take report 2012‒13 to 2015‒16
Page 31
final allocation announcements against all classes of entitlements may not be made until well into
the water year.
Figure 2 and Table 2 indicate that at a Basin scale over the period 2008–09 to 2014–15, actual
diversions have been consistently and at times substantially less than the annual Cap targets.
The growth in cumulative balances is likely to be a function of several factors that include:
1. In some states (e.g. some New South Wales valleys), water sharing arrangements set a maximum level of take that is below the long-term Cap limit. These circumstances make some annual credits in such areas the expected outcome.
2. Conservative water use decision making. A possible consequence of the millennium drought is that, in an overall sense, irrigators may have been more conservative in how much crop they plant in order to ensure they will have enough water to bring the crop through to harvest. This would result in less water use against allocations and the generation of annual Cap credits.
3. Irrigation enterprises may also have taken a while to get back to normal production levels after the millennium drought, and at first may not have been able to make full use of the water available.
4. Most of the Cap models currently used to determine annual Cap targets simulate 1993–94 arrangements and thus do not incorporate more recent carryover rules that have been established in the period since, including in response to the millennium drought. This means that modelled annual Cap targets could be expected to be higher than if these rules were incorporated, meaning annual credits are again more likely.
5. The methodology for accounting for environmental water recovery affects the annual Cap target, and this has an increased significance with large water recovery efforts beginning in 2009. The simple methodology available under Cap arrangements is based on ‘use methods’ (Appendix 4) that generally make annual credits more likely.
The trial of the SDL water accounting and compliance framework uses a methodology that more
accurately represents the effect of the recovery of water for the environment in line with Basin
Plan requirements (Water Resource Plans are required to use a methodology consistent with
Basin Plan requirements). Refer to Section 7.2 and Appendix 5.
It should be noted that cumulative balances generated under the Cap will not transfer over to the
relevant SDL resource unit under the SDL water accounting and compliance framework (though
they will continue for Cap purposes, should such accounting continue to be mandated by the
Murray–Darling Basin Ministerial Council). The Basin Plan requires that a new SDL Register of
Take commences on 1 July 2019 with a cumulative balance of zero in all parts of the Basin.
2.3.1. Queensland
Diversions in all Queensland Cap valleys were within their annual Cap targets for 2012–13 and
2013–14. However, the data indicates that in the 2014–15 and 2015–16 water years, diversions
in the Moonie valley exceeded annual Cap targets. Similarly, diversions in the Queensland
Border Rivers exceeded the annual Cap target in 2015–16.
In the case of the Border Rivers Cap valley, the cumulative credits recorded in the Cap Register
offset the annual exceedance and the valley remains compliant over the longer term.

Transition period water take report 2012‒13 to 2015‒16
Page 32
In the case of the Moonie valley, the arrangements under Schedule E mean that while annual
Cap credits/debits are recorded, they do not accumulate. In the absence of a cumulative balance,
the arrangements for the Moonie — and the Warrego, Paroo and Nebine Cap valleys — are that
if annual diversions exceed the annual Cap target the requirement for a special audit is triggered.
The MDBA established an Independent Audit Group (IAG) in consultation with Basin states in
October 2017. The results of the special audit into Cap implementation in the Moonie must be
made available within six months of commencement. If the IAG determines that the long-term
Cap has been exceeded, the MDBA will declare the exceedance and report the matter to the
Ministerial Council.
In response to the exceedance of the annual Cap target in the Moonie, Queensland has stated:
The exceedance of the annual Cap target in the Moonie valley in 2014–15 and 2015–16
was of a technical nature and relates to how the annual Cap target is calculated in the
accredited hydrologic Cap model. This issue is being addressed in the review of the
hydrologic model and water accounting methods for the water resource plan being
prepared for accreditation under the Commonwealth Water Act 2007. A special audit
conducted by the Independent Audit Group to review these matters is welcomed and
Queensland awaits any advice from this process to improve water management in the
Basin.
2.3.2. New South Wales
All New South Wales valleys were Cap compliant over the reporting period and continue to
accumulate credits. There were several Cap valleys where annual diversions were more than the
annual Cap target in one or more years of the reporting period and annual debits were recorded.
These were the:
Gwydir valley in 2012–13 and 2014–15
Macquarie/Castlereagh/Bogan in 2013–14 and 2015–16
NSW Murray in 2014–15
In all instances, existing cumulative credits meant that each valley remained in overall cumulative
credit and thus remained compliant with the Cap.
2.3.3. Victoria
All Victorian Cap valleys were compliant over the reporting period and continue to maintain
cumulative credits. There were instances where annual diversions in various Cap valleys were
more than the relevant annual Cap target and annual debits were recorded. These include the:
Victorian Murray/Kiewa/Ovens Cap valley in 2012–13 and 2015–16
Goulburn/Broken/Loddon Cap valley in 2015–16
Wimmera–Mallee in 2015–16

Transition period water take report 2012‒13 to 2015‒16
Page 33
In all instances, existing cumulative credits meant that each valley remained in overall cumulative
credit and thus remained compliant with the Cap.
2.3.4. Australian Capital Territory
Diversions in the Australian Capital Territory Cap valley were within its annual Cap target over
the four-year period, and Cap credits continued to accumulate.
2.3.5. South Australia
All South Australian Cap valleys were compliant over the reporting period and continue to
accumulate credits. Diversions in all South Australian Cap valleys were also within their annual
Cap targets over the reporting period.
Metropolitan Adelaide and associated country areas
Under the Cap arrangements, the Cap limit for the Metropolitan Adelaide and associated country
areas Cap valley works differently to all other Cap valleys within the Basin. The Metropolitan
Adelaide Cap covers diversions for water supply purposes delivered to Metropolitan Adelaide
and associated country areas through the Swan Reach–Stockwell, Mannum–Adelaide and
Murray Bridge–Onkaparinga pipeline systems.
This Cap valley operates under a five-year rolling Cap. The annual diversion target is calculated
as 650 GL minus the sum of diversions of the preceding four years. Diversions for this Cap valley
are not to exceed 650 GL within a five-year period. Further, the annual use and Cap target are
adjusted for any water accessed through trade to support water use in this Cap area. This is
known as the ‘First Use licence’ as it is considered to provide, for Cap purposes, the first water
used in each water year. It is also used to account for additional water required for Metropolitan
Adelaide on top of the water available under the Metropolitan Adelaide Cap.
In 2015–16 allocations of 8.34 GL were acquired from other designated Cap valleys and use was
recorded against the First Use licence. This was the first time such a trade has occurred since
2005–06. Accordingly, the 2015–16 annual Cap target was adjusted by 8.34 GL to account for
this temporary trade to the First Use licence.
2.4. The status of Cap models
Under Schedule E to the Murray–Darling Basin Agreement, full implementation of the Cap
requires Basin states to develop Cap models that are accredited by the MDBA for use in
determining annual Cap targets for all relevant Cap valleys. These models are the basis for
assessing annual Cap compliance.
There are 24 Cap valleys designated under Schedule E. Schedule E requires that an accredited
Cap model is developed for 22 valleys of these valleys. Two of these valleys in New South Wales
(Namoi/Peel and Barwon–Darling/Lower Darling) have two models within them making a total of
24 models that are required to be accredited. The current status of these models is:
13 accredited Cap models are in place
three have an accredited SDL model in place which is also used for Cap compliance
purposes

Transition period water take report 2012‒13 to 2015‒16
Page 34
nine models have previously been accredited on a provisional basis and these
accreditations have now lapsed
one Cap valley does not have a Cap target and hence an accredited Cap model has not
been developed
one Cap valley does not have an accredited Cap model or lapsed provisionally accredited
Cap model in place.
Appendix 3 gives further details on the status of Cap models.
The MDBA recognises that the Cap models or arrangements currently in place will likely remain
the best available information to assess compliance under the Cap while the states manage the
transition to SDL compliance. Ultimately, a decision to insist on full Cap implementation is a
matter for the Murray–Darling Basin Ministerial Council.
Despite the current status of Cap models, States have continued to meet their obligations under
the Cap and have provided their determination of the annual diversion targets for each Cap
valley for each year since commencement of the Basin Plan.
The MDBA considers the modelling resources available during the remainder of the transition
period are generally better spent preparing new models to meet the requirements under the SDL
compliance framework. Basin states may however choose to submit new Cap models for (re-
accreditation) or to amend existing accredited models. Where this is the case, the MDBA will
provide assistance and support as necessary.

Transition period water take report 2012‒13 to 2015‒16
Page 35
2.5. Annual Cap targets
The annual Cap target is the volume of water that is permitted to be taken from the designated
Cap valleys for consumptive purposes. After the end of each water year, the MDBA assesses
each Basin state’s determination of the annual Cap target for each Cap valley for that water year.
The annual Cap target has two components:
a) modelled component
b) un-modelled component
The portion of the annual Cap target determined by Cap models is called the modelled
component. The Cap models use observed climatic and hydrologic data, as well as water use
patterns to generate the annual Cap target. The diversions from unregulated sections of the river
systems for which there are no models are called the un-modelled component. The un-modelled
component of the annual Cap target is usually determined based on estimates. The total annual
Cap targets are the sum of the modelled and un-modelled components.
With the exception of Queensland Cap models and the model for the Victorian Wimmera–Mallee
Cap valley, the available Cap models determine the annual Cap targets that would have applied
prior to water recovery efforts commencing. Since the Cap limits have to be calculated as they
apply to consumptive use, the annual Cap targets calculated by the models have to be adjusted
to remove held environmental water entitlements that were available for use in the relevant Cap
valley in the relevant year.
The annual Cap targets are also adjusted to reflect trade that occurs between Cap valleys. The
detail of the various adjustments to annual Cap targets for each water year are provided in the
Cap Register (Table 3: Annual Cap adjustments for trade (GL), Table 4: Annual Cap adjustments
for environment (GL) and Table 5: Annual Cap targets adjusted for trade and environment (GL)).
2.5.1. Environmental water adjustments
The need to adjust annual Cap targets to account for held environmental water that is available is
a relatively recent development in the history of the Cap. As different programs aimed at
recovering water entitlements for environmental use have emerged, the volume of held
environmental entitlements in different valleys increased and the need to account for these in
determining annual Cap targets for consumptive use became more pressing.
In May 2008, the Murray–Darling Basin Ministerial Council endorsed the ‘Schedule E protocol’
enabling long-term and annual Cap targets to be adjusted for environmental water entitlement
recovery. This protocol means that diversions reported under the Cap should exclude held
environmental water entitlements, thus enabling the assessment of Cap compliance against
consumptive entitlement diversions only.
The protocol enables the annual Cap targets to be adjusted for environmental entitlement
recovery through the following approaches:
a) hydrological models
b) estimates: fixed, allocations, usage
c) other methods: for example a ‘scaling approach’.

Transition period water take report 2012‒13 to 2015‒16
Page 36
Under both Cap and transitional SDL water accounting and compliance arrangements, the MDBA
and Basin states have been working together to improve the methods being used to recognise
environmental water recovery. Consistent with the Schedule E protocol, different states are
working on different methods as appropriate to their existing water sharing arrangements. Final
agreement between the MDBA and each Basin State to these methods was reached in
November 2015.
This report uses the current methods agreed with Basin states for the adjustment of annual Cap
targets in recognition of environmental water recovery. Appendix 4 sets out the nominated
methods for annualising environmental water recovery under the Cap arrangements that have
been agreed between the MDBA and each of the Basin states.
2.6. Operation of the Cap post 30 June 2019
Any decision to revoke or amend the Cap arrangements set out under Schedule E to the Murray–
Darling Basin Agreement is a matter for the Murray–Darling Basin Ministerial Council. It is
anticipated that the Ministerial Council may make decisions about the operation of the Cap
following the commencement of the SDLs from 1 July 2019.
Any Cap credits or debits that have accrued as at 30 June 2019 will continue for Cap purposes.
They will not however transfer over to the new SDL Register of Take which will commence with a
balance of zero for all SDL resource units. Wherever there are accredited water resource plans in
place from 1 July 2019, water take compliance will be reported and assessed under the SDL
water accounting and compliance framework.
Any annual credits/debits at SDL resource unit scale and the resulting cumulative balance will be
recorded in the Register of Take.
2.7. Cap Register 1 July 1997 to 30 June 2016
The Cap Register is set out in the following eight tables that show annual Cap adjustments,
annual and cumulative Cap balances, and Cap compliance.
Note that Schedule E of the Murray-Darling Basin Agreement states that for all valleys except the
Moonie, Nebine, Warrego and Paroo in Queensland and Metro Adelaide in South Australia,
compliance with the Cap is assessed against the cumulative Cap balance (Table 8). For the four
Queensland valleys, compliance with the Cap is assessed against an annual Cap target (

Transition period water take report 2012‒13 to 2015‒16
Page 37
Table 7), and for the Metropolitan Adelaide and associate country areas Cap valley, compliance
with the Cap is assessed against a five-year rolling balance (Table 9).
As Cap models are improved over time and new information on diversions becomes available
there can be changes to the cumulative balance calculated in the previous year. Table 10 lists
the instances where such changes have occurred for the 2015–16 water year and the reason for
the change.
The format of the Cap Register is based on the approach adopted in Appendixes A to H of the
former Water Audit Monitoring reports.

Transition period water take report 2012‒13 to 2015‒16
Page 38
Table 3: Annual Cap adjustments for trade (GL)
System 1997-98 1998-99 1999-00 2000-01 2001-02 2002-03 2003-04 2004-05 2005-06 2006-07 2007-08 2008-09 2009-10 2010-11 2011-12 2012-13 2013-14 2014-15 2015-16
Intersecting Streams 0.00 0.00 0.00 0.00 0.00 0.00 0.00 0.00 0.00 0.00 0.00 0.00 0.00 0.00 0.00 0.00 0.00 0.00 0.00
Border Rivers 0.00 -1.59 -3.51 -8.47 -8.70 -13.50 -3.40 -6.37 -11.63 -6.74 -14.75 -9.49 -8.58 -19.63 -26.11 -19.51 -27.44 -1.10 -8.83
Gw ydir 0.00 0.00 0.00 0.00 0.00 0.00 0.00 0.00 0.00 0.00 0.00 0.00 0.00 0.00 0.00 0.00 0.00 0.00 0.00
Namoi/Peel 0.00 0.00 0.00 0.00 0.00 0.00 0.00 0.00 0.00 0.00 0.00 0.00 0.00 0.00 0.00 0.00 0.00 0.00 0.00
Macquarie/Castlereagh/Bogan 0.00 0.00 0.00 0.00 0.00 0.00 0.00 0.00 0.00 0.00 0.00 0.00 0.00 0.00 0.00 0.00 0.00 0.00 0.00
Barw on-Darling/Low er
Darling 5.39 13.02 8.99 21.93 7.82 0.00 0.00 -1.14 0.00 0.00 0.00 -27.15 -68.40 37.10 20.00 47.16 55.72 0.00 0.00
Lachlan 0.00 0.00 0.00 0.00 0.00 0.00 0.00 0.00 0.00 0.00 0.00 0.00 0.00 0.00 0.00 0.00 0.00 0.00 0.00
Murrumbidgee -33.44 -38.02 -113.65 -21.42 31.49 -14.49 -34.71 8.03 -5.90 -96.79 -139.10 -389.97 -110.78 -57.20 5.97 7.07 -71.92 -33.00 -207.31
Murray 30.21 6.78 105.81 -12.90 -33.31 30.84 34.89 -0.75 0.08 44.20 -19.89 -138.07 -70.07 -49.72 55.52 102.03 -128.43 36.01 -30.98
Total New South Wales 2.16 -19.82 -2.36 -20.85 -2.70 2.85 -3.22 -0.23 -17.44 -59.32 -173.74 -564.67 -257.83 -89.46 55.38 136.74 -172.08 1.91 -247.12
Goulburn/Broken/Loddon -3.13 3.33 -7.81 -0.77 0.76 -4.40 -59.69 -76.63 19.33 -62.30 -218.12 -106.91 -100.54 -135.21 -106.37 -188.56 -103.84 -218.14 -72.45
Campaspe 0.00 0.00 0.00 0.00 0.00 0.00 0.00 0.00 0.00 0.00 21.88 28.66 26.43 0.13 0.00 0.00 0.00 0.00 0.00
Wimmera-Mallee 0.00 0.00 0.00 0.00 0.00 0.75 0.70 -0.35 0.00 1.26 1.12 1.57 0.00 0.00 0.00 0.00 0.00 0.00 0.00
Murray/Kiew a/Ovens 17.74 11.86 0.70 -1.63 -10.44 -17.42 34.23 53.79 -9.07 36.07 171.62 258.19 51.19 324.96 62.94 13.76 262.90 231.34 259.98
Total Victoria 14.62 15.19 -7.10 -2.40 -9.68 -21.07 -24.76 -23.19 10.26 -24.97 -23.50 181.52 -22.92 189.88 -43.43 -174.80 159.06 13.21 187.54
Metro-Adelaide &
Associated Country Areas 0.00 0.00 0.00 0.00 12.00 11.00 9.41 8.80 16.00 0.00 0.00 0.00 0.00 0.00 0.00 0.00 0.00 0.00 8.34
Low er Murray Sw amps -2.30 -2.88 -4.01 -4.39 -3.81 -4.90 -21.77 -34.02 -32.98 -27.75 -20.22 -8.10 -23.61 -50.79 -47.43 -39.79 -51.90 -53.80 -53.32
Country Tow ns 0.00 0.00 0.00 0.00 -12.00 -11.00 -9.41 -5.00 -8.00 10.70 6.10 6.05 6.60 2.30 -14.00 -10.57 -13.50 -13.00 -12.00
All Other Purposes -14.47 6.46 10.33 19.61 9.56 9.60 41.13 46.69 20.46 89.65 190.94 370.76 286.19 -76.54 18.59 64.84 47.63 45.93 104.27
Combined AOP + Sw amps -16.77 3.58 6.32 15.22 5.76 4.71 19.36 12.67 -12.52 61.90 170.72 362.65 262.58 -127.33 -28.85 25.05 -4.27 -7.87 50.95
Total South Australia -16.77 3.58 6.32 15.22 5.76 4.71 19.36 16.47 -4.52 72.60 176.82 368.70 269.18 -125.03 -42.85 14.48 -17.77 -20.87 47.29
Condamine/Balonne 0.00 0.00 0.00 0.00 0.00 0.00 0.00 0.00 0.00 0.00 0.00 0.00 0.00 0.00 0.00 0.00 0.00 0.00 0.00
Border Rivers 0.00 1.59 3.51 8.47 8.70 13.50 3.50 6.37 11.63 6.74 14.75 9.49 8.58 19.63 26.11 19.51 27.44 1.10 8.83
Moonie 0.00 0.00 0.00 0.00 0.00 0.00 0.00 0.00 0.00 0.00 0.00 0.00 0.00 0.00 0.00 0.00 0.00 0.00 0.00
Nebine 0.00 0.00 0.00 0.00 0.00 0.00 0.00 0.00 0.00 0.00 0.00 0.00 0.00 0.00 0.00 0.00 0.00 0.00 0.00
Warrego 0.00 0.00 0.00 0.00 0.00 0.00 0.00 0.00 0.00 0.00 0.00 0.00 0.00 0.00 0.00 0.00 0.00 0.00 0.00
Paroo 0.00 0.00 0.00 0.00 0.00 0.00 0.00 0.00 0.00 0.00 0.00 0.00 0.00 0.00 0.00 0.00 0.00 0.00 0.00
Total Queensland 0.00 1.59 3.51 8.47 8.70 13.50 3.50 6.37 11.63 6.74 14.75 9.49 8.58 19.63 26.11 19.51 27.44 1.10 8.83
Australian Capital
Territory0.00 0.00 0.00 0.00 0.00 0.00 0.00 0.00 0.00 0.00 0.00 0.00 0.00 0.00 0.00 0.00 0.00 0.00 0.00
Total Basin 0.00 0.55 0.37 0.44 2.07 -0.01 -5.13 -0.58 -0.08 -4.96 -5.67 -4.96 -2.99 -4.97 -4.79 -4.07 -3.34 -4.65 -3.46
Table 3 details the volumes of allocations traded from one Cap valley to another Cap valley. It also includes an adjustment for entitlements permanently traded between three valleys, primarily from Victorian Murray and
NSW Murray to SA Murray. This value adjusts the annual Cap target for each Cap valley. Sign convention follows positive (+) value as volume traded in and negative (-) value as volume traded out.

Transition period water take report 2012‒13 to 2015‒16
Page 39
Table 4: Annual Cap adjustments for environment (GL)
System 1997-98 1998-99 1999-00 2000-01 2001-02 2002-03 2003-04 2004-05 2005-06 2006-07 2007-08 2008-09 2009-10 2010-11 2011-12 2012-13 2013-14 2014-15 2015-16
Intersecting Streams 0.00 0.00 0.00 0.00 0.00 0.00 0.00 0.00 0.00 0.00 0.00 0.00 -16.24 0.00 0.00 0.00 0.00 0.00 0.00
Border Rivers 0.00 0.00 0.00 0.00 0.00 0.00 0.00 0.00 0.00 0.00 0.00 0.00 0.00 0.00 0.00 -0.27 -0.03 0.00 0.00
Gw ydir 0.00 0.00 0.00 0.00 0.00 0.00 0.00 0.00 0.00 0.00 -0.18 -0.26 0.00 -16.77 -1.80 -48.07 -17.34 -56.64 -7.92
Namoi/Peel 0.00 0.00 0.00 0.00 0.00 0.00 0.00 0.00 0.00 0.00 0.00 0.00 0.00 0.00 0.00 -7.73 0.34 0.00 0.00
Macquarie/Castlereagh/Bogan 0.00 0.00 0.00 0.00 0.00 0.00 0.00 0.00 0.00 0.00 -0.69 0.00 -4.13 -60.21 -65.25 -137.72 -17.99 -16.04 -19.16
Barw on-Darling/Low er
Darling 0.00 0.00 0.00 0.00 0.00 0.00 0.00 0.00 0.00 0.00 0.00 -11.40 -21.78 -208.71 -102.31 -48.79 -5.10 0.00 0.00
Lachlan 0.00 0.00 0.00 0.00 0.00 0.00 0.00 0.00 0.00 0.00 0.00 -0.03 0.00 -11.98 -27.55 -66.28 -19.65 -5.82 -47.03
Murrumbidgee 0.00 0.00 0.00 0.00 0.00 0.00 0.00 0.00 -20.00 -20.00 -5.00 -12.96 -91.92 -334.09 -263.26 -326.62 -290.76 -350.55 -219.45
Murray 0.00 0.00 0.00 0.00 0.00 0.00 0.00 0.00 -1.75 -0.23 -0.19 -3.11 -12.23 -358.82 -350.53 -416.08 -380.97 -283.98 -147.40
Total New South Wales 0.00 0.00 0.00 0.00 0.00 0.00 0.00 0.00 -21.75 -20.23 -6.07 -27.76 -146.31 -990.58 -810.69 -1,051.56 -731.49 -713.02 -440.96
Goulburn/Broken/Loddon 0.00 0.00 0.00 0.00 0.00 0.00 0.00 -17.96 -15.50 -4.26 -8.95 -7.11 -15.52 -26.69 -187.86 -216.34 -328.05 -311.99 -233.14
Campaspe 0.00 0.00 0.00 0.00 0.00 0.00 0.00 0.00 0.00 0.00 0.00 0.00 0.00 0.00 -13.68 -24.91 -13.47 -39.47 -5.66
Wimmera-Mallee -24.14 -31.89 -26.00 -15.08 -17.29 -9.88 -6.37 -7.28 -3.17 -6.68 -3.34 -3.25 -17.03 -44.38 0.00 0.00 0.00 0.00 0.00
Murray/Kiew a/Ovens 0.00 0.00 0.00 0.00 0.00 0.00 0.00 -8.49 -6.99 -6.64 -12.42 -24.25 -42.57 -100.59 -104.32 -320.67 -315.49 -356.62 -536.04
Total Victoria -24.14 -31.89 -26.00 -15.08 -17.29 -9.88 -6.37 -33.73 -25.66 -17.58 -24.71 -34.61 -75.12 -171.66 -305.87 -561.92 -657.01 -708.08 -774.84
Metro-Adelaide &
Associated Country Areas 0.00 0.00 0.00 0.00 0.00 0.00 0.00 0.00 0.00 0.00 0.00 0.00 0.00 0.00 0.00 0.00 0.00 0.00 0.00
Low er Murray Sw amps 0.00 0.00 0.00 0.00 0.00 0.00 0.00 0.00 0.00 0.00 0.00 0.00 0.00 0.00 -8.08 -8.59 -8.73 -9.02 -9.22
Country Tow ns 0.00 0.00 0.00 0.00 0.00 0.00 0.00 0.00 0.00 0.00 0.00 0.00 0.00 0.00 0.00 0.00 0.00 0.00 0.00
All Other Purposes 0.00 0.00 0.00 0.00 0.00 0.00 0.00 0.00 0.00 0.00 0.00 -9.24 -13.51 -0.95 -91.20 -143.90 -143.04 -155.43 -172.30
Combined AOP + Sw amps 0.00 0.00 0.00 0.00 0.00 0.00 0.00 0.00 0.00 0.00 0.00 -9.24 -13.51 -0.95 -99.28 -152.49 -151.77 -164.45 -181.53
Total South Australia 0.00 0.00 0.00 0.00 0.00 0.00 0.00 0.00 0.00 0.00 0.00 -9.24 -13.51 -0.95 -99.28 -152.49 -151.77 -164.45 -181.53
Condamine/Balonne 0.00 0.00 0.00 0.00 0.00 0.00 0.00 0.00 0.00 0.00 0.00 0.00 0.00 0.00 -11.51 -63.21 -22.21 -17.18 -10.17
Border Rivers 0.00 0.00 0.00 0.00 0.00 0.00 0.00 0.00 0.00 0.00 0.00 0.00 -0.39 -5.63 -9.05 -10.02 -4.02 -3.42 -3.28
Moonie 0.00 0.00 0.00 0.00 0.00 0.00 0.00 0.00 0.00 0.00 0.00 0.00 0.00 0.00 -1.30 -1.30 -1.30 -1.30 -0.20
Nebine 0.00 0.00 0.00 0.00 0.00 0.00 0.00 0.00 0.00 0.00 0.00 0.00 0.00 0.00 -3.81 -0.13 -0.17 -0.37 -1.14
Warrego 0.00 0.00 0.00 0.00 0.00 0.00 0.00 0.00 0.00 0.00 0.00 0.00 0.00 0.00 -14.88 -1.26 -1.28 -6.64 -5.22
Paroo 0.00 0.00 0.00 0.00 0.00 0.00 0.00 0.00 0.00 0.00 0.00 0.00 0.00 0.00 0.00 0.00 0.00 0.00 0.00
Total Queensland 0.00 0.00 0.00 0.00 0.00 0.00 0.00 0.00 0.00 0.00 0.00 0.00 -0.39 -5.63 -40.55 -75.92 -28.98 -28.90 -20.00
Australian Capital
Territory0.00 0.00 0.00 0.00 0.00 0.00 0.00 0.00 0.00 0.00 0.00 0.00 0.00 0.00 0.00 0.00 0.00 0.00 0.00
Total Basin -24.14 -31.89 -26.00 -15.08 -17.29 -9.88 -6.37 -33.73 -47.41 -37.81 -30.78 -71.62 -235.32 -1,168.83 -1,256.38 -1,841.89 -1,569.24 -1,614.45 -1,417.33
Table 4 details the values for adjustment of annual Cap targets for environmental water. An annual Cap target as determined by hydrological models includes both consumptive and environmental water. The models do
not usually remove environmental water from the annual Cap target. Since compliance with Cap is confined to consumptive use, the adjustment is made to remove environmental use.

Transition period water take report 2012‒13 to 2015‒16
Page 40
Table 5: Annual Cap targets adjusted for trade and environment (GL)
System 1997-98 1998-99 1999-00 2000-01 2001-02 2002-03 2003-04 2004-05 2005-06 2006-07 2007-08 2008-09 2009-10 2010-11 2011-12 2012-13 2013-14 2014-15 2015-16
Intersecting Streams n/a n/a n/a n/a n/a n/a n/a n/a n/a n/a n/a n/a n/a n/a n/a n/a n/a n/a n/a
Border Rivers 269.71 226.57 217.84 234.78 323.01 136.84 186.00 204.50 174.97 69.03 127.93 157.32 137.57 235.27 151.43 338.47 251.63 95.20 187.23
Gw ydir 631.07 299.32 525.89 346.23 452.53 488.74 170.92 206.90 337.15 107.05 106.88 226.13 112.73 365.94 224.96 404.56 508.75 133.85 167.76
Namoi/Peel 367.07 352.13 380.15 374.83 370.19 311.66 249.02 290.65 329.86 160.86 200.06 260.50 260.52 414.15 312.95 421.78 387.20 220.05 204.37
Macquarie/Castlereagh/Bogan 385.71 591.12 410.09 574.66 576.77 256.41 270.43 184.03 393.48 120.42 218.62 143.77 113.53 590.41 407.42 535.38 268.12 203.59 123.05
Barw on-Darling/Low er
Darling 249.19 537.74 327.48 490.98 242.96 183.28 256.88 164.96 258.68 18.63 178.79 151.79 117.71 248.48 226.47 333.23 268.96 154.49 111.45
Lachlan 402.10 318.01 282.92 370.93 439.55 233.39 92.65 60.30 157.12 72.49 92.14 63.86 55.93 118.35 227.53 401.03 358.39 214.57 195.94
Murrumbidgee 2,550.21 2,523.20 2,036.85 2,761.81 2,662.48 2,099.64 1,871.56 1,403.51 2,436.12 1,073.81 850.28 575.13 641.49 1,491.74 2,157.02 2,794.15 2,251.33 1,698.34 1,336.59
Murray 1,869.90 2,168.41 1,735.34 2,030.99 1,706.98 395.96 1,607.67 1,334.69 1,712.66 231.62 450.49 388.69 951.71 1,112.71 1,701.61 2,103.47 1,643.60 924.71 854.72
Total New South Wales 6,724.97 7,016.51 5,916.57 7,185.21 6,774.49 4,105.91 4,705.13 3,849.55 5,800.04 1,853.90 2,225.19 1,967.18 2,391.18 4,577.04 5,409.39 7,332.07 5,937.97 3,644.80 3,181.11
Goulburn/Broken/Loddon 1,984.79 1,652.40 1,589.53 1,679.22 1,587.12 1,004.65 1,622.03 1,642.57 1,590.54 630.58 772.87 588.47 1,114.96 1,266.41 1,717.11 1,793.09 1,641.34 1,292.84 732.19
Campaspe 127.45 84.55 80.14 107.97 111.93 87.49 83.07 81.27 47.01 19.49 44.59 47.61 47.26 59.63 93.92 127.53 114.44 52.08 59.31
Wimmera-Mallee 152.00 155.17 112.84 62.61 79.27 56.13 63.32 68.39 35.41 18.15 37.94 22.02 31.78 42.34 74.98 45.77 43.66 33.68 13.07
Murray/Kiew a/Ovens 1,869.73 1,745.45 1,610.11 1,758.16 1,871.83 1,915.91 1,555.09 1,597.95 1,714.39 1,443.12 1,091.52 875.60 1,314.65 1,226.54 1,621.97 1,573.51 1,645.25 1,836.04 1,224.62
Total Victoria 4,133.97 3,637.56 3,392.62 3,607.96 3,650.16 3,064.17 3,323.50 3,390.18 3,387.35 2,111.34 1,946.91 1,533.71 2,508.65 2,594.92 3,507.98 3,539.90 3,444.69 3,214.64 2,029.19
Metro-Adelaide &
Associated Country Areas n/a n/a n/a n/a n/a n/a n/a n/a n/a n/a n/a n/a n/a n/a n/a n/a n/a n/a n/a
Low er Murray Sw amps 91.90 91.32 90.19 89.81 90.39 89.30 67.72 55.47 61.22 28.77 9.92 8.85 34.80 43.41 38.68 45.82 33.57 31.38 31.66
Country Tow ns 50.00 50.00 50.00 50.00 38.00 39.00 40.60 42.50 42.00 40.70 37.10 37.05 37.60 35.60 36.00 39.43 36.50 37.00 38.00
All Other Purposes 411.84 444.61 449.82 472.98 456.40 487.99 494.56 453.27 445.34 390.26 353.83 464.30 581.57 326.56 353.51 402.76 357.66 381.21 421.69
Combined AOP + Sw amps 503.74 535.94 540.01 562.80 546.79 577.30 562.28 508.74 506.56 419.03 363.75 473.15 616.37 369.97 392.20 448.58 391.23 412.59 453.35
Total South Australia 553.74 585.94 590.01 612.80 584.79 616.30 602.88 551.24 548.56 459.73 400.85 510.20 653.97 405.57 428.20 488.01 427.73 449.59 491.35
Condamine/Balonne n/a n/a n/a n/a n/a n/a n/a n/a n/a n/a n/a n/a n/a 1,728.42 1,014.04 1,242.06 626.25 418.61 343.61
Border Rivers n/a n/a n/a n/a n/a n/a n/a n/a n/a n/a n/a 184.06 175.24 601.05 255.90 520.30 148.41 114.74 76.80
Moonie n/a n/a n/a n/a n/a n/a n/a n/a n/a 12.40 84.80 35.93 75.84 76.84 80.27 41.63 13.62 1.39 0.46
Nebine n/a n/a n/a n/a n/a n/a n/a n/a n/a 2.30 5.80 4.98 9.66 3.11 4.45 0.94 1.21 4.16 5.63
Warrego n/a n/a n/a n/a n/a n/a n/a n/a n/a 45.90 77.00 18.93 94.48 93.56 78.38 5.79 3.47 28.26 17.75
Paroo n/a n/a n/a n/a n/a n/a n/a n/a n/a 2.13 4.09 1.18 1.58 0.08 0.08 0.05 0.07 0.08 0.08
Total Queensland 0.00 0.00 0.00 0.00 0.00 0.00 0.00 0.00 0.00 62.73 171.69 245.08 356.80 2,503.06 1,433.13 1,810.76 793.02 567.24 444.33
Australian Capital
Territory 53.02 30.73 30.26 34.18 37.48 49.71 42.35 40.71 42.53 51.47 39.26 45.67 41.68 17.44 22.42 45.25 45.23 43.40 46.86
Total Basin 11,465.71 11,270.74 9,929.46 11,440.15 11,046.92 7,836.09 8,673.86 7,831.68 9,778.47 4,539.17 4,783.90 4,301.84 5,952.28 10,098.03 10,801.12 13,216.00 10,648.64 7,919.66 6,192.85
Table 5 details the annual Cap target for consumptive water after adjusting for trade and environmental water in Table 3 and Table 4.

Transition period water take report 2012‒13 to 2015‒16
Page 41
Table 6: Annual diversions (GL)
System 1997-98 1998-99 1999-00 2000-01 2001-02 2002-03 2003-04 2004-05 2005-06 2006-07 2007-08 2008-09 2009-10 2010-11 2011-12 2012-13 2013-14 2014-15 2015-16
Intersecting Streams 3.31 3.31 3.31 3.31 3.31 3.31 3.31 3.31 3.31 3.31 3.31 3.31 3.31 3.31 3.31 3.31 3.31 3.31 3.31
Border Rivers 211.34 191.79 206.40 256.79 207.62 146.80 128.85 133.87 161.75 154.94 140.77 146.02 130.85 191.81 157.10 220.60 192.40 62.66 114.58
Gw ydir 565.82 339.55 481.43 458.00 495.57 271.50 202.93 198.61 263.76 173.47 123.13 187.20 90.96 271.44 242.93 424.63 420.66 140.56 120.62
Namoi/Peel 340.02 357.22 384.96 389.67 398.40 328.78 208.07 225.08 269.03 200.92 176.68 223.05 204.77 269.90 245.49 399.81 405.49 188.34 164.31
Macquarie/Castlereagh/Bogan 442.28 395.76 437.44 521.53 596.73 411.20 218.66 102.47 224.15 252.16 74.54 105.61 112.06 182.52 266.65 456.43 292.12 114.49 131.47
Barw on-Darling/Low er
Darling 269.53 431.75 263.64 492.87 204.32 126.90 292.40 186.07 199.41 17.17 221.20 159.26 150.28 124.06 166.37 283.94 180.01 73.58 84.16
Lachlan 428.97 293.22 300.59 423.16 457.15 252.99 58.89 36.45 127.66 66.01 46.30 40.23 25.74 90.14 204.51 343.23 240.73 187.79 166.53
Murrumbidgee 2,585.48 2,505.33 1,874.87 2,747.39 2,347.98 1,793.12 1,775.49 1,618.07 2,200.29 960.15 514.77 602.07 909.94 1,461.47 1,719.77 2,282.61 1,833.60 1,688.61 1,321.03
Murray 1,889.58 1,999.66 1,233.74 2,069.66 2,113.39 879.03 1,311.51 1,240.75 1,667.22 601.53 243.62 341.01 439.32 689.09 1,424.79 1,905.27 1,494.28 1,272.42 714.38
Total New South Wales 6,736.34 6,517.60 5,186.38 7,362.38 6,824.47 4,213.64 4,200.10 3,744.68 5,116.57 2,429.64 1,544.31 1,807.74 2,067.23 3,283.72 4,430.93 6,319.81 5,062.60 3,731.75 2,820.38
Goulburn/Broken/Loddon 1,909.00 1,698.51 1,553.46 1,568.79 1,700.32 1,075.63 1,595.59 1,552.81 1,592.39 651.32 684.46 628.26 803.65 544.46 1,009.77 1,235.48 1,165.29 1,124.88 1,080.56
Campaspe 104.76 83.37 79.84 112.43 128.78 84.81 79.66 41.10 21.34 13.46 23.62 26.64 26.43 18.36 28.48 42.55 25.87 35.06 39.29
Wimmera-Mallee 184.07 159.47 103.15 67.87 83.85 60.48 66.41 49.69 60.19 18.68 44.79 11.45 9.02 9.72 14.21 17.66 15.52 19.34 19.82
Murray/Kiew a/Ovens 1,742.98 1,803.74 1,555.38 1,712.00 1,916.38 1,754.69 1,477.67 1,492.91 1,577.87 1,406.28 800.53 837.39 970.57 563.00 1,292.36 1,674.26 1,310.70 1,399.81 1,341.75
Total Victoria 3,940.81 3,745.09 3,291.82 3,461.09 3,829.33 2,975.61 3,219.34 3,136.51 3,251.80 2,089.74 1,553.40 1,503.74 1,809.66 1,135.55 2,344.83 2,969.95 2,517.38 2,579.09 2,481.41
Metro-Adelaide &
Associated Country Areas 153.09 152.88 138.71 103.63 82.45 164.70 82.07 71.61 73.90 203.08 89.45 149.50 56.90 56.44 59.03 81.67 42.14 73.19 153.34
Low er Murray Sw amps 91.90 91.32 90.19 89.81 90.39 89.30 67.72 55.47 61.22 28.77 14.67 10.17 14.30 13.60 13.99 18.03 15.58 15.67 17.18
Country Tow ns 35.23 36.38 36.53 37.93 35.50 39.20 35.38 38.52 40.29 40.88 37.00 37.00 37.60 34.16 35.73 37.38 35.37 35.81 36.13
All Other Purposes 384.20 409.19 377.22 430.62 412.55 443.21 422.54 453.32 416.99 355.15 281.52 288.20 371.41 257.03 314.67 385.01 349.76 376.20 390.82
Combined AOP + Sw amps 476.10 500.51 467.41 520.43 502.94 532.51 490.26 508.79 478.21 383.92 296.19 298.37 385.71 270.64 328.66 403.04 365.34 391.88 408.00
Total South Australia 664.42 689.77 642.65 661.99 620.89 736.41 607.71 618.92 592.40 627.88 422.64 484.87 480.21 361.24 423.42 522.09 442.85 500.87 597.47
Condamine/Balonne 544.92 467.13 366.38 360.40 161.63 123.06 575.04 166.96 186.16 57.42 775.75 189.86 1,049.32 1,063.50 765.16 1,004.77 611.07 354.08 265.17
Border Rivers 185.67 123.18 162.70 288.14 163.29 77.95 203.74 191.65 124.66 70.78 209.71 156.72 122.30 420.84 209.68 378.37 145.71 102.90 89.45
Moonie 8.33 8.09 8.16 30.64 5.65 6.06 25.83 23.20 2.28 9.36 41.46 29.00 42.60 29.21 18.60 33.62 12.86 3.72 0.78
Nebine 0.00 0.00 0.00 0.00 0.00 0.00 0.00 0.00 0.09 0.17 0.11 0.09 1.00 0.15 1.00 0.00 0.00 0.08 1.40
Warrego 1.96 10.16 3.48 9.18 10.48 7.17 10.77 10.54 3.06 20.58 23.10 6.02 15.37 11.42 13.71 2.67 0.80 7.27 2.92
Paroo 0.04 0.04 0.03 0.03 0.00 0.00 0.10 0.06 0.04 1.99 4.01 1.02 1.57 0.06 0.03 0.03 0.04 0.01 0.00
Total Queensland 740.92 608.60 540.76 688.38 341.04 214.25 815.47 392.40 316.28 160.29 1,054.14 382.70 1,232.16 1,525.17 1,008.19 1,419.46 770.48 468.06 359.72
Australian Capital
Territory 44.21 29.40 26.47 33.74 36.52 40.11 27.82 27.12 27.80 25.06 15.59 18.66 17.61 6.55 8.49 18.66 18.76 16.99 20.10
Total Basin 12,126.71 11,590.45 9,688.08 12,207.59 11,652.26 8,180.02 8,870.45 7,919.63 9,304.86 5,332.60 4,590.08 4,197.71 5,606.86 6,312.22 8,215.85 11,249.97 8,812.07 7,296.76 6,279.08
Table 6 details the actual diversions that occurred in each year for each Cap valley. Diversions are defined by the diversion formula register.

Transition period water take report 2012‒13 to 2015‒16
Page 42
Table 7: Annual Cap credits (GL)
SystemLong
term Cap1997-98 1998-99 1999-00 2000-01 2001-02 2002-03 2003-04 2004-05 2005-06 2006-07 2007-08 2008-09 2009-10 2010-11 2011-12 2012-13 2013-14 2014-15 2015-16
Intersecting Streams n/a n/a n/a n/a n/a n/a n/a n/a n/a n/a n/a n/a n/a n/a n/a n/a n/a n/a n/a n/a
Border Rivers 234.00 58.37 34.78 11.44 -22.01 115.39 -9.96 57.15 70.63 13.22 -85.91 -12.84 11.31 6.72 43.47 -5.67 117.87 59.23 32.54 72.66
Gw ydir 350.22 65.25 -40.23 44.46 -111.77 -43.04 217.24 -32.02 8.29 73.39 -66.41 -16.25 38.93 21.77 94.50 -17.97 -20.06 88.09 -6.72 47.14
Namoi/Peel 363.88 27.04 -5.09 -4.82 -14.84 -28.21 -17.12 40.95 65.57 60.83 -40.06 23.38 37.45 55.75 144.25 67.46 21.97 -18.30 31.71 40.07
Macquarie/Castlereagh/Bogan 491.67 -56.56 195.36 -27.34 53.14 -19.95 -154.79 51.77 81.56 169.34 -131.74 144.08 38.16 1.47 407.89 140.77 78.96 -24.00 89.11 -8.42
Barw on-Darling/Low er
Darling 322.00 -20.34 105.99 63.84 -1.89 38.64 56.37 -35.52 -21.10 59.27 1.46 -42.41 -7.48 -32.57 124.42 60.10 49.29 88.94 80.91 27.29
Lachlan 335.37 -26.87 24.79 -17.67 -52.23 -17.59 -19.61 33.76 23.85 29.46 6.48 45.85 23.63 30.18 28.22 23.02 57.80 117.66 26.78 29.41
Murrumbidgee 2,358.37 -35.27 17.87 161.98 14.41 314.49 306.52 96.07 -214.56 235.82 113.67 335.51 -26.94 -268.45 30.27 437.25 511.55 417.73 9.73 15.57
Murray 1,907.66 -19.68 168.75 501.60 -38.67 -406.41 -483.07 296.16 93.94 45.45 -369.91 206.87 47.69 512.39 423.62 276.82 198.20 149.32 -347.71 140.34
Total New South Wales 6,363.16 -8.06 502.22 733.49 -173.86 -46.67 -104.42 508.33 108.18 686.77 -572.42 684.19 162.75 327.26 1,296.63 981.78 1,015.57 878.68 -83.65 364.05
Goulburn/Broken/Loddon 2,033.68 75.80 -46.11 36.08 110.43 -113.20 -70.97 26.44 89.76 -1.85 -20.74 88.41 -39.78 311.31 721.95 707.33 557.61 476.05 167.96 -348.36
Campaspe 121.82 22.69 1.18 0.31 -4.47 -16.85 2.67 3.41 40.17 25.66 6.04 20.97 20.97 20.83 41.27 65.44 84.98 88.56 17.02 20.03
Wimmera-Mallee 45.06 -32.07 -4.30 9.68 -5.26 -4.58 -4.35 -3.10 18.70 -24.78 -0.53 -6.85 10.57 22.76 32.62 60.77 28.11 28.14 14.34 -6.75
Murray/Kiew a/Ovens 1,702.03 126.75 -58.29 54.73 46.16 -44.55 161.22 77.41 105.05 136.51 36.83 290.98 38.22 344.09 663.54 329.61 -100.75 334.56 436.23 -117.14
Total Victoria 3,902.59 193.16 -107.52 100.80 146.87 -179.17 88.57 104.16 253.67 135.55 21.60 393.51 29.97 698.99 1,459.37 1,163.15 569.95 927.31 635.55 -452.22
Metro-Adelaide &
Associated Country Areas 0.00 128.00 84.00 74.00 109.00 31.24 30.62 110.85 186.75 232.48 99.85 164.10 87.26 93.17 94.63 238.69 246.46 353.82 337.53 248.97
Low er Murray Sw amps 94.20 0.00 0.00 0.00 0.00 0.00 0.00 0.00 0.00 0.00 0.00 -4.75 -1.32 20.50 29.81 24.70 27.80 17.99 15.70 14.47
Country Tow ns 50.00 14.77 13.62 13.47 12.07 2.50 -0.20 5.21 3.98 1.71 -0.18 0.10 0.05 0.00 1.44 0.27 2.05 1.13 1.19 1.87
All Other Purposes 449.90 27.64 35.43 72.60 42.36 43.85 44.79 72.02 -0.05 28.35 35.11 72.31 176.10 210.17 69.53 38.84 17.75 7.89 5.01 30.87
Combined AOP + Sw amps 544.10 27.64 35.43 72.60 42.36 43.85 44.79 72.02 -0.05 28.35 35.11 67.56 174.78 230.66 99.33 63.54 45.54 25.89 20.71 45.35
Total South Australia 594.10 170.41 133.05 160.07 163.43 77.59 75.21 188.08 190.68 262.54 134.78 231.76 262.09 323.83 195.40 302.50 294.06 380.84 359.44 296.19
Condamine/Balonne 729.00 n/a n/a n/a n/a n/a n/a n/a n/a n/a n/a n/a n/a n/a 664.92 248.88 237.29 15.18 64.53 78.43
Border Rivers 250.31 n/a n/a n/a n/a n/a n/a n/a n/a n/a n/a n/a 27.34 52.94 180.21 46.23 141.93 2.70 11.84 -12.64
Moonie 34.90 n/a n/a n/a n/a n/a n/a n/a n/a n/a 3.04 43.34 6.93 33.24 47.63 61.67 8.01 0.75 -2.32* -0.32*
Nebine 6.40 n/a n/a n/a n/a n/a n/a n/a n/a n/a 2.13 5.69 4.89 8.66 2.96 3.45 0.94 1.21 4.09 4.23
Warrego 47.90 n/a n/a n/a n/a n/a n/a n/a n/a n/a 25.32 53.90 12.91 79.11 82.14 64.67 3.12 2.67 20.99 14.83
Paroo 0.18 n/a n/a n/a n/a n/a n/a n/a n/a n/a 0.15 0.08 0.16 0.01 0.03 0.05 0.02 0.03 0.07 0.08
Total Queensland 1,068.69 0.00 0.00 0.00 0.00 0.00 0.00 0.00 0.00 0.00 30.64 103.01 52.24 173.95 977.89 424.94 391.30 22.54 99.18 84.61
Australian Capital
Territory 40.50 8.81 1.33 3.80 0.44 0.96 9.60 14.53 13.59 14.73 26.41 23.67 0.00 0.00 10.89 13.93 26.60 26.47 26.41 26.76
Total Basin 11,969.04 364.32 529.08 998.16 136.88 -147.30 68.95 815.10 566.12 1,099.59 -358.99 1,436.13 507.05 1,524.03 3,940.19 2,886.30 2,297.47 2,235.84 1,036.93 319.39
*Cap exceedance is subject to a special audit by the Independent Audit Group as per Clause 16 of Schedule E of the Murray Darling Basin Agreement.Table 7 details the annual balance in credit or debit after deducting actual diversions in Table 6 from annual Cap targets in Table 5 for each Cap valley.

Transition period water take report 2012‒13 to 2015‒16
Page 43
Table 8: Cumulative Cap credits (GL)
SystemLong
term Cap1997-98 1998-99 1999-00 2000-01 2001-02 2002-03 2003-04 2004-05 2005-06 2006-07 2007-08 2008-09 2009-10 2010-11 2011-12 2012-13 2013-14 2014-15 2015-16
Intersecting Streams n/a n/a n/a n/a n/a n/a n/a n/a n/a n/a n/a n/a n/a n/a n/a n/a n/a n/a n/a n/a
Border Rivers 234.00 58.37 93.15 104.59 82.58 197.97 188.01 245.16 315.80 329.02 243.11 230.27 241.57 248.29 291.76 286.09 403.96 463.19 495.73 568.39
Gw ydir 350.22 65.25 25.02 69.47 -42.29 -85.33 131.91 99.89 108.18 181.57 115.15 98.90 137.83 159.60 254.10 236.13 216.07 304.16 297.44 344.58
Namoi/Peel 363.88 27.04 21.96 17.14 2.30 -25.91 -43.03 -2.08 63.50 124.32 84.26 107.65 145.09 200.84 345.09 412.55 434.53 416.23 447.94 488.01
Macquarie/Castlereagh/Bogan 491.67 -56.56 138.79 111.45 164.59 144.63 -10.16 41.61 123.17 292.51 160.76 304.84 343.01 344.48 752.37 893.14 972.09 948.09 1,037.20 1,028.78
Barw on-Darling/Low er
Darling 322.00 -20.34 85.65 149.49 147.60 186.24 242.61 207.10 185.99 245.26 246.72 204.31 196.84 164.27 288.68 348.79 398.08 487.02 567.93 595.22
Lachlan 335.37 -26.87 -2.08 -19.75 -71.98 -89.57 -109.18 -75.42 -51.57 -22.11 -15.63 30.22 53.85 84.03 112.25 135.27 193.06 310.73 337.50 366.91
Murrumbidgee 2,358.37 -35.27 -17.40 144.58 159.00 473.49 780.00 876.08 661.52 897.34 1,011.01 1,346.52 1,319.58 1,051.13 1,081.40 1,518.65 2,030.20 2,447.93 2,457.66 2,473.23
Murray 1,907.66 -19.68 149.08 650.68 612.01 205.60 -277.47 18.69 112.63 158.08 -211.83 -4.95 42.73 555.12 978.74 1,255.56 1,453.76 1,603.08 1,255.37 1,395.71
Total New South Wales 6,363.16 -8.06 494.16 1,227.65 1,053.79 1,007.12 902.70 1,411.03 1,519.22 2,205.99 1,633.56 2,317.75 2,480.50 2,807.76 4,104.40 5,086.17 6,101.74 6,980.42 6,896.78 7,260.82
Goulburn/Broken/Loddon 2,033.68 75.80 29.69 65.76 176.19 63.00 -7.98 18.46 108.22 106.37 85.63 174.04 134.25 445.57 1,167.52 1,874.85 2,432.46 2,908.51 3,076.47 2,728.11
Campaspe 121.82 22.69 23.87 24.17 19.71 2.86 5.53 8.94 49.11 74.77 80.81 101.77 122.74 143.57 184.84 250.27 335.25 423.81 440.84 460.86
Wimmera-Mallee 45.06 -32.07 -36.38 -26.69 -31.95 -36.52 -40.88 -43.98 -25.27 -50.06 -50.59 -57.44 -46.87 -24.11 8.51 69.28 97.39 125.53 139.87 133.12
Murray/Kiew a/Ovens 1,702.03 126.75 68.46 123.19 169.35 124.80 286.02 363.43 468.48 604.99 641.83 932.81 971.03 1,315.11 1,978.65 2,308.26 2,207.51 2,542.07 2,978.30 2,861.16
Total Victoria 3,902.59 193.16 85.63 186.43 333.30 154.13 242.69 346.86 600.53 736.08 757.67 1,151.18 1,181.15 1,880.14 3,339.52 4,502.66 5,072.61 5,999.92 6,635.47 6,183.25
Metro-Adelaide &
Associated Country Areas0.00
128.00 84.00 74.00 109.00 31.24 30.62 110.85 186.75 232.48 99.85 164.10 87.26 93.17 94.63 238.69 246.46 353.82 337.53 248.97
Low er Murray Sw amps 94.20 0.00 0.00 0.00 0.00 0.00 0.00 0.00 0.00 0.00 0.00 -4.75 -6.07 14.43 44.24 68.93 96.73 114.72 130.43 144.90
Country Tow ns 50.00 14.77 28.40 41.87 53.94 56.44 56.24 61.45 65.43 67.14 66.96 67.06 67.11 67.11 68.55 68.82 70.88 72.01 73.20 75.07
All Other Purposes 449.90 27.64 63.06 135.66 178.03 221.87 266.66 338.68 338.64 366.99 402.10 474.41 650.51 860.67 930.20 969.04 986.79 994.68 999.69 1,030.57
Combined AOP + Sw amps 544.10 27.64 63.06 135.66 178.03 221.87 266.66 338.68 338.64 366.99 402.10 469.66 644.44 875.10 974.44 1,037.97 1,083.52 1,109.41 1,130.12 1,175.47
Total South Australia 594.10 170.41 175.46 251.53 340.97 309.56 353.53 510.98 590.82 666.61 568.91 700.82 798.81 1,035.38 1,137.62 1,345.48 1,400.86 1,535.24 1,540.85 1,499.50
Condamine/Balonne 729.00 n/a n/a n/a n/a n/a n/a n/a n/a n/a n/a n/a n/a 0.00 664.92 913.80 1,151.08 1,166.26 1,230.79 1,309.22
Border Rivers 250.31 n/a n/a n/a n/a n/a n/a n/a n/a n/a n/a 0.00 27.34 80.28 260.49 306.72 448.64 451.35 463.18 450.54
Moonie 34.90 n/a n/a n/a n/a n/a n/a n/a n/a n/a n/a n/a n/a n/a n/a n/a n/a n/a n/a n/a
Nebine 6.40 n/a n/a n/a n/a n/a n/a n/a n/a n/a n/a n/a n/a n/a n/a n/a n/a n/a n/a n/a
Warrego 47.90 n/a n/a n/a n/a n/a n/a n/a n/a n/a n/a n/a n/a n/a n/a n/a n/a n/a n/a n/a
Paroo 0.18 n/a n/a n/a n/a n/a n/a n/a n/a n/a n/a n/a n/a n/a n/a n/a n/a n/a n/a n/a
Total Queensland 1,068.69 0.00 0.00 0.00 0.00 0.00 0.00 0.00 0.00 0.00 0.00 0.00 27.34 80.28 925.41 1,220.51 1,599.72 1,617.61 1,693.97 1,759.77
Australian Capital
Territory 40.50 8.81 10.14 13.94 14.38 15.34 24.94 39.47 53.05 67.78 94.19 117.85 117.85 117.85 128.74 142.68 169.28 195.75 222.16 248.92
Total Basin 11,969.04 364.32 765.40 1,679.56 1,742.44 1,486.15 1,523.86 2,308.34 2,763.62 3,676.45 3,054.33 4,287.61 4,605.66 5,921.42 9,635.68 12,297.51 14,344.21 16,328.93 16,989.23 16,952.26
Table 8 details the values from Table 7 on a cumulative basis since Cap commenced.

Transition period water take report 2012‒13 to 2015‒16
Page 44
Table 9: Cap Register — for Metropolitan Adelaide, South Australia (GL)
YearSA - Metropolitan
Adelaide Diversion
Gross Metro-
Adelaide &
Associated
Country Areas
(rolling 5-year
Cap is 650 GL)
First use
license
Net Metro-Adelaide
& Associated
Country Areas
(rolling 5-year Cap
is 650 GL)
Annual Cap Credit -
Metro-Adelaide &
Associated Country
Areas
1997-98 Annual Diversion 153.09 0.00 153.09
Diversion - 5 Years to 1997/98 554.76 0.00 554.76 95.24
1998-99 Annual Diversion 152.88 0.00 152.88
Diversion - 5 Years to 1998/99 598.47 0.00 598.47 51.53
1999-00 Annual Diversion 138.71 0.00 138.71
Diversion - 5 Years to 1999/00 576.58 0.00 576.58 73.42
2000-01 Annual Diversion 103.63 0.00 103.63
Diversion - 5 Years to 2000/01 614.00 0.00 614.00 36.00
2001-02 Annual Diversion 82.45 12.00 70.45
Diversion - 5 Years to 2001/02 630.76 12.00 618.76 31.24
2002-03 Annual Diversion 164.70 11.00 153.70
Diversion - 5 Years to 2002/03 642.38 23.00 619.38 30.62
2003-04 Annual Diversion 82.07 9.41 72.66
Diversion - 5 Years to 2003/04 571.56 32.41 539.15 110.85
2004-05 Annual Diversion 71.61 8.80 62.81
Diversion - 5 Years to 2004/05 504.45 41.21 463.25 186.75
2005-06 Annual Diversion 73.90 16.00 57.90
Diversion - 5 Years to 2005/06 474.73 57.21 417.52 232.48
2006-07 Annual Diversion 203.08 0.00 203.08
Diversion - 5 Years to 2006/07 595.36 45.21 550.15 99.85
2007-08 Annual Diversion 89.45 0.00 89.45
Diversion - 5 Years to 2007/08 520.11 34.21 485.90 164.10
2008-09 Annual Diversion 149.50 0.00 149.50
Diversion - 5 Years to 2008/09 587.54 24.80 562.74 87.26
2009-10 Annual Diversion 56.90 0.00 56.90
Diversion - 5 Years to 2009/10 572.83 16.00 556.83 93.17
2010-11 Annual Diversion 56.44 0.00 56.44
Diversion - 5 Years to 2010/11 555.37 0.00 555.37 94.63
2011-12 Annual Diversion 59.03 0.00 59.03
Diversion - 5 Years to 2011/12 411.31 0.00 411.31 238.69
2012-13 Annual Diversion 81.67 0.00 81.67
Diversion - 5 Years to 2012/13 403.54 0.00 403.54 246.46
2013-14 Annual Diversion 42.14 0.00 42.14
Diversion - 5 Years to 2013/14 296.18 0.00 296.18 353.82
2014-15 Annual Diversion 73.19 0.00 73.19
Diversion - 5 Years to 2014/15 312.47 0.00 312.47 337.53
2015-16 Annual Diversion 153.34 8.34 145.00
Diversion - 5 Years to 2015/16 409.37 8.34 401.03 248.97
Table 9 details the Cap target for Metropolitan Adelaide. It is 650 GL each year minus the actual diversions for previous four
years. A model is not used to determine the Cap target in the Metropolitan Adelaide.

Transition period water take report 2012‒13 to 2015‒16
Page 45
Table 10: Difference in cumulative Cap credits between Cap Register, 2014–15 and Cap Register, 2015–16 (GL)
Model Cap
targets
Cap
adjustment
for trade
Cap adjustment
for
environmental
water
Diversions
Intersecting Streams n/a n/a n/a n/a 0.00 0.00 0.00
Border Rivers 482.53 495.73 13.20 13.20 0.00 0.00 0.00
Gw ydir 336.99 297.44 -39.55 -39.55 0.00 0.00 0.00
Namoi/Peel 437.90 447.94 10.04 10.04 0.00 0.00 0.00
Macquarie/Castlereagh/Bogan 1,037.38 1,037.20 -0.18 -0.18 0.00 0.00 0.00
Barw on-Darling/Low er Darling 537.83 567.93 30.09 30.09 0.00 0.00 0.00
Lachlan 698.96 337.50 -361.46 -361.46 0.00 0.00 0.00
Murrumbidgee 2,298.73 2,457.66 158.93 158.93 0.00 0.00 0.00
Murray 1,281.46 1,255.37 -26.09 -26.09 0.00 0.00 0.00
Total NSW 7,111.79 6,896.78 -215.01 -215.01 0.00 0.00 0.00
Goulburn/Broken/Loddon 3,081.11 3,076.47 -4.64 -4.64 0.00 0.00 0.00
Campaspe 437.94 440.84 2.89 2.89 0.00 0.00 0.00
Wimmera-Mallee 141.74 139.87 -1.88 -1.88 0.00 0.00 0.00
Murray/Kiew a/Ovens 2,989.24 2,978.30 -10.94 -10.94 0.00 0.00 0.00
Total Victoria 6,650.04 6,635.47 -14.57 -14.57 0.00 0.00 0.00
Metro-Adelaide & Associated
Country Areas337.53 337.53 0.00 n/a 0.00 0.00 0.00
Low er Murray Sw amps 130.43 130.43 0.00 0.00 0.00 0.00 0.00
Country Tow ns 73.20 73.20 0.00 0.00 0.00 0.00 0.00
All Other Purposes 999.69 999.69 0.00 0.00 0.00 0.00 0.00
Total South Australia 1,540.85 1,540.85 0.00 0.00 0.00 0.00 0.00
Condamine/Balonne 1,230.79 1,230.79 0.00 0.00 0.00 0.00 0.00
Border Rivers 463.18 463.18 0.00 0.00 0.00 0.00 0.00
Moonie n/a n/a n/a 0.00 0.00 0.00 0.00
Nebine n/a n/a n/a 0.00 0.00 0.00 0.00
Warrego n/a n/a n/a 0.00 0.00 0.00 0.00
Paroo n/a n/a n/a 0.00 0.00 0.00 0.00
Total Queensland 1,693.97 1,693.97 0.00 0.00 0.00 0.00 0.00
Australian Capital Territory 222.16 222.16 0.00 0.00 0.00 0.00 0.00
Total Basin 17,218.81 16,989.23 -229.58 -229.58 0.00 0.00 0.00
Table 10 is a comparison of the cumulative Cap credits with the previous year. Variations could be due to a more current
model run, changes in trade and environmental adjustments and improvements in accuracy of actual diversions. Models are
run each year to determine the annual Cap target. Where the model run produces a different target for the cumulative period
than was obtained the previous year, a correction is made to the prior year’s annual targets which results in variations in the
cumulative balance.
*TPWT Report = Transition Period Water Take Report
System
Difference in
cumulative
Cap credit
Cumulative Cap credit difference due to:Cumulative Cap
credit up to
year 2014-15 in
TPWT* Report
2014-15
Cumulative Cap
credit up to
year 2014-15 in
TPWT* Report
2015-16

Transition period water take report 2012‒13 to 2015‒16
Page 46
Part 2:
Trial assessment of annual water
availability and take under the
sustainable diversion limit water
accounting and compliance rules

Transition period water take report 2012‒13 to 2015‒16
Page 47
3. Purpose of the trial
The making of the Basin Plan has set in train a seven-year process of transition (2012–13 to
2018–19) from Cap-based to SDL water accounting and compliance in the Basin. While some of
the reporting components of the SDL water accounting and compliance framework commenced
in 2012, the Cap remains the only Basin-wide water take compliance regime that is currently in
place.
Given the additional forms of water take captured under the new SDL water accounting and
compliance framework and the significant investment in water recovery to achieve the SDLs, it is
prudent to ensure that all parties subject to the new framework are well prepared to comply with
the new arrangements from 1 July 2019. On this basis, the MDBA and Basin states are
collaborating to run a trial of the new framework during the transition period.
The trial is a ‘proof of concept’ to establish and test the types of arrangements that will need to be
in place from 1 July 2019 to ensure compliance with the SDLs.
The objectives of the trial are to:
1. Develop and test the types of arrangements that Basin states and the Commonwealth
Environmental Water Holder (CEWH) will use to prepare, self-assess and submit data to
the MDBA as required under sections 71 and 32 of the Water Act 2007 and Matter 9 of
Schedule 12 of the 2012 Basin Plan.
2. Develop and test the arrangements that the MDBA will use to receive, assess and report
on the data submitted by Basin states and the Commonwealth Environmental Water
Holder.
3. Identify where current gaps or weaknesses in the trial arrangements are and the
improvements that need to be made in order to enhance the overall integrity of the water
accounting and compliance framework from 2019, noting that there are no compliance
consequences during the trial.
4. Provide an indicative demonstration of what SDL compliance reporting may look like in
terms of how data will assessed and presented when the rules are fully in force.
In relation to objectives 1 and 4, the trial assessment is being presented in a way that is
consistent with the provisions of s.71(1) of the Water Act as set out below.
Part 2, Division 2, Subdivision F — Reporting obligations
71 Reporting obligations of Basin states
(1) A Basin State must, within 4 months after the end of a water accounting period for a water resource plan area in the Basin State give the Authority a written report that sets out the following:
a) the quantity of water available from the water resources of the water resource plan area during that water accounting period;
b) the quantity of water permitted to be taken from the water resources of the water resource plan area during the water accounting period;

Transition period water take report 2012‒13 to 2015‒16
Page 48
c) the quantity of water actually taken from the water resources of the water resource plan area during the water accounting period;
d) details of the water allocations made in relation to the water resources of that area in relation to that water accounting period;
e) details of any other decisions made by, or under the law of, the Basin State, that
permit the taking of water from the water resources of that area during that water
accounting period;
f) details of the trading or transfer of tradeable water rights in relation to the water
resources of that area during that water accounting period:
(i) within the area; and
(ii) into the area; and
(iii) from the area;
g) an assessment of compliance with any long-term annual diversion limit for the
water resources of the area, or for a particular part of those water resources, in
accordance with the method specified in the Basin Plan;
h) if there has been non-compliance with any long-term annual diversion limit for the
water resources of the area, or for a particular part of those water resources—the
actions that the Basin State proposes to take to ensure that the limit is complied
with in the future.
With the commencement of the Basin Plan in November 2012, the reporting requirements under
this clause commenced for the 2012–13 water year (i.e. the first such ‘water accounting period’
mentioned in s.71).
The structure of this part of the report is drawn from the reporting obligations under s.71. For
each report section the connection to the relevant sub-clause(s) of s.71 is provided. In the same
way, the requirements of s32 of the Water Act and Matter 9 of Schedule 12 to the Basin Plan
2012 are used as points of reference in Part 3 of this report.
Section 71 requires that data is reported at least at the level of water resource plan (WRP)
areas. Each WRP area contains one or more SDL resource units as specified in the Basin
Plan. For the purpose of the trial, SDL resource units have been used as the basis of reporting
wherever possible.
This is considered to provide the most useful presentation for the purpose of informing the
indicative compliance arrangements under the trial. It is also consistent with the forthcoming
requirement under Basin Plan s6.08(2) for the Register of Take to provide, from 2019, a record of
take and consequent annual and cumulative balances at the SDL resource unit scale.
Because the trial is a proof of concept, there may be instances where the data that is reported
and the conclusions that are drawn from that data change between years as better information
becomes available. It is the role of the trial to draw out instances where better information can be
generated to inform improvements in reporting during the trial as well as the development of the
accredited arrangements that will be applied from 1 July 2019. Consistent with this approach,

Transition period water take report 2012‒13 to 2015‒16
Page 49
future transitional water take reports will, where practical to do so, update data from previous
years where new/more accurate data becomes available.
The trial seeks to apply all the elements of the SDL water accounting and compliance framework
that will operate from 1 July 2019. However, the extent to which this can be done is limited by the
information and methods that are currently available.
3.1. How the SDL water accounting and compliance framework operates
3.1.1. The long-term average annual limit
As with the Cap, the annual SDL water accounting and compliance framework is made in
reference to long-term average annual limits on the volume of water that can be taken for
consumptive use in each SDL resource unit. These limits are the SDLs specified in Schedule 2 of
the Basin Plan.
At the completion of each water year, the method set out in the accredited WRPs will be used to
ascertain the ‘permitted take’ that applied for that year based on the climatic conditions
experienced. This method often employs long-term hydrological models. This work translates the
long-term average SDL into an annual limit for comparison against actual take. This is analogous
to the arrangements for the long-term Cap and annual Cap target.
Under the Basin Plan the concept of water ‘take’ means the removal of water, or the reduction in
flow, from a water resource.
The Basin Plan defines forms of take as:
take from a watercourse
take from a regulated river
take by floodplain harvesting
take by runoff dams
net take by commercial plantations
take from groundwater
take under basic rights.
For the purposes of the trial, a concept of transitional diversion limits (TDLs) has been
established. These operate in essentially the same way as Cap limits or SDLs, however they also
will reflect the amount of water that has been recovered to bridge the gap at the outset of the
each water year. The concept of the TDL is that given the SDLs have not yet been achieved
across all SDL resource units it is not appropriate to determine annual permitted take in
reference to the SDL. To do so would see actual diversions in the transition period compared to a
diversion limit that had not yet necessarily been achieved through water recovery efforts.
Were an SDL resource unit to be fully recovered, the transitional diversion limit would equal the
SDL; were recovery yet to commence, the transitional diversion limit would equal the baseline
diversion limit (BDL) which generally represents 2009 levels of use and was adopted as the
baseline for the Basin Plan (specified in Schedule 3 of the Basin Plan).
Across the Basin scale, each TDL is expected to decrease each year as water recovery to
achieve the SDL continues and is achieved.

Transition period water take report 2012‒13 to 2015‒16
Page 50
3.1.2. Determination of annual permitted take
Section 10.10 of the Basin Plan requires Basin states to prepare water resource plans that
include methods for determining annual permitted take for each form of take in each SDL
resource unit within the water resource plan area. These methods are equivalent to the Cap
models under the Cap framework. The methods set out in the water resource plans must
demonstrate that over a repeat of the Basin Plan historical climate conditions (1895 to 2009),
permitted take will achieve the SDL for each SDL resource unit.
It is important to understand that as with the long-term Cap limits, the SDLs are not an annual
limit on permitted take for a SDL resource unit. The SDLs are long-term average annual volumes
and by definition, it will be routine for the volume of permitted take in individual years to be above
or below the SDL. While permitted take methodologies attempt to explain as much of the inter-
annual variation as possible (e.g. through relating use to climatic conditions and water
availability), it is not always possible to fully explain such variations and thus ‘unders’ and ‘overs’
are expected and a cumulative balance is used.
Basin Plan compliant methods for determining annual permitted take for each form of take are
currently under development by Basin states. For the trial, Cap models adjusted as necessary to
the BDL and for environmental water recovery are being used to determine surface water
permitted take from watercourses and regulated rivers.
Permitted take for the other forms of surface water take is being determined based on the
estimates in Schedule 3 of the Basin Plan or Water resource assessments for without-
development and baseline conditions, Murray–Darling Basin Authority technical report 2010/20
Version 2 (MDBA 2011) or alternative estimates provided by Basin states. Issues associated with
the use of these long-term average estimates are discussed at section 5.
At this point in the transition period, the use of these long-term estimates of take for certain forms
of surface water take is necessary as methods are not yet available to provide improved
estimates on an annual basis. However, the MDBA is working with the Basin states to develop
more appropriate methods to estimate, model or measure annual actual take by interceptions.
The MDBA considers any improvements in this area will enhance the overall integrity of the SDL
water accounting and compliance framework that is put in place from 1 July 2019.
The determination of permitted take for groundwater is a concept that has not previously existed.
For the purposes of the trial, permitted take is being set at the TDL for each SDL resource unit.
Further discussion about the determination of permitted take for groundwater is provided at
section 7.4.
3.1.3. Determination of annual actual take
Section 10.15 of the Basin Plan requires that water resource plans must set out how the volume
of water actually taken each year for consumptive use by each form of take in each SDL
resource unit will be determined. This is likely to be a combination of volumes measured by water
meters, modelled by hydrological models and/or estimated based on agreed parameters.
For the trial, annual actual take from watercourses and regulated rivers is being determined using
the same methods as for Cap diversions. For the other forms of surface water take, annual actual
take is being set as the long-term average annual estimates listed in Schedule 3 of the Basin
Plan or Water resource assessments for without-development and baseline conditions, Murray–
Darling Basin Authority technical report 2010/20 Version 2 (MDBA 2011) or an alternative

Transition period water take report 2012‒13 to 2015‒16
Page 51
estimate determined by the relevant Basin State. For groundwater, annual actual take is being
determined through a combination of metered and estimated take.
As with permitted take, annual actual take will vary between years. This variability will be the
result of a combination of water availability and the water use decisions made by individual water
entitlement holders. These decisions will be influenced by many factors including the extent of
current and planned plantings, announced allocations, access to carryover, in-crop rainfall and
commodity prices. The effect of these decisions will be that annual actual take will rarely be the
same as annual permitted take. Annual actual take will routinely be at volumes above and below
annual permitted take.
3.1.4. Reporting of annual permitted take, annual actual take and related information
Section 71 of the Water Act, requires Basin states to provide a written report to the MDBA by
31 October each year (or other date agreed by the MDBA) that sets out a range of information
about: water availability, annual permitted take, annual actual take, allocations, trade and so on.
Section 71 has been reproduced in full at the start of this section.
3.1.5. Assessment of compliance with the SDLs
To assist in determining compliance, section 6.08 of the Basin Plan requires the MDBA to
establish a Register of Take. As a minimum, the Register of Take must record for each SDL
resource unit:
annual credits where annual actual take is less than annual permitted take
annual debits where annual actual take is more than annual permitted take
a cumulative balance of the annual credits and debits.
When the SDLs are in force, compliance will be assessed against the cumulative balance of
annual credits and debits relative to the annual permitted take. If the cumulative balance —
adjusted for any acquisition or disposal of held environmental water — for an SDL resource unit
is a debit of 20% or more of the SDL and the relevant Basin state does not have a ‘reasonable
excuse’ as provided for under section 6.12 of the Basin Plan, then an instance of non-compliance
will be confirmed.
For the purposes of the trial of the SDL water accounting and compliance framework, the MDBA
is maintaining a trial Register of Take. The trial Register of Take is being operated as would be
the case if actual compliance was being assessed. It is being used to give an indicative
demonstration of the cumulative balance of take for each SDL resource unit as assessed against
the relevant TDL for that resource unit.
Given that SDL models are not yet in place and the volume of held environmental water varies
over the water years, a method to estimate the annual transitional permitted take that adjusts for
the amount of held environmental water available is required. For the purpose of the trial, MDBA
and each Basin state have agreed on a nominated method for making this annual adjustment.
These methods are a further improvement on those used for Cap purposes and are set out at
Appendix 5. Noting that compliance will ultimately apply at SDL resource unit scale, Figure 3 and
Figure 4 provide the Basin scale findings for the above processes for surface water and
groundwater.

Transition period water take report 2012‒13 to 2015‒16
Page 52
Figure 3 Basin scale surface water transitional diversion limit, annual permitted take, annual actual take, annual credits and adjusted cumulative balance 2012–13 to 2015–16
Figure 4 Groundwater Basin scale transitional diversion limit, annual actual take, and annual credits and cumulative balance 2012–13 to 2015–16
-
2,000
4,000
6,000
8,000
10,000
12,000
14,000
16,000
18,000
2012-13 2013-14 2014-15 2015-16
Vo
lum
e (G
L)
Water Year
Annual Balance SDL BDL
TDL Permitted Take Actual Take
TDL Cumulative Credits
0
1,000
2,000
3,000
4,000
5,000
6,000
7,000
8,000
9,000
2012-13 2013-14 2014-15 2015-16
Vo
lum
e (G
L)
Water Year
Annual credit SDL
BDL TDL
Actual take TDL Cumulative Credits

Transition period water take report 2012‒13 to 2015‒16
Page 53
4. Water availability
s.71(1)(a) the quantity of water available from the water resources of the water resource
plan area during that water accounting period
This section provides information on the overall quantity of water available in the Basin. The
purpose of reporting this volume is to provide an overall picture of the water available throughout
the Basin for surface water and groundwater SDL resource units.
While this is intended to provide useful context for the water allocated, water used and the water
permitted to be taken under the SDL framework, it does not represent a controlling element of
water planning in its own right (though more localised assessments of water availability inform
each of the qualities established for other data reported under s.71).
Over recent years there have been ongoing discussions with Basin states as to how to
meaningfully calculate this volume on an annual basis. These discussions have noted the lower
priority for settling a method for doing so in light of other work to implement the Basin Plan. The
limited utility of an overall assessment of ‘water availability’ to these other elements of Basin
planning has also been a consideration.
Accordingly, for the purpose of this transitional period water take report, long-term annual
average volumes are presented at the Basin scale. In future reports, this data is expected to be
improved in terms of inter-annual variability and estimates at the SDL resource unit scale.
4.1. Surface water
For surface water, the long-term average Basin-wide availability was assessed in the 2012 Basin
Plan as 32,553 GL per year comprising inflows to the Basin and transfers into the Basin
(e.g. from the Snowy Hydro-electric Scheme).16 As noted in the Basin Plan, this was the MDBA’s
best estimate of surface water runoff generated across the Basin, based on modelled inflows
adjusted where necessary to incorporate the effects of interception activities.
4.2. Groundwater
For groundwater, the volume of recharge to groundwater systems is considered the most suitable
measure of ‘water available’. This volume is difficult to calculate on a long-term basis and more
so on an annual basis.
The long-term average estimate of this volume does however provide an overall context for the
scale of development of the groundwater resources of the Basin. It was also used extensively at
the SDL resource unit scale in setting the groundwater SDLs as part of the recharge risk
assessment methodology adopted by the MDBA.
Accordingly, based on the long-term average volume of recharge to groundwater, the long-term
average Basin-wide groundwater availability was assessed by the MDBA as 23,450 GL per
year.17
16 Basin Plan 2012, Schedule 1, paragraph 34. 17 Basin Plan 2012, Schedule 1, paragraph 8.

Transition period water take report 2012‒13 to 2015‒16
Page 54
4.3. Climate and storages
Annual rainfall, temperature conditions and water available in storage are the high-level drivers of
annual water availability. Summaries of these conditions for each year of the reporting period are
set out below.
The climate over the four-year reporting period was variable, commencing with near average
conditions in 2012–13, steadily becoming drier and hot from 2013–14 to mid–2015–16 and then
the period closed with above average rainfall and inflows across much of the Basin. Areas of
Queensland, New South Wales and Victoria entered drought at various points through the
reporting period and maximum and minimum temperatures exceeded the highest on record in
some areas.
In a general sense, the reporting period saw surface water availability decrease as each year
was generally drier than the preceding year.
Figure 5 Murray–Darling Basin rainfall deciles highest to lowest on record 2012–13 to 2015–16
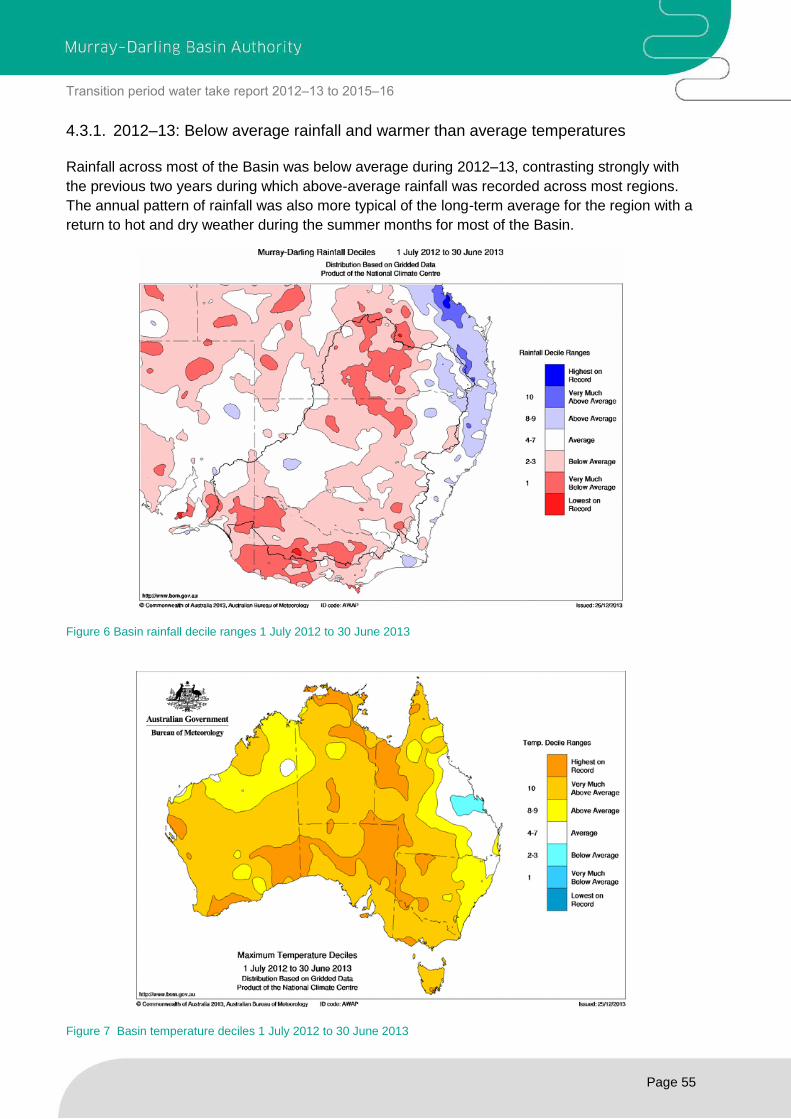
Transition period water take report 2012‒13 to 2015‒16
Page 55
4.3.1. 2012–13: Below average rainfall and warmer than average temperatures
Rainfall across most of the Basin was below average during 2012–13, contrasting strongly with
the previous two years during which above-average rainfall was recorded across most regions.
The annual pattern of rainfall was also more typical of the long-term average for the region with a
return to hot and dry weather during the summer months for most of the Basin.
Figure 6 Basin rainfall decile ranges 1 July 2012 to 30 June 2013
Figure 7 Basin temperature deciles 1 July 2012 to 30 June 2013

Transition period water take report 2012‒13 to 2015‒16
Page 56
There were, however, contrasting extremes during January 2013 when the majority of the Basin
experienced a record heat wave accompanied by very low rainfall during what was Australia’s
hottest month on record at that time. Later in January, torrential rainfall generated by ex-Tropical
Cyclone Oswald broke monthly records across parts of the upper Condamine and Border Rivers
catchments in the north-eastern Basin.
This event generated major flooding along several Barwon–Darling tributaries during the second
half of the 2013 summer. There was remarkably heavy rain at some locations near the New
South Wales–Queensland border; although a relatively steep gradient to lighter rain inland of the
Great Divide meant that downstream flood peaks and volumes were mostly a lot smaller than
those experienced during the Darling system flood events between 2010 and 2012.
Inflows to the River Murray System in 2012–13 broadly followed the long-term seasonal
pattern.18 However, July 2012 inflows were the highest since 1995, and August 2012 inflows
were also above the long-term average. Wet catchments in the upper Murray system tributaries
prior to the 2012 winter resulted in good responses to rain events during winter. Subsequent
drying due to hot weather and low rainfall meant that inflows receded steadily during the spring
and summer period and remained largely below long-term averages. During autumn, inflows
were generally below average, despite around average total rainfall in the south of the Basin.
Total inflows to the River Murray System for 2012–13 (including inflows to the Menindee Lakes
but excluding releases from the Snowy Mountains Scheme) were around 9,600 GL — annual
exceedance probability (AEP) of 52%. That is, 52 years in 100 would see higher volumes and
therefore close to the long-term median. This figure also includes almost 500 GL of inflows
resulting from environmental water releases along tributaries such as the Goulburn and
Murrumbidgee Rivers. This water — used mainly for in-channel benefits and to boost flows to
South Australia — formed part of the largest ever volume of environmental water released into
the River Murray System during a single year.
Total River Murray System active storage levels remained above the long-term average during
2012–13.19 Active storage was particularly high during October 2012 when the volume reached a
peak of 8,750 GL or 102% (note that storage can exceed 100% when Menindee Lakes are
surcharged above nominal full supply level). By the end of May 2013, lower than average rainfall
and inflows and much higher demands than in previous years, reduced active storage in the
River Murray System to around 6,000 GL.
4.3.2. 2013–14: A year of contrast
There was a notable difference in rainfall across the Basin during the 2013–14 water year
between the north and north-east — where rainfall was below or very much below average —
and central and southern areas, where rainfall was generally average to above average.
The first half of the year was characterised by dry conditions throughout large parts of the Basin,
with markedly reduced rainfall in late winter and spring compared to the long-term average. In the
18 The River Murray System runs from Lake Hume to the barrages in South Australia and includes the lower Darling up to and including Menindee Lakes. It includes Dartmouth Reservoir and Lake Victoria. 19 Most storages have a total capacity that is the sum of ‘dead’ storage and ‘active’ storage. Active storage is the volume that can be release via the Dam outlets. Dead storage is usually the volume that is below the release outlets and is effectively inaccessible.

Transition period water take report 2012‒13 to 2015‒16
Page 57
northern Basin, below-average rainfall continued on throughout January, with particularly low
inflows in the headwater catchments of the Darling River. By this time, much of Queensland had
had below average rainfall for over two years, and with the driest December in Queensland since
1932, large portions of the state were declared to be in drought conditions.
Figure 8 Basin rainfall deciles 1 July 2013 to 30 June 2014
Figure 9 Basin temperature deciles 1 July 2013 to 30 June 2014

Transition period water take report 2012‒13 to 2015‒16
Page 58
In the southern Basin, wetter conditions returned in the second half of the year with many areas
experiencing above average rainfall for the period January–June 2014. South Australia and the
lower Murray received particularly high rainfall over this period, with a number of significant
rainfall events associated with trough systems, many of tropical origin, feeding moisture from the
Indian Ocean across south-eastern Australia. One such event in mid-April delivered falls of up to
100 mm of rain right along the length of the River Murray channel. These rain events were the
catalyst for a significant drop in irrigation demand that then remained low until the conclusion of
the irrigation season in mid-May.
The pattern of inflows into the River Murray System in 2013–14 was broadly similar to that of
2012–13. Wet catchments in the upper Murray system tributaries leading into 2013–14 resulted
in high inflows during parts of July and August when good rains fell. A significant portion of these
inflows were captured in headwater storages although releases for airspace management were
also required as Dartmouth and Hume Reservoirs approached full supply. Downstream flows did
not reach minor flood level.
Thereafter, inflows mostly fell away quickly during spring and into summer while the Basin
experienced low rainfall and above-average temperatures. There was very hot weather — similar
to the previous year — during late spring and early summer, with several weeks of extreme
temperatures contributing to high demands and a period that featured some of the highest
system losses ever observed. Despite wetter conditions returning to the southern Basin from
February onwards, there was only a limited flow response and monthly inflow volumes remained
below the long-term average through to the end of May 2014.
Total inflows to the River Murray System for 2013‒14 (including inflows to the Menindee Lakes
but excluding releases from the Snowy Mountains Scheme, Inter-Valley Transfers and
environmental water inflows) were low, around 5,800 GL (AEP of 76%).
Total River Murray System active storage levels remained above the long-term average during
the first half of 2013–14 but then declined and tracked close to average over the last few months.
River Murray System active storage peaked in September 2013 at just below 8,000 GL. Lower
than average rainfall and inflows combined with high demands during spring and most of summer
combined to reduce active storage in the River Murray System to around 5,000 GL by the end of
May 2014. This was around 1,000 GL less than at the same time in 2013, although the volume in
storage was beginning to increase again leading into the 2014 winter as catchments were wetting
up.
4.3.3. 2014–15: Persisting Dry Conditions
Total inflow to the River Murray System for 2014‒15 (including inflows to the Menindee Lakes but
excluding releases from the Snowy Mountains Scheme, Inter-Valley Transfers and environmental
water inflows) was very low, around 4,350 GL (AEP of 90%).
In July, the headwater catchments received average rainfall whilst the rest of the River Murray System received below average rainfall and inflows. In August, a period of warmer than average temperatures and below-average rainfall began and as a result, inflows receded. August inflows, around 700 GL (AEP of 74%), were very much below the long-term average of 1,580 GL.

Transition period water take report 2012‒13 to 2015‒16
Page 59
Figure 10 Basin rainfall deciles 1 July 2014 to 30 June 2015
Figure 11 Basin temperature deciles 1 July 2014 to 30 June 2015

Transition period water take report 2012‒13 to 2015‒16
Page 60
In contrast to the south, the northern Basin, in particular the north west of the Basin, received good rainfall in the middle of August with above average, and in some places very much above average, rainfall for the month.
Dry conditions continued through spring and were coupled with record warm temperatures.
Inflows continued to recede over spring in contrast to the normal pattern of high inflows for this
time of year. Rainfall was below average or very much below average in the northern Basin for
October and November 2014.
Overall, the drought continued across affected areas with rainfall across the Basin lower than
average, reflected by particularly dry conditions in Victoria (lowest rainfall on record) and a
decline of water in storages. Across the northern Basin average to below average rainfall was
recorded, except in the lower Darling, where rainfall was above average.
Drought conditions eased slightly in Queensland alongside recorded rainfall very much below the
average in the Barwon–Culgoa area.

Transition period water take report 2012‒13 to 2015‒16
Page 61
4.3.4. 2015–16: Positive end-of-year outlook
Figure 12 Basin rainfall deciles 1 July 2015 to 30 June 2016
Figure 13 Basin temperature deciles 1 July 2015 to 30 June 2016

Transition period water take report 2012‒13 to 2015‒16
Page 62
By the end of 2015-16, the Murray–Darling Basin had received rainfall that was generally close to
or just below average. Initially, the distribution of rainfall was similar to 2014–15, including well
below average rainfall across the northern Victorian catchments which flow into the River Murray.
The upper Murray region, which provides runoff into the major headwater storages of Dartmouth
and Hume, experienced generally below average rainfall. In the northern Basin, the upper Darling
catchments received generally average to below average rainfall for the year, with many
locations in south-east Queensland still in drought conditions following three consecutive failed
summer wet seasons.
Temperatures were well above average throughout the Basin in 2015–16. Of particular note were
those areas that recorded the highest mean temperatures on record including much of the upper
Murray region, the northern Victoria catchments, along the River Murray, northwest New South
Wales, and southwest Queensland.
The relatively dry and warm conditions observed in south-east Australia during 2015–16 were in
part due to one of the strongest El Niño events on record, comparable with those of 1982–83 and
1997–98. El Niño conditions persisted well into 2016, with sea surface temperatures in the
tropical Pacific only cooling to neutral levels in May. As is often observed in El Niño years, there
were significantly fewer tropical cyclones in 2015–16, with only three named tropical cyclones
developing in the region and only one crossing the coast in Western Australia. This was the least
active tropical cyclone season since reliable records began in the 1950s. This had a significant
impact on rainfall in the northern Basin during the monsoon season (usually November to April).
Consecutive years of below average rainfall and above average temperatures contributed to a
decline in lower level soil moisture throughout large parts of the Murray–Darling Basin, in
particular in northern Victoria and south-east Queensland. This catchment condition meant that
even though parts of the River Murray system received average rainfall in 2015–16, the runoff
was often relatively low as much of the rainfall soaked into the soil or evaporated in a dry
landscape instead of flowing into storages.
There was a distinct change to wetter conditions from May 2016 across the entire Basin. Large
parts of all states experienced above average rainfall, and parts of central New South Wales
experienced the highest-ever recorded winter rainfall.
Total inflow to the River Murray System for 2015‒16 (including inflows to the Menindee Lakes but
excluding releases from the Snowy Mountains Scheme, Inter-Valley Transfers and environmental
water inflows) was very low, around 3,120 GL (AEP of 92%). With minimal inflows to Menindee
Lakes, River Murray System inflows (excluding Snowy Scheme, Darling River, Inter-Valley
Trades and managed environmental inflows) contributed almost all of the inflows to the Murray
during 2015–16 totalling around 3,040 GL (91% AEP).

Transition period water take report 2012‒13 to 2015‒16
Page 63
4.3.5. Water in storages
Storages within the Basin followed the broad climate trends, with higher levels seen in 2012–13
before dry conditions lead to higher demand and low inflows later in the reporting period. Water
storage levels in the Basin finished June 2016 at 8,754 GL, or 39% of total capacity. This is
611 GL less than at 30 June 2015.
Table 11 Percentage volumes in storage as at 30 June in the northern and southern Basin over the period 2012–13 to 2015–16
Northern Basin Southern Basin
June 2012 83% 57%
June 2013 65% 73%
June 2014 30% 65%
June 2015 23% 47%
June 2016 24% 41%
In the southern Basin, River Murray System active storage started 2015–16 with 3,780 GL
spread across Dartmouth Reservoir, Hume Reservoir and Lake Victoria. As at 31 May 2016, the
active storage volume was 2,540 GL (30% capacity), which was about 2,500 GL less than the
long-term average for the end of the water year.
Figure 14 River Murray System active storage volumes for the period June 2000 to June 2016. Graph shows the sum of active storage in Dartmouth and Hume Reservoirs, Lake Victoria and the Menindee Lakes Storage

Transition period water take report 2012‒13 to 2015‒16
Page 64
5. Annual actual take 2012–13 to 2015–16
5.1. Actual take
s.71(1)(c) the quantity of water actually taken from the water resources of the water resource plan area during the water accounting period
This section provides information on the reported quantity of water actually taken throughout the
Basin at the SDL resource unit level. Appendix 1 and Appendix 2 set out the combined total
reported volumes of transitional actual take by all forms of take at SDL resource unit level for
surface water and groundwater respectively. Table 13 to Table 16 list reported actual take by
each form of surface water take at the SDL resource unit scale.
‘Actual take’ refers to water recorded as being removed from rivers, dams, storages, floodplains,
groundwater systems and net take by commercial plantations. Actual take relates only to
consumptive use and does not include water used for environmental purposes. Part 3 of this
report provides information on the use of held environmental water.
The inclusion of forms of take in the SDL framework that have not to date been part of the Cap
arrangements is one of the key water management and accounting challenges facing Basin
states and the MDBA during the transition period. This is because historically, these forms of
take have not been routinely or consistently estimated, modelled or measured.
This report documents progress to date in developing methods for reporting on annual actual
take for all forms of take set out in the Basin Plan. For both surface water and groundwater,
progressively more detailed data on actual take has been reported each year.
Depending on the year in question, up to 30% of the reported annual actual take is based on the
long-term average estimates used in the Basin Plan or alternative estimates provided by Basin
states. The MDBA and Basin states are using the transition period and beyond to improve the
arrangements for monitoring and reporting on these forms of take (i.e. take by interceptions).
For example, commencing in 2013–14, the Australian Capital Territory introduced improvements
in annual reporting by including diversions from Lake Burley Griffin (LBG) and water use from
surviving allocations. This is an important achievement that aligns with the Basin Plan which
requires any water taken from Basin water resources to be accounted for.
Also, commencing from 2014–15, Queensland has been reporting annual actual take volumes for
floodplain harvesting as discrete volumes rather than a volume combined with take by runoff
dams.
New South Wales has reported discrete long-term estimates of actual take under basic rights as
determined under the relevant water sharing plan.
During the transition period, no compliance consequences apply if there is an instance where the
cumulative balance of differences between actual and permitted take is a debit of 20% or more of
the relevant surface water or groundwater TDL. However, these instances may inform the
development of water resource plans including accredited methods for determining permitted
take. They may also form contextual information that the MDBA considers when assessing those
methods.

Transition period water take report 2012‒13 to 2015‒16
Page 65
5.1.1. Variability of actual take between years
As discussed in section 3.1.3 it is anticipated that annual actual take will fluctuate from year to
year based around water availability and water use decisions taken by water entitlement holders.
Those water use decisions are generally influenced by:
the water needs of current crops and/or planned plantings
commodity and water prices and opportunities to trade
overall water availability — water in storage, tributary inflows, in-crop rainfall
annual allocations to entitlements and the timing of such allocations
the conditions on entitlements — such as annual use limits or commence-to-pump
triggers
access to carryover
the ability to purchase additional allocation.
The same area of a particular crop (annual or permanent) can have different water needs over a
season or between seasons depending on climate conditions. This will influence water take
decisions over the course of a water year. For example hot, dry and windy conditions will mean
higher volumes of actual water take to meet crop needs, while good in-crop rainfall at the right
times can significantly reduce actual water take.
While permitted take methodologies attempt to explain as much of the inter-annual variation as
possible (e.g. through relating use to climatic conditions and water availability), it is not always
possible to fully explain such variations and thus ‘unders’ and ‘overs’ are expected and a
cumulative balance is used.
Further information about the differences between volumes of water authorised for use and
annual permitted take is provided at section 7.1.
5.1.2. Annual actual take and the National Water Accounts (Bureau of Meteorology)
Water take in the Murray–Darling Basin is also reported by the Bureau of Meteorology as part of
their work in preparing National Water Accounts (refer http://www.bom.gov.au/water/nwa/2016/).
The reported water take in the Basin differs between this report and that published by the Bureau
due to different approaches being adopted in terms of how the data is collated. The data
presented in this report is consistent with the definitions and reporting units established by the
Basin Plan; in particular the way the SDLs have been specified and the way water recovery
amounts have been quantified. These accounts provide the basis for the Register of Take
required under the Basin Plan and the compliance arrangements that will apply from 2019.
The volumes reported in the National Water Accounts (NWA) differ from the volumes reported
here for several reasons including:
• NWA does not include take by interceptions;
• NWA presents data at a gross level for each component of reported take, where the
MDBA presents this as a net take. For some SDL resource units, such as the ACT, actual
take is net of any diversions returned to the river;
• NWA includes some minor adjustments where other data is reported from another agency
for the purposes of the NWA. For example different volumes for basic rights are used;

Transition period water take report 2012‒13 to 2015‒16
Page 66
• NWA determines the take in Victoria for the Goulburn at the farm gate, rather than from
the river. MDBA accounts for Goulburn diversions to the Waranga Western Chanel at the
river, before water is provided to irrigation districts in the Campaspe and Loddon. The
movement of water from the Goulburn to these irrigation areas is for Goulburn
entitlements.
5.2. Surface water annual actual take
Appendix 1 (column headed ‘s6.10, s10.10, s10.15: Annual data: Actual take GL/y’) sets out total
reported combined annual actual take by all forms of take for each SDL resource unit and Table
13 to Table 16 list reported annual actual take for each form of surface water take for each SDL
resource unit.
The actual take reported under SDL accounting is higher than that published in the Cap Register
(Table 6) as the SDL accounting includes water course diversions for areas previously not
included, interception activities, basic rights and floodplain harvesting in NSW. On average over
the four years of this reporting period, actual take is 2,840 GL higher as a result of this inclusion.
The reporting period saw surface water availability decrease as each year was generally drier
than the preceding year. As a consequence, available water in storage declined as did inflows.
The use of trade increased over the reporting period as entitlement holders sought to maximise
the volume of water they had available for use.
Section 6 provides further detail on general water availability, allocations and trade over the
reporting period. At a Basin scale, surface water annual actual take during the trial was less than
annual permitted take in each year of the reporting period.
Figure 15 Basin scale surface water transitional diversion limit, annual permitted take, annual actual take, annual credits and adjusted cumulative balance 2012–13 to 2015–16
-
2,000
4,000
6,000
8,000
10,000
12,000
14,000
16,000
18,000
2012-13 2013-14 2014-15 2015-16
Vo
lum
e (G
L)
Water Year
Annual Balance SDL BDL
TDL Permitted Take Actual Take
TDL Cumulative Credits

Transition period water take report 2012‒13 to 2015‒16
Page 67
Table 12 sets out the annual volumes for permitted take, actual take, annual credits/debits and
the transitional cumulative balances for each Basin State over the reporting period (noting that
the credits/debits and transitional cumulative balance are for the purposes of the trial only and
that the formal balance commences at 0 GL once the SDLs come into effect in 2019).
Table 13 to Table 16 set out the reported volumes of actual take (measured and estimated) for
each form of surface water take at the SDL resource unit scale. Where actual take reported in
these tables has been determined through the use of a long-term average estimate used in the
Basin Plan, this is indicated through the use of shading. The relative proportions of actual take
reported by Basin states using measured volumes (i.e. metered) or alternative estimates to those
used in the Basin Plan is also shown in these tables.

Transition period water take report 2012‒13 to 2015‒16
Page 68
Table 12 Basin and state scale surface water permitted take, actual take, annual credits and transitional adjusted cumulative balance (all in GL) 2012–13 to 2015–16 2012–13 2013–14 2014–15 2015–16
Permitted take
Actual take
Annual credit
Cumul. balance
Permitted take
Actual take
Annual credit
Cumul. balance
Permitted take
Actual take
Annual credit
Cumul. balance
Permitted take
Actual take
Annual credit
Cumul. balance
Qld 2,322.5 1,931.2 391.3 391.3 1,304.7 1,282.2 22.5 413.8 1,078.9 979.8 99.2 513.0 956.0 871.4 84.6 597.6
NSW 9,318.6 8,148.8 1,169.8 1,175.8 7,566.1 6,891.6 674.5 1,882.6 5,497.2 5,560.7 -63.5 1,814.0 4,990.2 4,649.4 340.8 2,156.9
ACT 57.3 30.7 26.6 26.6 57.2 30.8 26.5 53.1 55.4 29.0 26.4 79.5 56.7 32.1 24.6 104.1
Vic 3,700.5 3,430.6 269.9 275.8 3,727.0 2,978.0 749.0 1,028.9 3,503.3 3,039.7 463.6 1,494.4 2,676.7 2,942.0 -265.4 1,251.4
SA 612.3 551.6 60.7 48.6 512.6 473.6 39.0 76.5 550.5 526.7 23.8 99.2 680.2 615.0 65.2 160.5
Basin 16,011.1
14,092.8 1,918.4 1,918.1 13,167.7 11,656.1 1,511.6 3,455.0 10,685.3 10,135.8 549.5 4,000.1 9,359.8 9,109.9 249.9 4,270.5

Transition period water take report 2012‒13 to 2015‒16
Page 69
Table 13 Surface water annual actual take (GL) by different forms of take and the level of certainty for each SDL resource unit, water year 2012–13*
Take from watercourses and regulated
rivers
Take by floodplain harvesting
Take under basic rights
Net take by commercial plantation
Take by runoff dams
Total % take
annually reported**
Queensland
Paroo 0.03 0.00 - 0.00 9.70 9.73 0%
Warrego 2.67 0.00 - 0.00 83.00 85.67 3%
Nebine 0.00 0.00 - 0.00 25.00 25.00 0%
Condamine–Balonne 729.36 275.42 - 1.00 264.00 1,269.78 79%
Moonie 30.62 3.00 - 0.00 51.00 84.62 40%
Queensland Border Rivers 218.88 159.49 - 1.00 77.00 456.37 83%
Queensland total 981.56 437.91 0.00 2.00 509.70 1,931.17 74%
New South Wales
NSW Border Rivers 220.60 2.95 9.89 0.00 95.00 328.44 67%
Intersecting Streams 3.31 - 2.46 - 111.00 116.77 3%
Gwydir 424.63 17.80 8.01 1.00 124.00 575.44 74%
Namoi 399.81 13.99 4.72 5.00 160.00 583.52 69%
Macquarie–Castlereagh 456.43 0.00 7.11 44.00 266.00 773.54 59%
Lachlan 343.23 0.00 5.61 29.00 287.00 664.84 52%
Murrumbidgee 2,282.60 - 6.08 116.00 385.00 2,789.68 82%
Barwon–Darling Watercourse 189.31 11.49 0.82 - - 201.62 94%
Lower Darling 94.63 - 2.49 0.00 5.50 102.62 92%
NSW Murray 1,905.27 - 3.07 24.00 80.00 2,012.34 95%
New South Wales total 6,319.82 46.23 50.26 219.00 1,513.50 8,148.81 78%
Australian Capital Territory
Australian Capital Territory (Surface
water) 18.66 - - 11.00 1.00 30.66 61%
Victoria
Victorian Murray 1,647.42 - - 22.00 23.00 1,692.42 97%
Kiewa 6.72 - - 7.00 6.60 20.32 33%
Ovens 20.12 - - 32.00 26.00 78.12 26%
Broken 12.21 - - 13.00 30.00 55.21 22%
Goulburn 1,153.52 - - 23.00 86.00 1,262.52 91%
Campaspe 42.56 - - 1.00 39.00 82.56 52%
Loddon 69.74 - - 5.00 85.00 159.74 44%
Wimmera–Mallee (surface water) 17.66 - - 1.00 61.00 79.66 22%
Victoria total 2,969.95 0.00 0.00 104.00 356.60 3,430.55 87%
South Australia
South Australian Murray 522.09 - - - - 522.09 100%
South Australian Non-Prescribed Areas 0.00 - - - 3.50 3.50 0%
Marne Saunders 0.04 - - 0.00 2.12 2.16 100%
Eastern Mount Lofty Ranges 10.49 - - 3.20 10.18 23.87 87%
South Australia total 532.62 0.00 0.00 3.20 15.80 551.62 97%
Basin total 10,822.61 484.14 50.26 339.20 2,396.60 14,092.81 81%
Proportion of combined total take 76.78% 3.43% 0.36% 2.41% 17.00% 100%
% Take annually reported 100.00% 90.45% 0.00% 0.00% 0.51%
% Based on long-term average 0.00% 9.55% 100.00% 100.00% 99.45%
*Note: Shaded cells represent long-term average estimates
** Proportion of data that is reported using annual volumes and not long term average estimates

Transition period water take report 2012‒13 to 2015‒16
Page 70
Table 14 Surface water annual actual take (GL) by different forms of take and the level of certainty for each SDL resource unit, water year 2013-14*
Take from
watercourses
and
regulated
rivers
Take by
floodplain
harvesting
Take under
basic rights
Net take by
commercial
plantation
Take by
runoff
dams
Total
% Take
annually
reported**
Queensland
Paroo 0.04 0.00 - 0.00 9.70 9.74 0%
Warrego 0.80 0.00 - 0.00 83.00 83.80 1%
Nebine 0.00 0.00 - 0.00 25.00 25.00 0%
Condamine–Balonne 413.37 197.69 - 1.00 264.00 876.06 70%
Moonie 12.86 0.00 - 0.00 51.00 63.86 20%
Queensland Border Rivers 135.87 9.84 - 1.00 77.00 223.71 65%
Queensland total 562.94 207.53 0.00 2.00 509.70 1,282.17 60%
New South Wales
NSW Border Rivers 192.40 2.95 9.89 0.00 95.00 300.24 64%
Intersecting Streams 3.31 - 2.46 - 111.00 116.77 3%
Gwydir 420.66 17.80 8.01 1.00 124.00 571.47 74%
Namoi 405.49 13.99 4.72 5.00 160.00 589.20 69%
Macquarie–Castlereagh 292.13 0.00 7.11 44.00 266.00 609.24 48%
Lachlan 240.73 0.00 5.61 29.00 287.00 562.34 43%
Murrumbidgee 1,833.59 - 6.08 116.00 385.00 2,340.67 78%
Barwon–Darling Watercourse 78.45 11.49 0.82 - - 90.76 86%
Lower Darling 101.56 - 2.49 0.00 5.50 109.55 93%
NSW Murray 1,494.29 - 3.07 24.00 80.00 1,601.36 93%
New South Wales total 5,062.61 46.23 50.26 219.00 1,513.50 6,891.60 73%
Australian Capital Territory
Australian Capital Territory (Surface water) 18.76 - - 11.00 1.00 30.76 61%
Victoria
Victorian Murray 1,290.48 - - 22.00 23.00 1,335.48 97%
Kiewa 2.62 - - 7.00 6.60 16.22 16%
Ovens 17.60 - - 32.00 26.00 75.60 23%
Broken 11.87 - - 13.00 30.00 54.87 22%
Goulburn 1,118.28 - - 23.00 86.00 1,227.28 91%
Campaspe 25.87 - - 1.00 39.00 65.87 39%
Loddon 35.13 - - 5.00 85.00 125.13 28%
Wimmera–Mallee (surface water) 15.52 - - 1.00 61.00 77.52 20%
Victoria total 2,517.37 0.00 0.00 104.00 356.60 2,977.97 85%
South Australia
South Australian Murray 442.85 - - - - 442.85 100%
South Australian Non-Prescribed Areas 0.00 - - - 3.50 3.50 0%
Marne Saunders 0.06 - - 0.00 2.13 2.19 100%
Eastern Mount Lofty Ranges 11.67 - - 3.20 10.20 25.07 87%
South Australia total 454.58 0.00 0.00 3.20 15.83 473.61 96%
Basin total 8,616.26 253.76 50.26 339.20 2,396.63 11,656.11 77%
Proportion of combined total take 73.90% 2.18% 0.43% 2.91% 20.56% 100%
% Take annually reported 100.00% 81.78% 0.00% 0.00% 0.51% % Based on long-term average 0.00% 18.22% 100.00% 100.00% 99.44%
*Note: Shaded cells represent long-term average estimates
** Proportion of data that is reported using annual volumes and not long term average estimates

Transition period water take report 2012‒13 to 2015‒16
Page 71
Table 15 Surface water annual actual take (GL) by different forms of take and the level of certainty for each SDL resource unit, water year 2014-15*
Take from watercourses
and regulated
rivers
Take by floodplain harvesting
Take under basic rights
Net take by commercial plantation
Take by runoff dams
Total % Take
annually reported**
Queensland
Paroo 0.01 0.00 - 0.00 9.70 9.71 0%
Warrego 7.27 0.00 - 0.00 83.00 90.27 8%
Nebine 0.08 0.00 - 0.00 25.00 25.08 0%
Condamine–Balonne 343.94 10.15 - 1.00 264.00 619.09 57%
Moonie 3.72 0.00 - 0.00 51.00 54.72 7%
Queensland Border Rivers 102.90 0.00 - 1.00 77.00 180.90 57%
Queensland total 457.92 10.15 0.00 2.00 509.70 979.77 48%
New South Wales
NSW Border Rivers 62.66 2.95 9.89 0.00 95.00 170.50 37%
Intersecting Streams 3.31 - 2.46 - 111.00 116.77 3%
Gwydir 140.56 17.80 8.01 1.00 124.00 291.37 48%
Namoi 188.34 13.99 4.72 5.00 160.00 372.05 51%
Macquarie–Castlereagh 114.49 0.00 7.11 44.00 266.00 431.60 27%
Lachlan 187.79 0.00 5.61 29.00 287.00 509.40 37%
Murrumbidgee 1,688.61 - 6.08 116.00 385.00 2,195.69 77%
Barwon–Darling Watercourse 31.68 11.49 0.82 - - 43.99 72%
Lower Darling 41.90 - 2.49 0.00 5.50 49.89 84%
NSW Murray 1,272.42 - 3.07 24.00 80.00 1,379.49 92%
New South Wales total 3,731.76 46.23 50.26 219.00 1,513.50 5,560.75 67%
Australian Capital Territory
Australian Capital Territory (Surface water) 16.99 - - 11.00 1.00 28.99 59%
Victoria
Victorian Murray 1,375.66 - - 22.00 23.00 1,420.66 97%
Kiewa 5.81 - - 7.00 6.60 19.41 30%
Ovens 18.34 - - 32.00 26.00 76.34 24%
Broken 14.98 - - 13.00 30.00 57.98 26%
Goulburn 1,080.81 - - 23.00 86.00 1,189.81 91%
Campaspe 35.05 - - 1.00 39.00 75.05 47%
Loddon 29.09 - - 5.00 85.00 119.09 24%
Wimmera–Mallee (surface water) 19.34 - - 1.00 61.00 81.34 24%
Victoria total 2,579.08 0.00 0.00 104.00 356.60 3,039.68 85%
South Australia
South Australian Murray 500.87 - - - - 500.87 100%
South Australian Non-Prescribed Areas 0.00 - - - 3.50 3.50 0%
Marne Saunders 0.10 - - 0.00 2.25 2.35 100%
Eastern Mount Lofty Ranges 7.84 - - 3.20 8.89 19.93 84%
South Australia total 508.81 0.00 0.00 3.20 14.64 526.65 97%
Basin total 7,294.56 56.38 50.26 339.20 2,395.44 10,135.84 73%
Proportion of total combined take 71.95% 0.56% 0.50% 3.35% 23.63% 100% % Take annually reported 100.00% 18.00% 0.00% 0.00% 0.47% % Based on long-term average 0.00% 82.00% 100.00% 100.00% 99.49%
*Note: Shaded cells represent long-term average estimates
** Proportion of data that is reported using annual volumes and not long term average estimates

Transition period water take report 2012‒13 to 2015‒16
Page 72
Table 16 Surface water annual actual take (GL) by different forms of take and the level of certainty for each SDL resource unit, water year 2015-16*
Take from watercourses
and regulated
rivers
Take by floodplai
n harvestin
g
Take under basic rights
Net take by commercial plantation
Take by runoff dams
Total % Take
annually reported**
Queensland
Paroo 0.00 0.00 - 0.00 9.70 9.70 0%
Warrego 2.92 0.00 - 0.00 83.00 85.92 3%
Nebine 1.40 0.00 - 0.00 25.00 26.40 5%
Condamine–Balonne 207.63 57.55 - 1.00 264.00 530.18 50%
Moonie 0.78 0.00 - 0.00 51.00 51.78 2%
Queensland Border Rivers 87.45 2.00 - 1.00 77.00 167.45 53%
Queensland total 300.18 59.55 0.00 2.00 509.70 871.43 41%
New South Wales
NSW Border Rivers 114.58 2.95 9.89 0.00 95.00 222.42 52%
Intersecting Streams 3.31 - 2.46 - 111.00 116.77 3%
Gwydir 120.62 17.80 8.01 1.00 124.00 271.43 44%
Namoi 164.31 13.99 4.72 5.00 160.00 348.02 47%
Macquarie–Castlereagh 131.46 0.00 7.11 44.00 266.00 448.57 29%
Lachlan 166.53 0.00 5.61 29.00 287.00 488.14 34%
Murrumbidgee 1,321.02 - 6.08 116.00 385.00 1,828.10 72%
Barwon–Darling Watercourse 75.66 11.49 0.82 - - 87.97 86%
Lower Darling 8.49 - 2.49 0.00 5.50 16.48 52%
NSW Murray 714.39 - 3.07 24.00 80.00 821.46 87%
New South Wales total 2,820.37 46.23 50.26 219.00 1,513.50 4,649.36 61%
Australian Capital Territory
Australian Capital Territory (Surface water) 20.10 - - 11.00 1.00 32.10 63%
Victoria
Victorian Murray 1,318.94 - - 22.00 23.00 1,363.94 97%
Kiewa 6.15 - - 7.00 6.60 19.75 31%
Ovens 16.66 - - 32.00 26.00 74.66 22%
Broken 10.76 - - 13.00 30.00 53.76 20%
Goulburn 1,045.46 - - 23.00 86.00 1,154.46 91%
Campaspe 39.28 - - 1.00 39.00 79.28 50%
Loddon 24.34 - - 5.00 85.00 114.34 21%
Wimmera–Mallee (surface water) 19.82 - - 1.00 61.00 81.82 24%
Victoria total 2,481.41 0.00 0.00 104.00 356.60 2,942.01 84%
South Australia
South Australian Murray 597.47 - - - - 597.47 100%
South Australian Non-Prescribed Areas 0.00 - - - 3.50 3.50 0%
Marne Saunders 0.00 - - 0.00 2.02 2.02 100%
Eastern Mount Lofty Ranges 1.60 - - 3.20 7.21 12.01 73%
South Australia total 599.07 0.00 0.00 3.20 12.73 615.00 97%
Basin total 6,221.13 105.78 50.26 339.20 2,393.53 9,109.90 70%
Proportion of combined total take 68.27% 1.16% 0.55% 3.72% 26.27% 100% % Take annually reported 100.00% 56.30% 0.00% 0.00% 0.39% % Based on long-term average 0.00% 43.70% 100.00% 100.00% 99.57%
*Note: Shaded cells represent long-term average estimates
** Proportion of data that is reported using annual volumes and not long term average estimates

Transition period water take report 2012‒13 to 2015‒16
Page 73
5.2.1. Proportions of surface water annual actual take that are metered
For the volumes of annual actual take that do not use long-term estimates not all volumes
reported in an SDL resource unit are measured (i.e. metered). In the absence of metering other
forms of estimation are used including use of long term average estimates and hydrological
models. At the Basin scale over the four year reporting period, between 64% and 73% of annual
actual consumptive take from all forms of surface water take was metered. For watercourses and
regulated rivers, between 89% and 92% of Basin scale annual actual take was metered.
Reducing the proportion of unmetered take is an area where further improvements in these
accounts can be made, recognising the need for cost effectiveness considerations in relation to
certain forms of take (e.g. runoff dams). This report makes a number of recommendations in
relation to this issue (refer section 5.4). The reported data does not indicate the type or standard
of metering. Examples of different types of metering may include measuring depth through a
regulator, use of a magnetic flow meter, measurement through a flume gauge, measurement
through a Dethridge wheel, or measurement based on pump hours.
The levels of metering varies between the northern and southern Basin. For all forms surface
water take between 25% and 51% is metered in the northern Basin and between 77% and 84%
in the southern Basin. Despite this difference in proportion of metered take, the volume of
unmetered water take is similar in the northern and southern Basin due to the larger volumes
used in the southern Basin. That is, the average unmetered take over the four years in the
northern Basin was 1,963 GL/y while in the southern Basin the average was 1,569 GL/y.
In generating these statistics, the MDBA has assumed that:
In Victoria, unmetered take from watercourses in 2014–15 and 2015–16 used the same
categories of reliability as reported by Victoria in the previous two years where data was
provided.
In the Australian Capital Territory and the South Australian Eastern Mount Lofty Ranges
and Marne–Saunders SDL resource units all watercourse diversions are metered.
Water taken for environmental benefits is not included in these estimates.
Table 17 Basin and state scale percentage of surface water annual actual take that is metered
State / Basin Metered actual take from watercourses
(%) Metered actual take for all forms of take
(%)
2012-13 2013-14 2014-15 2015-16 2012-13 2013-14 2014-15 2015-16
Queensland 58% 31% 61% 81% 43% 18% 29% 33%
New South Wales 94% 92% 89% 86% 74% 69% 62% 54%
Australian Capital Territory
100% 100% 100% 100% 61% 61% 59% 63%
Victoria 99% 98% 98% 98% 86% 83% 83% 83%
South Australia 98% 98% 98% 98% 95% 94% 95% 96%
Northern Basin 72% 63% 56% 65% 51% 40% 25% 29%
Southern Basin 98% 98% 98% 97% 84% 81% 80% 77%
Basin total 91% 89% 91% 92% 73% 68% 67% 64%

Transition period water take report 2012‒13 to 2015‒16
Page 74
5.2.2. Actual take from watercourses
Basin scale data on actual take from watercourses has been reported since the 1983–84 water
year. Cap reporting on watercourse diversions from the designated Cap valleys commenced on
an interim basis in 1994–95 and under the ongoing Cap arrangements from 1997–98. Reporting
on annual actual take from watercourses and regulated rivers under the 29 surface water SDL
resource units covered by the SDL water accounting and compliance framework commenced
with the 2012–13 water year.
The watercourse and regulated rivers volumes cited in Table 13 to Table 16 effectively represent
Cap watercourse diversion plus annual actual take from the surface water SDL resource units not
covered by Cap in the Eastern Mount Lofty Ranges water resource plan area of South Australia.
As a result of this area now being included, the difference between Cap and SDL watercourse
diversions over the period is an increase of an average of 8 GL per year.
Basin scale actual take in the form of watercourse diversions was 10,823 GL in 2012–13, which
places it in about the top third of the annual volumes of take since 1983–84. Even when
accounting for the difference between Cap and SDL watercourse diversions, the 2012–13 level of
take was the highest since 2001–02 (before the millennium drought). This level of annual actual
take followed two consecutive years of above average inflows in 2010–11 and 2011–12.
Of the total 2012–13 watercourses actual take volume in Table 13, New South Wales accounted
for 58% at 6,320 GL, Victoria accounted for 27% at 2,970 GL, Queensland accounted for 9% at
982 GL, South Australia accounted for 5% at 523 GL, and the Australian Capital territory
accounted for 0.2% at 19 GL. As surface water availability fell over the four-year reporting period
in response to reduced inflows, there was a significant corresponding reduction in annual actual
take from watercourses.
Figure 16 shows annual actual take in the form of watercourse diversions over the period of
record (1983–84 to 2015–16). Figure 17 shows the same data for Queensland, South Australia
and the Australian Capital Territory to more clearly illustrate the variation in annual actual take in
those states over the reporting period.

Transition period water take report 2012‒13 to 2015‒16
Page 75
Figure 16 Basin and state scale annual actual take (GL) from watercourses 1983–84 to 2015–16
Figure 17 Annual actual take (GL) from watercourses for Queensland, Australian Capital Territory and South Australia only 1983–84 to 2015–16
0
2,000
4,000
6,000
8,000
10,000
12,000
14,0001
98
4
198
5
198
6
198
7
198
8
198
9
199
0
199
1
199
2
199
3
199
4
199
5
199
6
199
7
199
8
199
9
200
0
200
1
200
2
200
3
200
4
200
5
200
6
200
7
200
8
200
9
201
0
201
1
201
2
201
3
201
4
201
5
201
6
201
7
201
8
201
9
An
nu
al d
iver
sio
n (
GL)
Year ending 30 June
Queensland New South Wales Australian Capital Territory
Victoria South Australia Total Basin
0
200
400
600
800
1,000
1,200
1,400
1,600
1,800
2,000
19
84
19
85
19
86
19
87
19
88
19
89
19
90
19
91
19
92
19
93
19
94
19
95
19
96
19
97
19
98
19
99
20
00
20
01
20
02
20
03
20
04
20
05
20
06
20
07
20
08
20
09
20
10
20
11
20
12
20
13
20
14
20
15
20
16
20
17
20
18
20
19
An
nu
al D
iver
sio
n (
GL)
Year ending 30 June
Australian Capital Territory Queensland South Australia

Transition period water take report 2012‒13 to 2015‒16
Page 76
5.2.3. Take by floodplain harvesting and runoff dams, net take by commercial plantations
and take under basic rights
As discussed in earlier sections, the Basin Plan aims to manage forms of water take not fully
accounted for to date under Cap water accounting and compliance arrangements. For surface
water these include take by floodplain harvesting, take by runoff dams, net take by commercial
plantations and take under basic rights.
For the purpose of the trial of the SDL water accounting and compliance framework, with limited
exceptions, both annual actual take (Table 13 to Table 16) and annual permitted take for these
forms of take at SDL resource unit level are being determined as the long-term estimates as
listed in Schedule 3 of the Basin Plan or Water resource assessments for without-development
and baseline conditions, Murray–Darling Basin Authority technical report 2010/20 Version 2
(MDBA 2011) or alternative volumes as reported by the relevant Basin states.
Approaches adopted for the purpose of this report are:
Queensland:
o floodplain harvesting (known as ‘take by overland flow’) was measured and
reported annually and these have been used in the accounts in preference to the
estimates in Schedule 2 of the Basin Plan.
New South Wales:
o floodplain harvesting estimates used were those incorporated in the estimates in
Schedule 2 of the Basin Plan. There is work underway to better quantify these
estimates. Once this work has been completed and reviewed by the MDBA, it will
be incorporated in future reports.
o take under basic rights is reported using the estimated volumes as determined
under the relevant water sharing plan as at 2016.
South Australia:
o runoff dam actual take was reported as a combination of metered and estimated
data for the Marne Saunders and Eastern Mount Lofty SDL resource units. These
have been used in the accounts in preference to the estimates in Schedule 2 of
the Basin Plan.
Australian Capital Territory
o Commercial plantation estimate used was that incorporated in the estimates in
Schedule 2 of the Basin Plan. There is work underway to better quantify this
estimate as part of the WRP being prepared by the ACT.
The use of the same long-term average (or where available annual) estimates to determine
annual permitted take and annual actual take for these forms of take means that these forms of
take do not impact on the annual calculation of credits and/or debits, or on the consequent
cumulative balance and compliance assessment. For example, if the floodplain harvesting
component of annual permitted take and annual actual take in an SDL resource unit is always
5 GL the annual balance arising from this component will always be 0 GL.
The current use of long-term average estimates for up to 30% of actual take provides a
benchmark from which improvements can be made. Improvements in this area will enhance
integrity of the water accounting and compliance framework.

Transition period water take report 2012‒13 to 2015‒16
Page 77
New methods that either give some expression to annual weather conditions and water
availability in the relevant SDL resource unit and/or apply other lines of evidence to provide some
ability to identify any growth in these forms of take should be investigated over the remainder of
the transition period so that they can be applied from 1 July 2019 wherever possible.

Transition period water take report 2012‒13 to 2015‒16
Page 78
5.3. Groundwater annual actual take
Groundwater take occurs across the entire Murray–Darling Basin with annual average extraction
estimated to be 1,415 GL over the 13 years to 2016. Groundwater represents 10 to 20 per cent
of the total water take in the Basin over the reporting period with the remainder attributed to
surface water take.
However, the relative use of groundwater use varies greatly across the Basin. During drier
periods, the relative importance of groundwater becomes greater and is especially important for
regional economies during these times. In particular, communities in north-western New South
Wales and south-western Queensland have a high reliance on groundwater.
Furthermore, most groundwater annual actual take is centred on a small number of large alluvial
groundwater systems in New South Wales, Queensland and Victoria and most of this
groundwater use is for irrigation. Ten out of the 81 groundwater SDL resource units represent
two thirds or 64% of all groundwater take across the Basin over the four years of the reporting
period. There are also several cities and towns across the Basin that rely on groundwater for
most of their water supply.
Figure 18 shows that at a Basin scale, there was a gradual increase in groundwater annual
actual take over the first three years of the reporting period from 1,231 GL in 2012–13 to
1,556 GL in 2014–15. This trend steadied with annual actual take reducing slightly from 1,556 GL
to 1,535 GL between 2014–15 and 2015–16.
The bulk of the increase over the reporting period was driven by increased take in New South
Wales. In each year across the four-year period, New South Wales was the major groundwater
0
500
1,000
1,500
2,000
2,500
3,000
3,500
4,000
2012-13 2013-14 2014-15 2015-16
Vo
lum
e (G
L)
Water Year
SDL BDL TDL Actual take

Transition period water take report 2012‒13 to 2015‒16
Page 79
user accounting for 70% of the total actual take of groundwater. This was followed by
Queensland and Victoria, each using 13% of groundwater annual actual take.
South Australia accounts for about 4% of Basin scale groundwater annual actual take. Annual
actual take in South Australia and the Australian Capital Territory was stable throughout the
reporting period.
Figure 18 Basin scale groundwater BDL, SDL, TDL and actual take 2012–13 to 2015–16
5.3.1. Groundwater take under basic rights
Groundwater take under basic rights covers water used for stock and domestic purposes in all
Basin states as well as groundwater used for native title rights in some Basin states. While the
licencing requirements vary across Basin states, a licence or approval is generally required to
construct a bore for stock and domestic purposes, but not always to extract water from it.
Basin states use estimation methods to determine reportable groundwater take under basic
rights as volumes extracted are not limited or reportable. In 2015–16, Basin states estimated the
total take of groundwater extracted under basic rights to be 238 GL.
In some parts of the Basin, groundwater is the only reliable source of water for stock and
domestic purposes. In 32% of groundwater systems (26 out of 81 SDL resource units) over the
reporting period, take under basic rights was the only or main form of take. These SDL resource
units accounted for approximately 11% (60 GL/y) of all groundwater take under basic rights
across the Basin. In contrast, in 60% of groundwater systems or 49 SDL resource units, take
under basic rights represents less than 10% of total actual take in that SDL resource unit.
0
500
1,000
1,500
2,000
2,500
3,000
3,500
4,000
2012-13 2013-14 2014-15 2015-16
Vo
lum
e (G
L)
Water Year
SDL BDL TDL Actual take

Transition period water take report 2012‒13 to 2015‒16
Page 80
Data reporting on groundwater take under basic rights has improved over the four-year reporting
period as states have improved their estimation methods. Due to this improvement, only the
estimated figures for 2015–16 have been reported in the detailed groundwater data set at
Appendix 2. It is unlikely that groundwater taken under basic rights will fluctuate significantly in
quantity between water years as there is unlikely to be significant growth in this form of
groundwater use.
5.3.2. Proportions of groundwater annual actual take that are metered
The proportion of groundwater take that is metered varies between the different states across the
Basin. In 2015–16, Basin states reported that 78% of the total groundwater take was metered.
However, 100% of the take under basic rights was unmetered.
In 2015–16, in Victoria 91% of the total groundwater take was metered. This was followed by
New South Wales and South Australia, with total groundwater take of 83% and 88% metered in
each state respectively. While in Queensland, only 28% of the total groundwater take was
metered. The highest percentage of metered groundwater take was in the Australian Capital
Territory where 100% of groundwater take was metered.
5.3.3. Managed aquifer recharge
Managed aquifer recharge (MAR) is the intentional recharge of an aquifer, either by injection or
infiltration of treated or untreated surface water into a groundwater system for subsequent
recovery by planned extraction or for environmental benefit. One of the inherent benefits of MAR
is the ability to use the groundwater system as a storage system to ‘bank’ injected waters for use
at another time (e.g. recharge water during wet years for extraction during drier years).
A number of MAR schemes are proposed within the Basin. However, MAR is currently practiced
in only two groundwater SDL resource units, one in South Australia and the other in the
Australian Capital Territory.
In South Australia, water from the River Murray SDL resource unit and from the tributaries of the
River Murray in the Eastern Mount Lofty Ranges surface water SDL resource unit is recharged
into the Angas Bremer (Murray Group Limestone) SDL resource unit. Over the reporting period
4.65 GL was added to this aquifer via MAR as storage with 1.16 GL extracted over the same
period.
MAR was first used in the Australian Capital Territory in 2014–15 to test and evaluate the
suitability of an aquifer within the Australian Capital Territory (groundwater) SDL resource unit.
This forms part of a pilot program by the Australian Capital Territory Government to use MAR to
store stormwater harvested and filtered at a neighbourhood-scale for future irrigation of urban
green spaces. Over the reporting period, 0.41 GL was added to this groundwater system as
storage and 0.35 GL was extracted for use over the same period.
The Basin Plan requires that MAR is accounted for in determining annual permitted take.20 MAR
volumes are being accounted for in a way that avoids double-counting the extraction of water
against an SDL in both the source and receiving SDL resource units. The use of water extracted
from surface water (source) for the purpose of MAR water storage is accounted as actual take for
20 Basin Plan 2012, s10.12(1)(i)

Transition period water take report 2012‒13 to 2015‒16
Page 81
the relevant surface water SDL resource unit. The later extraction of the MAR from the
groundwater system (receiver) is then separately accounted for in a way that it does not impact
on annual allocations or the determination of annual permitted take or annual actual take from
the relevant groundwater SDL resource unit. MAR extraction is not included in the permitted take,
actual take and allocation while reporting these components of take from groundwater.
Over the reporting period 5.06 GL were added to aquifers across the basin via MAR with 1.51 GL
extracted over the same period.
Table 18 Managed aquifer re-charge volumes 2012–13 to 2015–16
2012–13 2013–14 2014–15 2015–16
SDL Resource unit Stored Extracted Stored Extracted Stored Extracted Stored Extracted
Australian Capital Territory Australian Capital Territory (groundwater) (GS52)
n/a n/a n/a n/a 0.28 0.31 0.13 0.05
South Australia
Angas Bremer (Murray Group Limestone) (GS1)
1.51 n/da 1.21 n/da 0.90 0.64 1.02 0.52
Basin total 1.51 0.00 1.21 0.00 1.19 0.94 1.15 0.57
a No data was available regarding extraction volumes in South Australia for 2012–13 or 2013–14
5.4. Recommendations
Recommendation 1:
Improving the methods for estimating volumes of annual actual and annual permitted take.
The current use of long-term average estimates for up to 30% of take (i.e. take by floodplain
harvesting, runoff dams, commercial plantations (net take) and under basic rights) provides a
benchmark from which improvements can be made. Improvements in this area will enhance
integrity of the water accounting and compliance framework.
New methods that give some expression to annual weather conditions and water availability in
the relevant SDL resource unit should be investigated over the remainder of the transition period
so that they can be applied from 1 July 2019 wherever possible. Similarly, other lines of evidence
that provide the ability to identify any growth in these forms of take should also be developed.
Recommendation 2:
Increasing the proportion of actual take that is measured across the Basin to an agreed standard.
The integrity of the SDL water accounting and compliance framework is enhanced wherever
actual take is measured rather than modelled or estimated. Identifying and taking advantage of
cost effective ways of increasing the proportion of measured take, particularly where that
measurement is consistent with an agreed national standard, will increase the overall integrity of
the framework as well the levels of public confidence in the accounting and compliance
arrangements.

Transition period water take report 2012‒13 to 2015‒16
Page 82
6. Allocations and trade
s.71(1)(d) details of the water allocations made in relation to the water resources of that area in relation to that water accounting period
s.71(1)(e) details of any other decisions made by, or under the law of, the Basin state, that permit the taking of water from the water resources of that area during that water accounting period
This section provides information on the quantity of water allocated throughout the Basin at the
SDL resource unit level. ‘Other decisions’ under s.71(1)(e) refers to forms of access such as
carryover, basic rights and water used by farm dams and commercial plantations.
6.1. Allocations
The annual volume of allocation — subject to any use limits and/or periods of access — is one of
the key factors influencing the volume of water that is actually taken during a water year.
However, it is important to note that in most water years, entitlement holders do not take their full
allocation (generally about 75% of the water allocated at the Basin scale is taken). Allocation not
taken is often traded or carried over for use in future years. Allocation that is carried over is at
risk of forfeiture and/or spill depending on the rules in the relevant SDL resource unit.
Annual allocation — including relevant use limits — combined with carryover available from the
previous year and any additional water secured through trade, provides the total volume of water
authorised for use in any one year. Appendices 1 (surface water) and 2 (groundwater) provide
the total combined volumes of water authorised for use for each SDL resource unit over the
reporting period.
Annual allocations are the volumes of water actually authorised by Basin states for take by
entitlement holders. This may be expressed as a percentage or share component of the total
share value of the entitlements held. For example, a 50% allocation against an entitlement with a
100 megalitre (ML) share value authorises the holder of the entitlement to take 50 ML of water.
Annual allocations are referred to differently across the Basin. For example, in New South Wales
they are known as ‘available water determinations’, in the Victorian Murray they are ‘seasonal
determinations’ and in South Australia they are ‘allocations’.
Allocations are authorised by Basin states against the different entitlements in a particular valley
or water source under the terms of the relevant water sharing arrangements. Allocations are
made in response to things like available water in storage, minimum expected stream flows,
forecast rainfall and other seasonal conditions.
The volume of water allocated does not match the permitted take (or Cap target) for the purpose
of SDL accounting (refer Section 7.1).

Transition period water take report 2012‒13 to 2015‒16
Page 83
6.1.1. Surface water allocation
Table 19 shows the total volume authorised in surface water SDL resource units over the
reporting period. This data also forms part of Appendix 1, column headed ‘Annual authorised
(allocated) water including interceptions (GL/y)(s.71(1)(d)).
Table 19 Surface water authorised (GL) from 2012–13 to 2015–16
SDL resource unit 2012–13 2013–14 2014–15 2015–16
Paroo 9.7 9.7 9.7 9.7
Warrego 85.8 85.6 91.2 86.7
Nebine 25.0 25.0 25.1 26.4
Condamine–Balonne 1,305.3 903.4 629.1 539.6
Moonie 84.6 63.9 54.7 51.8
Queensland Border Rivers 482.0 234.2 196.6 192.7
Queensland total 1,992.4 1,321.8 1,006.3 906.9
NSW Border Rivers 421.7 338.0 199.0 276.5
Intersecting Streams 131.8 137.6 131.3 131.3
Gwydir 845.2 729.2 392.6 308.2
Namoi 723.0 642.1 416.5 388.5
Macquarie–Castlereagh 1,107.9 948.4 741.4 737.9
Lachlan 930.8 926.8 745.3 741.6
Murrumbidgee 3,631.6 2,887.5 2,644.6 2,163.0
Barwon–Darling Watercourse 475.1 471.0 517.2 511.1
Lower Darling 180.7 128.3 96.8 60.7
NSW Murray 2,798.5 2,045.7 1,872.4 1,291.6
New South Wales total 11,246.4 9,254.5 7,757.3 6,610.5
Australian Capital Territory (Surface Water)
85.1 86.7 88.7 87.7
Victorian Murray–Kiewa–Ovens 2,671.8 1,654.2 1,869.1 2,036.0
Goulburn–Broken–Campaspe–Loddon 1,927.1 1,902.7 1,621.6 1,646.5
Wimmera–Mallee (Surface Water) 212.4 283.5 207.0 191.3
Victoria total 4,811.3 3,840.4 3,697.7 3,873.8
SA Murray 659.3 609.5 604.7 672.2
SA Non-Prescribed Areasa 3.5 3.5 3.5 3.5
Marne Saunders 3.3 3.3 3.2 3.3
Eastern Mount Lofty Ranges 23.9 25.1 28.1 27.8
South Australia total 689.9 641.4 639.5 706.8
Basin total 18,825.2 15,144.8 13,189.4 12,185.7
a Volumetric allocations or authorisations are not made in the SDL resource unit. In the absence of authorisations /
allocations, the permitted take values have been used.
The volumes reported in Table 19 include water allocated in the year in question along with any
carryover available in the relevant systems. As some water can be carried over across multiple
years it is not possible to sum volumes allocated across years as this would involve some double
counting. In the case of two areas in Victoria a combined total has been provided (Murray—
Kiewa–Ovens; Goulburn–Broken–Campaspe–Loddon). Future reports will endeavour to separate
this information out to the SDL resource unit level.

Transition period water take report 2012‒13 to 2015‒16
Page 84
In some unregulated surface water systems (e.g. the Barwon–Darling) water allocated is only
available to be taken when conditions such as flow heights or other conditions are met. The data
in Table 19 is the overall volume available but access to this water is subject to the relevant
licence conditions being met.
Table 20 shows the proportion of the volume allocated that was actually taken in each year of the
reporting period. As can be seen from the data in the table, at the Basin scale around 75% of the
water legally authorised for use in a given year is taken (75%–77% in the four years of the
reporting period). This data also forms part of Appendix 1.
Table 20 Proportion of actually taken as surface water authorised from 2012–13 to 2015–16
SDL resource unit 2012–13 2013–14 2014–15 2015–16
Paroo 100% 100% 100% 100%
Warrego 100% 98% 99% 99%
Nebine 100% 100% 100% 100%
Condamine–Balonne 97% 97% 98% 98%
Moonie 100% 100% 100% 100%
Queensland Border Rivers 95% 96% 92% 87%
Queensland total 97% 97% 97% 96%
NSW Border Rivers 78% 89% 86% 80%
Intersecting Streams 89% 85% 89% 89%
Gwydir 68% 78% 74% 88%
Namoi 81% 92% 89% 90%
Macquarie–Castlereagh 70% 64% 58% 61%
Lachlan 71% 61% 68% 66%
Murrumbidgee 77% 81% 83% 85%
Barwon–Darling Watercourse 42% 19% 9% 17%
Lower Darling 57% 85% 52% 27%
NSW Murray 72% 78% 74% 64%
New South Wales total 72% 74% 72% 70%
Australian Capital Territory (Surface Water)
36% 35% 33% 37%
Victorian Murray–Kiewa–Ovens 67% 86% 81% 72%
Goulburn–Broken–Campaspe–Loddon 81% 77% 89% 85%
Wimmera–Mallee (Surface Water) 38% 27% 39% 43%
Victoria total 71% 78% 82% 76%
SA Murray 79% 73% 83% 89%
SA Non-Prescribed Areasa 100% 100% 100% 100%
Marne Saunders 66% 67% 73% 62%
Eastern Mount Lofty Ranges 100% 100% 71% 43%
South Australia total 80% 74% 82% 87%
Basin total 75% 77% 77% 75%
a Volumetric allocations or authorisations are not made in the SDL resource unit. In the absence of authorisations /
allocations, the permitted take values have been used.

Transition period water take report 2012‒13 to 2015‒16
Page 85
6.1.2. Surface water carried over from the previous year
Methods of determining surface water annual permitted take have to account for the volume of
water that is available as carryover from the previous year. Over recent years Basin state
governments have further developed rules that allow entitlement holders to carryover unused
annual allocation volumes. This has been in part a response to the millennium drought. The
arrangements seek to increase the capacity of individual entitlement holders to manage their
water portfolio including risks with respect to securing access to water from one year to the next.
The rules affecting access to carryover volumes vary from state to state. Subject to these rules
— and usually depending on the water available during a water year — access to carryover may
be cancelled or forfeited. The available carryover is volume carried over from the last water year
less carryover cancelled during the water year in question.
During the reporting period, carryover of surface water allocations was available in all Basin
states except the Australian Capital Territory. Carryover has been a prominent factor in water use
and hence on the determination of annual permitted take. A number of factors may be
contributing to the use of carryover by entitlement holders. These include allocation price volatility
and the experience of water shortages during the millennium drought.
It is also likely that there is a relationship between how well carryover behaviour is being reflected
in the determination of annual permitted take and the subsequent annual credits that have
accrued each year during the trial as cumulative TDL balances. The Cap models being used to
determine annual permitted take for watercourses and regulated rivers are not well tuned to the
carryover rules that have developed in the period since most Cap models were developed and so
determinations of permitted take may not be as accurate as they could be.
6.1.3. Groundwater allocation
All Basin states have the ability to make groundwater allocation announcements based on rules
within state water management plans. States take into account many factors when making
allocations which may include current or expected levels of recharge to a groundwater system,
risk of water level changes influencing water quality, water mixing between groundwater systems
or changes in groundwater pressure levels causing irreversible impact to the system or risk to
existing infrastructure such as bores or wells.
Over the four reporting years, all states except the Australian Capital Territory have made
allocation announcements affecting a specific SDL resource unit or sub-areas within SDL
resource units.
Table 21 shows the total volume of groundwater allocated by states each reporting year. Take
under basic rights is not generally subject to allocation announcements. Broadly, allocation over
the four reporting periods has remained at similar levels.
6.1.4. Groundwater carried over from the previous water years
Carryover enables groundwater users to carryover unused available groundwater at the end of a
water year. This carryover water becomes available in the next water year within the limits and
subject to the conditions and rules that the relevant Basin state has in place for each SDL

Transition period water take report 2012‒13 to 2015‒16
Page 86
resource unit. The rules affecting access to carryover volumes vary from state to state due to
different licence categories and varied hydrogeology across the SDL resources units. In most of
the groundwater systems, towns, domestic and stock and supplementary licence categories
cannot carryover.
During the reporting period, carryover of groundwater allocations were available in all Basin
states except the Australian Capital Territory. Carryover volumes are provided by all relevant
Basin states for all four reporting years, where applicable. Generally, carryover volumes are
calculated as the unused volumes from the previous water year that are further adjusted to reflect
the carryover conditions and rules under the relevant state water management framework.
Table 21 shows Basin scale authorised groundwater (allocation and carryover) over the reporting
period.
In Appendix 2, the data for allocation and carryover at the SDL resource unit scale is provided
(column headed ‘Allocation + Carryover (GL/y) s.71(1)(d) – water allocations’). At the Basin scale
about one third to one half of water authorised for use was used in the years of this reporting
period (38% to 47%). This does however vary within years with some systems using a high
proportion of the water authorised for use reflecting the level of development in such systems
and/or the method for authorising take in these systems.

Transition period water take report 2012‒13 to 2015‒16
Page 87
Table 21 Basin State authorised groundwater (allocation and carryover) for the period 2012–13 to 2015–16
2012-13 2013-14 2014-15 2015-16
Basin State
Total authorised
(carryover + allocation)
(GL)
Actual take (GL)
Allocation used (%)
Total authorised
(carryover + allocation)
(GL)
Actual take (GL)
Allocation used (%)
Total authorised
(carryover + allocation)
(GL)
Actual take (GL)
Allocation used (%)
Total authorised
(carryover + allocation)
(GL)
Actual take (GL)
Allocation used (%)
Queensland 282.82 162.36 57% 270.31 193.86 72% 279.86 177.64 63% 276.92 187.24 68%
New South Wales
2,414.22 844.50 35% 2,445.23 999.54 41% 2,405.88 1,109.6
5 46% 2,317.14 1,043.02 45%
Australian Capital Territorya
1.03 0.58 56% 1.03 0.46 45% 1.61 0.76 47% 1.48 0.96 65%
Victoriab 428.41 162.99 38% 509.86 149.24 29% 502.20 213.11 42% 499.40 241.86 48%
South Australia 110.69 61.01 55% 110.80 54.55 49% 140.62 55.28 39% 141.81 62.22 44%
Basin total 3,237.17 1,231.44 38% 3,337.23 1,397.65 42% 3,330.17 1,556.44 47% 3,236.75 1,535.30 47%
a Carryover is not enabled for groundwater in the Australian Capital Territory b Carryover was not enabled for groundwater in Victoria in 2012–13

Transition period water take report 2012‒13 to 2015‒16
Page 88
6.2. Water Trade within the Basin
s.71(1) (f) details of the trading or transfer of tradeable water rights in relation to the water
resources of that area during that water accounting period.
This section provides information on the quantity of water trading throughout the Basin at the
SDL resource unit level. Trade between SDL resource units affects the annual permitted take in
such units where water is traded between consumptive users. Water trade between consumptive
users and between environmental uses (disposal or acquisition of held environmental water) is
however treated differently for the purposes of SDL compliance (refer Basin Plan s10.12(3)).
The Basin Plan water trading rules came into effect on 1 July 2014. Trade of water allocations
continues as a major feature of annual water use. This underlines the importance of minimising
restrictions on trade and building security and certainty into water sharing frameworks.
Under the SDL accounting framework, the volume of allocation trades across the year are
totaled, inclusive of trade within and across SDL resource units, and these volumes are provided
at Table 22. The trade across SDL resource units is used to adjust annual permitted take.
Volumes of entitlement trade across the Basin are published separately by the Bureau of
Meteorology.
6.2.1. Surface water trade
Surface water is traded within and between Basin states, and also within and between the pool of
consumptive water entitlements (for irrigation of crops and town water supplies etc.) and
environmental water entitlements. Water trade has enabled water entitlement holders to
maximize the value of their entitlement by being able to buy and sell water when required.
The volumes of water traded throughout the Basin on an annual basis is described in Table 22.
The total volume represents all allocation trades (due to short term and long term water trades))
within and from an SDL resource unit in each state. This data is provided for both consumptive
and environmental holdings.
The overall volumes of allocation trade are also partitioned in to source (i.e. origin) of the water
traded (consumptive, environmental) and its destination (consumptive, environmental) in Table
23 (see also Figure 19 and Figure 20). The bulk of environmental water allocation trade occurs
as the mechanism to deliver and account for the movement of environmental water from one
SDL resource unit to another as part of environmental watering actions.

Transition period water take report 2012‒13 to 2015‒16
Page 89
Table 22 Total surface water allocation trade (GL) across the Basin: consumptive and environmental uses
Year Total
volume (GL / %)
Consumptive to consumptive
Environmental to
environmental
Consumptive to
environmental
Environmental to
consumptive
2012–13 5,811.8 2,840.1 2,937.2 17.4 17.1
100% 49% 51% <1% <1%
2013–14 4,860.2 2,625.5 2,170.2 19.6 44.9
100% 54% 45% <1% 1%
2014–15 5,321.1 2,500.1 2,786.3 19.5 15.2
100% 47% 52% <1% <1%
2015–16 5,611.1 2,535.9 3,040.8 6.9 27.5
100% 45% 54% <1% <1%
Figure 19 Surface water allocation trade volumes 2012–13 to 2015–16, including total trade, consumptive to consumptive, environment to environment, consumptive to environment and environment to consumptive
0.0
1,500.0
3,000.0
4,500.0
6,000.0
7,500.0
2012-13 2013-14 2014-15 2015-16
Trad
e V
olu
me
(GL)
Water Year
Total Allocation Trade Consumptive to Consumtive Environment to Environment
Consumptive to Environment Environment to Consumptive

Transition period water take report 2012‒13 to 2015‒16
Page 90
Figure 20 Surface water allocation trade volumes 2012–13 to 2015–16, consumptive to environment and environment to consumptive only
0.0
25.0
50.0
75.0
2012-13 2013-14 2014-15 2015-16
Trad
e V
olu
me
(GL)
Water Year
Consumptive to Environment Environment to Consumptive

Transition period water take report 2012‒13 to 2015‒16
Page 91
Table 23 Surface water allocation total trade (GL): between consumptive and environmental uses
Year Basin state Allocation trade:
totala Consumptive to
consumptive Environmental to
environmental Consumptive to environmental
Environmental to consumptive
Net environmental to consumptive
2012–13
Queensland 104.7 104.7 0.0 0.0 0.0 0.0
New South Wales 2,384.7 1,338.7 1,017.7 11.2 17.1 5.9
Australian Capital Territory
0.0 0.0 0.0 0.0 0.0 0.0
Victoria 2,297.4 1,327.9 975.4 –5.8 0.0 5.8
South Australia 1,024.9 68.8 944.1 12.0 0.0 –12.0
TOTAL 5,811.8 2,840.1 2,937.2 17.4 17.1 –0.2
2013–14
Queensland 105.1 105.1 0.0 0.0 0.0 0.0
New South Wales 2,058.6 1,270.9 730.9 12.3 44.6 32.3
Australian Capital Territory
0.0 0.0 0.0 0.0 0.0 0.0
Victoria 1,901.7 1,059.8 845.3 –3.7 0.3 4.1
South Australia 794.8 189.7 593.9 11.1 0.0 –11.1
TOTAL 4,860.2 2,625.5 2,170.2 19.6 44.9 25.2
2014–15
Queensland 123.6 123.6 0.0 0.0 0.0 0.0
New South Wales 1,929.3 910.8 1,008.0 7.8 2.7 –5.1
Australian Capital Territory
0.0 0.0 0.0 0.0 0.0 0.0
Victoria 2,457.4 1,256.6 1,177.8 10.5 12.5 2.0
South Australia 810.8 209.1 600.5 1.2 0.0 –1.2
TOTAL 5,321.1 2,500.1 2,786.3 19.5 15.2 –4.3
2015–16
Queensland 106.2 106.2 0.0 0.0 0.0 0.0
New South Wales 2,201.9 1,197.8 1,002.0 0.0 2.1 2.1
Australian Capital Territory
0.0 0.0 0.0 0.0 0.0 0.0
Victoria 2,405.9 1,033.3 1,350.2 0.0 22.4 22.3
South Australia 897.1 198.6 688.6 6.9 3.0 –3.9
TOTAL 5,611.1 2,535.9 3,040.8 6.9 27.5 20.6
*Total represents tagged and temporary trade that includes within and across each SDL resource unit in each state. This analysis shows total trade activity and is not the trade
adjustment to permitted take.

Transition period water take report 2012‒13 to 2015‒16
Page 92
6.2.2. Groundwater trade
Groundwater allocations and entitlements across the Basin can be traded in the following three
broad categories, noting that trade between states is not currently enabled:
- Within the same SDL resource unit
- Between different SDL resource units
- Between surface water and groundwater
Rules governing groundwater trade vary across the Basin by state and SDL resource unit based
on individual aquifer properties and demand for the water source. There are a number of SDL
resource units where trade is not enabled, commonly where the water quality is not suitable for
use or the water in the groundwater system is too difficult to access. States may choose to
enable trade in these SDL resource units in the future. Across the Basin, 99% of all trade
occurred as trade within the same SDL resource unit and the remaining 1% was trade between
SDL resource units in Victoria. There was no trade reported between surface water and
groundwater in any state.
Across the 2012–13 to 2015–16 period, Victoria was the only state to report trade between SDL
resource units. This trade in Victoria occurred between SDL resource units in the Goulburn-
Murray water resource plan area in two years, 2013–14 and 2015–16. The volumes of water
traded totalled less than 1 GL in each of those years. Under the SDL accounting framework,
volumes of trade between SDL resource units should be taken into account and annual permitted
take adjusted accordingly; however due to the small volumes involved, permitted take volumes in
these SDL resource units were not adjusted over this reporting period. Improved accounting for
the effects of trade on permitted take will be included in future reports.
The majority of groundwater trade, over 90% by volume in each year, occurred in New South
Wales with over 40% of total trade accounted for in the Lower Murrumbidgee Alluvium (deep)
SDL resource unit (GS28) and Lower Lachlan Alluvium SDL resource unit (GS25) combined.
State rules in South Australia and New South Wales currently do not allow for trade between
SDL resource units.
As groundwater availability is not dependent on weather conditions in the short term, users
commonly turn to groundwater to supplement needs when surface water availability is low. At a
Basin scale, reporting data shows that increases in both groundwater trade and groundwater
take correspond with decreased surface water allocations.
Total groundwater allocation volume traded across the basin was 138 GL in 2013–14 which
increased to 214 GL in 2014–15 and 244 GL in 2015–16. This correlates with hotter and drier
climatic conditions and reduced surface water availability.
Across the Basin, groundwater allocation trade reported has steadily increased in volume each
year with 74 GL reported in 2012–13, 137 GL in 2013–14, 214 GL in 2014–15 and 245 GL in
2015–16. This increase may be partially attributed to changing climatic conditions and surface
water availability, and partially to improved reporting data from the states, noting that there was
no data received from Victoria or the Australian Capital Territory for the 2012–13 reporting
period. The improvement in data reporting is reflected in the more complete data sets in both
2014–15 and 2015–16.

Transition period water take report 2012‒13 to 2015‒16
Page 93
Table 24 Total groundwater allocation trade volumes (GL) at Basin and state scales 2012–2013 to 2015–2016. Total includes trade within, into and out of SDL resource units
Allocation trade (GL)
State 2012–2013 2013–2014 2014–2015 2015–2016
Queensland 1.17 4.04 5.06 5.53
New South Wales 71.71 124.59 199.36 221.47
Australian Capital Territorya n/d 0.08 0.00 0.02
Victoriaa n/d 5.95 7.62 17.46
South Australia 0.66 1.85 3.36 3.11
Basin Total 73.54 136.90 214.12 245.98
a No data was available from the Australian Capital Territory or Victoria in 2012–13
Detailed trade volumes at SDL resource unit scale are available from MDBA upon request. This
includes a list of SDL resource units where trade was not enabled.

Transition period water take report 2012‒13 to 2015‒16
Page 94
7. Permitted take and indicative compliance
s.71(1)(b) the quantity of water permitted to be taken from the water resources of the water
resource plan area during the water accounting period
This section provides information on the quantity of water permitted to be taken throughout the
Basin at the SDL resource unit level.
Appendix 1 (surface water) and 2 (groundwater) detail the combined total reported volumes of
transitional annual permitted take — as determined against the TDL — from each SDL resource
unit over the reporting period.
Importantly, permitted take is different to the water allocated which is also known as ‘water
authorised for use’. The ‘permitted take’ is broadly analogous to the annual Cap target under the
Cap on diversions.
Annual permitted take is defined in the Basin Plan s6.10(1) as:
‘For a water accounting period, sum the maximum quantity of water permitted to be taken
by each form of take for consumptive use from the SDL resource unit, determined in
accordance with the method for section 10.10 (annual permitted take).’
WRPs are required under section 10.10(1) to set out the method for determining the annual
permitted take. To this end, section 10.10(4) states WRPs must demonstrate ‘…that the method
relates to the SDL of each resource unit in such a way that, if applied over a repeat of the
historical climate conditions, it would result in meeting the SDL for the resource unit …’
In addition to demonstrating that they can achieve the SDLs over the Basin Plan historical
climate conditions, the methods for determining annual permitted take that Basin states
incorporate into accredited water resource plans must consider a range of matters (refer Basin
Plan s10.12). These include:
the climate conditions experienced during the year in question
all forms of take (from watercourses, regulated rivers, groundwater, by runoff dams, by
floodplain harvesting, by commercial plantations (net take) and under basic rights) and all
classes of water entitlement in the SDL resource unit
carryover of allocation from the previous year
return flows (for surface water)
trade in and out of the SDL resource unit
water resources used for managed aquifer recharge (for groundwater)
accounting separately for the movement of water between the consumptive and
environmental pools.
Accordingly, the annual permitted take is the annual expression of the limit on actual take that
would, over a repeat of the historic climatic conditions (1895–2009), meet the SDL. Thus upon
the completion of each water year, the method that would deliver the SDL over the long-term is
applied to the year just ended, for example incorporating the climatic conditions experienced, to
determine the annual permitted take.

Transition period water take report 2012‒13 to 2015‒16
Page 95
The key component of each accredited surface water WRP will be the ‘SDL model’ that will
generate annual permitted take for each form of take for the purposes of SDL compliance.
During the transition period, most surface water SDL models are not yet available so existing
modelling platforms are used and then adjusted as necessary to produce an estimate of the
permitted take for the purpose of the transitional account. These are generally the Cap models,
adjusted as necessary to the BDL, then further reduced to allow for water recovery that bridges
the gap to the SDLs as at the outset of each water year (termed the TDL).
While permitted take methodologies attempt to explain as much of the inter-annual variation as
possible (e.g. through relating use to climatic conditions and water availability), it is not always
possible to fully explain such variations and thus ‘unders’ and ‘overs’ are expected and a
cumulative balance is used. This is further accentuated in the transition period as the models in
use were generally not specifically developed to assist in this task. This situation will be
addressed through the preparation of WRPs.
7.1. Water authorised for use versus annual permitted take
Appendix 1 and 2 also provide data about the reported volumes of water authorised for use in
each SDL resource unit over each year during the reporting period. These volumes are generally
higher than the reported total volumes of permitted take for the same SDL resource unit in the
same year.
The question ‘how can the volume of water authorised for use be more than permitted take’
requires some explanation. At its simplest, the Cap and SDL frameworks are a limit on actual
take not, directly, on the amount of water allocated.
Basin states allocate water based on the sharing arrangements set out in the water resource
management instruments developed in each state. Some underuse of allocated water is
expected for a range of reasons (e.g. mid-summer rainfall suppressing demand). Since the
introduction of the Cap, Basin states have moderated the amount of water allocated as
necessary to ensure Cap compliance. Over the period 2012–13 to 2015–16, the amount of water
actually taken is around 75% of that authorised for extraction across the Basin.
Appendixes 1 and 2 detail the amount of water authorised for use (including carryover) each year
for each surface water and groundwater SDL resource unit. Also shown is the proportion of water
authorised that was actually taken.

Transition period water take report 2012‒13 to 2015‒16
Page 96
7.2. Surface water annual permitted take
Annual surface water permitted take is calculated after the end of each water year. It is the
volume of take for the relevant SDL resource unit that reflects for that year: the weather
conditions, announced allocations, available carryover, and trade. Appendix 1 sets out the annual
permitted take for each SDL resource unit as it relates to the long-term average TDL for that
year. See column headed ‘Transitional permitted take (GL/y) (s.71(1)(b))’.
For the purposes of the trial, the adjustment to annual permitted take to account for held
environmental water is being undertaken using a scaling approach as nominated and agreed with
each Basin state. These methods improve on those currently being used under the Cap but are a
temporary measure to accommodate TDL reporting in advance of fully developed methods that
will be defined in Basin state water resource plans (WRPs).
The use of models for this purpose is a critical function in SDL compliance and perhaps the key
component to the overall integrity of the accounts. It should be emphasised that attention to this
aspect of water resource plan accreditation will be thorough and the MDBA looks forward to
improvements in model performance for this purpose.
Further, a number of specific approaches were adopted for determining the annual permitted
take for some surface water SDL resource units that are described here for completeness:
New South Wales Barwon Darling:
o A number of improvements have been investigated to address long-term issues
associated with the hydrological modelling, in particular the ‘trunk’ streams of the
Barwon–Darling and River Murray systems. An important issue for modelling such
streams is the selection of inflows to be used to generate annual permitted take
targets. For the purpose of this report, the annual permitted take targets in the
trunk streams have been calculated based on the methodology used for the
annual Cap target (i.e. under Cap reporting arrangements) for the transition years.
o The independent audit reports of Cap models provide a number of
recommendations for improving these models including in relation to the choice of
inflows and improved estimation for the end of system flows (i.e. Menindee
inflows).
o As there was insufficient opportunity to thoroughly address these
recommendations for this report, these issues are identified as areas of future
improvement and are expected to be addressed through WRPs due by 2019.
Australian Capital Territory
o The water recovery to meet the ACT reduction target (4.9 GL) has been achieved
through the purchase of entitlements in the NSW Murrumbidgee. In order for this
recovery to be reflected in the annual permitted take in the ACT, an interstate
trade account between NSW and the ACT is required. This is not yet in place
though both NSW and the ACT have committed to establishing the necessary
arrangements. For the purpose of this report, it has been assumed that this
arrangement is already in place. This was considered the best way to report water
use and permitted take for the transition period.

Transition period water take report 2012‒13 to 2015‒16
Page 97
South Australian Murray
o For the Metropolitan Adelaide water use component of the SA Murray SDL
resource unit annual permitted take, actual use for each of the four years has
been used. In the absence of a climate adjusted model for this component of
water use, this was seen to provide the most useful surrogate, noting that the
actual take for Metropolitan Adelaide has been lower due to the operation of the
Adelaide Desalination Plant. A climate adjusted approach for this component is
expected to form part of the WRP under preparation for this area.
Appendix 5 sets out the nominated methods for environmental water adjustment that have been
agreed between the MDBA and each of the Basin states for use during the transition period.
The methods adopted for the purpose of transition period water accounting better align with
Basin Plan arrangements. In NSW and Victorian SDL resource units, this results in a larger
adjustment to the raw estimates of annual permitted take. Accordingly, the annual and
cumulative credits over the four years of this accounting period differ under the TDL and Cap
reporting processes. There is no difference in the methodologies in Queensland and South
Australia. In the ACT a difference only applies in 2015–16 reflecting progress in water recovery at
that time.
In overall terms, over the four years of the reporting period, the TDL permitted take volumes are
less than the comparable annual Cap targets by an average of around 120 GL per year.
Figure 21 presents transitional annual permitted take for surface water over the four years at the
Basin scale and by Basin State. The reduction in the volume of annual permitted take at the
Basin scale is also a consequence of reduced water availability due to climate conditions.
Figure 21 Basin and state scale surface water annual permitted take (GL) 2012–13 to 2015–16
16,011
13,168
10,685
9,360
0
4,000
8,000
12,000
16,000
20,000
2012-13 2013-14 2014-15 2015-16
Per
mit
ted
Tak
e (G
L)
Water year
MDB QLD NSW ACT Vic SA
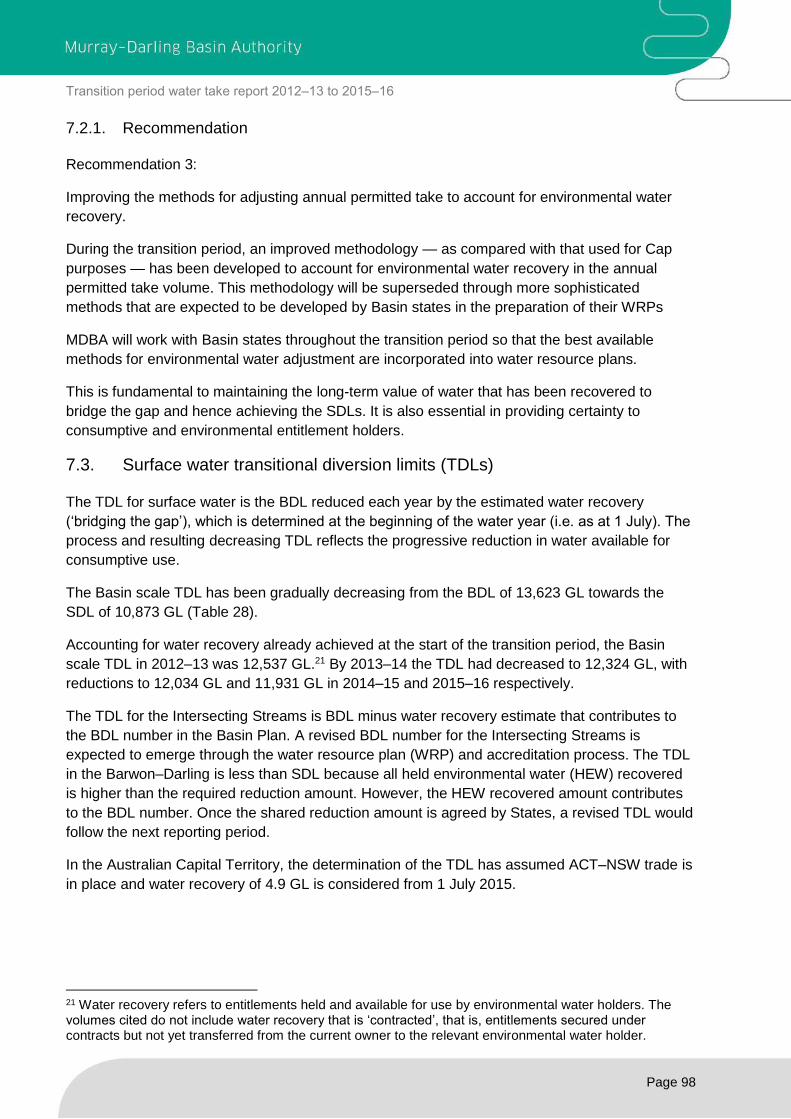
Transition period water take report 2012‒13 to 2015‒16
Page 98
7.2.1. Recommendation
Recommendation 3:
Improving the methods for adjusting annual permitted take to account for environmental water
recovery.
During the transition period, an improved methodology — as compared with that used for Cap
purposes — has been developed to account for environmental water recovery in the annual
permitted take volume. This methodology will be superseded through more sophisticated
methods that are expected to be developed by Basin states in the preparation of their WRPs
MDBA will work with Basin states throughout the transition period so that the best available
methods for environmental water adjustment are incorporated into water resource plans.
This is fundamental to maintaining the long-term value of water that has been recovered to
bridge the gap and hence achieving the SDLs. It is also essential in providing certainty to
consumptive and environmental entitlement holders.
7.3. Surface water transitional diversion limits (TDLs)
The TDL for surface water is the BDL reduced each year by the estimated water recovery
(‘bridging the gap’), which is determined at the beginning of the water year (i.e. as at 1 July). The
process and resulting decreasing TDL reflects the progressive reduction in water available for
consumptive use.
The Basin scale TDL has been gradually decreasing from the BDL of 13,623 GL towards the
SDL of 10,873 GL (Table 28).
Accounting for water recovery already achieved at the start of the transition period, the Basin
scale TDL in 2012–13 was 12,537 GL.21 By 2013–14 the TDL had decreased to 12,324 GL, with
reductions to 12,034 GL and 11,931 GL in 2014–15 and 2015–16 respectively.
The TDL for the Intersecting Streams is BDL minus water recovery estimate that contributes to
the BDL number in the Basin Plan. A revised BDL number for the Intersecting Streams is
expected to emerge through the water resource plan (WRP) and accreditation process. The TDL
in the Barwon–Darling is less than SDL because all held environmental water (HEW) recovered
is higher than the required reduction amount. However, the HEW recovered amount contributes
to the BDL number. Once the shared reduction amount is agreed by States, a revised TDL would
follow the next reporting period.
In the Australian Capital Territory, the determination of the TDL has assumed ACT–NSW trade is
in place and water recovery of 4.9 GL is considered from 1 July 2015.
21 Water recovery refers to entitlements held and available for use by environmental water holders. The volumes cited do not include water recovery that is ‘contracted’, that is, entitlements secured under contracts but not yet transferred from the current owner to the relevant environmental water holder.

Transition period water take report 2012‒13 to 2015‒16
Page 99
Table 25 Surface water BDLs, bridging the gap (BtG) recovery at 1 July and transitional diversion limits (GL) at SDL resource unit scale 2012–13 to 2015–16
2012–13 2013–14 2014–15 2015–16
BDL BtG as
at 1 July TDL BDL
BtG as at 1 July
TDL BDL BtG as
at 1 July TDL BDL
BtG as at 1 July
TDL
Queensland
Paroo 9.9 - 9.9 9.9 - 9.9 9.9 - 9.9 9.9 - 9.9
Warrego 127.7 8.0 119.7 127.7 8.0 119.7 127.7 8.0 119.7 127.7 8.0 119.7
Nebine 31.2 1.0 30.2 31.2 1.0 30.2 31.2 1.0 30.2 31.2 1.0 30.2
Condamine–Balonne 978.3 23.1 955.2 978.3 34.6 943.7 978.3 40.3 938.0 978.3 53.8 924.5
Moonie 84.2 1.1 83.1 84.2 1.1 83.1 84.2 1.1 83.1 84.2 1.1 83.1
Queensland Border Rivers 320.1 4.2 315.9 320.1 5.8 314.3 320.1 6.6 313.5 320.1 8.5 311.6
Queensland total 1,551.4 37.4 1,514.0 1,551.4 50.4 1,501.0 1,551.4 56.9 1,494.5 1,551.4 72.3 1,479.1
New South Wales
NSW Border Rivers 302.6 0.1 302.5 302.6 0.1 302.5 302.6 0.2 302.4 302.6 0.2 302.4
Intersecting Streams 114.0 0.2 113.8 114.0 0.2 113.8 114.0 0.2 113.8 114.0 0.2 113.8
Gwydir 450.2 42.5 407.7 450.2 42.5 407.7 450.2 42.5 407.7 450.2 46.9 403.3
Namoi 508.3 4.8 503.5 508.3 4.9 503.4 508.3 6.2 502.1 508.3 7.6 500.7
Macquarie –Castlereagh 734.3 53.9 680.4 734.3 61.5 672.8 734.3 73.2 661.1 734.3 75.4 658.9
Lachlan 618.4 48.3 570.1 618.4 48.8 569.6 618.4 49.6 568.8 618.4 49.6 568.8
Murrumbidgee 2,501.1 132.2 2,368.9 2,501.1 162.5 2,338.6 2,501.1 307.1 2,194.0 2,501.1 325.6 2,175.5
Barwon–Darling Watercourse 198.0 22.3 175.7 198.0 22.3 175.7 198.0 23.8 174.2 198.0 25.8 172.2
Lower Darling 60.5 0.4 60.1 60.5 0.4 60.1 60.5 1.0 59.5 60.5 1.0 59.5
NSW Murray 1,811.7 192.7 1,619.0 1,811.7 266.9 1,544.8 1,811.7 280.7 1,531.0 1,811.7 288.9 1,522.8
New South Wales total 7,299.1 497.3 6,801.8 7,299.1 610.0 6,689.1 7,299.1 784.5 6,514.6 7,299.1 821.1 6,478.0
Australian Capital Territory
Australian Capital Territory total 52.5 - 52.5 52.5 - 52.5 52.5 - 52.5 52.5 4.9 47.6
Victoria
Victorian Murray 1,707.1 234.0 1,473.1 1,707.1 251.1 1,456.0 1,707.1 297.6 1,409.5 1,707.1 314.4 1,392.7

Transition period water take report 2012‒13 to 2015‒16
Page 100
2012–13 2013–14 2014–15 2015–16
BDL BtG as
at 1 July TDL BDL
BtG as at 1 July
TDL BDL BtG as
at 1 July TDL BDL
BtG as at 1 July
TDL
Kiewa 24.6 - 24.6 24.6 - 24.6 24.6 - 24.6 24.6 - 24.6
Ovens 83.4 0.1 83.3 83.4 0.1 83.3 83.4 0.1 83.3 83.4 0.1 83.3
Broken 56.2 0.0 56.2 56.2 0.1 56.1 56.2 0.1 56.1 56.2 0.2 56.0
Goulburn 1,689.4 211.4 1,478.0 1,689.4 228.1 1,461.3 1,689.4 278.3 1,411.1 1,689.4 293.0 1,396.4
Campaspe 152.6 6.3 146.3 152.6 28.9 123.7 152.6 29.0 123.6 152.6 29.0 123.6
Loddon 178.6 9.9 168.7 178.6 9.9 168.7 178.6 11.4 167.2 178.6 11.9 166.7
Wimmera–Mallee 128.5 - 128.5 128.5 22.6 105.9 128.5 22.6 105.9 128.5 22.6 105.9
Victoria total 4,020.4 461.6 3,558.8 4,020.4 540.8 3,479.6 4,020.4 639.0 3,381.4 4,020.4 671.1 3,349.3
South Australia
South Australian Murray 665.0 90.3 574.7 665.0 98.3 566.7 665.0 108.9 556.1 665.0 122.4 542.6
South Australian Non-Prescribed Areas
3.5 - 3.5 3.5 - 3.5 3.5 - 3.5 3.5 - 3.5
Marne Saunders 2.9 - 2.9 2.9 - 2.9 2.9 - 2.9 2.9 - 2.9
Eastern Mount Lofty Ranges 28.3 - 28.3 28.3 - 28.3 28.3 - 28.3 28.3 - 28.3
South Australia total 699.7 90.3 609.4 699.7 98.3 601.4 699.7 108.9 590.8 699.7 122.4 577.3
Basin total 13,623.1 1,086.5 12,536.6 13,623.1 1,299.5 12,323.6 13,623.1 1,589.3 12,033.8 13,623.1 1,691.8 11,931.3

Transition period water take report 2012‒13 to 2015‒16
Page 101
7.4. Groundwater permitted take
In the case of groundwater systems in the Basin most of the 81 SDL resource units have use
levels below 75% of the SDL and for more than 2/3 of the SDL resource units, use is below half
of the SDL. Accordingly for such systems, the average SDL can be used as a surrogate in the
absence of a more sophisticated method.
However, SDLs are not yet in effect and water recovery to bridge the gap from the BDL to the
SDLs is not complete. Consequently, the transitional SDL water accounting and compliance trial
is using TDLs as the annual permitted take for groundwater. This is the approach adopted for all
groundwater SDL resource units in this report.
For most groundwater SDL resource units, the TDL is the same as the current SDL because the
majority of SDL resource units have the same or higher SDL than the associated BDL. Over the
reporting period, TDL is different than the SDL only for:
two SDL resource units in Queensland (Upper Condamine Alluvium (Central Condamine
Alluvium) and Upper Condamine Alluvium (Tributaries)) where the Basin Plan set water
recovery targets
seven SDL resource units in New South Wales associated with the Achieving Sustainable
Groundwater Entitlements (ASGE) Program that was still progressively coming in to effect
during the four years covered by this report.
7.5. Groundwater transitional diversion limits (TDLs)
For most groundwater SDL resource units, the TDL is the same as the current SDL. This is
because the majority of SDL resource units are not subject to water recovery to bridge the gap
between the BDL and the SDL.
Water recovery to bridge a gap between the BDL and SDL is only required in two SDL resource
units, the Queensland Upper Condamine Alluvium (Central Condamine Alluvium) and Upper
Condamine Alluvium (Tributaries). However as at 1 July 2015, no groundwater had been
recovered to bridge the gap in these two SDL resources units. Consequently, the TDL is the
same as the BDL for these resource units.

Transition period water take report 2012‒13 to 2015‒16
Page 102
Table 26 Groundwater transitional diversion limits (TDLs) in SDL resource units subjected to water recovery of HEW under 'bridging the gap' for 2012–13 to 2015–16
SDL resource unit
BDL (GL)
SDL (GL)
HEW 'bridging the gap'
(GL)
Transitional diversion limit (GL)
2012–13
2013– 14
2014– 15
2015–16
2012–13
2013– 14
2014– 15
2015–16
Upper Condamine Alluvium (Central Condamine Alluvium)
81.4 46.0 0.00 0.00 0.00 0.00 81.4 81.4 81.4 81.4
Upper Condamine Alluvium (Tributaries)
45.5 40.5 0.00 0.00 0.00 0.00 45.5 45.5 45.5 45.5
Other SDL resource units where the TDL is different to the SDL over the reporting period are
associated with a progressive reduction of groundwater allocations in New South Wales. In 2005,
New South Wales introduced the ASGE Program, which aims to ensure the long-term
sustainability of the groundwater systems in seven of the groundwater SDL resource units:
the Upper Namoi Alluvium
Lower Namoi Alluvium
Lower Murrumbidgee Alluvium (deep)
Lower Gwydir Alluvium
Lower Lachlan Alluvium
Lower Macquarie Alluvium and
Lower Murray Alluvium (deep)
At the commencement of the water sharing plans, the entitlements for these systems were
reduced. Where a licence holder previously extracted more than their new reduced entitlement, a
supplementary water access licence was issued to allow adjustment to the reduction by provision
of extra water. The allocation of water under these supplementary water access licences was
progressively reduced over a 10-year adjustment period allowing licence holders to adapt. The
amount of supplementary water and resulting decreasing TDL from 2012–13 to 2015–16 reflects
the progressive reduction in supplementary allocations (Table 27).
In 2015–16, supplementary volumes had reduced to zero in all these areas with the exception of
the Lower Lachlan Alluvium, which was reduced to zero on 1 July 2016. Therefore, at the end of
the reporting period, the TDL is equal to the current SDL in six of these SDL resource units. In
these SDL resource units there are no supplementary volumes available in 2015–16.
Groundwater TDLs at the SDL resource unit level for the four reporting years have been reported
in the detailed groundwater data set at Appendix 2. See column headed ‘TDL (GL/y) s.71(1)(b) –
permitted take’.

Transition period water take report 2012‒13 to 2015‒16
Page 103
Table 27 Groundwater transitional diversion limits (TDLs) in SDL resource units that had entitlements reduced under the NSW ASGE Program for 2012–13 to 2015–16
SDL resource unit
BDL (GL)
SDL (GL)
Supplementary water (GL)
TDL (GL)
2012–13
2013– 14
2014– 15
2015–16
2012–13
2013– 14
2014– 15
2015–16
Lower Gwydir Alluvium 33.0 33.0 6.0 4.0 2.0 0.0 39.0 37.0 35.0 33.0
Lower Macquarie Alluvium
70.7 70.7 0.7 0.5 0.3 0.0 71.4 71.2 71.0 70.7
Lower Murray Alluvium (deep)
88.9 88.9 29.1 19.4 9.7 0.0 118.0 108.3 98.6 88.9
Lower Murrumbidgee Alluvium (deep)
273.6 273.6 12.4 8.3 4.1 0.0 286.0 281.9 277.7 273.6
Lower Namoi Alluvium
88.3 88.3 6.3 4.2 2.1 0.0 94.6 92.5 90.4 88.3
Lower Lachlan Alluvium
123.4 117.0 10.6 8.5 6.4 4.2 127.6 125.5 123.4 121.2
Upper Namoi Alluvium
123.4 123.4 12.4 8.3 4.3 0.0 135.8 131.7 127.7 123.4

Transition period water take report 2012‒13 to 2015‒16
Page 104
7.6. Transition assessment of actual take against permitted take and the TDL
s.71(1)(g) an assessment of compliance with any long-term annual diversion limit for the
water resources of the area, or for a particular part of those water resources, in
accordance with the method specified in the Basin Plan
This section provides an indicative assessment of water take throughout the Basin at the SDL
resource unit level. While there are no formal compliance arrangements in operation during the
trial, this assessment, uses the framework set out in the Water Act and the Basin Plan that will
apply from 1 July 2019.
As set out in earlier sections of this report, the TDL represents the progress of water recovery
against the BDL for each year of the transition period (2012–13 to 2018–19). As each year of the
transition period progresses, the TDL will approach the SDL until the SDL is achieved by 2019.
During the transition period, annual permitted take is determined with reference to the TDL for
that year through a process that accounts for the recovery of water entitlements from the
consumptive pool to ‘bridge the gap’ as at the start of the relevant year. The annual permitted
take is then determined based on the best available method for this purpose.
As already discussed, annual actual take has been less than annual permitted take at the Basin
scale for both surface water and groundwater in all years of the reporting period. Consequently,
there have been annual credits in each year of the reporting period and the Basin scale
transitional cumulative balance at the end of 2015–16 had risen to 4,271 GL for surface water
and 7,939 GL for groundwater. The transitional cumulative balances will not carryover to the
formal compliance framework as the Basin Plan requires the Register of Take to commence on
1July 2019 with a zero balance.
The pattern of cumulative credits evident in these transitional accounts are broadly similar to that
observed in the Cap Register. This in part reflects the ongoing use of Cap models for the
purpose of calculating the annual permitted take amounts during the transitional period. It also
might be due to the potential causes of these credits in the Cap Register which are considered to
include:
• Conservative water use decision making. A possible consequence of the millennium
drought is that overall, irrigators may have been more conservative in how much crop
they plant to ensure they will have enough water to bring the crop through to harvest. This
would result in less water use against allocations and the generation of annual Cap
credits.
• Cap models used to determine annual Cap targets based on 1993–94 arrangements do
not incorporate more recent carryover rules that have been established in the period
since this time including in response to the millennium drought. This means that modelled
annual Cap targets could be expected to be higher than if carryover were to be
incorporated, meaning annual credits are again more likely.
• Annual Cap Credits were relatively small for 2015–16. It is as yet unclear as to the extent
the usage below Cap targets in previous years can be expected to continue.
The methods for determining surface water annual permitted take that are developed by Basin
states in the WRPs under preparation will be based on planning assumptions with respect to
utilisation and use of allocations and carryover. The planning assumptions adopted will influence

Transition period water take report 2012‒13 to 2015‒16
Page 105
the annual permitted take amounts from 2019. Accordingly, any discernible patterns in the
accumulation of annual actual take credits or debits will not be apparent for some years after the
SDLs take effect from 2019.
The MDBA is preparing guidance material for Basin states about how it will approach the
regulation of possible instances of non-compliance with the SDLs under section 6.12 of the Basin
Plan, including a guideline on what will be considered a ‘reasonable excuse’ under this section.
The guidance material and MDBA’s approach to such matters will be consistent with the
Compliance Strategy of the MDBA as it is updated over time.
7.6.1. Transitional assessment — Surface water
Appendix 1 shows the transitional annual credits/debits and the transitional adjusted cumulative
balance for each surface water SDL resource unit.
Table 28 and Figure 22 show Basin scale TDL, annual permitted take, annual actual take, annual
credits and the adjusted cumulative balance for each of the four years of the reporting period.
The Basin Plan required that the effect of disposal or acquisition of environmental water not be
included in the annual permitted take estimates (refer section 10.12(3)) but that the net effect of
such activity is used to adjust the cumulative balance of credits/debits that is calculated in the
Register of Take (refer section 6.12(1)(a)). This adjustment for each year for each SDL resource
unit is shown in Appendix 1. The overall effect at the Basin scale is presented in Table 28.
Table 28 Basin scale surface water TDL, transitional annual permitted take, annual actual take, transitional annual credits and cumulative balance for 2012–13 to 2015–16. All values in GL.
2012–13 2013–14 2014–15 2015–16
TDL 12,536.6 12,323.6 12,033.8 11,931.3
Permitted take 16,011.1 13,167.7 10,685.3 9,359.8
Actual take 14,092.8 11,656.1 10,135.8 9,109.9
Annual credit 1,918.4 1,511.6 549.5 249.9
Adjustment for disposal or acquisition of environmental water
-0.2 25.2 -4.3 20.6
Adjusted cumulative balance 1,918.1 3,455.0 4,000.1 4,270.6

Transition period water take report 2012‒13 to 2015‒16
Page 106
Figure 22 Basin scale TDL, transitional annual permitted take, annual actual take and transitional credits and cumulative TDL credits 2012–13 to 2015–16
At the SDL resource unit scale, there were 17 instances among the 116 assessments of take
over the reporting period where annual actual take exceed annual permitted take and an annual
debit was recorded in the trial Register of Take. Noting that compliance against the TDL does not
apply during the transition period, there were no instances where these annual debits resulted in
a cumulative balance debit of 20% or more of the TDL.
-
2,000
4,000
6,000
8,000
10,000
12,000
14,000
16,000
18,000
2012-13 2013-14 2014-15 2015-16
Vo
lum
e (G
L)
Water Year
Annual Balance SDL BDL
TDL Permitted Take Actual Take
TDL Cumulative Credits

Transition period water take report 2012‒13 to 2015‒16
Page 107
7.6.2. Transitional assessment — Groundwater
Appendix 2 shows the transitional annual credits and the transitional adjusted cumulative balance
for each groundwater SDL resource unit.
As discussed in section 7.5, for the purpose of the trial of the SDL water accounting and
compliance framework, annual permitted take for groundwater is being set at the relevant TDL.
Table 29 shows Basin scale TDL / annual permitted take, annual actual take, annual credits and
cumulative balance for groundwater across the four years of the reporting period.
Actual take in most groundwater SDL resource units was below permitted take in all years.
Across the 81 groundwater SDL resource units, there were only seven instances among the 324
assessments of take where annual actual take exceeded annual permitted take.
There was only one groundwater SDL resource unit where the cumulative debit exceeded 20%
over the reporting period. This was the Lower Gwydir Alluvium SDL resource unit in New South
Wales.
Table 29 Basin scale groundwater TDL/permitted take, annual actual take, transitional annual credits and TDL cumulative balance for 2012–13 to 2015–16. All values in GL.
2012-13 2013-14 2014-15 2015-16
TDL/permitted take 3,451 3,427 3,403 3,378
Actual take 1,231 1,398 1,556 1,535
Annual credit 2,220 2,030 1,846 1,843
TDL cumulative balance 2,220 4,249 6,096 7,939
In the New South Wales Lower Gwydir Alluvium SDL resource unit, annual actual take was
greater than the permitted take in 2013–14, 2014–15 and 2015–16. New South Wales has
advised MDBA that the current levels of annual actual take in this resource unit are being
managed within the compliance rules for the NSW long-term average annual extraction limit
(state plan limit) under existing state legislative arrangements.
Under these existing state arrangements, carryover of allocations in licence holders’ accounts
were available to use in these years and users legally extracted volumes within their account
rules (refer Appendix 2, column headed ‘Actual Take / (Allocation + Carry Over)’, which presents
actual use compared with the allocation and carryover available in this SDL resource unit).
For the purpose of transitional water take reports, the MDBA has set the permitted take equal to
the long-term average SDL, or where a state plan provides for higher diversions, the permitted
take is equal to the state plan limit (refer Section 7.4). This is the approach adopted for all
groundwater SDL units in this transitional period as a ‘road test’.
In the Lower Gwydir Alluvium for the first three years of the reporting period, the state plan limit is
used as permitted take. There were progressive reductions in the plan limit through to June 2015,
after which time the state plan limit is equal to the Basin Plan SDL.
The cumulative balance of actual take against the permitted take is –8.1 GL at the end of
2014–15 and -10.6 GL at the end of 2015–16. This corresponds to a cumulative debit of 23% and
32%, respectively. This is a situation that, if it were to occur under the Register of Take after

Transition period water take report 2012‒13 to 2015‒16
Page 108
2019, would require NSW to provide a reasonable excuse for this situation or be found to be non-
compliant with the SDL.
Further analysis indicates that once the reporting period includes data from 2016–17 (the NSW
Water Register reports actual take of 23.1 GL, which results in an estimated annual credit of
9.9 GL), the cumulative balance will return to a debit of less than 20% as of June 2017
(estimated cumulative balance of –0.7 GL or –2%).
All states will need to take account of the changes in annual actual take from SDL resource units
in the development of the method for determining annual permitted take that will be applied in the
relevant water resource plan.
Figure 23 Groundwater Basin scale transitional diversion limit, annual actual take, and annual credits and cumulative balance 2012–13 to 2015–16
0
1,000
2,000
3,000
4,000
5,000
6,000
7,000
8,000
9,000
2012-13 2013-14 2014-15 2015-16
Vo
lum
e (G
L)
Water Year
Annual credit SDL
BDL TDL
Actual take TDL Cumulative Credits

Transition period water take report 2012‒13 to 2015‒16
Page 109
Part 3:
Environmental water availability and use

Transition period water take report 2012‒13 to 2015‒16
Page 110
8. Environmental water
In line with objective 1 of the trial of the SDL water accounting and compliance framework, Part 3
of this report sets out information about environmental water as reported to the MDBA in
accordance with s.32 of the Water Act 2007 (Cth) and Matter 9 of Schedule 12 of the
Basin Plan. These provisions are reproduced in full below and the relevant sub-provision appears
at the beginning of the section that presents the information reported against it.
Water Act 2007— Part 2 — Division 1 Subdivision C — Environmental management
s.32 Authority to identify and account for held environmental water
The Authority must identify and account for held environmental water in the Murray–Darling Basin for each financial year.
Basin Plan 2012 — Schedule 12 – Matters for evaluation and reporting requirements
Matter 9 – The identification of environmental water and the monitoring of its use
Matter 9.1 Volume of water available for the identification and accounting of held environmental water (HEW)
Matter 9.1.1 Volume of HEW entitlements by SDL resource unit
Matter 9.1.2 Carryover and forfeiture of HEW by SDL resource unit
Matter 9.1.3 Volume of HEW used by SDL resource unit
Matter 9.2 – volume of planned environmental water available
Matter 9.2.1 Volume of PEW by WRP Area
This part of the report (Part 3) identifies and accounts for held environmental water in the Murray–Darling Basin for each water year. Information is provided for each year of the reporting period and detailed reporting commences with the 2013–14 water year. This section also makes general reference to the identification of planned environmental water in the Basin.
Water used for environmental purposes is referred to as environmental water. The Water Act (sections 4 and 6) and the Basin Plan recognise two types of environmental water: held environmental water (HEW), and planned environmental water (PEW).
Held environmental water (HEW) is defined as water available under water access rights, water delivery rights and irrigation rights that is used for environmental purposes. Typically, water rights owned by an environmental water holder, such as the Commonwealth Environmental Water Holder (CEWH), are referred to as HEW entitlements and contribute to the majority of the HEW available.
By distinction, planned environmental water (PEW) is environmental water that is generally not callable or associated with any water access rights.

Transition period water take report 2012‒13 to 2015‒16
Page 111
There are some exceptions in New South Wales where PEW exists in the form of environmental water allowances in particular valleys. These exist as volumes in storage that may be called in certain circumstances. PEW is discussed in more detail at the end of this section.
The Basin Plan requires a reduction in long-term average consumptive surface water diversions
to achieve the basin wide sustainable diversion limit (SDL) of 10,873 GL. The reduction amount
is currently a long-term average volume of 2,750 GL and is in addition to HEW that has been
recovered for environmental use prior to 30 June 2009.22 The volume of the reduction amount is
to be made available to achieve the environmental objectives of the Basin Plan.
The Australian Government has committed to secure the reduction amount to achieve the SDL
through the recovery of water entitlements that will be registered as HEW and owned by the
Commonwealth Environmental Water Holder. This commitment has been made to avoid any
impacts on consumptive entitlement holders associated with the reduction in the size of the
consumptive pool.
The recovery of entitlements has been prioritised through investment in on- and off-farm irrigation
infrastructure projects rather than through the purchase of entitlements. As part of this approach,
non-strategic entitlement purchase has been capped at 1,500 GL.
It is important to note that registered HEW entitlements retain the same characteristics as the
consumptive entitlements from which they are sourced. For example, a New South Wales Murray
general security entitlement registered as HEW will have the same characteristics in terms of
access rules, fees, charges and tradability as the original New South Wales Murray general
security entitlement previously registered as a consumptive entitlement.
Like consumptive water, a portion of HEW is held in the storages and represents the water
allocated to water entitlements that are owned by the various environmental water holders. Like
irrigation water, this HEW remains in storage until called upon by the relevant Basin state to meet
orders submitted by its owners for use at environmental sites. This water is subject to the same
storage rules, storage losses, carryover and forfeit rules as consumptive water held in the
storage.
8.1. Determining the long-term average annual volume of HEW
For reporting of HEW entitlements, both the water share volume and a long-term annual average
use volume is shown.
The long-term annual average use volume is derived using long-term diversion limit equivalence
(LTDLE) factors. These are also known as Cap factors. To derive the long-term annual average
volume of an entitlement the water share value is multiplied by the LTDLE factor to give the
long-term annual average volume.
For example, if an entitlement has a 50 ML water share value and a LTDLE factor of 0.9, the
long-term annual average volume of the entitlement is 50 x 0.9 = 45 ML.
LTDLE factors enable differing entitlements across the Basin to be converted into a common
currency to allow for direct comparison between products with differing reliability and expected
22 This volume is subject to change through amendments to the Basin Plan arising from the northern Basin Review and the operation
of SDL adjustment mechanism.

Transition period water take report 2012‒13 to 2015‒16
Page 112
usage under the rules of the relevant water sharing arrangements. LTDLE factors are used to
estimate the volume of water recovered to ‘bridge the gap’.
In surface water there is a unique LTDLE factor for each class of entitlement in each SDL
resource unit. In groundwater, entitlements associated with HEW have been assumed for the
purpose of this report to have an LTDLE factor of 1.00, therefore the entitlement volume equals
the long-term diversion limit equivalent volume.
The LTDLE factors that are currently being used to estimate the volume of water recovery to
bridge the gap and that have been used to determine the LTDLE volumes in this report, are
those adopted by the Murray–Darling Basin Ministerial Council in November 2011. The MDBA
expects that LTDLE factors will change due to refinements in their estimation that emerge as
Basin states bring forward their water resource plans for accreditation or earlier, through the
‘planning assumptions’ process agreed by Ministerial Council in 2015. This will in turn change the
estimates of progress in water recovery towards bridging the gap.
Changes to LTDLE factors may occur because the water resource plans will reflect the best
available information about such things as the forecast utilisation of entitlements by various users
and the forecast impact of any new or changed water sharing rules introduced by Basin states.
Water resource plans must also use the Basin Plan historical climate conditions (1895 to 2009)
as the basis for modelling water availability and this differs from the periods used for some of the
2011 factors.
The ‘planning assumptions’ process agreed by Ministerial Council allowed each state to identify
and provide to the MDBA relevant ‘planning assumptions’ that would support each state’s
proposed water resource plans. The assumptions include proposed methods that would be used
to inform the demonstration of SDL compliance in each SDL resource unit. The planning
assumptions enable the calculation of a set of LTDLE factors for the period that the water
resource plan operates, and this in turn informs the Australian Government’s water recovery
strategy.
8.2. Commencement of environmental water data reporting
2013–14 was the first year Basin states and the Commonwealth Environmental Water Holder
commenced reporting environmental water data in accordance with Basin Plan requirements.
Noting this is the first set of Basin-wide HEW accounts that have been prepared, further
improvements are expected over time. Other calculations, including annual permitted take
estimates that rely upon HEW data may also be refined and improve over time too.
The seven-year transition period from 2012 to 2019 allows these issues to be identified and
addressed before compliance commences on 1 July 2019. In addition, there may be
improvements in Basin state reporting of the volume of HEW authorised, used, carried over and
forfeited.

Transition period water take report 2012‒13 to 2015‒16
Page 113
8.3. Available held environmental water entitlements
Matter 9.1 Volume of water available for the identification and accounting of held environmental water (HEW)
Total available HEW is made up of three components of water recovery:
1. Entitlements recovered prior to the Basin Plan and/or entitlements recognised as providing
environmental benefits when the baseline diversion limit was set.
2. Entitlements recovered after the baseline diversion limit was established that are not gap-
bridging because they were not previously part of consumptive water (e.g. evaporation
savings).
3. Entitlements recovered to bridge the gap between baseline diversion limit to the SDL
(currently a long-term average annual target of 2,750 GL).
Due to the nature of water recovery projects — especially those incorporating significant
infrastructure upgrades or renewals — progress in water recovery does not proceed regularly.
From investment to realisation of the savings takes time, sometimes in the order of five or more
years. There are a number of water recovery projects still underway which are expected to
deliver HEW entitlements in the near future. These contribute to bridging the gap.
In terms of describing total HEW recovery and progress towards achieving the current Basin Plan
reduction amount of 2,750 GL/y, the following terms are used:
HEW ‘contracted’, and
HEW ‘available’.
HEW ‘contracted’ refers to entitlements secured under contracts but not yet transferred from the
current owner to the relevant environmental water holder.
HEW ‘available’ refers to entitlements that have been transferred to the ownership of the relevant
environmental water holder and are available for use.
Contracted HEW is reported by the MDBA in conjunction with the Department of Agriculture and
Water Resources on a quarterly basis. Information on these quarterly updates are available at
http://www.mdba.gov.au/managing-water/environmental-water/progress-water-recovery. These
impending HEW entitlements are listed in the HEW register maintained by the MDBA when the
entitlement becomes ‘available’.
This part of the report discusses HEW available and not HEW contracted.
8.4. Surface water HEW
8.4.1. Surface water HEW available
Section 32 of the Water Act requires the MDBA to identify and account for all HEW in the Murray–Darling Basin. To meet this obligation, Basin states and the Commonwealth Environmental Water Holder report annually on existing and newly obtained HEW entitlements.

Transition period water take report 2012‒13 to 2015‒16
Page 114
Over the reporting period, total surface water HEW available has increased by 907 GL in
long-term diversion limit equivalence (LTDLE) terms from 1,880 GL at 30 June 2012 to 2,787 GL
at 30 June 2016.
Reporting of surface water HEW entitlements over this period has improved. Basin states have
reviewed their entitlements to confirm with greater certainty that individual entitlements are being
used for environmental outcomes. Basin states have also identified some additional HEW
entitlements that existed at baseline, or generally at 30 June 2009, that were not previously
recognised as HEW.
The HEW register is a formal database, maintained by the MDBA to meet the requirements of the
Water Act and the Basin Plan. It records all HEW entitlements registered in the Basin and is the
source of all volumes presented in this report.
The total volume of surface water HEW entitlements held at each 30 June over the period 2012
to 2016 is shown in Table 30. This table shows all surface water HEW entitlements in the Basin
including those entitlements that were HEW before the Basin Plan commenced and those that
have been acquired since it commenced.

Transition period water take report 2012‒13 to 2015‒16
Page 115
Table 30 Total surface water held environmental water (HEW) entitlements available as at 30 June for the period 2012 to 2016
2012 2013 2014 2015 2016
SDL resource unit
HEW entitleme
nts (GL)
long-term HEW (GL -
LTDLE)
HEW entitleme
nts (GL)
long-term HEW (GL -
LTDLE)
HEW entitleme
nts (GL)
long-term HEW (GL -
LTDLE)
HEW entitleme
nts (GL)
long-term HEW (GL -
LTDLE)
HEW entitleme
nts (GL)
long-term HEW (GL -
LTDLE)
Queensland
Paroo 0.0 0.0 0.0 0.0 0.0 0.0 0.0 0.0 0.0 0.0
Warrego 16.1 8.0 16.1 8.0 16.1 8.0 16.1 8.0 16.1 8.0
Unsupplemented 16.1 8.0 16.1 8.0 16.1 8.0 16.1 8.0 16.1 8.0
Nebine 5.9 1.0 5.9 1.0 5.9 1.0 5.9 1.0 5.9 1.0
Unsupplemented 5.9 1.0 5.9 1.0 5.9 1.0 5.9 1.0 5.9 1.0
Condamine-Balonne 35.0 23.1 49.6 34.6 57.4 40.3 85.3 53.8 89.8 57.1
Medium 0.0 0.0 0.0 0.0 0.1 0.0 0.1 0.0 0.1 0.0
Unsupplemented 35.0 23.1 49.6 34.6 57.3 40.2 62.1 43.7 66.6 47.0
Overland flow licence 0.0 0.0 0.0 0.0 0.0 0.0 23.2 10.0 23.2 10.0
Moonie 1.4 1.1 1.4 1.1 1.4 1.1 1.4 1.1 1.4 1.1
Unsupplemented 1.4 1.1 1.4 1.1 1.4 1.1 1.4 1.1 1.4 1.1
Queensland Border Rivers 11.8 4.2 16.0 5.8 18.3 6.6 23.4 8.5 32.7 12.2
Medium 10.6 3.6 11.7 4.0 13.8 4.7 15.5 5.2 15.5 5.2
Unsupplemented 1.2 0.6 4.3 1.8 4.5 1.9 7.9 3.2 17.2 7.0
Queensland total 70.2 37.4 89.0 50.4 99.1 56.9 132.1 72.3 145.9 79.4
New South Wales
NSW Border Rivers 0.3 0.1 0.3 0.1 0.4 0.2 0.4 0.2 3.0 1.0
General security B 0.3 0.1 0.3 0.1 0.4 0.2 0.4 0.2 1.7 0.7
Supplementary Access 0.0 0.0 0.0 0.0 0.0 0.0 0.0 0.0 1.3 0.4
Intersecting Streams 8.1 8.1 17.8 17.8 17.8 17.8 17.8 17.8 17.8 17.8
Unregulated 8.1 8.1 8.1 8.1 8.1 8.1 8.1 8.1 8.1 8.1
Unregulated - special additional high flow
0.0 0.0 9.7 9.7 9.7 9.7 9.7 9.7 9.7 9.7
Gwydir 126.5 42.5 126.5 42.5 130.5 44.2 136.0 48.6 136.0 48.6
High security 0.4 0.4 0.4 0.4 1.6 1.6 5.8 5.8 5.8 5.8
General security 106.6 38.4 106.6 38.4 106.6 38.4 106.6 38.4 106.6 38.4

Transition period water take report 2012‒13 to 2015‒16
Page 116
2012 2013 2014 2015 2016
SDL resource unit
HEW entitleme
nts (GL)
long-term HEW (GL -
LTDLE)
HEW entitleme
nts (GL)
long-term HEW (GL -
LTDLE)
HEW entitleme
nts (GL)
long-term HEW (GL -
LTDLE)
HEW entitleme
nts (GL)
long-term HEW (GL -
LTDLE)
HEW entitleme
nts (GL)
long-term HEW (GL -
LTDLE)
Supplementary Access 19.5 3.7 19.5 3.7 22.2 4.2 23.6 4.5 23.6 4.5
Namoi 6.2 4.8 6.3 4.9 8.2 6.3 9.9 7.6 10.8 8.3
General security 6.2 4.8 6.3 4.9 8.2 6.3 9.9 7.6 10.8 8.3
Macquarie-Castlereagh 129.9 53.9 148.0 61.5 181.2 75.1 187.3 77.3 187.3 77.3
General security 126.6 53.2 144.7 60.8 170.5 71.6 174.6 73.4 174.6 73.4
Supplementary Access 3.3 0.7 3.3 0.7 7.7 1.6 9.7 2.1 9.7 2.1
Unregulated 0.0 0.0 0.0 0.0 2.9 1.9 2.9 1.9 2.9 1.9
Lachlan 124.5 53.3 125.4 53.8 126.2 54.6 126.2 54.6 126.2 54.6
High security 1.7 1.7 1.9 1.9 2.7 2.7 2.7 2.7 2.7 2.7
General security 122.8 51.6 123.5 51.9 123.5 51.9 123.5 51.9 123.5 51.9
Murrumbidgee 442.7 291.3 486.7 321.1 1,037.3 577.5 1,062.6 595.9 1,078.3 607.0
High security 38.1 36.2 40.8 38.7 41.8 39.7 44.2 42.0 44.4 42.2
General security 347.2 221.8 386.0 246.6 394.1 251.8 412.2 263.4 421.5 269.3
Coleambally Irrigation Conveyance 9.2 8.8 10.6 10.1 12.3 11.7 12.4 11.8 12.6 12.0
Murrumbidgee Irrigation Conveyance 20.6 19.8 21.8 21.0 26.2 25.2 31.0 29.7 35.7 34.2
Regulated River Conveyance 1.0 1.0 1.0 1.0 1.0 1.0 1.0 1.0 1.0 1.0
Supplementary Access 26.5 3.7 26.5 3.7 26.5 3.7 26.5 3.7 27.7 3.9
Supplementary Access (Lowbidgee) 0.0 0.0 0.0 0.0 529.1 240.2 529.1 240.2 529.1 240.2
Unregulated 0.0 0.0 0.0 0.0 6.3 4.2 6.3 4.2 6.3 4.2
Barwon-Darling Watercourse 22.3 22.3 22.3 22.3 23.8 23.8 25.8 25.8 28.3 28.3
Unregulated 22.3 22.3 0.0 0.0 1.5 1.5 1.5 1.5 1.5 1.5
Unregulated (A class) 0.0 0.0 0.1 0.1 0.1 0.1 0.1 0.1 0.1 0.1
Unregulated (B class) 0.0 0.0 10.8 10.8 10.8 10.8 11.8 11.8 14.3 14.3
Unregulated (C class) 0.0 0.0 11.5 11.5 11.5 11.5 12.5 12.5 12.5 12.5
Lower Darling 298.8 71.0 298.8 71.0 299.5 71.6 299.5 71.6 301.0 72.8
High security 0.5 0.5 0.5 0.5 0.9 0.8 0.9 0.8 1.0 0.9
General security 48.3 47.4 48.3 47.4 48.6 47.6 48.6 47.6 50.0 48.8
Supplementary Access 250.0 23.1 250.0 23.1 250.0 23.1 250.0 23.1 250.0 23.1
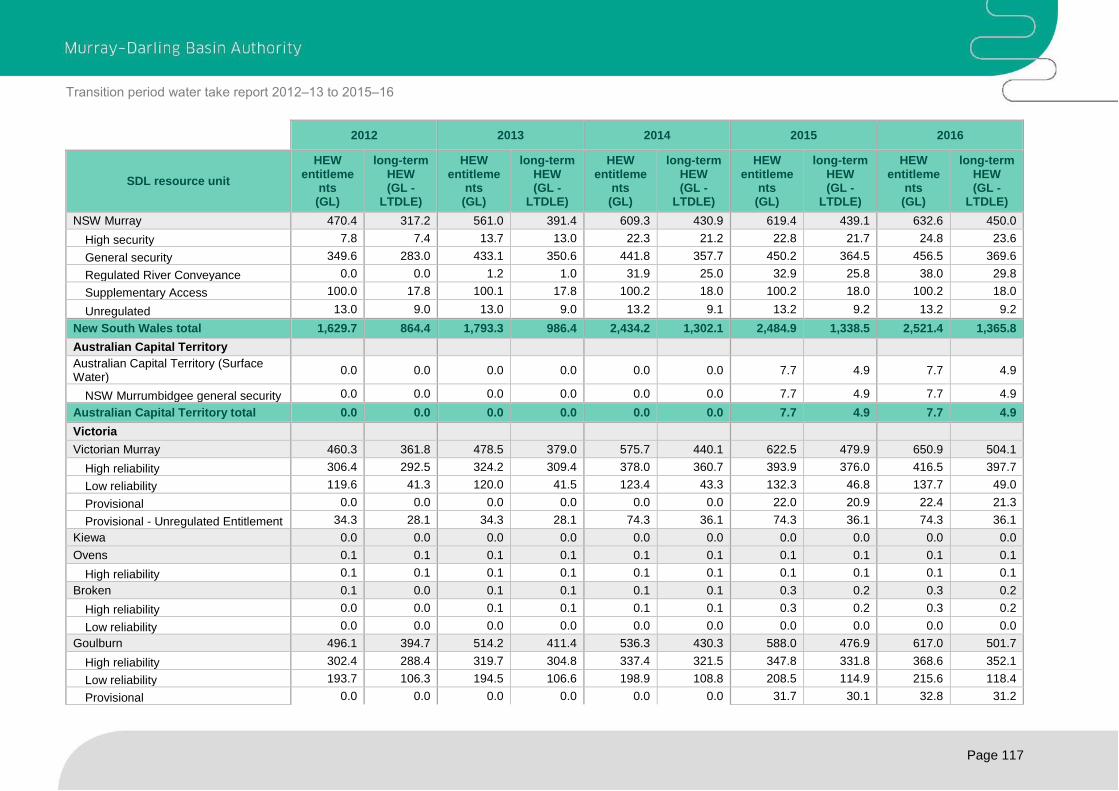
Transition period water take report 2012‒13 to 2015‒16
Page 117
2012 2013 2014 2015 2016
SDL resource unit
HEW entitleme
nts (GL)
long-term HEW (GL -
LTDLE)
HEW entitleme
nts (GL)
long-term HEW (GL -
LTDLE)
HEW entitleme
nts (GL)
long-term HEW (GL -
LTDLE)
HEW entitleme
nts (GL)
long-term HEW (GL -
LTDLE)
HEW entitleme
nts (GL)
long-term HEW (GL -
LTDLE)
NSW Murray 470.4 317.2 561.0 391.4 609.3 430.9 619.4 439.1 632.6 450.0
High security 7.8 7.4 13.7 13.0 22.3 21.2 22.8 21.7 24.8 23.6
General security 349.6 283.0 433.1 350.6 441.8 357.7 450.2 364.5 456.5 369.6
Regulated River Conveyance 0.0 0.0 1.2 1.0 31.9 25.0 32.9 25.8 38.0 29.8
Supplementary Access 100.0 17.8 100.1 17.8 100.2 18.0 100.2 18.0 100.2 18.0
Unregulated 13.0 9.0 13.0 9.0 13.2 9.1 13.2 9.2 13.2 9.2
New South Wales total 1,629.7 864.4 1,793.3 986.4 2,434.2 1,302.1 2,484.9 1,338.5 2,521.4 1,365.8
Australian Capital Territory
Australian Capital Territory (Surface Water)
0.0 0.0 0.0 0.0 0.0 0.0 7.7 4.9 7.7 4.9
NSW Murrumbidgee general security 0.0 0.0 0.0 0.0 0.0 0.0 7.7 4.9 7.7 4.9
Australian Capital Territory total 0.0 0.0 0.0 0.0 0.0 0.0 7.7 4.9 7.7 4.9
Victoria
Victorian Murray 460.3 361.8 478.5 379.0 575.7 440.1 622.5 479.9 650.9 504.1
High reliability 306.4 292.5 324.2 309.4 378.0 360.7 393.9 376.0 416.5 397.7
Low reliability 119.6 41.3 120.0 41.5 123.4 43.3 132.3 46.8 137.7 49.0
Provisional 0.0 0.0 0.0 0.0 0.0 0.0 22.0 20.9 22.4 21.3
Provisional - Unregulated Entitlement 34.3 28.1 34.3 28.1 74.3 36.1 74.3 36.1 74.3 36.1
Kiewa 0.0 0.0 0.0 0.0 0.0 0.0 0.0 0.0 0.0 0.0
Ovens 0.1 0.1 0.1 0.1 0.1 0.1 0.1 0.1 0.1 0.1
High reliability 0.1 0.1 0.1 0.1 0.1 0.1 0.1 0.1 0.1 0.1
Broken 0.1 0.0 0.1 0.1 0.1 0.1 0.3 0.2 0.3 0.2
High reliability 0.0 0.0 0.1 0.1 0.1 0.1 0.3 0.2 0.3 0.2
Low reliability 0.0 0.0 0.0 0.0 0.0 0.0 0.0 0.0 0.0 0.0
Goulburn 496.1 394.7 514.2 411.4 536.3 430.3 588.0 476.9 617.0 501.7
High reliability 302.4 288.4 319.7 304.8 337.4 321.5 347.8 331.8 368.6 352.1
Low reliability 193.7 106.3 194.5 106.6 198.9 108.8 208.5 114.9 215.6 118.4
Provisional 0.0 0.0 0.0 0.0 0.0 0.0 31.7 30.1 32.8 31.2

Transition period water take report 2012‒13 to 2015‒16
Page 118
2012 2013 2014 2015 2016
SDL resource unit
HEW entitleme
nts (GL)
long-term HEW (GL -
LTDLE)
HEW entitleme
nts (GL)
long-term HEW (GL -
LTDLE)
HEW entitleme
nts (GL)
long-term HEW (GL -
LTDLE)
HEW entitleme
nts (GL)
long-term HEW (GL -
LTDLE)
HEW entitleme
nts (GL)
long-term HEW (GL -
LTDLE)
Campaspe 12.0 9.3 12.0 9.4 35.7 32.0 35.7 32.0 35.7 32.0
High reliability 6.5 6.2 6.6 6.3 25.7 24.6 25.7 24.6 25.7 24.6
High reliability/fixed annual losses 0.0 0.0 0.0 0.0 1.7 1.7 1.7 1.7 1.7 1.7
Low reliability 5.4 3.1 5.4 3.1 8.4 5.8 8.4 5.8 8.4 5.8
Loddon 13.4 10.9 13.4 10.9 17.0 14.3 17.4 14.7 17.4 14.7
High reliability 10.7 10.2 10.7 10.2 14.3 13.6 14.8 14.1 14.8 14.1
Low reliability 2.6 0.7 2.6 0.7 2.6 0.7 2.6 0.7 2.6 0.7
Provisional - Regulated Entitlement 0.1 0.0 0.1 0.0 0.1 0.0 0.1 0.0 0.1 0.0
Wimmera-Mallee (Surface Water) 40.6 38.2 68.6 60.8 69.6 61.8 69.6 61.8 69.6 61.8
Irrigation product including losses 0.0 0.0 28.0 22.6 28.0 22.6 28.0 22.6 28.0 22.6
Wetlands 0.0 0.0 0.0 0.0 1.0 0.9 1.0 0.9 1.0 0.9
Wimmera Mallee Pipeline Product 40.6 38.2 40.6 38.2 40.6 38.2 40.6 38.2 40.6 38.2
Victoria total 1,022.5 815.1 1,086.8 871.7 1,234.4 978.7 1,333.6 1,065.6 1,390.9 1,114.6
South Australia
SA Murray 175.9 163.5 187.3 174.0 207.4 192.9 222.4 206.4 239.9 222.2
Class 1 0.1 0.1 0.1 0.1 0.1 0.1 0.1 0.1 0.1 0.1
Class 3a / 3b 106.7 96.1 115.6 104.0 127.5 114.7 142.5 128.2 160.0 144.0
Class 4 0.1 0.1 37.3 0.1 0.1 0.1 0.1 0.1 0.1 0.1
Class 7 37.3 35.6 34.2 35.6 37.3 35.6 37.3 35.6 37.3 35.6
Class 9 31.7 31.8 34.2 34.2 42.5 42.5 42.5 42.5 42.5 42.5
SA Non-Prescribed Areas 0.0 0.0 0.0 0.0 0.0 0.0 0.0 0.0 0.0 0.0
Marne Saunders 0.0 0.0 0.0 0.0 0.0 0.0 0.0 0.0 0.0 0.0
Eastern Mount Lofty Ranges 0.0 0.0 0.0 0.0 0.0 0.0 0.0 0.0 0.0 0.0
South Australia total 175.9 163.5 187.3 174.0 207.4 192.9 222.4 206.4 239.9 222.2
Basin total 2,898.3 1,880.4 3,156.3 2,082.5 3,975.1 2,530.5 4,180.6 2,687.8 4,305.7 2,786.9

Transition period water take report 2012‒13 to 2015‒16
Page 119
Table 30 shows the NSW Intersecting Streams SDL resource unit has an estimated recovery of
17 GL LTDLE. This figure is based on the entitlements recovered and a LTDLE factor of 1.00.
There is some doubt about this value, as the reported diversions over the Cap reporting period
remained static at 3 GL/y for over 20 years. In addition, the Authority estimated the baseline
watercourse diversions as 3 GL/y in determining the SDLs for the Basin Plan.
Therefore, whilst there are entitlements that can be utilised by the HEW owner, the long-term
value associated with these entitlements will require further work by New South Wales. These
values are not used in calculations to determine the TDL or permitted take in this report. Further
work is required to improve the understanding of actual diversions in this SDL resource unit and
determine an appropriate LTDLE to recognise recoveries in the NSW Intersecting Streams.
HEW entitlements are largely generated from water recovery programs funded by the Australian
Government and /or Basin state governments. Water recovery programs commenced in the early
2000s and include:
Pre-Basin Plan water recovery programs or pre-existing environmental water
o Water for Rivers – 228 GL LTDLE HEW. This returns 158 GL to the Snowy River
and 70 GL HEW for the River Murray
o The Living Murray initiative – 488 GL LTDLE HEW for the River Murray
o Victorian government initiatives – 76 GL LTDLE HEW (75 GL for Wimmera–Mallee
and 1 GL for the Loddon)
o South Australian class 9 wetlands entitlement – 34 GL LTDLE HEW
o New South Wales initiatives – 99 GL LTDLE HEW (72 GL for the Murrumbidgee,
25 GL for the Murray and 2 GL for the Macquarie)
o NSW Murrumbidgee pre-existing environmental water – 40 GL LTDLE
o establishing consumptive limits, lower than Cap, in some NSW water sharing
plans – contributing 241 GL LTDLE for a lower consumptive limit rather than
creating HEW
Bridging the gap programs under the Basin Plan
o Australian Government led Sustainable Rural Water Use and Infrastructure
Program (SRWIUP)
o Other initiatives including water gifted to the Australian Government and state
based recovery programs
As shown in Figure 24, HEW entitlements have been progressively recovered since 2004 to meet
the requirements of state based programs and those of the Basin Plan recovery target. With the
commencement of reporting HEW entitlements for the purpose of this report from 2013–14, data
from this time forward incorporates pre-existing HEW that was captured in this data.
The rate of increase in HEW entitlements has slowed over the last three years as the remaining
gap to achieving the water recovery target draws closer.

Transition period water take report 2012‒13 to 2015‒16
Page 120
SRWUIP refers to the Australian Government Sustainable Rural Water Use and Infrastructure Program. State recoveries include programs such as New South Wales Riverbank and other small recoveries
Figure 24 Total available held environmental water (HEW) entitlements as at 30 June by recovery program for the period 2004 to 2016.
HEW entitlements are typically transferred or recognised once the program or stages of the
program are finished and the water savings or purchases are confirmed and the HEW entitlement
is owned by an environmental manager, for example Commonwealth Environmental Water
Holder or Victorian Environmental Water Holder.
There are a range of owners of HEW entitlements, reflecting the investment history in
environmental water. HEW entitlement holders in the Basin include:
Commonwealth Environmental Water Holder (CEWH)
State governments o Victorian Environmental Water Holder (VEWH) o various New South Wales state government agencies o South Australian Minister for Water and the River Murray
other private organisations
0
500
1,000
1,500
2,000
2,500
3,000
2004 2005 2006 2007 2008 2009 2010 2011 2012 2013 2014 2015 2016
Vo
lum
e (L
TDLE
-G
L)
Water Year - as at 30 June
Water for Rivers The Living Murray
SRWUIP - Purchases SRWUIP - Infrastructure
Other - including state recoveries Total HEW

Transition period water take report 2012‒13 to 2015‒16
Page 121
*Various New South Wales state government agencies
** HEW volume held by other private organisations is 3 GL LTDLE and is too small to appear in this chart
Figure 25 Proportions of total HEW available as owned by the different environmental water holders (volumes in GL LTDLE)
As shown in Figure 25, the CEWH holds the largest volume of HEW entitlements in the Basin
(60%). This reflects the significant Australian Government investment in water recovery. The
CEWH holds HEW entitlements in all Basin states, including HEW recovered for meeting the
shared reduction target of 4.9 GL/y in the ACT. The Queensland government does not own any
HEW entitlements, instead HEW in Queensland is owned and managed by the CEWH.
Figure 26 shows that as at 30 June 2016, the majority of the HEW entitlements are located in
New South Wales and Victoria.
MDBA, 45 GL, 2%
CEWH, 1,684 GL, 60%
VEWH, 475 GL, 17%
Other**, 3 GL, 0%
NSW*, 503 GL, 18%
SA Water Minister, 77 GL, 3%
MDBA CEWH VEWH Other** NSW* SA Water Minister
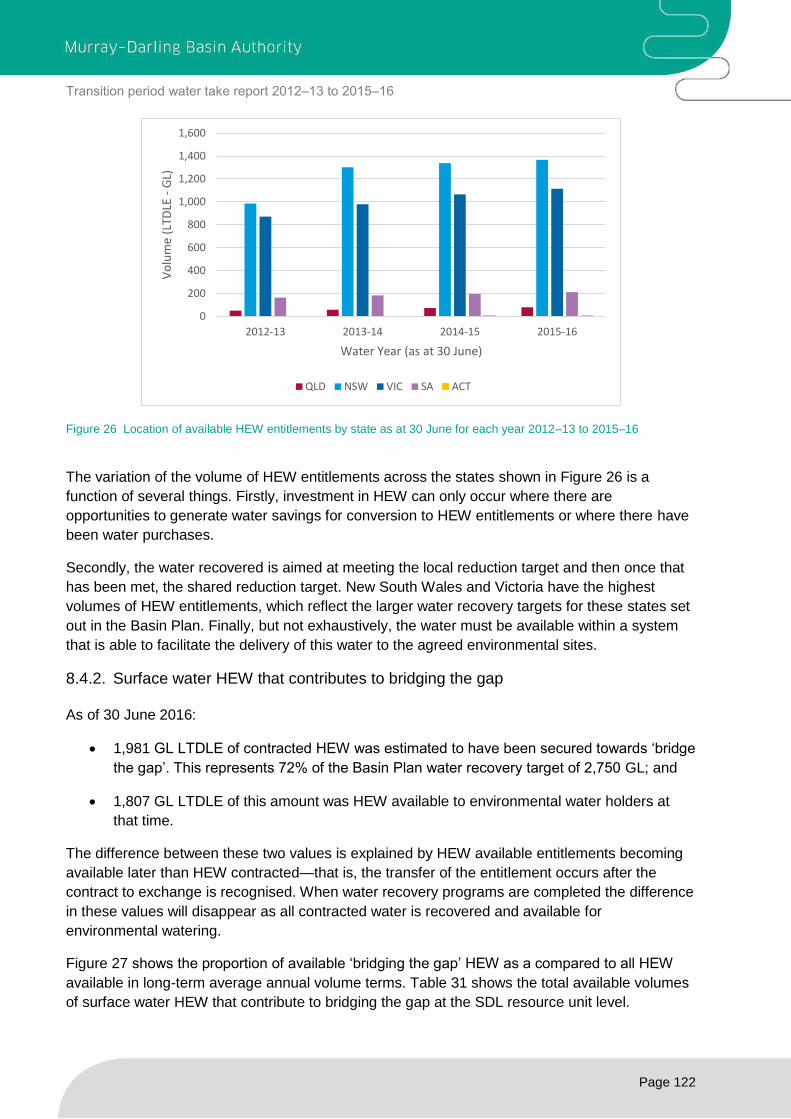
Transition period water take report 2012‒13 to 2015‒16
Page 122
Figure 26 Location of available HEW entitlements by state as at 30 June for each year 2012–13 to 2015–16
The variation of the volume of HEW entitlements across the states shown in Figure 26 is a
function of several things. Firstly, investment in HEW can only occur where there are
opportunities to generate water savings for conversion to HEW entitlements or where there have
been water purchases.
Secondly, the water recovered is aimed at meeting the local reduction target and then once that
has been met, the shared reduction target. New South Wales and Victoria have the highest
volumes of HEW entitlements, which reflect the larger water recovery targets for these states set
out in the Basin Plan. Finally, but not exhaustively, the water must be available within a system
that is able to facilitate the delivery of this water to the agreed environmental sites.
8.4.2. Surface water HEW that contributes to bridging the gap
As of 30 June 2016:
1,981 GL LTDLE of contracted HEW was estimated to have been secured towards ‘bridge
the gap’. This represents 72% of the Basin Plan water recovery target of 2,750 GL; and
1,807 GL LTDLE of this amount was HEW available to environmental water holders at
that time.
The difference between these two values is explained by HEW available entitlements becoming
available later than HEW contracted—that is, the transfer of the entitlement occurs after the
contract to exchange is recognised. When water recovery programs are completed the difference
in these values will disappear as all contracted water is recovered and available for
environmental watering.
Figure 27 shows the proportion of available ‘bridging the gap’ HEW as a compared to all HEW
available in long-term average annual volume terms. Table 31 shows the total available volumes
of surface water HEW that contribute to bridging the gap at the SDL resource unit level.
0
200
400
600
800
1,000
1,200
1,400
1,600
2012-13 2013-14 2014-15 2015-16
Vo
lum
e (L
TDLE
-G
L)
Water Year (as at 30 June)
QLD NSW VIC SA ACT

Transition period water take report 2012‒13 to 2015‒16
Page 123
Figure 27 Bridging the gap ‘available’ HEW as compared to the of total ‘available’ HEW as at 30 June 2012–13 to 2015–16
0
500
1,000
1,500
2,000
2,500
3,000
2012-13 2013-14 2014-15 2015-16
Vo
lum
e (L
TDLE
-G
L)
Water Year
Total HEW Entitlements HEW BtG entitlements

Transition period water take report 2012‒13 to 2015‒16
Page 124
Table 31 Total surface water HEW that contributes to ‘bridging the gap’ as at 30 June for the period 2012 to 2016
2012 2013 2014 2015 2016
Surface water SDL resource unit
HEW entitlement
s (GL)
long-term HEW (GL -
LTDLE)
HEW entitlement
s (GL)
long-term HEW (GL -
LTDLE)
HEW entitlement
s (GL)
long-term HEW (GL -
LTDLE)
HEW entitlement
s (GL)
long-term HEW (GL -
LTDLE)
HEW entitlement
s (GL)
long-term HEW (GL -
LTDLE)
Queensland
Paroo 0.0 0.0 0.0 0.0 0.0 0.0 0.0 0.0 0.0 0.0
Warrego 16.1 8.0 16.1 8.0 16.1 8.0 16.1 8.0 16.1 8.0
Nebine 5.9 1.0 5.9 1.0 5.9 1.0 5.9 1.0 5.9 1.0
Condamine-Balonne 35.0 23.1 49.6 34.6 57.4 40.3 85.3 53.8 89.8 57.1
Moonie 1.4 1.1 1.4 1.1 1.4 1.1 1.4 1.1 1.4 1.1
Queensland Border Rivers 11.8 4.2 16.0 5.8 18.3 6.6 23.4 8.5 32.7 12.2
Queensland total 70.2 37.4 89.0 50.4 99.1 56.9 132.1 72.3 145.9 79.4
New South Wales
NSW Border Rivers 0.3 0.1 0.3 0.1 0.4 0.2 0.4 0.2 3.0 1.0
Intersecting Streams 8.1 8.1 17.8 17.8 17.8 17.8 17.8 17.8 17.8 17.8
Gwydir 126.5 42.5 126.5 42.5 126.5 42.5 132.0 46.9 132.0 46.9
Namoi 6.2 4.8 6.3 4.9 8.1 6.2 9.9 7.6 10.8 8.3
Macquarie-Castlereagh 129.9 53.9 148.0 61.5 178.3 73.2 184.4 75.4 184.4 75.4
Lachlan 112.5 48.3 113.4 48.8 114.2 49.6 114.2 49.6 114.2 49.6
Murrumbidgee 223.5 132.2 268.3 162.5 575.7 307.1 601.0 325.6 613.6 334.7
Barwon-Darling Watercourse 22.3 22.3 22.3 22.3 23.8 23.8 25.8 25.8 28.3 28.3
Lower Darling 0.5 0.4 0.5 0.4 1.2 1.0 1.2 1.0 2.7 2.2
NSW Murray 237.4 192.7 328.1 266.9 344.0 280.7 354.1 288.9 367.3 299.8
New South Wales total 867.2 505.2 1,031.6 627.6 1,390.0 802.1 1,440.9 838.7 1,474.2 864.0
Australian Capital Territory
Australian Capital Territory (Surface Water)
0.0 0.0 0.0 0.0 0.0 0.0 7.7 4.9 7.7 4.9
Australian Capital Territory total 0.0 0.0 0.0 0.0 0.0 0.0 7.7 4.9 7.7 4.9

Transition period water take report 2012‒13 to 2015‒16
Page 125
2012 2013 2014 2015 2016
Surface water SDL resource unit
HEW entitlement
s (GL)
long-term HEW (GL -
LTDLE)
HEW entitlement
s (GL)
long-term HEW (GL -
LTDLE)
HEW entitlement
s (GL)
long-term HEW (GL -
LTDLE)
HEW entitlement
s (GL)
long-term HEW (GL -
LTDLE)
HEW entitlement
s (GL)
long-term HEW (GL -
LTDLE)
Victoria
Victorian Murray 254.7 234.0 272.9 251.1 299.2 274.7 346.0 314.4 374.4 338.7
Kiewa 0.0 0.0 0.0 0.0 0.0 0.0 0.0 0.0 0.0 0.0
Ovens 0.1 0.1 0.1 0.1 0.1 0.1 0.1 0.1 0.1 0.1
Broken 0.1 0.1 0.1 0.1 0.1 0.1 0.3 0.2 0.3 0.2
Goulburn 230.0 211.4 248.0 228.1 269.6 246.4 321.3 293.0 350.2 317.8
Campaspe 6.8 6.3 6.9 6.4 30.6 29.0 30.6 29.0 30.6 29.0
Loddon 10.8 9.9 10.8 9.9 12.4 11.4 12.9 11.9 12.9 11.9
Wimmera-Mallee (Surface Water) 0.0 0.0 28.0 22.6 28.0 22.6 28.0 22.6 28.0 22.6
Victoria total 502.4 461.6 566.8 518.2 639.9 584.2 739.0 671.1 796.3 720.2
South Australia
SA Murray 100.3 90.2 109.1 98.2 121.0 108.9 136.0 122.4 153.5 138.2
SA Non-Prescribed Areas 0.0 0.0 0.0 0.0 0.0 0.0 0.0 0.0 0.0 0.0
Marne Saunders 0.0 0.0 0.0 0.0 0.0 0.0 0.0 0.0 0.0 0.0
Eastern Mount Lofty Ranges 0.0 0.0 0.0 0.0 0.0 0.0 0.0 0.0 0.0 0.0
South Australia total 100.3 90.2 109.1 98.2 121.0 108.9 136.0 122.4 153.5 138.2
Basin total 1,540.0 1,094.4 1,796.4 1,294.5 2,249.9 1,552.1 2,455.6 1,709.5 2,577.5 1,806.6

Transition period water take report 2012‒13 to 2015‒16
Page 126
8.4.3. Surface water HEW to determine the transitional diversion limit
As discussed in earlier sections, total available HEW is made up of three components of water
recovery:
1. Entitlements recovered prior to the Basin Plan and/or entitlements recognised as providing
environmental benefits when the baseline diversion limit was set.
2. Entitlements recovered after the baseline diversion limit was established that are not
gap-bridging because they were not previously part of consumptive water (e.g. evaporation
savings).
3. Entitlements recovered to bridge the gap between baseline diversion limit to the SDL
(currently a long-term average annual target of 2,750 GL).
The HEW entitlements used to determine the transitional diversional limit (TDL) are only those
associated with that component of total HEW available that is associated with water recovery to
bridge the gap.
The concept of the TDL is that it represents how much water recovery progress has been made
in an SDL resource unit toward bridging the gap from BDL to SDL as at 1 July of the water year
in question. Expressed as a formula in its simplest form this means:
TDL = BDL minus gap-bridging HEW available at 1 July.
However, as noted in discussions on Table 30 in section 8.4.1, gap-bridging HEW available
recovered from the New South Wales Intersecting Streams SDL resource unit is not deducted
from BDL for TDL calculation purposes due to unresolved issues about the long-term average
volume of these entitlements. For this SDL resource unit the TDL is set at the SDL.
Prior to calculating the TDL any difference between the 30 June and 1 July available HEW
volumes that contribute to bridging the gap is identified. There may be difference in 30 June and
1 July volumes as some water recovery programs give effect to water recovery on 1 July each
year.
For example, Victorian bulk entitlements are amended at the start of the water year to reflect the
outcomes of the previous year’s recovery progress. For the purpose of the trial, these volumes
are added to the preceding 30 June (the day prior) HEW entitlements to determine what HEW
entitlements that contribute to bridging the gap are available as at 1 July.
Table 32 shows the difference between 30 June and 1 July HEW available that contributes to
bridging the gap. Table 33 shows the final HEW available volumes that contribute to bridging the
gap that are deducted from the BDL, to determine the TDL for each SDL resource unit, at the
State scale. The HEW adjustment to BDL to determine TDL can also be found by SDL resource
unit in Table 25 .

Transition period water take report 2012‒13 to 2015‒16
Page 127
Table 32 Difference between 30 June and 1 July bridging the gap HEW by SDL resource units at the commencement of water years 2012–13 through to 2015–16
Surface water SDL resource unit
1 July increase over 30
June 2012 (GL -
LTDLE)
1 July increase over 30
June 2013 (GL -
LTDLE)
1 July increase over 30
June 2014 (GL -
LTDLE)
1 July increase over 30
June 2015 (GL -
LTDLE)
Queensland
Paroo 0.0 0.0 0.0 0.0
Warrego 0.0 0.0 0.0 0.0
Nebine 0.0 0.0 0.0 0.0
Condamine-Balonne 0.0 0.0 0.0 0.0
Moonie 0.0 0.0 0.0 0.0
Queensland Border Rivers 0.0 0.0 0.0 0.0
Queensland total 0.0 0.0 0.0 0.0
New South Wales
NSW Border Rivers 0.0 0.0 0.0 0.0
Intersecting Streams 0.0 0.0 0.0 0.0
Gwydir 0.0 0.0 0.0 0.0
Namoi 0.0 0.0 0.0 0.0
Macquarie-Castlereagh 0.0 0.0 0.0 0.0
Lachlan 0.0 0.0 0.0 0.0
Murrumbidgee 0.0 0.0 0.0 0.0
Barwon-Darling Watercourse 0.0 0.0 0.0 0.0
Lower Darling 0.0 0.0 0.0 0.0
NSW Murray 0.0 0.0 0.0 0.0
New South Wales total 0.0 0.0 0.0 0.0
Australian Capital Territory
Australian Capital Territory (Surface Water) 0.0 0.0 0.0 0.0
Australian Capital Territory total 0.0 0.0 0.0 0.0
Victoria
Victorian Murray 0.0 0.0 22.9 0.0
Kiewa 0.0 0.0 0.0 0.0
Ovens 0.0 0.0 0.0 0.0
Broken 0.0 0.0 0.0 0.0
Goulburn 0.0 0.0 31.9 0.0
Campaspe 0.0 22.6 0.0 0.0
Loddon 0.0 0.0 0.0 0.0
Wimmera-Mallee (Surface Water) 0.0 0.0 0.0 0.0
Victoria total 0.0 22.6 54.8 0.0
South Australia
SA Murray 0.0 0.0 0.0 0.0
SA Non-Prescribed Areas 0.0 0.0 0.0 0.0
Marne Saunders 0.0 0.0 0.0 0.0
Eastern Mount Lofty Ranges 0.0 0.0 0.0 0.0
South Australia total 0.0 0.0 0.0 0.0
Basin total 0.0 22.5 54.8 0.0

Transition period water take report 2012‒13 to 2015‒16
Page 128
Table 33 Held environmental water (HEW) deducted from BDL to determine TDL as at 1 July 2012 to 2015
Year All HEW available
30 June (GL - LTDLE)
Deduct Non gap bridging HEW (GL - LTDLE)
Add HEW for 1 July
(GL - LTDLE)
HEW recoveries to deduct from
BDL (GL - LTDLE)
1 July 2012 1,880.4 794.0 -0.0 1,086.5
1 July 2013 2,082.5 805.6 22.5 1,299.4
1 July 2014 2,530.5 996.0 54.8 1,589.3
1 July 2015 2,687.8 995.9 0.0 1,691.8
8.5. Groundwater HEW
8.5.1. Groundwater HEW available
Groundwater HEW available has increased from 0 GL LTDLE at 30 June 2012 to 8.96 GL LTDLE
at 30 June 2016. Groundwater entitlements associated with HEW have been assumed for the
purpose of this report to have a LTDLE factor of 1.00, therefore the entitlement volume equals
the long-term diversion limit equivalent volume.
Table 34 shows the increase in groundwater HEW volumes across the Basin. By 30 June 2016,
groundwater HEW had increased to 8.96 GL compared to 1.28 GL at 30 June 2014 and 30 June
2015. This increase is mainly due to increased HEW entitlements in New South Wales and ‘gap-
bridging’ recovery in the Queensland Upper Condamine Alluvium.
Importantly, the reporting period saw improvements in groundwater HEW data reporting. This is
reflected in the more complete data sets available in 2013–14 to 2015–16 as compared with the
2012–13 water year where states were able to provide limited data.
Table 34 Total available groundwater HEW by state as at 30 June for the period 2014 to 2016
Total groundwater HEW (GL)
Groundwater SDL resource unit 2014 2015 2016
New South Wales
Billabong Creek Alluvium 0.03 0.03 0.03
Lachlan Fold Belt 0.03 0.03 1.32
Lower Murray Alluvium (shallow; Shepparton Formation) 0.03 0.03 0.03
Lower Murray Alluvium (deep; Renmark Group and Calivil Formation) 1.05 1.05 0.03
Lower Murrumbidgee Alluvium (deep; Calivil Formation and Renmark Group) 0.00 0.00 5.05
Upper Murray Alluvium 0.14 0.14 0.14
New South Wales total 1.27 1.27 6.60
Queensland
Upper Condamine Alluvium (Central Condamine Alluvium) 0.00 0.00 2.36
Queensland total 0.00 0.00 2.36
Total 1.27 1.27 8.96
The increase in groundwater HEW in New South Wales is the result of HEW entitlements
acquired in six groundwater SDL resource units under the NSW Metering Project, a New South
Wales led state priority project under the Australian Government Sustainable Rural Water Use

Transition period water take report 2012‒13 to 2015‒16
Page 129
and Infrastructure Program (SRWUIP). These water savings were offered in return for funding
and are not part of 'bridging the gap' under the Basin Plan. For this report, this water has not
been used to adjust the TDLs.
8.5.2. Groundwater HEW that contributes to bridging the gap
Section 8.5.1 set out the amount of available groundwater HEW throughout the Basin. This
section describes the amount of groundwater HEW that contributes to bridging the gap.
As previously noted, the Basin Plan only requires groundwater extractions to be reduced to meet
the SDL in two SDL resource units in Queensland, within the Condamine–Balonne water
resource plan area (GW21).
The Australian Government has committed to recovering the 40.4 GL required to bridge the gap
to the SDL in this WRP area. The required reduction is: 35.4 GL in the Upper Condamine
Alluvium (Central Condamine Alluvium) SDL resource unit, and 5 GL in the Upper Condamine
Alluvium (Tributaries) SDL resource unit.
Since February 2014, a number of tenders for entitlement purchase have been held in the Upper
Condamine Alluvium. These have recovered 2.36 GL as at 30 June 2016, or 6% of the required
40.4 GL target that is to be reached by 2019. Table 34 includes ‘gap-bridging’ groundwater
recoveries achieved.
8.5.3. Groundwater HEW to determine the transitional diversion limit
Similar to surface water, ‘gap-bridging’ HEW available is deducted from the groundwater BDL to
determine the TDL each year.
No adjustments are made in the reporting period 2012–13 to 2015–16, as the 2.36 GL recovery
of HEW made in the Upper Condamine Alluvium (Central Condamine Alluvium) SDL resource
unit was completed after 1 July 2015 (see Table 34). This recovery will adjust the TDL in the
2016–17 reporting period.

Transition period water take report 2012‒13 to 2015‒16
Page 130
8.6. Held environmental water authorised for use and actual use
Matter 9.1.2 Carryover and forfeiture of HEW by SDL resource unit
Matter 9.1.3 Volume of HEW used by SDL resource unit
As with consumptive entitlements, the amount of HEW authorised for use each year varies
depending on the climatic conditions and allocations, carryover from previous years, trade of
allocations and allocation adjustments reflecting applicable rules in state water resource plans (or
forfeitures). The net volume of allocations that may be used in an SDL resource unit after
accounting for these variables is presented in this report as the HEW authorised for use.
Basin states commenced reporting HEW allocation authorised and used against Matter 9.1.2 and
Matter 9.1.3 in the 2013–14 water year.
8.6.1. Surface water HEW authorised for use
The total volume authorised for use may not be finalised until the end of year, as trades may
influence whether the allocation is available in one SDL resource unit or another. For example,
Table 30 shows South Australia with long-term surface water HEW available ranging between
133 GL and 222 GL, whilst Table 35 shows HEW authorised ranging between 801 GL and
918 GL. This reflects trade into South Australia from other SDL resource units.
The volume of HEW authorised for use is a combination of allocations made to HEW entitlements
in the year, HEW allocation carryover from the previous year, trade of HEW allocations between
SDL resource units, net trade of HEW allocations for consumptive use, net transfer of HEW
allocations to outside the Murray-Darling Basin and return flows from HEW watering activities.
Also, in unregulated surface water systems, HEW authorised for use reflects only the HEW
actually recorded as use, not the volume that may be allocated to an account. In unregulated
systems allocation is only available to be taken when conditions such as flow height are met. In
NSW, therefore, authorised HEW use for unregulated systems and for supplementary access
water rights reflects only the actual HEW use that has occurred. For example, Table 35 shows
zero HEW authorised in the Barwon–Darling as no extractions of HEW occurred in this period. It
is noted that this differs from the way water allocated has been reported for consumptive users.
This will be rectified in future reports.
The volume of surface water HEW authorised for use each year, influences the timing and
location of environmental watering activities for that year.
Each year, the HEW available can be used for the following purposes:
Undertaking environmental watering actions—such as delivering environmental flows to specific river reaches, wetlands, floodplains and other important ecological sites; or
Traded, on a temporary basis to the consumptive pool.
The volumes of HEW authorised over the reporting period are shown in Table 35. HEW data was
first reported in 2013–14. There was an increase in authorised HEW over the period of 263 GL
from 2,344 GL in 2013–14 to 2,607 GL in 2015–16. This increase is a function of the increasing
volume of HEW entitlements over the period, partially offset by generally decreasing allocation
volumes in drier weather.

Transition period water take report 2012‒13 to 2015‒16
Page 131
Table 35 HEW authorised for use in 2013–14, 2014–15 and 2015–16 for each SDL resource unit
SDL resource unit 2013–14
(GL) 2014–15
(GL) 2015–16
(GL)
Queensland
Paroo 0.0 0.0 0.0
Warrego 0.0 2.5 0.9
Nebine 0.0 0.0 1.0
Condamine–Balonne 22.3 17.4 9.5
Moonie 1.4 1.4 0.2
Queensland Border Rivers 10.4 8.2 9.7
Queensland total 34.1 29.6 21.2
New South Wales
NSW Border Rivers 0.1 0.1 0.2
Intersecting Streams 0.0 0.0 0.0
Gwydir 113.4 81.4 35.6
Namoi 6.1 6.2 6.4
Macquarie–Castlereagh 47.3 28.7 27.3
Lachlan 97.3 76.2 103.4
Murrumbidgee 224.6 318.4 210.9
Barwon–Darling Watercourse 0.0 0.0 0.0
Lower Darling 78.9 49.5 25.0
NSW Murray 220.3 222.1 324.8
New South Wales total 788.0 782.6 733.6
Australian Capital Territory
Australian Capital Territory (Surface Water) 0.0 0.0 0.0
Australian Capital Territory total 0.0 0.0 0.0
Victoria
Victorian Murray 557.3 408.8 521.0
Kiewa 0.0 0.0 0.0
Ovens 0.1 0.1 0.1
Broken 0.1 0.9 0.6
Goulburn 75.3 404.6 355.6
Campaspe 20.1 30.7 26.6
Loddon 7.5 9.7 14.1
Wimmera–Mallee (Surface Water) 60.4 45.4 16.4
Victoria total 720.7 900.2 934.3
South Australia
SA Murray 800.9 809.1 917.6
SA Non-Prescribed Areas 0.0 0.0 0.0
Marne Saunders 0.0 0.0 0.0
Eastern Mount Lofty Ranges 0.0 0.0 0.0
South Australia total 800.9 809.1 917.6
Basin total 2,343.7 2,521.5 2,606.6

Transition period water take report 2012‒13 to 2015‒16
Page 132
8.6.2. Surface water HEW use
Table 36 shows the use of authorised HEW over the period 2013–14 to 2015–16. This table
shows an increase in the volume of HEW used over the period from 1,583 GL in 2013–14 to
1,954 GL in 2015–16. This is an increase of 371 GL or approximately 23%.
HEW used as a percentage of the authorised HEW is set out in Table 37. This shows that at the
Basin scale there has been an increase in the proportion of HEW being used. HEW used has
increased from 68% in 2013–14 to 75% in 2015–16. This, in overall terms, is roughly equivalent
to the utilisation by consumptive users (refer section 6.1.1). Some SDL resource units show a
reduction, indicating that opportunities may not have been available in that year to use the water
for environmental outcomes.

Transition period water take report 2012‒13 to 2015‒16
Page 133
Table 36 Surface water HEW used in 2013–14, 2014–15 and 2015–16 for each SDL resource unit
SDL resource unit 2013–14
(GL) 2014–15
(GL) 2015–16
(GL)
Queensland
Paroo 0.0 0.0 0.0
Warrego 0.0 2.5 0.9
Nebine 0.0 0.0 1.0
Condamine–Balonne 22.3 17.4 9.5
Moonie 1.4 1.4 0.2
Queensland Border Rivers 4.1 1.8 1.1
Queensland total 27.8 23.2 12.6
New South Wales
NSW Border Rivers 0.0 0.0 0.0
Intersecting Streams 0.0 0.0 0.0
Gwydir 32.3 56.6 7.1
Namoi 0.0 0.0 0.0
Macquarie–Castlereagh 21.0 16.0 19.2
Lachlan 23.0 5.8 48.0
Murrumbidgee 147.8 223.7 115.2
Barwon–Darling Watercourse 0.0 0.0 0.0
Lower Darling 55.2 0.0 0.0
NSW Murray 83.8 63.2 186.1
New South Wales total 363.2 365.4 375.6
Australian Capital Territory
Australian Capital Territory (Surface Water) 0.0 0.0 0.0
Australian Capital Territory total 0.0 0.0 0.0
Victoria
Victorian Murray 344.4 166.8 375.5
Kiewa 0.0 0.0 0.0
Ovens 0.1 0.1 0.1
Broken 0.1 0.9 0.5
Goulburn 15.2 342.4 242.6
Campaspe 5.6 30.7 13.7
Loddon 5.8 7.6 7.4
Wimmera–Mallee (Surface Water) 19.8 33.7 8.1
Victoria total 390.9 582.1 647.8
South Australia
SA Murray 800.9 809.1 917.6
SA Non-Prescribed Areas 0.0 0.0 0.0
Marne Saunders 0.0 0.0 0.0
Eastern Mount Lofty Ranges 0.0 0.0 0.0
South Australia total 800.9 809.1 917.6
Basin total 1,582.7 1,779.8 1,953.5

Transition period water take report 2012‒13 to 2015‒16
Page 134
Table 37 Surface water HEW used as a percentage of water authorised in 2013–14, 2014–15 and 2015–16 for each SDL resource unit
SDL resource unit 2013-14 2014-15 2015-16
Queensland
Paroo NA NA NA
Warrego NA 100% 100%
Nebine NA NA 100%
Condamine-Balonne 100% 100% 100%
Moonie 100% 100% 100%
Queensland Border Rivers 39% 22% 11%
Queensland total 81% 78% 59%
New South Wales
NSW Border Rivers 23% 0% 0%
Intersecting Streams NA NA NA
Gwydir 29% 70% 20%
Namoi 0% 0% 0%
Macquarie-Castlereagh 44% 56% 70%
Lachlan 24% 8% 46%
Murrumbidgee 66% 70% 55%
Barwon-Darling Watercourse NA NA NA
Lower Darling 70% 0% 0%
NSW Murray 38% 28% 57%
New South Wales total 46% 47% 51%
Australian Capital Territory
Australian Capital Territory (Surface Water) NA NA NA
Australian Capital Territory total NA NA NA
Victoria
Victorian Murray 62% 41% 72%
Kiewa NA NA NA
Ovens 100% 100% 100%
Broken 100% 97% 88%
Goulburn 20% 85% 68%
Campaspe 28% 100% 51%
Loddon 77% 78% 52%
Wimmera-Mallee (Surface Water) 33% 74% 50%
Victoria total 54% 65% 69%
South Australia
SA Murray 100% 100% 100%
SA Non-Prescribed Areas NA NA NA
Marne Saunders NA NA NA
Eastern Mount Lofty Ranges NA NA NA
South Australia total 100% 100% 100%
Basin total 68% 71% 75%
NA – means that either no HEW was authorised for use in the year or in unregulated systems flow conditions did not
provide an opportunity for HEW to be used

Transition period water take report 2012‒13 to 2015‒16
Page 135
Figure 28 shows the surface water HEW authorised for use each year and how it was utilised in
that year. As shown in this figure, authorised HEW has increased each year, HEW used has
increased, HEW forfeited or adjusted in accounts has decreased and the volume of HEW carried
over has declined.
* No data reported for water year 2012–13
Figure 28 Surface water HEW authorised and how it has been utilised at a Basin scale 2013–14 to 2015–16
The use of HEW to deliver environmental watering actions is often co-ordinated among the
different owners of the entitlements. Further information about use of HEW under the Basin Plan
is available from the MDBA website at: https://www.mdba.gov.au/managing-water/environmental-
water and from the websites of the environmental water holders.
If HEW is not used or extracted it may be:
carried over to the next water year (if carryover provisions apply) or
forfeited or deducted from the account if there are no carryover provisions or carryover limits are reached or there is a spill from the storage.
As shown in Figure 28 and Figure 29, there was a decrease in the annual volume of HEW carried
over across the reporting period. More information about the use of carryover by environmental
water holders can be accessed from their respective websites.
A small amount of water was forfeited, largely due to storage spill rules.
Even though owners of HEW have the same set of rights and obligations as other owners of the
same class of entitlement, concern has previously been raised that the volume of HEW carried
over may be impacting on storages and the rights of other users to that storage. Figure 29 shows
0
500
1,000
1,500
2,000
2,500
3,000
2012-13* 2013-14 2014-15 2015-16
Vo
lum
e (G
L)
Water Year
HEW authorised for use HEW used HEW forfeited or adjusted HEW allocation carryover to next year

Transition period water take report 2012‒13 to 2015‒16
Page 136
that at a Basin scale, HEW carryover as a proportion of actual storage was 6% at 30 June 2014,
and 7% at 30 June 2015 and 2016.
The percentage for a single storage may be different to this and can vary across the Basin. By
comparison, consumptive carryover as a proportion of actual storage was 25% at 30 June 2013,
23% at 30 June 2014 and 25% at 30 June 2015.
HEW carryover as a percentage of total carryover represents 20% at 30 June 2014, and 23% at
30 June 2015. HEW data was not available for 2012–13 and consumptive carryover data was not
yet available on 30 June 2016, making a comparison over the four years incomplete.
This analysis suggests, at a Basin scale, the volume of HEW carryover is not impacting on
storage volumes and represents a small proportion of total carryover. Even so, if a storage was
to fill to capacity, the same rules would apply to both HEW carryover and any consumptive
carryover.
Figure 29 Comparison of consumptive and HEW carryover as a proportion of end of year actual storage 2012–13 to 2015–16 – at a Basin scale

Transition period water take report 2012‒13 to 2015‒16
Page 137
In Figure 29 the dam capacity varies across the reporting period because in:
2013–14 an enlarged Cotter Dam in the ACT increased storage by 70 GL,
2014–15 in NSW Lake Burrendong storage was decreased and other minor adjustments
made decreasing storage by 490 GL, and
2015–16 in Victoria Lake Mokoan was removed as it no longer acts as a storage,
resulting in a decrease of 365 GL.
8.6.3. Groundwater HEW authorised for use and used
In groundwater systems, the allocation provided for groundwater HEW entitlements is not
extracted or used. Groundwater HEW is expected to remain in the groundwater system to
provide environmental outcomes, rather than being extracted.

Transition period water take report 2012‒13 to 2015‒16
Page 138
8.7. Planned Environmental Water
Matter 9.2 – volume of planned environmental water available
Matter 9.2.1 Volume of PEW by SDL resource unit
Planned environmental water (PEW) is rules-based environmental water that is not associated
with any water access rights and is generally not callable.
This rules-based water may maintain minimum flows, ensure a proportion of water flowing into a
storage is passed through the storage and released from the dam, or be the residual water that is
prevented from being taken as consumptive use.
In unregulated surface water systems and groundwater SDL resource units, PEW is most often
created by a rule that limits the volume of water that can be taken for consumptive use.
As PEW is often an operating rule in a water resource plan, it may provide both environmental
and non-environmental benefits. For example, PEW may assist in managing in-stream water
quality whilst also meeting conveyance losses or providing minimum flows in a reach to enable
take under basic rights.
Section 6 of the Water Act defines PEW for the purpose of Basin Plan implementation. There are
PEW arrangements throughout the Basin.
The Water Act and the Basin Plan require that there be no net reduction in the protection of
pre-existing PEW in the water resource plans that are being prepared by Basin states. The
setting of the Basin Plan SDLs assumed this continued protection. PEW is required to be
identified in water resource plans and, once accredited, Basin states will be required to report
annually on their compliance on delivering PEW.
Reporting of PEW is a new requirement under the Basin Plan. The MDBA considers that further
work is required over the transition period to enable Basin states to improve their reporting of this
important element of environmental water.

Transition period water take report 2012‒13 to 2015‒16
Page 139
9. Data improvements to date and future work
9.1. Data improvements over the period and ongoing limitations
The period of this report represents the first four years under which surface water and
groundwater data on water authorised, annual permitted take and annual actual water take were
reported to the MDBA by Basin states under section 71 of the Water Act. The period of this report
also represents the first instances of reporting on held environmental water available and used as
required under Matter 9 of Schedule 12 to the Basin Plan.
As discussed earlier in this report, the requirement outlined in s.71 of the Water Act that data for
all forms of take defined in the Basin Plan is to be reported is a challenge for Basin states.
Prior to the commencement of the Basin Plan, data for groundwater take, floodplain harvesting,
runoff dams, net take by commercial plantations and take under basic rights was not routinely or
consistently collected. As a consequence, Basin states and the MDBA have worked together to
make sure that the best available information can be provided for all forms of take as required by
the Basin Plan.
Improvements are being made and include:
Reporting by SDL resource unit
Expanding reporting data on actual water taken from watercourses and regulated rivers to
include estimates of actual water taken from basic rights, floodplain harvesting, runoff
dams, net take by commercial plantations and groundwater.
Separately reporting actual water taken by each form of take.
However, the improvements have not been implemented across all Basin states or for all forms
of take.
It is also true that important limitations on the data that is reported remain. One example of this is
the continued use of the long-term average estimates for some forms of take set out in
Schedule 3 of the Basin Plan when reporting annual actual take. While this may currently be the
best available information, it does not reflect levels of annual take that will vary in response to
climate conditions. This applies to actual take from basic rights, runoff dams and net take by
commercial plantations.
This issue is likely to continue until improved methods of estimating actual take for these forms of
take are developed but at present it represents a key opportunity to improve the overall integrity
of the SDL water accounting and compliance framework.
9.2. Improving data collection and handling
There are opportunities for all Basin states and the MDBA to improve data collection and
handling. Current arrangements are labour intensive, subject to delays (for example bad weather
preventing access to water meters), and prone to inaccuracy through the use of multiple
spreadsheets that do not have appropriate controls in place to prevent unintended data errors.
MDBA encourages the Basin states to continue to improve the efficiency, effectiveness and
timeliness of data collection and handling.

Transition period water take report 2012‒13 to 2015‒16
Page 140
For its own part, the MDBA has commissioned a project that will establish a fit–for–purpose
data storage and reporting tool. The new tool will adopt best information management practice to
ensure the integrity and accuracy of the processing and assessment of reporting data submitted
by the Basin states.
9.3. Developing suitable models
The water resource plans that Basin states develop for surface water SDL resource units are
expected to contain hydrological models that represent some forms of take. These models will be
the new standard upon which formal SDL accounting is based.
The models used for the Cap are representative of water use and water resources available
under state rules in place as at 1993–94 and do not cover many requirements needed to
determine annual permitted take under the Basin Plan. Basin states are, accordingly, currently
looking into different ways to move from Cap models to SDL models for water resource plans.
As an interim step, Basin states are updating their models to reflect the level of development
used to determine the BDL — that is, the water use and state water resource management rules
in place as at 30 June 2009.
MDBA has an agreement with the Basin states that surface water modelling will move to a
common modelling platform called eWater Source. However, Basin states are concerned that it
may take some years to be confident of the new model platform and it may not be sufficiently
developed and proven in time for the water resource plans to be place by 2019.
9.4. Recommendations
Recommendation 4:
Adoption of automated reporting tools where possible to improve the timeliness, accuracy and
efficiency of reporting and assessment.
MDBA continue to develop a new automated SDL reporting tool that will enhance the timeliness,
accuracy and reporting outputs available from the annual assessment of state reporting data.

Transition period water take report 2012‒13 to 2015‒16
Page 141
10. Appendix 1: Surface water SDL trial water take account
Basin Plan Chapter 6 Part 4 - Trial Compliance Arrangements
SDL Res. Unit code
SDL Resource Unit WRP Area State
Long-term averages1 (including
interceptions)
Long-term averages as HEW4 recovery progresses
(TDL5 reduces to SDL by 2019)
BDL2 (GL/y)
SDL3 (GL/y)
TDL5 (GL/y)
2012-13 2013-14 2014-15 2015-16
SS29 Paroo Warrego-Paroo-Nebine Qld 9.9 9.9 9.9 9.9 9.9 9.9
SS28 Warrego Warrego-Paroo-Nebine Qld 127.7 117.2 119.7 119.7 119.7 119.7
SS27 Nebine Warrego-Paroo-Nebine Qld 31.2 29.9 30.2 30.2 30.2 30.2
SS26 Condamine–Balonne Condamine–Balonne Qld 978.3 838.1 955.2 943.7 938.0 924.5
SS25 Moonie Moonie Qld 84.2 82.3 83.1 83.1 83.1 83.1
SS24 Queensland Border Rivers Queensland Border Rivers Qld 320.1 298.5 315.9 314.3 313.5 311.6
SS23 NSW Border Rivers NSW Border Rivers NSW 302.6 283.9 302.5 302.5 302.4 302.4
SS17 Intersecting Streams9 Intersecting Streams NSW 114.0 113.8 113.8 113.8 113.8 113.8
SS22 Gwydir Gwydir NSW 450.2 389.9 407.7 407.7 407.7 403.3
SS21 Namoi Namoi NSW 508.3 479.0 503.5 503.4 502.1 500.7
SS20 Macquarie –Castlereagh Macquarie –Castlereagh NSW 734.3 645.4 680.4 672.8 661.1 658.9
SS16 Lachlan Lachlan NSW 618.4 570.4 570.1 569.6 568.8 568.8
SS15 Murrumbidgee Murrumbidgee NSW 2,501.1 1,938.1 2,368.9 2,338.6 2,194.0 2,175.5
SS19 Barwon–Darling Watercourse10 Barwon–Darling Watercourse NSW 198.0 180.9 175.7 175.7 174.2 172.2
SS18 Lower Darling New South Wales Murray and Lower Darling NSW 60.5 45.5 60.1 60.1 59.5 59.5
SS14 NSW Murray New South Wales Murray and Lower Darling NSW 1,811.7 1,341.7 1,619.0 1,544.8 1,531.0 1,522.8
SS1 Australian Capital Territory (surface water)11 Australian Capital Territory (surface water) ACT 52.5 47.6 52.5 52.5 52.5 47.6
SS2 Victorian Murray Victorian Murray Vic 1,707.1 1,251.7 1,473.1 1,456.0 1,409.5 1,392.7
SS3 Kiewa Victorian Murray Vic 24.6 23.3 24.6 24.6 24.6 24.6
SS4 Ovens Northern Victoria Vic 83.4 80.3 83.3 83.3 83.3 83.3
SS5 Broken Northern Victoria Vic 56.2 54.6 56.2 56.1 56.1 56.0

Transition period water take report 2012‒13 to 2015‒16
Page 142
Basin Plan Chapter 6 Part 4 - Trial Compliance Arrangements
SDL Res. Unit code
SDL Resource Unit WRP Area State
Long-term averages1 (including
interceptions)
Long-term averages as HEW4 recovery progresses
(TDL5 reduces to SDL by 2019)
BDL2 (GL/y)
SDL3 (GL/y)
TDL5 (GL/y)
2012-13 2013-14 2014-15 2015-16
SS6 Goulburn Northern Victoria Vic 1,689.4 1,153.0 1,478.0 1,461.3 1,411.1 1,396.4
SS7 Campaspe Northern Victoria Vic 152.6 120.9 146.3 123.7 123.6 123.6
SS8 Loddon Northern Victoria Vic 178.6 155.8 168.7 168.7 167.2 166.7
SS9 Wimmera–Mallee (surface water) Wimmera-Mallee (surface water) Vic 128.5 105.5 128.5 105.9 105.9 105.9
SS11 South Australian Murray South Australia River Murray SA 665.0 483.1 574.7 566.7 556.1 542.6
SS10 South Australian Non-Prescribed Areas South Australian Murray Region SA 3.5 3.5 3.5 3.5 3.5 3.5
SS12 Marne Saunders Eastern Mount Lofty Ranges SA 2.9 2.9 2.9 2.9 2.9 2.9
SS13 Eastern Mount Lofty Ranges Eastern Mount Lofty Ranges SA 28.3 26.4 28.3 28.3 28.3 28.3
TOTALS MDB 13,623.1 10,873.1 12,536.6 12,323.6 12,033.8 11,931.3
Qld 1,551.4 1,375.9 1,514.0 1,501.0 1,494.5 1,479.1
NSW 7,299.1 5,988.6 6,801.8 6,689.1 6,514.6 6,478.0
ACT 52.5 47.6 52.5 52.5 52.5 47.6
Vic 4,020.4 2,945.1 3,558.8 3,479.6 3,381.4 3,349.3
SA 699.7 515.9 609.4 601.4 590.8 577.3
MKO Murray-Kiewa-Ovens BP s6.12(2)(a) Vic 1,815.1 1,355.3 1,581.1 1,563.9 1,517.4 1,500.6
GBCL Gbn-Bkn-Camp-Lodd BP s6.12(2)(b) Vic 2,076.8 1,484.3 1,849.3 1,809.8 1,758.1 1,742.8
1. Long-term averages figures are based on the historical climate sequence (1895-2009). BDL as per Basin Plan 2012, Schedule 2 to 1 decimal place. 2. BDL is Baseline Diversion Limit- a single number determined as an average of modelled annual variations over 114 year. 3. SDL is Sustainable Diversion Limit: determined as BDL minus amount of water recovered for the environment. Shared reduction determined on basis of default set out in the Basin Plan s6.05(4). Actual recovery in some
cases exceeds default amount. 4. HEW is Held Environmental Water recovered to "Bridge the Gap" at 1 July each water year (i.e. increasing towards 2750 GL) 5. TDL is Transitional Diversion Limits that is BDL minus HEW at 1 July each water year. TDL represent an indicative non-binding limit during the Transition Period (i.e. 2012-19) 9. Water recovery that has occurred in the intersecting streams is limited to 0.2 GL based on estimated BDL in Basin Plan. 10. Northern Basin Review considered the water recovery achieved when recommending changes to local and shared reduction targets. In the Barwon-Darling SDL resource unit, HEW over-recovery was considered in the proposed Basin Plan Amendments 2016. At the time of preparation of this report, the Basin Plan Amendments are not adopted by the Commonwealth Minister for Water. 11. Water recovery to meet ACT's shared amount has occurred in NSW Murrumbidgee SDL resource unit.

Transition period water take report 2012‒13 to 2015‒16
Page 143
Basin Plan Chapter 6 Part 4 - Trial Compliance Arrangements
SDL Resource Unit
s6.10, s10.10, s10.15: Annual data (including interceptions) -:determined each year:-
s6.11: Difference of annual Transitional Permitted and Actual Take Actual take / Transitional permitted take
(%) Transitional Permitted Take6 (GL/y) (s71(1)(b))
Actual Take7 (GL/y) (s71(1)(c))
Annual balance (GL/y)
2012-13 2013-14 2014-15 2015-16 2012-13 2013-14 2014-15 2015-16 2012-13 2013-14 2014-15 2015-16 2012-13 2013-14 2014-15 2015-16
Paroo 9.8 9.8 9.8 9.8 9.7 9.7 9.7 9.7 0.0 0.0 0.1 0.1 100% 100% 99% 99%
Warrego 88.8 86.5 111.3 100.8 85.7 83.8 90.3 85.9 3.1 2.7 21.0 14.8 96% 97% 81% 85%
Nebine 25.9 26.2 29.2 30.6 25.0 25.0 25.1 26.4 0.9 1.2 4.1 4.2 96% 95% 86% 86%
Condamine–Balonne 1,507.1 891.2 683.6 608.6 1,269.8 876.1 619.1 530.2 237.3 15.2 64.5 78.4 84% 98% 91% 87%
Moonie 92.6 64.6 52.4 51.5 84.6 63.9 54.7 51.8 8.0 0.8 -2.3 -0.3 91% 99% 104% 101%
Queensland Border Rivers 598.3 226.4 192.7 154.8 456.4 223.7 180.9 167.4 141.9 2.7 11.8 -12.6 76% 99% 94% 108%
NSW Border Rivers 446.4 359.5 203.0 295.0 328.4 300.2 170.5 222.4 118.0 59.2 32.5 72.5 74% 84% 84% 75%
Intersecting Streams9 116.8 116.8 116.8 116.8 116.8 116.8 116.8 116.8 0.0 0.0 0.0 0.0 100% 100% 100% 100%
Gwydir 555.8 644.7 331.3 308.1 575.4 571.5 291.4 271.4 -19.6 73.2 39.9 36.7 104% 89% 88% 88%
Namoi 595.7 556.7 398.4 383.4 583.5 589.2 372.1 348.0 12.1 -32.5 26.4 35.4 98% 106% 93% 91%
Macquarie –Castlereagh 873.1 576.6 517.2 437.3 773.5 609.2 431.6 448.6 99.6 -32.6 85.6 -11.3 89% 106% 83% 103%
Lachlan 773.6 686.8 533.1 534.2 664.8 562.3 509.4 488.1 108.8 124.5 23.7 46.0 86% 82% 96% 91%
Murrumbidgee 3,278.8 2,726.2 2,270.5 1,829.2 2,789.7 2,340.7 2,195.7 1,828.1 489.1 385.5 74.8 1.0 85% 86% 97% 100%
Barwon–Darling Watercourse10 208.8 121.3 54.4 92.7 201.6 90.8 44.0 88.0 7.1 30.6 10.4 4.7 97% 75% 81% 95%
Lower Darling 145.4 113.9 60.7 29.2 102.6 109.6 49.9 16.5 42.8 4.3 10.8 12.7 71% 96% 82% 56%
NSW Murray 2,324.3 1,663.7 1,011.9 964.6 2,012.3 1,601.3 1,379.5 821.5 311.9 62.3 -367.6 143.1 87% 96% 136% 85%
Australian Capital Territory (surface water)11 57.3 57.2 55.4 56.7 30.7 30.8 29.0 32.1 26.6 26.5 26.4 24.6 54% 54% 52% 57%
Victorian Murray 1,526.8 1,651.4 1,718.0 1,431.7 1,692.4 1,335.5 1,420.7 1,363.9 -165.6 316.0 297.3 67.7 111% 81% 83% 95%
Kiewa 21.3 21.3 21.5 22.1 20.3 16.2 19.4 19.8 1.0 5.0 2.0 2.3 95% 76% 90% 90%
Ovens 83.8 82.4 80.7 82.4 78.1 75.6 76.3 74.7 5.6 6.8 4.4 7.8 93% 92% 95% 91%
Broken 65.4 62.8 59.8 58.8 55.2 54.9 58.0 53.8 10.2 8.0 1.8 5.0 84% 87% 97% 91%
Goulburn 1,538.2 1,591.0 1,340.5 810.8 1,262.5 1,227.3 1,189.8 1,154.5 275.7 363.8 150.7 -343.6 82% 77% 89% 142%

Transition period water take report 2012‒13 to 2015‒16
Page 144
Basin Plan Chapter 6 Part 4 - Trial Compliance Arrangements
SDL Resource Unit
s6.10, s10.10, s10.15: Annual data
(including interceptions) -:determined each year:-
s6.11: Difference of annual Transitional Permitted and Actual Take Actual take / Transitional permitted take
(%) Transitional Permitted Take6 (GL/y) (s71(1)(b))
Actual Take7 (GL/y) (s71(1)(c))
Annual balance (GL/y)
2012-13 2013-14 2014-15 2015-16 2012-13 2013-14 2014-15 2015-16 2012-13 2013-14 2014-15 2015-16 2012-13 2013-14 2014-15 2015-16
Campaspe 148.8 103.5 88.2 93.7 82.6 65.9 75.1 79.3 66.2 37.6 13.1 14.4 55% 64% 85% 85%
Loddon 208.4 108.9 99.0 102.2 159.7 125.1 119.1 114.3 48.7 -16.3 -20.1 -12.2 77% 115% 120% 112%
Wimmera–Mallee (surface water) 107.8 105.7 95.7 75.1 79.7 77.5 81.3 81.8 28.1 28.1 14.3 -6.8 74% 73% 85% 109%
South Australian Murray 581.7 481.0 524.0 656.9 522.1 442.9 500.9 597.5 59.6 38.1 23.1 59.5 90% 92% 96% 91%
South Australian Non-Prescribed Areas 3.5 3.5 3.5 3.5 3.5 3.5 3.5 3.5 0.0 0.0 0.0 0.0 100% 100% 100% 100%
Marne Saunders 3.3 3.1 3.1 3.1 2.2 2.2 2.3 2.0 1.1 0.9 0.7 1.0 66% 71% 77% 66%
Eastern Mount Lofty Ranges 23.9 25.1 19.9 16.7 23.9 25.1 19.9 12.0 0.0 0.0 0.0 4.7 100% 100% 100% 72%
MDB 16,011.1 13,167.7 10,685.3 9,359.8 14,092.8 11,656.1 10,135.8 9,109.9 1,918.4 1,511.6 549.5 249.9 88% 89% 95% 97%
Qld 2,322.5 1,304.7 1,078.9 956.0 1,931.2 1,282.2 979.8 871.4 391.3 22.5 99.2 84.6 83% 98% 91% 91%
NSW 9,318.6 7,566.1 5,497.2 4,990.2 8,148.8 6,891.6 5,560.7 4,649.4 1,169.8 674.5 -63.5 340.8 87% 91% 101% 93%
ACT 57.3 57.2 55.4 56.7 30.7 30.8 29.0 32.1 26.6 26.5 26.4 24.6 54% 54% 52% 57%
Vic 3,700.5 3,727.0 3,503.3 2,676.7 3,430.6 2,978.0 3,039.7 2,942.0 269.9 749.0 463.6 -265.4 93% 80% 87% 110%
SA 612.3 512.6 550.5 680.2 551.6 473.6 526.7 615.0 60.7 39.0 23.8 65.2 90% 92% 96% 90%
Murray-Kiewa-Ovens 1,631.9 1,755.1 1,820.2 1,536.2 1,790.9 1,427.3 1,516.4 1,458.4 -158.9 327.8 303.7 77.8 110% 81% 83% 95%
Gbn-Bkn-Camp-Lodd 1,960.8 1,866.3 1,587.5 1,065.4 1,560.0 1,473.2 1,441.9 1,401.8 400.7 393.1 145.5 -336.4 80% 79% 91% 132%
6. Permitted Take is annual volume determined by a model (where available) after the end of the water year, using the climate for that year plus floodplain harvesting, interceptions and basic rights
less the effect of environmental water recovery.
7. Actual Take is an annual volume, the amount of water physically taken out of river system + Interceptions for consumptive use

Transition period water take report 2012‒13 to 2015‒16
Page 145
Basin Plan Chapter 6 Part 4 - Trial Compliance Arrangements
SDL Resource Unit
Basin Plan s10.12(3): Net Volume of HEW disposed (added to consumptive) and acquired (removed
from consumptive) (GL/y)
Basin Plan s6.12(1)(a): Transitional adjusted cumulative
balance after disposal or acquisition of HEW (if any)
Basin Plan s6.12(1)(a): Indicative compliance test (non-binding)
20% with long-term TDL
Adjusted cumulative balance (∑) (GL/y)
Adjusted cumulative balance is debit ≤ 20% of TDL = Compliant
2012-13 2013-14 2014-15 2015-16 2012-13 2013-14 2014-15 2015-16 2012-13 2013-14 2014-15 2015-16
Paroo 0.0 0.0 0.0 0.0 0.0 0.0 0.1 0.2 0% 0% 1% 2%
Warrego 0.0 0.0 0.0 0.0 3.1 5.8 26.8 41.6 3% 5% 22% 35%
Nebine 0.0 0.0 0.0 0.0 0.9 2.2 6.2 10.5 3% 7% 21% 35%
Condamine–Balonne 0.0 0.0 0.0 0.0 237.3 252.5 317.0 395.4 25% 27% 34% 43%
Moonie 0.0 0.0 0.0 0.0 8.0 8.8 6.4 6.1 10% 11% 8% 7%
Queensland Border Rivers 0.0 0.0 0.0 0.0 141.9 144.6 156.5 143.8 45% 46% 50% 46%
NSW Border Rivers 0.0 0.0 0.0 0.0 118.0 177.2 209.7 282.3 39% 59% 69% 93%
Intersecting Streams9 0.0 0.0 0.0 0.0 0.0 0.0 0.0 0.0 0% 0% 0% 0%
Gwydir 0.0 15.0 0.0 0.5 -19.6 68.6 108.5 145.7 -5% 17% 27% 36%
Namoi 0.0 0.3 0.0 0.0 12.1 -20.1 6.3 41.7 2% -4% 1% 8%
Macquarie –Castlereagh 0.0 3.0 0.0 0.0 99.6 70.0 155.6 144.2 15% 10% 24% 22%
Lachlan 0.0 3.4 0.0 1.0 108.8 236.7 260.4 307.4 19% 42% 46% 54%
Murrumbidgee 10.1 8.8 -0.3 0.6 499.2 893.5 968.0 969.7 21% 38% 44% 45%
Barwon–Darling Watercourse10 0.0 0.0 0.0 0.0 7.1 37.7 48.1 52.7 4% 21% 28% 31%
Lower Darling 0.0 10.0 0.0 0.0 42.8 57.1 68.0 80.7 71% 95% 114% 135%
NSW Murray -4.1 -8.2 -4.8 0.0 307.8 361.9 -10.5 132.6 19% 23% -1% 9%
Australian Capital Territory (surface water)11 0.0 0.0 0.0 0.0 26.6 53.1 79.5 104.1 51% 101% 151% 219%
Victorian Murray 13.9 3.4 -6.9 0.0 -151.7 167.6 458.1 525.8 -10% 12% 33% 38%
Kiewa 0.0 0.0 0.0 0.0 1.0 6.1 8.1 10.4 4% 25% 33% 42%
Ovens 0.0 0.0 0.0 0.0 5.6 12.4 16.8 24.5 7% 15% 20% 29%
Broken 0.0 0.0 0.0 0.0 10.2 18.1 20.0 25.0 18% 32% 36% 45%
Goulburn 0.0 0.7 8.8 22.4 275.7 640.2 799.7 478.4 19% 44% 57% 34%

Transition period water take report 2012‒13 to 2015‒16
Page 146
Basin Plan Chapter 6 Part 4 - Trial Compliance Arrangements
SDL Resource Unit
Basin Plan s10.12(3): Net Volume of HEW disposed (added to consumptive) and acquired (removed
from consumptive) (GL/y)
Basin Plan s6.12(1)(a): Transitional adjusted cumulative
balance after disposal or acquisition of HEW (if any)
Basin Plan s6.12(1)(a): Indicative compliance test (non-binding)
20% with long-term TDL
Adjusted cumulative balance (∑) (GL/y)
Adjusted cumulative balance is debit ≤ 20% of TDL = Compliant
2012-13 2013-14 2014-15 2015-16 2012-13 2013-14 2014-15 2015-16 2012-13 2013-14 2014-15 2015-16
Campaspe -8.0 0.0 0.0 0.0 58.2 95.8 109.0 123.4 40% 77% 88% 100%
Loddon 0.0 0.0 0.0 0.0 48.7 32.4 12.3 0.1 29% 19% 7% 0%
Wimmera–Mallee (surface water) 0.0 0.0 0.0 0.0 28.1 56.2 70.6 63.8 22% 53% 67% 60%
South Australian Murray -12.0 -11.1 -1.2 -3.9 47.6 74.6 96.5 152.1 8% 13% 17% 28%
South Australian Non-Prescribed Areas 0.0 0.0 0.0 0.0 0.0 0.0 0.0 0.0 0% 0% 0% 0%
Marne Saunders 0.0 0.0 0.0 0.0 1.1 2.0 2.7 3.7 38% 68% 93% 129%
Eastern Mount Lofty Ranges 0.0 0.0 0.0 0.0 0.0 0.0 0.0 4.7 0% 0% 0% 17%
MDB -0.2 25.2 -4.3 20.6 1,918.1 3,455.0 4,000.1 4,270.6 15% 28% 33% 36%
Qld 0.0 0.0 0.0 0.0 391.3 413.8 513.0 597.6 26% 28% 34% 40%
NSW 5.9 32.3 -5.1 2.1 1,175.8 1,882.6 1,814.0 2,156.9 17% 28% 28% 33%
ACT 0.0 0.0 0.0 0.0 26.6 53.1 79.5 104.1 51% 101% 151% 219%
Vic 5.8 4.1 2.0 22.3 275.8 1,028.9 1,494.4 1,251.4 8% 30% 44% 37%
SA -12.0 -11.1 -1.2 -3.9 48.7 76.6 99.2 160.5 8% 13% 17% 28%
Murray-Kiewa-Ovens 13.9 3.4 -6.9 -0.0 -145.0 186.1 483.0 560.8 -9% 12% 32% 37%
Gbn-Bkn-Camp-Lodd -8.1 0.7 8.8 22.4 392.7 786.5 940.9 626.8 21% 43% 54% 36%

Transition period water take report 2012‒13 to 2015‒16
Page 147
Other aspects of s71 reporting
SDL Resource Unit
Annual authorised (allocated) water including interceptions8
(GL/y) (s71(1)(d))
Actual take / annual authorised water (%)
2012-13 2013-14 2014-15 2015-16 2012-13 2013-14 2014-15 2015-16
Paroo 9.7 9.7 9.7 9.7 100% 100% 100% 100%
Warrego 85.8 85.6 91.2 86.7 100% 98% 99% 99%
Nebine 25.0 25.0 25.1 26.4 100% 100% 100% 100%
Condamine–Balonne 1,305.3 903.4 629.1 539.6 97% 97% 98% 98%
Moonie 84.6 63.9 54.7 51.8 100% 100% 100% 100%
Queensland Border Rivers 482.0 234.2 196.6 192.7 95% 96% 92% 87%
NSW Border Rivers 421.7 338.0 199.0 276.5 78% 89% 86% 80%
Intersecting Streams9 131.8 137.6 131.3 131.3 89% 85% 89% 89%
Gwydir 845.2 729.2 392.6 308.2 68% 78% 74% 88%
Namoi 723.0 642.1 416.5 388.5 81% 92% 89% 90%
Macquarie –Castlereagh 1,107.9 948.4 741.4 737.9 70% 64% 58% 61%
Lachlan 930.8 926.8 745.3 741.6 71% 61% 68% 66%
Murrumbidgee 3,631.6 2,887.5 2,644.6 2,163.0 77% 81% 83% 85%
Barwon–Darling Watercourse10 475.1 471.0 517.2 511.1 42% 19% 9% 17%
Lower Darling 180.7 128.3 96.8 60.7 57% 85% 52% 27%
NSW Murray 2,798.5 2,045.7 1,872.4 1,291.6 72% 78% 74% 64%
Australian Capital Territory (surface water)11 85.1 86.7 88.7 87.7 36% 35% 33% 37%
Victorian Murray
2,671.8 1,654.2 1,869.1 2,036.0 67% 86% 81% 72% Kiewa
Ovens

Transition period water take report 2012‒13 to 2015‒16
Page 148
Other aspects of s71 reporting
SDL Resource Unit
Annual authorised (allocated) water including interceptions8
(GL/y) (s71(1)(d))
Actual take / annual authorised water (%)
2012-13 2013-14 2014-15 2015-16 2012-13 2013-14 2014-15 2015-16
Broken
1,927.1 1,902.7 1,621.6 1,646.5 81% 77% 89% 85%
Goulburn
Campaspe
Loddon
Wimmera–Mallee (surface water) 212.4 283.5 207.0 191.3 38% 27% 39% 43%
South Australian Murray 659.3 609.5 604.7 672.2 79% 73% 83% 89%
South Australian Non-Prescribed Areas 3.5 3.5 3.5 3.5 100% 100% 100% 100%
Marne Saunders 3.3 3.3 3.2 3.3 66% 67% 73% 62%
Eastern Mount Lofty Ranges 23.9 25.1 28.1 27.8 100% 100% 71% 43%
MDB 18,825.2 15,144.8 13,189.4 12,185.7 75% 77% 77% 75%
Qld 1,992.4 1,321.8 1,006.3 906.9 97% 97% 97% 96%
NSW 11,246.4 9,254.5 7,757.3 6,610.5 72% 74% 72% 70%
ACT 85.1 86.7 88.7 87.7 36% 35% 33% 37%
Vic 4,811.3 3,840.4 3,697.7 3,873.8 71% 78% 82% 76%
SA 689.9 641.4 639.5 706.8 80% 74% 82% 87%
8. Authorised water for use is the sum of: net carryover volume from previous year; allocations in regulated systems; unregulated entitlements and actual use of
supplementary water for NSW; actual use of unregulated streams and losses in diversions for Victoria; actual use of floodplain harvesting, unsupplemented and urban water for Queensland; SA water allocations in EMLR region and authorised water for SA non-prescribed Murray region; Commonwealth and Lake Burley Griffin diversions for the ACT. For the NSW Barwon-Darling this reflects account access moderated by annual use limits and is subject to the actual flows being available to meet pumping thresholds.

Transition period water take report 2012‒13 to 2015‒16
Page 149
11. Appendix 2: Groundwater SDL trial water take account
Groundwater SDL trial water take account at SDL resource unit level.
BDL1
(GL/y) SDL2
(GL/y)
State planning
limit4
(GL/y)
GW HEW5
at 1 July 2016
(GL/y)
Basic rights6
TDL8
(GL/y) s.71(1)(b) - permitted take7
SDL res. unit code
SDL resource unit WRP area State 2012-13 2013-14 2014-15 2015-16
GS54 Queensland Border Rivers Alluvium Queensland Border Rivers Qld 14.0 14.0 20.6 1.44 14.0 14.0 14.0 14.0
GS55 Queensland Border Rivers Fractured Rock Queensland Border Rivers Qld 10.1 10.5 10.5 1.51 10.5 10.5 10.5 10.5
GS57 Sediments above the Great Artesian Basin: Border Rivers Queensland Border Rivers Qld 0.04 14.4 3.04 0.04 14.4 14.4 14.4 14.4
GS59 Sediments above the Great Artesian Basin: Moonie Moonie Qld 0.10 32.5 3.10 0.08 32.5 32.5 32.5 32.5
GS62 St George Alluvium: Moonie Moonie Qld 0.01 0.69 0.69 0.01 0.69 0.69 0.69 0.69
GS53 Condamine Fractured Rock Condamine-Balonne Qld 0.81 1.48 1.50 0.66 1.48 1.48 1.48 1.48
GS56 Queensland MDB: deep Condamine-Balonne Qld 0.00 100.0 0.10 0.00 100.0 100.0 100.0 100.0
GS58 Sediments above the Great Artesian Basin: Condamine–Balonne Condamine-Balonne Qld 0.66 18.1 3.66 0.59 18.1 18.1 18.1 18.1
GS61 St George Alluvium: Condamine–Balonne (shallow) Condamine-Balonne Qld 0.77 27.7 3.80 0.77 27.7 27.7 27.7 27.7
GS61 St George Alluvium: Condamine–Balonne (deep) Condamine-Balonne Qld 12.6 12.6 12.6 0.00 12.6 12.6 12.6 12.6
GS64a Upper Condamine Alluvium (Central Condamine Alluvium) Condamine-Balonne Qld 81.4 46.0 92.0 0.00 6.00 81.4 81.4 81.4 81.4
GS64b Upper Condamine Alluvium (Tributaries) Condamine-Balonne Qld 45.5 40.5 45.5 0.00 3.50 45.5 45.5 45.5 45.5
GS65 Upper Condamine Basalts Condamine-Balonne Qld 79.0 79.0 79.0 17.86 79.0 79.0 79.0 79.0
GS60 Sediments above the Great Artesian Basin: Warrego–Paroo–Nebine Warrego-Paroo-Nebine Qld 1.21 99.2 9.21 1.11 99.2 99.2 99.2 99.2
GS63 St George Alluvium: Warrego–Paroo–Nebine Warrego-Paroo-Nebine Qld 0.12 24.6 0.10 0.12 24.6 24.6 24.6 24.6
GS66 Warrego Alluvium Warrego-Paroo-Nebine Qld 0.70 10.2 2.70 0.40 10.2 10.2 10.2 10.2
GS50 Western Porous Rock Western Porous Rock NSW 63.1 116.6 530.5 26.75 116.6 116.6 116.6 116.6
GS42 Upper Darling Alluvium Darling Alluvium NSW 6.29 6.59 19.12 2.28 6.59 6.59 6.59 6.59
GS23 Lower Darling Alluvium Darling Alluvium NSW 2.23 2.23 2.23 0.73 2.23 2.23 2.23 2.23
GS13 Billabong Creek Alluvium Murray Alluvium NSW 7.50 7.50 7.50 0.03 0.64 7.50 7.50 7.50 7.50
GS27 Lower Murray Alluvium (shallow) Murray Alluvium NSW 81.9 81.9 81.9 0.03 0.99 81.9 81.9 81.9 81.9
GS27 Lower Murray Alluvium (deep) Murray Alluvium NSW 88.9 88.9 88.9 1.32 1.53 118.0 108.3 98.6 88.9

Transition period water take report 2012‒13 to 2015‒16
Page 150
Groundwater SDL trial water take account at SDL resource unit level.
BDL1
(GL/y) SDL2
(GL/y)
State planning
limit4
(GL/y)
GW HEW5
at 1 July 2016
(GL/y)
Basic rights6
TDL8
(GL/y) s.71(1)(b) - permitted take7
SDL res. unit code
SDL resource unit WRP area State 2012-13 2013-14 2014-15 2015-16
GS46 Upper Murray Alluvium Murray Alluvium NSW 14.1 14.1 14.1 0.14 0.40 14.1 14.1 14.1 14.1
GS38 Oaklands Basin Murray Alluvium NSW 0.00 2.50 0.00 0.00 2.50 2.50 2.50 2.50
GS21 Lake George Alluvium Murrumbidgee Alluvium NSW 1.27 1.27 1.27 0.03 1.27 1.27 1.27 1.27
GS28 Lower Murrumbidgee Alluvium (shallow) Murrumbidgee Alluvium NSW 26.9 26.9 13.0 3.00 26.9 26.9 26.9 26.9
GS28 Lower Murrumbidgee Alluvium (deep) Murrumbidgee Alluvium NSW 273.6 273.6 271.0 5.05 1.00 286.0 281.9 277.7 273.6
GS31 Mid-Murrumbidgee Alluvium Murrumbidgee Alluvium NSW 53.5 53.5 53.5 0.80 53.5 53.5 53.5 53.5
GS12 Belubula Alluvium Lachlan Alluvium NSW 2.88 2.88 2.88 0.04 2.88 2.88 2.88 2.88
GS25 Lower Lachlan Alluvium Lachlan Alluvium NSW 123.4 117.0 112.0 4.00 127.6 125.5 123.4 121.2
GS44 Upper Lachlan Alluvium Lachlan Alluvium NSW 94.2 94.2 94.2 6.28 94.2 94.2 94.2 94.2
GS10 Adelaide Fold Belt Lachlan and South Western Fractured Rock
NSW 3.61 6.90 26.0 2.14 6.90 6.90 6.90 6.90
GS19 Kanmantoo Fold Belt Lachlan and South Western Fractured Rock
NSW 8.9 18.7 121.5 8.15 18.7 18.7 18.7 18.7
GS20 Lachlan Fold Belt Lachlan and South Western Fractured Rock
NSW 142.4 259.0 901.8 0.03 74.31 259.0 259.0 259.0 259.0
GS39 Orange Basalt Lachlan and South Western Fractured Rock
NSW 10.7 10.7 16.2 1.16 10.7 10.7 10.7 10.7
GS51 Young Granite Lachlan and South Western Fractured Rock
NSW 7.11 7.11 9.50 0.76 7.11 7.11 7.11 7.11
GS11 Bell Valley Alluvium Macquarie-Castlereagh Alluvium NSW 3.29 3.29 3.29 0.01 3.29 3.29 3.29 3.29
GS14 Castlereagh Alluvium Macquarie-Castlereagh Alluvium NSW 0.62 0.62 0.62 0.08 0.62 0.62 0.62 0.62
GS15 Coolaburragundy-Talbragar Alluvium Macquarie-Castlereagh Alluvium NSW 3.47 3.47 3.47 0.07 3.47 3.47 3.47 3.47
GS16 Cudgegong Alluvium Macquarie-Castlereagh Alluvium NSW 2.53 2.53 2.53 0.03 2.53 2.53 2.53 2.53
GS26 Lower Macquarie Alluvium Macquarie-Castlereagh Alluvium NSW 70.7 70.7 69.3 1.73 71.4 71.2 71.0 70.7
GS45 Upper Macquarie Alluvium Macquarie-Castlereagh Alluvium NSW 17.9 17.9 17.9 0.30 17.9 17.9 17.9 17.9
GS34 NSW GAB Surat Shallow New South Wales Great Artesian Basin Shallow
NSW 6.6 15.5 143.3 0.98 15.5 15.5 15.5 15.5
GS35 NSW GAB Warrego Shallow New South Wales Great Artesian Basin Shallow
NSW 0.7 33.4 115.7 0.65 33.4 33.4 33.4 33.4
GS36 NSW GAB Central Shallow New South Wales Great Artesian Basin Shallow
NSW 0.25 8.83 145.6 1.16 8.83 8.83 8.83 8.83

Transition period water take report 2012‒13 to 2015‒16
Page 151
Groundwater SDL trial water take account at SDL resource unit level.
BDL1
(GL/y) SDL2
(GL/y)
State planning
limit4
(GL/y)
GW HEW5
at 1 July 2016
(GL/y)
Basic rights6
TDL8
(GL/y) s.71(1)(b) - permitted take7
SDL res. unit code
SDL resource unit WRP area State 2012-13 2013-14 2014-15 2015-16
GS29 Lower Namoi Alluvium Namoi Alluvium NSW 88.3 88.3 89.3 3.30 94.6 92.5 90.4 88.3
GS30 Manilla Alluvium Namoi Alluvium NSW 1.23 1.23 1.23 0.02 1.23 1.23 1.23 1.23
GS40 Peel Valley Alluvium Namoi Alluvium NSW 9.34 9.34 9.34 0.24 9.34 9.34 9.34 9.34
GS47 Upper Namoi Alluvium Namoi Alluvium NSW 123.4 123.4 124.9 2.83 135.8 131.7 127.7 123.4
GS48 Upper Namoi Tributary Alluvium Namoi Alluvium NSW 1.77 1.77 1.77 0.04 1.77 1.77 1.77 1.77
GS24 Lower Gwydir Alluvium Gwydir Alluvium NSW 33.0 33.0 33.0 0.70 39.0 37.0 35.0 33.0
GS43 Upper Gwydir Alluvium Gwydir Alluvium NSW 0.72 0.72 0.72 0.07 0.72 0.72 0.72 0.72
GS17 Gunnedah-Oxley Basin MDB Eastern Porous Rock NSW 22.1 114.5 205.6 5.78 114.5 114.5 114.5 114.5
GS41 Sydney Basin MDB Eastern Porous Rock NSW 3.1 17.2 60.4 0.47 17.2 17.2 17.2 17.2
GS18 Inverell Basalt New England Fractured Rock and Northern Basalts
NSW 4.15 4.15 25.8 1.07 4.15 4.15 4.15 4.15
GS22 Liverpool Ranges Basalt New England Fractured Rock and Northern Basalts
NSW 2.16 2.16 19.1 1.83 2.16 2.16 2.16 2.16
GS37 New England Fold Belt New England Fractured Rock and Northern Basalts
NSW 32.9 55.1 276.0 18.57 55.1 55.1 55.1 55.1
GS49 Warrumbungle Basalt New England Fractured Rock and Northern Basalts
NSW 0.55 0.55 5.71 0.54 0.55 0.55 0.55 0.55
GS32 NSW Border Rivers Alluvium New South Wales Border Rivers Alluvium
NSW 8.40 8.40 8.40 0.24 8.40 8.40 8.40 8.40
GS33 NSW Border Rivers Tributary Alluvium New South Wales Border Rivers Alluvium
NSW 0.41 0.41 0.41 0.14 0.41 0.41 0.41 0.41
GS52 Australian Capital Territory (Groundwater) Australian Capital Territory (groundwater)
ACT 1.70 3.16 7.25 0.00 3.16 3.16 3.16 3.16
GS8 Goulburn-Murray: Shepparton Irrigation Region Goulburn-Murray Vic 244.1 244.1 244.1 0.00 244.1 244.1 244.1 244.1
GS8 Goulburn-Murray: Highlands Goulburn-Murray Vic 38.3 50.5 38.3 3.85 50.5 50.5 50.5 50.5
GS8 Goulburn-Murray: Sedimentary Plain Goulburn-Murray Vic 203.5 203.5 214.0 15.38 203.5 203.5 203.5 203.5
GS8 Goulburn-Murray: deep Goulburn-Murray Vic 0.0 20.0 0.0 0.00 20.0 20.0 20.0 20.0
GS9 Wimmera-Mallee: Highlands Wimmera-Mallee Vic 1.26 2.14 1.30 0.28 2.14 2.14 2.14 2.14
GS9 Wimmera-Mallee: Sedimentary Plain Wimmera-Mallee Vic 68.9 190.7 68.9 1.10 190.7 190.7 190.7 190.7
GS9 Wimmera-Mallee: deep Wimmera-Mallee Vic 0.0 20.0 0.0 0.00 20.0 20.0 20.0 20.0

Transition period water take report 2012‒13 to 2015‒16
Page 152
Groundwater SDL trial water take account at SDL resource unit level.
BDL1
(GL/y) SDL2
(GL/y)
State planning
limit4
(GL/y)
GW HEW5
at 1 July 2016
(GL/y)
Basic rights6
TDL8
(GL/y) s.71(1)(b) - permitted take7
SDL res. unit code
SDL resource unit WRP area State 2012-13 2013-14 2014-15 2015-16
GS3 Mallee (Pliocene Sands) South Australian Murray Region SA 0.0 41.4 0.0 0.00 41.4 41.4 41.4 41.4
GS3 Mallee (Murray Group Limestone) South Australian Murray Region SA 65.7 65.7 63.6 2.28 65.7 65.7 65.7 65.7
GS3 Mallee (Renmark Group) South Australian Murray Region SA 0.00 2.00 0.00 0.00 2.00 2.00 2.00 2.00
GS5 Peake–Roby–Sherlock (unconfined limestone) South Australian Murray Region SA 3.41 3.41 3.41 0.19 3.41 3.41 3.41 3.41
GS5 Peake-Roby-Sherlock (confined strata - Buccleuch formation and Renmark Group)
South Australian Murray Region SA 2.58 2.58 2.58 0.41 2.58 2.58 2.58 2.58
GS6 SA Murray (Groundwater) South Australian Murray Region SA 1.8 64.8 0.0 1.80 64.8 64.8 64.8 64.8
GS7 SA Murray Salt Interception Schemes South Australian Murray Region SA 11.1 28.6 0.0 0.00 28.6 28.6 28.6 28.6
GS1 Angas Bremer (Quaternary) Eastern Mount Lofty Ranges SA 0.00 1.09 0.25 0.00 1.09 1.09 1.09 1.09
GS1 Angas Bremer (Murray Group Limestone) Eastern Mount Lofty Ranges SA 6.57 6.57 6.60 0.07 6.57 6.57 6.57 6.57
GS2 Eastern Mount Lofty Ranges Eastern Mount Lofty Ranges SA 34.7 38.5 38.5 2.14 38.5 38.5 38.5 38.5
GS4 Marne Saunders (fractured rock) Eastern Mount Lofty Ranges SA 2.09 2.09 2.10 0.09 2.09 2.09 2.09 2.09
GS4 Marne Saunders (Murray Group Limestone including overlying Quaternary sediments)
Eastern Mount Lofty Ranges SA 2.38 2.38 2.40 0.18 2.38 2.38 2.38 2.38
GS4 Marne Saunders (Renmark Group) Eastern Mount Lofty Ranges SA 0.50 0.50 0.50 0.00 0.50 0.50 0.50 0.50
TOTALS MDB 2,385.5 3,333.6 4,712.5 6.6 237.7 3,451.4 3,427.1 3,402.8 3,378.3
Qld 247.0 531.5 288.1 - 34.1 571.9 571.9 571.9 571.9
NSW 1,450.0 1,808.4 3,730.5 6.6 175.8 1,885.9 1,861.5 1,837.2 1,812.7
ACT 1.7 3.2 7.3 - - 3.2 3.2 3.2 3.2
Vic 556.0 730.9 566.7 - 20.6 730.9 730.9 730.9 730.9
SA 130.8 259.7 119.9 - 7.2 259.7 259.7 259.7 259.7

Transition period water take report 2012‒13 to 2015‒16
Page 153
Basin Plan Chapter 6 Part 4 - Trial compliance arrangements
Actual take9
(GL/y) s.71(1)(c) - actual take
Actual take/TDL (%)
Debit / credit10 (TDL - actual)
(GL/y)
Cumulative balance (Cumulative annual TDL - annual actual)
(GL/y)
Indicative compliance test (Non-binding) 20% with long-term TDL13
(Cumulative balance / TDL) Basin Plan s6.12(1)(a)
SDL resource unit 2012-13 2013-14 2014-15 2015-16 2012-13 2013-14 2014-15 2015-16 2012-13 2013-14 2014-15 2015-16 2012-13 2013-14 2014-15 2015-16 2012-13 2013-14 2014-15 2015-16
Queensland Border Rivers Alluvium
8.85 11.32 11.79 12.82 63% 81% 84% 92% 5.1 2.7 2.2 1.2 5.1 7.8 10.0 11.2 37% 56% 72% 80%
Queensland Border Rivers Fractured Rock
9.52 9.52 9.52 10.16 90% 90% 90% 97% 1.0 1.0 1.0 0.4 1.0 2.0 3.0 3.4 10% 19% 29% 32%
Sediments above the Great Artesian Basin: Border Rivers
0.02 0.03 0.03 0.04 0% 0% 0% 0% 14.4 14.4 14.4 14.3 14.4 28.7 43.1 57.4 100% 200% 299% 399%
Sediments above the Great Artesian Basin: Moonie
0.08 0.08 0.30 0.32 0% 0% 1% 1% 32.4 32.4 32.2 32.2 32.4 64.9 97.1 129.3 100% 200% 299% 398%
St George Alluvium: Moonie 0.01 0.01 0.01 0.01 1% 1% 1% 1% 0.7 0.7 0.7 0.7 0.7 1.4 2.0 2.7 99% 197% 296% 395%
Condamine Fractured Rock 0.32 0.32 0.58 1.07 22% 22% 39% 72% 1.2 1.2 0.9 0.4 1.2 2.3 3.2 3.6 78% 157% 217% 245%
Queensland MDB: deep 0.00 0.00 0.00 0.10 0% 0% 0% 0% 100.0 100.0 100.0 99.9 100.0 200.0 300.0 399.9 100% 200% 300% 400%
Sediments above the Great Artesian Basin: Condamine–Balonne
0.46 0.50 0.50 0.66 3% 3% 3% 4% 17.7 17.6 17.6 17.5 17.7 35.3 53.0 70.4 97% 195% 292% 388%
St George Alluvium: Condamine–Balonne (shallow)
0.77 0.77 0.77 1.12 3% 3% 3% 4% 26.9 26.9 26.9 26.6 26.9 53.9 80.8 107.4 97% 194% 292% 388%
St George Alluvium: Condamine–Balonne (deep)
9.50 11.62 11.62 11.61 75% 92% 92% 92% 3.1 1.0 1.0 1.0 3.1 4.1 5.1 6.1 25% 32% 40% 48%
Upper Condamine Alluvium (Central Condamine Alluvium)
32.33 55.09 41.08 41.96 40% 68% 50% 52% 49.1 26.3 40.3 39.4 49.1 75.4 115.7 155.1 60% 93% 142% 191%
Upper Condamine Alluvium (Tributaries)
33.89 32.89 30.58 32.65 74% 72% 67% 72% 11.6 12.6 14.9 12.9 11.6 24.2 39.1 52.0 26% 53% 86% 114%
Upper Condamine Basalts 65.09 70.11 69.26 72.66 82% 89% 88% 92% 13.9 8.9 9.7 6.3 13.9 22.7 32.4 38.7 18% 29% 41% 49%
Sediments above the Great Artesian Basin: Warrego–Paroo–Nebine
0.80 0.86 0.78 1.24 1% 1% 1% 1% 98.4 98.3 98.4 97.9 98.4 196.7 295.1 393.0 99% 198% 298% 396%
St George Alluvium: Warrego–Paroo–Nebine
0.09 0.11 0.11 0.12 0% 0% 0% 0% 24.5 24.5 24.5 24.5 24.5 49.0 73.5 97.9 100% 199% 299% 398%
Warrego Alluvium 0.64 0.64 0.72 0.72 6% 6% 7% 7% 9.6 9.6 9.5 9.5 9.6 19.2 28.7 38.3 94% 188% 281% 374%
Western Porous Rock 34.99 36.66 29.91 35.79 30% 31% 26% 31% 81.6 79.9 86.7 80.8 81.6 161.5 248.2 329.0 70% 139% 213% 282%
Upper Darling Alluvium 2.80 3.50 4.00 4.20 43% 53% 61% 64% 3.8 3.1 2.6 2.4 3.8 6.9 9.5 11.9 57% 104% 144% 180%
Lower Darling Alluvium 0.73 0.73 0.77 0.78 33% 33% 35% 35% 1.5 1.5 1.5 1.5 1.5 3.0 4.5 5.9 67% 135% 200% 265%

Transition period water take report 2012‒13 to 2015‒16
Page 154
Basin Plan Chapter 6 Part 4 - Trial compliance arrangements
Actual take9
(GL/y) s.71(1)(c) - actual take
Actual take/TDL (%)
Debit / credit10 (TDL - actual)
(GL/y)
Cumulative balance (Cumulative annual TDL - annual actual)
(GL/y)
Indicative compliance test (Non-binding) 20% with long-term TDL13
(Cumulative balance / TDL) Basin Plan s6.12(1)(a)
SDL resource unit 2012-13 2013-14 2014-15 2015-16 2012-13 2013-14 2014-15 2015-16 2012-13 2013-14 2014-15 2015-16 2012-13 2013-14 2014-15 2015-16 2012-13 2013-14 2014-15 2015-16
Billabong Creek Alluvium 1.97 2.14 2.08 3.28 26% 29% 28% 44% 5.5 5.4 5.4 4.2 5.5 10.9 16.3 20.5 74% 145% 217% 274%
Lower Murray Alluvium (shallow)
2.26 4.10 5.90 5.40 3% 5% 7% 7% 79.6 77.8 76.0 76.5 79.6 157.4 233.4 309.9 97% 192% 285% 378%
Lower Murray Alluvium (deep)
56.17 45.19 67.49 85.50 48% 42% 68% 96% 61.8 63.1 31.1 3.4 61.8 124.9 156.0 159.4 52% 115% 158% 179%
Upper Murray Alluvium 12.29 10.66 9.87 11.18 87% 76% 70% 79% 1.8 3.4 4.2 2.9 1.8 5.3 9.5 12.4 13% 37% 67% 88%
Oaklands Basin 0.00 0.00 0.00 0.00 0% 0% 0% 0% 2.5 2.5 2.5 2.5 2.5 5.0 7.5 10.0 100% 200% 300% 400%
Lake George Alluvium 1.05 0.44 0.42 0.62 83% 35% 33% 49% 0.2 0.8 0.8 0.6 0.2 1.0 1.9 2.5 17% 82% 149% 200%
Lower Murrumbidgee Alluvium (shallow)
5.25 6.47 7.15 6.21 20% 24% 27% 23% 21.6 20.4 19.7 20.7 21.6 42.0 61.8 82.4 80% 156% 230% 307%
Lower Murrumbidgee Alluvium (deep)
179.58 230.25 300.31 268.45 63% 82% 108% 98% 106.4 51.6 - 22.6 5.2 106.4 158.0 135.5 140.6 37% 56% 49% 51%
Mid-Murrumbidgee Alluvium 35.50 36.06 40.08 32.43 66% 67% 75% 61% 18.0 17.4 13.4 21.1 18.0 35.4 48.8 69.9 34% 66% 91% 131%
Belubula Alluvium 1.44 0.84 0.60 0.72 50% 29% 21% 25% 1.4 2.0 2.3 2.2 1.4 3.5 5.8 7.9 50% 121% 200% 275%
Lower Lachlan Alluvium 87.21 104.90 120.47 97.53 68% 84% 98% 80% 40.4 20.6 2.9 23.7 40.4 61.0 63.9 87.6 32% 49% 52% 72%
Upper Lachlan Alluvium 44.24 42.26 57.20 55.65 47% 45% 61% 59% 49.9 51.9 37.0 38.5 49.9 101.8 138.8 177.3 53% 108% 147% 188%
Adelaide Fold Belt 2.14 2.14 2.14 2.14 31% 31% 31% 31% 4.8 4.8 4.8 4.8 4.8 9.5 14.3 19.0 69% 138% 207% 276%
Kanmantoo Fold Belt 8.15 8.65 8.15 8.15 44% 46% 44% 44% 10.6 10.1 10.6 10.6 10.6 20.6 31.2 41.7 56% 110% 167% 223%
Lachlan Fold Belt 80.55 82.05 78.80 79.69 31% 32% 30% 31% 178.5 177.0 180.2 179.3 178.5 355.4 535.6 714.9 69% 137% 207% 276%
Orange Basalt 1.86 1.69 1.61 1.65 17% 16% 15% 15% 8.8 9.0 9.1 9.0 8.8 17.8 26.8 35.9 83% 167% 252% 336%
Young Granite 1.90 1.76 1.44 2.19 27% 25% 20% 31% 5.2 5.4 5.7 4.9 5.2 10.6 16.2 21.2 73% 149% 228% 298%
Bell Valley Alluvium 1.37 1.35 1.44 1.41 42% 41% 44% 43% 1.9 1.9 1.9 1.9 1.9 3.9 5.7 7.6 58% 117% 174% 231%
Castlereagh Alluvium 0.08 0.08 0.08 0.08 13% 13% 13% 13% 0.5 0.5 0.5 0.5 0.5 1.1 1.6 2.2 87% 174% 261% 348%
Coolaburragundy-Talbragar Alluvium
1.40 2.08 1.72 2.19 40% 60% 50% 63% 2.1 1.4 1.8 1.3 2.1 3.5 5.2 6.5 60% 100% 150% 187%
Cudgegong Alluvium 1.23 1.79 2.34 1.91 49% 71% 92% 75% 1.3 0.7 0.2 0.6 1.3 2.0 2.2 2.9 51% 81% 88% 113%

Transition period water take report 2012‒13 to 2015‒16
Page 155
Basin Plan Chapter 6 Part 4 - Trial compliance arrangements
Actual take9
(GL/y) s.71(1)(c) - actual take
Actual take/TDL (%)
Debit / credit10 (TDL - actual)
(GL/y)
Cumulative balance (Cumulative annual TDL - annual actual)
(GL/y)
Indicative compliance test (Non-binding) 20% with long-term TDL13
(Cumulative balance / TDL) Basin Plan s6.12(1)(a)
SDL resource unit 2012-13 2013-14 2014-15 2015-16 2012-13 2013-14 2014-15 2015-16 2012-13 2013-14 2014-15 2015-16 2012-13 2013-14 2014-15 2015-16 2012-13 2013-14 2014-15 2015-16
Lower Macquarie Alluvium 36.74 40.32 45.92 47.13 51% 57% 65% 67% 34.7 30.9 25.0 23.6 34.7 65.6 90.6 114.2 49% 92% 128% 161%
Upper Macquarie Alluvium 13.69 14.05 15.34 15.95 76% 78% 86% 89% 4.3 3.9 2.6 2.0 4.3 8.1 10.7 12.7 24% 45% 60% 71%
NSW GAB Surat Shallow 2.55 2.16 2.20 1.19 16% 14% 14% 8% 13.0 13.3 13.3 14.3 13.0 26.3 39.6 53.9 84% 170% 255% 348%
NSW GAB Warrego Shallow 0.65 0.65 0.65 0.65 2% 2% 2% 2% 32.7 32.7 32.7 32.7 32.7 65.5 98.2 130.9 98% 196% 294% 392%
NSW GAB Central Shallow 1.16 1.16 1.16 1.16 13% 13% 13% 13% 7.7 7.7 7.7 7.7 7.7 15.3 23.0 30.7 87% 174% 261% 347%
Lower Namoi Alluvium 61.09 104.30 105.05 92.96 65% 113% 116% 105% 33.5 - 11.8 - 14.6 - 4.7 33.5 21.7 7.1 2.4 35% 23% 8% 3%
Manilla Alluvium 0.17 0.25 0.24 0.26 14% 20% 20% 21% 1.1 1.0 1.0 1.0 1.1 2.0 3.0 4.0 86% 166% 246% 325%
Peel Valley Alluvium 7.96 8.66 7.19 6.60 85% 93% 77% 71% 1.4 0.7 2.2 2.7 1.4 2.1 4.2 7.0 15% 22% 45% 74%
Upper Namoi Alluvium 90.12 113.64 102.37 93.72 66% 86% 80% 76% 45.6 18.1 25.3 29.7 45.6 63.7 89.0 118.7 34% 48% 70% 96%
Upper Namoi Tributary Alluvium
0.55 0.39 0.21 0.23 31% 22% 12% 13% 1.2 1.4 1.6 1.5 1.2 2.6 4.2 5.7 69% 147% 235% 322%
Lower Gwydir Alluvium 29.33 46.38 43.33 35.54 75% 125% 124% 108% 9.6 - 9.4 - 8.3 - 2.5 9.6 0.2 - 8.1 - 10.6 25% 1% -23% -32%
Upper Gwydir Alluvium 0.07 0.07 0.07 0.07 10% 10% 10% 10% 0.7 0.7 0.7 0.7 0.7 1.3 2.0 2.6 90% 181% 271% 361%
Gunnedah-Oxley Basin MDB
9.59 11.90 12.47 11.84 8% 10% 11% 10% 104.9 102.6 102.0 102.6 104.9 207.4 309.4 412.0 92% 181% 270% 360%
Sydney Basin MDB 0.47 0.47 0.47 0.47 3% 3% 3% 3% 16.7 16.7 16.7 16.7 16.7 33.4 50.1 66.8 97% 195% 292% 389%
Inverell Basalt 1.07 1.07 1.17 1.58 26% 26% 28% 38% 3.1 3.1 3.0 2.6 3.1 6.2 9.1 11.7 74% 148% 220% 282%
Liverpool Ranges Basalt 1.83 1.85 1.83 1.84 85% 86% 85% 85% 0.3 0.3 0.3 0.3 0.3 0.6 1.0 1.3 15% 29% 45% 59%
New England Fold Belt 19.76 20.13 19.89 19.99 36% 37% 36% 36% 35.3 35.0 35.2 35.1 35.3 70.3 105.5 140.6 64% 128% 192% 255%
Warrumbungle Basalt 0.54 0.54 0.54 0.54 98% 98% 98% 98% 0.0 0.0 0.0 0.0 0.0 0.0 0.0 0.0 2% 4% 6% 8%
NSW Border Rivers Alluvium 2.84 5.59 5.41 3.98 34% 67% 64% 47% 5.6 2.8 3.0 4.4 5.6 8.4 11.4 15.8 66% 100% 135% 188%
NSW Border Rivers Tributary Alluvium
0.16 0.17 0.17 0.17 39% 41% 41% 41% 0.3 0.2 0.2 0.2 0.3 0.5 0.7 1.0 61% 120% 178% 237%
Australian Capital Territory (Groundwater)
0.58 0.46 0.76 0.96 18% 15% 24% 30% 2.6 2.7 2.4 2.2 2.6 5.3 7.7 9.9 82% 167% 243% 312%

Transition period water take report 2012‒13 to 2015‒16
Page 156
Basin Plan Chapter 6 Part 4 - Trial compliance arrangements
Actual take9
(GL/y) s.71(1)(c) - actual take
Actual take/TDL (%)
Debit / credit10 (TDL - actual)
(GL/y)
Cumulative balance (Cumulative annual TDL - annual actual)
(GL/y)
Indicative compliance test (Non-binding) 20% with long-term TDL13
(Cumulative balance / TDL) Basin Plan s6.12(1)(a)
SDL resource unit 2012-13 2013-14 2014-15 2015-16 2012-13 2013-14 2014-15 2015-16 2012-13 2013-14 2014-15 2015-16 2012-13 2013-14 2014-15 2015-16 2012-13 2013-14 2014-15 2015-16
Goulburn-Murray: Shepparton Irrigation Region
41.28 35.51 43.68 79.45 17% 15% 18% 33% 202.9 208.6 200.5 164.7 202.9 411.5 612.0 776.7 83% 169% 251% 318%
Goulburn-Murray: Highlands 9.91 5.52 19.92 13.09 20% 11% 39% 26% 40.5 44.9 30.5 37.4 40.5 85.5 116.0 153.4 80% 169% 230% 304%
Goulburn-Murray: Sedimentary Plain
101.24 98.43 136.46 141.53 50% 48% 67% 70% 102.2 105.0 67.0 61.9 102.2 207.2 274.2 336.2 50% 102% 135% 165%
Goulburn-Murray: deep 0.00 0.00 0.00 0.00 0% 0% 0% 0% 20.0 20.0 20.0 20.0 20.0 40.0 60.0 80.0 100% 200% 300% 400%
Wimmera-Mallee: Highlands 0.62 0.60 0.72 0.46 29% 28% 34% 22% 1.5 1.5 1.4 1.7 1.5 3.1 4.5 6.2 71% 143% 209% 288%
Wimmera-Mallee: Sedimentary Plain
9.94 9.18 12.33 7.33 5% 5% 6% 4% 180.7 181.5 178.3 183.3 180.7 362.2 540.6 723.9 95% 190% 284% 380%
Wimmera-Mallee: deep 0.00 0.00 0.00 0.00 0% 0% 0% 0% 20.0 20.0 20.0 20.0 20.0 40.0 60.0 80.0 100% 200% 300% 400%
Mallee (Pliocene Sands) 0.00 0.00 0.00 0.00 0% 0% 0% 0% 41.4 41.4 41.4 41.4 41.4 82.8 124.3 165.7 100% 200% 300% 400%
Mallee (Murray Group Limestone)
41.00 34.57 37.73 34.98 62% 53% 57% 53% 24.7 31.2 28.0 30.8 24.7 55.9 83.9 114.6 38% 85% 128% 174%
Mallee (Renmark Group) 0.00 0.00 0.00 0.00 0% 0% 0% 0% 2.0 2.0 2.0 2.0 2.0 4.0 6.0 8.0 100% 200% 300% 400%
Peake–Roby–Sherlock (unconfined limestone)
0.19 0.19 0.19 0.19 6% 6% 6% 6% 3.2 3.2 3.2 3.2 3.2 6.4 9.6 12.9 94% 189% 283% 378%
Peake-Roby-Sherlock (confined strata - Buccleuch formation and Renmark Group)
1.80 1.11 0.61 0.50 70% 43% 24% 19% 0.8 1.5 2.0 2.1 0.8 2.2 4.2 6.3 30% 87% 163% 244%
SA Murray (Groundwater) 1.80 1.80 1.80 1.80 3% 3% 3% 3% 63.0 63.0 63.0 63.0 63.0 126.0 188.9 251.9 97% 194% 292% 389%
SA Murray Salt Interception Schemes
9.94 11.31 9.55 11.85 35% 40% 33% 41% 18.7 17.3 19.1 16.8 18.7 36.0 55.1 71.9 65% 126% 192% 251%
Angas Bremer (Quaternary) 0.00 0.00 0.00 0.00 0% 0% 0% 0% 1.1 1.1 1.1 1.1 1.1 2.2 3.3 4.4 100% 200% 300% 400%
Angas Bremer (Murray Group Limestone)
2.06 1.74 1.44 1.20 31% 26% 22% 18% 4.5 4.8 5.1 5.4 4.5 9.3 14.5 19.8 69% 142% 220% 302%
Eastern Mount Lofty Ranges 2.13 2.13 2.13 9.58 6% 6% 6% 25% 36.4 36.4 36.4 28.9 36.4 72.8 109.1 138.1 94% 189% 283% 359%
Marne Saunders (fractured rock)
0.49 0.36 0.43 0.59 23% 17% 21% 28% 1.6 1.7 1.7 1.5 1.6 3.3 5.0 6.5 77% 159% 239% 311%
Marne Saunders (Murray Group Limestone including overlying Quaternary sediments)
1.60 1.34 1.40 1.53 67% 56% 59% 64% 0.8 1.0 1.0 0.8 0.8 1.8 2.8 3.6 33% 76% 117% 153%

Transition period water take report 2012‒13 to 2015‒16
Page 157
Basin Plan Chapter 6 Part 4 - Trial compliance arrangements
Actual take9
(GL/y) s.71(1)(c) - actual take
Actual take/TDL (%)
Debit / credit10 (TDL - actual)
(GL/y)
Cumulative balance (Cumulative annual TDL - annual actual)
(GL/y)
Indicative compliance test (Non-binding) 20% with long-term TDL13
(Cumulative balance / TDL) Basin Plan s6.12(1)(a)
SDL resource unit 2012-13 2013-14 2014-15 2015-16 2012-13 2013-14 2014-15 2015-16 2012-13 2013-14 2014-15 2015-16 2012-13 2013-14 2014-15 2015-16 2012-13 2013-14 2014-15 2015-16
Marne Saunders (Renmark Group)
0.00 0.00 0.00 0.00 0% 0% 0% 0% 0.5 0.5 0.5 0.5 0.5 1.0 1.5 2.0 100% 200% 300% 400%
MDB 1,231.4 1,397.7 1,556.4 1,535.3 36% 41% 46% 45% 2,220.0 2,029.5 1,846.4 1,843.0 2,220.0 4,249.4 6,095.8 7,938.8 64% 124% 179% 235%
Qld 162.4 193.9 177.6 187.2 28% 34% 31% 33% 409.5 378.0 394.2 384.6 409.5 787.5 1,181.8 1,566.4 72% 138% 207% 274%
NSW 844.5 999.5 1,109.7 1,043.0 45% 54% 60% 58% 1,041.4 862.0 727.6 769.7 1,041.4 1,903.4 2,630.9 3,400.6 55% 102% 143% 188%
ACT 0.6 0.5 0.8 1.0 18% 15% 24% 30% 2.6 2.7 2.4 2.2 2.6 5.3 7.7 9.9 82% 167% 243% 312%
Vic 163.0 149.2 213.1 241.9 22% 20% 29% 33% 567.9 581.6 517.8 489.0 567.9 1,149.5 1,667.3 2,156.3 78% 157% 228% 295%
SA 61.0 54.6 55.3 62.2 23% 21% 21% 24% 198.7 205.1 204.4 197.5 198.7 403.8 608.2 805.7 77% 155% 234% 310%

Transition period water take report 2012‒13 to 2015‒16
Page 158
Other aspects of s.71 reporting14
Allocation11 + Basic Rights
(GL/y) s.71(1)(d) - water allocations
Carry Over12
(GL/y) s.71(1)(d) - carry over
Allocation + Carry Over (GL/y)
s.71(1)(d) - water allocations
Actual Take / (Allocation + Carry Over) (%)
SDL resource unit 2012-13 2013-14 2014-15 2015-16 2012-13 2013-14 2014-15 2015-16 2012-13 2013-14 2014-15 2015-16 2012-13 2013-14 2014-15 2015-16
Queensland Border Rivers Alluvium 20.6 20.6 20.6 20.6 0.0 0.0 0.0 0.0 20.6 20.6 20.6 20.6 43% 55% 57% 62%
Queensland Border Rivers Fractured Rock 10.2 10.2 10.2 10.2 0.0 0.0 0.0 0.0 10.2 10.2 10.2 10.2 94% 94% 94% 100%
Sediments above the Great Artesian Basin: Border Rivers 0.0 0.0 0.0 0.0 0.0 0.0 0.0 0.0 0.0 0.0 0.0 0.0 57% 86% 86% 100%
Sediments above the Great Artesian Basin: Moonie 0.1 0.1 0.3 0.3 0.0 0.0 0.0 0.0 0.1 0.1 0.3 0.3 79% 79% 93% 100%
St George Alluvium: Moonie 0.0 0.0 0.0 0.0 0.0 0.0 0.0 0.0 0.0 0.0 0.0 0.0 100% 100% 100% 100%
Condamine Fractured Rock 0.8 0.8 1.1 1.1 0.0 0.0 0.0 0.0 0.8 0.8 1.1 1.1 39% 39% 54% 100%
Queensland MDB: deep 0.0 0.0 0.0 0.1 0.0 0.0 0.0 0.0 0.0 0.0 0.0 0.1 0% 0% 0% 100%
Sediments above the Great Artesian Basin: Condamine–Balonne
0.7 0.7 0.7 0.7 0.0 0.0 0.0 0.0 0.7 0.7 0.7 0.7 70% 76% 76% 100%
St George Alluvium: Condamine–Balonne (shallow) 0.8 0.8 0.8 1.1 0.0 0.0 0.0 0.0 0.8 0.8 0.8 1.1 100% 100% 100% 100%
St George Alluvium: Condamine–Balonne (deep) 10.2 12.6 12.6 11.6 0.0 0.0 0.0 0.0 10.2 12.6 12.6 11.6 93% 92% 92% 100%
Upper Condamine Alluvium (Central Condamine Alluvium) 60.9 60.9 60.9 60.9 43.1 29.5 37.9 34.0 104.0 90.4 98.8 94.9 31% 61% 42% 44%
Upper Condamine Alluvium (Tributaries) 43.0 41.7 41.7 41.8 7.8 7.8 8.5 9.3 50.8 49.5 50.2 51.1 67% 66% 61% 64%
Upper Condamine Basalts 79.0 79.0 78.8 79.0 3.7 3.7 3.8 4.1 82.7 82.7 82.6 83.1 79% 85% 84% 87%
Sediments above the Great Artesian Basin: Warrego–Paroo–Nebine
1.3 1.3 1.2 1.2 0.0 0.0 0.0 0.0 1.3 1.3 1.2 1.2 60% 65% 63% 100%
St George Alluvium: Warrego–Paroo–Nebine 0.1 0.1 0.1 0.1 0.0 0.0 0.0 0.0 0.1 0.1 0.1 0.1 75% 92% 92% 100%
Warrego Alluvium 0.6 0.6 0.7 0.7 0.0 0.0 0.0 0.0 0.6 0.6 0.7 0.7 100% 100% 100% 100%
Western Porous Rock 59.0 59.0 62.3 62.6 5.4 5.7 5.4 5.4 64.4 64.7 67.7 68.0 54% 57% 44% 53%
Upper Darling Alluvium 5.6 5.8 5.8 5.8 0.0 0.0 0.0 0.0 5.6 5.8 5.8 5.8 50% 60% 69% 72%
Lower Darling Alluvium 1.7 1.7 1.7 1.7 0.0 0.0 0.0 0.0 1.7 1.7 1.7 1.7 44% 44% 46% 47%
Billabong Creek Alluvium 7.2 7.2 7.2 7.6 0.0 2.9 5.7 0.0 7.2 10.1 12.9 7.6 28% 21% 16% 43%
Lower Murray Alluvium (shallow) 83.4 80.3 80.3 78.7 31.2 33.4 29.6 29.3 114.6 113.7 109.9 108.0 2% 4% 5% 5%
Lower Murray Alluvium (deep) 113.9 105.2 95.5 86.0 41.8 41.5 41.9 41.9 155.6 146.6 137.4 127.9 36% 31% 49% 67%
Upper Murray Alluvium 41.6 41.6 41.6 41.6 15.0 13.7 15.5 14.1 56.7 55.3 57.1 55.7 22% 19% 17% 20%

Transition period water take report 2012‒13 to 2015‒16
Page 159
Other aspects of s.71 reporting14
Allocation11 + Basic Rights
(GL/y) s.71(1)(d) - water allocations
Carry Over12
(GL/y) s.71(1)(d) - carry over
Allocation + Carry Over (GL/y)
s.71(1)(d) - water allocations
Actual Take / (Allocation + Carry Over) (%)
SDL resource unit 2012-13 2013-14 2014-15 2015-16 2012-13 2013-14 2014-15 2015-16 2012-13 2013-14 2014-15 2015-16 2012-13 2013-14 2014-15 2015-16
Oaklands Basin 0.0 0.0 0.0 0.0 0.0 0.0 0.0 0.0 0.0 0.0 0.0 0.0 0% 0% 0% 0%
Lake George Alluvium 1.3 1.3 1.3 1.3 0.0 0.0 0.0 0.0 1.3 1.3 1.3 1.3 83% 35% 33% 49%
Lower Murrumbidgee Alluvium (shallow) 8.2 8.2 8.2 8.2 5.2 5.2 4.9 4.7 13.4 13.4 13.1 12.9 39% 48% 54% 48%
Lower Murrumbidgee Alluvium (deep) 283.7 279.6 275.5 276.4 252.0 260.7 242.8 229.2 535.7 540.3 518.3 505.6 34% 43% 58% 53%
Mid-Murrumbidgee Alluvium 82.7 82.7 82.5 83.0 0.2 16.7 18.0 17.6 83.0 99.4 100.5 100.6 43% 36% 40% 32%
Belubula Alluvium 8.3 8.3 8.3 8.3 0.0 2.2 3.1 2.5 8.3 10.5 11.4 10.8 17% 8% 5% 7%
Lower Lachlan Alluvium 123.2 121.1 119.0 112.6 52.8 61.2 56.4 47.3 176.0 182.3 175.3 160.0 50% 58% 69% 61%
Upper Lachlan Alluvium 184.0 179.7 179.7 179.7 19.0 33.2 47.6 31.3 203.0 212.8 227.3 210.9 22% 20% 25% 26%
Adelaide Fold Belt 4.3 4.3 4.3 4.3 0.2 0.2 0.2 0.2 4.5 4.5 4.5 4.5 48% 48% 47% 47%
Kanmantoo Fold Belt 8.9 9.7 8.9 8.9 0.1 0.1 0.1 0.1 9.0 9.7 9.0 9.0 91% 89% 91% 91%
Lachlan Fold Belt 139.6 148.5 145.2 148.4 5.8 2.0 10.3 8.0 145.4 150.5 155.5 156.4 55% 55% 51% 51%
Orange Basalt 10.7 11.0 11.0 10.7 0.7 0.9 1.0 1.0 11.4 11.9 11.9 11.7 16% 14% 13% 14%
Young Granite 7.1 7.1 7.1 7.1 0.6 0.6 1.1 0.6 7.7 7.7 8.2 7.7 25% 23% 18% 28%
Bell Valley Alluvium 4.6 4.6 4.6 4.6 0.0 0.0 -0.0 0.0 4.6 4.6 4.6 4.6 30% 29% 31% 31%
Castlereagh Alluvium 0.7 0.7 0.7 0.7 0.0 0.0 0.0 0.0 0.7 0.7 0.7 0.7 12% 12% 12% 12%
Coolaburragundy-Talbragar Alluvium 6.1 6.1 6.1 6.1 0.0 -0.0 0.0 0.0 6.1 6.1 6.1 6.1 23% 34% 28% 36%
Cudgegong Alluvium 13.7 13.7 13.7 13.7 0.0 -0.2 0.0 0.0 13.7 13.6 13.7 13.7 9% 13% 17% 14%
Lower Macquarie Alluvium 71.4 70.7 70.4 69.5 27.6 26.3 26.4 27.0 99.0 97.0 96.8 96.5 37% 42% 47% 49%
Upper Macquarie Alluvium 32.5 32.5 32.5 32.5 0.0 0.0 -0.3 0.0 32.5 32.5 32.2 32.5 42% 43% 48% 49%
NSW GAB Surat Shallow 6.7 6.7 6.7 6.8 0.0 0.0 0.0 1.4 6.7 6.7 6.7 8.2 38% 32% 33% 15%
NSW GAB Warrego Shallow 0.7 0.7 0.7 0.7 0.0 0.0 0.0 0.0 0.7 0.7 0.7 0.7 100% 100% 100% 98%
NSW GAB Central Shallow 1.2 1.2 1.2 1.2 0.0 0.0 0.0 0.0 1.2 1.2 1.2 1.2 100% 99% 97% 98%
Lower Namoi Alluvium 95.6 93.5 91.4 89.3 79.7 80.0 74.7 63.8 175.3 173.4 166.0 153.1 35% 60% 63% 61%

Transition period water take report 2012‒13 to 2015‒16
Page 160
Other aspects of s.71 reporting14
Allocation11 + Basic Rights
(GL/y) s.71(1)(d) - water allocations
Carry Over12
(GL/y) s.71(1)(d) - carry over
Allocation + Carry Over (GL/y)
s.71(1)(d) - water allocations
Actual Take / (Allocation + Carry Over) (%)
SDL resource unit 2012-13 2013-14 2014-15 2015-16 2012-13 2013-14 2014-15 2015-16 2012-13 2013-14 2014-15 2015-16 2012-13 2013-14 2014-15 2015-16
Manilla Alluvium 3.5 3.5 3.5 3.3 0.0 0.0 0.0 0.0 3.5 3.5 3.5 3.3 5% 7% 7% 8%
Peel Valley Alluvium 49.1 43.3 36.2 39.1 18.8 18.6 18.7 18.6 67.9 61.9 54.9 57.7 12% 14% 13% 11%
Upper Namoi Alluvium 135.8 127.7 123.7 118.9 108.5 107.5 101.6 92.9 244.3 235.1 225.3 211.8 37% 48% 45% 44%
Upper Namoi Tributary Alluvium 3.6 3.2 3.4 3.7 0.0 0.0 0.0 0.0 3.6 3.2 3.4 3.7 15% 12% 6% 6%
Lower Gwydir Alluvium 39.0 37.0 35.1 33.1 26.4 26.7 23.2 16.8 65.3 63.7 58.3 49.9 45% 73% 74% 71%
Upper Gwydir Alluvium 1.3 1.3 1.3 1.3 0.0 0.0 0.0 0.0 1.3 1.3 1.3 1.3 6% 6% 6% 6%
Gunnedah-Oxley Basin MDB 23.6 29.8 28.5 29.4 4.5 0.0 4.1 5.2 28.1 29.8 32.6 34.5 34% 40% 38% 34%
Sydney Basin MDB 3.0 3.0 3.7 3.0 0.0 0.0 0.0 2.4 3.0 3.0 3.7 5.4 15% 16% 13% 9%
Inverell Basalt 4.1 4.2 4.1 4.1 0.6 0.6 0.6 0.6 4.8 4.8 4.8 4.8 22% 22% 25% 33%
Liverpool Ranges Basalt 2.2 2.3 2.3 2.3 0.0 0.0 0.1 0.1 2.3 2.3 2.3 2.3 81% 81% 79% 79%
New England Fold Belt 26.2 38.6 28.1 39.7 0.9 1.0 11.8 1.0 27.2 39.6 39.8 40.7 73% 51% 50% 49%
Warrumbungle Basalt 0.6 0.6 0.6 0.6 0.0 0.0 0.0 0.0 0.6 0.6 0.6 0.6 86% 86% 86% 86%
NSW Border Rivers Alluvium 16.1 16.1 16.1 16.1 0.0 0.0 -0.0 0.0 16.1 16.1 16.1 16.1 18% 35% 34% 25%
NSW Border Rivers Tributary Alluvium 1.7 1.7 1.7 1.7 0.0 0.0 0.0 0.0 1.7 1.7 1.7 1.7 9% 10% 10% 10%
Australian Capital Territory (Groundwater) 1.0 1.0 1.6 1.5 0.0 0.0 0.0 0.0 1.0 1.0 1.6 1.5 56% 45% 47% 65%
Goulburn-Murray: Shepparton Irrigation Region 147.5 196.7 194.8 191.7 0.0 0.0 0.0 0.0 147.5 196.7 194.8 191.7 28% 18% 22% 41%
Goulburn-Murray: Highlands 42.1 32.5 39.7 39.2 0.0 0.0 0.0 0.0 42.1 32.5 39.7 39.2 24% 17% 50% 33%
Goulburn-Murray: Sedimentary Plain 218.8 232.2 221.2 221.8 0.0 21.6 23.4 25.8 218.8 253.8 244.6 247.6 46% 39% 56% 57%
Goulburn-Murray: deep 0.0 0.0 0.0 0.0 0.0 0.0 0.0 0.0 0.0 0.0 0.0 0.0 0% 0% 0% 0%
Wimmera-Mallee: Highlands 1.6 2.1 3.8 2.6 0.0 0.0 0.0 0.0 1.6 2.1 3.8 2.6 39% 29% 19% 18%
Wimmera-Mallee: Sedimentary Plain 18.3 24.7 17.0 18.3 0.0 0.0 0.0 0.0 18.3 24.7 17.0 18.3 54% 37% 72% 40%
Wimmera-Mallee: deep 0.0 0.0 2.3 0.0 0.0 0.0 0.0 0.0 0.0 0.0 2.3 0.0 0% 0% 0% 0%

Transition period water take report 2012‒13 to 2015‒16
Page 161
Other aspects of s.71 reporting14
Allocation11 + Basic Rights
(GL/y) s.71(1)(d) - water allocations
Carry Over12
(GL/y) s.71(1)(d) - carry over
Allocation + Carry Over (GL/y)
s.71(1)(d) - water allocations
Actual Take / (Allocation + Carry Over) (%)
SDL resource unit 2012-13 2013-14 2014-15 2015-16 2012-13 2013-14 2014-15 2015-16 2012-13 2013-14 2014-15 2015-16 2012-13 2013-14 2014-15 2015-16
Mallee (Pliocene Sands) 0.0 0.0 0.0 0.0 0.0 0.0 0.0 0.0 0.0 0.0 0.0 0.0 0% 0% 0% 0%
Mallee (Murray Group Limestone) 62.6 62.6 62.6 62.6 0.0 0.0 0.0 0.0 62.6 62.6 62.6 62.6 65% 55% 60% 56%
Mallee (Renmark Group) 0.0 0.0 0.0 0.0 0.0 0.0 0.0 0.0 0.0 0.0 0.0 0.0 0% 0% 0% 0%
Peake–Roby–Sherlock (unconfined limestone) 0.5 0.5 0.5 0.5 0.0 0.0 0.0 0.0 0.5 0.5 0.5 0.5 39% 39% 39% 39%
Peake-Roby-Sherlock (confined strata - Buccleuch formation and Renmark Group)
2.3 2.3 2.3 2.3 0.0 0.0 0.0 0.0 2.3 2.3 2.3 2.3 77% 48% 26% 21%
SA Murray (Groundwater) 1.8 1.8 1.8 1.8 0.0 0.0 0.0 0.0 1.8 1.8 1.8 1.8 100% 100% 100% 100%
SA Murray Salt Interception Schemes 28.6 28.6 28.6 28.6 0.0 0.0 0.0 0.0 28.6 28.6 28.6 28.6 35% 40% 33% 41%
Angas Bremer (Quaternary) 0.0 0.0 0.0 0.0 0.0 0.0 0.0 0.0 0.0 0.0 0.0 0.0 0% 0% 0% 0%
Angas Bremer (Murray Group Limestone) 6.6 6.6 6.6 6.6 1.4 1.3 1.4 0.6 8.0 7.9 8.0 7.1 26% 22% 18% 17%
Eastern Mount Lofty Ranges 2.1 2.1 32.0 33.9 0.0 0.0 0.0 0.0 2.1 2.1 32.0 33.9 100% 100% 7% 28%
Marne Saunders (fractured rock) 2.0 2.0 2.0 2.0 0.3 0.3 0.3 0.3 2.4 2.3 2.4 2.4 21% 15% 18% 25%
Marne Saunders (Murray Group Limestone including overlying Quaternary sediments)
2.3 2.3 2.3 2.3 0.1 0.2 0.1 0.3 2.4 2.5 2.4 2.6 67% 53% 58% 59%
Marne Saunders (Renmark Group) 0.0 0.0 0.0 0.0 0.0 0.0 0.0 0.0 0.0 0.0 0.0 0.0 0% 0% 0% 0%
MDB 2,483.8 2,532.2 2,510.5 2,499.5 753.3 805.0 819.7 737.3 3,237.2 3,337.2 3,330.2 3,236.8 38% 42% 47% 47%
Qld 228.2 229.3 229.7 229.5 54.6 41.0 50.2 47.4 282.8 270.3 279.9 276.9 57% 72% 63% 68%
NSW 1,717.3 1,704.7 1,661.6 1,654.2 696.9 740.6 744.3 662.9 2,414.2 2,445.2 2,405.9 2,317.1 35% 41% 46% 45%
ACT 1.0 1.0 1.6 1.5 - - - - 1.0 1.0 1.6 1.5 56% 45% 47% 65%
Vic 428.4 488.3 478.8 473.6 - 21.6 23.4 25.8 428.4 509.9 502.2 499.4 38% 29% 42% 48%
SA 108.9 109.0 138.8 140.6 1.8 1.8 1.9 1.2 110.7 110.8 140.6 141.8 55% 49% 39% 44%

Transition period water take report 2012‒13 to 2015‒16
Page 162
Carry Over / (Allocation + Carry Over) (%)
Actual Take Measurement Method
2015-16
SDL resource unit 2012-13 2013-14 2014-15 2015-16 Non-
metered (GL/y)
% metered
Queensland Border Rivers Alluvium 8% 9% 8% 8% 6.14 52%
Queensland Border Rivers Fractured Rock 0% 0% 0% 0% 10.16 0%
Sediments above the Great Artesian Basin: Border Rivers 0% 0% 0% 0% 0.04 0%
Sediments above the Great Artesian Basin: Moonie 0% 28% 44% 0% 0.32 0%
St George Alluvium: Moonie 27% 29% 27% 27% 0.01 0%
Condamine Fractured Rock 27% 28% 30% 33% 1.07 0%
Queensland MDB: deep 27% 25% 27% 25% 0.10 0%
Sediments above the Great Artesian Basin: Condamine–Balonne
0% 0% 0% 0% 0.66 0%
St George Alluvium: Condamine–Balonne (shallow) 0% 0% 0% 0% 1.12 0%
St George Alluvium: Condamine–Balonne (deep) 39% 39% 38% 36% 11.61 0%
Upper Condamine Alluvium (Central Condamine Alluvium) 47% 48% 47% 45% 6.00 86%
Upper Condamine Alluvium (Tributaries) 0% 17% 18% 17% 28.60 12%
Upper Condamine Basalts 0% 21% 27% 23% 67.31 7%
Sediments above the Great Artesian Basin: Warrego–Paroo–Nebine
30% 34% 32% 30% 1.24 0%
St George Alluvium: Warrego–Paroo–Nebine 9% 16% 21% 15% 0.12 3%
Warrego Alluvium 4% 4% 5% 5% 0.72 0%
Western Porous Rock 1% 1% 1% 1% 26.75 25%
Upper Darling Alluvium 4% 1% 7% 5% 2.28 46%
Lower Darling Alluvium 6% 8% 8% 8% 0.73 6%
Billabong Creek Alluvium 8% 8% 13% 8% 0.64 80%
Lower Murray Alluvium (shallow) 0% 0% 0% 0% 0.99 82%
Lower Murray Alluvium (deep) 0% 0% 0% 0% 1.53 98%
Upper Murray Alluvium 0% 0% 0% 0% 0.40 96%

Transition period water take report 2012‒13 to 2015‒16
Page 163
Carry Over / (Allocation + Carry Over) (%)
Actual Take Measurement Method
2015-16
SDL resource unit 2012-13 2013-14 2014-15 2015-16 Non-
metered (GL/y)
% metered
Oaklands Basin 0% -1% 0% 0% 0.00 0%
Lake George Alluvium 28% 27% 27% 28% 0.03 95%
Lower Murrumbidgee Alluvium (shallow) 0% 0% -1% 0% 3.00 52%
Lower Murrumbidgee Alluvium (deep) 0% 0% 0% 17% 1.00 100%
Mid-Murrumbidgee Alluvium 0% 0% 0% 2% 0.80 98%
Belubula Alluvium 0% 0% 0% 1% 0.04 94%
Lower Lachlan Alluvium 45% 46% 45% 42% 4.00 96%
Upper Lachlan Alluvium 0% 0% 0% 0% 6.28 89%
Adelaide Fold Belt 28% 30% 34% 32% 2.14 0%
Kanmantoo Fold Belt 44% 46% 45% 44% 8.15 0%
Lachlan Fold Belt 0% 0% 0% 0% 74.31 7%
Orange Basalt 40% 42% 40% 34% 1.16 30%
Young Granite 0% 0% 0% 0% 0.76 65%
Bell Valley Alluvium 16% 0% 13% 15% 0.01 99%
Castlereagh Alluvium 1% 0% 0% 45% 0.08 0%
Coolaburragundy-Talbragar Alluvium 13% 13% 13% 13% 0.07 97%
Cudgegong Alluvium 2% 2% 3% 4% 0.03 98%
Lower Macquarie Alluvium 3% 2% 29% 2% 1.73 96%
Upper Macquarie Alluvium 2% 2% 2% 2% 0.30 98%
NSW GAB Surat Shallow 0% 0% 0% 0% 0.98 18%
NSW GAB Warrego Shallow 0% 0% 0% 0% 0.65 0%
NSW GAB Central Shallow 8% 9% 8% 8% 1.16 0%
Lower Namoi Alluvium 0% 0% 0% 0% 3.30 96%

Transition period water take report 2012‒13 to 2015‒16
Page 164
Carry Over / (Allocation + Carry Over) (%)
Actual Take Measurement Method
2015-16
SDL resource unit 2012-13 2013-14 2014-15 2015-16 Non-
metered (GL/y)
% metered
Manilla Alluvium 0% 0% 0% 0% 0.02 92%
Peel Valley Alluvium 0% 28% 44% 0% 0.24 96%
Upper Namoi Alluvium 27% 29% 27% 27% 2.83 97%
Upper Namoi Tributary Alluvium 27% 28% 30% 33% 0.04 83%
Lower Gwydir Alluvium 27% 25% 27% 25% 0.70 98%
Upper Gwydir Alluvium 0% 0% 0% 0% 0.07 0%
Gunnedah-Oxley Basin MDB 0% 0% 0% 0% 5.78 51%
Sydney Basin MDB 39% 39% 38% 36% 0.47 0%
Inverell Basalt 47% 48% 47% 45% 1.07 32%
Liverpool Ranges Basalt 0% 17% 18% 17% 1.83 1%
New England Fold Belt 0% 21% 27% 23% 18.57 7%
Warrumbungle Basalt 30% 34% 32% 30% 0.54 0%
NSW Border Rivers Alluvium 9% 16% 21% 15% 0.24 94%
NSW Border Rivers Tributary Alluvium 4% 4% 5% 5% 0.14 18%
Australian Capital Territory (Groundwater) 0% 0% 0% 0% 0.00 100%
Goulburn-Murray: Shepparton Irrigation Region 0% 0% 0% 0% 0.00 100%
Goulburn-Murray: Highlands 0% 0% 0% 0% 3.85 71%
Goulburn-Murray: Sedimentary Plain 0% 8% 10% 10% 15.38 89%
Goulburn-Murray: deep 0% 0% 0% 0% 0.00 0%
Wimmera-Mallee: Highlands 0% 0% 0% 0% 0.28 40%
Wimmera-Mallee: Sedimentary Plain 0% 0% 0% 0% 1.10 85%
Wimmera-Mallee: deep 0% 0% 0% 0% 0.00 0%
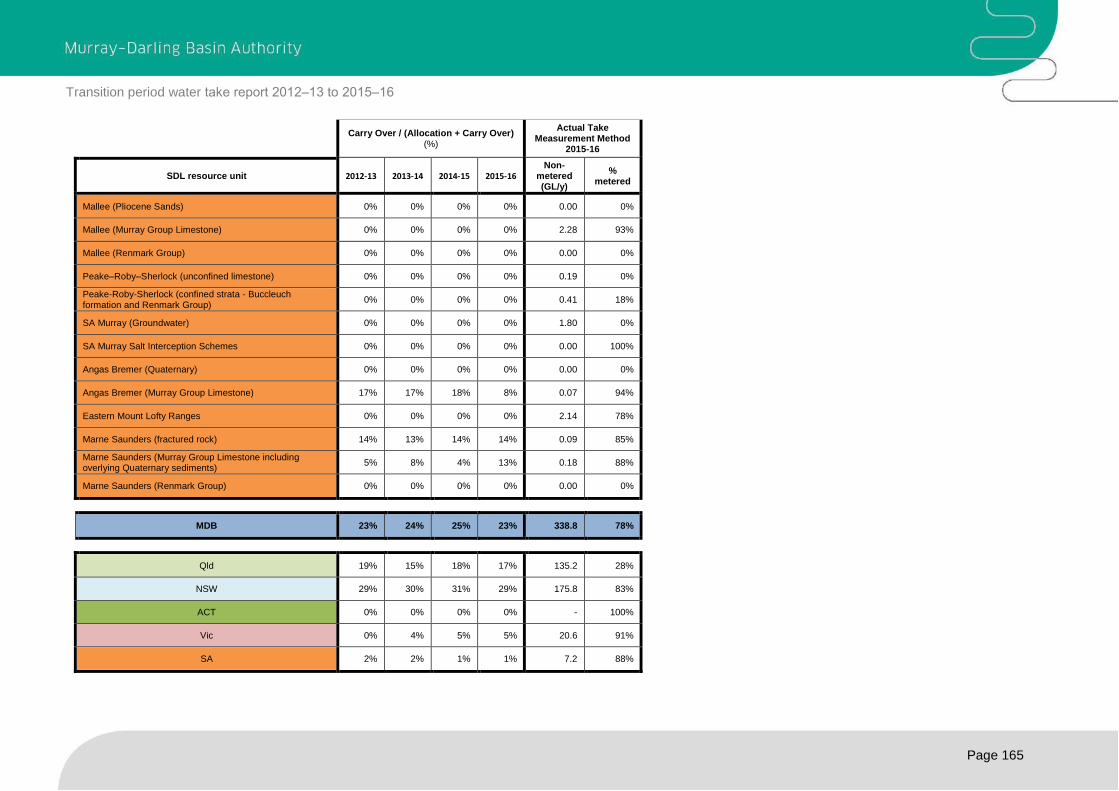
Transition period water take report 2012‒13 to 2015‒16
Page 165
Carry Over / (Allocation + Carry Over) (%)
Actual Take Measurement Method
2015-16
SDL resource unit 2012-13 2013-14 2014-15 2015-16 Non-
metered (GL/y)
% metered
Mallee (Pliocene Sands) 0% 0% 0% 0% 0.00 0%
Mallee (Murray Group Limestone) 0% 0% 0% 0% 2.28 93%
Mallee (Renmark Group) 0% 0% 0% 0% 0.00 0%
Peake–Roby–Sherlock (unconfined limestone) 0% 0% 0% 0% 0.19 0%
Peake-Roby-Sherlock (confined strata - Buccleuch formation and Renmark Group)
0% 0% 0% 0% 0.41 18%
SA Murray (Groundwater) 0% 0% 0% 0% 1.80 0%
SA Murray Salt Interception Schemes 0% 0% 0% 0% 0.00 100%
Angas Bremer (Quaternary) 0% 0% 0% 0% 0.00 0%
Angas Bremer (Murray Group Limestone) 17% 17% 18% 8% 0.07 94%
Eastern Mount Lofty Ranges 0% 0% 0% 0% 2.14 78%
Marne Saunders (fractured rock) 14% 13% 14% 14% 0.09 85%
Marne Saunders (Murray Group Limestone including overlying Quaternary sediments)
5% 8% 4% 13% 0.18 88%
Marne Saunders (Renmark Group) 0% 0% 0% 0% 0.00 0%
MDB 23% 24% 25% 23% 338.8 78%
Qld 19% 15% 18% 17% 135.2 28%
NSW 29% 30% 31% 29% 175.8 83%
ACT 0% 0% 0% 0% - 100%
Vic 0% 4% 5% 5% 20.6 91%
SA 2% 2% 1% 1% 7.2 88%

Transition period water take report 2012‒13 to 2015‒16
Page 166
Basin Plan Chapter 6 Part 4 - Trial compliance arrangements
Groundwater SDL trial water take account by Water Resource Plan Areas.
BDL1
(GL/y) SDL2
(GL/y) 2017 SDL3
State Plann
ing Limit4
(GL/y)
GW HEW5
at 1 July 2016
(GL/y)
Basic Right
s6
TDL8
(GL/y) s.71(1)(b) - permitted take7
Actual Take9
(GL/y) s.71(1)(c) - actual take
Actual Take/TDL (%)
WRP Area
WRP area State 2012-
13 2013-
14 2014-
15 2015-
16 2012-
13 2013-
14 2014-
15 2015-
16 2012-
13 2013-
14 2014-
15 2015-
16
GW19 Queensland Border Rivers Qld 24.1 38.9 38.9 34.1 0.00 2.99 38.9 38.9 38.9 38.9 18.4 20.9 21.3 23.0 47% 54% 55% 59%
GW20 Moonie Qld 33.2 33.2 3.8 0.00 0.09 33.2 33.2 33.2 33.2 33.2 0.1 0.1 0.3 0.3 0% 0% 1% 1%
GW21 Condamine-Balonne Qld 325.4 325.4 238.2 0.00 29.38 365.8 365.8 365.8 365.8 365.8 142.4 171.3 154.4 161.8 39% 47% 42% 44%
GW22 Warrego-Paroo-Nebine Qld 134.0 134.0 12.0 0.00 1.63 134.0 134.0 134.0 134.0 134.0 1.5 1.6 1.6 2.1 1% 1% 1% 2%
GW6 Western Porous Rock NSW 63.1 116.6 530.5 0.00 26.75 63.1 116.6 116.6 116.6 116.6 63.1 116.6 530.5 0.00 30% 31% 26% 31%
GW7 Darling Alluvium NSW 8.5 8.8 21.4 0.00 3.01 8.5 8.8 8.8 8.8 8.8 8.5 8.8 21.4 0.00 40% 48% 54% 56%
GW8 Murray Alluvium NSW 192.4 194.9 192.4 1.52 3.56 192.4 224.0 214.3 204.6 194.9 192.4 194.9 192.4 1.52 32% 29% 42% 54%
GW9 Murrumbidgee Alluvium NSW 355.2 355.2 338.7 5.05 4.83 355.2 367.6 363.5 359.4 355.2 355.2 355.2 338.7 5.05 60% 75% 97% 87%
GW10 Lachlan Alluvium NSW 220.4 214.0 209.1 0.00 10.32 220.4 224.7 222.5 220.4 218.3 220.4 214.0 209.1 0.00 59% 67% 81% 71%
GW11 Lachlan and South Western Fractured Rock
NSW 172.7 302.4 1,075.0 0.03 86.52 172.7 302.4 302.4 302.4 302.4 172.7 302.4 1,075.
0 0.03 31% 32% 30% 31%
GW12 Macquarie-Castlereagh Alluvium NSW 98.6 98.6 97.2 0.00 2.22 98.6 99.3 99.1 98.8 98.6 98.6 98.6 97.2 0.00 55% 60% 68% 70%
GW13 New South Wales Great Artesian Basin Shallow
NSW 7.5 57.7 404.6 0.00 2.79 7.5 57.7 57.7 57.7 57.7 7.5 57.7 404.6 0.00 8% 7% 7% 5%
GW14 Namoi Alluvium NSW 224.0 224.0 226.5 0.00 6.43 224.0 242.7 236.5 230.4 224.0 224.0 224.0 226.5 0.00 66% 96% 93% 86%
GW15 Gwydir Alluvium NSW 33.7 33.7 33.7 0.00 0.77 33.7 39.7 37.7 35.7 33.7 33.7 33.7 33.7 0.00 74% 123% 122% 106%
GW16 Eastern Porous Rock NSW 25.2 131.6 266.1 0.00 6.25 25.2 131.6 131.6 131.6 131.6 25.2 131.6 266.1 0.00 8% 9% 10% 9%
GW17 New England Fractured Rock and Northern Basalts
NSW 39.8 62.0 326.6 0.00 22.01 39.8 62.0 62.0 62.0 62.0 39.8 62.0 326.6 0.00 37% 38% 38% 39%
GW18 New South Wales Border Rivers Alluvium
NSW 8.8 8.8 8.8 0.00 0.38 8.8 8.8 8.8 8.8 8.8 8.8 8.8 8.8 0.00 34% 65% 63% 47%
GW1 Australian Capital Territory (groundwater)
ACT 3.2 3.2 7.3 0.00 0.00 3.2 3.2 3.2 3.2 3.2 0.6 0.5 0.8 1.0 18% 15% 24% 30%
GW2 Goulburn-Murray Vic 518.1 555.8 496.5 0.00 19.23 518.1 518.1 518.1 518.1 518.1 152.4 139.5 200.1 234.1 29% 27% 39% 45%
GW3 Wimmera-Mallee Vic 212.8 212.8 70.2 0.00 1.38 212.8 212.8 212.8 212.8 212.8 10.6 9.8 13.1 7.8 5% 5% 6% 4%
GW4 South Australian Murray Region SA 208.5 206.4 69.6 0.00 4.68 208.5 208.5 208.5 208.5 208.5 54.7 49.0 49.9 49.3 26% 23% 24% 24%
GW5 Eastern Mount Lofty Ranges SA 51.1 51.1 50.4 0.00 2.48 51.1 51.1 51.1 51.1 51.1 6.3 5.6 5.4 12.9 12% 11% 11% 25%

Transition period water take report 2012‒13 to 2015‒16
Page 167
Basin Plan Chapter 6 Part 4 - Trial compliance arrangements
Debit / Credit10 (TDL - Actual)
(GL/y)
Cumulative Balance (Cumulative annual TDL - annual actual)
(GL/y)
Indicative Compliance Test (Non-binding) 20% with Long-term TDL13
(Cumulative Balance / TDL) Basin Plan s6.12(1)(a)
WRP area
WRP area State 2012-13 2013-14 2014-15 2015-16 2012-13 2013-14 2014-15 2015-16 2012-13 2013-14 2014-15 2015-16
GW19 Queensland Border Rivers Qld 20.5 18.0 17.6 15.9 20.5 38.5 56.1 72.0 53% 99% 144% 185%
GW20 Moonie Qld 33.1 33.1 32.9 32.9 33.1 66.2 99.1 132.0 100% 199% 299% 398%
GW21 Condamine-Balonne Qld 223.4 194.5 211.4 204.0 223.4 417.9 629.3 833.2 61% 114% 172% 228%
GW22 Warrego-Paroo-Nebine Qld 132.5 132.4 132.4 131.9 132.5 264.9 397.3 529.2 99% 198% 296% 395%
GW6 Western Porous Rock NSW 81.6 79.9 86.7 80.8 81.6 161.5 248.2 329.0 70% 139% 213% 282%
GW7 Darling Alluvium NSW 5.3 4.6 4.0 3.8 5.3 9.9 13.9 17.8 60% 112% 158% 201%
GW8 Murray Alluvium NSW 151.3 152.2 119.3 89.6 151.3 303.5 422.7 512.3 68% 142% 207% 263%
GW9 Murrumbidgee Alluvium NSW 146.2 90.3 11.4 47.5 146.2 236.5 247.9 295.4 40% 65% 69% 83%
GW10 Lachlan Alluvium NSW 91.8 74.5 42.1 64.4 91.8 166.3 208.5 272.9 41% 75% 95% 125%
GW11 Lachlan and South Western Fractured Rock
NSW 207.8 206.1 210.3 208.6 207.8 413.9 624.1 832.7 69% 137% 206% 275%
GW12 Macquarie-Castlereagh Alluvium NSW 44.8 39.4 32.0 29.9 44.8 84.2 116.1 146.0 45% 85% 118% 148%
GW13 New South Wales Great Artesian Basin Shallow
NSW 53.4 53.8 53.7 54.7 53.4 107.1 160.8 215.5 92% 186% 279% 373%
GW14 Namoi Alluvium NSW 82.8 9.3 15.3 30.3 82.8 92.1 107.5 137.7 34% 39% 47% 61%
GW15 Gwydir Alluvium NSW 10.3 - 8.7 - 7.7 - 1.9 10.3 1.6 - 6.1 - 8.0 26% 4% -17% -24%
GW16 Eastern Porous Rock NSW 121.6 119.3 118.7 119.3 121.6 240.8 359.5 478.9 92% 183% 273% 364%
GW17 New England Fractured Rock and Northern Basalts
NSW 38.8 38.4 38.5 38.0 38.8 77.1 115.7 153.7 63% 124% 187% 248%
GW18 New South Wales Border Rivers Alluvium
NSW 5.8 3.1 3.2 4.7 5.8 8.9 12.1 16.8 66% 101% 137% 190%
GW1 Australian Capital Territory (groundwater)
ACT 2.6 2.7 2.4 2.2 2.6 5.3 7.7 9.9 82% 167% 243% 312%
GW2 Goulburn-Murray Vic 365.6 378.6 318.0 284.0 365.6 744.2 1,062.2 1,346.2 71% 144% 205% 260%
GW3 Wimmera-Mallee Vic 202.2 203.0 199.8 205.0 202.2 405.3 605.0 810.1 95% 190% 284% 381%
GW4 South Australian Murray Region SA 153.8 159.6 158.7 159.2 153.8 313.4 472.0 631.3 74% 150% 226% 303%
GW5 Eastern Mount Lofty Ranges SA 44.9 45.6 45.7 38.2 44.9 90.4 136.1 174.4 88% 177% 266% 341%

Transition period water take report 2012‒13 to 2015‒16
Page 168
Other aspects of s.71 reporting
Allocation11 + Basic Rights
(GL/y) s.71(1)(d) - water allocations
Carry Over12
(GL/y) s.71(1)(d) - carry over
Allocation + Carry Over (GL/y)
s.71(1)(d) - water allocations
Actual Take / (Allocation + Carry Over)
(%)
Carry Over / (Allocation + Carry Over) (%)
Actual Take Measurement
Method 2015-16
WRP area
WRP area 2012-
13 2013-
14 2014-
15 2015-
16 2012-
13 2013-
14 2014-
15 2015-
16 2012-
13 2013-
14 2014-
15 2015-
16 2012-
13 2013-
14 2014-
15 2015-
16 2012-
13 2013-
14 2014-
15 2015-
16
Non-meter
ed (GL/y)
% metered
GW19 Queensland Border Rivers 30.8 30.8 30.8 30.8 0.0 - - 0.0 30.8 30.8 30.8 30.8 60% 68% 69% 75% - - - - 16.3 29%
GW20 Moonie 0.1 0.1 0.3 0.3 0.0 - - 0.0 0.1 0.1 0.3 0.3 81% 81% 93% 100% - - - - 0.3 0%
GW21 Condamine-Balonne 195.3 196.4 196.5 196.3 54.6 41.0 50.2 47.4 249.9 237.4 246.7 243.7 57% 72% 63% 66% 0.2 0.2 0.2 0.2 116.5 28%
GW22 Warrego-Paroo-Nebine 2.1 2.1 2.1 2.1 0.0 - - 0.0 2.1 2.1 2.1 2.1 73% 77% 77% 100% - - - - 2.1 0%
GW6 Western Porous Rock 48.4 48.4 62.6 62.6 5.4 5.7 5.4 5.4 59.0 59.0 62.3 62.6 59% 62% 48% 57% 0.1 0.1 0.1 0.1 26.8 25%
GW7 Darling Alluvium 7.4 7.5 7.5 7.5 0.0 - - 0.0 7.2 7.5 7.5 7.5 49% 57% 64% 67% - - - - 3.0 40%
GW8 Murray Alluvium 249.1 236.3 226.6 215.3 88.0 91.5 92.7 85.2 246.1 234.3 224.7 214.0 30% 27% 38% 49% 0.4 0.4 0.4 0.4 3.6 97%
GW9 Murrumbidgee Alluvium 378.5 374.4 370.2 368.9 257.4 282.6 265.7 251.5 375.9 371.8 367.4 368.9 59% 73% 95% 83% 0.7 0.8 0.7 0.7 4.8 98%
GW10 Lachlan Alluvium 315.6 313.5 311.4 309.2 71.8 96.6 107.1 81.1 315.5 309.1 307.0 300.6 42% 48% 58% 51% 0.2 0.3 0.3 0.3 10.3 93%
GW11 Lachlan and South Western Fractured Rock
180.2 180.2 180.2 180.2 7.3 3.7 12.6 9.8 170.7 180.6 176.5 179.4 55% 53% 52% 52% 0.0 0.0 0.1 0.1 86.5 8%
GW12 Macquarie-Castlereagh Alluvium
129.0 128.8 128.5 128.3 27.6 26.1 26.1 27.0 129.0 128.2 128.0 127.0 42% 47% 52% 54% 0.2 0.2 0.2 0.2 2.2 97%
GW13 New South Wales Great Artesian Basin Shallow
8.6 8.6 8.6 8.7 0.0 - - 1.4 8.5 8.5 8.5 8.6 51% 47% 47% 35% - - - 0.2 2.8 7%
GW14 Namoi Alluvium 286.6 271.3 258.0 254.3 207.0 206.1 195.0 175.3 287.6 271.2 258.2 254.3 56% 84% 83% 76% 0.7 0.8 0.8 0.7 6.4 97%
GW15 Gwydir Alluvium 40.4 38.2 36.3 34.3 26.4 26.7 23.2 16.8 40.2 38.3 36.4 34.4 73% 121% 119% 104% 0.7 0.7 0.6 0.5 0.8 98%
GW16 Eastern Porous Rock 32.4 32.4 32.4 32.4 4.5 - 4.1 7.6 26.6 32.8 32.2 32.4 38% 38% 40% 38% 0.2 - 0.1 0.2 6.3 49%
GW17 New England Fractured Rock and Northern Basalts
46.7 46.7 46.7 46.8 1.6 1.6 12.4 1.7 33.2 45.6 35.1 46.7 70% 52% 67% 51% 0.0 0.0 0.4 0.0 22.0 8%
GW18 New South Wales Border Rivers Alluvium
17.9 17.9 17.9 17.9 0.0 - -
0.0 0.0 17.9 17.9 17.9 17.9 17% 32% 31% 23% - - - - 0.4 91%
GW1 Australian Capital Territory (groundwater)
1.0 1.0 1.6 1.5 0.0 - - 0.0 1.0 1.0 1.6 1.5 56% 45% 47% 65% - - - - 0.0 100%
GW2 Goulburn-Murray 408.5 461.5 455.7 452.7 0.0 21.6 23.4 25.8 408.5 483.0 479.0 478.5 37% 29% 42% 49% - 0.0 0.0 0.1 19.2 92%
GW3 Wimmera-Mallee 19.9 26.8 23.2 20.9 0.0 - - 0.0 19.9 26.8 23.2 20.9 53% 36% 56% 37% - - - - 1.4 82%
GW4 South Australian Murray Region
95.8 95.8 95.8 95.8 0.0 - - 0.0 95.8 95.8 95.8 95.8 57% 51% 52% 51% - - - - 4.7 91%
GW5 Eastern Mount Lofty Ranges
13.0 13.1 42.9 44.8 1.8 1.8 1.9 1.2 14.9 15.0 44.8 46.0 42% 37% 12% 28% 0.1 0.1 0.0 0.0 2.5 81%

Transition period water take report 2012‒13 to 2015‒16
Page 169
1. BDL is Baseline Diversion Limit as in Schedule 4 of the Basin Plan
2. SDL is Sustainable Diversion Limit as in Schedule 4 of the Basin Plan
3. Sustainable Diversion Limit after the proposed groundwater Basin Plan
amendments are adopted
4. State plan limit or entitlement Volume
5. HEW is Held Environmental Water recovered to "Bridge the Gap" or
acquired under the Sustainable Rural Water Use and Infrastructure Program
(SRWUIP) as at 1 July 2016
6. Basic Rights - Groundwater take under basic rights generally covers water
used for stock and domestic purposes, the Basin states estimate this take
using estimation methods
7. Permitted Take - the use of annual permitted take is a new concept in
accounting for groundwater resources. The MDBA has been working with
the states to determine how the permitted take will be incorporated into the
Basin Plan accounting and compliance that will come into effect after 2019.
For the purpose of the transition period field test, annual permitted take for
groundwater is being set at the TDL.
8. TDL is Transitional Diversion Limits. Groundwater TDL is the same as the
SDL for majority of the SDL resource units except for the Queensland Upper
Condamine Alluvium where water recovery to bridge a gap between the BDL
and SDL is required and for the SDL resource units that are associated with
an ongoing reduction of groundwater entitlements in NSW. TDL represent an
indicative non-binding limit during the Transition Period (i.e. 2012-19)
9. Actual take is the total quantity (volume) of water actually taken by each form
of take from the SDL resource unit during a water accounting period which
includes take from groundwater and take under basic rights
10. Debit/Credit - Transitional Diversion Limit minus actual take
11. Allocation - Water allocation means a specific volume of water allocated to a
water access entitlement in a given water accounting period
12. Carry over - Volume of carry over that is available for take
13. Lower Gwydir Alluvium Actual Take - If 2016-17 actual take is considered,
the outlook indicates actual take will be within TDL 14. The volumes in these columns may have been adjusted by the MDBA as
required based on data provided by states i.e. NSW did not provide the data
as it is for all columns for their SDL resource units

Transition period water take report 2012‒13 to 2015‒16
Page 170
12. Appendix 3: Status of Cap models
Cap Valley Status of Cap models and Cap compliance to 30 June 2016
Queensland
Condamine – Balonne An IQQM Cap model was provisionally accredited by the Authority in 2013 for use until 2015. Though accreditation has lapsed, the model remains the best available information with which to determine Cap compliance. Since 1997–98 there have been no special audits triggered in the Condamine–Balonne Cap valley. As at 30 June 2016, the valley has recorded a cumulative credit of 1,309.22 GL.
Queensland Border Rivers – Macintyre Brook
An IQQM Cap model was provisionally accredited by the Authority in 2013 for use until 2015, on the condition that Queensland and NSW would work to develop a common Cap model. Though this accreditation has lapsed, the model remains the best available information with which to determine Cap compliance. Since 1997–98 there have been no special audits triggered in the Border Rivers–Macintyre Brook Cap valley. As at 30 June 2016, the valley has recorded a cumulative credit of 450.54 GL.
Moonie An IQQM Cap model was provisionally accredited by the Authority in 2010 for use until 2012. Though accreditation has lapsed, the model remains the best available information with which to determine Cap compliance. There has been an apparent exceedance of the Cap in the Moonie Cap valley in water years 2014–15 and 2015–16. These will be subject to a special audit under Schedule E of the Murray Darling Basin Agreement. The Moonie Cap valley does not operate under a cumulative cap, with the apparent exceedances being of 2.32 GL and 0.32 GL, respectively.
Nebine An IQQM Cap model was provisionally accredited by the Authority in 2010 for use until 2012. An SDL model is available through the accredited Warrego–Paroo–Nebine Water Resource Plan. Cap compliance under Schedule E will continue to be assessed against the Cap model until 2019. Since 1997–98 there have been no special audits triggered in the Nebine Cap valley. The Nebine Cap valley does not operate under a cumulative cap, with the annual balance not entering deficit for the reporting period.
Warrego An IQQM Cap model was provisionally accredited by the Authority in 2010 for use until 2012. An SDL model is available through the accredited Warrego–Paroo–Nebine Water Resource Plan. Cap compliance under Schedule E will continue to be assessed against the Cap model until 2019. Since 1997–98 there have been no special audits triggered in the Warrego Cap valley. The Warrego Cap valley does not operate under a cumulative cap, with the annual balance not entering deficit for the reporting period.
Paroo
An IQQM Cap model was provisionally accredited by the Authority in 2010 for use until 2012. An SDL model is available through the accredited Warrego–Paroo–Nebine Water Resource Plan. Cap compliance under Schedule E will continue to be assessed against the Cap model until 2019. Since 1997–98 there have been no special audits triggered in the Paroo Cap valley. The Paroo Cap valley does not operate under a cumulative cap, with the annual balance not entering deficit for the reporting period.

Transition period water take report 2012‒13 to 2015‒16
Page 171
Cap Valley Status of Cap models and Cap compliance to 30 June 2016
New South Wales
Intersecting Streams There was no Cap target in the Intersecting Streams for the reporting period.
NSW Border Rivers An IQQM Cap model was provisionally accredited by the Authority in 2013 for use until 2015, on the condition that Queensland and NSW would work to develop a common Cap model. Though this accreditation has lapsed, the model remains the best available information with which to determine Cap compliance. Since 1997–98 there has been one special audit triggered in the NSW Border Rivers Cap valley, for the water year 1999–00. As at 30 June 2016, the valley has recorded a cumulative credit of 568.39 GL.
Gwydir An IQQM Cap model was accredited by the Authority in 2009 and was available to determine Cap compliance for the reporting period. Since 1997–98 there have been two special audits triggered in the Gwydir Cap valley — these occurred for the water years 1999–00 and 2001–02. As at 30 June 2016, the valley has recorded a cumulative credit of 344.58 GL.
Namoi – Peel The Namoi–Peel Cap valley features two models. An IQQM Cap model for the Namoi was accredited in 2005 and was available to determine Cap compliance within the valley. An IQQM Cap model for the Peel was accredited by the Authority in 2009 and was available to determine Cap compliance within the valley. Since 1997–98 there has been one special audit triggered in the Namoi–Peel Cap valley for the water year 2000–01. As at 30 June 2016, the valley has recorded a cumulative credit of 488.01 GL.
Macquarie – Castlereagh – Bogan
An IQQM Cap model was accredited by the Authority in 2012 and was available to determine Cap compliance for the reporting period. Since 1997–98 there has been one special audit triggered in the Macquarie–Castlereagh–Bogan Cap valley for the water year 2002–03. As at 30 June 2016, the valley has recorded a cumulative credit of 1,028.78 GL.
Barwon – Darling – Lower Darling
The Barwon–Darling–Lower Darling Cap valley features two models. An IQQM model for the Barwon–Darling was provisionally accredited by the Authority in 2014 for use until 2015. Though accreditation has lapsed, the model remains the best available information with which to determine Cap compliance within the Barwon–Darling component of this Cap valley. An MSM Cap model for the Lower Darling was accredited by the Authority in 2015 and was available for use to determine Cap compliance within the Lower Darling component of this Cap valley. Since 1997–98 there have been six special audits triggered in the Barwon–Darling–Lower Darling Cap valley — these occurred for the waters years 2000–01, 2003–04, 2004–05, 2005–06, 2007–08 and 2008–09. As at 30 June 2016, the valley has recorded a cumulative credit of 595.22 Gl.
Lachlan An IQQM Cap model was accredited in 2002 and was available to determine Cap compliance for the reporting period. Since 1997–98 there have been three special audits triggered in the Lachlan Cap valley. These occurred for the water years 2000–01, 2001–02 and 2002–03. As at 30 June 2016, the valley has recorded a cumulative credit of 366.91 GL.
Murrumbidgee An IQQM model was accredited by the Authority in 2011 and was available to determine Cap compliance for the reporting period. Since 1997–98 there have been no special audits triggered in the Murrumbidgee Cap valley. As at 30 June 2016, the valley has recorded a cumulative credit of 2,473.23 GL.

Transition period water take report 2012‒13 to 2015‒16
Page 172
Cap Valley Status of Cap models and Cap compliance to 30 June 2016
Murray An MSM Cap model was accredited in 2008 and was available to determine Cap compliance for the reporting period. Since 1997–98 there have been no special audits triggered in the Murray Cap valley. As at 30 June 2016, the valley has recorded a cumulative credit of 1,395.71 GL.
Australian Capital Territory
A Regression Cap model was accredited by the Authority in 2013 for use until 2019 and was available to determine Cap compliance for the reporting period. Since 1997–98 there have been no special audits triggered in the Australian Capital Territory Cap valley. As at 30 June 2016, the valley has recorded a cumulative credit of 248.92 GL.
Victoria
Goulburn–Broken–Loddon
A GSM REALM23 Cap model was accredited in 2007 and was available to determine Cap compliance for the reporting period. Since 1997–98 there have been no special audits triggered in the Goulburn–Broken–Loddon Cap valley. As at 30 June 2016, the valley has recorded a cumulative credit of 2,728.11 GL.
Campaspe A GSM REALM Cap model was originally accredited in 2007. Amendments made to the GSM REALM Cap model were also accredited in 2012 and were available to determine Cap compliance for the reporting period. Since 1997–98 there have been no special audits triggered in the Campaspe Cap valley. As at 30 June 2016, the valley has recorded a cumulative credit of 460.86 GL.
Wimmera–Mallee A W-M REALM Cap model was accredited by the Authority in 2013 and was available to determine Cap compliance for the reporting period. Since 1997–98 there have been no special audits triggered in the Wimmera–Mallee Cap valley. As at 30 June 2016, the valley has recorded a cumulative credit of 133.12 GL.
Murray–Kiewa–Ovens An MSM Cap model was accredited in 2008 and was available to determine Cap compliance for the reporting period. Since 1997–98 there have been no special audits triggered in the Murray–Kiewa–Ovens Cap valley. As at 30 June 2016, the valley has recorded a cumulative credit of 2,861.16 GL.
South Australia
Metro Adelaide & Associated Country Areas
There is currently no model available to determine Cap compliance within the Metro Adelaide & Associated Country Areas Cap Valley. In the absence of an accredited model, this Cap valley operates under the existing five year rolling cap arrangement outlined in the Murray Darling Basin Agreement. Since 1997–98 there have been no special audits triggered in the Metro Adelaide & Associated Country Areas Cap valley. As at 30 June 2016, the five year rolling cap was 401.03 GL against a target of 650 GL.
Lower Murray Swamps
No Cap model is required in the Lower Murray Swamps Cap valley as the annual Cap target is a fixed volume limit adjusted for trade and environmental water. Since 1997–98 there have been no special audits triggered in the Lower Murray Swamps Cap valley. As at 30 June 2016, the valley has recorded a cumulative credit of 144.90 GL.
Country Towns No Cap model is required for the Country Towns Cap valley as the annual Cap target is a fixed volume limit adjusted for trade and environmental water. Since 1997–98 there have been no special audits triggered in the Country Towns Cap valley. As at 30 June 2016, the valley has recorded a cumulative credit of 75.07 GL.
23 Goulburn Simulation Model- Resource Allocation Model

Transition period water take report 2012‒13 to 2015‒16
Page 173
Cap Valley Status of Cap models and Cap compliance to 30 June 2016
All Other Purposes A Regression Cap model was accredited in 2004 and was available to determine Cap compliance for the reporting period. Since 1997–98 there have been no special audits triggered in the All Other Purposes Cap valley. As at 30 June 2016, the valley has recorded a cumulative credit of 1,030.57 GL.
Notes to Appendix 3:
Model Accreditation
A requirement of Schedule E of the Murray Darling Basin Agreement is the development of
models for determining the annual Cap targets in each designated Cap valley. These models
must be accredited by the Authority before use. Once complete, these models are given to an
independent auditor to assess their suitability to meet requirements for models listed in Schedule.
The Authority takes on board recommendations from the independent auditor before accrediting
models for use. In some cases this has led to provisional accreditation pending further work from
the relevant body. Prior to 2009, models were accredited by the Ministerial Council.
Compliance and Special Audits
For each water year, states must monitor and report to the MDBA on the compliance of each
designated Cap valley with the Cap targets. Using this information, the MDBA maintains a Cap
Register 24 tracking the cumulative balance of annual actual diversions and Cap targets. If an
apparent exceedance of the Cap is found during this process the Authority must direct the
Independent Audit Group (IAG) to conduct a special audit of that Cap valley.
An apparent exceedance may be:
The diversions for the Metro Adelaide & Associated Country Areas exceeding 650 GL
over a five year period.
The diversions in the Warrego, Paroo, Moonie or Nebine exceeding the annual diversion
target within those valleys.
The cumulative debit recorded in the Cap Register exceeding 20% of the average annual
diversion in all other valleys.25
If called upon to perform a special audit, the IAG will consider a range of evidence before
reporting their determination within six months of receiving direction. If the IAG determines that
the state has exceeded the Cap, the Authority will declare the state in breach of the Cap and
report the matter to the Ministerial Council.
With the declaration of breach, a state must report to the next Ministerial Council stating the
reasons why the breach occurred, the action proposed or taken to return the Cap Register to
balance and the period that the Cap valleys model predicts it will take to return to balance. When
the Authority is satisfied that the Cap valley has returned to balance and complying with the Cap,
the Authority will revoke the declaration of breach and report this to the next Ministerial Council
meeting.
24 Available on the MDBA website: https://www.mdba.gov.au/publications/mdba-reports/water-take-compliance-reports 25 Excludes NSW Intersecting Streams

Transition period water take report 2012‒13 to 2015‒16
Page 174
13. Appendix 4: State nominated methods for annualising environmental water recovery under the
Cap arrangements
Cap valley Nominated
method Method Description
New South Wales
Intersecting Streams Not applicable Not applicable
Border Rivers Usage Method 1. The usage method adjusts the annual targets by the volume of environmental allocation used (that is physically taken out of the river system) for environmental benefits. 2. The adjustment also includes an estimate of water traded for environmental use of a non-environmental (consumptive) allocation or any environmental allocation traded back to consumptive pool. 3. For Cap valleys in NSW and Victoria, adjustment is made for Snowy transfers where applicable.
Gwydir
Namoi/Peel
Macquarie/Castlereagh/Bogan
Barwon–Darling/Lower Darling
Lachlan
Murrumbidgee
Murray
Victoria
Goulburn/Broken/Loddon Cap valley Usage Method 1. The usage method adjusts the annual targets by the volume of environmental allocation used (that is physically taken out of the river system) for environmental benefits. 2. The adjustment also includes an estimate of water traded for environmental use of a non-environmental (consumptive) allocation or any environmental allocation traded back to consumptive pool. 3. For Cap valleys in NSW and Victoria, adjustment is made for Snowy transfers where applicable.
Campaspe
Murray/Kiewa/Ovens Cap valley
Wimmera–Mallee Use of Model A model calibrated to the new (lower) diversion limit post environmental water recovery is used to determine annual division targets.
South Australia
Metropolitan Adelaide & associated country areas
Not applicable Not applicable

Transition period water take report 2012‒13 to 2015‒16
Page 175
Cap valley Nominated
method Method Description
Lower Murray swamps Simple or Bundled Scaling
1. The long-term diversion limit equivalent (LTDLE) volume of environmental water recovered for all classes together is scaled by the ratio of annual diversion target to the total long-term diversion limit before recovery. The LTDLE HEW recovered is annualised. 2. Subtract it from pre-adjusted annual permitted take to determine annual permitted take for consumptive use.
Country towns
All other purposes
Queensland
Condamine/Balonne Use of Model The model is run with all entitlements including HEW to give total Cap target, then the target under individual HEW entitlements is deducted from the total.
Border Rivers
Moonie
Nebine
Warrego
Paroo
Australian Capital Territory Not applicable Not applicable

Transition period water take report 2012‒13 to 2015‒16
Page 176
14. Appendix 5: Environmental water adjustment under the trial of SDL water accounting and
compliance
SDL resource unit State's nominated method Method Description
Queensland
Paroo Use of Model: The model of an SDL resource unit is
configured to the long-term diversion limit to determine the annual permitted take for consumptive use.
1. A model is run in an annual mode from the start of the accounting period with the climatic input for the water year added. The determination of annual modelled environmental water is based on the assumption of 100% utilisation of environmental entitlements. 2. The model determines a combined number of annual permitted take for both consumptive and environmental pools. 3. In post process, the modelled limit for environmental entitlements is subtracted from the combined number to determine annual permitted take for consumptive use.
Warrego
Nebine
Condamine–Balonne
Moonie
Queensland Border Rivers
New South Wales
NSW Border Rivers Scaling by Allocations: The environmental water
recovery (HEW) for each class of entitlements is separately annualised based on their modelled allocations. The annualised amount is removed from the pre-adjusted annual permitted take to determine the annual permitted take for consumptive use. The method uses data for: 1. High and general security entitlements: % modelled allocations , 2. Supplementary entitlements and unregulated systems: access period in days or months when water is available for use
As an initial Step, modelled annual Cap targets are scaled down to the relevant NSW plan limit (as it compares to the long-term average Cap for that area). 1. The long-term diversion limit equivalent (LTDLE) volume of on-allocation (high and general security) environmental water (HEW) is separately scaled by the ratio of annual modelled % allocation to the long-term modelled % allocation for that type of entitlement before recovery. The LTDLE HEW recovered is annualised. 2. The long-term diversion limit equivalent (LTDLE) volume of off-allocation (supplementary or unregulated system) environmental water (HEW) is scaled by the ratio of annual access period (days or months) to the long-term access period (days or months) made for that type of class before recovery. The LTDLE HEW recovered is annualised. 3. Make sum total of annualised environmental water volume for all classes. 4. Subtract it from pre-adjusted annual permitted take to determine annual permitted take for consumptive use.
Intersecting Streams
Gwydir
Namoi
Macquarie–Castlereagh
Lachlan
Murrumbidgee
Barwon–Darling Watercourse
Lower Darling
NSW Murray
Australian Capital Territory No environmental water held within the Australian Capital Territory in 2013–14 – no adjustment to determination of annual permitted take required
N/A
Victoria
Victorian Murray

Transition period water take report 2012‒13 to 2015‒16
Page 177
SDL resource unit State's nominated method Method Description
Kiewa
Scaling by Entitlement Types: The environmental water
recovery (HEW) for each class of entitlements (high and low reliability) is separately annualised based on their modelled entitlement volume. The annualised amount is removed from the pre-adjusted annual permitted take to determine the annual permitted take for consumptive use.
1. The long-term diversion limit equivalent (LTDLE) volume of environmental water (high reliability and general reliability) is separately scaled by the ratio of annual modelled diversion target to the long-term modelled limit for that type of entitlement before recovery. The LTDLE HEW recovered is annualised. 2. Make sum total of annualised environmental water volume for all classes. 3. Subtract it from pre-adjusted annual permitted take to determine annual permitted take for consumptive use.
Ovens
Broken
Goulburn
Campaspe
Loddon
Wimmera–Mallee Use of Model: The model of an SDL resource unit is
configured to the long-term diversion limit as set out by the Basin Plan to determine annual permitted take.
A model configured to new diversion limit post environmental water recovery is used to determine annual permitted take for consumptive use.
South Australia
SA Murray Simple or Bundled Scaling: The environmental water
recovery (HEW) for all classes/entitlements is annualised based on their sum total of modelled volume. The annualised amount is removed from the pre-adjusted annual permitted take to determine the annual permitted take for consumptive use.
1. The long-term diversion limit equivalent (LTDLE) volume of environmental water recovered for all classes together is scaled by the ratio of annual diversion target to the total long-term diversion limit before recovery. The LTDLE HEW recovered is annualised. 2. Subtract it from pre-adjusted annual permitted take to determine annual permitted take for consumptive use.
SA Non-Prescribed Areas No environmental water held within SA Non-Prescribed Areas in 2013–14 – no adjustment to determination of annual permitted take required
N/A
Marne Saunders No environmental water held within Marne Saunders in 2013–14 – no adjustment to determination of annual permitted take required
N/A
Eastern Mount Lofty Ranges No environmental water held within Eastern Mount Lofty Ranges in 2013–14 – no adjustment to determination of annual permitted take required
N/A

Transition period water take report 2012‒13 to 2015‒16
Page 178
15. Appendix 6: Surface water SDL resource units

Transition period water take report 2012‒13 to 2015‒16
Page 179
16. Appendix 7: Groundwater SDL resource units

Transition period water take report 2012‒13 to 2015‒16
Page 180

Transition period water take report 2012‒13 to 2015‒16
Page 181

Transition period water take report 2012‒13 to 2015‒16
Page 182
17. Appendix 8 – Core concepts and useful links
1 Legislative background
The Water Act 2007 (Cth) and the Basin Plan 2012 provide the legislative background that
informs the requirements of this water take report.
A.1.1 Water Act 2007 (Cth)
Section 71
Section 71 sets out reporting obligations of the Basin states to provide the MDBA with
information regarding the use and management of all Basin water resources for an annual water
accounting period.
Section 32
Section 32 requires the MDBA to identify and account for all held environmental water on an
annual basis, including all water access entitlements recovered for the environment through
reforms prior to the Basin Plan.
Schedule 1
Schedule 1 of the Water Act contains the Murray–Darling Basin Agreement. Schedule E of this
agreement establishes a long-term Cap on surface water use in river valleys across the Basin.
Schedule 1 also requires each Basin State to report to the MDBA on a range of matters.
The Water Act is available online via the Federal Register of Legislation
<https://www.legislation.gov.au/Home/>
A.1.2 The Basin Plan 2012
Schedule 2 of the Basin Plan sets out the long-term average sustainable diversion limits (SDLs)
for each surface-water SDL resource unit within the 20 water resource plan areas for surface
water. It also includes estimates by the MDBA of the quantity of water represented by the SDLs.
Long-term average sustainable diversion limits (SDLs) are the maximum long‑term annual
average quantities of water that can be taken on a sustainable basis from Basin water resources
as a whole, and from each SDL resource unit, from 2019. They are the means for ensuring that
consumption of water is maintained at an environmentally sustainable level.
Schedule 3 of the Basin Plan sets out the baseline diversion limits (BDL) for each surface water
SDL resource unit within the 20 surface-water water resource plan areas, and includes estimates
by the MDBA of the quantity of water represented by the BDL, in Gigalitres per year. BDLs define
a baseline from which to measure reductions in diversions. A surface water baseline diversion
limit is the sum of the long-term annual average limits (or where there is currently no limit, the
long-term annual average take) for all forms of take from a surface water SDL resource unit.
Schedule 4 of the Basin Plan sets out the baseline diversion limits (BDLs) and the long-term
average sustainable diversion limits (SDLs) for each groundwater SDL resource unit within the
23 groundwater water resource plan areas. Groundwater BDLs are the best estimates of the

Transition period water take report 2012‒13 to 2015‒16
Page 183
MDBA of the quantity of water that could be taken under the state planning regimes when the
Basin Plan was made. Groundwater SDLs are the maximum long-term average annual average
quantities of water that can be taken on a sustainable basis from each SDL resource unit. They
are the means for ensuring that consumption of water is maintained at an environmentally
sustainable level of take.
Schedule 12 of the Basin Plan sets out reporting requirements for MDBA, Basin states and the
Commonwealth. As part of this reporting, under Matter 9 of Schedule 12, MDBA, Basin states
and the Commonwealth are required to identify environmental water, both held and planned
environmental water and monitor its use. Matter 9 reporting is broken up into 3 areas, these are:
Matter 9.1 Identification and accounting of held environmental water;
Matter 9.2 Identification and accounting of planned environmental water; and
Matter 9.3 Monitoring the use of environmental water.
Contained in this report is the Basin State information received for Matter 9.1. The report for
Matter 9.3 is provided in Basin Plan annual report 2013–1426 published on the MDBA website.
Reporting on planned environmental water has occurred for the 2013–14 water year. However,
as reporting annually on planned environmental water is in its infancy, the results of these reports
are not yet published. The MDBA is working with Basin states on providing better ways of
reporting estimates on the amount of planned environmental water in the Basin.
The Basin Plan 2012 is available online via the Federal Register of Legislation.
<https://www.legislation.gov.au/Home/>
A.2 Core concepts with regard to take
A.2.1 What is take?
The term ‘take’ means the take of water from a water resource. Take includes taking the water by
means of:
• diverting it from a main river system into an irrigation district or other distribution network
• pumping water directly from the river or aquifer
• diverting water as the water flows across the land into a dam
• intercepting water before it reaches a river to grow a commercial forestry plantation.
A.2.2 Forms of take
The Basin Plan defines forms of take as:
take from a watercourse/unregulated river
take from a regulated river
take by floodplain harvesting
take by runoff dams
net take by commercial plantations
take from groundwater
26 Basin Plan annual report 2013–14 <https://www.mdba.gov.au/publications/mdba-reports/basin-plan-annual-report-2013–14>

Transition period water take report 2012‒13 to 2015‒16
Page 184
take under basic rights.
A.2.3 Sustainable diversion limits
The Basin Plan establishes sustainable diversion limits (SDLs) for surface and groundwater. The
SDL is the limit on how much water can be sustainably taken for consumptive uses (including
domestic, urban and agricultural use) from an SDL resource unit. The SDL includes all forms of
take and is a volume in Gigalitres per year (GL/y). The SDL is also a long-term annual average
limit.
There is an SDL volume for each SDL resource unit and take is reported for each SDL resource
unit in a water resource plan (WRP) area.
The SDLs take effect from 1 July 2019 through accredited water resource plans.
A.2.3.1 Surface water SDL resource units
The boundaries of the 29 surface water SDL resource units as defined by the Murray–Darling
Basin Plan can be found on the MDBA website http://www.mdba.gov.au/
A.2.3.2 Groundwater SDL resource units
The boundaries of the 66 groundwater SDL resource units as defined by the Murray–Darling
Basin Plan can be found on the MDBA website http://www.mdba.gov.au/
This includes 7 groundwater SDL resource units for deep groundwater that can be found on the
MDBA website http://www.mdba.gov.au/
Note that there are six WRP areas that apply to both surface water and groundwater, therefore
the total number of WRP areas is 36. The WRP areas incorporate a total of 110 SDL resource
units.
A number of other maps and alternative formats for the above maps are available on the MDBA
website http://www.mdba.gov.au/
A.2.4 Reporting Take
Take is accounted for over a water accounting period, which follows the 12 month period 1 July
to 30 June. The Basin states report take of surface water and groundwater to the MDBA. The
MDBA is responsible for assessing the data before recording it on a register of take for each SDL
resource unit. The purpose of this register is to record compliance by Basin states with the SDL
for each SDL resource unit. Compliance commences in the first water accounting period after 30
June 2019 following the commencement of an accredited water resource plan.
A.2.5 Annual actual take and annual permitted take
For a water accounting period, annual permitted take is the sum of the maximum quantities of
water permitted to be taken by each form of take for consumptive use from an SDL resource unit.
The water resource plan must have a method to determine annual permitted take for each form
of take in each SDL resource unit in the WRP area. This method must be designed to be applied
at the end of each water accounting period. The water resources available during the accounting
period are a very important consideration in the method.

Transition period water take report 2012‒13 to 2015‒16
Page 185
Because of varying water availability between water accounting periods, annual permitted take
will vary and will rarely, if ever, equal the SDL. Importantly, while annual permitted take can vary,
the SDL of each resource unit in the WRP area must be complied with over the term of the water
resource plan.
For the same water accounting period, annual actual take is the sum of the quantities of water
actually taken by each form of take for consumptive use from the SDL resource unit.
A water resource plan must have rules to ensure that annual actual take does not exceed annual
permitted take. If applicable, water allocation rules need to be included.
Data provided annually by Basin states comes from a range of sources including: state registers
and databases; outputs from state river models; estimates from surveys and other methods.
Therefore, data may range from very accurate and reliable to potentially limited or with high
levels of uncertainty. This range of data sources is acceptable to be added together to calculate
either the annual permitted take or actual take. The Basin Plan provides some flexibility with this
data uncertainty by allowing the Basin State to have a cumulative balance of actual take over
permitted take of up to 20% of the SDL before the Basin State would be considered non-
compliant, for an SDL resource unit.
A.2.6 Roles and responsibilities
The Basin Plan has established two main roles with regards to the plan: the MDBA as the
regulator of the Basin Plan and the Basin states as the implementers.
Basin states are responsible for managing the water activities within their state, in accordance
with the accredited water resource plans. Each year the states report the water take and the
MDBA records the Basin State’s assessment of compliance with SDLs.
A.2.7 Implementation process
The Basin Plan’s management arrangements implement SDLs in each SDL resource unit, which
are within a water resource plan area. A water resource plan area may include several SDL
resource units. Basin states are responsible for preparing water resource plans for these water
resource plan areas. A water resource plan has to ensure that the SDL of each resource unit in
the water resource plan area is complied with over the term of the water resource plan.
Basin states are developing water resource plans during this transition period to 1 July 2019.
Basin states propose water resource plans to the MDBA, who then assess them and provide
recommendations to the Commonwealth Water Minister whether a water resource plan should be
accredited or not. The Commonwealth Water Minister considers the recommendations and
makes a decision whether to accredit a water resource plan or not. Accredited water resource
plans will have effect until either it ceases to have effect or until three years after an amendment
to the Basin Plan that affects water resource plan accreditations.
A.3 Useful links
This section includes links to key legislation, reports, maps and other information sources
referred to throughout this report. While this report is intended to standalone, the links below may

Transition period water take report 2012‒13 to 2015‒16
Page 186
be useful for readers seeking further information for context, background, or as a starting point to
explore this report in more detail.
A.3.1 Reports
MDBA Annual Reports:
The Basin Plan annual report tracks the progress of the Basin Plan and associated water
reforms. The 2012–13, 2013–14, 2014–15 and 2015–16 reports are available on the MDBA
website <http://www.mdba.gov.au/>
The Commonwealth Water Act 2007 <https://www.legislation.gov.au/Home/>
The Basin Plan 2012 <https://www.legislation.gov.au/Home/>
Environmental Water Recovery Progress <http://www.mdba.gov.au/>

Transition period water take report 2012‒13 to 2015‒16
Page 187
18. Glossary
Actual take Total quantity of water actually taken from the water resources of a
water resource plan area during a water accounting period.
Allocation The annual volume of water to which the holder of an access
licence is entitled as recorded in the water allocation account for the
licence.
Baseline Diversion Limit Baseline diversion limit (BDL) means the baseline limit of take from
a sustainable diversion limit (SDL) resource unit. The baseline limit
is:
o for a surface water SDL resource unit — the quantity of water
calculated in accordance with column 2 of the table in Basin
Plan Schedule 3 for that SDL resource unit.
o for a groundwater SDL resource unit — quantity of water
calculated in accordance with column 3 of the table in Basin
Plan Schedule 4 for that SDL resource unit.
The baseline reflects the level of take at 30 June 2009 generally. It
is a combination of limits established by state law (e.g. existing
water resource plan limits) or limits established by the Cap
arrangements, and defined levels of take where there are no
established limits.
The BDL establishes a baseline from which to determine required
reductions in diversions to achieve the SDL.
Basin Plan, the Legislation that sets out the BDL and SDL for each resource unit
and the reporting requirements (see section A.1.2 for more
information).
Basin states The states and territories within the Murray–Darling Basin, namely,
New South Wales, Victoria, Queensland, South Australia and the
Australian Capital Territory.
Bulk entitlement A perpetual entitlement of water granted to water authorities by the
Crown of Victoria under the Water Act 1989 (Vic).
Carryover A way to manage water resources and allocations that allows
entitlement holders to take a portion of unused water from one water
year into a new water year.
Cap, The A limit, implemented in 1997, on the volume of surface water that can
be diverted for consumptive use.
CEWH Commonwealth Environmental Water Holder
CEWO Commonwealth Environmental Water Office

Transition period water take report 2012‒13 to 2015‒16
Page 188
Class of entitlement Water entitlements are divided into differing ‘classes’ of security,
where ‘security’ refers to the frequency with which water allocated
under that entitlement is able to be supplied in full. Higher security
entitlements have higher average and less variable yields than lower
security entitlements.
Consumptive use Use of water for irrigation, industry, urban, stock and domestic use, or
for other private consumptive purpose.
Diversion The removal of water from a river system by means of pumping or
gravity channels.
Diversion licence Specified licences issued for a specified annual volume and diversion
rate.
Water entitlement The volume of water authorised to be taken and used by an irrigator
or water authority. It includes bulk entitlements, environmental
entitlements, water rights, sales water and surface-water and
groundwater licences.
Environmentally sustainable Average level of take that allowing environmental needs to be
level of take met.
Environmental water Held environmental water or planned environmental water.
Floodplain harvesting The taking of water from a floodplain, including after it leaves a
watercourse during a flood.
Gigalitre (GL) One billion or 109 litres.
Groundwater Water occurring naturally below ground level (in an aquifer or
otherwise).
Held environmental water Water available under:
(a) a water access right, or
(b) a water delivery right, or
(c) an irrigation right,
for the purposes of achieving environmental outcomes (including
water that is specified in a water access right to be for environmental
use).
Inflow Source of the water that flows into a specific body of water — for a
lake, inflow could be a stream or river, and inflow for a stream or river
could be rain.
Interception The interception of surface water or groundwater that would
otherwise flow, directly or indirectly, into a watercourse, lake, wetland,
aquifer, dam or reservoir that is a Basin water resource.
IQQM Integrated quantity quality model

Transition period water take report 2012‒13 to 2015‒16
Page 189
Irrigation The application of water to land to grow crops, usually through
supplying water by means of channels or pipes
Long-term diversion limit Ratio used by water planners to represent the expected use of water
in the various water access entitlements of a given river system.
Megalitre (ML) One million or 106 litres
MSM Murray Simulation Model
Ministerial Council, The Murray–Darling Basin Ministerial Council.
Murray–Darling Basin The Agreement between the governments of Agreement the four
Agreement Basin states and the Commonwealth. The current Agreement is the
2008 Agreement.
On-farm storage Privately-owned storage used to harvest surplus flow or to store
unused allocation for use in the following season.
Overdraw Water diverted in one season against a prospective allocation in the
subsequent year.
Overland flow A term used by Queensland for floodplain harvesting, see definition
for floodplain harvesting
Permitted take Total quantity of water permitted to be taken during a water
accounting period in a water resource plan area, varying from year
to year according to the interaction of climate, inflows and water
resource plan rules (e.g. allocation rules, access rules).
Planned Environmental Water Water used for environmental outcomes which is not associated with
an entitlement but is managed through with rules set out in water
management plans or laws.
REALM Resource Allocation Model
Regulated system A surface water system in which water in a watercourse can be stored
or flow levels are controlled, through the use of structures such as
large dams and large weirs.
Salinity The concentration of dissolved salts in water usually expressed in EC
units. Applies to both surface and groundwater
Surface water Includes water in a watercourse, lake or wetland, and any water
flowing over or lying on the land after having precipitated naturally or
after having risen to the surface naturally from underground.
Sustainable diversion limit The maximum long-term annual average quantity of water that can
(SDL) be taken, on a sustainable basis, from the Basin water resources as a
whole, and the water resources, or particular parts of the water
resources, of each water resource plan area.

Transition period water take report 2012‒13 to 2015‒16
Page 190
Take Take is the removal of water, or the reduction in flow of water, from a
water resource for consumptive purposes. See ‘Actual Take’ and
‘Permitted Take.’
Transitional diversion limit The TDL represents progress from current diversion limits (defined
(TDL) in the Basin Plan as the baseline diversion limit – BDL) to the SDL. It
is a mechanism to assist with the development, testing and trialling of
Basin Plan arrangements till June 2019.
Unregulated streams Streams that are not controlled or regulated by releases from major
storages.
Utilisation The amount of water available for diversion that is actually diverted.
Water accounting A systematic process of identifying, recognising, quantifying,
reporting and assuring information about water, the rights or other
claims to water, and the obligations against water. Water accounting
applies Australian Water Accounting Standards
Water audit monitoring MDBA prepared annual reports providing a comprehensive (WAM) Report overview of water use and management in the Basin. The Cap
method precursor to Water Take Reporting. Water quality The condition of water and its related suitability for different purposes.
It refers to a combination of physical, chemical and/or biological
characteristics of water in the context of the proposed use of that
water.
Water resource Groundwater — water that occurs naturally beneath the ground level
(whether in an aquifer or otherwise), or water that has been pumped,
diverted or released to an aquifer for the purpose of being stored
there. Murray–Darling Basin groundwater resources exclude
groundwater in the Great Artesian Basin.
Surface water — includes water in a watercourse, lake or wetland,
and any water flowing over or lying on land after having precipitated
naturally, or after having risen to the surface naturally from beneath
the ground level.
Water resource plans (WRPs) Statutory management plans developed for particular surface water
and groundwater systems. Currently these plans known by different
names throughout the Murray–Darling Basin (such as ‘water sharing
plans’ in New South Wales and ‘water allocation plans’ in SA).
Water year A continuous 12-month period, usually starting 1 July, or any other
month as prescribed under the water regulation or a resource
operations plan, but usually selected to begin and end during a
relatively dry season. Used as a basis for processing streamflow and
other hydrologic data.