transit oriented development strategic plan for … presentations/city...transit oriented...
TRANSCRIPT

Transit Oriented Development Strategic Plan for Bhopal
26th February, 2015
IBI GROUP

INTRODUCING BHOPAL
Bhopal Curitiba Ottawa
Population 1.79 million (2011) 1.76 million 1.2 million
Area 684.24 sq.km 430.9 sq.km 5716 sq.km
Gross Density 2616 persons/sq.km 4095 persons /sq.km 196.6 persons/sq.km
Urban Area Density 6893 persons/sq.km 4200 persons/sq.km 1860 persons/sq.km
Higher Order Transit BRTS + proposed MRTS BRTS BRTS + Proposed LRT
OttawaCuritibaBhopal
Urban FormTransport Policy Framework

Need for TOD in Bhopal
• Prioritizing public transit use and reduced use of private vehicles for daily commuting
• Providing policy directions to establish a TOD-centric growth pattern
• Capitalizing upon the land value potential near BRTS and Metro stations to attract private sector investment in joint development
• Formulating a strategic implementation programme that outlines the phasing strategy for investment

Step-by-Step Process
Recommendations to address these barriers in order to strengthen the role
of Bhopal’s local administration in planning and implementing TODs.
Brings forth the fundamental steps in the development of transit and
pedestrian friendly communities in Indian cities.
Determines the Scale and scope for the Bhopal TOD Plan taking into
consideration existing nodal agency priorities, data availability, and a
cursory review of existing plans
Government, experts and stakeholders formulate team with their roles
and responsibilities for the process of implementation
The ‘Invest’ section presents a capital improvements programme for
the implementation of the TOD Plan.

ASSESS
ENA
BLE
PLA
N+ D
ESIGN
INV
ESTIM
PLEM
ENT
1. Review Nature of Transit
High NMT Modal Share
Expanding higher order transit service
• BRTS (1 operational) and MRTS (planned)
10% annum growth in vehicular traffic over the last decade, of which 80% are 2wheelersWalk 44%
Cycle4%
Two Wheeler
25%
Car 3%IPT1%
Mini Bus20%
Bus3%
74% Potential Transit Users

ASSESS
ENA
BLE
PLA
N+ D
ESIGN
INV
ESTIM
PLEM
ENT
1. Review Nature of Transit
Public transport- Buses, mini buses and IPT modes (Tata Magic, auto-rickshaws).
ASSESS
ENA
BLE
PLA
N+ D
ESIGN
INV
ESTIM
PLEM
ENT
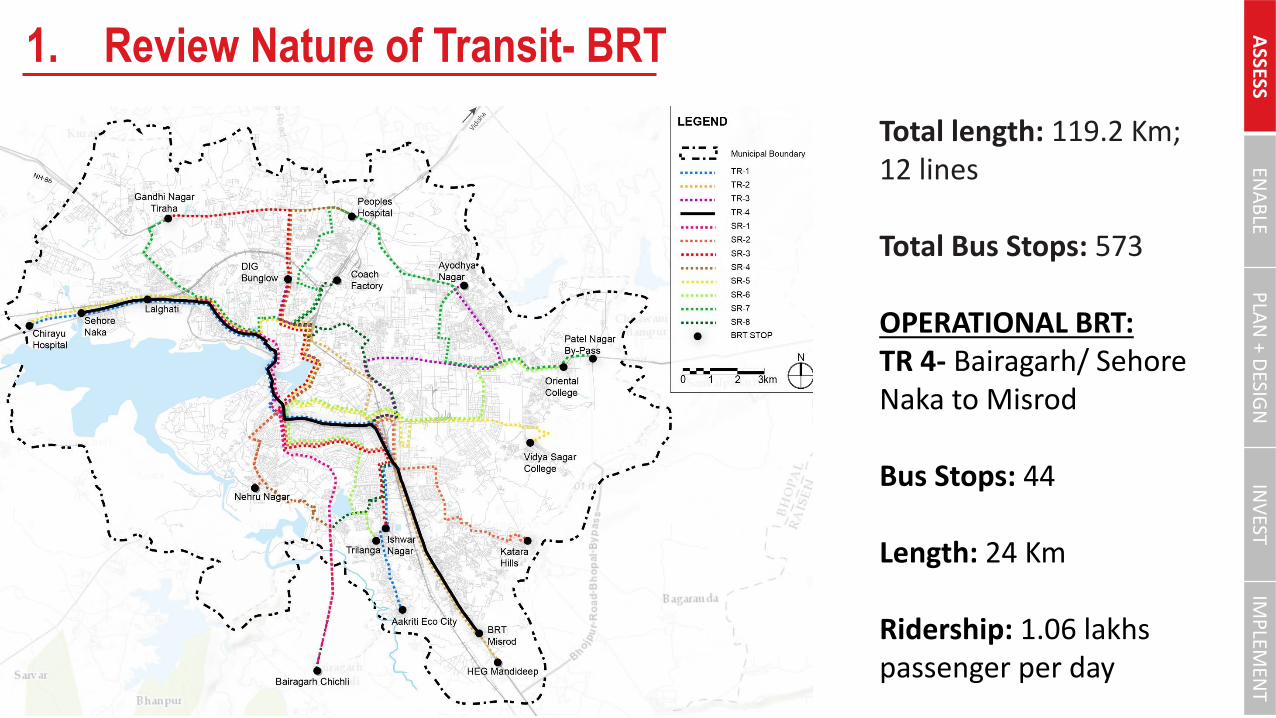
1. Review Nature of Transit- BRT
Total length: 119.2 Km;12 lines
Total Bus Stops: 573
OPERATIONAL BRT: TR 4- Bairagarh/ Sehore Naka to Misrod
Bus Stops: 44
Length: 24 Km
Ridership: 1.06 lakhs passenger per day
ASSESS
ENA
BLE
PLA
N+ D
ESIGN
INV
ESTIM
PLEM
ENT
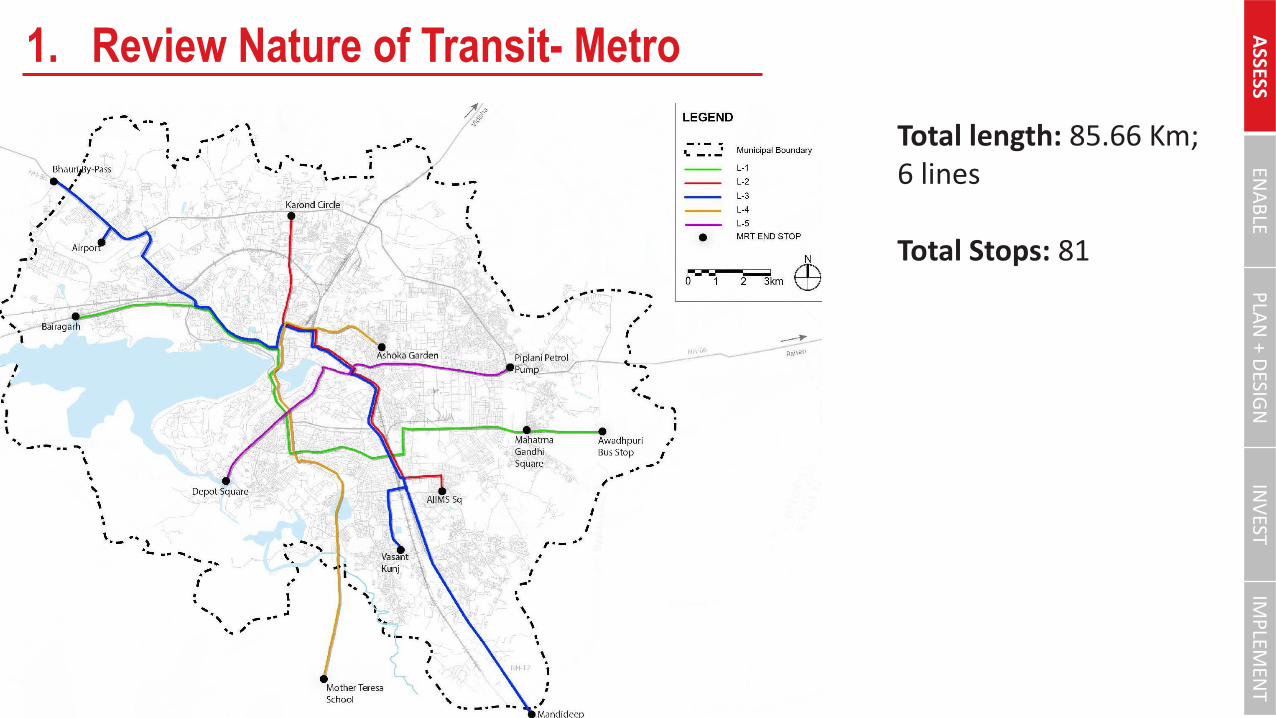
1. Review Nature of Transit- Metro
Total length: 85.66 Km; 6 lines
Total Stops: 81

ASSESS
ENA
BLE
PLA
N+ D
ESIGN
INV
ESTIM
PLEM
ENT
1. Review Nature of Transit- Key Takeaway
• Proposed Metro route alignment runs parallel with the operations and proposed BRT routes
• Government intends to gradually phase out the operational BRT route or utilize it as a feeder system, once the Metro is operational
• Corridor level TOD approach with multi-modal integration of different modes of transportation.

ASSESS
ENA
BLE
PLA
N+ D
ESIGN
INV
ESTIM
PLEM
ENT
1. Review Station Areas
Lack of multimodal integration Poor Transit Quality

ASSESS
ENA
BLE
PLA
N+ D
ESIGN
INV
ESTIM
PLEM
ENT
1. Review Station Areas
Lack of traffic calming to improve safety for pedestrians
Unsafe access between BRT stops & surrounding development

ASSESS
ENA
BLE
PLA
N+ D
ESIGN
INV
ESTIM
PLEM
ENT
1. Review Station Areas
Lack of planned parking facility High on-street parking encroaching NMT infrastructure

ASSESS
ENA
BLE
PLA
N+ D
ESIGN
INV
ESTIM
PLEM
ENT
2. Institutional Framework
• Multiplicity of agencies
• Land use planning falls under the purview of Town and Country Planning at state level or development authority.
• Insufficient capacities to develop and implement TOD projects

ASSESS
ENA
BLE
PLA
N+ D
ESIGN
INV
ESTIM
PLEM
ENT
3. Previous Plans- Bhopal Master Plan
TOD Consistencies:
• Differential densities for city with higher density areas proposed around the existing and the proposed work centres
• Proposed Mass Rapid Transit System connecting major work centres, and traffic generating zones
• Recommends variable FSIs based on site context.
TOD Gaps:
• Does not address regulatory or implementation mechanisms for coordinated land use and transportation planning
• Does not identifies mixed use as a land use category
• Development controls are limited to FSI
• Does not plan for pedestrian accessibility

ASSESS
ENA
BLE
PLA
N+ D
ESIGN
INV
ESTIM
PLEM
ENT
3. Previous Plans- DCRs
FAR
• Residential Use: 0.75- 1.33
• Commercial Use: 1.5-2.5
• Mixed Use: FAR for commercial development will be 0.75 only where FAR for residential area is 0.75
• DENSITIES PROPOSED (Development Plan- 2005)
• Low- upto 125PPH
• Medium- 126-250 PPH
• Medium & High- 251- 400PPH
• High- 401- 600PPH
PARKING:
• Multi-family Residential: 1ECS/ 100sqm
• Commercial: • 1 ECS/ 50 sq.m where shops size
exceed 20 sq.m
• 1 ECS /100 sq.m of floor space in other areas
• Hotels and Lodges: 1ECS/75 sq.m• Govt. Semi-public and private offices:
1ECS/100 sq.m of built-up area

ASSESS
ENA
BLE
PLA
N+ D
ESIGN
INV
ESTIM
PLEM
ENT
3. Previous Plans- Bhumi Vikas Adhiniyam
TOD Consistencies:
• Introduces a new category of residential use R2 that permits commercial on ground floor
• The assessment of the shopline is based on:• Infrastructure capacity• Traffic survey
• Express clearance require for permitting high-rise buildings to ensure balance of infrastructure and other utilities.
TOD Gaps:
• Does not include the concept of Transit Oriented Development.
• Does not include mixed use a category in the identified land uses that allows mix of uses other than commercial and residential
• Allows front setbacks and boundary wall which are not friendly for developments.
• No single window approval for development

ASSESS
ENA
BLE
PLA
N+ D
ESIGN
INV
ESTIM
PLEM
ENT
3. Previous Plans- BRTS DPR
TOD Consistencies:
• Proposed typical cross section based on different ROWs
• Segregated traffic lanes for BRT, slow moving vehicles, non motorized transport and pedestrians.
• Proposed integration of BRT with the existing feeder service.
• Planned the BRTS routes linking the proposed sub-cities.
TOD Gaps:
• Does not discuss micro-strategies to improve accessibility to transit stations.
• Lack of integration of parking and with local feeder service- autos, tata magic.
• The plan does not take into consideration universal accessibility
ASSESS
ENA
BLE
PLA
N+ D
ESIGN
INV
ESTIM
PLEM
ENT
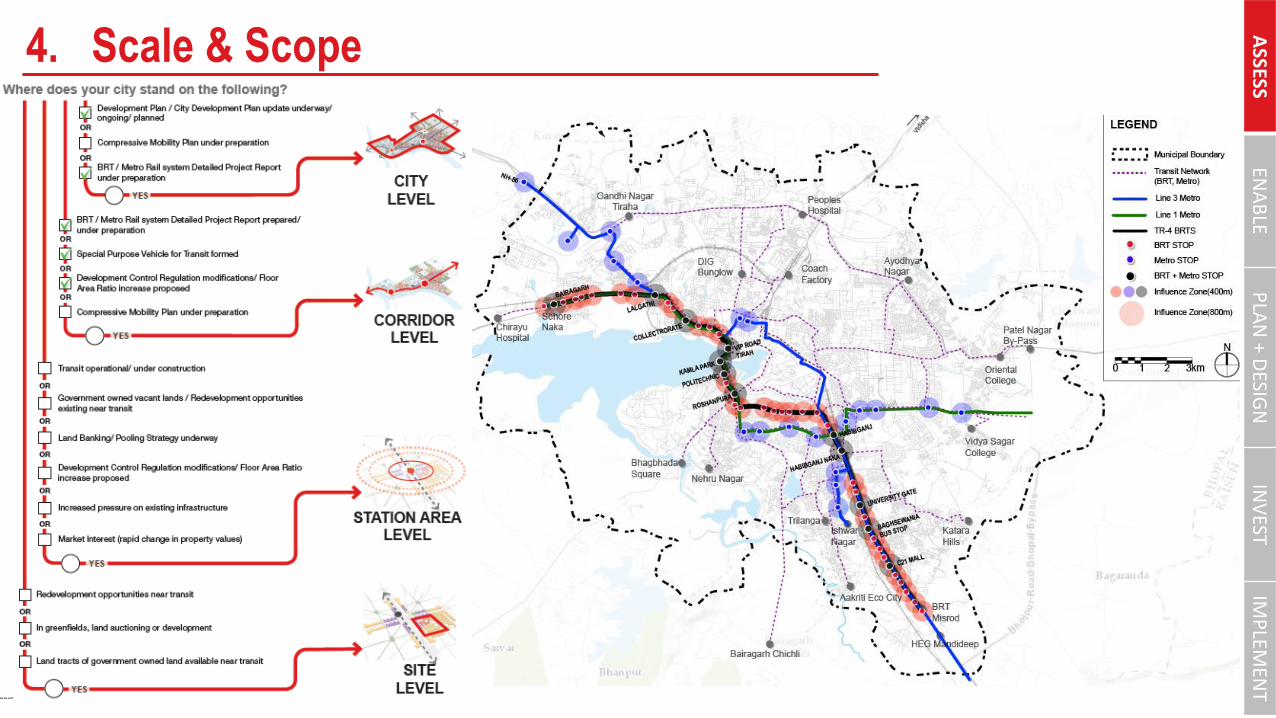
4. Scale & Scope
ASSESS
ENA
BLE
PLA
N+ D
ESIGN
INV
ESTIM
PLEM
ENT
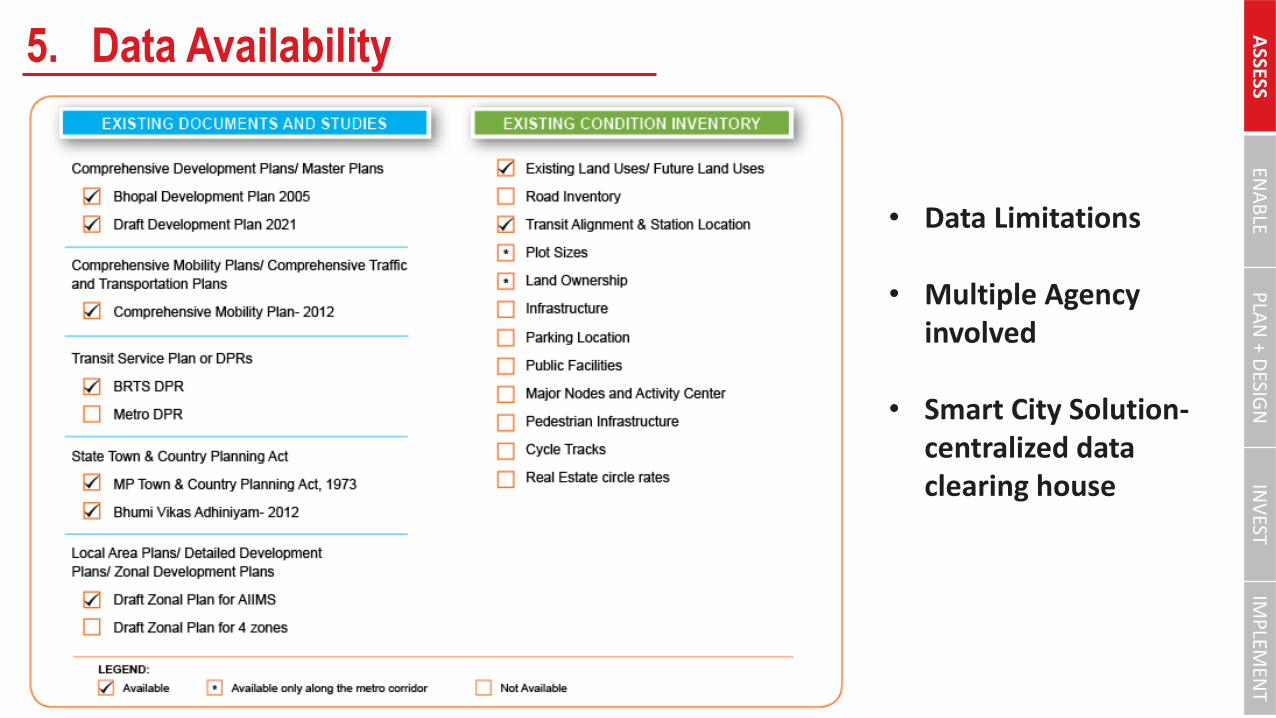
5. Data Availability
• Data Limitations
• Multiple Agency involved
• Smart City Solution-centralized data clearing house

ASSESS
ENA
BLE
PLA
N+ D
ESIGN
INV
ESTIM
PLEM
ENT
1. TOD Task Force

ASSESS
ENA
BLE
PLA
N+ D
ESIGN
INV
ESTIM
PLEM
ENT
2. Goal Setting
1. Two- Pronged Approach: BRTS vs. MRTS
2. Eliminating Policy/ Regulations barriers- Acts/ Development Plan / DCR modifications
3. Differential FARs / Optimized Densities based on Station Area Plans/ Special TOD Zone
4. Prioritization for Development of Station Areas
5. Financial and non-financial incentives to push market towards desired investment
ASSESS
ENA
BLE
PLA
N+ D
ESIGN
INV
ESTIM
PLEM
ENT
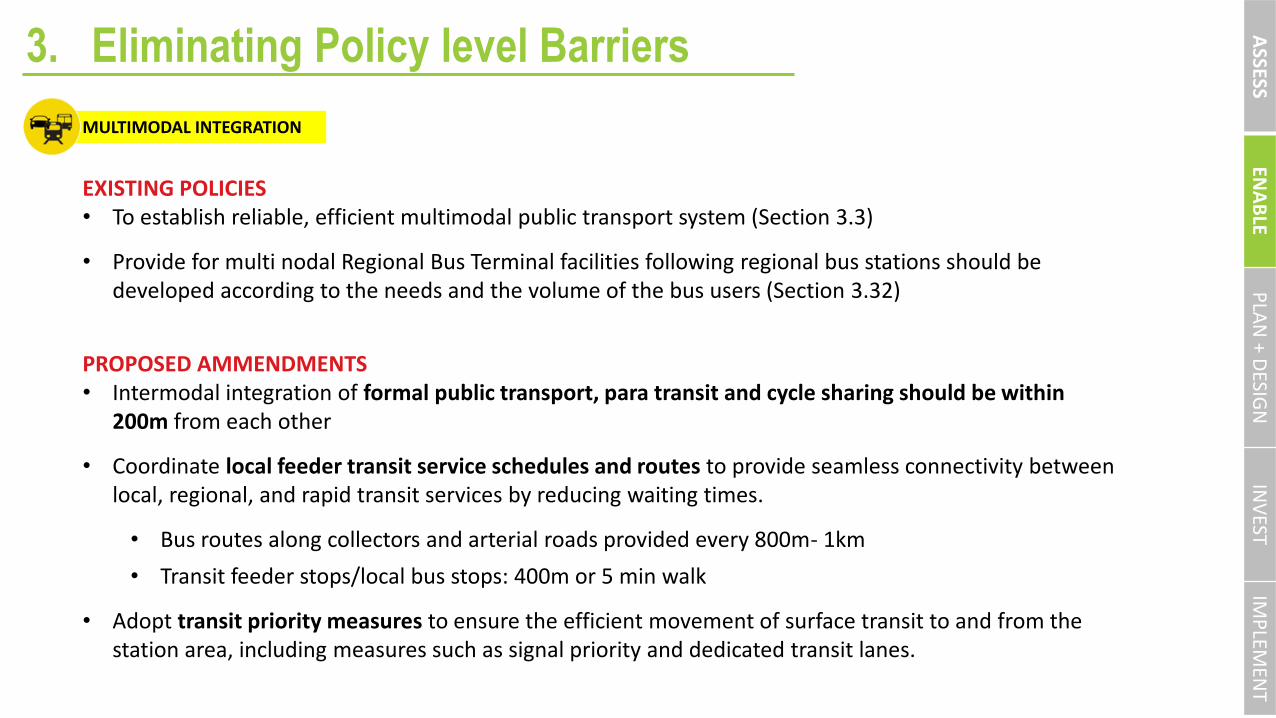
3. Eliminating Policy level Barriers
MULTIMODAL INTEGRATION
EXISTING POLICIES• To establish reliable, efficient multimodal public transport system (Section 3.3)
• Provide for multi nodal Regional Bus Terminal facilities following regional bus stations should be developed according to the needs and the volume of the bus users (Section 3.32)
PROPOSED AMMENDMENTS• Intermodal integration of formal public transport, para transit and cycle sharing should be within
200m from each other
• Coordinate local feeder transit service schedules and routes to provide seamless connectivity between local, regional, and rapid transit services by reducing waiting times.
• Bus routes along collectors and arterial roads provided every 800m- 1km
• Transit feeder stops/local bus stops: 400m or 5 min walk
• Adopt transit priority measures to ensure the efficient movement of surface transit to and from the station area, including measures such as signal priority and dedicated transit lanes.

ASSESS
ENA
BLE
PLA
N+ D
ESIGN
INV
ESTIM
PLEM
ENT
3. Eliminating Policy level Barriers
EXISTING POLICIES• Mixed land use- Mixed land use zone means a use zone in the land use plan consisting of more than
one use zones, in such case use premises/use activities permitted.in both the use zones shall be applicable. (Section 4.12)
• At the time of Zonal Development Plan, streets of mixed use activity shall be identified.
• Commercial activity allowed shall be only on the ground floor to the extent of 25% or 50sqm
PROPOSED AMMENDMENTS• In all integrated schemes, a minimum of 30% of overall FAR shall be mandatory for Residential use, a
minimum 10% of FAR for commercial use and minimum 10% of FAR for community facilities. Mix of uses and FAR utilization for the remaining 50% FAR shall be as per the land use category designated in the Zonal Plan.
MIXED LAND USES
ASSESS
ENA
BLE
PLA
N+ D
ESIGN
INV
ESTIM
PLEM
ENT
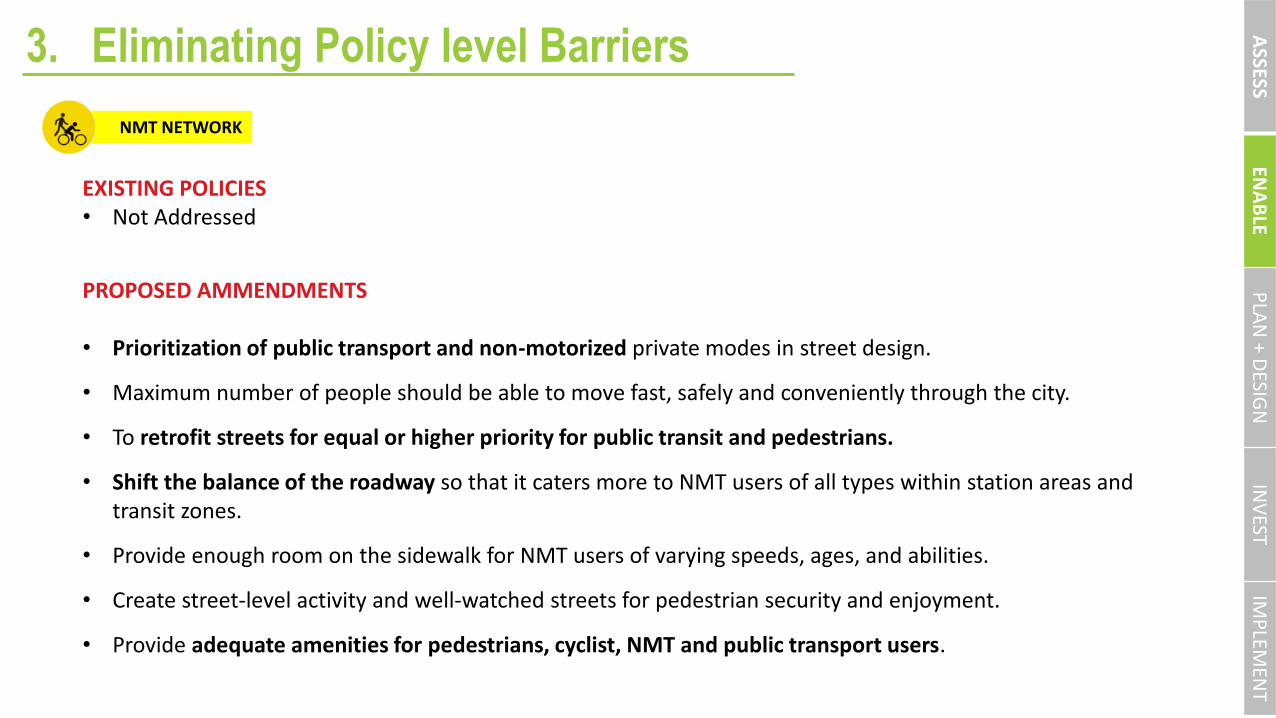
3. Eliminating Policy level Barriers
EXISTING POLICIES• Not Addressed
PROPOSED AMMENDMENTS
• Prioritization of public transport and non-motorized private modes in street design.
• Maximum number of people should be able to move fast, safely and conveniently through the city.
• To retrofit streets for equal or higher priority for public transit and pedestrians.
• Shift the balance of the roadway so that it caters more to NMT users of all types within station areas and transit zones.
• Provide enough room on the sidewalk for NMT users of varying speeds, ages, and abilities.
• Create street-level activity and well-watched streets for pedestrian security and enjoyment.
• Provide adequate amenities for pedestrians, cyclist, NMT and public transport users.
NMT NETWORK

ASSESS
ENA
BLE
PLA
N+ D
ESIGN
INV
ESTIM
PLEM
ENT
1. Map Transit CorridorPriority Corridor:• BRTS- TR4 (Operational
Corridor)• MRTS: Line 1 & Line 3
Critical link that connects the major activity centres in Bhopal.
Metro traces the same route except for the stretch extending from Board Office to Mandideep and an additional connectivity to Airport.
Overlapping Stretch: 14Km (Metro-21.58Km & BRT 30.59KM)

ASSESS
ENA
BLE
PLA
N+ D
ESIGN
INV
ESTIM
PLEM
ENT
2. Influence Zone

ASSESS
ENA
BLE
PLA
N+ D
ESIGN
INV
ESTIM
PLEM
ENT
3. Analyzing Development Opportunities Misrod- Habibganj stretch • High availability of vacant land.• Close proximity to the railway
station is attracting a lot of economic activities.
Habibganj Railway Station- T.T. Nagar is a high activity area with large residential areas on the left side and large commercial centrei.e. at MP Nagar on the right side.
T.T. Nagar- Kamla Park stretch has mix of activities- New Market, Kamla Park
Kamla Park- Bairagarh has a mixed use character- old area with high percentage of mix of
Towards Bairagarh- stretch maintains a mixed use character & low density development.

ASSESS
ENA
BLE
PLA
N+ D
ESIGN
INV
ESTIM
PLEM
ENT
3. Analyzing Development Opportunities
Based on travel demand projections:
• Stretch from T.T. Nagar to Board Office is the highly used corridor;
• Stretch connectingBoard Office to Habibganj Station
ASSESS
ENA
BLE
PLA
N+ D
ESIGN
INV
ESTIM
PLEM
ENT
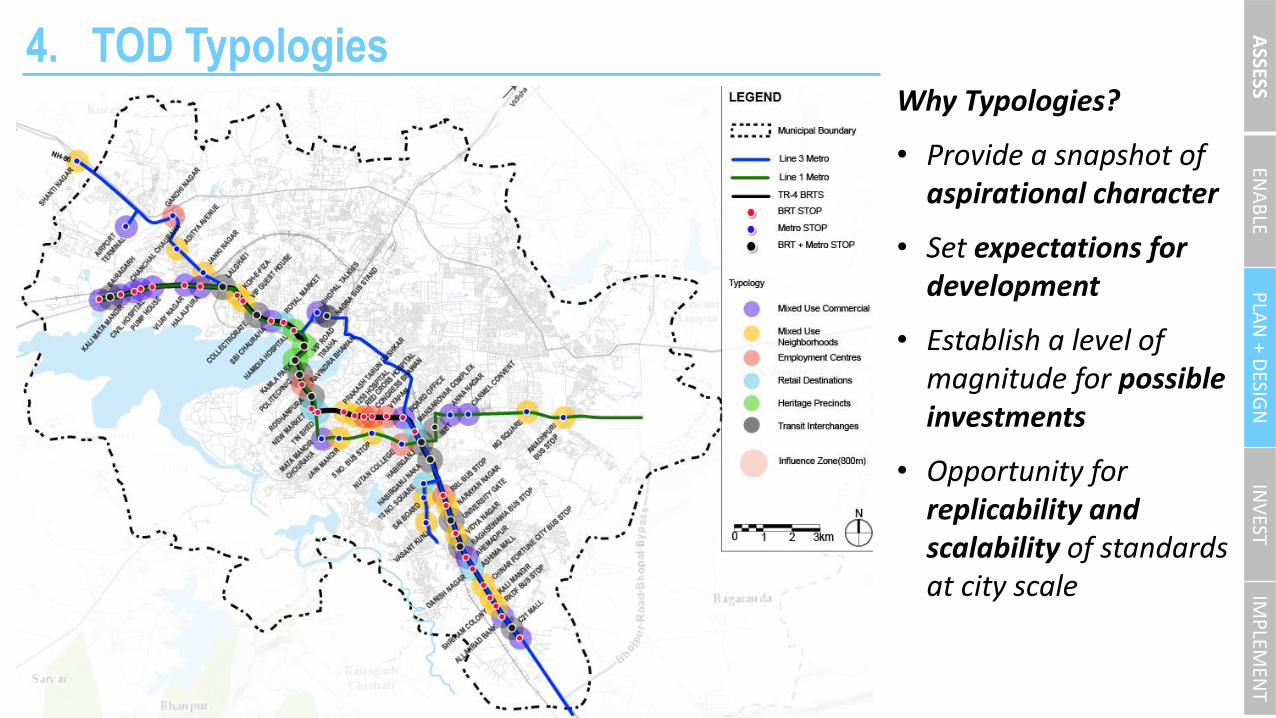
4. TOD TypologiesWhy Typologies?
• Provide a snapshot of aspirational character
• Set expectations for development
• Establish a level of magnitude for possible investments
• Opportunity for replicability and scalability of standards at city scale

ASSESS
ENA
BLE
PLA
N+ D
ESIGN
INV
ESTIM
PLEM
ENT
4. TOD Typologies
Mixed Use Commercial
Mixed use Neighbourhoods
Employment Centres
Retail Destinations Heritage Precincts Transit Interchanges
Characteristic Significant center of economic and cultural activity with regional-scale retail destinations.
Predominantly residential district within the core/old city area
Significant centreof economic and community activity & offices of the city + a moderate mix of retail.
Famousdestinations,recreation areas, mass congregation areas
Old parts of the city with significanthistorical, cultural & architecturalcharacteristics
Predominantly a mix of commercial,institutional and residentialdistrict organized around transit stations
Land Use Residential-30-40%Commercial-30-50%PSP & Others- 10-20%
Residential-50-70%Commercial-20-30%PSP & Others- 10-20%
Residential-30-40%Commercial-10-20%PSP & Others- 30-50%
Residential-30%Commercial-50-60%PSP & Others- 10-20%
Residential-30-40%Commercial-10-20%PSP & Others- 10-20%Heritage Areas-20-30%
Residential-30%Commercial-10-20%PSP & Others- 10-20%Transportation-20-30%

ASSESS
ENA
BLE
PLA
N+ D
ESIGN
INV
ESTIM
PLEM
ENT
5. Accessibility
• Traffic calming
• Pedestrian
crosswalks
• IPT integration
• Universal
Access

ASSESS
ENA
BLE
PLA
N+ D
ESIGN
INV
ESTIM
PLEM
ENT
5. Accessibility
RoW: 60m

ASSESS
ENA
BLE
PLA
N+ D
ESIGN
INV
ESTIM
PLEM
ENT
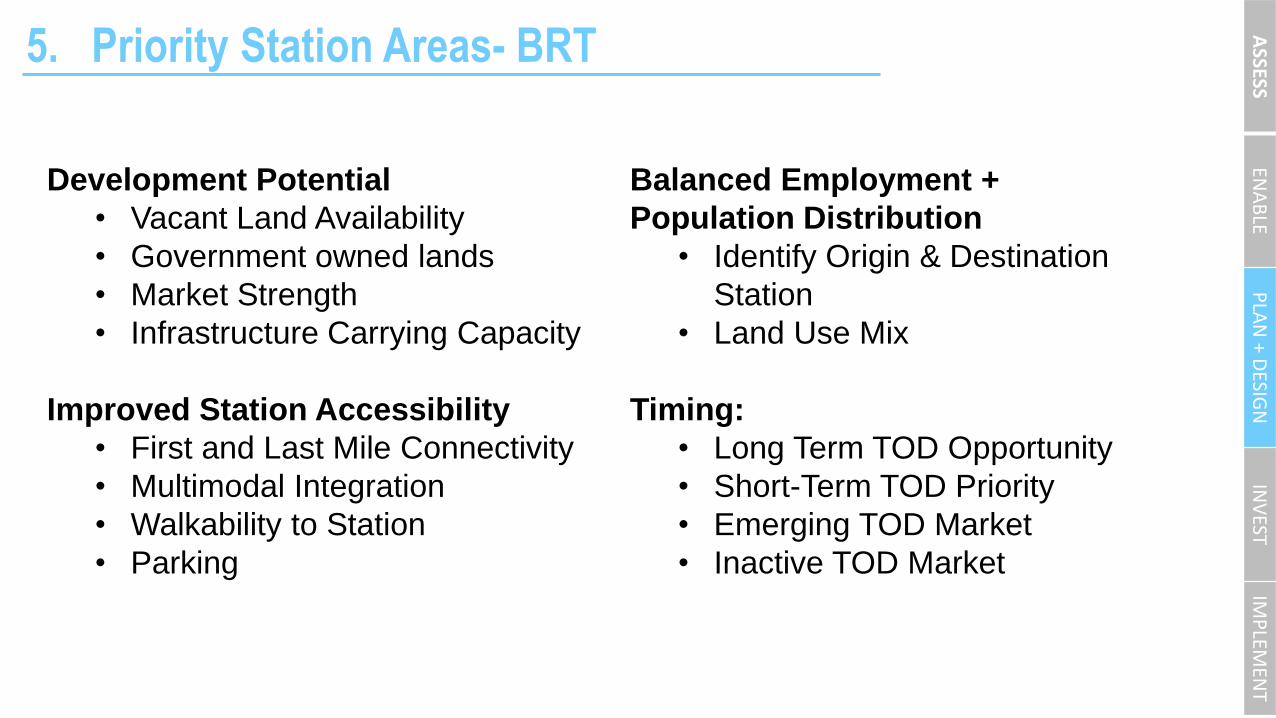
5. Priority Station Areas- BRT
ASSESS
ENA
BLE
PLA
N+ D
ESIGN
INV
ESTIM
PLEM
ENT
5. Priority Station Areas- BRT
Development Potential
• Vacant Land Availability
• Government owned lands
• Market Strength
• Infrastructure Carrying Capacity
Improved Station Accessibility
• First and Last Mile Connectivity
• Multimodal Integration
• Walkability to Station
• Parking
Balanced Employment +
Population Distribution
• Identify Origin & Destination
Station
• Land Use Mix
Timing:
• Long Term TOD Opportunity
• Short-Term TOD Priority
• Emerging TOD Market
• Inactive TOD Market
ASSESS
ENA
BLE
PLA
N+ D
ESIGN
INV
ESTIM
PLEM
ENT
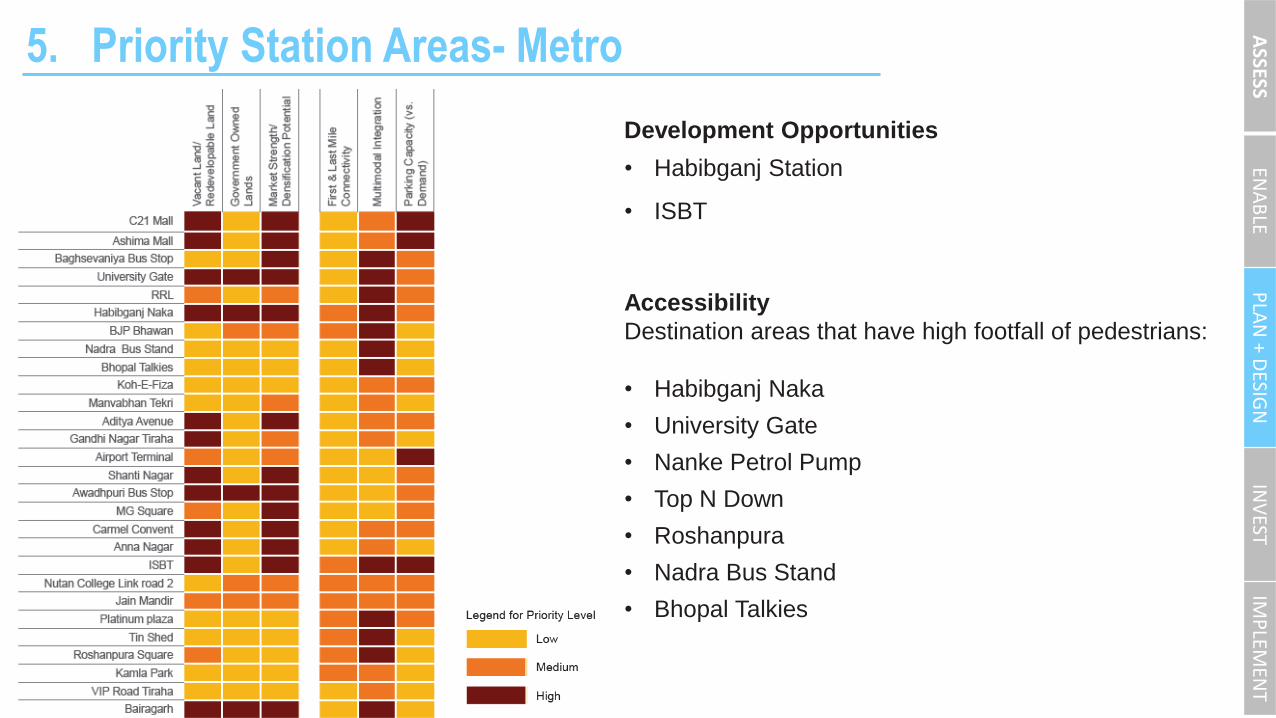
5. Priority Station Areas- Metro
Development Opportunities
• Habibganj Station
• ISBT
Accessibility
Destination areas that have high footfall of pedestrians:
• Habibganj Naka
• University Gate
• Nanke Petrol Pump
• Top N Down
• Roshanpura
• Nadra Bus Stand
• Bhopal Talkies

ASSESS
ENA
BLE
PLA
N+ D
ESIGN
INV
ESTIM
PLEM
ENT
Financing Models
1. Land Banking- Urban Infill
2. Land Pooling- TP Schemes (Greenfield)
3. Premium FARs in exchange of providing:
• Public amenities
• Public open space
• Achieving IGBC or Green Building certification
• Affordable housing units
• Public access for creating small block sizes
4. Transit Agency: Rail + Property
• Land Value Capture
• Joint Development
5. Align with Smart City Project/ funding & other central government programs

ASSESS
ENA
BLE
PLA
N+ D
ESIGN
INV
ESTIM
PLEM
ENT
Implementation Strategy
• Formulation of Task Force to ensure continuity in TOD planning process
• Prepare TOD policy and relevant bye-laws
• Establish a TOD Overlay District as a Special Area in Development Plan under preparation
• Notification of Rules & Regulations to establish statutory relevance for TOD Principles.
• Improve citywide Public Transport & NMT facilities along with route rationalization for bus routes and feeder routes.
• Conduct detailed Station Area Planning for priority stations.
• Identify key catalyst projects/ sites for TOD.

ASSESS
ENA
BLE
PLA
N+ D
ESIGN
INV
ESTIM
PLEM
ENT
Implementation Strategy- Key Sites

ASSESS
ENA
BLE
PLA
N+ D
ESIGN
INV
ESTIM
PLEM
ENT
Implementation Strategy- Key Sites

ASSESS
ENA
BLE
PLA
N+ D
ESIGN
INV
ESTIM
PLEM
ENT
Implementation Framework: Who Implements TOD?
MPUCDUADDUMTATCPDBDABMCSPVs: BCLL | METRO | SMART CITY
• Alternative 1: UMTA/ MPUCD includes TOD coordination and planning
• Alternative 2: Revive BDA as the planning and implementation agency with a special TOD cell
• Alternative 3: Form a special SPV for TOD Overlay Zone under BMC?
• Detailed TOD Planning at varying scales
• Project Management
• Enforcement & Monitoring
Implementation- Capacity BuildingA
SSESSEN
AB
LEP
LAN
+ DESIG
NIN
VEST
IMP
LEMEN
T

ASSESS
ENA
BLE
PLA
N+ D
ESIGN
INV
ESTIM
PLEM
ENT
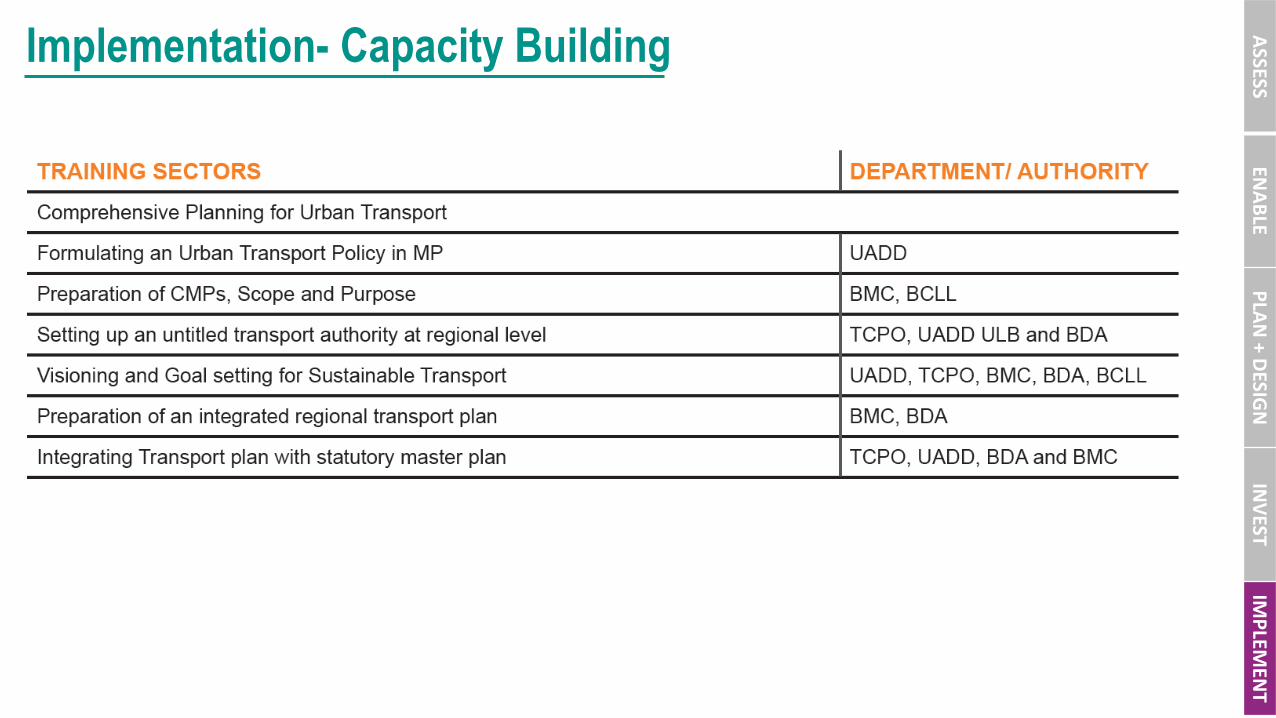
Implementation- Capacity Building
ASSESS
ENA
BLE
PLA
N+ D
ESIGN
INV
ESTIM
PLEM
ENT
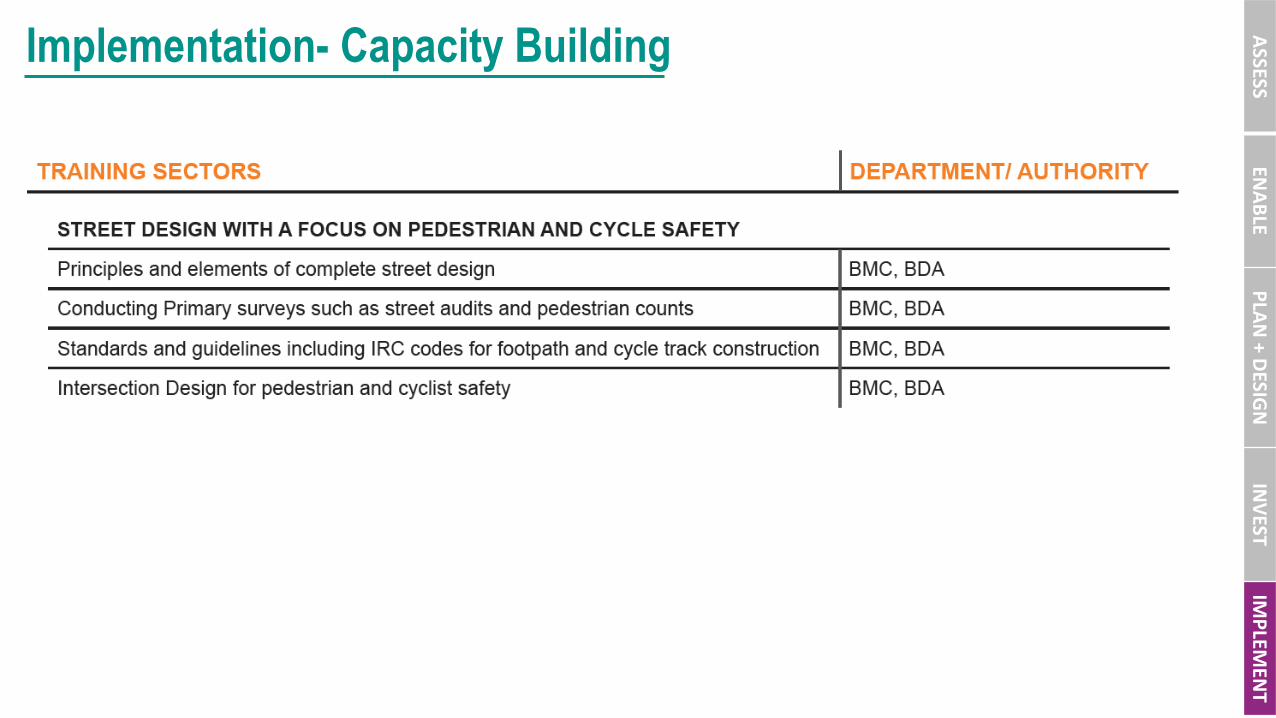
Implementation- Capacity Building
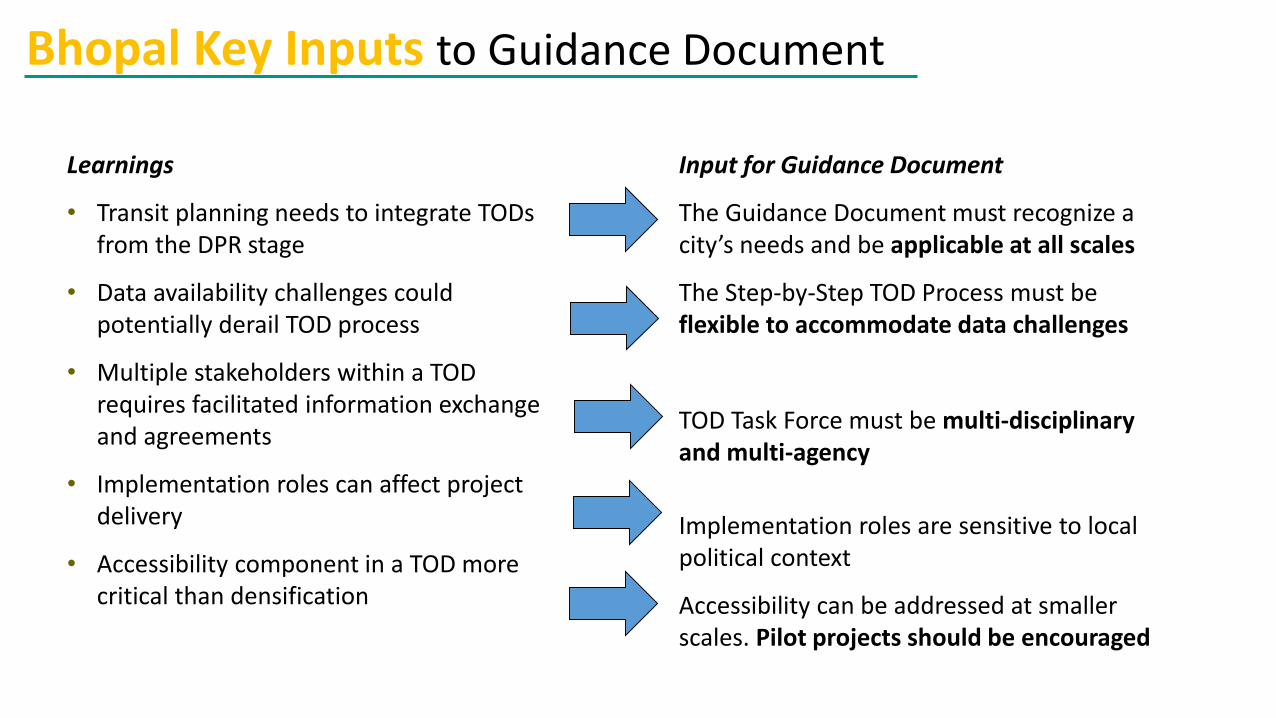
Input for Guidance Document
The Guidance Document must recognize a city’s needs and be applicable at all scales
The Step-by-Step TOD Process must be flexible to accommodate data challenges
TOD Task Force must be multi-disciplinary and multi-agency
Implementation roles are sensitive to local political context
Accessibility can be addressed at smaller scales. Pilot projects should be encouraged
Learnings
• Transit planning needs to integrate TODs from the DPR stage
• Data availability challenges could potentially derail TOD process
• Multiple stakeholders within a TOD requires facilitated information exchange and agreements
• Implementation roles can affect project delivery
• Accessibility component in a TOD more critical than densification
Bhopal Key Inputs to Guidance Document

Thank You