transient state kinetics tutorial using the kinetics … constants for anystep, their ratio gives...
TRANSCRIPT

Biophysical Journal Volume 67 September 1994 1260-1273
Transient State Kinetics Tutorial Using the Kinetics SimulationProgram, KINSIM
Daniel H. Wachsstock and Thomas D. PollardDepartment of Cell Biology and Anatomy, The Johns Hopkins University School of Medicine, Baltimore, Maryland 21205 USA
ABSTRACT This artile provides an introduction to a computer tutorial on tansient state kinetics. The tutorial uses ourMacintosh version of the computer program, KINSIM, that calculates the time course of reactions. KINSIM is also available forother popular computers. This program allows even those investgators not matmatically inclined to evaluate the rate constantsfor the transitions between the intermediates in any reaction mechanism. These rate constants are one of the insights that areessential for understanding how biochemical processes work at the molecular level. The approach is applicable not only toenzyme reacbons but also to any other type of process of interest to biophysiists, cell biologists, and molecular biologists inwhich concentratons change with time. In principle, the same methods could be used to characterize time-dependent, large-scale processes in ecology and evolution. Completion of the tutorial takes students 6-10 h. This investment is rewarded by adeep understanding of the principles of chemical kinetics and familiarity with the tools of kinetics simulation as an approach tosolve everyday problems in the laboratory.
INTRODUCTION
Knowledge of kinetic constants frequently provides some ofthe most penetrating insights about most molecular mecha-nisms in biology and chemistry, but many molecular biolo-gists are reluctant to take on the task of evaluating theseconstants (Maddox, 1993). Instead, most focus on the otherinformation required to establish mechanisms: 1) a completeinventory of the molecular components of the system; 2) alist of the intermediates in the reactions of these components;and 3) the atomic structures of these components. A varietyof biochemical, molecular biological, genetic, and biophysi-cal methods are available to complete these tasks-but ki-netic analysis is the only way to obtain the information aboutthe rates of the transitions between the various possible in-termediates. These rate constants are the key to understand-ing how things work, because a full set of rate constantsallows one to decide which of the possible intermediates areused in a reaction mechanism, to appreciate the rates of thevarious steps, and to evaluate the free energy changes at eachstep. Johnson (1992) provides a particularly clear explana-tion of the strategy and methods used in transient kineticsanalysis of enzyme mechanisms.
Given their fundamental importance, why do we generallyknow less about the kinetic constants than other features ofour systems? Although everyone learns in biochemistryclasses about the traditional tools used to evaluate the initialrates of enzyme reactions, this steady-state approach is ofteninadequate for detailed understanding ofeven simple enzymemechanisms and is not applicable to a wide variety of pro-
Receivedfor publication 7 September 1993 and infinalform 24 May 1994.Address reprint requests to Thomas D. Pollard, Department of Cell Biologyand Anatomy, Johns Hopkins Medical School, 725 N. Wolfe St, Baltimore,MD 21205. Tel.: 410-955-5664; Fax: 410-955-4129; E-mail: pollardCjhuigf.med jhu.edu.c 1994 by the Biophysical Society0006-3495/94/09/1260/14 $2.00
cesses in which enzyme reactions play little or no part. Ex-amples of largely nonenzymatic processes include the as-sembly of cellular organelles, the cytoskeleton, and theextracellular matrix; the binding of cells to each other and theextracellular matrix; and the activities of most ion channels.Just like enzyme reactions, none of these processes will beunderstood until we work out their molecular mechanisms,including the evaluation of the rates of the transitions be-tween the various intermediate states.
Transient kinetics
The goal of an analysis by transient kinetics is to understandthe mechanism of a reaction. This approach can provide aninventory of the reactants, intermediates, and products alonga reaction pathway together with the kinetic rate constantsthat determine the transitions between these chemical spe-cies. Both the identity of the intermediates and the values ofthe rate constants are important and interdependent in ap-preciating the mechanism. You can view the reactants, in-termediates, and products as the roster ofplayers in the game.The rate constants reveal not only the rate of the transitionsbetween these intermediates, but also the pathway throughthe various possible intermediates between reactants andproducts. As a bonus, if one knows the forward and reverserate constants for any step, their ratio gives the equilibriumconstant for the reaction. This provides a powerful connec-tion between kinetics and thermodynamics. From the equi-librium constant, one can calculate the free energy change,which provides valuable thermodynamic information aboutprocesses that may be inaccessible to evaluation by equi-librium methods.The strategy is simple: just change the conditions of the
system and watch the time course as it approaches a newequilibrium or steady state. This is called transient state orpre-steady-state kinetics, because one observes the transitionfrom one equilibrium to another equilibrium or steady state,
1260

Transient State Kinetcs Tutorial
rather than the rate of a biochemical reaction running at asteady rate. Steady-state data are also useful, but transientdata are frequently more informative. One frequently doessteady-state experiments before transient experiments. First,the steady-state experiments generally require less material,particularly for an enzyme reaction. Second, the steady-stateparameters will provide important clues required to designtransient experiments.One has many options when changing conditions to ini-
tiate a transient. Changing the concentration is a method forsystems with two reactants or products, since mass actionwill drive it toward a new equilibrium. For example, one cansimply dilute such an equilibrium system and watch whathappens. Or one can mix two reactants and watch for thedisappearance of reactants or the formation of products. An-other strategy is to change the environment of the system, forexample, by changing the solution conditions (pH, ionicstrength, etc.), the temperature, or the pressure. Slow reac-tions taking seconds can be initiated by hand. Fast reactionson a millisecond time scale require rapid mixing equipmentto change the conditions. "Stopped-flow" devices mix twosolutions and inject them into a spectroscopic cuvette in -2ms for measurement of the time course of changes in ab-sorption, light scattering, or fluorescence.
In each case, you learn about the system from watching itapproach a new equilibrium or steady state, so you need someway to observe what is happening. Fortunately, one can usu-ally find a good assay for the concentrations of reactants,intermediates, and/or products-the more assays the better.
Since many reactions are fast, spectroscopic assays areparticularly useful. For example, one can follow absorbance,light scattering, fluorescence, fluorescence polarization, and(recently) even circular dichroism, electron spin resonance,or x-ray diffraction. If the system does not have an intrinsicoptical signal, you can add one. For example, fluorescentprobes can be covalently attached to the reactants or productsto monitor their behavior, or an indicator dye can be addedto the solution to measure pH or ion concentrations. Withoptical probes, one can usually follow concentration changescontinuously during the reaction.
If optical signals are not available, virtually any chemicalassay will work, but one is forced to stop a series of identicalreactions at various time points to measure the change inconcentrations. Reactions can be stopped chemically withacid or a denaturant or physically by freezing. Slow reactionscan be stopped by hand, but fast reactions require rapid mix-ing and quenching that can be achieved mechanically in a"quenched-flow" device. Even complicated chemical assayslike electron microscopy and gel electrophoresis are useful,providing that the reaction can be stopped and the variouschemical species are stable over the time course of the assay.For example, the products of a single step in DNA synthesishave been followed on a millisecond time scale by gel elec-trophoresis (Johnson, 1992).
Having set up an assay system and watched what happenswhen the system approaches a new equilhbrium, one needs
tools to extract the kinetic constants from the observed timecourses. The strategy at this point depends on the complexityof the mechanism. If things are really simple, one can get theanswer with a pencil and paper. If the mechanism is com-plicated with one or more intermediates between reactantsand products, more robust methods are required to calculatethe rate constants. The traditional approach seeks an ana-lytical solution, an equation with all of the rate constants.Formulation of these equations requires a good workingknowledge of calculus and algebra. This approach is elegantbut limited, because simplifying assumptions are usually re-quired to complete the analysis. The Michaelis-Mentenanalysis of enzyme mechanisms is an example of an ana-lytical solution using simplifying assumptions (rapid equi-librium binding of substrate to enzyme, no enzyme productcomplex, and no back reactions). The required simplifyingassumptions are rarely all valid. Furthermore, the mathemati-cal requirements of the analytical approach have limited thenumber of biologists capable of using transient kinetics toanalyze the mechanisms of their favorite processes.An alternative approach is to use numerical integration by
computer to simulate the kinetic data and calculate the rateconstants. In principle, numerical integration can solve anymechanism without simplifying assumptions, being limitedonly by computer speed. Fortunately, powerful computerprograms can now run on readily available computers to takealmost all of the work out of the analysis. One can nowdecipher mechanisms on a lap top computer, a feat which adecade ago was not possible. The purpose of this tutorial isto show you how to do it without knowledge of calculus.
Before working on the methods of analyzing kinetic pro-cesses, we need a word about the data required to analyze amechanism. Ifyour reaction is simple, perhaps only one step,you will be able to solve the puzzle with a minimum ofmeasurements. For example, knowledge of the equilibriumconstants and a single transient experiment showing the timecourse of the concentration change of either the reactant orproduct as the system approaches a new equilibrium may beenough. On the other hand, if the mechanism includes twoor more intermediates or competing side reactions, you willneed to measure the time course of the concentration changeof several species (as many as possible). Even complicatedmechanisms can be solved with incomplete knowledge of theinternal steps, providing the full time course of the reactionfor those accessible species can be measured over a range ofinitial concentrations. This is possible because you can usea computer to find a unique set of rate constants that simulatethese kinetic curves.A final point deals with the range of processes accessible
to analysis by transient kinetics. Most of our examples in-volve relatively rapid molecular interactions, processes tak-ing place on a milisecond to second time scale. On the otherhand, exactly the same strategy can be used to study pro-cesses on much slower time scales. One of our examples isfrom clinical medicine: a childhood cancer which developsover a period of months.
Wachsock and Polhard 1261

VoluTe 67 Septe er 1994
KINETICS TUTORIAL
You will learn how to use transient kinetics by doing someproblems. You will use a kinetics simulation progam origi-nally written by Barshop et al. (1983) for use on a VAXcomputer. Their KINSIM program has been ported to desktop computers. The PC version was written by G. Hua andB. V. Plapp of the University of Iowa. D. Wachsstock wrotethe Macintosh version called HopKDNSIME Carl Friedenmaintains a pubLic domain archive of the latest versions ofthe KINSIM family of programs, including an automatic fit-ing program called FrTSIM, at Washington University in StLouis. FlTSIM is not yet available for Macintosh. SeeFrieden (1993, 1994) for directions on how to log on toWUARCHIVE by anonymous FTP. This tutorial is availablefrom his resource. This tutorial, HopKINSIM, and the Hop-KINSIM manual are also available on diskette from T. D.Pollard at The Johns Hopkins Universiy School of Medi-cine, Bale, MD (please include $5 for production andhandling) and on the BJ Interet server at the University ofMinnesota. See directions for access by anonymous FTP or
Gopher in the BJ.To use the Macintosh version of KINSIM, you will need
a Macintosh computer with a math coprocessor (IlCi Pow-erbook 170, SE30, or more powerful recent models) and a
text editor (Apple's TeachText, or you can use any wordprocessor as long as you remember to save your file as a textfile). To do the problems you will need either a gaphingprogram like Cricket Graph or graph paper and pencil. To getprintouts, you can either open the output files in your graph-ing program and print them there, or get a screen dump ofthe HopKINSIM screen by setting the screen up the way you
like it and pressing (commandXshiftX3) and then printing thefile named Picture 1 with the Finder. To get quick estimatesof half-times, a ruler to place on the screen is helpful.To do the following problems you must know the
definitions of rate constants and the relation of rate constantsto equilibrium constants. Appendix 1 will provide youwith these reaionships as well as the physical basis for rateconstants. You will also need to know how to run theHopKINSIM program You will acquire most of theseskills during the Tutorial. For details, consult the Manualprovided with each version of the program.
The problems start easy and become more difficult. If youare not challenged by the fit problems, skip ahead to thelater problems. Open up the KINSIM Tutorial on the disk.You can either follow the tutorial on the screen or print outthe tutorial, leaving the screen free for displaying kineticdata. A of the answers are given in Appendix 2.
Problem 1: KINSIM pce andp offirst-order reactons
In this problem we will examine an artificial situation to geta feel for both KINSIM and rate constants. The reactio isa simple first-order change in a protein molecule, A, to a
conformation with a higher intrinsk fluorescence, A'.
Reaction 1. A---> A'
In real life an equihlnim would exist between states Aand A', but for our intrduction we will pretend that thetransition from A to A' is rersible. This is a frst-orderreaction, because there is only one reactant. In a it-ordertrasition like this, the rate of change of the concentrationof reactants and products at any point in time is simplythe product of the first-order rate constant (k) and theconcentation.
Rate = k+(A)
Tasks
1.1. Open up your text editor and write out the mechanismof Reaction 1. Your mechanism should look like this:
A==A' (return)*Output (retur)A (return)A' (retun)
Note: In KINSIM a double equal (==) represents a re-versbe kinetic reaction. A single equal (=) is a rapid equi-hlbrium, used where the rate constants are not known. Gen-erally KINSIM runs faster with a reversible kinetic reaction.*Output signals that the concentraions of the following spe-cies will be graphed vs. time. We have decided to view theconcentrations of both A and A'.
1.2. Name and save the mechanism as a text file and thenclose the word processor.
13. Next, open up the HopKINSIM prgam. Inside Hop-KINSIM, open up your reaction mechanism. The computerwill quickly ampile the mechanism into the mathematicalequations required to calculate the time course of the reac-
1.4. Under RUN, select CHANGE followed by the vari-ous parameters that you need to adjust Start with RATES.For k+1 (the forward rate constant) select 10. The units fora fit-order rate constant are s-5. Leave k_ (the reverse rateconstant) at 0, the default value. Under CONCENTRA-TIONS setAto 1 (the units are pM) and leave A' at 0. UnderTlME CONSTANIT select 1 (second) for the total time and0.01 (second) for the interval between time points (called Atime). Optional: Under TIME CONSTANTS you can alsomodify the size of the time steps and other parameters thataffect the rate of the simulation. For purposes of this tutorial,use the default parameters. If you need to speed up a simu-lation, read the section on TIME CONSTANTS in themanual. Optional: Under AXES, set the y axis (concentra-tion) to 1 FM and leave the x axis (time) at 1 s. The defaultsettings will automatically adjust the axes for each simulationif you do not set them ahead of time.
1.5. Under PREFERENCES under the FILE menu setthe Response time to 1000 ms. This will speed up the
1262 By~Jua

Transient State Kinetcs Tutorial
calculations at the cost of having to wait 1 s to interrupt theprogram while running.
1.6. Also under PREFERENCES, uncheck the Save Out-put Data check box. If this is checked, the output from eachsimulation will be saved as a tab-delimited text file that yourgraphing program can read, and you will be asked toname the file each time. For the problems here, that may notbe necessary, but you can recheck it at any time. If yourgraphing program is Cricket Graph 1.3, check that box inPREFERENCES. If your graphing program is somethingelse, use your text editor to remove the first line of the sampledata files (it contains an asterisk that Cricket Graph 13 re-quires). Eventually you will want read the entire Manual tolearn the details of how HopKINSIM works, but the briefinstructions in this tutorial should be sufficient for now.
1.7. Under RUN select GO to start the reaction. In a fewseconds, the computer will display the time course of thereaction. (Note: Te slope of the curve is the rate of thereaction. The slope is maximal early in the reaction when theconcentration ofA is highest and then declines steadily as Ais depleted in favor of A'. As explained in Appendix 1, thecurve is an exponential function.)
1.8. What is half-time for the reaction? It is the time whenhalf ofA is converted to A'. It may be helpful to change theaxes (under the CHANGE menu in the RUN menu) to seethe time precisely. Divide 0.693 by this half-time to estimatethe observed rate constant (kobs).
1.9. What is the value of kb.? It should be the same as thek+1 that you entered, 10 s-'.
1.10. Note the half-time for the reaction starting from thefirst half-time, the time for the reaction to proceed from 0.5to 0.75 fLMA'. What do you find? What is the half-time forthe reaction from 0.75 p.M to 0.875 jiM? Why do you getthe same answer for every part of the reaction?
1.11. Return to the CHANGE dialogue box and vary thevalue of k+1. Change it to values between 5 and 25 s-'. Foreach value selected, estimate the half-time and calculate thek0b, to reinforce the important relationship between the half-time and the rate constant.
1.12. Try a simulation with a lower concentration of A,like 0.2 pLM. What happens to the half-time for the reaction?Why? (Note: If the screen become cluttered, you can deleteor hide any of the data with the EDIT CURVES commandunder the RUN menu. Holding down the option key lets youdelete all the data curves at once. If you need to take a breakfrom KINSIM, select QUIT to exit HopKINSIM.)
P l 2: Rate constants for a reversiblefirst-order ractionNow that you are familiar with the properties of a fist-orderreaction, we will try a simple reversible reaction. We willstart with a simple imaginary reaction: a reversible confor-mational change. Protein A exists in two states, A and A',with an equilibrium between these two species
Reaction 2: A = = A'.
The reaction is characterized by two first-order rate con-stants k+1 for the forward reaction and k-1 for the reversereaction. The equilibrium constant is K,q.
K, = kjlk_l. = (A',)/(A)where A'c and A*, are the concentrations at equilibrium.
If these relationships are not clear to you, consultAppendix 1.
Tasks
2.1. Write out and compile this reaction in KINSIM.2.2. Observe the time course of the reaction using the
following parameters: A = 1 FM; k+ = 10 s-1; k_ = 5 s-l.At equilibrium, what are the concentrations of A and A'?Calculate the equilibrium constant from these concentrationsand confirm that it matches the ratio of the rate constants.
23. By checking the successive half-times, confirm thatthe time course of this reaction follows a single exponential,even though there are two reactions (forward and reverse).
2.4. Estimate the value of the apparent first-order rateconstant (kj) from the half-time of the reaction and confirmits value by running a simulation with a first-order reactionand single rate constant (k+ = k,*6 and k_ = 0). From thevalue of kb, can you guess how kb. is related to the two rateconstants for this reversible reaction?
2.5. To test your idea, run several more simulations of thereversible reaction, each time varying k 1 by a factor of 2.Each time observe the shape of the curve and estimate thevalues of kob from the half-times. What is the relationship ofkob, to the rate constants? As a hint, when k_1 is reduced to2.5 s-1, what happens to k,b?
2.6. Note the effect of changing k on the equilibriumconcentrations ofA and A'. Verify that all the equilibriumconcentrations of A and A' agree with the equation givenabove.
2.7. Also vary the value of k,. What are the conse-quences? By now you should be confident about how kb, isrelated to the two rate constants. It is the sum of the two rateconstants, as expected from the analysis in Appendix 1.
Problm 3: Calculation of the rate andequilibrium constants for a
c formational changeWe have a protein that can exist in two conformations. A'has a higher fluorescence than A, so that we can measure itsconcentration spectroscopically. Our first experiment is tomeasure the equilibrium constant by measuring the concen-trations ofA and A' in samples containing a total of 100 p.MA + A'. We collect the following data:
ConditionspH 7pH 8pH 9
(A)10 p.M99pM99.9 p.M
(A')90 p.M1.0 pLM0.1 p.M
Wahsock and PoNr 1263

Vd1-Vme 67 September 1994
Tasks
3.1. From the data in the table calculate the equilibriumconstants at the three pH values.
3.2. At pH 7, what happens to the concentrations ofA andA' when the sample is diluted 100-fold, giving a total of thethese two species of 1 pM? What has dlution done to theratio of the two species in equilbrium?Our experiment wfll be to mix an equiibrium mixture of
A and A' at pH 9 with some acid to lower the pH to a physi-ological value of 7. The equilibrium shifts in the direction ofA', so that A' is produced at the expense of A. The totalconcentation of A + A' is 100 pM.
33. Write out and compile the reaction descnibed in theexperiment in KINSIM.
3.4. Display in KINSIM the data for this experiment filedon this disk under "Datafle3." Do this by selecting DATAin the OPEN submenu in the FILE menu.
3.5. Use the half-time to estimate k,b and confirm thevalue with KINSIM.
3.6. Select values for the rate constants k+1 and k-1 thatfit the equilibrium and kinetic data. Remember that the ratioof the rate costants must be equal to the equilibrium con-stant. The challenge is to select the two rate constants con-sistent with the equilbrium constant that best fit the data.Your estimates should be very close to the actual values ifyou understand the principle. To be sure, confim the valuesby running a simulation.
Prolm 4: A ser..d , reactionwith an excess of one eactant-a rst-order reactionWe will now consider a bimolecular reaction where two mol-ecules bind togethr to form a complex. We will use thebinding ofmoleculeA to molecule B as our example. We willuse an excess of one of the reactants, B. This simplifies theanalysis, because the concentrati ofB remains more or lessconstant, so that only the concentration ofA changes duringthe reactio This will make a second-order reaction look likea first-order reaction.
4.6. What is kz,b6 when k+ = 0.5 or 0.75 or 2 or 4 or 5.,M's'? How does ki,, depend on k+?
4.7. Now set k+ to 0.5 AM-s-' and vary B in the rangeof 10-40 p.M and observe what happens to kt. Confirm thatids = k+B.
4.8. Now vary k_ in the range of 1 to 10 s-' with k+ setat 1 pi,M-Is-I and B at 10 pM. What happens to the equi-librium concentration of AB and to kb? How does kodepend on k_?
4.9. What is the general expression for k., as a functionof k+ and k_?
4.10. Vary B = 10, 20,30,40pM withk+ = 1 .M-1s-'and k_ = 10 s-'. Make a plot of k., vs. B. What is theequation of the line? Confirm that the slope is k+ and the yintercept is k.
4.11. Unknown.- Now load Datafile4. In this experimentA binds to B to formcomplex AB. A = 0.1 p.M andBB2, 4, 6, 8, and 10 pM What are k+ andk?
Problem 5: A second-wder reaction wfth limifingco aons of both recanAgain we wl examine a bimolecular association reactionof two molecules A and B. The m nism is the same asProblem 4, but this time we will use similar concentationsof the reactants.
Tasks
5.1. Load and run the reaction with the following param-eters:A= 1 gLM,B = 1 pM, k = 4 pM-s-', k_ = 0.2s-'. Under TIME CONSTANTS, set the total time to 5 s andthe A time to 0.05 s.
5.2. What is the shape of the curve? Is it a single expo-nential? Can one spea of k,b?
53. How can you analyze the reaction and obtain the rateconstants under these e?
5.4. Unbnown. Now load Datafile5. In this experimentAbinds to B to form complex AB. A = 1 M and B = 0.5,1, and 2 .M What are k+ and k_?
Reaction 4: A + B == AB
Tasks
4.1. Write out and compile the mechanism in KINSIM.Output only the concentration of AB.42. Set the parameters as follows: A = 1 KM, B = 10
PJM k, = 1 p.-Ms-', k = 0.43. Run the reaction.4.4. What is the shape of the curve? Set the y axis to 1 to
see the curve well. Is it a single exponential? Verify this inthe usual way by checking the half-times along the curve andby simulating the curve with a first-order reaction.
4.5. What is kb,? How is it related to the rate constantsthat you used for the simulation?
Probkm 6: A two-step a on m han -sbing folloed by a conormational change
This is an example of a very common reaction in biology.Two molecules bind together and then undergo a confor-mational change. This is simply a second-order bimolecularreaction (like Problems 4 and 5) followed by a first-orderreaction (like Problems 1-3). Few new concepts are neededto understand the mechanism, but some interesting and im-portant new properties emerge from coupling the reactions.One is that the two reactions can be separated by choosingapproriate conditions. Anotier is how the overall equilb-rium depends on the properties of the two reactions.
Reaction: A + B == AB == AB'
1264 IYOR*d Joumal

Transient State Kinetcs Tutorial
Note that we now must deal with four rate constants: k+1,a second-order rate constant with units of M's-1, and threefirst-order rate constants k-,, k+, and k_2with units of s-1.
Tasks
6.1. Load and run the reaction with the following param-eters:A=A p1 M, B = 10 ZM, k+j = 2 ±M-'s- , k-, = 5s-1, k+2 = 100 s-', k2 = 50 s-1. Total time should be 0.25s; A time should be 0.001 s.
6.2. Fxamine the shape of the AB' curve. Is it a first-orderreaction? Why is there a lag at the outset? Which reaction israte limiting during the lag phase? After the lag phase? Testyour hypothesis by varying the concentration of B.
6.3. What happens if we vary the rate of the second re-action? Try k+2 = 1 or 10 s-'. What happens to the equi-librium concentrations of reactants and products? What hap-pens if we change the values of the rate constants for thesecond reaction while maintaining their ratio at 2:1? For ex-ample, try k+2 = 10 s-1, k2 = 5 s-5.
6.4. In the example in which you varied k,2, what hap-pened to the equilibrium concentrations of AB and AB'?From the equilibrium concentrations of A, B, and AB' cal-culate the overall equilibrium constants under the two con-ditions (k+2 = 10 or 100 s-1). Also use the rate constants tocalculate the equilibrium constants for both of the reactionsunder the two conditions. What is the relationship betweenthe equilnirium constants for each of the pair of the reactionsand the overall reaction? Verify your hypothesis with a thirdset of rate constants (k+1 = 1 pM1s-1,k1 = i1 , k+2 =10 s', k-2 = 1 s-) and the resulting equilibrium concen-trations of reactants and products.
6.5. With the set of rate constants from 6.1, experimentwith varying B = 4 through 5000 pM, doubling it each time.You will need to change the time constants over several or-ders of magnitude to get the data and measure accurate half-times. Estimate the values of the rate constant for the ap-proximately first-order reaction after the lag phase. (Toestimate the half-times for these very fast reactions, it maybe helpful to save the output data. Use the PREFERENCESitem in the FILE menu and look at the data in a graphingprogram. Look at the data in your graphing program andestimate kb, from the half-time.) Plot kb. vs. B. Where onthis plot can you find k+1 and k_1? What is the relationshipof the rate on the plateau to the rate constants? (See Appendix1.) Knowing the rate on the plateau, k+1 and k-, (from theslope and intercept) and the overall equihibrium constant(from the equilibrium concentrations of reactants and prod-ucts), how can you calculate the values of k+2 and k-2?
6.6. Now load Datafile6. In this experiment A binds to Bto form complexAB that undergoes a conformational changetoAB'.A = 0.1 .M andB = 1, 2,4,8, 16, and32 p.M. Whatare the four rate constants? First note equilibrium concen-tration of AB' and then try plotting k b vs. B to estimate thevalues. Then simulate the curves with KINSIM to determinethem more accurately.
Pr 7: A two-hit eacton-dissociation ofthe actomyosin complexThis is a more complex set of paired reactions, three in total.Two have the same rate constants, making things relativelysimple. This is a real example from biochemistry. The motorenzyme myosin (M) binds to an actin filament (A) by eachof its two heads. Both heads must bind ATP (T) for thecomplex to dissociate. The ATP binding reactions are inde-pendent and have the same rate constants. Exactly the samemechanism explains the development of retinoblastoma inchildren. Two tumor suppressor genes need to be inactivatedbefore the tumor develops. You may be able to think of othertwo hit reactions like these examples.
Reaction: AM + T == AMTAMT + T == AMTTAM1T == A + MTT
k+l1k-lk+21k 2
k+31k_3
Tasks
7.1. Load and run the reaction with the following param-eters: AM = 1 KM, other protein species = 0 pM, T = 10p.M, k,j = k+2 = 0-3 .M-'s-1, k-, = k 2 = 0.001 s-',k+3 =500 s-', k-3 = 10 pM-ls- . Follow the concentrationsof AM, AMT, AMTI7, and MTT.
7.2. Why is there a lag? What happens to the lag as T isvaried?
7.3. If faced with these rate constants, how could youdesign the experiment to observe directly the dissociationreaction and evaluate its rate constants? Simulate your ex-periment and confirm that you can evaluate the constants.
7.4. Unkaown: Now load Dataset 7.1. This in Knudsen's(1971) classic analysis ofthe development ofretinoblastoma.Patients with a family history ofretinoblastoma develop theircancer earlier than thoe with no family history. We nowknow that mutations in both of the retinoblastoma genes arerequired for a tumor to develop. Postulate a mechanism thatmight explain the difference in the kinetics of tumor devel-opment in these two patient populations. Write out and com-pile your mechanism in KINSIM. In this case, you will needto define the time interval as a month rather than a secondas we have done with our other examples. You will also needto define the concentration units arbitrarily, such as 100 pa-tient units. Other than that, the same reasoning is involved.Do you think that you are dealing with first-order or second-order reactions? Are any of the reactions reversible? UseKINSIM to find rate constants that can account for the timecourse of the onset of the tumor.
Problem 8: A simple enzyme reaction
Here we will see how to evaluate a simple enzyme mecha-nism in which the enzyme (E) binds the substrate (S), con-verts substrate to product (P), and the product dissociates.This is a minimal mechanism, since most enzymatic reac-tions involve at least one additional conformational changeof the enzyme-substrate or enzyme-product complex.
Wc-h*sshx:k and Poad 1265

Voume 67 Septen*e 1994
Nevertheless, this mechanism is more realistic than the clas-sic Michaelis-Menten mechanism in which the EP interme-diate is omitted to simplify the analysis. Although the mecha-nism has three steps, you will see that it can be dissectedrather easily with a few transient experiments. Although thisis an imaginary enzyme, the biochemical literature is full ofexamples of enzymes with mechanisms similar to this.
Reaction: E + S == ES == EP == E + P
Note that we now must deal with six rate constants: k+I andk_3are second-order rate constants with units of LM-'s-';the other four rate constants k-1, k+, k-2, and k+3 are firstorder with units of s-'. Also note that our task may seemcomplex at first, but you should be able to appreciate itssimplicity when you see the reaction broken down into in-dividual steps that can be analyzed using the principles thatyou have leamed to dissect first- and second-order reactions.This mechanism is nothing more than first- and second-orderreactions linked together. The experiments will isolate theindividual reactions for your analysis.
Tasks
8.1. Write out the mechanism and compile it in KINSIM.8.2. If you were provided with assays for P, ES, and EP
as well as a supply of E, S, and P, consider what experimentsmight reveal the rate constants for the various steps. Wherewould you begin? Once you have designed a strategy, youwill be able to call up data for the most common experiments.
83. Choose from the following list the data file that youfind most useful. Use analysis of exponentials or KINSIM tolearn about the reaction. Then choose additional data filesand continue until you have solved the mchanism. Youshould be able to determine all of the rate cnstants with onlythree experiments. The additional experiments will allowyou to confirm your results.
a. Steady-state rate of conversion of S to P as a functionof S.
b. Time course of conversion of S to P upon mixing Swith E
c. Time course of S bining to E as a function of S.d. Time course ofPbig to E as afunction of P.e. Intrrupt steady-se production ofradive P from
radioactive S by adding excess cold S; observe the timecourse of the release of radioactive P from E.
The details of each of these sorts of experiments follow;you may wish to think about how to do them and how to getthe rate constants out of the results before looking ahead.
a. This is the classic steady-state experiment. We mix alarge amount of S with a tiny concentration of E (0.1 p.M),observe the accumulation ofP over short period of time, andrepeat this experiment for many different concentrations ofS. The data fom such an experiment is in Datafile8a. It mayhelp to look at the data in your gaphingpam rather than
P, vs. time for S = 03, 0.5, 0.7, 1, 2, 3, 6, 9, 12 p.M. Notethat there is a short lag before the slope reaches its steady-state value. Where does the lag come from? For this steady-state experiment, we ignore the lag. Calculate the rates (theslopes) and plot the rates as a function of S. Note the hy-perbolic shape of the curve. Then plot the 1/rate vs. 1/S. Thisis the Lineweaver-Burk transformation of the data. The y
intercept is called the V. and the x intercept the Michaelisconstant, K. As you will recall from biochemistry, givencertain assumptions (rapid binding, slow turnover, no reverse
reactions) the K. is related to the affinity of the enzyme forits subsrte. We will see whether these values really tell us
anything useful about the actual mechanism.b. This is a burst experiment that allows us to follow the
time course of the first two steps in the reaction. It is ac-
complished by mixing E and S and then stopping the reactionat intervals with acid in a quench flow machine. We measure
and display the total P, that is EP + P as a function of time.Note that P does not need to dissociate from E to be detected.However, P must dissociate fom Ebefore another S can bindand initiate another round of the reaction. For the experimentin Datafile8b, we mixed 100 1,M S with 1 pM E. We observethat almost 1 mol of P is formed rapidIly before the reactionrate slows down considerably. What does the fast phase rep-
resent? (Hint: this fast phase corresponds to the lag in ex-
periment (a) above, when we only looked at free P). Whatrate constants control this phase? Given the concentrationsof E and S, whih reaction is rate limiting? What can you
conclude about the rate constants for the rate limiting reac-
tion? Why is there less than one mole of P released at the endof the fast phase? What does the slow phase represent? Whatrate constants control the slow phase? Wat can you con-
clude about the rate constants for the rate limiting reactionsfor this phase?
c. This is a simple bimolecular binding reaction, just likethose we have examine above. It might be done with fluo-rescent analogue of S which gives a signal when complexedwith the enzyme or if one is lucky, the fluorescence of theenzyme itselfmay change when S binds. In our experimentsin Datafile8c, we have mixed 0.1 pM E with several con-
centations of S (= 1, 2, 4, 8, 12 p.M) and followed theconcentration of E with S bound. This is equivalent to fol-
lowing ES + EP, since the two can rapidly interconvertFrom the raw data estimate the values of k+1 and k_, byanalysis of exponentials. These will only be estimates in theabsence ofinfoion about the second and third reactions.
d. This is a simple bimolecular binding reaction, just like
reaction (c), except that we look at the the binding of theproduct, P, to the enzyme. As before, we follw the total ES+ EP, but this time start with free P and no free S. Allchemical reactions are reversible at some rate, and we can
take advantage of this to "run the enzyme backwards." Thissimple experiment can be very revealing as we shall see.
Again, the experiment might be done with fluorescent ana-
logue of P, which gives a signal when complexed with theenzyme or if one is lucky, the fluorescence of the enzyme
loading it into HopKINSIM. lhe plot displays free product,
1266 BoWs~Jja
itself may change when P binds. In our expefiments in

Transient State Kinetcs Tutorial
Datafile8d, we have mixed 0.1 pLM E with several concen-trations of P (= 1, 2, 4, 8, 12 pM) and followed the con-centration of E with P bound. From the raw data calculatethe values of k+3 and k3 by analysis of exponentials or byKNSIM. Note that since we read the reaction from left toright, k_3 is the association reaction, and k+3 is the disso-ciation reaction.
e. This is a chase experiment that reveals directly the rateof product dissociation. We start by mixing 1 pM E with 20pM radioactive S and wait just long enough for the reactionto achieve a steady-state rate. Then we add 1000 FM coldS. Thereafter, essentially all ofthe S binding to E will be cold,so all radioactive P that we observe from this time point willhave come from radioactive S or P bound to E at the time ofthe addition of the cold S. In Datafile8e we see the timecourse of the dissociation of radioactive P. Which reactionsare being observed in this experiment? What can this data tellyou about the rate constants of these reactions? To simulatethis sort of experiment, start with zero concentrations of ev-erything except 1 pM EP, to simulate the fact that the enzymeis fully saturated with substrate at the beginning of the chasepart of the experiment and all the free radioactive substratehas been competed away. Assuming EP = 1 pM is not reallyvalid. Why not? Nevertheless, to get started set the reasso-ciation rate for the product (k-3) to 0, to simulate the fact thatthe radioactive product will not bind the enzyme again (whynot?). Set the association rate for the substrate (k,1) to 0, tosimulate the fact that new radioactive substrate will not bind(why not?). Then follow the concentration of free P. You willlearn that it is necessary to modify your initial assumptionsto get a reasonable fit to the data.
8.4. Once you have esfimates of all six rate constants, goback to the key experiments and simulate the time courseswith a full set of rate constants. You should be able to fit thedata exactly after making a few modifications of your initialassumptions. Now that you know all six rate constants, doyou understand intuitively why the various experiments pro-duced the observed data? Think about which reactions arerate limiting in each experiment.
8.5. Calculate the equilibrium constants for each of thereactions and compare these values with the Km. In this case,is the K,,m a reliable indicator of the affinity of the enzyme forits substrate?
8.6. Compare the steady-state V.. with the rate constantsfor the individual steps. What does the V tell us about themechanism? Does it conrespond to any particular step in thereaction?
Problm 9: Multiple iteracting components:actin, ATP, and profilin
For your final exam, you can try a reaction that involvesmultiple interacting components. As far as we know, mecha-nisms of this complexity cannot be solved analytically. Ki-netic simulation is the only available approach. Fortunately,by building up our knowledge of the reactions one step at atime, we will be able to understand the whole process in
detail. We will look at the exchange of nucleotide bound toactin and how the actin binding protein profilin promotes thisreaction (Goldschmidt-Clermont et al., 1991). The guaninenucleotide exchange proteins that promote exchange of GTPfor GDP on small G-proteins probably work the same way,but the decisive experiments have not yet been done.
Here is the background. Actin (A) is the major subunit ofmicrofilaments. The actin monomer is stabilized by ATP (T)bound in a deep cleft in the middle of the molecule. Thisbound nucleotide can exchange slowly with free ATP in themedium. The actin monomer binding protein, profilin (P),accelerates the exchange reaction and may be used in thecell to recycle ADP-actin to ATP-actin. We will measureexchange by adding the fluorescent ATP analogue, etheno-ATP (eT), to actin. eT has the convenient property of beingmuch more fluorescent when it binds to actin than when it isfree, so we can easily measure the concentration ofAeT andPAeT (profilin binding does not affect the eT fluorescence).
Reactions: A+ T ==ATA + eT == AeTP + AT == PATP + AeT == PAeTPA + T == PATPA + eT == PAeTP + A == PA
(1)(2)(3)(4)(5)(6)(7)
Even the most enthusiastic kinetic simulator would havetrouble with all of these reactions without some simplifyingassumptions and your computer would get bogged down aswell. Therefore:
I. We will eliminate Reaction 7, since the concentrationoffreeA is vanishingly small. (Actually one should leave thisreaction in the mechanism to make the mechanism thermo-dynamically legitimate, but it will have little effect on thesimulation.)
H. We will assume that the association rate constants fornucleotide binding to actin (Reactions 1, 2, 5, and 6) are thesame with a value of 1 pM-ls- . (Ihis approximate value isknown from the literature and its absolute value + lOx willnot affect the time course of the reaction significantly.)
HI. To keep things simple, we will assume that k,3 = k+4;k-3 = k-4 and k-5 = k-6.
Tasks
9.1. First we note that profilin is involved in all but thefirst two reactions, so when the profilin concentration is 0,we can look at the first two reactions alone. Write out andcompile Reactions 1 and 2. Display the data in Datafile 9.1.We mix 2 pM AT with three different concentrations of eT(2, 20, or 200 pM). We follow the time course of the changein the fluorescence as eT replaces T bound to the actin by afluorescence change.
9.2. Search for values of k 1 and k 2 that fit the data.Assume that the initial concentration ofA is 0. Think aboutwhich experiment is most sensitive to the relative values of
Wacskck and Poar 1267

Volume 67 September 1994
these rate constants. Remember that the rate constants de-termine both the rate of the reaction and the equilibriumconcentrations of the products. First look for a ratio of rateconstants that gives the observed equilibrium concentrations.Start with the curve most sensitive to the values of k-1 andk_2. Then confirm the value of the equilibrium constant withother curves. Finally, maintaining the ratio of the rate con-stants, vary there absolute values to achieve a fit of thecurves. Now you can proceed to the experiments with pro-filin, using the four rate constants from P = 0 as givens.
9.3. In the next series of experiments, we mix 200 pLM eTwith 2 jIM AT in the presence of various concentrations ofprofilin (P = 0, 0.02, 0.2, or 2.0 pIM). Display Datafile 9.2showing the concentration of AeT + PAeT (determined byfluorescence) as a function of time.
9.4. Search for values of k+3 =k+4 k_3 = k_4and k =k-6 that simulate the experimental data. Hint: Start with dif-fusion limited association rate constants and vary the dis-sociation rate constants to bring the curves into approximateagreement with the data. You may be suspicious that the datawill not sufficiently constrain the simulations for you to solvefor so many unknowns. Never fear, only one set of thesenumbers will actualy work. Let us know if you find a so-lution significantly different from ours. How tightly con-strained are the values of the unknown rate constants?
9.5. Examine the rate constants. Why does profilin in-crease the rate of nucleotide exchange? Note that low con-centrations of profilin can effect the nucleotide exchange ofall of the actin even if the actin is present at a much higherconcentration. What features of the rates of these reactionsaccounts for this "catalytic" effect of profilin?
This work was supported by NIH Research Grants GM-26132 and GM-26338 to T.D.P. and by Medical Scientist Traiing Program Grant GM-07309 that supported DIH.W. We are grateful to Enrique De La Cruz andthe participants in the 1993 Physiology Course at the Marine BiologicalLaboratory, Woods Hole, MA, for field testing this tutoriaL
APPENDIX 1: RATE CONSTANTS ANDEQUIUBRIUM CONSTANTSThe concepts in this section form the basis for understanding all of themolecular interactions m chemistry and biology. Most molecular interac-tions are driven by the diffusion ofthe reactants that simply collide with eachother on a random basis. Similarly, the dissociation of molecular complexesis a random process with a probability determined by the affinity of themolecules for each other. Many other reactions ocur within molecules ormolecular complexes. Together these casses of molecular interactions areresponsible for all life processes.We will review the physical basis for reaction rate constants and their
relation to the thermodynamic parameter, the equilibrium constant Thesesimple but powerful principles are essential to appreciate the molecularinteractions in cells. In many cases in biology, rate constants are even moreimportant the equilibrium constants, since the rates of reactios govern thedynamics of the cell.
DefinitionsRate constants, designaed by lower case k's, are constants that relate theconcentations of reactants to the rate of a reaction.
Equilibrium constants are given as upper case K's. A very tanduseful concept is that the equilibrium onstant for a reaction is related di-recdy to the rate constants for the forward and reverse reactions as well asthe equilibrium concentaions of reactants and products.
The rate of a reaction is the rate of change of concentration of a ratnt(R) or product (P) with time. As reaants disappear, products are formedso that the rate of reactant loss is directly related to the rate of productformation in a manner determined by the stoichiometry of the mechanism.The arrows in all of the reacion mechanism in this tutorial indicate thedirection of the reaction.
As a preview, here are the the relationships in the general case:
Reaction mechanis R <==> PReaction rates
Forward rate kk+ [RIReverse rate - k [PINet rate = k+[RI-k [PI
At equiibrium the net rate is 0, so k, [R,J = k_[Pj
lThe equilibrium constant K is defined as K, = k+ =
In specific cases, these relationhips depend on the reaction mechanism,partiularly on whether one or more than one chemical species constitutesthe reactants and products. We will derive the equilibrim constant fom aconsideration of the reacton rates. We will begin with the simplest casewhere there is one reactant
First-order reactions
Fist-order reactions have one reactant The general case is simply
R - -> P
A common example of a first-order reaction is a conformational changein a protein, where A and A' are the two conformatons
Another example is the dissociation of a molecular complex such as
AB --> A + B
where A and B could be two proteins or an enzyme and a productThe rate of a first-order reaction is direcdy proportional to the concen-
traion of the reactant (R, A, or AB in our examples). The numerical valuesof the rate of a first-order reaction expressed as a differential equation (rateof change of reaant or product as a function of time, t) is simply theconcentration of the reactant tmles a constant, the rate constant k with unitsof s-.
-dR dPRate = = - =kR
dt dt
The rate of the reaction has units of M s-' where M is moles per literand s is seconds. This is verbalized as "molar per second.. As the reactantis depleted, the rate slows.A first-rder rate constant can be viewed as a probability. For the con-
formational change, it is the probability per unit time than anyA will changeto Al in a unit of time. For the dissociation of complex AB, the first-orderrate constant is determined by the strength of the bonds hokling the complextogether. This "dissociation rate constant" can be viewed as the probabilitythat the complex will full apart in a unit oftime. Note also that the probabiliyof the conformational change of each A to A* or of the dissociation of eachAB is independent of its concentraion Each A or AB does its own thing.The concentrations ofA and AB are only important in determining the rateof the reaction observed in a bulk sample.
When thinking about a first-order reaction, it is sometimes useful to referto the "half-time" of the reaction. The half-time, tuI2? is the time for one-halfof the existing reaant to be converted to product. Tis time depends onlyon the rate constant and threfore is the same regardless of the startming
1 268 B$yia Jomal
Transiet Stas Kinics Tutxil
rnnr_ation of reant. The relationship is derived as folows
dR= -kR
dtdR
so - =-kdt.R
InR,-n R = -k,
where R, is the initial con and R, is the concentatio at time t
nlR,= hIR.-kt or R,= Re-
Whcn the initial concention Ro is reduced by half
0.5 = - or 2 =ec tus In2 = kt
so, ranIg
0.693tL2 = k
0.693or k=
tii
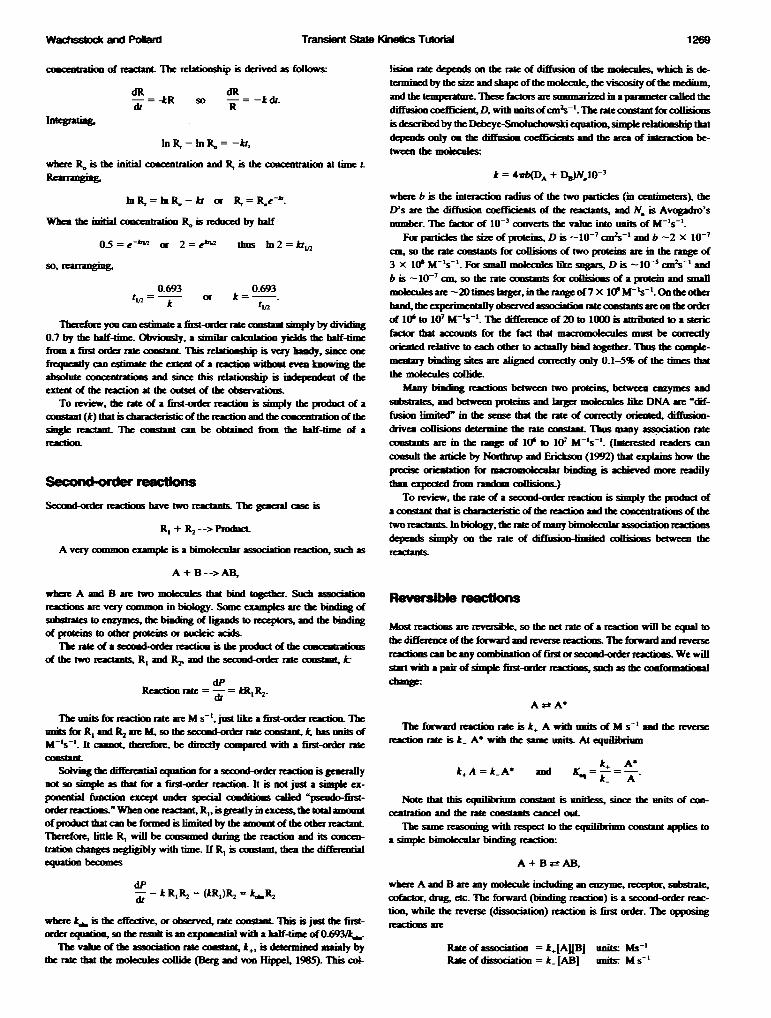
Themefore you can a first-rder rate comstat simply by dividing0.7 by the half-time. Obviously, a similr cakllatio yields the half-timehrom a firs orcu rate consant This rets is ver handy, since onefrequentl can estimate the extent of a reactioa wiht even kowing theabsolute concentraions and since this reltionship is indepndent of thecxtent of the reaion at the outse of the observations
To review, the rate of a fit-ordr reactio is simply the product of aconstant (k) that is rctristic ofthe reactio and the concenatatio of thesingle reLant The constant can be obtined from the half-time of areaW
Second-order reactions have two reactants. The geneal case is
RI + R2--> Proch
A very amon example is a bimolecula association reaction, suh as
A + B-->AB,
where A and B are two moleculs that bid togetdhr. Such associtoreactions are very common in biology. Some examples are the binding ofsdstrates to enzymes, the binding ofLi to recqLos, and the bindingof proteins to othe proteins or nuceic acids
The rate of a second-order reactio is the product of the coarof the two reactnts, R, and R2, and the sec ad-or rate wastant, k:
dPReaction rafte = -= kRjR2-
The units for reaioe rate are M s-', just like a first-order reaction. Theunits for RI ad R2 are M, so the second-orde rate constan, has u ofM-'s-'. It cannot, te , be direcdy compared with a fis-order ratcousam
Soving the differential equation for a second-order reaction is generalynot so simple as tha for a fist-order react It is mA just a simple ex-ponential functki except under special conditions caSled "pseudo-fir-orderreaonS."Whenonereactant, R1, isgratlyinexcess,detol amountof produc that can be formed is limted by the amount of the other reactatlherefore, little R1 will be consumed durg the reacon and its concen-taton changes negligby with time. lf R1 is constant, then the differntial-a becomes
dP= kRjR2 = (kR,)R2 = kR2
where k, is the effecdive, or obseved, rate coistanL This is just the fir-or equaton, so the result is anexptl with a half-time of0.693/k.
The value of the assotion rate cosmAa-, k+, is detmined mainly bythe rate that the moeules collide (Berg and von fipped, 1984 This col-
lision rate depends on the rate of diffusion of the molecule, whidfi is de-terminedby the size and shape of the mokcuk, the viscosity of the medium,and the -emperatu re. These factors are u ma d in a p r called thediff ]Sionc , with ntofcm2s-.The rate constan frollisionsis desalbedby theDebeye-mequatin, simple lahip thatdepends only on the diffusion coefficient and the ar of interactio be-tween the molecI_s:
k = 4whA + DS)Nel03where b is the interacion rndius of the two particles (mi centimeters), theD's are the diffusion coeficits of the reactants, and N. is Avogadro'snmber. The fxac of 10-3 convets the value into Mis of M-'s-'.
For partcis the size of proteins, D is -i10' an-s' and b -2 X i0-'cm, so the rate constants for collisions of two proes are in the range of3 x 10' M-s-'. For small molculks like sugars, D is -10-5 cms- andb is _10-7 cm, so the rate constants for coision of a protein and smallmolcules are -20times argr, in therageof7 x l0'M's-1. Onthe othfhamd, the ay observed ora constnts are on the orderof 10' to 107 M-'s-1. The differ e of 20 to 1000 is tatrbe to a stericfator that accounts for the fac that m be corclyoriented retive to each othr to actuy bind together. Thus the cople-mentary binding sites are aligned correcty only 0.1-5% of the times thatthe moecules colide.
Many binding reactions between two protins, between enzymes ands -sraes, and between proeins and lar molcules like DNA are "dif-
fusion limhed" in the sene dtt the rate of correcdy orintd, diffon-driven collisions em the rate costL This many rateconsants are in the range of 10' to 107 M-'s-1. (Interested readers canconsl the article by Northrup and Erickson (1992) tha explains how thepIN orientation for maromolcular bining is achieved mor rendilydtn expected fom random colliam )
To review, the rate of a second-oder reactio is simply the product ofa conant that is chaacteistic of the reaction and the concentadons of thetwo reactants. In biology, the rate ofmany bimoculr ion raconsdepends simply on the rate of d din collisions between theIre.ant
Most reactions are reversible, so the net rate of a reaction wiIl be equal tothe differce ofthe fo d and rvers reactions. The forward and reversereactiis can be any obinati of first or seand-orcr realios We willstat with a pair of simple first-order , such as the conformationalchange:
A ± A*
The forwad reaction rate is k+ A with units of M s-' and the reversremacinrate is k- A' with the same units. Ateq
Ak A'
Note that this equilibrium constant is unitess, since the units of con-centrabon and the rate coustant cancel out.
The same r ing with respect to the equlriuM constant applies toa simple bimolclar binding reactiow
A + B i± AB,
where A and B are any molecule incding an enzyme, recep, s ,cofacto, drug, etc. The forward (binding reaction) is a second-order reac-tion, while the reverse (dissociation) reaion is firt order. lTe opposingreactions ae
Rate of associatio = +[AIJBJ nits; M-sRate of dissodatin = k4[AB] nits: M s-'
Mo-bock and Polmd 1269

Vdlme 67 Septe 1994
The overall rate of the reaction is the fonwd rate minus the revers rate:
Net rate = Assoa rate -D i o rate
= k+[A][B]- k[ABNote caefuD y at this point, de d on the vales of the rate
coustants and the concentrations of A, B, and AB the raction can go for-ward, or nowhere.
Ateq uim the forward and revrse rates are (by definition) the same.Thus
k+[AJ[BJ = k[[AB]so
k- [A][BJ = R, the di a constant!k- [AB]
These reai sunmnanarze how reaction rate constants and equi-librim arcentratuons of reactant and produs are related to each odher.
The equilI riu contat for such a bimoleaular reacio can be writtenin two ways:
Am _n -qrium conant
K [AB] kunits: MxM
D [AJ[BJk MXM
Dissoimtion -u consant
[AIB] =k uis: M xM[AB] k,M
What is the half-time of a vrsible reaction? For a simple reaction,A - Al that starts with a given concentratio of A = Av the rate of thereacion is
rate = forward rate - b wad te
dA*- = k+[Al - k [A*J-
But the tobalnal iscantat, so [AJ + [A*] = A, or [A*J = A. - [A] anl
r ke k+[ Al-k_(A.-[1AD-(k + k_)[AJ -kA
=k,JAJ- kA,.This is just the first-order equation with an extra amsant on the end,
which does not affect the half-time (see your inhuctory differetial equa-tions textbook) Whatmaes is the coefficientofthe reactan concentratio,so the half-time is 0.693/kJ,, = 0.693/(k+ + k) IThe effective rate constantisthe smm of the rate counts. This may seem counteintutve; why shouldthe revere rate contant have anything to do with the time for the forwardreaction? The reaso is that the time corse of the reaction is not the timetoconverta oftheA into A*, but is the time to rca equllbrium.The largerthe reverse rate co,tant, the lem A* wll be present at equilibrium, and thefaster the reacion winl go fr 100% A to the equlibrium mixhtre.
For the bimolular reaction A + B - AB, the diffe l equ is
rate = k AI[B]A -k- [AB] as above.
The geneal solubion of this equation i complcated, which is why nu-meil it ng prgrams (like HopKINSIM) are so useful for real- lifereactions. However, the pseud-first-orderapprato above can be use-ful in this case. lf B is in great excess, then [AB] will be limited by theconacnAtion ofA and the a o n of B will be effectively costant,and
rate = k+[AJ[B]- k[AB] = (k+[BIlAJ - k_(A. - [A])
= (k+[B] + k_)[AJ+ aconstant
and the apparn rate constan isk, [B] + k-. Thus, pltting [B] vs. apparentrate constant (which can be estimated from the half-time of the reaction)gives a line with a y inteept of k- and slope of k+. Remember, the con-cen<ra of B must be much higher than dtat of A to use the pseudo-fi-order oximaion. Actually stimating an the rate cougats by fit-ting tosimlatahas theanage ofbeing applicabk to all coandiions
Unked recfions
Many imporant p sses in the cell coist simply ofa single reaon, butmost of cellula biochemistry involves series of linked reactions For ex-ample, when two macromleculs bind together the compkx will oftenundego some type of ineral or cnformational change,linkg a fir-order reacion to a second-order reacfio
A + B AB
AB ±AB*.
One of thouanJds of examples is G(f binding to a G-protein, causingit to undergo a conformatInal change fm the inactive to the active stateupon biding GO
Similarly, the simple enzyme reactio considered in most biochemistrybooks is simply a series of rersible second- and first-order react u
E + S ± ES
ES ±EP
EP EE+P,
where E is enzyme, S is substate, and P is products. These and much morecomplicated reactions can be descibed rigorously by a seies of rate equa-tions like those explained above. For example, simple enzyme reactiosneary always involve one or more akditional first-order reactious where themolecules undergo conformatiwuad changes
linking reactons togeher is the secret of how the cell carres out un-favorable reactions An unfble reaion can be driven forward by afavorAbl reacion up- ordow ns All that matters ifthe total free energchange for al of the coupled recstionS is negafive. For example, the un-favorable reaction poding AT fm ADP is driven by being coupld toan nerg source in the form of a proton gradient acrs the mitchondriemane that is derived in tumrn fom the oxidation of chemical bonids ofM tr
APPENDDI 2: ANSWERS TO THE PROBLEMS
Problem 1
1.8. The half-time is 0.07 s.1.9. k,,b, is 0.69310.07 = 10 s-'.1.10. The time to 0.75 pM is 0.14 s, so the time rm 0.5 to 0.75 pM
is 0.14-0.07 = 0.07 s, the same half-time as the first half of the reclion.From 0.75 to 0.875 pM it is also 0.07 s. It is always the same because thereaction is a simple exponetia whhout a "memory." The reaction rom anypoint onwd is the same as the reactio from time zro, and the time to useup half of what is eft is always the same.
1.12. Cnging the conenttion changes the rate by the same propor-tion (the rate is k[AD so it takes just as log to use up half of the reactants.
Problem 2
22 Equilibrium concentration ofA = 033 p, A' = 0.67 IK,, =k,k = 10/5 = 2 = A'IA = 0.67/033 = 2.
23. 50% m imum at 0.05 s, 75% at 0.1 s, 87.5% at 0.15 s. Eachhalf-time is 0.05 s.
2.4. kb, = 0.693i0.05 = 14 s-1. (Quite cloe to k+ + k_ = 15 s-1.) Partof the problem withn rical i ation d estimating half-times fom
1270 B..

Transirt Se 3eIC Tuorial
diseete time points is that rounding enrors occur. Dividing by a sliglyernroous nmber ma fies theerro. The mere acrate way to stikw is by ruming a si ati f an irreeveibaction with a final con-cetraton - to the equiIri concentration in the unknown reactionand adjusting the fist-oder rate constant until the simlbtion matches theda.
2.5. Seocvhs wec tried:
k half-time kh10 0.035 19.82.5 0.055 12.61 0.065 10.7
k+ +k-
12511
Thus k.6 is the smm of the forward and revers rate crAstants2.6.
k- A A' A'/A k,fk-10 0.5 0.5 12.5 0.67 .033 0.51 0.83 0.17 02
27. Thi is left as an exerse for the reader.
Problm 33.1.
pH K
7 9
10.502
8 .019 .001
32 Dilation does not change the ratio; both are dduitd equaly.3.5. Half-time is 0.07 s; ka is 10 s-'.3.6. Weneed kk = K= 9andk_ + _k =k =10s-',sok =
9 s-' andk. = 1 s-'.
53. You can either solve the di erntial equatioexacy ( impos-siIl butvry diffut) or use the simlalion program to generate theoeicalcurves until you fid a siglepair of rate c uants that match the eper-mental data. This is sa d sice the raio of the rate costants isconsdtaied to fit the equilbrim datafm the ong time scale part of theexperimets, so tee is only oe variable. The higher the raecomna-ts,, thefaster the reacio, so you ca i diae tell if you valus are too higbor too low.
5.4. k+ is 1 LM-'s-' and k- is 03 s.
Problem1 6
62 The apparent rate constant for the first reaction is k,B + k-lvas in Problem 5, or 25 s-L The apparent rate constant for the secondreaction is k+2 + k2, as in Problem 2. It is pseudo-first-order, becausethe first reaction is slower than the second, so it behaves like the one
step reaction in the previous problem. The second reaction is invisiblebecause it is so fast; AB is rapidly converted into AB' and the timecourse of AB' formation in this experiment is the same as that of ABin the previous experiment.
63. Ihe second reaction becomes slower, relatve to the first, so thesecond reactio becomes rate limitin latng the actual k,b and com-
paring them to the predicd k... for each ron is left as an exercise forthe reader. Keepingthe ratio the same leaves the equilbri vaes the samebut lengte the lag, eaough to be able to observe an overshoot in the valueof [AB].
6.4.
kBA=k+2 A B ' '/A*B
1 0.2102 921 0.016 0.00810 0.1849 9.185 0.136 0.08
100 0.0840 9.084 0.611 0.8
K,0.40.40.4
K20.020.22
K=
K1 * K20.0080.080.8
PRoblem 4
4.4. It is exponetiamL Half-time is 0.07 all along the curve, and k., is10 s-'.
4.5. kb is notobviously relatedtothe rate constansuntil youdothe next
parts of the prblea
4.6.
k+ 0.5 0.75 1 2 4ka 5 7.5 10 20 40
k.. is proorional to k+.4.7.
B 10 20 30 40k.b. 5 10 15 20
k, is prptioal to B. kd. = k+B.4.&
k- 1 3 5 8 10k.6 11 13 15 18 20
AB 0.09 0.8 0.67 0.56 0.50
The equilbri constant for the overall reactio A + B == AB' is theproduct of the qu conants for the two coupled reactions.
6.5.B half time
4 .0788 .04616 .028432 .01864 .01215128 .00875
8.8815.124.438.557.0792
B
2565121024204840965000
half tme
.00666
.00579
.00505
.00478
.00465
.00463
104.0119.71372145.0149.0149.7
You could keep going, but you see that the plateau is at k.. = 150s-1 and it should be equal to k,2 + k-2- It does not get quite lnear atthe kl end, but takig the first three points as linear, the best fit is
k.. = 4.23 + 13 B, or you would estimate k+j as 13 JLM-s-' and k-,as 4.23 s-'. The overall equihlium constant is 0.8 jM-', from the datain Problem 6.4, and this is equal to the product of the indivdual equi-librium constants,
4.9. k,1 = k,B + k_4.10.
B 10 20 30 40k,*. 20 30 40 50
Slope is iM-'s' andy intercept is 10 s-'.4.11. k+ is 25 LMs-' and k is1 s-'.
Probll 55; It is not an exponential (ahbougb it is close) Sucessive half-times
are 0.20, 028, and 0.30 s. It is fster at the begining than at the ed-, it isactually a hypebolic curve.
-+1k2k-1k-2
or 2 = 0.8.4-23k-2
T'he plateau is k+2 + k-2 = 150, and you can solve for k+2 and k-2 Youwould estimate k+2 as 108.1 s-' andk-2 as 41.9 s-'. This is not perfect,because we cannot get a clean line at the low end of the scale (seeProblem 6.6) but it is certainly close. To get a more accurate answer,you would need to start with these estimates, simulate the whole set ofreactions, and adjust the rate constants until the simulation fits the timecourses over the whole range of reaction rates. This is somewhat tediousand has been t ted in some systems.
6.7. The answer is kt+ = 15 M-ls-', k =2 s, k+2 = 20 s,k-2 = Ss-'.
WWoncm-d Poard 1271

Voumfe 67 Septenter 1994
Problem 7
72. There is a lag because two rs need to bind befioe MIT, the finalproduct, can be generaedl. One Tbinds with single alkinetics, but
it may come offbefore the second one can bid, sothe proailt of gettingboth Ts onss low, and it tas some time befoe tis hap-
pens. Once AMITform, it fIlls apatvery quickly intoA and MTF. Higherconetration ofT reduce the lag.
73. The key to this game is to reduce the number of unknwns as muchas poss a en experimet then va the unknow that are left tobest fit the experimental data. One idea: Based on the biology, it is rea-
sonable to assume that the rate consants for the first two reacton ae
the same. This cuts the number of unknowns to four. -
you could mix the acfin-myosin complex with ATP and observe the timecourse of the decrease in ligt sring a spoed-flow machine as themyosi dissocd fro the actin fil By tesig a range of ATP
ai you would have enough data to fid a unique solution of the
kinetic mecranism by knetic sutionwith KINSDM.7.4. One simple mechaism is the foblwing. RB == RB'; RB' ==
RB"; where RB represents the pair of Rb tumor suopressr gemne and theprime repesent muoti in one or both of the gene Patiens with mu-
tations in both genes (RB) develop cancer. Patients who inberit one mu-
tatio (ial concentraio of RB' = 1.0) develop cacer with a fir-odertime course and a rate contant of 0.075 month` for the second reactio
The fit to this curve is excellenL TIhe rvee rate contants are 0 for both
ret Paientsbom withtwo nofmal genes developcancerwith an initial
lag. You wll beable to get an ate fittothe data with k+, = 0.05
onth-l', k-I = 0,k-2= 0075Smonth-',k2=0. Considering that the data
are very limited and based on referrals of patients to a canc hosptl, the
fit is nt so bad. In fact, are much more conmpicated than this simpletwo-hit model, given that addiional steps are required for the tumors todevelop. We should also take into acont that the retina contins about2,000,000 cells, any one ofwhich can develop c r. In addition, we havenot taken into account that the number of dividing nemoblasts deaes to0 during the first few yeas of f, changing the number ofcells in the etina
th are susceptible to develpment of thse tmnos Mutt that occurafter the cells stop dividing p b are sklent Let us know if you de-
velp a more realstc model that gives a better fit to the data.
PiobClem 8
83. Theanswer isk+1 is 10 'M-ls-' andkk- is 1 s-.k+2is5 s-1 andk-2 is 1 s1'. k+3 is03 s-' d kis 1 M`s-'.
83a. K. is a t 0.2p4; V, is 0.024 1M s-' It is very difficult toetimate because ofthe scatter in the points. The data are perfect The scatterin the Ineweaver-Burk plot is the ma to all the clasical
methodaof aalyzing kieticdata Before c_xnpes,the only kind ofcrvetht was convenient to fit was a shtaight line. The clacal ohes
(ineweaver-Burk, Satchard, etc.) were designd to transform nonlinear
data into stag lines. These ls, divisiom) may
exagge eerrors (in this cse, roundig errors) to the poi tht a lks-squres linear fit is ip riate and misi
83b. The fastphase is the fiust rnover of S into P, as E binds its frstS. This involves only the reactiom E + S 4 ES E;P, and it is contaldby k,1 and k_. With higb S, the ES *:EP reaction is rate-limiting. The hastphase has an initial rate of42pM s-', which will be appoximately the rateofthereacinES- EP, ork+2 ES. WhatisESduring fast phase? Durig
this phase, almost all of theE has bound S ahrady (the second step is ratelmiting because it is sower than the first step), but has not relased it, so
ES is ately equal to the initial aonetration of E, or 1 p1L Thus
k+2ES = 42 p.Ms-1 =k+2 1 M, ork+2 is-4-2 s-', not faroffthe real answerof 5 s-'.
The slow phase begins whenEP starts dissoc ing intoE and P,alwingE to react with another S and continue at a steady Thus the fast pase
catues until all the E is satat Why is this not when EP is equal totheiniial of E?The answer is that EP isin euiliumwithES, and this equilibri the stady-state concentration of E.
Fron the graph, ths is when EP is -0.83 pLM (the slow ad fas plass donot fm a sharp angle, so you have to extrapolat) Sinc the enzyme issatated, ES = 1 pM - EP = 0.17 1k This tells us theq briumcoan{t for Reacto 2; k,+2k-2 = 0SA.17 = 5. Using the estimate for k2abave, we get k2 = 0-84 s-1.
The slow phase isthe reaction EP - E + P, and its rate is ro atelyk+3 EP, where EP is the steady-st concentato of EP. This phas iswhawas s ien the steadytte experimet min part (a), and the lag in prof P there is the fast phase here (production ofEP rathfer than P), which hastold us so muchd The slow rate fir the graph is 0.27 p1 s-' which shouldbe k+3 EP = k+3 0.8 p or + 3= 03 s'.
83c. Thisisjustthebimolcularbindignreactif Problem 4 above,and we have a vast excuss of S, so the pseudo-first-order analysis applies.A heratvely, just use HEpqCEN Tlhis is a two-unknown system (k...)and we can measure the time comse all the way toequi so it wouldbe easy. Doing it the analytical way,
S 1 2 4 8 12
k.6. 924 19.8 34.65 693 99
Least squares fit givesk+, = 8-2 -ls- andk = 2.4 s-'.This is wihinan order of magn of the correct answer, but not acurate. The problemagain is dividing by a number sujct to mruning and othe errom This isthe advantage of simulating the fu time caurse of a reaction, which gvesexacty the right answer and uses all the data. The general rule is fit the data,not the so , whenever possible.
83d_ Same problem as (83c), but starting with P rather than S. k's aregiven above.
8-3e. If we assume that the reverwse reaction is negligble (a commonasumion in this sort of problm), then this experiment is hlke Problem 1,a first-order, irversible reaction, EP-. E + P. Staringwith all the enzymeas EP is wrong, because it wil be eqi um with ES, but without doingthe other pimets, we do not know what that e i will be. Ifyouknew the iir constant from the bus exper t, then you couldset ES to 0.17 pM and EP to 0.83 p1M at the stat Still, rnning KINSIMwould provide a resonable estimate of k,3.
Doing it anaytically, assumng dat the recton EP - E + P is irre-vesible, vs ahalf-time of1.7s and ak+3 of .4 s-'.lTis is doce to theactal value of 03 s-', largely because we have been able to ignoe therevers reactions (EP ES -. E + ) The association ractions do notour because of the presece of the large execss of _nadiocive sub-stte. Any free ezyme is immedial bound to a "bla molecule andthus will not be sem m our experimeal results.
8.5. Theequimc statsare K, = 10p ,K 2= 5, K3 = 03 14-1.Do you u d the units nvolved? K (which we found above to be 0.2itM) does not represent any of tese eqlibri consa ts, so it is not reallyan affiity for anything. Itrpresents the concentation of substrat neededto produce a half-maximal steady-state rate, so an enzyme with a lower 4,will requir kss substrte to saturate, so in that sense it hasa higher affinity.It can be rlated to the Ps if certain sim assumpons awe made (ESto EP equilibrium is infiniely fast, ireversiblepmduct release) as you havekarned in biochemistry, but it cannot be simply allated for a more re-alistic model such as this one.
8.6. V., is the maximum rate of prduc of P in the pesence ofinfinite subsntate. Under thse conditions, the third step (product release) islimiting. so the rate of produci of P is k+3 [EPI or 03 s-' 0.083 p1M= 0.025 pms-', ckose to the observed value of0.02363 pMs-'. (Where didthe 0.083 pLMo4 e fron?) ht is an overstimate because the rate of pro-ducion is really limited by two reactons, the second and the third. In ourcase, the third is much slwer, so it domiiated the clation Fr the
mincined, the correct effective rate consta to use is
Tlis numnbergives some informtion about the rate constat in the mecha-nis, but only ifwe know the equiihbrim anratio of EP, or asmethat it is negligibe and that the reactin is limied by the concentatio ofES, as is assumed in the Mic iMenten analysis
1272 lm. .a ioumai

Wahsskock and Polard Transient State Kniet Tutorial 1273
Prbem 9
k+1 = k+2 = 1 LM-Ms-'; k-1 = 0.01 s-; k-2 =0.03 s-1; k+3 = k+4 = 2IM-,S-';k_3 = k-4 = 4 s-1;k+5 = k+6 = 1 LM-s-'; k5 = k- = 6 s-'.The profilin catalyzes the nucleotide exchange by hopping frm one actinmolecule to another on a subsecond time scale. The half-life of thecomplex of profilin with actin is 175 ms. During this time, the nucleotidehighly is likely to dissociate from the PAT complex, since its half-lifeis 117 ms.
REFERENCESBarshop, B. A-, R. F. Wrenn, and C. Frieden. 1983. Analysis of nu-
merical methods for computer simulation of kinetic processes: de-velopment of KINSIM-a flexible portable system. Anal. B,ocheIL130:134-145.
Bez& 0. G, md P. HI von HippeL 1985.D idld _ oaCios. Amui Rev. Biops Biophys. COcm. 14:131-160.
Frieden, C. 1993. Numerical integration of rate equaio by .Trends BiochenL Sci. 18:58-60.
Frieden, C. 1994. Numerical integration of rate equation by computer anupdate. Trends BiochIeL Sci. 19:181-182.
Goldchmidt-Clemont, P, L N Machesky, S. KI Dobersein, and T. D.Pdolard- 1991. Mecnism of inteact of human platelet prflin withactin J. CeU BioL 113:1081-1089.
Johnson, K. A. 1992. Transient-state ietic analysis of enzyme reactiopathways Enzyse 20-1-61.
Knudsen, A. G. 1971. Mutation and cancer: staistical study of retinoblas-toa- Proc. NatL Acad Sci USA. 68:820-824.
Maddox, J. 1993. The dark side of moklcula biology. Nature. 363:13.Northrup, S. H, and H. P. Erickson- 1992. Kintics of protein-ptein as-
sociation expiained by Brownian dynamic cm er simlati Proc.NamL Acad ScL USA. 893338-3342.