transient-state analysis ofmetabolic fluxes in crabtree …aem.asm.org/content/56/1/281.full.pdf ·...
TRANSCRIPT

Vol. 56, No. 1APPLIED AND ENVIRONMENTAL MICROBIOLOGY, Jan. 1990, p. 281-2870099-2240/90/010281-07$02.00/0Copyright C) 1990, American Society for Microbiology
Transient-State Analysis of Metabolic Fluxes in Crabtree-Positiveand Crabtree-Negative Yeasts
HENDRIK VAN URK, W. S. LEOPOLD VOLL, W. ALEXANDER SCHEFFERS,AND JOHANNES P. VAN DIJKEN*
Department of Microbiology and Enzymology, Delft University of Technology,Julianalaan 67, 2628 BC Delft, The Netherlands
Received 30 June 1989/Accepted 6 October 1989
In bakers' yeast, an immediate alcoholic fermentation begins when a glucose pulse is added to glucose-limited, aerobically grown cells. The mechanism of this short-term Crabtree effect was investigated via a
comparative enzymic analysis of eight yeast species. It was established that the fermentation rate of theorganisms upon transition from glucose limitation to glucose excess is positively correlated with the level ofpyruvate decarboxylase (EC 4.1.1.1). In the Crabtree-negative yeasts, the pyruvate decarboxylase activity waslow and did not increase when excess glucose was added. In contrast, in the Crabtree-positive yeasts, theactivity of this enzyme was on the average sixfold higher and increased after exposure to glucose excess. InCrabtree-negative species, relatively high activities of acetaldehyde dehydrogenases (EC 1.2.1.4 and EC1.2.1.5) and acetyl coenzyme A synthetase (EC 6.2.1.1), in addition to low pyruvate decarboxylase activities,were present. Thus, in these yeasts, acetaldehyde can be effectively oxidized via a bypass that circumvents thereduction of acetaldehyde to ethanol. Growth rates of most Crabtree-positive yeasts did not increase upon
transition from glucose limitation to glucose excess. In contrast, the Crabtree-negative yeasts exhibitedenhanced rates of biomass production which in most cases could be ascribed to the intracellular accumulationof reserve carbohydrates. Generally, the glucose consumption rate after a glucose pulse was higher in theCrabtree-positive yeasts than in the Crabtree-negative yeasts. However, the respiratory capacities ofsteady-state cultures of Crabtree-positive yeasts were not significantly different from those of Crabtree-negativeyeasts. Thus, a limited respiratory capacity is not the primary cause of the Crabtree effect in yeasts. Instead,the difference between Crabtree-positive and Crabtree-negative yeasts is attributed to differences in the kineticsof glucose uptake, synthesis of reserve carbohydrates, and pyruvate metabolism.
Alcoholic fermentation during bakers' yeast production isundesirable. Ethanol formation can be prevented by growingthe organism under sugar limitation. However, becausebakers' yeast is produced in large fermentors, sugar concen-tration gradients occur. When glucose concentrations riseabove 100 to 200 mg/liter, aerobic alcoholic fermentationsets in (23, 24). This fermentative response to higher sugarconcentrations is known as the short-term Crabtree effect(14, 20).The Crabtree effect has been the subject of many studies
(1, 3, 4, 7, 19a, 20, 22). The main goal of these studies was toassess the role of the respiratory capacity of Saccharomycesspecies in the Crabtree effect. Kappeli (7) emphasized thatSaccharomyces spp. possess limited respiratory capacities,which cause increased intracellular pyruvate concentrations.Only when pyruvate accumulates does the fermentativeenzyme pyruvate decarboxylase become important, since itsaffinity for pyruvate is much lower than that of pyruvatedehydrogenase, the key enzyme of the oxidative route (6,22). However, van Urk et al. (19a, 20) have demonstratedthat the respiratory capacities of steady-state cultures ofSaccharomyces cerevisiae CBS 8066 are not significantlylower than the respiratory capacity of Candida utilis CBS621, a yeast which does not exhibit the Crabtree effect.Instead, the anabolic capacities of steady-state cultures, theability to accumulate intracellular reserve carbohydrates,and pyruvate decarboxylase activity appear to be the impor-tant parameters in the occurrence of the short-term Crabtreeeffect.
* Corresponding author.
In order to ascertain the parameters of the physiologicalbehavior of yeasts upon transition from glucose limitation toglucose excess, it was decided to perform a comparativestudy on a variety of yeast species.
MATERIALS AND METHODSStrains. The following yeast strains were obtained from
the Centraal Bureau voor Schimmelcultures (CBS; Delft,The Netherlands): S. cerevisiae CBS 8066, Torulopsis gla-brata CBS 138, Schizosaccharomyces pombe CBS 356,Brettanomyces intermedius CBS 1943, Candida utilis CBS621, Hansenula nonfermentans CBS 5764, Kluyveromycesmarxianus CBS 6556, and Pichia stipitis CBS 5773. Thesestrains were maintained on malt agar slopes. In addition,some experiments were carried out with a leaky pyruvatedecarboxylase mutant of S. cerevisiae (pdc 2-122) (17). Thisstrain was maintained on yeast extract-peptone agar slopescontaining 2% ethanol.
Culture conditions. The organisms were grown aerobicallyin chemostat cultures under glucose limitation at D = 0.1 h-1as described previously (20). The glucose concentration inthe reservoir medium was 5 g/liter. The pdc mutant wasgrown at a dilution rate of 0.05 h-', since its PEmax was only0.1 h-1. The medium for the mutant was the same as that forthe other yeasts, except that it also contained 40 mg ofDL-leucine liter-'. After 2 days of batch growth on ethanol,the dilution rate was set at 0.05 h-1. After another 2 days,the ethanol-containing reservoir was exchanged for a glu-cose-containing reservoir, and the dilution rate was kept at0.05 h-1.
Glucose pulse experiments. The glucose pulse experiments
281
on June 13, 2018 by guesthttp://aem
.asm.org/
Dow
nloaded from

282 VAN URK ET AL.
were performed in duplicate with each organism. After asteady state had been reached, the glucose feed was stoppedand 50 mM glucose was added aseptically to the cultures.Samples were taken at regular intervals for the determina-tion of metabolite concentrations, enzyme levels, and dryweight, as well as protein, glycogen, and trehalose contentsof the cells. During the experiment, the oxygen consumptionand CO2 production rates were continuously monitored viaanalysis of the exhaust gas by a paramagnetic oxygenanalyzer and an infrared carbon dioxide analyzer. Themethods used for gas analysis and the determination ofglucose, ethanol, acetate, and pyruvate were as described byvan Urk et al. (20).For comparative purposes, the pulse experiments were
divided into three phases: the first 30 min of the experiment(phase I), a phase between 30 and 60 min after glucoseaddition (phase II), and hour 2 of the pulse experiment(phase III). If the glucose was consumed within 2 h (i.e., inthe case of T. glabrata), the consumption and productionrates during phase III were calculated over the period inwhich glucose was still present. The glucose and oxygenconsumption rates and metabolite production rates (seeTable 1) were calculated by linear regression of the analyti-cal data obtained during the three respective phases.Carbon recoveries during the steady-state situations were
between 95 and 105% for all yeasts tested and between 80and 120% during the pulse experiments for all except forSchizosaccharomyces pombe, which excreted other prod-ucts besides pyruvate, acetate, ethanol, and carbon dioxide.The nature of these products was not investigated.Enzyme assays. For the determination of enzyme activi-
ties, samples were taken from steady-state cultures and fromcultures 30, 60, and 120 min after glucose addition during theglucose pulse experiments. Cells were washed in 10 mMpotassium phosphate (pH 7.5) containing 2.5 mM EDTA andfrozen at -20°C until the preparation of extracts (within 1month). Extracts were prepared by sonication of cells in a 75mM potassium phosphate buffer (pH 6.5) containing 5 mMMgSO4, 1 mM thiamine PP1, and 2 mM dithiothreitol with anMSE-150 W sonifier. Enzyme activities were assayed infreshly prepared extracts with a Hitachi 100-60 spectropho-tometer at 340 nm. In all cases, the enzyme activity waslinearly proportional to the amount of extract used. Theassays of the individual enzymes were performed as de-scribed by Postma et al. (16).
Determination of glycogen and trehalose. Glycogen andtrehalose contents of cells were determined as described byvan Urk et al. (20).
RESULTS
Selection of strains. We selected eight yeast species for thedetermination of transient responses after the exposure ofyeasts to glucose excess. These species had already beencharacterized in the literature with respect to the occurrenceof the Crabtree effect. Generally, however, information ontheir responses to excess sugar concerned only long-termadaptation, which involves the repression of respiratoryenzymes in aerobic batch cultures. It was anticipated thatlike S. cerevisiae, other Crabtree-positive yeasts wouldrespond to a sudden exposure to glucose excess by aninstantaneous, aerobic alcoholic fermentation (i.e., a short-term Crabtree effect [14, 20]). This proved to be the case inall four Crabtree-positive yeasts selected (S. cerevisiae CBS8066, T. glabrata CBS 138, Schizosaccharomyces pombeCBS 356, and, to a lesser extent, B. intermedius CBS 1943).
This phenomenon was not observed in C. utilis CBS 621, H.nonfermentans CBS 5764, K. marxianus CBS 6556, or P.stipitis CBS 5773, which are known to carry out alcoholicfermentation under oxygen-limited conditions. Despite itsname, H. nonfermentans also belongs to this class of facul-tatively fermentative yeasts, although it scores negative inthe classical taxonomic fermentation test (19).
Rate of biomass production. The rate of biomass produc-tion of three of the Crabtree-positive yeasts immediatelyafter glucose addition (phase I) remained about equal to thatduring the steady state in the chemostat (Table 1). T. gla-brata behaved differently. Its rate of biomass productionduring phase I was twice that of the steady-state culture.After adaptation to glucose excess, the growth rates of thefour yeasts increased (Table 1). The protein content of theCrabtree-positive yeasts remained approximately constantduring the experiments (Table 2); it may be concluded thatthe rate of biomass production is directly related to thegrowth rate. In the Crabtree-negative yeasts, the growth ratecannot be calculated directly from the increase in dryweight, since synthesis of reserve carbohydrates in theseorganisms was triggered by a glucose pulse (Table 2). K.marxianus behaved differently in this respect: its content ofreserve carbohydrates remained constant (Table 2). Thegrowth rates of the Crabtree-negative yeasts should becalculated on the basis of the protein content of the cells andthe rate of biomass production (20). In all Crabtree-negativespecies, the protein content decreased during phase I. Whenthe growth rate is estimated on the basis of protein, itappears that also these yeasts initially (phase I) continued togrow at the same rate as during glucose limitation. Thisconclusion may be drawn even in the case of K. marxianus,although the decrease in protein content did not coincidewith an increase in glycogen or trehalose (Table 2). Possibly,other reserve materials such as lipids were accumulated inK. marxianus.
Respiration rate. From a comparison of the Crabtree-positive and Crabtree-negative yeasts, no clear correlationbetween respiratory activity (qo2) and fermentation rate(qethanol + qacetate) (Table 1) can be drawn. For instance, therespiration rates of the Crabtree-negative yeasts H. nonfer-mentans and P. stipitis after transition to glucose excesswere even lower than the respiration rate of S. cerevisiae.Moreover, a low rate of respiration did not coincide with ahigh rate of fermentation, as is evident from the behavior ofB. intermedius (Table 1).
Glucose consumption rate. The Crabtree-positive yeastsgenerally exhibited a higher rate of glucose consumptionthan the Crabtree-negative species. C. utilis and B. interme-dius behaved exceptionally. The rate of glucose consump-tion was markedly higher in C. utilis than in the other threeCrabtree-negative yeasts. However, this organism accumu-lated more glycogen as a reserve carbohydrate than the rest.This accumulation of reserve carbohydrates results in a lowglycolytic rate. The rate of glycolysis can be estimated,roughly, as follows: qglycolysis = qglucose - qglycogen -qtrehalose (in millimoles of glucose units gram-' hour-').It can be calculated that the qgiycolysis in the Crabtree-negative yeasts during phase I was 1.8 to 3.5mmol g-1 h-', whereas this parameter was 6.2 to 7.5 inthe Crabtree-positive yeasts, excluding B. intermedius. In B.intermedius, qglclysis during phase I was much lower (1.1mmol g-' h-4) than in the other Crabtree-positive yeasts.This is not surprising, in view of the low rates of growth,respiration, and fermentation encountered in this organism(Table 1). Altogether, these results establish that the carbon
APPL. ENVIRON. MICROBIOL.
on June 13, 2018 by guesthttp://aem
.asm.org/
Dow
nloaded from
METABOLIC FLUXES IN CRABTREE-POSITIVE AND -NEGATIVE YEASTS
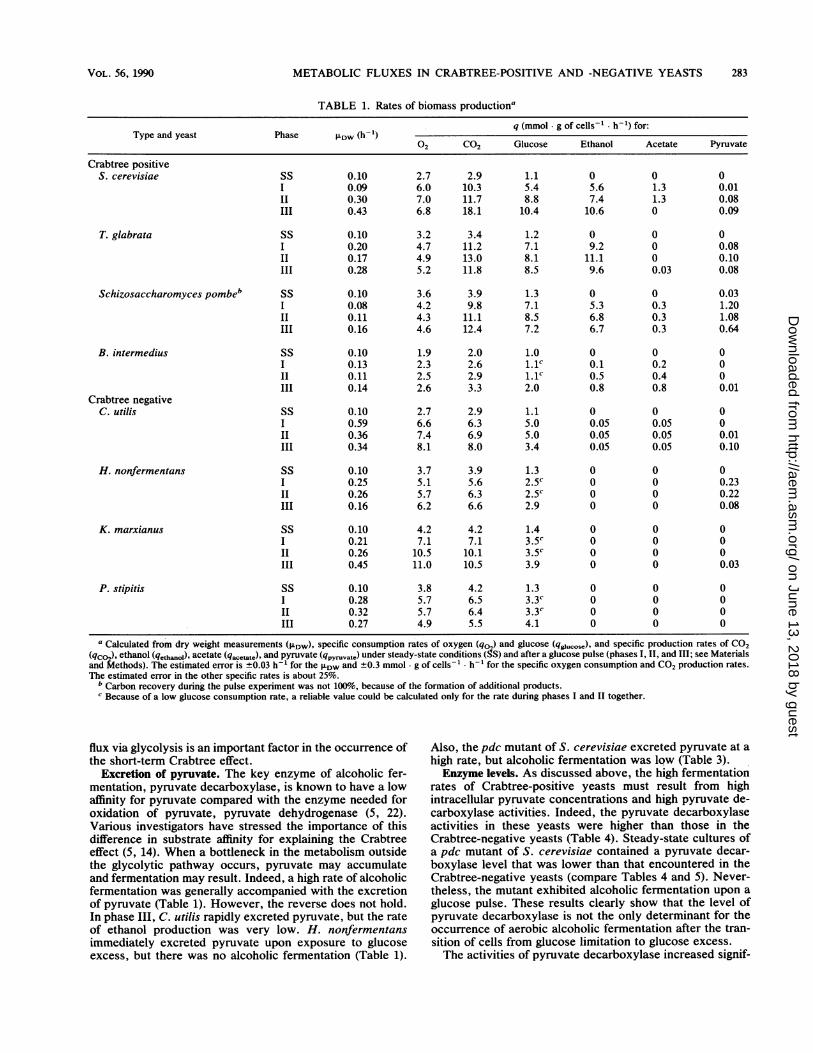
TABLE 1. Rates of biomass productiona
Type and yeast Phase LDW(h-') q (mmol g of cells' h1) for:
02 CO2 Glucose Ethanol Acetate Pyruvate
Crabtree positiveS. cerevisiae SS 0.10 2.7 2.9 1.1 0 0 0
I 0.09 6.0 10.3 5.4 5.6 1.3 0.01II 0.30 7.0 11.7 8.8 7.4 1.3 0.08III 0.43 6.8 18.1 10.4 10.6 0 0.09
T. glabrata SS 0.10 3.2 3.4 1.2 0 0 0I 0.20 4.7 11.2 7.1 9.2 0 0.08II 0.17 4.9 13.0 8.1 11.1 0 0.10III 0.28 5.2 11.8 8.5 9.6 0.03 0.08
Schizosaccharomyces pombeb SS 0.10 3.6 3.9 1.3 0 0 0.03I 0.08 4.2 9.8 7.1 5.3 0.3 1.20II 0.11 4.3 11.1 8.5 6.8 0.3 1.08III 0.16 4.6 12.4 7.2 6.7 0.3 0.64
B. intermedius SS 0.10 1.9 2.0 1.0 0 0 0I 0.13 2.3 2.6 1.1C 0.1 0.2 0II 0.11 2.5 2.9 1.1C 0.5 0.4 0III 0.14 2.6 3.3 2.0 0.8 0.8 0.01
Crabtree negativeC. utilis SS 0.10 2.7 2.9 1.1 0 0 0
I 0.59 6.6 6.3 5.0 0.05 0.05 0II 0.36 7.4 6.9 5.0 0.05 0.05 0.01III 0.34 8.1 8.0 3.4 0.05 0.05 0.10
H. nonfermentans SS 0.10 3.7 3.9 1.3 0 0 0I 0.25 5.1 5.6 2.5c 0 0 0.23II 0.26 5.7 6.3 2.5c 0 0 0.22III 0.16 6.2 6.6 2.9 0 0 0.08
K. marxianus SS 0.10 4.2 4.2 1.4 0 0 0I 0.21 7.1 7.1 3.5C 0 0 0II 0.26 10.5 10.1 3.5C 0 0 0III 0.45 11.0 10.5 3.9 0 0 0.03
P. stipitis SS 0.10 3.8 4.2 1.3 0 0 0I 0.28 5.7 6.5 3.3C 0 0 0II 0.32 5.7 6.4 3.3C 0 0 0III 0.27 4.9 5.5 4.1 0 0 0
a Calculated from dry weight measurements (LDW), specific consumption rates of oxygen (qo) and glucose (qXucose), and specific production rates of CO2(qc ), ethanol (qe,h.01), acetate (qacetate), and pyruvate (qpyr-uvate) under steady-state conditions (SS) and after a glucose pulse (phases I, II, and III; see MaterialsandMethods). The estimated error is ±0.03 h-' for the PDw and ±0.3 mmol g of cells-' h for the specific oxygen consumption and CO2 production rates.The estimated error in the other specific rates is about 25%.
b Carbon recovery during the pulse experiment was not 100%, because of the formation of additional products.c Because of a low glucose consumption rate, a reliable value could be calculated only for the rate during phases I and II together.
flux via glycolysis is an important factor in the occurrence ofthe short-term Crabtree effect.
Excretion of pyruvate. The key enzyme of alcoholic fer-mentation, pyruvate decarboxylase, is known to have a lowaffinity for pyruvate compared with the enzyme needed foroxidation of pyruvate, pyruvate dehydrogenase (5, 22).Various investigators have stressed the importance of thisdifference in substrate affinity for explaining the Crabtreeeffect (5, 14). When a bottleneck in the metabolism outsidethe glycolytic pathway occurs, pyruvate may accumulateand fermentation may result. Indeed, a high rate of alcoholicfermentation was generally accompanied with the excretionof pyruvate (Table 1). However, the reverse does not hold.In phase III, C. utilis rapidly excreted pyruvate, but the rateof ethanol production was very low. H. nonfermentansimmediately excreted pyruvate upon exposure to glucoseexcess, but there was no alcoholic fermentation (Table 1).
Also, the pdc mutant of S. cerevisiae excreted pyruvate at ahigh rate, but alcoholic fermentation was low (Table 3).Enzyme levels. As discussed above, the high fermentation
rates of Crabtree-positive yeasts must result from highintracellular pyruvate concentrations and high pyruvate de-carboxylase activities. Indeed, the pyruvate decarboxylaseactivities in these yeasts were higher than those in theCrabtree-negative yeasts (Table 4). Steady-state cultures ofa pdc mutant of S. cerevisiae contained a pyruvate decar-boxylase level that was lower than that encountered in theCrabtree-negative yeasts (compare Tables 4 and 5). Never-theless, the mutant exhibited alcoholic fermentation upon a
glucose pulse. These results clearly show that the level ofpyruvate decarboxylase is not the only determinant for theoccurrence of aerobic alcoholic fermentation after the tran-sition of cells from glucose limitation to glucose excess.The activities of pyruvate decarboxylase increased signif-
283VOL. 56, 1990
on June 13, 2018 by guesthttp://aem
.asm.org/
Dow
nloaded from

APPL. ENVIRON. MICROBIOL.
TABLE 2. Protein, glycogen, and trehalose contents of yeastsgrown under glucose-limited conditions (SS) and during
glucose pulse experiments (30 and 60 min afterglucose addition to steady-state cultures)a
Amt [(g of glucoseTimeAmt f protein units g of dry
Type and yeast Time Amt of pro°teinlO) w-)10 fTypeand east (min) (g g [dry wtf'1 100) wt 1) 100] of:Glycogen Trehalose
Crabtree positiveS. cerevisiae SS 42 6 4
30 43 2 060 44 2 0
T. glabrata SS 41 7 130 40 5 260 40 7 1
S. pombe SS 42 2 530 42 2 160 42 3 1
B. intermedius SS 40 6 030 37 6 060 40 6 0
Crabtree negativeC. utilis SS 53 3 0
30 40 17 060 39 14 0
H. nonfermentans SS 39 2 130 37 6 460 37 8 5
K. marxianus SS 52 1 030 50 1 060 48 1 0
P. stipitis SS 48 1 030 39 10 060 35 16 0
a D = 0.1 h-1. The estimated error is ±3 for the protein determination and±1 for the glycogen and trehalose determinations.
icantly in the Crabtree-positive yeasts during glucose pulseexperiments (Table 4). In contrast, the activities of pyruvatedecarboxylase in the Crabtree-negative yeasts remainedmuch lower compared with those encountered in the Crab-tree-positive yeasts (Table 4). The other important enzymefor fermentation, alcohol dehydrogenase, was present athigh levels in the Crabtree-positive yeasts. Of the Crabtree-negative yeasts, only P. stipitis did not have detectablelevels of this enzyme, which explains its Crabtree-negativebehavior. On the other hand, all Crabtree-negative yeastshad acetaldehyde dehydrogenase activity and hence shouldhave been able to produce acetate. The reason why theCrabtree-negative yeasts excreted little if any acetate (Table1) may be that acetate was immediately metabolized toacetyl coenzyme A (CoA) by the enzyme acetyl-CoA syn-thetase (Table 4). In the Crabtree-positive yeasts, this by-pass oxidation route may also be used (6, 10) (Table 4).However, because the activity of the enzyme pyruvatedecarboxylase in these yeasts was higher than that of acetyl-CoA synthetase, alcoholic fermentation was the predomi-nant process at high intracellular pyruvate concentrations.
TABLE 3. Rates of growth, substrate consumption, and productformation of S. cerevisiae pdc 2-122 (17)a
PhaseD'uWq (mmol g of cells-' h-') for:
Phase 1(h- l(h1) 02 C02 Glucose Ethanol Acetate Pyruvate
SS 0.05 2.6 2.7 0.7 0 0 0I 0 3.3 3.4 1.7b 0.4 0.1 0.94II 0 3.4 4.0 1.7b 1.0 0.2 0.81III 0 3.3 4.9 2.0 1.8 0.5 0.71
a Growth rates (P.Dw), specific consumption rates of oxygen (qO2) andglucose (qglucose) and specific production rates of ethanol (qethanol), acetate(qacetate) and pyruvate (qpy.uvate) under steady-state conditions (SS) and aftera glucose pulse (phases I, II, and III; see Materials and Methods). Theestimated error is ±0.03 h-' for PtDw and +0.3 mmol g of cells-' h-1 forspecific oxygen consumption and CO2 production rates. The estimated errorin the other specific rates is about 25%.
b Because of a low glucose consumption rate, a reliable value could becalculated only for the rate during phases I and II together.
DISCUSSION
The results of our comparative study on the metabolicbehavior of eight yeast species show that several parametersare decisive for the occurrence of the short-term Crabtreeeffect. These include the rate of glucose consumption, thecapacity to accumulate reserve carbohydrates, the level ofpyruvate decarboxylase in the cells during exposure toglucose excess, and the growth rate under this condition.
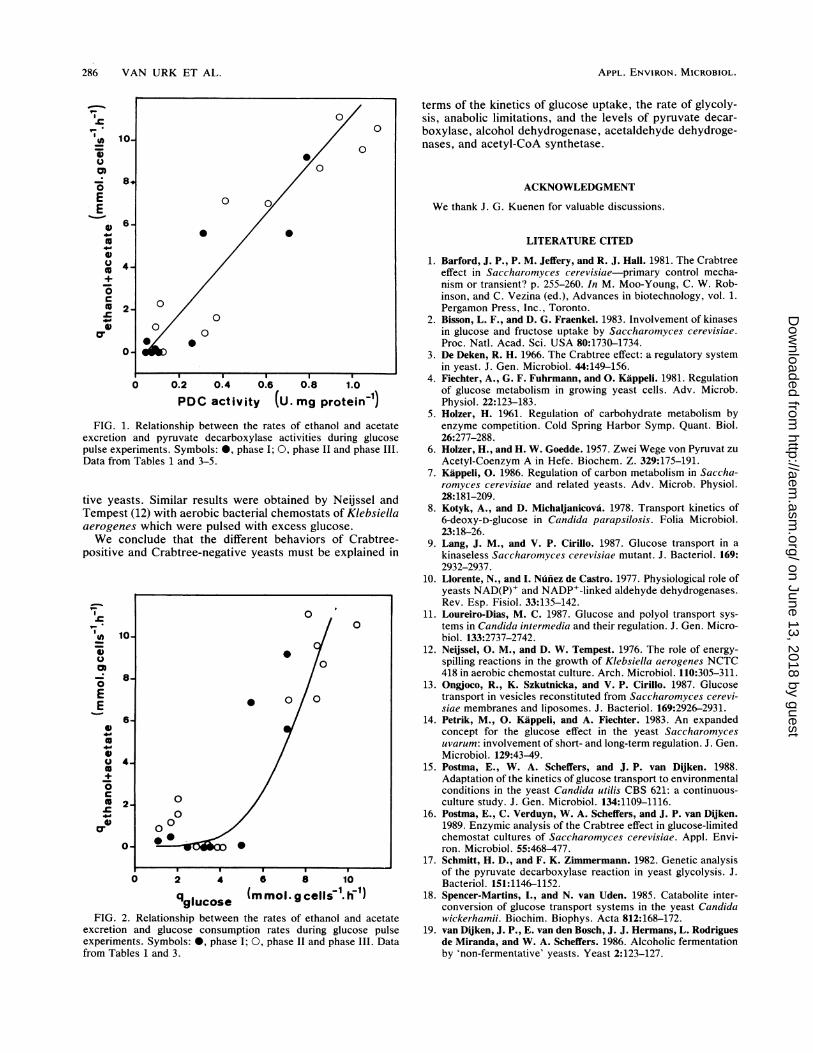
It is evident that a prerequisite for alcoholic fermentationis the presence of the enzymes of the fermentative route,pyruvate decarboxylase and alcohol dehydrogenase. Thisprerequisite was fulfilled in all cases but one (i.e., P. stipitis,which did not contain alcohol dehydrogenase under theculture conditions employed [Table 4]). Generally, a highrate of alcoholic fermentation correlated with high levels ofpyruvate decarboxylase. This can be seen from a plot of therates of fermentation (i.e., qethanol + qacetate) of the variousyeasts and their pyruvate decarboxylase levels (Fig. 1). Asimilar pattern for pdc mutants of S. cerevisiae was found bySchmitt and Zimmermann (17) under conditions in whichlong-term effects are relevant. The correlation in Fig. 1 is,however, not strict, indicating that other regulating factorsare also involved. For example, the pdc mutant of S.cerevisiae had approximately the same level of pyruvatedecarboxylase as the Crabtree-negative yeasts but neverthe-less carried out alcoholic fermentation, albeit at a low rate.An important factor in this respect is the branching point atthe level of acetaldehyde, at which fermentation and respi-ration compete for the same substrate. In the Crabtree-negative yeasts, the rate of respiration of acetaldehyde isprobably high enough to prevent even a low rate of ethanolproduction.An enhanced flux through the glycolytic pathway is the
basis of the short-term Crabtree effect (see above). Highrates of alcoholic fermentation were typically encountered inthe species that exhibited high rates of glucose consumption(Fig. 2). However, the physiological interpretation of theglucose consumption rate should be made carefully. Thisparameter is not identical to the rate of glycolysis. In C.utilis, for example, a high rate of glucose consumption wasobserved, but this was largely due to the accumulation ofglycogen. In addition, not only the rate of catabolism (fer-mentation and respiration) but also the rate of anabolismcontributes to the rate of glycolysis. This is because thesynthetic pathways of many cell constituents originate at orbeyond the level of pyruvate.
284 VAN URK ET AL.
on June 13, 2018 by guesthttp://aem
.asm.org/
Dow
nloaded from

METABOLIC FLUXES IN CRABTREE-POSITIVE AND -NEGATIVE YEASTS
TABLE 4. Enzyme activities (units milligram of protein-') under steady-state conditions (SS)and after a glucose pulse (phases I, II, and III)
TypeandyeastePyruvate Alcohol Acetaldehyde Acetaldehyde Acetyl-Type and yeast Phase decarboxylase dehydrogenase dehydrogenase dehydrogenase CoA
(NAD-) (NAD+) (NADP+) synthetase
Crabtree positiveS. cerevisiae SS 0.58 7.00 0.71 0.23 0.05
I 0.71 6.56 0.77 0.23 0.05II 0.85 5.74 0.79 0.22 0.03III 1.12 6.39 0.78 0.24 0.02
T. glabrata SS 0.73 3.73 0.07 0.04 0.21I 0.79 3.60 0.08 0.03 0.21II 0.94 3.60 0.05 0.03 0.18III 1.05 3.98 0.03 0.04 0.15
Schizosaccharomyces pombe SS 0.29 0.97 0.17 0.05 0.07I 0.31 1.21 0.17 0.04 0.06II 0.41 1.45 0.15 0.04 0.04III 0.61 1.48 0.05 0.02 0.04
B. intermedius SS 0.24 3.85 0.44 0.18 0.16I 0.26 3.90 0.41 0.18 0.18Il 0.32 3.76 0.37 0.17 0.19III 0.37 3.64 0.36 0.17 0.17
Crabtree negativeC. utilis SS 0.08 2.91 0.13 0.04 0.50
I 0.09 2.86 0.13 0.03 0.54II 0.11 2.22 0.13 0.02 0.44III 0.11 1.61 0.10 0.02 0.44
H. nonfermentans SS 0.08 0.40 0.19 0.03 0.11I 0.08 0.30 0.19 0.03 0.10II 0.08 0.25 0.18 0.03 0.10III 0.09 0.25 0.17 0.22 0.10
K. marxianus SS 0.05 1.04 0.64 0.10 0.36I 0.05 1.12 0.54 0.09 0.37II 0.05 1.23 0.54 0.09 0.37III 0.06 1.17 0.49 0.07 0.39
P. stipitis SS 0.09 0.00 0.10 0.00 0.091 0.11 0.00 0.10 0.00 0.09ll 0.13 0.00 0.10 0.00 0.05III 0.12 0.00 0.09 0.00 0.05
The primary event that causes an enhanced rate of glyco-lysis is the increased uptake of glucose from the environ-ment. Different mechanisms of glucose uptake exist inSaccharomyces spp. and Candida spp. In Saccharomycesspp., glucose is taken up by facilitated diffusion (8, 9), and inCandida spp., glucose is taken up by proton symport (11, 13,15, 18). Recent work in our laboratory on glucose uptake hasshown that this difference between Saccharomyces spp. and
TABLE 5. Enzyme activities (units. milligram of protein-')under steady-state conditions (SS) and after a glucose pulse
(phases I, II, and III) of S. cerevisiae pdc 2-122 (17)
Pyruvate Alcohol Acetaldehyde AcetaldehydePhase decar- dehydro- dehydro- dehydro- Acetyl-CoA
boxylase genase genase genase synthetaseboyae(NAD+) (NAD-) (NADP+)
SS 0.03 2.13 0.23 0.16 0.04I 0.05 2.75 0.26 0.15 0.05II 0.09 2.70 0.26 0.13 0.07III 0.11 2.50 0.24 0.13 0.05
Candida spp. holds for Crabtree-positive and Crabtree-negative yeasts in general (21), i.e., all the Crabtree-negativeyeasts tested exhibited glucose uptake by active transport(21).The short-term Crabtree effect in Saccharomyces uvarum
H2055 (14) has been explained in terms of a limited respira-tory capacity. Although this may apply to this particularstrain, it cannot be a general explanation for this effect.Alcoholic fermentation in the Crabtree-positive yeasts upontransition from glucose limitation to glucose excess was notassociated with low respiratory activity (Table 1). Moreover,compared with the steady-state respiratory activities, allyeasts increased their specific oxygen consumption ratesupon transition to glucose excess. Apparently, they pos-sessed a catabolic overcapacity but, in most cases, noanabolic overcapacity. In other words, the protein synthesisrates before and immediately after glucose addition were
equal in most of the yeasts tested. As discussed previously(20), under glucose excess, this will lead to an uncoupling ofcatabolic and anabolic reactions. Therefore, overflow reac-tions will occur in the Crabtree-positive and Crabtree-nega-
285VOL. 56, 1990
on June 13, 2018 by guesthttp://aem
.asm.org/
Dow
nloaded from
286 VAN URK ET AL.
1-
_ 84EE
6-
4-
+ 2
42
0
0
0
0
0
0
0
0
0
0
0 00
0.2 0.4 0.6 0.8 1.0
PDC activity (U. mg protein-')FIG. 1. Relationship between the rates of ethanol and acetate
excretion and pyruvate decarboxylase activities during glucosepulse experiments. Symbols: 0, phase I; 0, phase II and phase III.Data from Tables 1 and 3-5.
tive yeasts. Similar results were obtained by Neijssel andTempest (12) with aerobic bacterial chemostats of Klebsiellaaerogenes which were pulsed with excess glucose.We conclude that the different behaviors of Crabtree-
positive and Crabtree-negative yeasts must be explained in
10-
8-
0 2 4 6 8 10
qglucose (mmol.gcelli"'.1ih)FIG. 2. Relationship between the rates of ethanol and acetate
excretion and glucose consumption rates during glucose pulseexperiments. Symbols: 0, phase I; 0, phase II and phase III. Datafrom Tables 1 and 3.
0
terms of the kinetics of glucose uptake, the rate of glycoly-sis, anabolic limitations, and the levels of pyruvate decar-boxylase, alcohol dehydrogenase, acetaldehyde dehydroge-nases, and acetyl-CoA synthetase.
ACKNOWLEDGMENT
We thank J. G. Kuenen for valuable discussions.
LITERATURE CITED
1. Barford, J. P., P. M. Jeffery, and R. J. Hall. 1981. The Crabtreeeffect in Saccharomyces cerevisiae-primary control mecha-nism or transient? p. 255-260. In M. Moo-Young, C. W. Rob-inson, and C. Vezina (ed.), Advances in biotechnology, vol. 1.Pergamon Press, Inc., Toronto.
2. Bisson, L. F., and D. G. Fraenkel. 1983. Involvement of kinasesin glucose and fructose uptake by Saccharomyces cerevisiae.Proc. Natl. Acad. Sci. USA 80:1730-1734.
3. De Deken, R. H. 1966. The Crabtree effect: a regulatory systemin yeast. J. Gen. Microbiol. 44:149-156.
4. Fiechter, A., G. F. Fuhrmann, and 0. Kappeli. 1981. Regulationof glucose metabolism in growing yeast cells. Adv. Microb.Physiol. 22:123-183.
5. Holzer, H. 1961. Regulation of carbohydrate metabolism byenzyme competition. Cold Spring Harbor Symp. Quant. Biol.26:277-288.
6. Holzer, H., and H. W. Goedde. 1957. Zwei Wege von Pyruvat zuAcetyl-Coenzym A in Hefe. Biochem. Z. 329:175-191.
7. Kappeli, 0. 1986. Regulation of carbon metabolism in Saccha-romyces cerevisiae and related yeasts. Adv. Microb. Physiol.28:181-209.
8. Kotyk, A., and D. Michaljanicova. 1978. Transport kinetics of6-deoxy-D-glucose in Candida parapsilosis. Folia Microbiol.23:18-26.
9. Lang, J. M., and V. P. Cirillo. 1987. Glucose transport in akinaseless Saccharomyces cerevisiae mutant. J. Bacteriol. 169:2932-2937.
10. Llorente, N., and 1. Nufiez de Castro. 1977. Physiological role ofyeasts NAD(P)+ and NADP+-linked aldehyde dehydrogenases.Rev. Esp. Fisiol. 33:135-142.
11. Loureiro-Dias, M. C. 1987. Glucose and polyol transport sys-tems in Candida intermedia and their regulation. J. Gen. Micro-biol. 133:2737-2742.
12. Neijssel, 0. M., and D. W. Tempest. 1976. The role of energy-spilling reactions in the growth of Klebsiella aerogenes NCTC418 in aerobic chemostat culture. Arch. Microbiol. 110:305-311.
13. Ongjoco, R., K. Szkutnicka, and V. P. Cirillo. 1987. Glucosetransport in vesicles reconstituted from Saccharomyces cerevi-siae membranes and liposomes. J. Bacteriol. 169:2926-2931.
14. Petrik, M., 0. Kappeli, and A. Fiechter. 1983. An expandedconcept for the glucose effect in the yeast Saccharomycesuvarum: involvement of short- and long-term regulation. J. Gen.Microbiol. 129:43-49.
15. Postma, E., W. A. Scheffers, and J. P. van Dijken. 1988.Adaptation of the kinetics of glucose transport to environmentalconditions in the yeast Candida utilis CBS 621: a continuous-culture study. J. Gen. Microbiol. 134:1109-1116.
16. Postma, E., C. Verduyn, W. A. Scheffers, and J. P. van Dijken.1989. Enzymic analysis of the Crabtree effect in glucose-limitedchemostat cultures of Saccharomyces cerevisiae. Appl. Envi-ron. Microbiol. 55:468-477.
17. Schmitt, H. D., and F. K. Zimmermann. 1982. Genetic analysisof the pyruvate decarboxylase reaction in yeast glycolysis. J.Bacteriol. 151:1146-1152.
18. Spencer-Martins, I., and N. van Uden. 1985. Catabolite inter-conversion of glucose transport systems in the yeast Candidawickerhamii. Biochim. Biophys. Acta 812:168-172.
19. van Dijken, J. P., E. van den Bosch, J. J. Hermans, L. Rodriguesde Miranda, and W. A. Scheffers. 1986. Alcoholic fermentationby 'non-fermentative' yeasts. Yeast 2:123-127.
v-'-
01EEE
00
0
00
0
0
oO
V'0.4.'aU 4.coEu
c0 2-
0
0-
APPL. ENVIRON. MICROBIOL.
0
R-
on June 13, 2018 by guesthttp://aem
.asm.org/
Dow
nloaded from
METABOLIC FLUXES IN CRABTREE-POSITIVE AND -NEGATIVE YEASTS
19a.van Urk, H., P. M. Bruinenberg, M. Veenhuis, W. A. Scheffers,and J. P. van Dijken. 1989. Respiratory capacities of mitochon-dria of Saccharomyces cerevisiae CBS 8066 and Candida utilisCBS 621 grown under glucose limitation. Antonie van Leeuwen-hoek 56:211-220.
20. van Urk, H., P. R. Mak, W. A. Scheffers, and J. P. van Dijken.1988. Metabolic responses of Saccharomyces cerevisiae CBS8066 and Candida utilis CBS 621 upon transition from glucoselimitation to glucose excess. Yeast 4:283-291.
21. van Urk, H., E. Postma, W. A. Scheffers, and J. P. van Dijken.1989. Glucose transport in Crabtree-positive and Crabtree-negative yeasts. J. Gen. Microbiol. 135:2399-2406.
22. van Urk, H., D. Schipper, G. J. Breedveld, P. R. Mak, W. A.Scheffers, and J. P. van Dijken. 1989. Localization and kineticsof pyruvate-metabolizing enzymes in Saccharomyces cerevisiaeCBS 8066 and Candida utilis CBS 621. Biochim. Biophys. Acta992:78-86.
23. Verduyn, C., T. P. L. Zomerdijk, J. P. van Dijken, and W. A.Scheffers. 1984. Continuous measurement of ethanol productionby aerobic yeast suspensions with an enzyme electrode. Appl.Microbiol. Biotechnol. 19:181-185.
24. Woehrer, W., and M. Roehr. 1981. Regulatory aspects ofbakers' yeast metabolism in aerobic fed-batch cultures. Bio-technol. Bioeng. 23:567-581.
VOL. 56, 1990 287
on June 13, 2018 by guesthttp://aem
.asm.org/
Dow
nloaded from