transient simulations of nitrogen load for a coastal aquifer and embayment, cape cod, ma
TRANSCRIPT
Transient Simulations of NitrogenLoad for a Coastal Aquifer andEmbayment, Cape Cod, MAJ O H N A . C O L M A N * A N DJ O H N P . M A S T E R S O N
United States Geological Survey, 10 Bearfoot Road,Northborough, Massachusetts 01532
Received March 14, 2007. Revised manuscript received Sep-tember 17, 2007. Accepted September 19, 2007.
A time-varying, multispecies, modular, three-dimensionaltransport model (MT3DMS) was developed to simulategroundwater transport of nitrogen from increasing sources onland to the shore of Nauset Marsh, a coastal embayment ofthe Cape Cod National Seashore. Simulated time-dependentnitrogen loads at the coast can be used to correlate with currentobserved coastal eutrophic effects, to predict current andultimate effects of development, and to predict loads resultingfrom source remediation. A time-varying nitrogen load,corrected for subsurface loss, was applied to the landsubsurface in the transport model based on five land-usecoverages documenting increasing development from 1951 to1999. Simulated nitrogen loads to Nauset Marsh increasedfrom 230 kg/yr before 1930 to 4390 kg/yr in 2001 to 7130 kg/yrin 2100, assuming future nitrogen sources constant at the 1999land-use rate. The simulated nitrogen load per area ofembayment was 5 times greater for Salt Pond, a eutrophiclandward extension of Nauset Marsh, than for other NausetMarsh areas. Sensitivity analysis indicated that load results werelittle affected by changes in vertical discretization andannual recharge but much affected by the nitrogen loss rateassumed for a kettle lake downgradient from a landfill.
IntroductionSaltwater embayments are common features of the Mas-sachusetts, Rhode Island, and New York coast. Theseembayments, typically set in highly transmissive glacialoutwash sediments and lacking surface water inflow, receivefreshwater and nitrogen primarily from groundwater dis-charge. Nitrogen is often limiting to plant growth in marinewaters and is readily transported from sources on landthrough sand aquifers to the shore (1). Recently, coastaldevelopment and associated disposal of wastewater throughseptic systems have increased loads of nitrogen to coastalembayments (2), and many embayments now exhibiteutrophic effects (1, 2).
Increasing eutrophication has led to investigations ofnitrogen load, conducted primarily with steady-state, source-loading models (2, 3) (but see ref 4, where the effect of aquifertravel times on changing loads from septic systems has beensimulated by use of mapped travel-time bands). The steady-state nitrogen models simulate a constant nitrogen load tothe coast, determined as the sum of nitrogen sources in thewatershed area less losses incurred during transport. Bound-
aries of the groundwater–watershed are defined for thesteady-state nitrogen models from water table maps or fromregional groundwater-flow models.
The groundwater-flow models, coupled with solute-transport models, also could be used to assess time-varying(transient) loads of nitrogen. The transient simulations allowfor time-varying inputs of nitrogen sources, such as thoseresulting from increasing development, and of recharge,which varies with rainfall. The transient models simulatethree-dimensional solute distribution so that time-dependentestuarine loading and nitrogen depth distribution at the coastcan be determined. These capabilities are necessary for modelverification, correlations to estuary trophic response, predic-tions of future loads, and determination of the time-dependent consequences of remedial actions, includingsewering and associated water transfers. Transient loads areespecially necessary for the analysis of contributing areasthat have experienced recent development. Long aquifertravel times (up to 100 years) mean that increased nitrogenload at the coast may lag behind development of the uplandby many decades.
Both steady-state and transient models have similarlimitations regarding the accuracy of loading data used asinputs, of loss factors for nitrogen in the aquifer, and ofgroundwater-flow models that relate recharge areas todischarge at the coast. Models are constrained, however, byaquifer recharge and nitrogen source rates. Thus, usefulqualitative results, for example, the magnitude and timingof loads increasing or decreasing, are still possible.
Here transient simulations are described for nitrogen loadsto Nauset Marsh, a coastal embayment on Cape Cod, MA.Descriptions of the site and the computer models are givenfirst followed by field methods and literature sources for dataused to determine nitrogen input data for the model, tocharacterize the aquifer, and to verify the model. Whereasmethods for new data collection are given in full, summariesare given for previously published material, with details givenin the Supporting Information.
MethodsSite Description. The transient models simulated nitrogenin groundwater in the watershed of Nauset Marsh, a coastalembayment on Lower Cape Cod, MA (Figure 1). Thewatershed is in the Nauset groundwater-flow lens, wherefreshwater flows over deeper saltwater, from recharge inlandto discharge at the coast (5). The groundwater contributingarea of Nauset Marsh includes National Seashore land,housing and commercial areas, and five freshwater seepagekettle lakes (lakes formed in glacial outwash sediments byblocks of ice broken from the retreating glacier).
Description of the Models. A subregional MODFLOWmodel (6) (Figure 1) was used to simulate groundwater flow,based on a regional model for Lower Cape Cod developedby Masterson (5). Nitrogen transport was simulated by atime-varying, multispecies, modular, three-dimensional trans-port model (MT3DMS) model (7) that used flow-data outputfrom the subregional MODFLOW model. The finite-differencegrid for both subregional models consists of 180 rows and164 columns of uniformly spaced model cells 30 m on a side.The grids have 23 layers that extend from the water table tothe interface between the freshwater and saltwater flowsystems. Detailed descriptions of the models are given in theSupporting Information.
Water-Quality Data for Model Inputs. Nitrogen inputsfor the model were computed primarily from land-usecoverages; however, a nitrogen loading rate from the Visitor
* Corresponding author phone: (508) 490-5027; fax: (508) 490-5068; e-mail: [email protected].
Environ. Sci. Technol. 2008, 42, 207–213
10.1021/es070638b CCC: $40.75 Not subject to U.S. Copyright. Publ. 2008 Am. Chem. Soc. VOL. 42, NO. 1, 2008 / ENVIRONMENTAL SCIENCE & TECHNOLOGY 9 207
Published on Web 11/21/2007

Center of the Cape Cod National Seashore was determinedfrom samples collected from the distribution line of the septicleachfield and water-use data from the facility. Computedloading rates for the facility, which is just upgradient fromSalt Pond (Figure 1), were used to help evaluate loads fromother large septic systems in the groundwater–watershed.The septic system nitrogen load was determined from fivesamples collected at roughly constant time intervals fromJune 29, 2001, to May 23, 2002. Samples were sent on ice tothe National Water Quality Laboratory (NWQL), United StatesGeological Survey (USGS), for analysis of total ammonia andorganic nitrogen by colorimetry after microkjeldahl digestion(8), at a minimum reporting level (MRL) of 80 µg/L, and foranalysis of nitrate and nitrite by colorimetry after cadmiumreduction to nitrite and diazotization (9), MRL of 40 µg/L. Allconcentrations for nitrate and ammonia are reported in thispaper as the weight of nitrogen per liter. Monthly water-usedata for 2001 were obtained from the Cape Cod NationalSeashore Visitor Center to compute nitrogen loads.
Water-Quality Data for Aquifer Geochemical Charac-terization and Transport-Model Verification. Two data setswere available for aquifer geochemical characterization andmodel verification. Samples were collected during 2001–2003from the two 15-port multilevel samplers (MLSs; at MSL 1and MLS 2; Figure 1) and during a previous investigation(10, 11) from 1993 to 1994 from pushpoint wells near theshore (at S1 and S2, Figure 1).
Samples for nitrogen analyses were collected annuallyduring 2001–2003, by peristaltic pump from ports of the MLSspaced from the water table to 30 m depth. Samples for iron,manganese, and dissolved organic carbon (DOC) analysiswere collected in May 2002. Specific conductance (Orionmodel 126), dissolved oxygen, and pH (flow-through cell withHydrolab minisonde probes) were determined on-site.Samples were filtered (0.45 µm) inline, preserved with HClto pH 2.2, and analyzed at the North Atlantic CoastalLaboratory of the Cape Cod National Seashore for nitrate,
nitrite, ammonia, and in some samples, iron and manganese,or frozen before analysis of dissolved total nitrogen. Dissolvedorganic nitrogen was computed by the difference betweendissolved total nitrogen and inorganic nitrogen species.Nitrogen species analytical methods were from (12), adaptedfor the Quickchem FIA+ 8000 series flow-injected LachatInstruments autoanalyzer. The colorimetric chemistry fornitrate and nitrite analysis, MRL of 2 µg/L, was the same asthat above, and that for ammonia analysis, MRL of 4 µg/L,was by indophenol formation after treatment with phenoland sodium hypochlorite. Total dissolved nitrogen wasanalyzed as nitrate, after an alkaline persulfate digestion (13),MRL of 5 µg/L. Analyses of iron and manganese were byflame atomic absorption spectrometry (14), MRL of 100 µg/L. DOC samples were collected in prebaked amber glassbottles, acidified with H2SO4 to pH <2 and sent to the NWQLfor analysis by persulfate oxidation and IR spectrometry (15),MRL of 0.3 mg/L.
Additional nitrogen data (10, 11) for model verificationwere from the shore of Salt Pond (site S1) and the shore ofSalt Pond Bay (site S2) (Figure 1). Samples analyzed for nitrateand ammonium were collected during 1993–1994 frompushpoint wells in the intertidal zone, advanced 10 cm belowthe sediment surface and spaced parallel to the shoreline.
Transient Model Nitrogen Inputs. Time-varying nitrogenloads to the aquifer were estimated from land-use dataavailable for 1951, 1971, 1985, 1991, and 1999 (16) (Figure 2)and, for large septic systems, from data collection at the VisitorCenter, described above. Constituent loading rates wereassigned for each type of land use, 15 in total (13 shown inFigure 2), and used as inputs to the model for the time periodhalfway between one land-use assessment and the nextassessment. Loading for the period before the first land-useassessment in 1951 was arbitrarily divided into two regimes:predevelopment before 1930 (atmospheric deposition loadingonly) and the 1951 assessment after 1930. Loading in theperiod after the last land-use assessment, in 1999, was kept
FIGURE 1. Location map showing the Nauset groundwater-flow lens, Nauset Marsh, the location of the subregional solute-transportmodel domain, and the location of sampling sites used in model verification.
208 9 ENVIRONMENTAL SCIENCE & TECHNOLOGY / VOL. 42, NO. 1, 2008

at 1999 levels to the end of the simulation period, anadditional 100 years. An exception was landfill loading, whichwas decreased to zero at year 2003 to simulate the effect oflandfill capping begun in 1995.
Land-use loading relations and loss factors for nitrogenprimarily were not recalculated for the purposes of thisinvestigation; rather, they were based on publications aboutnitrogen loading elsewhere on Cape Cod (2, 17). Loadingrelations and loss factors are described in the SupportingInformation.
Sensitivity Analysis. Sensitivity analysis was limited tothe transport model; the flow model has been documentedpreviously (5). Considered in the sensitivity analysis was theeffect on nitrogen loads to the Nauset embayments of (i)fluctuating recharge, (ii) changed vertical model grid dis-cretization, and (iii) changed loss of the landfill nitrogenplume during passage through freshwater ponds. Nitrogendischarge to the embayments is also very sensitive to alterednitrogen loading to the aquifer and altered nitrogen lossfactors, but the effect is obvious—less nitrogen loading tothe aquifer or greater loss factors would lead to less nitrogendischarged to the embayments—and therefore was notincluded in the sensitivity analysis.
Fluctuating recharge was assessed by using the computedannual recharge values for Hatchville, MA, on western CapeCod from 1941 to 1995 (18), normalized on average to equalthe recharge value used in the model for Nauset Marsh. Inthe changed vertical discretization of the model, the top fivemodel layers were split, making 10 3-m thick layers. Smallercell size decreases numerical dispersion and would act topreserve vertical concentration gradients. Nitrogen lossduring passage of the landfill plume through a freshwaterlake was changed from 100% loss, as in the base-case model,to 90% loss.
ResultsMeasured Nitrogen Input. Total nitrogen concentrationsaveraged 95 mg/L (SD) 11 mg/L) in samples from the septicsystem of the Visitor Center. All nitrogen was in ammonium
or organic forms. Specific conductance of the effluent was1120 µS/cm (SD ) 109 µS/cm). The septic-system loaddetermined by the product of annual water use (2300 m3)and the average nitrogen concentration was 220 kg of N/year.
Aquifer Geochemistry. The water-quality results from the30 ports of MLS 1 and MLS 2 indicated that the aquifer wasoxic in the near-shore location of the sampling. Nitrogenwas primarily in the nitrate form. Concentrations of dissolvediron were less than 1 mg/L with exceptions for samples fromone port each at MLS 1 and MLS 2 of 2.4 and 1.8 mg/L,respectively. Concentrations of dissolved manganese rangedfrom 0.3 to 2.6 mg/L in samples from MLS 1 and were lessthan 0.6 mg/L in samples from MLS 2. DOC and organicnitrogen concentrations were less than 0.3 and 0.02 mg/L,respectively. Specific conductance values ranged from 120to 240 µS/cm; the pH ranged from to 5.8 to 6.5. High nitrogenand conductance values were measured in the zone 3–6 mbelow the water table and may indicate an area where theaquifer has been contaminated with septic-system effluent.
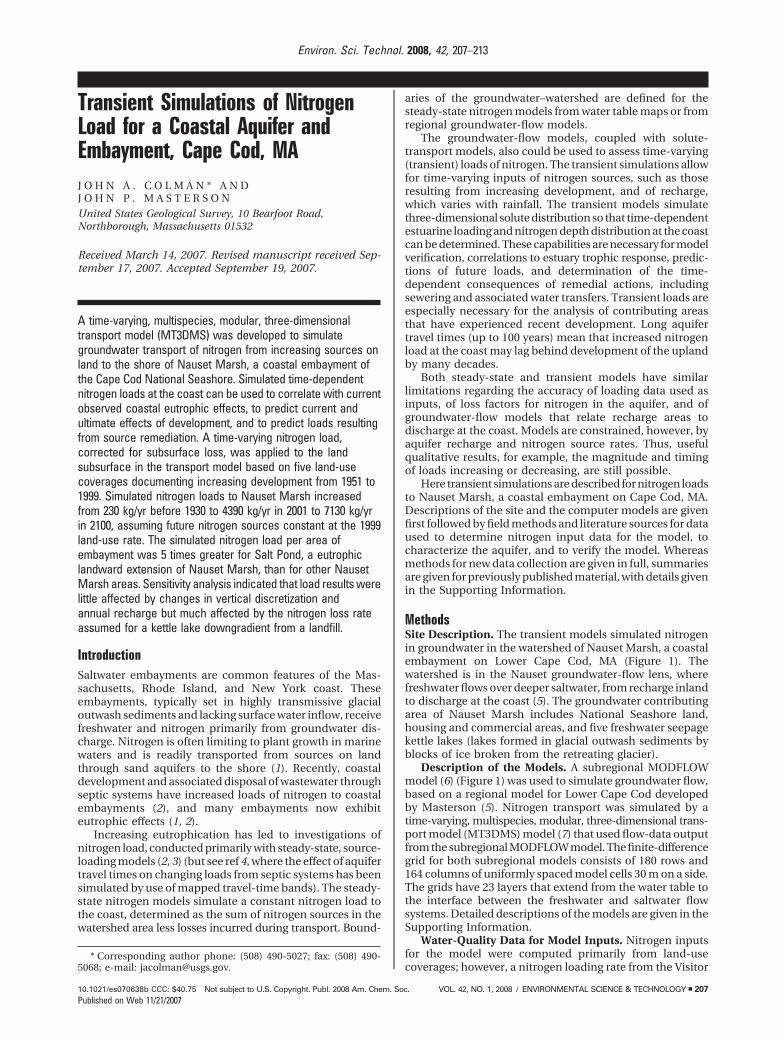
Computed Nitrogen Loading. The loads of nitrogen foreach land use were computed and input to the solute-transport model as an equivalent concentration in rechargefor each grid element. The summed loads represent the totalnitrogen load to the subsurface (Figure 3). Loss factors, whichwere applied externally to the model, substantially decreasedthe nitrogen load (Figure 3).
Model Verification. Load rather than concentration dataare best for validating a model that predicts nitrogen load.Local deviation from model assumptions may cause mea-sured concentrations to differ from simulated concentrationsbut may still not substantially affect load. Until methods aredeveloped that can measure load accurately, however, wecan verify only with concentration data.
Model verification was by comparison of measured withsimulated nitrogen concentrations for MLS port locationsand for pushpoint wells in the intertidal zone. Because nitraterepresented the principal form of nitrogen in the aquifer,other nitrogen data (ammonia and organic nitrogen) werenot needed for the comparisons. Nitrate concentrations
FIGURE 2. Changing land use of the groundwater contributing area for Nauset during 1930 to 1999, from MassGIS (16). Groundwaterhead contours (0.5 m contour interval) and MLS locations are shown in the 1930 coverage. Coverage boundaries are the same as theboundaries of the model grid, shown in Figure 1.
VOL. 42, NO. 1, 2008 / ENVIRONMENTAL SCIENCE & TECHNOLOGY 9 209
increased over time in the MLS samples (Figure 4, top panels)more so at MLS 1 than at MLS 2. (Two profiles for MLS 2 areinterrupted at -6.5 m because of a plugged port at somesamplings.) These results were consistent with changes insources of nitrogen, which increased upgradient from MLS1 (compare land covers in 1991 and 1999 and flow direction,perpendicular to water table contours; Figure 2), but wereless changed upgradient from MLS 2 (Figure 2). Nitrateconcentrations in the depth profiles of both MLSs weregenerally greatest toward the water table and decreasing withdepth. The concentrations at MLS 1 decreased gradually atthe deeper ports; concentrations at the three deepest sampleports of MLS 2 were consistently near zero (Figure 4).
Simulated concentration results at the locations of MLS1 and MLS 2 were generated for 1997–2005 for comparisonwith the measured concentrations (Figure 4 middle panels).The coarse vertical grid size of the base model does not allowfor vertical detail in the profiles. Thus, results from a modelwith finer vertical discretization, which is described morefully in the Sensitivity Analysis section, are also presentedfor MLS 1. (The finer discretization results from MLS 2 overlaycoarse-grid data and were not plotted.)
The general agreement between simulated concentrationsand measured nitrogen concentrations for the MLSs in termsof size, depth, and time trends of the highest concentrationsis impressive considering the size of the combined dilutionand loss factors that operate. Nitrogen concentrations of 35mg/L were assumed for domestic septic systems, which arethe principal nitrogen sources for the MLSs, and are greaterby a factor of 18.4 than the highest concentration measuredat the MLSs, 1.9 mg/L. A small discrepancy between the actualand simulated dilution and loss factors would result insubstantial discrepancies between measured and simulatedgroundwater concentrations of nitrogen at the MLS sites.
A detailed comparison of simulated and measured nitrateconcentrations at MLS 1 (lowest panel, red points, Figure 4;finer discretization results were used) indicates that thesimulation overpredicted values of most measured concen-trations (RMSE ) 0.69 mg/L). Results from a secondsimulation (lowest panel, green points, Figure 4), in whichloss in the aquifer of nitrogen from septic systems wasincreased from the base case 50% to 70%, were more evenlydistributed around the dashed line of equivalency. The secondrun illustrates the magnitude of parameter change requiredto improve the bias but is not grounds for changing the modelcalibration. Many model parameters or local aquifer proper-ties besides the loss rate could equally well account for thebias.
Measured and modeled results at MLS 2 agreed in thatneither increased greatly over time. However, the depth of
peak concentration differs between measured and modeledresults, and the measured concentrations differed fromsimulated concentrations for the three deepest samplingports (<30 µg/L compared with 650–1300 µg/L, respectively).The area upgradient of MLS 2 included a leaking undergroundstorage tank, for which a pump and treat system had beeninstalled. In addition, clay lenses were encountered duringdrilling of MLS 2, which were too thin to be included explicitlyin the simulation. At shallow depths, differences betweensimulated and measured concentrations could be a result ofmixing from the pump and treat systems. The higherconcentrations in the simulation compared to measuredconcentrations at deeper depths may be because nitrogenhad not yet penetrated to depths below the clay lenses.
The pushpoint nitrate concentrations at Salt Pond (S1)ranged from 30 to 3100 µg/L with variable salinities. If thenitrate came exclusively from the fresh groundwater, asdetermined by Portnoy et al. (10), the nitrate concentrationextrapolated to zero salinity, 2800 µg/L (n ) 47) (11), wouldestimate the nitrate in a completely fresh sample. Thesimulated nitrogen concentration for S1 was 2300 µg/L. Incontrast, concentrations in samples collected in pushpointson the intertidal beach of Salt Pond Bay (S2) were more than10 times lower, 100 µg/L (n)21) after accounting for seawatercontribution to the samples (11). The simulated concentrationfor that area and time was 300 µg/L. The somewhat highersimulated concentrations are likely a result of numericalmixing upward in the 6-m vertical-grid spacing from thehigher-concentration water recharged upgradient of theprotected National Seashore land.
In summary, whereas simulated nitrogen concentrationsare in the right range––an order of magnitude less thanconcentrations of the nitrogen sources for the MLS loca-tions––variable correlation resulted from detailed compari-sons between measured and simulated concentrations. Shoreconcentrations (S1 and S2) matched simulated concentra-tions well. MLS 2 was apparently poorly located, and ameaningful detailed comparison between measured andsimulated was not possible. MLS 1 data matched simulatedvalues better when the septic-system loss was changed from50% to 70%. Mixing features and fine-scale aquifer propertiesnot entered into the simulations will cause local discrepanciesbetween simulated and measured concentrations; however,simulation results at a larger scale, such as nitrogen loadingto a subembayment, will not necessarily be greatly affectedby the small-scale inconsistencies. The verification indicatesthat qualitative predictions of time variation of loads arelikely correct but that the quantitative accuracy of loads hasnot been determined.
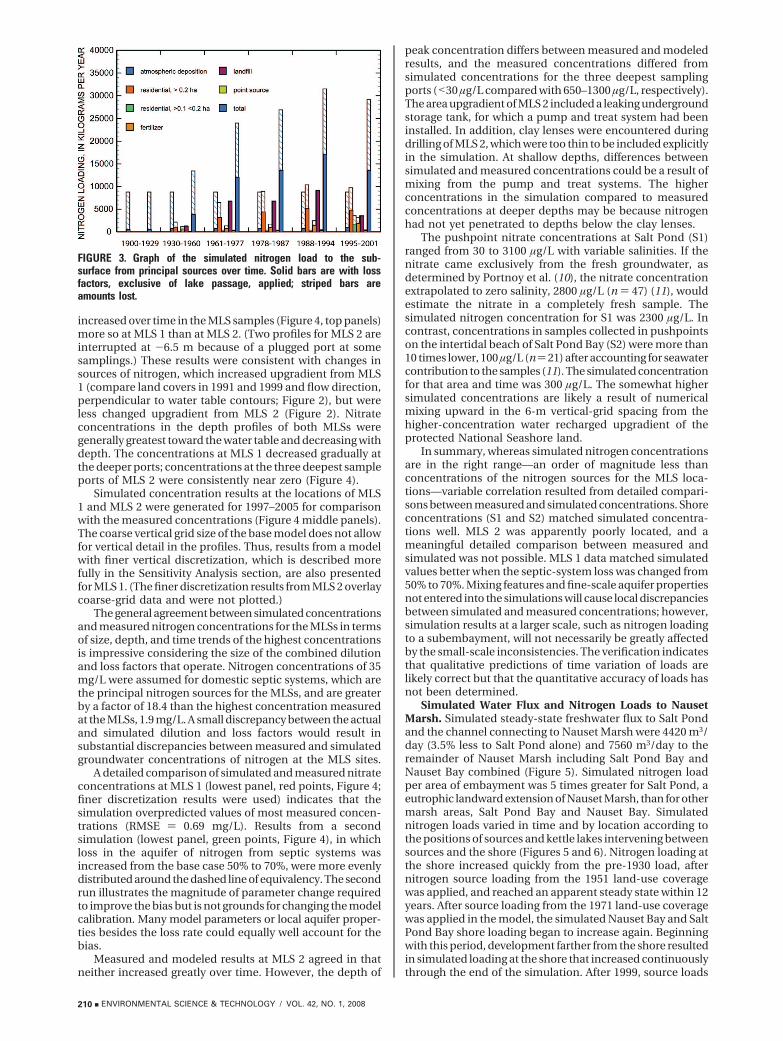
Simulated Water Flux and Nitrogen Loads to NausetMarsh. Simulated steady-state freshwater flux to Salt Pondand the channel connecting to Nauset Marsh were 4420 m3/day (3.5% less to Salt Pond alone) and 7560 m3/day to theremainder of Nauset Marsh including Salt Pond Bay andNauset Bay combined (Figure 5). Simulated nitrogen loadper area of embayment was 5 times greater for Salt Pond, aeutrophic landward extension of Nauset Marsh, than for othermarsh areas, Salt Pond Bay and Nauset Bay. Simulatednitrogen loads varied in time and by location according tothe positions of sources and kettle lakes intervening betweensources and the shore (Figures 5 and 6). Nitrogen loading atthe shore increased quickly from the pre-1930 load, afternitrogen source loading from the 1951 land-use coveragewas applied, and reached an apparent steady state within 12years. After source loading from the 1971 land-use coveragewas applied in the model, the simulated Nauset Bay and SaltPond Bay shore loading began to increase again. Beginningwith this period, development farther from the shore resultedin simulated loading at the shore that increased continuouslythrough the end of the simulation. After 1999, source loads
FIGURE 3. Graph of the simulated nitrogen load to the sub-surface from principal sources over time. Solid bars are with lossfactors, exclusive of lake passage, applied; striped bars areamounts lost.
210 9 ENVIRONMENTAL SCIENCE & TECHNOLOGY / VOL. 42, NO. 1, 2008

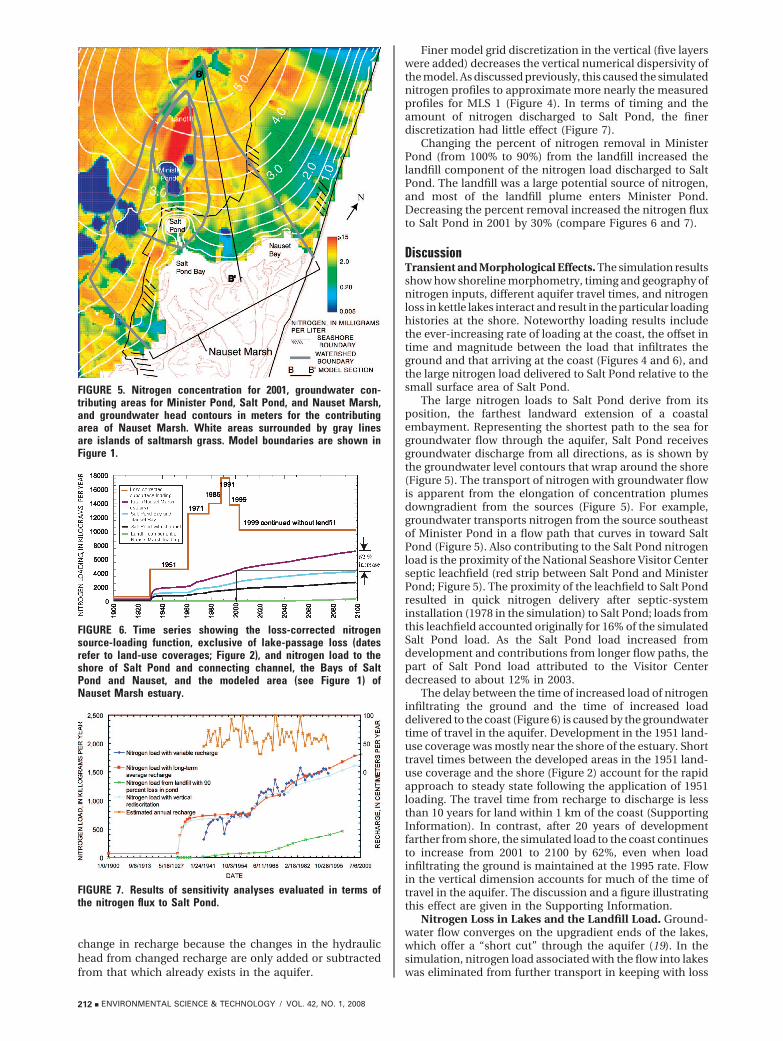
were frozen at the 1999 land-use rates, except the landfillloading, which was decreased to zero after 2003. In 2001, thesimulated nitrogen load to Salt Pond and the channelconnecting to Nauset Marsh was 1680 kg/yr; nitrogen fluxto the remainder of Nauset Marsh including Salt Pond Bayand Nauset Bay combined was 2710 kg/yr for a combinedload of 4390 kg/yr. The combined load to Nauset Marshestuary, however, increased 62% to 7130 kg/yr through theend of the simulation at 2100 (Figure 6).
Simulation of the landfill ammonia plume indicated a lownitrogen load at the shore in comparison with the load at thesource and a long delay in nitrogen arrival at the shore (Figures3 and 6). The difference between the landfill source and shoreload is caused by nitrogen loss during passage throughMinister Pond, located downgradient from the landfill. The
slow transport of nitrogen is caused by the retardation factorfor ammonia and the long flow path that extends from thelandfill, under Minister Pond, to the shore.
Sensitivity Analysis. The effects of changing modelparameters for the sensitivity analysis were evaluated in termsof changes in simulated nitrogen loads to Salt Pond (Figure7). Simulated variable recharge resulted in fluctuations inthe nitrogen load discharged to Salt Pond. The greatest year-to-year change in recharge during the period that wassimulated (1941–1995) occurred between 1971 and 1972,when recharge changed from 38 to 112 cm/yr, an increaseof 193%. The corresponding increase in nitrogen load duringthis period was an increase of 24% (Figure 7). Greater rechargecauses immediate response in terms of increased load, butthe relative magnitude of the response is smaller than the
FIGURE 4. Time-series nitrate data from MLSs in the aquifer near Nauset Marsh, used for model verification: (A) measured andsimulated concentrations at MLS 1; (B) measured and simulated concentrations at MLS 2. Data from above the water table (MLS 1)are from a perched water table. Red data points in the bottom panel are for 50% nitrogen loss from septic-system sources; greendata points are for 70% loss. Black data points are from S1 and S2.
VOL. 42, NO. 1, 2008 / ENVIRONMENTAL SCIENCE & TECHNOLOGY 9 211
change in recharge because the changes in the hydraulichead from changed recharge are only added or subtractedfrom that which already exists in the aquifer.
Finer model grid discretization in the vertical (five layerswere added) decreases the vertical numerical dispersivity ofthe model. As discussed previously, this caused the simulatednitrogen profiles to approximate more nearly the measuredprofiles for MLS 1 (Figure 4). In terms of timing and theamount of nitrogen discharged to Salt Pond, the finerdiscretization had little effect (Figure 7).
Changing the percent of nitrogen removal in MinisterPond (from 100% to 90%) from the landfill increased thelandfill component of the nitrogen load discharged to SaltPond. The landfill was a large potential source of nitrogen,and most of the landfill plume enters Minister Pond.Decreasing the percent removal increased the nitrogen fluxto Salt Pond in 2001 by 30% (compare Figures 6 and 7).
DiscussionTransient and Morphological Effects. The simulation resultsshow how shoreline morphometry, timing and geography ofnitrogen inputs, different aquifer travel times, and nitrogenloss in kettle lakes interact and result in the particular loadinghistories at the shore. Noteworthy loading results includethe ever-increasing rate of loading at the coast, the offset intime and magnitude between the load that infiltrates theground and that arriving at the coast (Figures 4 and 6), andthe large nitrogen load delivered to Salt Pond relative to thesmall surface area of Salt Pond.
The large nitrogen loads to Salt Pond derive from itsposition, the farthest landward extension of a coastalembayment. Representing the shortest path to the sea forgroundwater flow through the aquifer, Salt Pond receivesgroundwater discharge from all directions, as is shown bythe groundwater level contours that wrap around the shore(Figure 5). The transport of nitrogen with groundwater flowis apparent from the elongation of concentration plumesdowngradient from the sources (Figure 5). For example,groundwater transports nitrogen from the source southeastof Minister Pond in a flow path that curves in toward SaltPond (Figure 5). Also contributing to the Salt Pond nitrogenload is the proximity of the National Seashore Visitor Centerseptic leachfield (red strip between Salt Pond and MinisterPond; Figure 5). The proximity of the leachfield to Salt Pondresulted in quick nitrogen delivery after septic-systeminstallation (1978 in the simulation) to Salt Pond; loads fromthis leachfield accounted originally for 16% of the simulatedSalt Pond load. As the Salt Pond load increased fromdevelopment and contributions from longer flow paths, thepart of Salt Pond load attributed to the Visitor Centerdecreased to about 12% in 2003.
The delay between the time of increased load of nitrogeninfiltrating the ground and the time of increased loaddelivered to the coast (Figure 6) is caused by the groundwatertime of travel in the aquifer. Development in the 1951 land-use coverage was mostly near the shore of the estuary. Shorttravel times between the developed areas in the 1951 land-use coverage and the shore (Figure 2) account for the rapidapproach to steady state following the application of 1951loading. The travel time from recharge to discharge is lessthan 10 years for land within 1 km of the coast (SupportingInformation). In contrast, after 20 years of developmentfarther from shore, the simulated load to the coast continuesto increase from 2001 to 2100 by 62%, even when loadinfiltrating the ground is maintained at the 1995 rate. Flowin the vertical dimension accounts for much of the time oftravel in the aquifer. The discussion and a figure illustratingthis effect are given in the Supporting Information.
Nitrogen Loss in Lakes and the Landfill Load. Ground-water flow converges on the upgradient ends of the lakes,which offer a “short cut” through the aquifer (19). In thesimulation, nitrogen load associated with the flow into lakeswas eliminated from further transport in keeping with loss
FIGURE 5. Nitrogen concentration for 2001, groundwater con-tributing areas for Minister Pond, Salt Pond, and Nauset Marsh,and groundwater head contours in meters for the contributingarea of Nauset Marsh. White areas surrounded by gray linesare islands of saltmarsh grass. Model boundaries are shown inFigure 1.
FIGURE 6. Time series showing the loss-corrected nitrogensource-loading function, exclusive of lake-passage loss (datesrefer to land-use coverages; Figure 2), and nitrogen load to theshore of Salt Pond and connecting channel, the Bays of SaltPond and Nauset, and the modeled area (see Figure 1) ofNauset Marsh estuary.
FIGURE 7. Results of sensitivity analyses evaluated in terms ofthe nitrogen flux to Salt Pond.
212 9 ENVIRONMENTAL SCIENCE & TECHNOLOGY / VOL. 42, NO. 1, 2008

rates measured in other investigations (3, 20). The nitrogenremoval resulted in low-concentration areas downgradientfrom lakes (Figure 5). Exclusive of the landfill load, about20% of the loss-corrected load was removed in the lakes(compare the loss-corrected source load and shore load at2100; Figure 6). Loss because of lake passage was about 90%for the nitrogen load from the landfill, which was largelywithin the contributing area of Minister Pond (Figure 5).
Of the various large nitrogen sources, nitrogen loadtransported from the landfill (as ammonium) was least well-known. Landfill plumes can be heavier than ambientgroundwater because of high concentrations of dissolvedsolids. Whether the landfill plume sinks to the fine-grainedmaterial deep in the aquifer and is substantially slowed intransport or is transported to Minister Pond is uncertain.Also unknown is whether nitrogen removal in Minister Pondcould be complete if the bulk of landfill nitrogen entersMinister Pond. That is, high-percentage removal observedin other lakes (3, 20) might not apply when the input ofnitrogen is very large.
Where development on shore has been rapid, transientmodels are essential for correlations of nitrogen load withobserved eutrophic effects and for predictions of futurenitrogen loads. Transient simulations of nitrogen distributionin three dimensions, in the past, present, and future, canfacilitate the design of nitrogen load remediation, andtransient models can provide the structure for incorporatingresearch advances on nitrogen reaction and transport.
AcknowledgmentsWe appreciate the contributions from the Cape Cod NationalSeashore of Nancy Finley and John Portnoy, who helpedplan and carry out the research, and Krista Lee and JudithOset, who assisted with data collection and completed thechemical analyses, and from the town of Eastham of HenryLind, for advice and support in the field. The use of trade,product, or firm names is for descriptive purposes only anddoes not imply endorsement by the U.S. Government.
Supporting Information AvailableDetails of models, model inputs, and model results that weretoo detailed for inclusion in the journal text. These includethe sections Model Descriptions, Nitrogen Loss Rates, andGroundwater Time of Travel. This material is available freeof charge via the Internet at http://pubs.acs.org.
Literature Cited(1) Cloern, J. E. Our evolving conceptual model of the coastal
eutrophication problem. Mar. Ecol.: Prog. Ser. 2001, 210, 223–253.
(2) Valiela, I.; Collins, G.; Kremer, J.; Lajtha, K.; Geist, M.; Seely, B.;Brawley, J.; Sham, C. H. Nitrogen loading from coastal water-sheds to receiving estuaries: new method and application. Ecol.Appl. 1997, 7 (2), 358–380.
(3) Colman, J. A.; Masterson, J. P.; Pabich, W. J.; Walter, D. A. Effectsof aquifer travel time on nitrogen transport to a coastalembayment, Cape Cod, MA. Ground Water 2004, 42, 1069–1078.
(4) Brawley, J. W.; Collins, G.; Kremer, J. N.; Sham, C. H.; Valiela,I. A time-dependent model of nitrogen loading to estuaries fromcoastal watersheds. J. Environ. Qual. 2000, 29, 1448–1461.
(5) Masterson, J. P. Effects of changing ground-water pumping,recharge conditions, and sea level on ground-water flow in thelower Cape Cod aquifer system, MA; U.S. Geological SurveyScience-Investigations Report 2004-5014; U.S. Geological Survey:Washington, DC, 2004. http://pubs.usgs.gov/sir/2004/5014/.
(6) Harbaugh, A. W.; McDonald, M. G. User’s documentation forMODFLOW-96, an update to the U.S. Geological Survey modularthree-dimensional finite-difference ground-water-flow model;U.S. Geological Survey Open-File Report 96-485; U.S. GeologicalSurvey: Washington, DC, 1996.
(7) Zheng, C.; Wang, P. P. MT3DMS: A Modular Three-DimensionalMultispecies Transport Model for Simulation of Advection,Dispersion, and Chemical Reactions of Contaminants inGroundwater Systems. Documentation and User’s Guide, Pre-pared for U.S. Army Corps of Engineers; Contract Report SERDP-99-1f; 1999.
(8) Patton, C. J.; Truitt, E. P. Methods of analysis by the U.S. GeologicalSurvey National Water Quality Laboratory––Determination ofammonium plus organic nitrogen by a Kjeldahl digestion methodand an automated photometric finish that includes digest cleanupby gas diffusion; U.S. Geological Survey Open-File Report 00-170; U.S. Geological Survey: Washington, DC, 2000.
(9) Fishman, M. J. Methods of analysis by the U.S. Geological SurveyNational Water Quality Laboratory––Determination of inorganicand organic constituents in water and fluvial sediments; U.S.Geological Survey Open-File Report 93-125; U.S. GeologicalSurvey: Washington, DC, 1993.
(10) Portnoy, J. W.; Nowicki, B. L.; Roman, C. T.; Urish, D. W. Thedischarge of nitrate-contaminated groundwater from developedshoreline to marsh-fringed estuary. Water Resour. Res. 1998,34, 3095–3104.
(11) Urish, D. W.; Qanbar, E. K. Hydrologic Evaluation of Ground-water Discharge Nauset Marsh, Cape Cod National Seashore,MA. Technical Report NPS/NESO-RNR/NRTR/97-07; 1997.
(12) Grasshoff, K. Methods of Seawater Analysis; Verlag Chemie: NewYork, 1976.
(13) Valderrama, J. C. The simultaneous analysis of total nitrogenand total phosphorus in natural waters. Mar. Chem. 1981, 10,109–122.
(14) APHA. Standard methods for the examination of water andwastewater; American Public Health Association: Washington,DC, 1995.
(15) Brenton, R. W.; Arnett, T. L. Methods of analysis by the U.S.Geological Survey National Water Quality Laboratory––Deter-mination of dissolved organic carbon by UV-promoted persulfateoxidation and infrared spectrometry; U.S. Geological SurveyOpen-File Report 92-480; U.S. Geological Survey: Washington,DC, 1993.
(16) MassGIS. MassGIS Datalayer Descriptions and Guide to UserServicesExecutive Office of Environmental Affairs Data Center:Boston, MA, 2001.
(17) Valiela, I. G.; Bowen, J. L. Nitrogen sources to watersheds andestuaries: role of land cover mosaics and losses within water-sheds. Environ. Pollut. 2002, 118, 239–248.
(18) Walter, D. A.; Whealan, A. T. Simulated water sources and effectsof pumping on surface and ground water, Sagamore andMonomoy flow lenses, Cape Cod, MA; U.S. Geological SurveyScientific Investigations Report 2004-5181; U.S. GeologicalSurvey: Washington, DC, 2005. http://pubs.water.usgs.gov/sir2004/5181/.
(19) Masterson, J. P.; Walter, D. A. Delineation of ground-waterrecharge areas, western Cape Cod, MA. Water-ResourcesInvestigations Report 00-4000; U.S. Geological Survey: Wash-ington, DC, 2000.
(20) Ito, M.; Mitchell, M. J.; Driscoll, C. T.; Roy, K. M. Nitrogen input–output budgets for lake-containing watersheds in the Adiron-dack region of NY. Biogeochemistry 2005, 72, 283–314.
ES070638B
VOL. 42, NO. 1, 2008 / ENVIRONMENTAL SCIENCE & TECHNOLOGY 9 213