transient safety assessment and risk mitigation of a
TRANSCRIPT
1 2 3 4 5 6 7 8 9 10 11 12 13 14 15 16 17 18 19 20 21 22 23 24 25 26 27 28 29 30 31 32 33 34 35 36 37 38 39 40 41 42 43 44 45 46 47 48 49 50 51 52 53 54 55 56 57 58 59 60 61 62 63 64 65
1
Transient safety assessment and risk mitigation of a hydroelectric
generation system
Huanhuan Li1,2
, Beibei Xu 1,2
, Ehsan Arzaghi3, Rouzbeh Abbassi
4, Diyi Chen
1,2*, Aggidis George A.
5,
Jingjing Zhang 1,2
, Edoardo Patelli6
1Institute of Water Resources and Hydropower Research, Northwest A&F University, Shaanxi
Yangling 712100, P. R. China 2Key Laboratory of Agricultural Soil and Water Engineering in Arid and Semiarid Areas, Ministry of
Education, Northwest A&F University, Shaanxi Yangling 712100, P. R. China 3Science and Engineering Faculty, Queensland University of Technology, Brisbane 4000 Australia
4School of Engineering, Faculty of Science and Engineering, Macquarie University, Sydney, NSW,
Australia 5Lancaster University Renewable Energy Group and Fluid Machinery Group, Engineering
Department, Lancaster University, Lancaster UK 6Department of Civil and Environmental Engineering, University of Strathclyde, Glasgow G1 1XJ
United Kingdom
* Corresponding author: Diyi Chen
Telephone: 086-181-6198-0277
E-mail: [email protected]
Abstract: Transient safety assessment of hydroelectric generation systems is a major challenge for
engineers specialized in hydropower stations around the world. This includes two key scientific
issues: the dynamic risk quantification in a multi-factors coupling process, and the identification of
elements with highest contribution to system stability. This paper presents a novel and efficient
dynamic safety assessment methodology for hydroelectric generation systems (HGSs). Based on a
comprehensive fuzzy-entropy evaluation method, the dynamic safety level of the system is estimated
by means of probability values, and the influence rate of assessment indices on the HGS risk profile
is also obtained. Moreover, a number of risk mitigation and maintenance amendment strategies are
discussed to reduce the losses in operation and maintenance (O&M) costs at hydropower stations.
*Revised Manuscript with No Changes MarkedClick here to view linked References

1 2 3 4 5 6 7 8 9 10 11 12 13 14 15 16 17 18 19 20 21 22 23 24 25 26 27 28 29 30 31 32 33 34 35 36 37 38 39 40 41 42 43 44 45 46 47 48 49 50 51 52 53 54 55 56 57 58 59 60 61 62 63 64 65
2
The methodology is implemented and validated using an existing hydropower station experiencing a
start-up transient process, results of which are shown to be beneficial to operators and risk managers.
It is recommended that the presented methodology is applicable not only to the HGS’s start-up
process but is also promisingly useful for largely fluctuating transient processes of other engineering
facilities.
Keywords: Hydropower System; Dynamic Safety Assessment; Multi-factors Coupling Process;
Transient Analysis; Risk Mitigation;
1. Introduction
The global energy industry is confronted with a pressing pressure from the growth in economy
and the urgency of environmental protection, which propels the developments in renewable energy
[1, 2]. Meanwhile, the increasing penetration of intermittent renewable energy into the power grid
also poses a new challenge to the safety of power supply [3, 4]. Hydropower, as a clean energy
resource, is becoming increasingly attractive to all stakeholders of the energy industry including
companies, governments and the public due to its reliability, flexibility and affordability [5, 6]. The
average global hydroelectric generation has exceeded 4000 terawatt hours in 2017 [7, 8], which has
been supplying 16% of the world’s total electricity and constituting 68% of renewable electricity
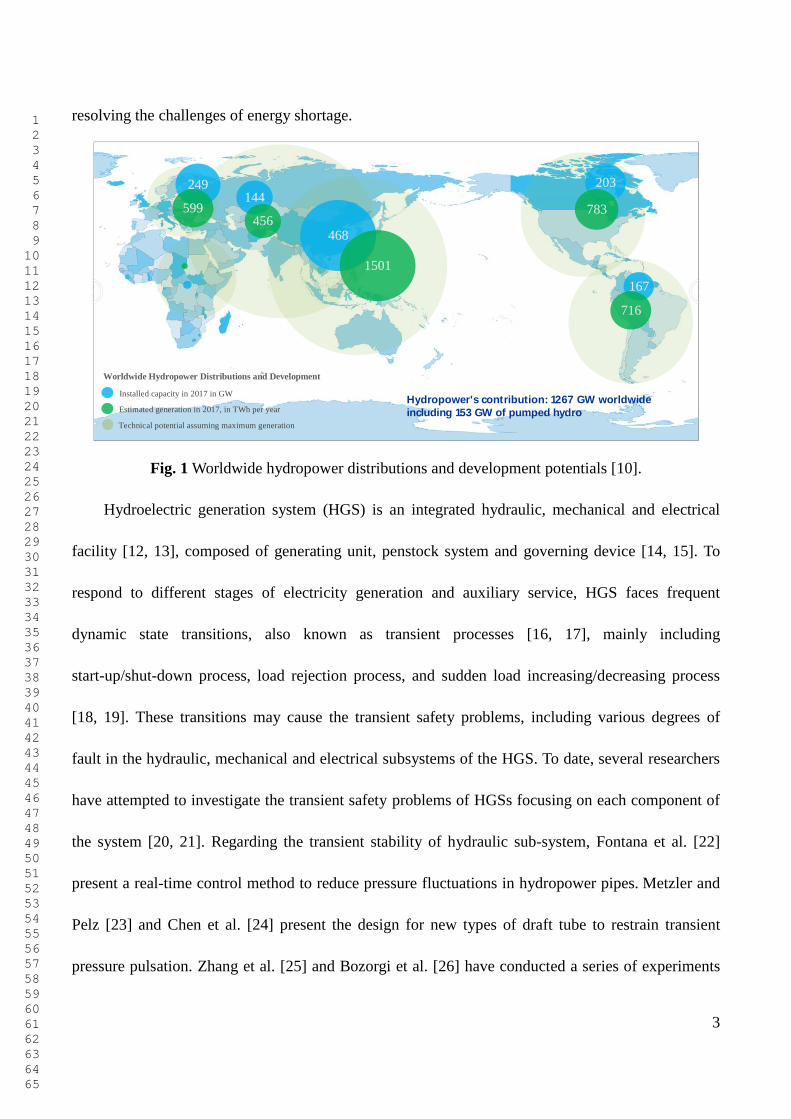
capacity [9]. A report by the International Hydropower Association in 2018 has highlighted the
importance of hydropower in electricity generation, from which the worldwide distribution of
installed capacity and potentials for developments are presented in Fig. 1 [10]. The International
Renewable Energy Agency (IRENA) predicts that the global hydropower capacity will reach 2200
gigawatt by 2030 [11], being in the forefront of energy industry and of significant interest for
1 2 3 4 5 6 7 8 9 10 11 12 13 14 15 16 17 18 19 20 21 22 23 24 25 26 27 28 29 30 31 32 33 34 35 36 37 38 39 40 41 42 43 44 45 46 47 48 49 50 51 52 53 54 55 56 57 58 59 60 61 62 63 64 65
3
resolving the challenges of energy shortage.
203
783
167
716
249
599144
456468
1501
Technical potential assuming maximum generation
Estimated generation in 2017, in TWh per year
Installed capacity in 2017 in GWHydropower's contribution: 1267 GW worldwide
including 153 GW of pumped hydro
Worldwide Hydropower Distributions and Development
Fig. 1 Worldwide hydropower distributions and development potentials [10].
Hydroelectric generation system (HGS) is an integrated hydraulic, mechanical and electrical
facility [12, 13], composed of generating unit, penstock system and governing device [14, 15]. To
respond to different stages of electricity generation and auxiliary service, HGS faces frequent
dynamic state transitions, also known as transient processes [16, 17], mainly including
start-up/shut-down process, load rejection process, and sudden load increasing/decreasing process
[18, 19]. These transitions may cause the transient safety problems, including various degrees of
fault in the hydraulic, mechanical and electrical subsystems of the HGS. To date, several researchers
have attempted to investigate the transient safety problems of HGSs focusing on each component of
the system [20, 21]. Regarding the transient stability of hydraulic sub-system, Fontana et al. [22]
present a real-time control method to reduce pressure fluctuations in hydropower pipes. Metzler and
Pelz [23] and Chen et al. [24] present the design for new types of draft tube to restrain transient
pressure pulsation. Zhang et al. [25] and Bozorgi et al. [26] have conducted a series of experiments
1 2 3 4 5 6 7 8 9 10 11 12 13 14 15 16 17 18 19 20 21 22 23 24 25 26 27 28 29 30 31 32 33 34 35 36 37 38 39 40 41 42 43 44 45 46 47 48 49 50 51 52 53 54 55 56 57 58 59 60 61 62 63 64 65
4
to explore the method of pressure reduction in the pipe system. With regard to transient stability of
mechanical subsystem, Wu et al. [27] has proposed a dynamic shaft model of the HGS to
numerically assess the vibration mechanisms. Valentin et al. [28] has employed Finite Element
Method (FEM) aiming at investigating the relationship between the instability of Francis turbines
and the power swings in part load and over-load conditions. Presas et al. [29] and Egusquiza et al.
[30] present methods in which sensors are utilized to monitor the vibration and swing of mechanical
components of the HGS. With respect to the transient stability of electrical subsystem, a number of
researches have focused on the investigation of the characteristics of electromagnetic vibrations in
hydropower generators [31, 32]. Xu et al. [33] introduce the fractional order theory to study the
influence of field current on the stability of hydropower generator in a small grid-connected transient
process. Rajagopal and Singh [34] present a voltage and frequency controller of the isolated
hydropower system to cope with load disturbances. Damdoum et al. [35] provide a low voltage
ride-through strategy of hydropower generator to cope with grid fault transient process. Bitew et al.
[36] design the droop-fed controller of hydropower system to control the grid-connected frequency
and voltage stability of the multi-energy integrated power system. In summary, comparing the
isolated hydropower generation, the integrated power system has an obvious electrical instability
problem. In practice, HGS operation management is associated with unique challenges in terms of
efficiency improvements, fault prevention and maintenance planning [37, 38]. Hence, the safety
assessment of HGSs, especially in transient processes, must be a prioritized task not only in
hydropower industry but also within the research community.
On the other hand, recent researches on HGS within the dynamic/static safety assessment
contexts can fall into five major categories: (i) Numerical simulations of the HGS hydro-mechanical

1 2 3 4 5 6 7 8 9 10 11 12 13 14 15 16 17 18 19 20 21 22 23 24 25 26 27 28 29 30 31 32 33 34 35 36 37 38 39 40 41 42 43 44 45 46 47 48 49 50 51 52 53 54 55 56 57 58 59 60 61 62 63 64 65
5
processes using commercial software (e.g. Computational Fluid Dynamics (CFD) analyses of the
process) [39, 40]. (ii) Diagnosis of HGS components using condition monitoring and fault detection
methods, generally with a Bayesian network and Fault Tree approach [41, 42, 43]. (iii) Empirical
models based on experimental and historical data for safety analysis and operation planning of HGS
[44]. (iv) Mathematical and dynamic models investigating operational properties of HGS and its
subsystems [45, 46]. (v) Intelligence-based methods used to estimate system safety of HGS and
identifying high-risk influential factors, including Fuzzy Evaluation, Entropy-weight Method, Grey
Theory and Analytical Hierarchy Processes [47, 48]. Nevertheless, the proposed approaches in
categories (i) and (ii) assume that the operation of each subsystem is independent of the others,
ignoring the prevalent nonlinearity within the system in transient processes. Further efforts are also
essential to improve the accuracy of empirical methods (iii) since they are greatly reliant on the
reliability of expert judgment. The methods in categories (i) to (iv) have a significant disadvantage of
not being completely supportive for Probabilistic Safety Assessment (PSA) compared to the
intelligent approaches in category (v). Moreover, the existing approaches in category (v) are based on
static HGS, failing to accurately quantify the dynamic risk profile of HGSs in transient processes.
That is, the transient behavior of HGSs herein is attributed to the drastic variations observed in
system indices. Transient safety assessment methods have therefore become a major focus area of
research in this field to successfully evaluate the health condition of HGSs.
Among the intelligence-based methods, fuzzy comprehensive evaluation (FCE) method is a
strong condition assessment approach by means of Fuzzy set theory, which provides a global
evaluation of an uncertain system/operation using multiple internal and/or external factors [49, 50].
For example, Cui et al. [51] have utilized FCE to construct an evaluation framework of virtual water

1 2 3 4 5 6 7 8 9 10 11 12 13 14 15 16 17 18 19 20 21 22 23 24 25 26 27 28 29 30 31 32 33 34 35 36 37 38 39 40 41 42 43 44 45 46 47 48 49 50 51 52 53 54 55 56 57 58 59 60 61 62 63 64 65
6
strategy from the perspective of an integrated water-ecosystem-economy system. Al-Zahrani et al.
[52] established an FCE decision model to identify the vulnerable locations in water distribution
networks. Niu et al. [53] have conducted risk assessment of debris flows in a typical hydropower
station based on FCE method. The entropy-weight method (EWM) is generally used to measure the
variation of system indicators (indices in the case of this paper), which has been widely applied in
various research fields. References [54], [55] and [56] have employed EWM for quantitative
evaluation of the safety problems in hydropower stations, while references [57] and [58] have
investigated the application of EWM in solar, wind and other renewable energy resources. This
method is therefore adopted with an integration to FCE to evaluate the stability of HGS and its safety
levels during transient processes.
In light of the above discussions, the motivating of this research are summarized as: 1) From a
power safety perspective, hydropower is the most effective way to alleviate stability problems in
multi-energy power systems owing to its outstanding advantages of the energy storage and the
regulation capabilities to electrical frequency and peak load. 2) The engineering practice at
hydropower stations usually rely on time-based maintenance to reduce the operational risk of HGSs.
This means that there exists a lack of effective methods to employ experimental and operational data
to reduce the probability of failure occurrence and maximize the benefits of assets in the stations. 3)
With regard to the proposed methodology, the existing safety assessment methods mainly focus on
the management of static data. However, the operational condition of HGSs should frequently
change to cope with different the altering demands of power grid. Thus, to present a dynamic safety
assessment framework aiming at various transient processes has important theoretical significances
and practical values.
1 2 3 4 5 6 7 8 9 10 11 12 13 14 15 16 17 18 19 20 21 22 23 24 25 26 27 28 29 30 31 32 33 34 35 36 37 38 39 40 41 42 43 44 45 46 47 48 49 50 51 52 53 54 55 56 57 58 59 60 61 62 63 64 65
7
The main aim of this paper is to provide a novel framework for safety assessment of nonlinear
HGSs. This framework analyses a highly fluctuating transient processes, consist of system start-up,
shut-down and load rejection realizing the transition from static to dynamic assessment. The novel
components of the proposed methodology include development of an enhanced dynamic
fuzzy-entropy evaluation method, which combines FCE with dynamic entropy-weight method for a)
enabling the assessment of transient processes and b) extending the assessment method to a system
safety level that accounts for the dependencies amongst hydraulic, mechanical and electrical
subsystems of HGS. In the present paper, the stability indices of hydraulic subsystem include the
inlet pressure of spiral casing, the pressure of head cover and the inlet pressure of draft pipe. The
indices of mechanical subsystem include the swing of upper, lower and hydraulic guide bearings, the
vibration of upper and lower brackets, the vibration of stator frame and the vibration of head cover.
The indices of hydraulic and mechanical subsystems are measured by the dynamic balance test. The
indices of electrical subsystem mainly involve the field current, the voltage and current of generator,
and these indices are checked by the running-in and no-load tests (for details see Appendix 3). The
other novelty is achieved by presenting several recommendations for risk mitigation and
maintenance amendment strategies corresponding to the studied HGS. This assists in improving the
dynamic stability as well as to reduce the financial loss due to operation downtime or inefficient
maintenance used in the management of hydropower stations. It should be noted that the dynamic
FCE method presented in this paper is not merely useful for investigation of HGS’s safety, but can be
readily applied to other nonlinear complex systems such as the marine drilling platform and the
wind/solar/pumped-storage hybrid system.
The remainder of the paper is structured as follows. In Section 2 the transient characteristics of

1 2 3 4 5 6 7 8 9 10 11 12 13 14 15 16 17 18 19 20 21 22 23 24 25 26 27 28 29 30 31 32 33 34 35 36 37 38 39 40 41 42 43 44 45 46 47 48 49 50 51 52 53 54 55 56 57 58 59 60 61 62 63 64 65
8
a universal nonlinear HGS are described. In Section 3 an enhanced dynamic comprehensive
fuzzy-entropy evaluation method and an overview of the global methodology for safety assessment
of HGS are provided. Section 4 discusses the details of the conducted dynamic balance experiment
on the studied station’s HGS. Section 5 demonstrates the process of safety assessment methodology
and presents the highlighted results and safety improvement recommendations. The key findings of
this study are discussed in the conclusion section (i.e. Section 6).
Table 1 Nomenclature of the hydroelectric generation system in safety assessment.
Symbol Quantity
At Comprehensive fuzzy-entropy matrix at time t
Amax|t=t Adaptive safety level of HGS at time t
Ac Modified set of safety levels
Aa Adaptive set of safety levels
bt Guide vane height, m
F Runner outlet area, m2
H Hydro-turbine head, m
Hi(t) Entropy value of index i at time t
m Assessment indices
N Hydro-turbine rotational speed, rad/s
n Safety levels
Q Hydro-turbine discharge, m3/s
Rt_ij Fuzzy relationship matrix
r0 Runner intermediate flow surface radius, m
rij(t) Normalization set of inverse index at time t
U Assessment index set
V Set of safety levels
W(t) Entropy weight set of m indices at time t
w(t) Entropy weight of indices at time t
xij(t) Actual assessment index at time t
y Guide vane opening angle, rad
α Guide vane discharge angle, rad
β0 Runner intermediate flow surface angle, rad
λ Intermediate variable
μ(μs) Fuzzy membership functions with respect to Stable safety level
μ(μb) Fuzzy membership functions with respect to Unstable safety level
μ(μp) Fuzzy membership functions with respect to Unacceptable safety level
ω Generator rotor speed, rad/s

1 2 3 4 5 6 7 8 9 10 11 12 13 14 15 16 17 18 19 20 21 22 23 24 25 26 27 28 29 30 31 32 33 34 35 36 37 38 39 40 41 42 43 44 45 46 47 48 49 50 51 52 53 54 55 56 57 58 59 60 61 62 63 64 65
9
2. Transient Characteristics of HGS
HGSs efficiently use the hydropower to generate electricity and transmit it to the power grid.
Their operation includes both steady-state and transient processes for which it is greatly important to
perform safety assessments. A universal HGS is composed of a reservoir, piping systems, a surge
tank, a hydro-turbine, a generator and the control system, as illustrated in Fig. 2.
Turbine
Head Water Surge Tank
Tail Water
Penstock L1 Penstock L2
Penstock L3
Power Grid
Control
Center
interaction
Hydroelectric
Generation Unit
Fig. 2 Schematic of a HGS.
In this paper, we focus on the risk assessment of start-up transient process since it is one of the
most repeated processes during HGS operational time. During the start-up transient process, the
opening of guide vane increases following the law in Fig. 3. This results in a pressure pulsation of
the flow in pipes and also a considerable increase in turbine torque, which greatly influences the rate
of component deterioration accelerating HGS failure.
The dynamic characteristics of HGS in the start-up process is expressed by hydro-turbine torque,
Mt, and the hydro-turbine discharge Q, given by Eq. (1):
( , , )
( , , )
t tM M H N y
Q Q H N y
, (1)
where H , N and y denote the hydro-turbine head, the hydro-turbine rotational speed and the
opening of guide vane, respectively.
1 2 3 4 5 6 7 8 9 10 11 12 13 14 15 16 17 18 19 20 21 22 23 24 25 26 27 28 29 30 31 32 33 34 35 36 37 38 39 40 41 42 43 44 45 46 47 48 49 50 51 52 53 54 55 56 57 58 59 60 61 62 63 64 65
10
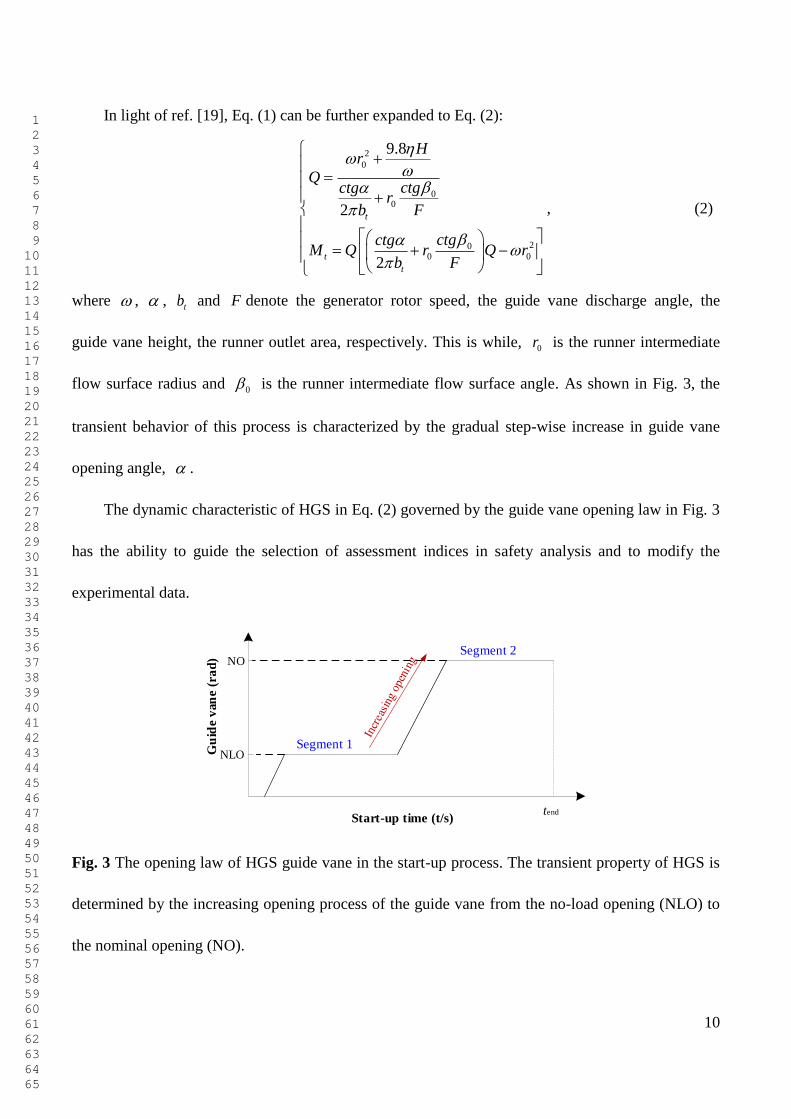
In light of ref. [19], Eq. (1) can be further expanded to Eq. (2):
2
0
00
200 0
9.8
2
2
t
t
t
Hr
Qctgctg
rb F
ctgctgM Q r Q r
b F
, (2)
where , , tb and F denote the generator rotor speed, the guide vane discharge angle, the
guide vane height, the runner outlet area, respectively. This is while, 0r is the runner intermediate
flow surface radius and 0 is the runner intermediate flow surface angle. As shown in Fig. 3, the
transient behavior of this process is characterized by the gradual step-wise increase in guide vane
opening angle, .
The dynamic characteristic of HGS in Eq. (2) governed by the guide vane opening law in Fig. 3
has the ability to guide the selection of assessment indices in safety analysis and to modify the
experimental data.
Start-up time (t/s)
Gu
ide v
an
e (
ra
d)
NLO
NO
Segment 1
Segment 2
tend
Fig. 3 The opening law of HGS guide vane in the start-up process. The transient property of HGS is
determined by the increasing opening process of the guide vane from the no-load opening (NLO) to
the nominal opening (NO).
1 2 3 4 5 6 7 8 9 10 11 12 13 14 15 16 17 18 19 20 21 22 23 24 25 26 27 28 29 30 31 32 33 34 35 36 37 38 39 40 41 42 43 44 45 46 47 48 49 50 51 52 53 54 55 56 57 58 59 60 61 62 63 64 65
11
3. Developed Methodology
This paper presents a novel methodology for safety assessment of HGS experiencing largely
fluctuating processes based on an enhanced dynamic fuzzy-entropy evaluation approach. The new
method effectively overcomes the shortcomings of conventional approaches which are mostly static
performance estimations. Also, its implementation is advantageous to operations management for
risk mitigation and maintenance scheduling amendments at hydropower stations.
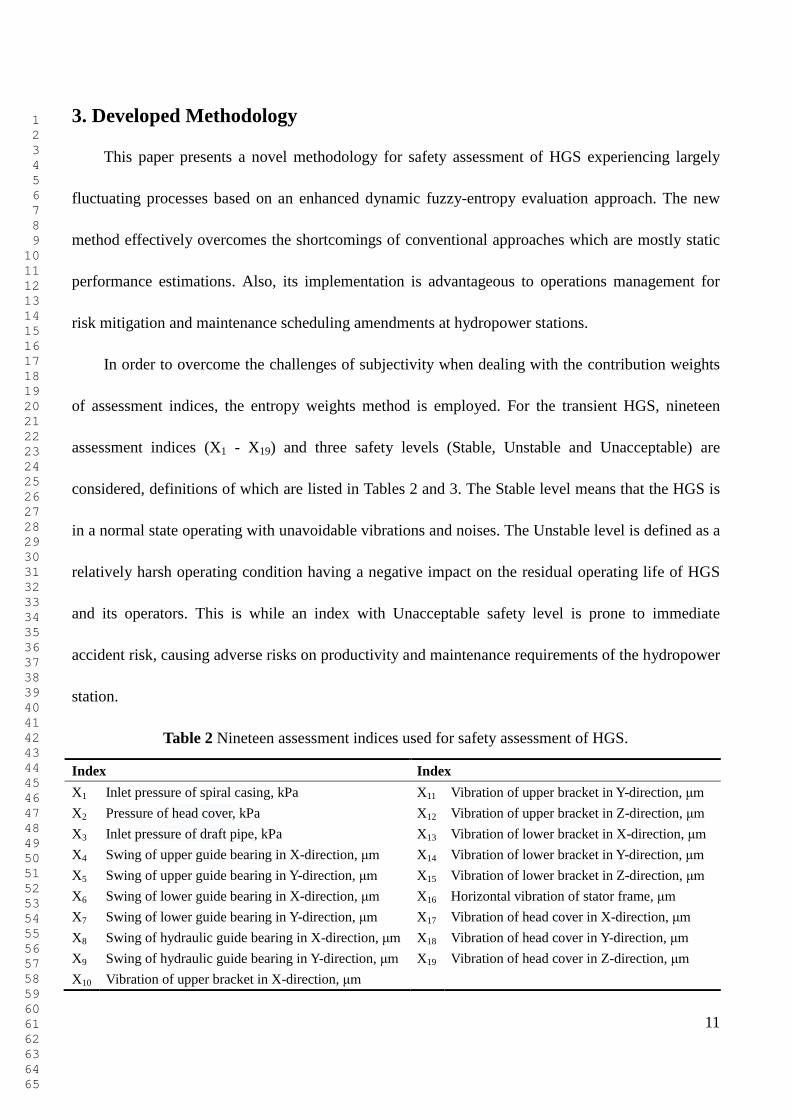
In order to overcome the challenges of subjectivity when dealing with the contribution weights
of assessment indices, the entropy weights method is employed. For the transient HGS, nineteen
assessment indices (X1 - X19) and three safety levels (Stable, Unstable and Unacceptable) are
considered, definitions of which are listed in Tables 2 and 3. The Stable level means that the HGS is
in a normal state operating with unavoidable vibrations and noises. The Unstable level is defined as a
relatively harsh operating condition having a negative impact on the residual operating life of HGS
and its operators. This is while an index with Unacceptable safety level is prone to immediate
accident risk, causing adverse risks on productivity and maintenance requirements of the hydropower
station.
Table 2 Nineteen assessment indices used for safety assessment of HGS.
Index Index
X1 Inlet pressure of spiral casing, kPa X11 Vibration of upper bracket in Y-direction, μm
X2 Pressure of head cover, kPa X12 Vibration of upper bracket in Z-direction, μm
X3 Inlet pressure of draft pipe, kPa X13 Vibration of lower bracket in X-direction, μm
X4 Swing of upper guide bearing in X-direction, μm X14 Vibration of lower bracket in Y-direction, μm
X5 Swing of upper guide bearing in Y-direction, μm X15 Vibration of lower bracket in Z-direction, μm
X6 Swing of lower guide bearing in X-direction, μm X16 Horizontal vibration of stator frame, μm
X7 Swing of lower guide bearing in Y-direction, μm X17 Vibration of head cover in X-direction, μm
X8 Swing of hydraulic guide bearing in X-direction, μm X18 Vibration of head cover in Y-direction, μm
X9 Swing of hydraulic guide bearing in Y-direction, μm X19 Vibration of head cover in Z-direction, μm
X10 Vibration of upper bracket in X-direction, μm

1 2 3 4 5 6 7 8 9 10 11 12 13 14 15 16 17 18 19 20 21 22 23 24 25 26 27 28 29 30 31 32 33 34 35 36 37 38 39 40 41 42 43 44 45 46 47 48 49 50 51 52 53 54 55 56 57 58 59 60 61 62 63 64 65
12
Table 3 Assessment principles used for safety assessment of HGS.
Safety level (below) \ Index (right)
X1, X2, X3
(kPa)
X4, X5, X6, X7 (μm)
X8, X9 (μm)
X10, X11, X13, X14, X19 (μm)
X12, X15 (μm)
X16 (μm)
X17, X18 (μm)
Stable (S) 0 - 54 0 - 280 0 - 350 0 - 100 0 - 70 0 - 35 0 - 80
Unstable (B) 74 - 108 320 - 460 400 - 525 120 - 200 90 - 140 45 - 70 100 - 160
Unacceptable (P) >108 >500 >575 >220 >160 >80 >180
The corresponding process of safety assessment framework proposed by this paper is as
follows:
(1) Conducting the dynamic balance experiments on the existing hydropower station to obtain
the transient data of HGS (i.e. indices X1 - X19 listed in Table 2). To improve the data reliability,
transient performance results are analyzed of the HGS to identify and eliminate outliers from the
data.
(2) Selecting the multiple monitoring times referring to the transient time between increasing
loads of 10MW, 20MW, 30MW and 130MW. This is performed to collect data from multiple sensors
and the safety properties of HGS are estimated consecutively during the transient process.
(3) Calculating the entropy values of normalized indices at the transient time interval, and
subsequently deducing the corresponding entropy weight set ( )W t based on Eq. (6).
(4) Establishing the assessment indices (X1 - X19 in the case of this paper) and the safety levels
(e.g. Stable, Unstable and Unacceptable in this study) respectively defined as U = {u1, u2, …, um}
and V = {v1, v2, …, vn}. In light of the change rules in Table 1, the fuzzy membership function ( )V
and fuzzy relationship matrix m nR at different times are respectively obtained using Eqs. (7), (8),
and (9).
(5) Creating the fuzzy-entropy matrices at different times, At1 - Atend , obtained as the product of
fuzzy relationship matrix 1 ~( )
endm n t tR and the entropy weight set ( )W t . Using maximum
1 2 3 4 5 6 7 8 9 10 11 12 13 14 15 16 17 18 19 20 21 22 23 24 25 26 27 28 29 30 31 32 33 34 35 36 37 38 39 40 41 42 43 44 45 46 47 48 49 50 51 52 53 54 55 56 57 58 59 60 61 62 63 64 65
13
membership principle to select the adaptive safety levels max| 1 max| 2 max| 1 max|{ , ,..., , }end enda t t t t t tA A A A A .
This is followed by modifying safety levels to B P| 1 B P| 2 B P| 1 B P|{ , ,..., , }end endc t t t t t tA A A A A for more
emphasis on critical states of operation. Following the Steps 1 to 5 yields a visualized assessment of
HGS safety during transient processes.
(6) Based on the obtained results, some useful risk mitigation and maintenance amendment
strategies are suggested to significantly enhance dynamic safety and availability of HGS, and
reducing financial losses in the hydropower station operation.
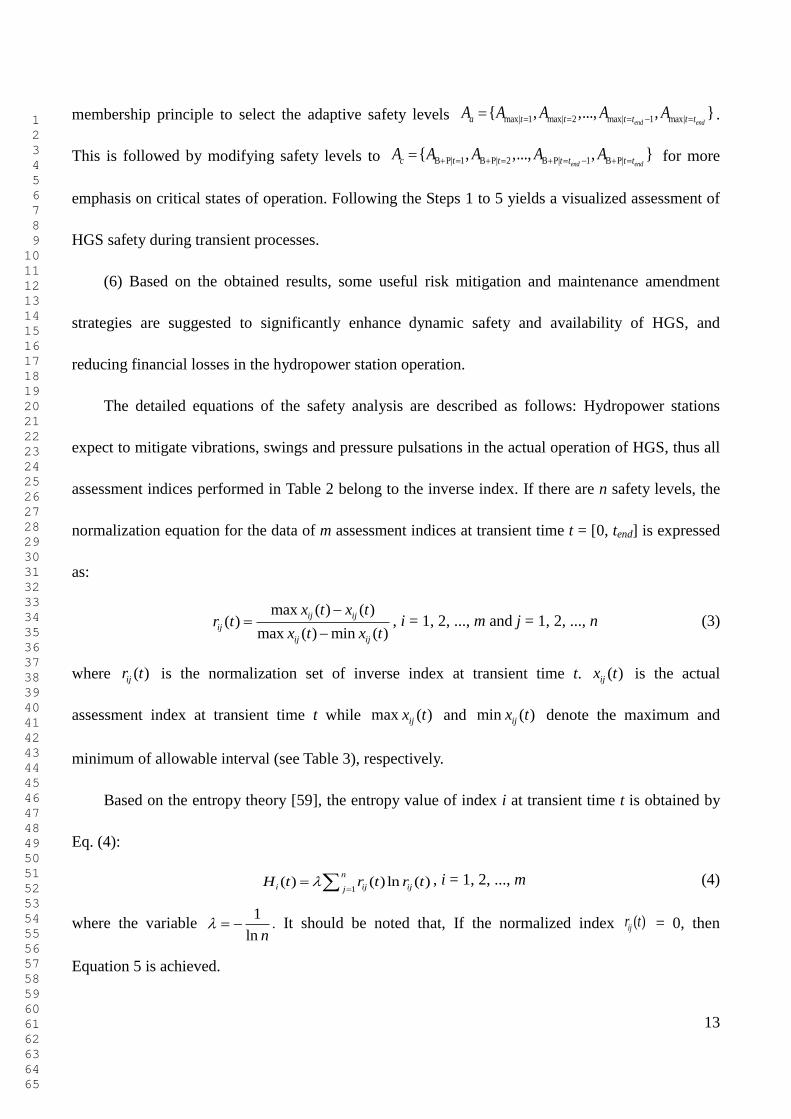
The detailed equations of the safety analysis are described as follows: Hydropower stations
expect to mitigate vibrations, swings and pressure pulsations in the actual operation of HGS, thus all
assessment indices performed in Table 2 belong to the inverse index. If there are n safety levels, the
normalization equation for the data of m assessment indices at transient time t = [0, tend] is expressed
as:
max ( ) ( )( )
max ( ) min ( )
ij ij
ij
ij ij
x t x tr t
x t x t
, i = 1, 2, ..., m and j = 1, 2, ..., n (3)
where ( )ijr t is the normalization set of inverse index at transient time t. ( )ijx t is the actual
assessment index at transient time t while max ( )ijx t and min ( )ijx t denote the maximum and
minimum of allowable interval (see Table 3), respectively.
Based on the entropy theory [59], the entropy value of index i at transient time t is obtained by
Eq. (4):
1( ) ( ) ln ( )
n
i ij ijjH t r t r t
, i = 1, 2, ..., m (4)
where the variable 1
ln n . It should be noted that, If the normalized index ( )ijr t = 0, then
Equation 5 is achieved.

1 2 3 4 5 6 7 8 9 10 11 12 13 14 15 16 17 18 19 20 21 22 23 24 25 26 27 28 29 30 31 32 33 34 35 36 37 38 39 40 41 42 43 44 45 46 47 48 49 50 51 52 53 54 55 56 57 58 59 60 61 62 63 64 65
14
( ) ln ( ) 0ij ijr t r t . (5)
As a result, the entropy weight set of m indices at transient time t, i.e.
1 2( )={ ( ), ( ),..., ( )}mW t w t w t w t , is calculated by Eq. (6).
1
1
1 ( )( )
( )
( )=1
ii m
ii
m
ii
H tw t
m H t
w t
, iw [0, 1]. (6)
Assuming the assessment indices (X1 - X19) is expressed by the set of U = {u1, u2, …, um} and
the safety levels (i.e. Stable-S, Unstable-B and Unacceptable-P) is denoted by the set of V = {v1,
v2, …, vn}. Based on classifications of indices and the change rules listed in Table 3, the fuzzy
membership function of nineteen indices is divided into two types. The shape of fuzzy membership
function of indices (X1, X2) are similar to index X3, and that of indices (X5 - X19) are similar to index
X4. Hence, X3 and X4 are selected as representative examples of fuzzy functions and depicted in Fig.
4.
(a) (b)
Fig. 4 Two examples of fuzzy membership functions for assessment indices of HGS during start-up
transient process. (a) Inlet pressure of draft pipe (Index X3), and (b) Swing of upper guide bearing in
x-direction (Index X4).
1 2 3 4 5 6 7 8 9 10 11 12 13 14 15 16 17 18 19 20 21 22 23 24 25 26 27 28 29 30 31 32 33 34 35 36 37 38 39 40 41 42 43 44 45 46 47 48 49 50 51 52 53 54 55 56 57 58 59 60 61 62 63 64 65
15
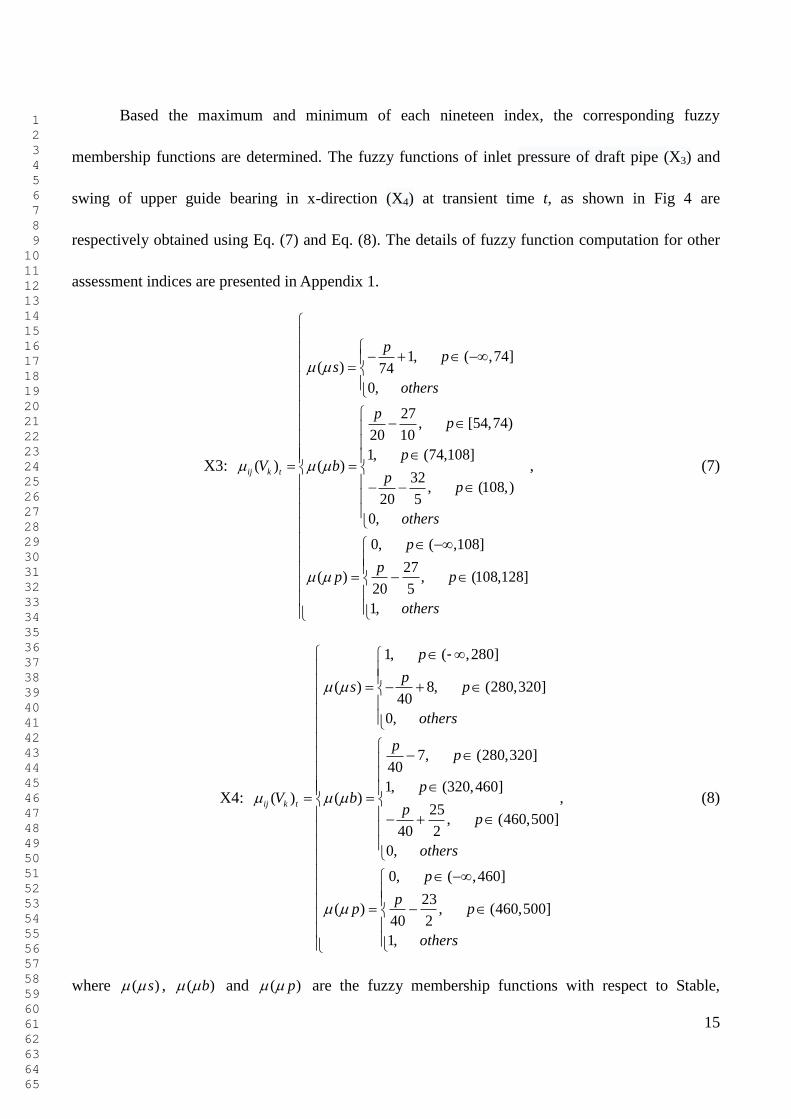
Based the maximum and minimum of each nineteen index, the corresponding fuzzy
membership functions are determined. The fuzzy functions of inlet pressure of draft pipe (X3) and
swing of upper guide bearing in x-direction (X4) at transient time t, as shown in Fig 4 are
respectively obtained using Eq. (7) and Eq. (8). The details of fuzzy function computation for other
assessment indices are presented in Appendix 1.
X3:
1, ( ,74]( ) 74
0,
27, [54,74)
20 10
1, (74,108]( ) ( )
32, (108,)
20 5
0,
0, ( ,108]
27( ) , (108,128]
20 5
1,
ij k t
pp
s
others
pp
pV b
pp
others
p
pp p
others
, (7)
X4:
1, ( ,280]
( ) 8, (280,320]40
0,
7, (280,320]40
1, (320,460]( ) ( )
25, (460,500]
40 2
0,
0, ( ,460]
23( ) , (460,500]
40 2
1,
ij k t
p
ps p
others
pp
pV b
pp
others
p
pp p
others
-
,
(8)
where ( )s , ( )b and ( )p are the fuzzy membership functions with respect to Stable,
1 2 3 4 5 6 7 8 9 10 11 12 13 14 15 16 17 18 19 20 21 22 23 24 25 26 27 28 29 30 31 32 33 34 35 36 37 38 39 40 41 42 43 44 45 46 47 48 49 50 51 52 53 54 55 56 57 58 59 60 61 62 63 64 65
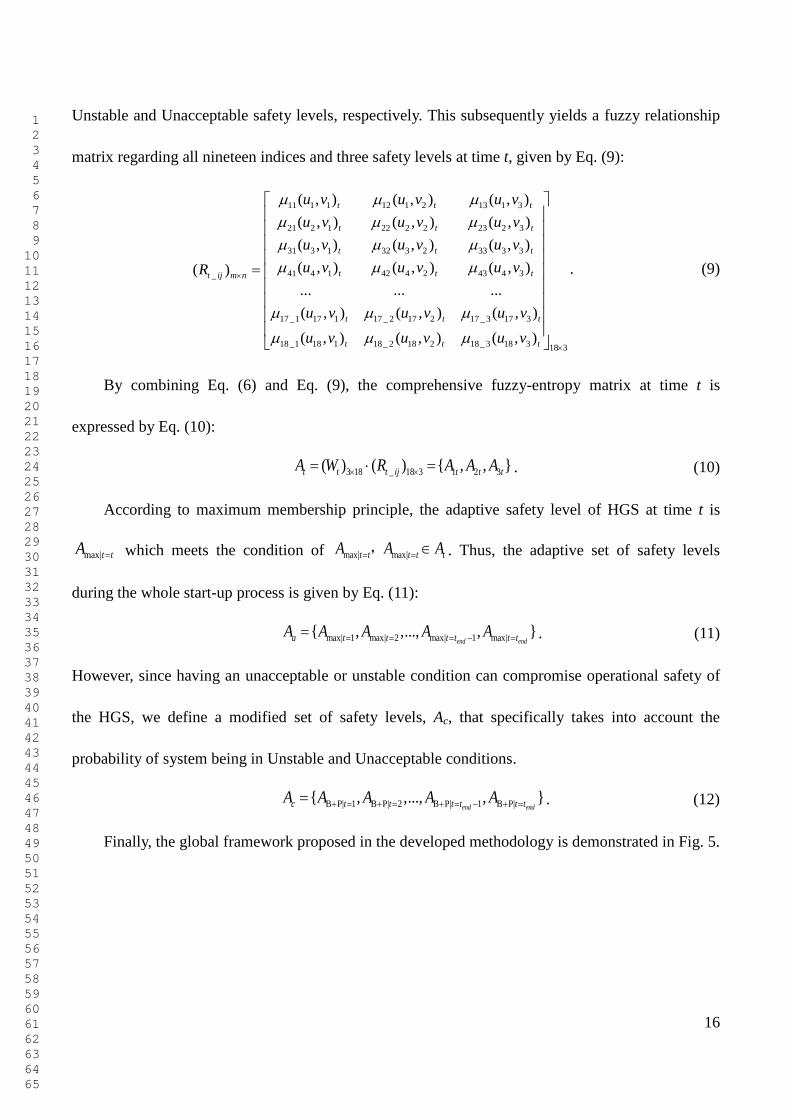
16
Unstable and Unacceptable safety levels, respectively. This subsequently yields a fuzzy relationship
matrix regarding all nineteen indices and three safety levels at time t, given by Eq. (9):
11 1 1 12 1 2 13 1 3
21 2 1 22 2 2 23 2 3
31 3 1 32 3 2 33 3 3
41 4 1 42 4 2 43 4 3_
17 _1 17 1 17 _ 2 17 2
18_1 18 1 18_ 2 18
( , ) ( , ) ( , )
( , ) ( , ) ( , )
( , ) ( , ) ( , )
( , ) ( , ) ( , )( )
... ...
( , ) ( , )
( , ) (
t t t
t t t
t t t
t t tt ij m n
t t
t
u v u v u v
u v u v u v
u v u v u v
u v u v u vR
u v u v
u v u
17 _ 3 17 3
2 18_ 3 18 3 18 3
...
( , )
, ) ( , )
t
t t
u v
v u v
. (9)
By combining Eq. (6) and Eq. (9), the comprehensive fuzzy-entropy matrix at time t is
expressed by Eq. (10):
3 18 _ 18 3 1 2 3( ) ( ) { , , }t t t ij t t tA W R A A A . (10)
According to maximum membership principle, the adaptive safety level of HGS at time t is
max|t tA which meets the condition of max| max|t t t t tA A A , . Thus, the adaptive set of safety levels
during the whole start-up process is given by Eq. (11):
max| 1 max| 2 max| 1 max|{ , ,..., , }end enda t t t t t tA A A A A . (11)
However, since having an unacceptable or unstable condition can compromise operational safety of
the HGS, we define a modified set of safety levels, Ac, that specifically takes into account the
probability of system being in Unstable and Unacceptable conditions.
B P| 1 B P| 2 B P| 1 B P|{ , ,..., , }end endc t t t t t tA A A A A . (12)
Finally, the global framework proposed in the developed methodology is demonstrated in Fig. 5.

1 2 3 4 5 6 7 8 9 10 11 12 13 14 15 16 17 18 19 20 21 22 23 24 25 26 27 28 29 30 31 32 33 34 35 36 37 38 39 40 41 42 43 44 45 46 47 48 49 50 51 52 53 54 55 56 57 58 59 60 61 62 63 64 65
17
Transient characteristics analysis of hydroelectric generating system in start-up process
Dynamic balance experiment to obtain data information of assessment indices
Select transient data of assessment indices at time t, t=[0 s, tend s]
Determine assessment indices set
U=(u1, u2, , ui, , um) and change rules of indices
Classify safety levels of assessment indices
V=(v1, v2, , vj, , vn)
Create fuzzy membership matrixμ(U)
Establish fuzzy relationship assessment matrix Rt m×n
Normalization for all selected data of assessment
indices at transient time t
Calculate entropy value of assessment index i
(i+1, m)
Obtain entropy weight set of all assessment
indices Wt=(w1, w2, , wi, wm)
Calculate fuzzy-entropy comprehensive assessment matrix at time t, At=Rt m×n ·Wt=(A1t, A2t, , Ajt, , Ant)
time t=t+1
Maximum membership principle to select set of safety levels from t=0 to t=tend, i.e. Af =(Amax|t=1,
Amax|t=2, , Amax|t=tend )
Dynamic safety results visualization
Recommendation of risk mitigation and amended maintenance strategies
START
END
Fuzzy Entropy
Calculate the modified set of safety levels Ac=(AB+P|t=1, AB+P|t=2, AB+P|t=tend)
time t=tend
Fig. 5 Global framework for dynamic safety assessment of HGS.
4. Physical Experiments
4.1 Dynamic balance tests
In order to eliminate the stability problems associated with generator and excitation systems, the
running-in and no-load tests are conducted in prior to the dynamic balance test. The results of
running-in test demonstrate that the generator rotates normally, with no indication of mechanical
1 2 3 4 5 6 7 8 9 10 11 12 13 14 15 16 17 18 19 20 21 22 23 24 25 26 27 28 29 30 31 32 33 34 35 36 37 38 39 40 41 42 43 44 45 46 47 48 49 50 51 52 53 54 55 56 57 58 59 60 61 62 63 64 65
18
transmission problems. The no-load test shows that the measured current and power accord with the
corresponding characteristic curves. However, it observes significant vibrations and water pressures
of indices in the 100%ne running-in test and 100%Ue no-load test (for details see Appendix 3). This
is why the dynamic balance test is following carried out and becomes the safety focus of this paper.
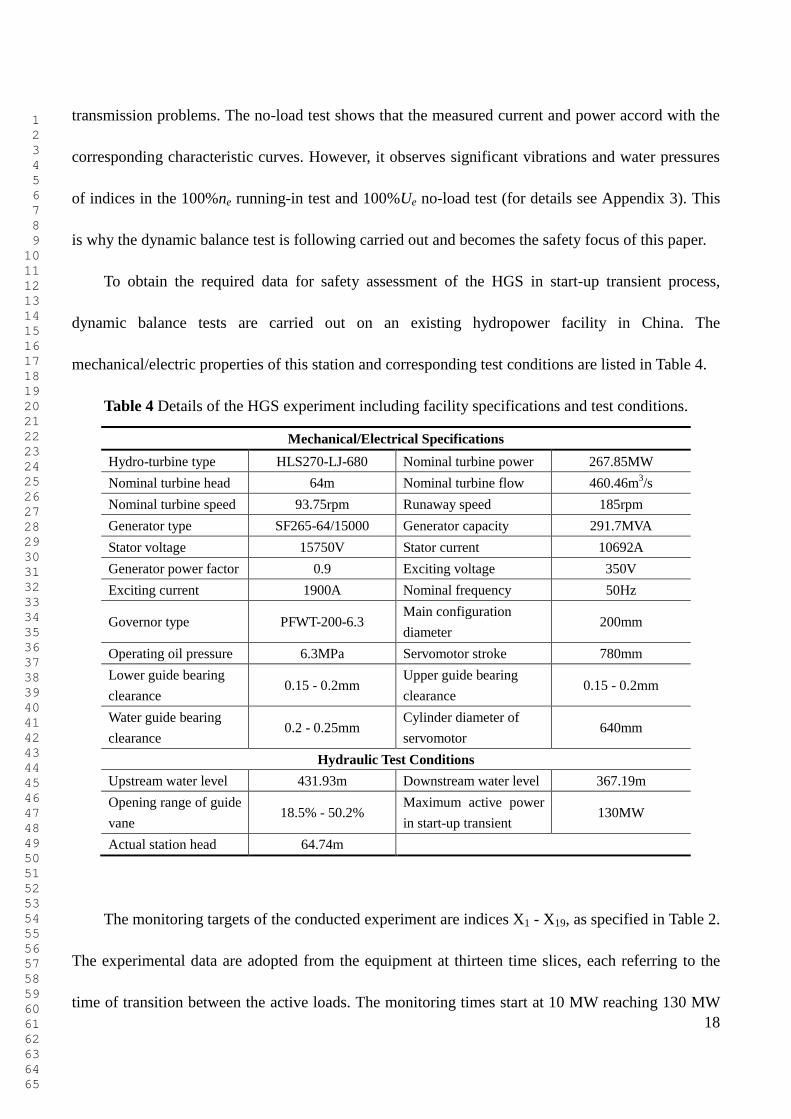
To obtain the required data for safety assessment of the HGS in start-up transient process,
dynamic balance tests are carried out on an existing hydropower facility in China. The
mechanical/electric properties of this station and corresponding test conditions are listed in Table 4.
Table 4 Details of the HGS experiment including facility specifications and test conditions.
Mechanical/Electrical Specifications
Hydro-turbine type HLS270-LJ-680 Nominal turbine power 267.85MW
Nominal turbine head 64m Nominal turbine flow 460.46m3/s
Nominal turbine speed 93.75rpm Runaway speed 185rpm
Generator type SF265-64/15000 Generator capacity 291.7MVA
Stator voltage 15750V Stator current 10692A
Generator power factor 0.9 Exciting voltage 350V
Exciting current 1900A Nominal frequency 50Hz
Governor type PFWT-200-6.3 Main configuration
diameter 200mm
Operating oil pressure 6.3MPa Servomotor stroke 780mm
Lower guide bearing
clearance 0.15 - 0.2mm
Upper guide bearing
clearance 0.15 - 0.2mm
Water guide bearing
clearance 0.2 - 0.25mm
Cylinder diameter of
servomotor 640mm
Hydraulic Test Conditions
Upstream water level 431.93m Downstream water level 367.19m
Opening range of guide
vane 18.5% - 50.2%
Maximum active power
in start-up transient 130MW
Actual station head 64.74m
The monitoring targets of the conducted experiment are indices X1 - X19, as specified in Table 2.
The experimental data are adopted from the equipment at thirteen time slices, each referring to the
time of transition between the active loads. The monitoring times start at 10 MW reaching 130 MW
1 2 3 4 5 6 7 8 9 10 11 12 13 14 15 16 17 18 19 20 21 22 23 24 25 26 27 28 29 30 31 32 33 34 35 36 37 38 39 40 41 42 43 44 45 46 47 48 49 50 51 52 53 54 55 56 57 58 59 60 61 62 63 64 65
19
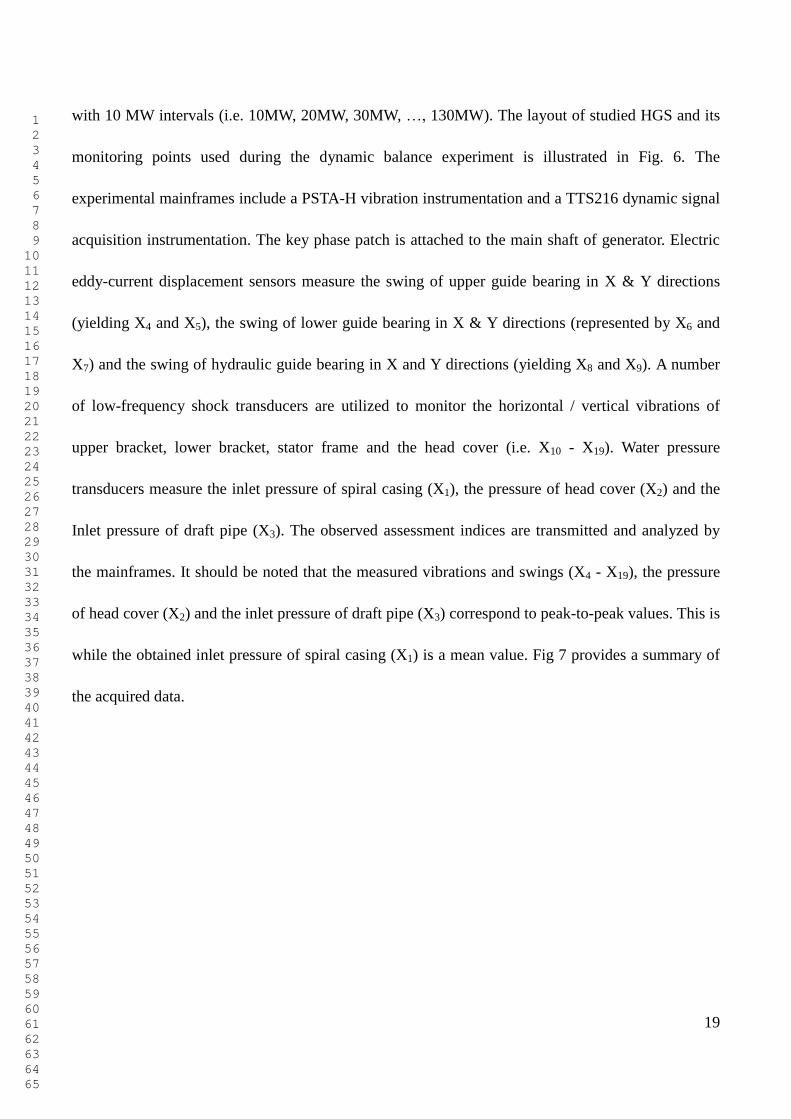
with 10 MW intervals (i.e. 10MW, 20MW, 30MW, …, 130MW). The layout of studied HGS and its
monitoring points used during the dynamic balance experiment is illustrated in Fig. 6. The
experimental mainframes include a PSTA-H vibration instrumentation and a TTS216 dynamic signal
acquisition instrumentation. The key phase patch is attached to the main shaft of generator. Electric
eddy-current displacement sensors measure the swing of upper guide bearing in X & Y directions
(yielding X4 and X5), the swing of lower guide bearing in X & Y directions (represented by X6 and
X7) and the swing of hydraulic guide bearing in X and Y directions (yielding X8 and X9). A number
of low-frequency shock transducers are utilized to monitor the horizontal / vertical vibrations of
upper bracket, lower bracket, stator frame and the head cover (i.e. X10 - X19). Water pressure
transducers measure the inlet pressure of spiral casing (X1), the pressure of head cover (X2) and the
Inlet pressure of draft pipe (X3). The observed assessment indices are transmitted and analyzed by
the mainframes. It should be noted that the measured vibrations and swings (X4 - X19), the pressure
of head cover (X2) and the inlet pressure of draft pipe (X3) correspond to peak-to-peak values. This is
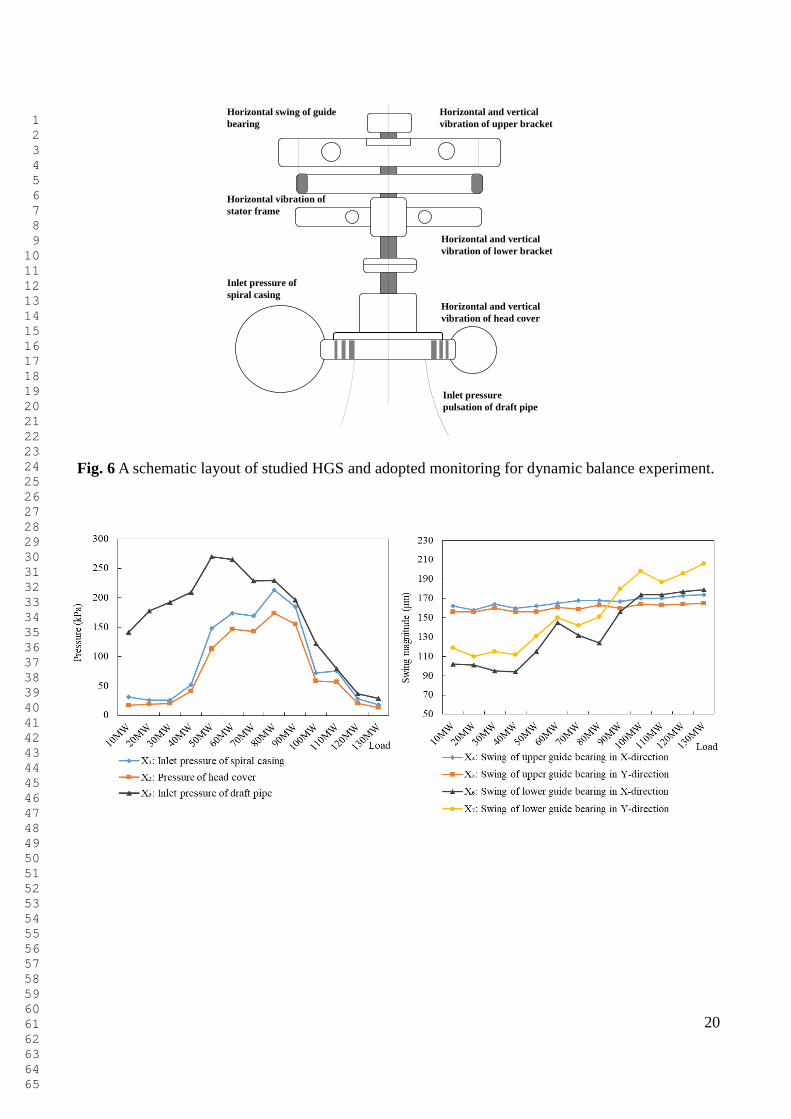
while the obtained inlet pressure of spiral casing (X1) is a mean value. Fig 7 provides a summary of
the acquired data.
1 2 3 4 5 6 7 8 9 10 11 12 13 14 15 16 17 18 19 20 21 22 23 24 25 26 27 28 29 30 31 32 33 34 35 36 37 38 39 40 41 42 43 44 45 46 47 48 49 50 51 52 53 54 55 56 57 58 59 60 61 62 63 64 65
20
Horizontal swing of guide
bearing
Horizontal and vertical
vibration of upper bracket
Horizontal and vertical
vibration of lower bracket
Horizontal and vertical
vibration of head cover
Inlet pressure
pulsation of draft pipe
Inlet pressure of
spiral casing
Horizontal vibration of
stator frame
Fig. 6 A schematic layout of studied HGS and adopted monitoring for dynamic balance experiment.
1 2 3 4 5 6 7 8 9 10 11 12 13 14 15 16 17 18 19 20 21 22 23 24 25 26 27 28 29 30 31 32 33 34 35 36 37 38 39 40 41 42 43 44 45 46 47 48 49 50 51 52 53 54 55 56 57 58 59 60 61 62 63 64 65
21
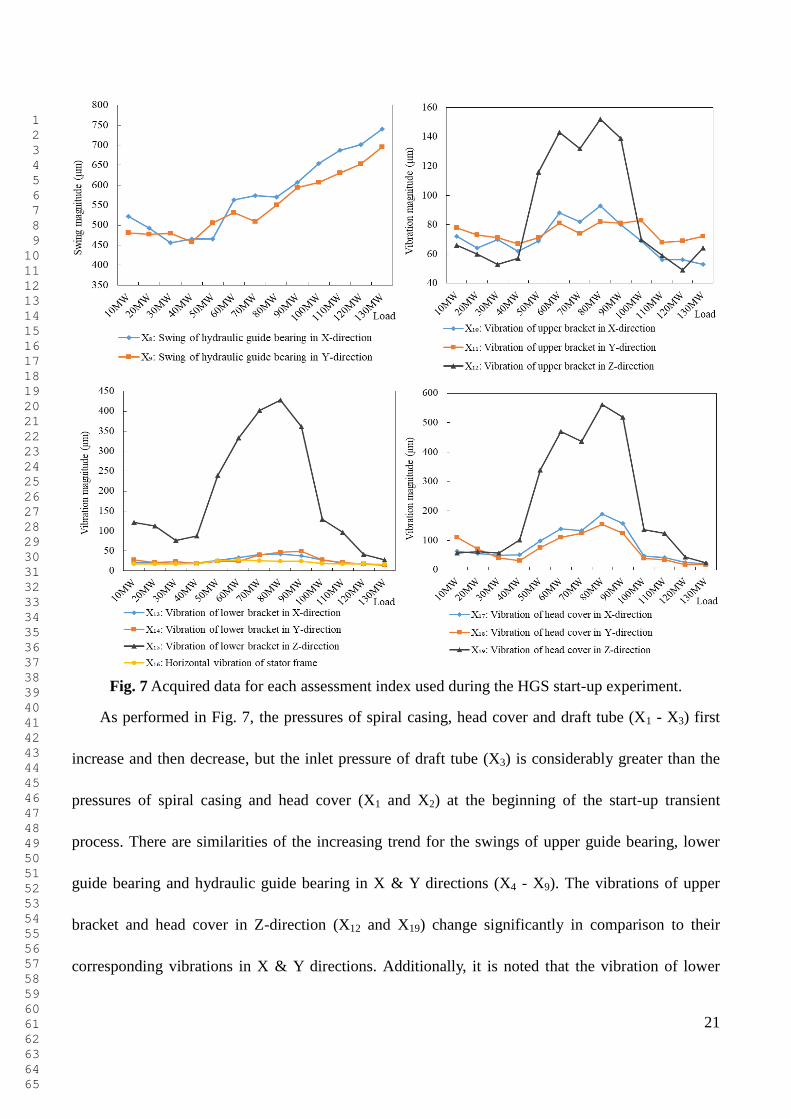
Fig. 7 Acquired data for each assessment index used during the HGS start-up experiment.
As performed in Fig. 7, the pressures of spiral casing, head cover and draft tube (X1 - X3) first
increase and then decrease, but the inlet pressure of draft tube (X3) is considerably greater than the
pressures of spiral casing and head cover (X1 and X2) at the beginning of the start-up transient
process. There are similarities of the increasing trend for the swings of upper guide bearing, lower
guide bearing and hydraulic guide bearing in X & Y directions (X4 - X9). The vibrations of upper
bracket and head cover in Z-direction (X12 and X19) change significantly in comparison to their
corresponding vibrations in X & Y directions. Additionally, it is noted that the vibration of lower

1 2 3 4 5 6 7 8 9 10 11 12 13 14 15 16 17 18 19 20 21 22 23 24 25 26 27 28 29 30 31 32 33 34 35 36 37 38 39 40 41 42 43 44 45 46 47 48 49 50 51 52 53 54 55 56 57 58 59 60 61 62 63 64 65
22
bracket in Z-direction (X15) shows a tremendous fluctuation compared with the relevant vibrations in
X & Y directions.
4.2 Preliminary data analysis
From the experimental results, shown in Fig. 7, it is found that some indices exceed the
allowable operating ranges recommended by Li et al. [60]. Specifically, the peak values from swing
of hydraulic guide bearing in X direction (X8) and swing of hydraulic guide bearing in Y direction
(X9) are approximately 710μm and 653μm, respectively. This is almost more than double when
compared to the allowable operating value of 300μm. The measured inlet pressure of draft pipe (X3)
reaches the maximum of 269.5kPa, which is significantly greater than the allowable operational limit
of 64kPa. Moreover, the instability issues are also observed in the inlet pressure of spiral casing (X1),
the vibration of upper bracket in Z direction (X12), the vibration of lower bracket in Z-direction (X15)
and the vibration of head cover in X, Y and Z direction (X17, X18 and X19). In addition, the
qualitative result shows that the high-risk load domain is roughly at (40MW, 90MW) since the
critical indices change dramatically during this range.
This analysis provides a brief insight into the extent of operational safety, though it is required
to investigate this in more depth so that recommendations for safety improvements can be made
available to operators and risk managers. This is due to the fact that many of the indices exceed their
maximum allowable values making it difficult to prioritize where the resources must be spent on to
mitigate risk. Additionally, the complex characteristic arisen from internal couplings among indices
cannot be neglected. For example, a small change in one index may lead to a dramatic variation of
multiple indices resulting in inherently different operational characteristics. Therefore, to address the
1 2 3 4 5 6 7 8 9 10 11 12 13 14 15 16 17 18 19 20 21 22 23 24 25 26 27 28 29 30 31 32 33 34 35 36 37 38 39 40 41 42 43 44 45 46 47 48 49 50 51 52 53 54 55 56 57 58 59 60 61 62 63 64 65
23
problems of the drastic vibrations, swings and fluctuations, it is essential to conduct a thorough
evaluation to better understand the dynamic behavior of the HGS and to control the dominant indices
for determination of the operational risk. That is, the main goals of the preliminary data analysis
include: (a) making an overall judgment about the HGS operational state, as well as providing the
required input for conducting a precise quantitative risk assessment of HGS operation.
5. Dynamic Safety Analysis
This section aims at quantitatively analyzing the safety levels of HGS using a probabilistic
approach. To determine the risk profile of HGS, the fuzzy-entropy weights of indices are computed
during the transition of full load domain (i.e. 10MW - 130MW). The risk associated with HGS is
computed based on the adaptive set Aa and the modified set Ac, as explained in Section 3. Based on
the analysis results, several risk mitigation strategies and maintenance amendment suggestions are
presented to improve the operation of HGS and to increase the asset efficiency in hydropower
stations.
5.1 HGS risk profile
To evaluate the effect of assessment indices on operational performance of the HGS at the
start-up process, the corresponding quantized weight contributions of the nineteen assessment indices
are plotted against the load conditions in Fig. 8.
1 2 3 4 5 6 7 8 9 10 11 12 13 14 15 16 17 18 19 20 21 22 23 24 25 26 27 28 29 30 31 32 33 34 35 36 37 38 39 40 41 42 43 44 45 46 47 48 49 50 51 52 53 54 55 56 57 58 59 60 61 62 63 64 65
24
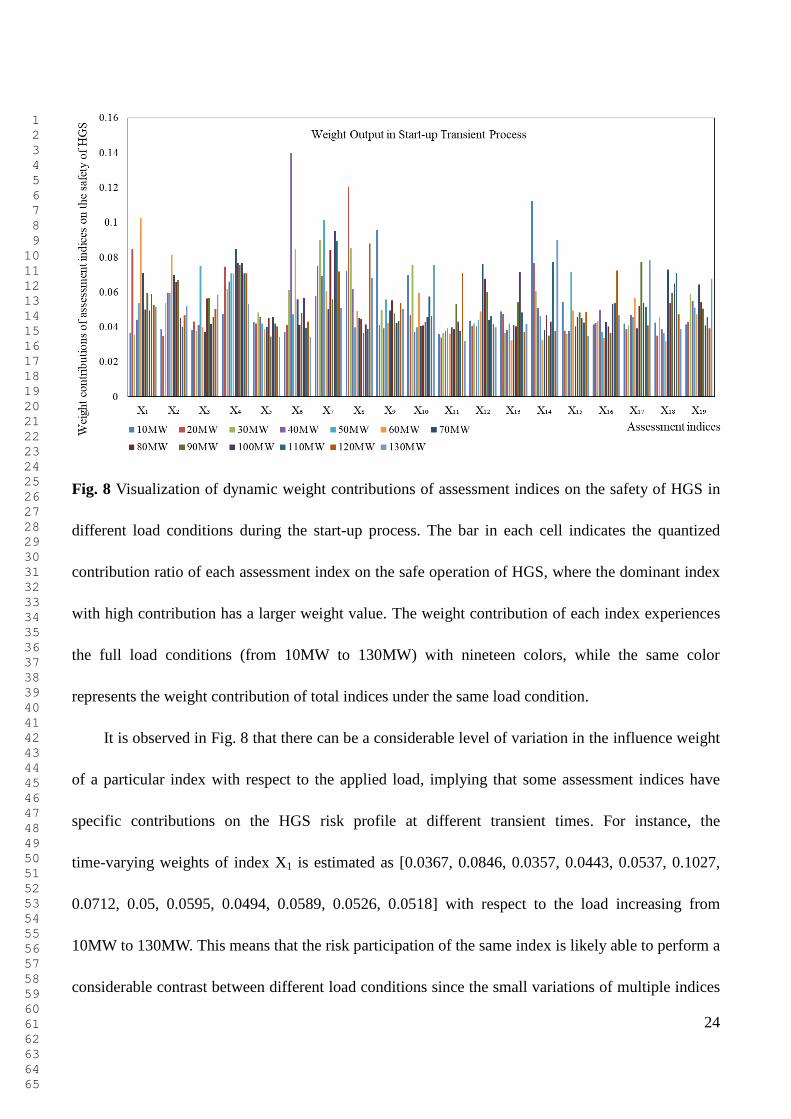
Fig. 8 Visualization of dynamic weight contributions of assessment indices on the safety of HGS in
different load conditions during the start-up process. The bar in each cell indicates the quantized
contribution ratio of each assessment index on the safe operation of HGS, where the dominant index
with high contribution has a larger weight value. The weight contribution of each index experiences
the full load conditions (from 10MW to 130MW) with nineteen colors, while the same color
represents the weight contribution of total indices under the same load condition.
It is observed in Fig. 8 that there can be a considerable level of variation in the influence weight
of a particular index with respect to the applied load, implying that some assessment indices have
specific contributions on the HGS risk profile at different transient times. For instance, the
time-varying weights of index X1 is estimated as [0.0367, 0.0846, 0.0357, 0.0443, 0.0537, 0.1027,
0.0712, 0.05, 0.0595, 0.0494, 0.0589, 0.0526, 0.0518] with respect to the load increasing from
10MW to 130MW. This means that the risk participation of the same index is likely able to perform a
considerable contrast between different load conditions since the small variations of multiple indices
1 2 3 4 5 6 7 8 9 10 11 12 13 14 15 16 17 18 19 20 21 22 23 24 25 26 27 28 29 30 31 32 33 34 35 36 37 38 39 40 41 42 43 44 45 46 47 48 49 50 51 52 53 54 55 56 57 58 59 60 61 62 63 64 65
25
may lead to a dramatic change of the studied index. Moreover, the indices (X1 - X19) are formed a
relation to influence and to condition each other in the same load condition. This means that the
dominant indices that the risk participation is extremely high in comparison to other indices have the
more distinct sensitivity to the stability of HGS at each load condition. From the obtained weight
contributions of indices, it is easily concluded that the most critical indices with major risk
contributions include the inlet pressure of spiral casing (X1), swing of lower guide bearing in
X-direction (X6), swing of lower guide bearing in Y-direction (X7), swing of hydraulic guide bearing
in X-direction (X8), swing of hydraulic guide bearing in Y-direction (X9) and vibration of lower
bracket in Y-direction (X14). The above result can be attributed to that the remarkable swing of
hydraulic guide bearing and lower guide bearing result in the large pressure of spiral casing, and the
unexpected vibrations of lower bracket and other elements. Thus, to enhance the operating safety of
HGS, the hydropower station should deal with the problems that are able to cause the risk of
hydraulic guide bearing and lower guide bearing, such as reducing hydraulic exciting vibration and
hydraulic imbalance in pipelines.
The preliminary data analysis derives that the high-risk load domain for the start-up process is
approximately at (40MW, 90MW), thus Fig. 9 further quantifies the contributions of each index on
the HGS risk under theses high-risk operating conditions. In addition to this, the quantified risk
contributions of indices for the global load domain (10MW - 130MW) are performed in Appendix 2.
1 2 3 4 5 6 7 8 9 10 11 12 13 14 15 16 17 18 19 20 21 22 23 24 25 26 27 28 29 30 31 32 33 34 35 36 37 38 39 40 41 42 43 44 45 46 47 48 49 50 51 52 53 54 55 56 57 58 59 60 61 62 63 64 65
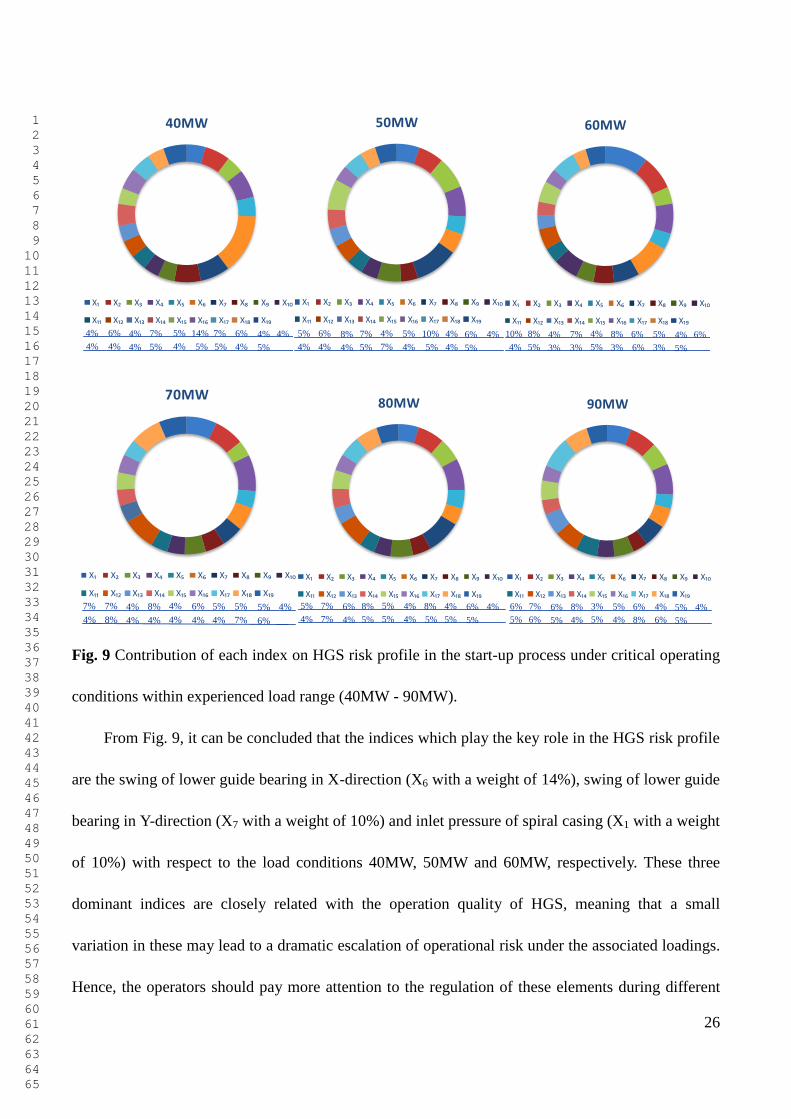
26
5% 6% 8% 7% 4% 5% 10% 4% 6% 4%
4% 4% 4% 5% 7% 4% 5% 4% 5%
4% 6% 4% 7% 5% 14% 7% 6% 4% 4%
4% 4% 4% 5% 4% 5% 5% 4% 5%
40MW
X₁ X₂ X₃ X₄ X₅ X₆ X₇ X₈ X₉ X₁₀
X₁₁ X₁₂ X₁₃ X₁₄ X₁₅ X₁₆ X₁₇ X₁₈ X₁₉
50MW
X₁ X₂ X₃ X₄ X₅ X₆ X₇ X₈ X₉ X₁₀
X₁₁ X₁₂ X₁₃ X₁₄ X₁₅ X₁₆ X₁₇ X₁₈ X₁₉
5% 6% 8% 7% 4% 5% 10% 4% 6% 4%
4% 4% 4% 5% 7% 4% 5% 4% 5%
4% 6% 4% 7% 5% 14% 7% 6% 4% 4%
4% 4% 4% 5% 4% 5% 5% 4% 5%
40MW
X₁ X₂ X₃ X₄ X₅ X₆ X₇ X₈ X₉ X₁₀
X₁₁ X₁₂ X₁₃ X₁₄ X₁₅ X₁₆ X₁₇ X₁₈ X₁₉
50MW
X₁ X₂ X₃ X₄ X₅ X₆ X₇ X₈ X₉ X₁₀
X₁₁ X₁₂ X₁₃ X₁₄ X₁₅ X₁₆ X₁₇ X₁₈ X₁₉
7% 7% 4% 8% 4% 6% 5% 5% 5% 4%
4% 8% 4% 4% 4% 4% 4% 7% 6%
10% 8% 4% 7% 4% 8% 6% 5% 4% 6%
4% 5% 3% 3% 5% 3% 6% 3% 5%
60MW
X₁ X₂ X₃ X₄ X₅ X₆ X₇ X₈ X₉ X₁₀
X₁₁ X₁₂ X₁₃ X₁₄ X₁₅ X₁₆ X₁₇ X₁₈ X₁₉
70MW
X₁ X₂ X₃ X₄ X₅ X₆ X₇ X₈ X₉ X₁₀
X₁₁ X₁₂ X₁₃ X₁₄ X₁₅ X₁₆ X₁₇ X₁₈ X₁₉
7% 7% 4% 8% 4% 6% 5% 5% 5% 4%
4% 8% 4% 4% 4% 4% 4% 7% 6%
10% 8% 4% 7% 4% 8% 6% 5% 4% 6%
4% 5% 3% 3% 5% 3% 6% 3% 5%
60MW
X₁ X₂ X₃ X₄ X₅ X₆ X₇ X₈ X₉ X₁₀
X₁₁ X₁₂ X₁₃ X₁₄ X₁₅ X₁₆ X₁₇ X₁₈ X₁₉
70MW
X₁ X₂ X₃ X₄ X₅ X₆ X₇ X₈ X₉ X₁₀
X₁₁ X₁₂ X₁₃ X₁₄ X₁₅ X₁₆ X₁₇ X₁₈ X₁₉
6% 7% 6% 8% 3% 5% 6% 4% 5% 4%
5% 6% 5% 4% 5% 4% 8% 6% 5%
5% 7% 6% 8% 5% 4% 8% 4% 6% 4%
4% 7% 4% 5% 5% 4% 5% 5% 5%
80MW
X₁ X₂ X₃ X₄ X₅ X₆ X₇ X₈ X₉ X₁₀
X₁₁ X₁₂ X₁₃ X₁₄ X₁₅ X₁₆ X₁₇ X₁₈ X₁₉
90MW
X₁ X₂ X₃ X₄ X₅ X₆ X₇ X₈ X₉ X₁₀
X₁₁ X₁₂ X₁₃ X₁₄ X₁₅ X₁₆ X₁₇ X₁₈ X₁₉
6% 7% 6% 8% 3% 5% 6% 4% 5% 4%
5% 6% 5% 4% 5% 4% 8% 6% 5%
5% 7% 6% 8% 5% 4% 8% 4% 6% 4%
4% 7% 4% 5% 5% 4% 5% 5% 5%
80MW
X₁ X₂ X₃ X₄ X₅ X₆ X₇ X₈ X₉ X₁₀
X₁₁ X₁₂ X₁₃ X₁₄ X₁₅ X₁₆ X₁₇ X₁₈ X₁₉
90MW
X₁ X₂ X₃ X₄ X₅ X₆ X₇ X₈ X₉ X₁₀
X₁₁ X₁₂ X₁₃ X₁₄ X₁₅ X₁₆ X₁₇ X₁₈ X₁₉
Fig. 9 Contribution of each index on HGS risk profile in the start-up process under critical operating
conditions within experienced load range (40MW - 90MW).
From Fig. 9, it can be concluded that the indices which play the key role in the HGS risk profile
are the swing of lower guide bearing in X-direction (X6 with a weight of 14%), swing of lower guide
bearing in Y-direction (X7 with a weight of 10%) and inlet pressure of spiral casing (X1 with a weight
of 10%) with respect to the load conditions 40MW, 50MW and 60MW, respectively. These three
dominant indices are closely related with the operation quality of HGS, meaning that a small
variation in these may lead to a dramatic escalation of operational risk under the associated loadings.
Hence, the operators should pay more attention to the regulation of these elements during different
1 2 3 4 5 6 7 8 9 10 11 12 13 14 15 16 17 18 19 20 21 22 23 24 25 26 27 28 29 30 31 32 33 34 35 36 37 38 39 40 41 42 43 44 45 46 47 48 49 50 51 52 53 54 55 56 57 58 59 60 61 62 63 64 65
27
transient times to avoid compromising safety. Additionally, there are more than six indices that their
corresponding contribution weights reach the proportions of (8%, 7% and 6%) under the load
conditions within 70MW, 80MW and 90MW, respectively. Thus, these indices can be considered as
the dominant indices and paid more attentions in start-up process since they have relatively large risk
contributions on the safety of HGS.
5.2 Transient safety assessment of HGS
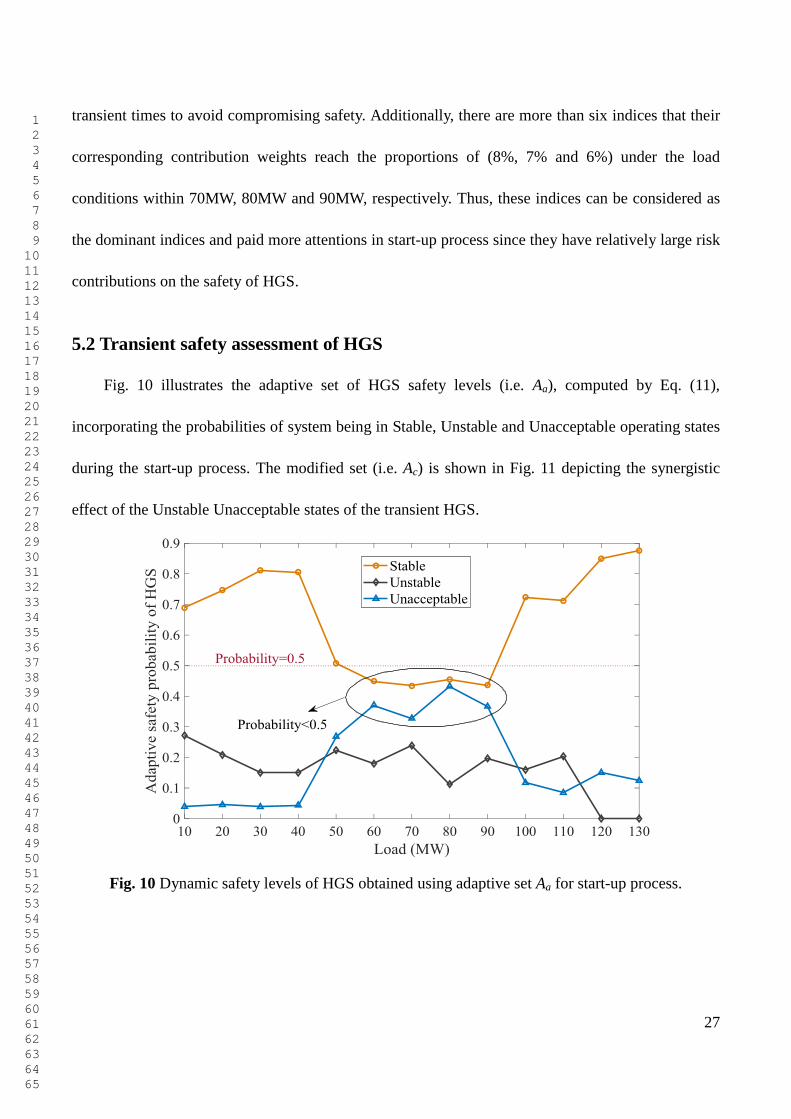
Fig. 10 illustrates the adaptive set of HGS safety levels (i.e. Aa), computed by Eq. (11),
incorporating the probabilities of system being in Stable, Unstable and Unacceptable operating states
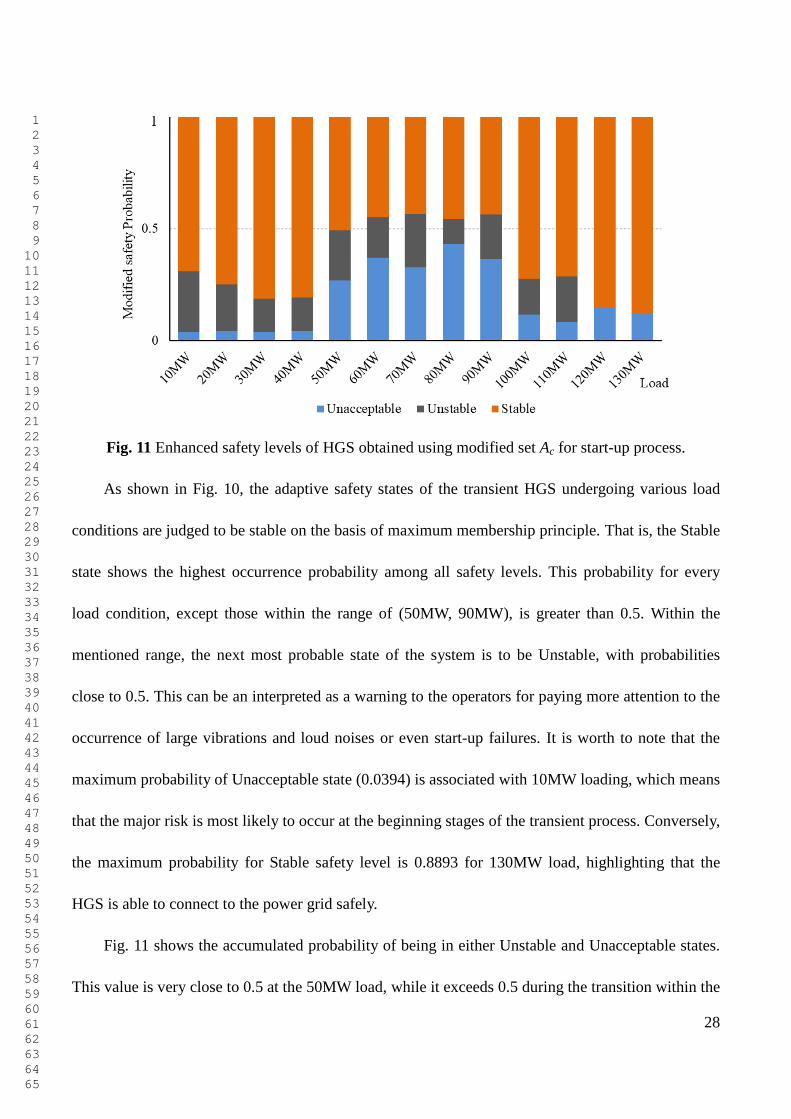
during the start-up process. The modified set (i.e. Ac) is shown in Fig. 11 depicting the synergistic
effect of the Unstable Unacceptable states of the transient HGS.
Fig. 10 Dynamic safety levels of HGS obtained using adaptive set Aa for start-up process.
1 2 3 4 5 6 7 8 9 10 11 12 13 14 15 16 17 18 19 20 21 22 23 24 25 26 27 28 29 30 31 32 33 34 35 36 37 38 39 40 41 42 43 44 45 46 47 48 49 50 51 52 53 54 55 56 57 58 59 60 61 62 63 64 65
28
Fig. 11 Enhanced safety levels of HGS obtained using modified set Ac for start-up process.
As shown in Fig. 10, the adaptive safety states of the transient HGS undergoing various load
conditions are judged to be stable on the basis of maximum membership principle. That is, the Stable
state shows the highest occurrence probability among all safety levels. This probability for every
load condition, except those within the range of (50MW, 90MW), is greater than 0.5. Within the
mentioned range, the next most probable state of the system is to be Unstable, with probabilities
close to 0.5. This can be an interpreted as a warning to the operators for paying more attention to the
occurrence of large vibrations and loud noises or even start-up failures. It is worth to note that the
maximum probability of Unacceptable state (0.0394) is associated with 10MW loading, which means
that the major risk is most likely to occur at the beginning stages of the transient process. Conversely,
the maximum probability for Stable safety level is 0.8893 for 130MW load, highlighting that the
HGS is able to connect to the power grid safely.
Fig. 11 shows the accumulated probability of being in either Unstable and Unacceptable states.
This value is very close to 0.5 at the 50MW load, while it exceeds 0.5 during the transition within the
1 2 3 4 5 6 7 8 9 10 11 12 13 14 15 16 17 18 19 20 21 22 23 24 25 26 27 28 29 30 31 32 33 34 35 36 37 38 39 40 41 42 43 44 45 46 47 48 49 50 51 52 53 54 55 56 57 58 59 60 61 62 63 64 65
29
load range of (60MW, 90MW). This should draw the attention of hydropower station operators and
risk managers to the occurrence of instability problems throughout the operation. Based on the
results presented above, it can be concluded that a good agreement is achieved with the engineering
practice and theories provided by references [61, 62, 63].
5.3 Safety improvement recommendations
The safety analysis target of hydropower stations is to reduce the operational risk, to avoid
additional costs of power production and to coordinate efficient maintenance schedules for optimized
usage of resources. All of these objectives are achievable by improving the HGS safety through the
assessment of the equipment and critical operational stages of the transient processes. In this paper,
the obtained results can be translated into the following recommendations for amendment of risk
mitigation and maintenance planning strategies at hydropower stations.
i) The operators should be more cautious about the safety state of HGS within the load domain
of (50MW, 90MW), carefully monitoring risk indices to generate effective warnings which help
avoid failure events. It should be noted that although a specific range is here identified as the most
critical load conditions, the proposed method can be readily used for any other facilities resulting in
their particular safety requirements. Meanwhile, it is suggested for the maintenance crew to pay more
attention to the previous fault locations when scheduling the next maintenance interruptions, if the
warning strategies and maintenance procedures are not very effective.
ii) Since it was observed that the highest risk is associated with the earlier stages of the start-up
process, we suggest the operation planning to aim at optimizing the start-up strategy, for instance by
identifying the optimum guide vane law and by reduction of error operating frequency of operators.

1 2 3 4 5 6 7 8 9 10 11 12 13 14 15 16 17 18 19 20 21 22 23 24 25 26 27 28 29 30 31 32 33 34 35 36 37 38 39 40 41 42 43 44 45 46 47 48 49 50 51 52 53 54 55 56 57 58 59 60 61 62 63 64 65
30
Additionally, the hydropower station should arrange repair plans and coping with potential adverse
accidents highlighted in the assessment results.
iii) Although the final state of HGS dynamic operating safety is expected to be Stable, we
cannot exclude the occurrence likelihood of undesirable events. Therefore, the hydropower asset
managers may be able to extend preventive maintenance intervals or preferably change the regular
time-based strategy to condition-based strategy optimizing the maintenance schedule that minimizes
the financial risk due to unexpected downtime or excessive repair activities.
6. Conclusions
This paper investigates the transient safety level of HGSs, contributing a few novel components
to the state-of-the-art dynamic safety assessment methods. For this purpose, a methodology based on
an enhanced fuzzy-entropy evaluation approach is developed to enable the risk quantification using
assessment indices obtained from a dynamic balance experiments and corresponding theory
modifications. The computed dynamic weights of indices reveal their level of influence on HGS
instability. We find that the critical indices with highest contributions to the overall risk profile are
the inlet pressure of spiral casing (X1), swing of lower guide bearing in X-direction (X6), swing of
lower guide bearing in Y-direction (X7), swing of hydraulic guide bearing in X-direction (X8), swing
of hydraulic guide bearing in Y-direction (X9) and vibration of lower bracket in Y-direction (X14).
Additionally, the transient safety levels for the entire load range (10MW, 130MW) are successfully
estimated, and the results show that the final safety state of the transient process is Stable, although
the occurrence of other states including Unstable and Unacceptable cannot be neglected. The
operators of hydropower station must pay more attention to the system operating within the load
1 2 3 4 5 6 7 8 9 10 11 12 13 14 15 16 17 18 19 20 21 22 23 24 25 26 27 28 29 30 31 32 33 34 35 36 37 38 39 40 41 42 43 44 45 46 47 48 49 50 51 52 53 54 55 56 57 58 59 60 61 62 63 64 65
31
range of (50MW, 90MW) since the likelihood of Stable and Unstable states are very close. The
dynamic safety status at the beginning stage of the transient process also requires special attention
because the related unacceptable probability reaches its maximum value of 0.0394. Based on the
results of the quantitative risk assessment, several risk mitigation and maintenance improvement
suggestions are made to enhance the safety of HGS operation, to reduce the likelihood of losses in
power production capacities, and to optimize maintenance schedules for more efficient usage of
resources. The future work could be focused on the application of the proposed methods in the safety
assessment of other large fluctuation transient processes (e.g. load rejection, generating phase
modulation, and operation switching between different transient processes).
It is worthwhile to note that since about 80% of HGS’s faults are triggered by the vibration of
hydraulic‐ mechanic‐ electric components (i.e. the hydro-turbine shaft, the generator shaft and the
pressure pipe) during its start-up transient process [64, 65], this study has not considered the typical
electrical characteristics (e.g. current and voltage) of the system. In order to improve this, future
work may focus on grid-connected power safety assessment of the HGS integrating with other
energy systems (the details have been elaborated in the introduction section).
Acknowledgments
This work was supported by the scientific research foundation of National Natural Science
Foundation of China--Outstanding Youth Foundation (51622906), and National Natural Science
Foundation of China (51479173).
1 2 3 4 5 6 7 8 9 10 11 12 13 14 15 16 17 18 19 20 21 22 23 24 25 26 27 28 29 30 31 32 33 34 35 36 37 38 39 40 41 42 43 44 45 46 47 48 49 50 51 52 53 54 55 56 57 58 59 60 61 62 63 64 65
32
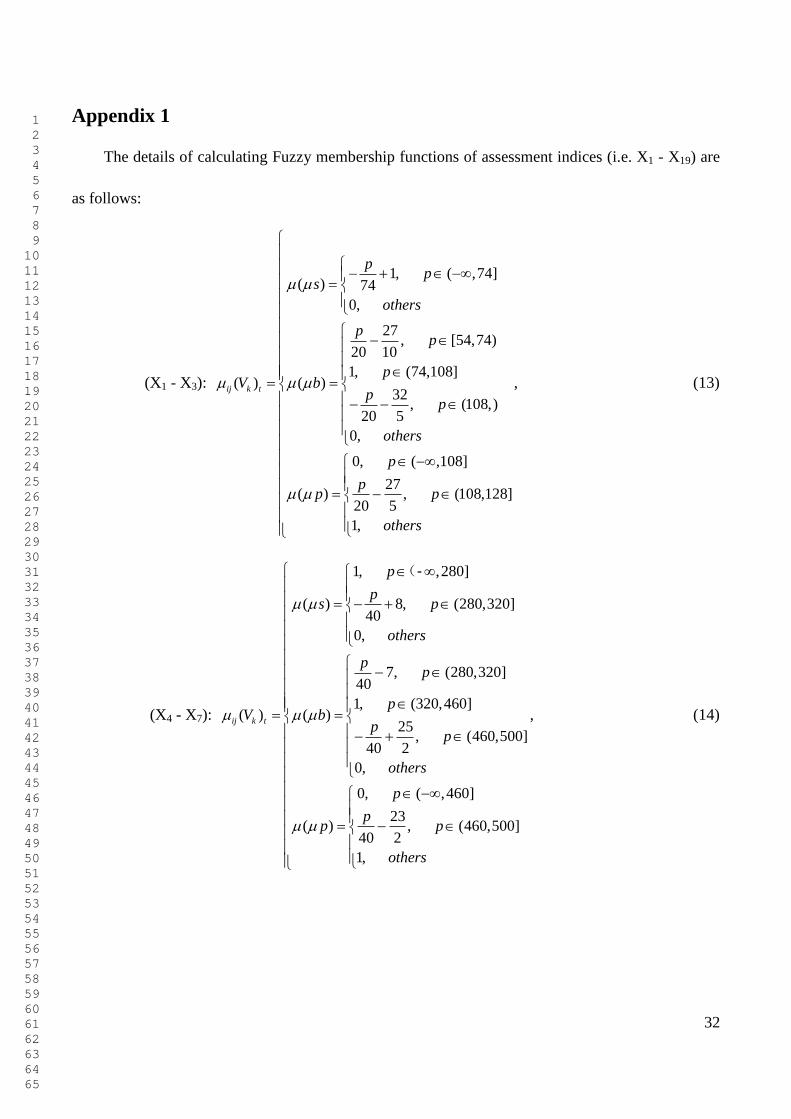
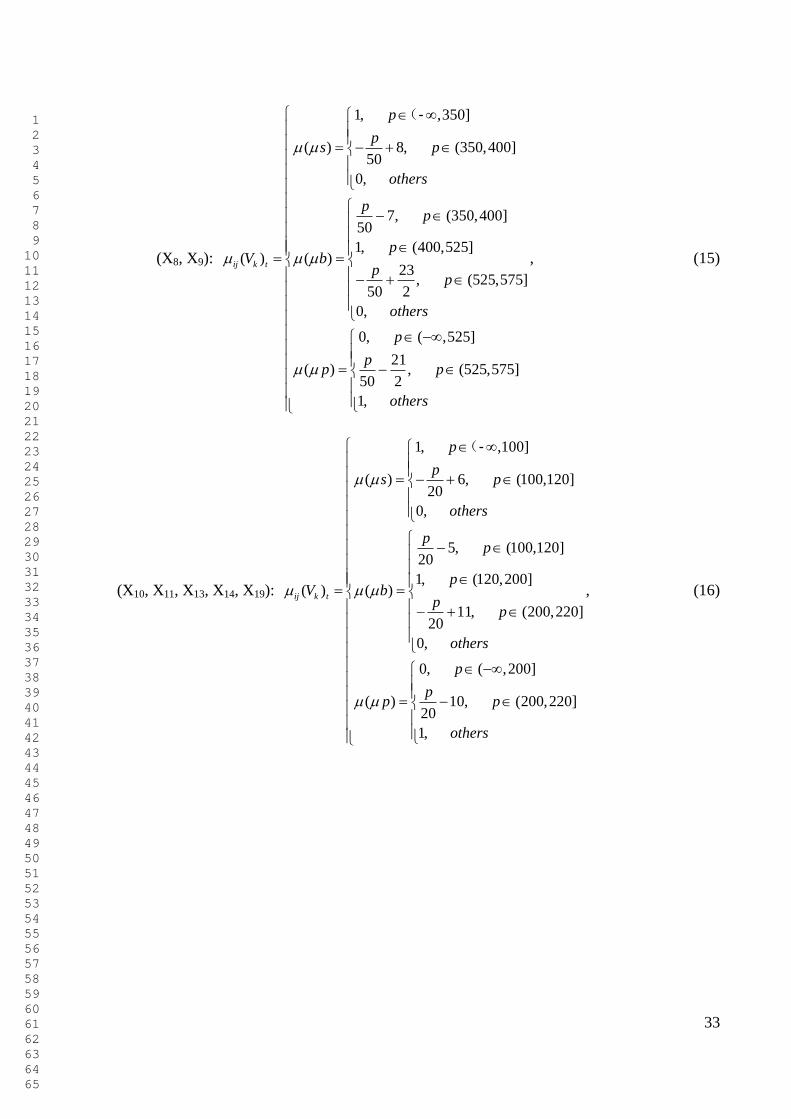
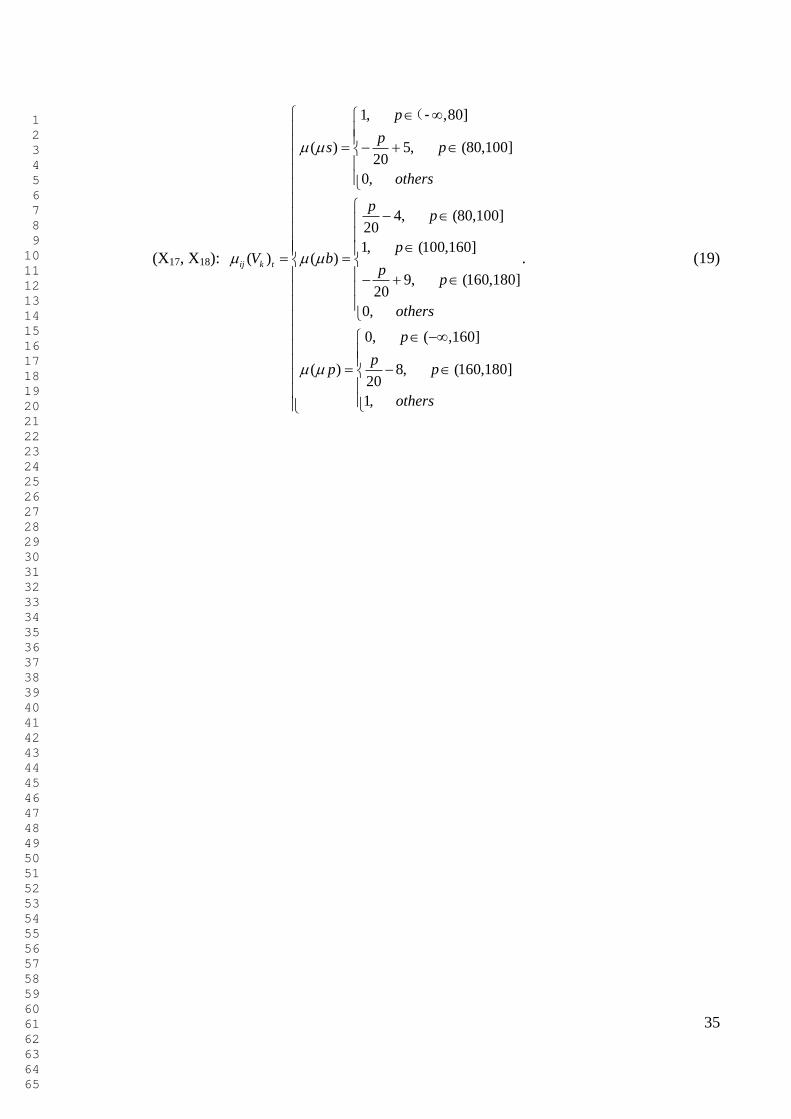
Appendix 1
The details of calculating Fuzzy membership functions of assessment indices (i.e. X1 - X19) are
as follows:
(X1 - X3):
1, ( ,74]( ) 74
0,
27, [54,74)
20 10
1, (74,108]( ) ( )
32, (108,)
20 5
0,
0, ( ,108]
27( ) , (108,128]
20 5
1,
ij k t
pp
s
others
pp
pV b
pp
others
p
pp p
others
, (13)
(X4 - X7):
1, ,280]
( ) 8, (280,320]40
0,
7, (280,320]40
1, (320,460]( ) ( )
25, (460,500]
40 2
0,
0, ( ,460]
23( ) , (460,500]
40 2
1,
ij k t
p
ps p
others
pp
pV b
pp
others
p
pp p
others
(-
, (14)
1 2 3 4 5 6 7 8 9 10 11 12 13 14 15 16 17 18 19 20 21 22 23 24 25 26 27 28 29 30 31 32 33 34 35 36 37 38 39 40 41 42 43 44 45 46 47 48 49 50 51 52 53 54 55 56 57 58 59 60 61 62 63 64 65
33
(X8, X9):
1, ,350]
( ) 8, (350,400]50
0,
7, (350,400]50
1, (400,525]( ) ( )
23, (525,575]
50 2
0,
0, ( ,525]
21( ) , (525,575]
50 2
1,
ij k t
p
ps p
others
pp
pV b
pp
others
p
pp p
others
(-
, (15)
(X10, X11, X13, X14, X19):
1, ,100]
( ) 6, (100,120]20
0,
5, (100,120]20
1, (120,200]( ) ( )
11, (200,220]20
0,
0, ( ,200]
( ) 10, (200,220]20
1,
ij k t
p
ps p
others
pp
pV b
pp
others
p
pp p
others
(-
, (16)

1 2 3 4 5 6 7 8 9 10 11 12 13 14 15 16 17 18 19 20 21 22 23 24 25 26 27 28 29 30 31 32 33 34 35 36 37 38 39 40 41 42 43 44 45 46 47 48 49 50 51 52 53 54 55 56 57 58 59 60 61 62 63 64 65
34
(X12, X15):
1, ,70]
9( ) , (70,90]
20 2
0,
7, (70,90]
20 2
1, (90,140]( ) ( )
8, (140,160]20
0,
0, ( ,140]
( ) 7, (140,160]20
1,
ij k t
p
ps p
others
pp
pV b
pp
others
p
pp p
others
(-
, (17)
X16:
1, ,35]
9( ) , (35,45]
10 2
0,
7, (35,45]
10 2
1, (45,70]( ) ( )
8, (70,80]10
0,
0, ( ,70]
( ) 7, (70,80]10
1,
ij k t
p
ps p
others
pp
pV b
pp
others
p
pp p
others
(-
, (18)
and
1 2 3 4 5 6 7 8 9 10 11 12 13 14 15 16 17 18 19 20 21 22 23 24 25 26 27 28 29 30 31 32 33 34 35 36 37 38 39 40 41 42 43 44 45 46 47 48 49 50 51 52 53 54 55 56 57 58 59 60 61 62 63 64 65
35
(X17, X18):
1, ,80]
( ) 5, (80,100]20
0,
4, (80,100]20
1, (100,160]( ) ( )
9, (160,180]20
0,
0, ( ,160]
( ) 8, (160,180]20
1,
ij k t
p
ps p
others
pp
pV b
pp
others
p
pp p
others
(-
. (19)
1
2
3
4
5
6
7
8
9
10
11
12
13
14
15
16
17
18
19
20
21
22
23
24
25
26
27
28
29
30
31
32
33
34
35
36
37
38
39
40
41
42
43
44
45
46
47
48
49
36
Ap
pen
dix
2
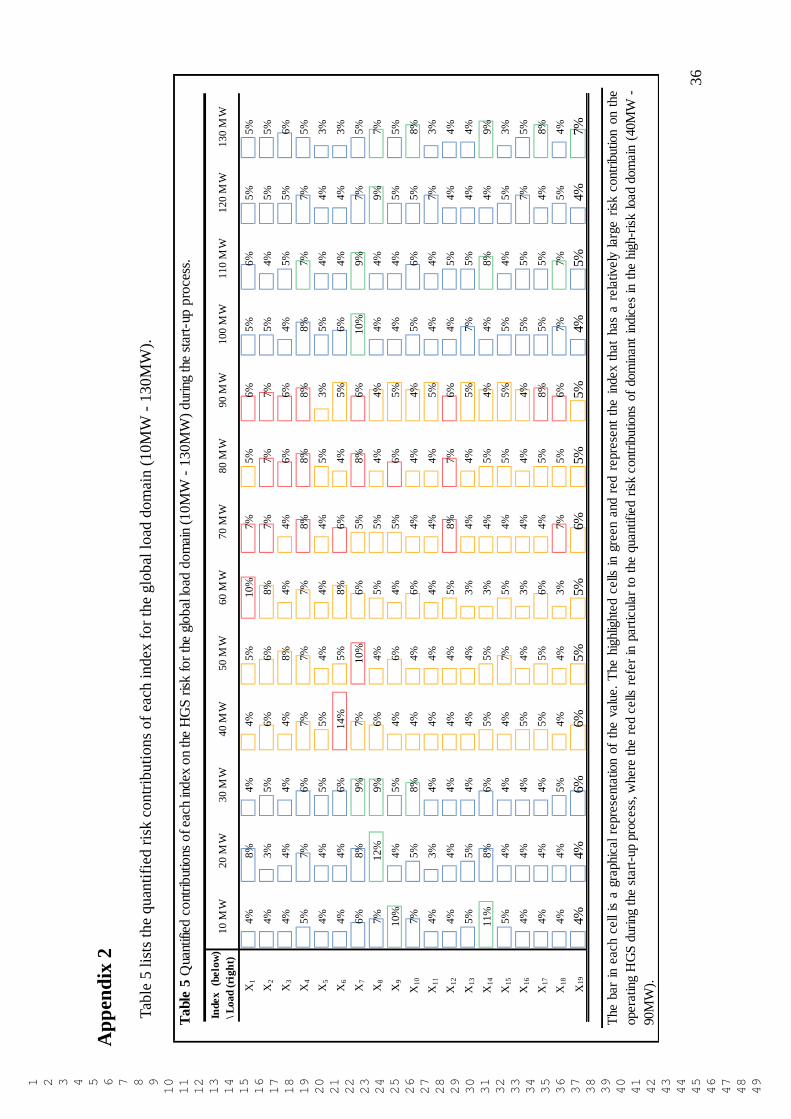
Tab
le 5
lis
ts t
he
quan
tifi
ed r
isk c
ontr
ibuti
ons
of
each
index
for
the
glo
bal
load
dom
ain (
10M
W -
13
0M
W).
Index
(belo
w)
\ L
oa
d (
rig
ht)
10
MW
20
MW
30
MW
40
MW
50
MW
60
MW
70
MW
80
MW
90
MW
10
0 M
W1
10 M
W1
20 M
W1
30 M
W
X1
4%
8%
4%
4%
5%
10%
7%
5%
6%
5%
6%
5%
5%
X2
4%
3%
5%
6%
6%
8%
7%
7%
7%
5%
4%
5%
5%
X3
4%
4%
4%
4%
8%
4%
4%
6%
6%
4%
5%
5%
6%
X4
5%
7%
6%
7%
7%
7%
8%
8%
8%
8%
7%
7%
5%
X5
4%
4%
5%
5%
4%
4%
4%
5%
3%
5%
4%
4%
3%
X6
4%
4%
6%
14%
5%
8%
6%
4%
5%
6%
4%
4%
3%
X7
6%
8%
9%
7%
10%
6%
5%
8%
6%
10%
9%
7%
5%
X8
7%
12%
9%
6%
4%
5%
5%
4%
4%
4%
4%
9%
7%
X9
10%
4%
5%
4%
6%
4%
5%
6%
5%
4%
4%
5%
5%
X10
7%
5%
8%
4%
4%
6%
4%
4%
4%
5%
6%
5%
8%
X11
4%
3%
4%
4%
4%
4%
4%
4%
5%
4%
4%
7%
3%
X12
4%
4%
4%
4%
4%
5%
8%
7%
6%
4%
5%
4%
4%
X13
5%
5%
4%
4%
4%
3%
4%
4%
5%
7%
5%
4%
4%
X14
11%
8%
6%
5%
5%
3%
4%
5%
4%
4%
8%
4%
9%
X15
5%
4%
4%
4%
7%
5%
4%
5%
5%
5%
4%
5%
3%
X16
4%
4%
4%
5%
4%
3%
4%
4%
4%
5%
5%
7%
5%
X17
4%
4%
4%
5%
5%
6%
4%
5%
8%
5%
5%
4%
8%
X18
4%
4%
5%
4%
4%
3%
7%
5%
6%
7%
7%
5%
4%
X19
4%
4%
6%
6%
5%
5%
6%
5%
5%
4%
5%
4%
7%
The
bar
ineach
cell
isa
gra
phic
al
repre
senta
tion
of
the
valu
e.
The
hig
hlig
hte
dcells
ingre
en
and
red
repre
sent
the
index
that
has
are
latively
larg
eri
skcontr
ibution
on
the
opera
ting
HG
Sduri
ng
the
start
-up
pro
cess
,w
here
the
red
cells
refe
rin
part
icula
rto
the
quantifi
ed
risk
contr
ibutions
of
dom
inant
indic
es
inth
ehig
h-r
isk
load
dom
ain
(40M
W-
90M
W).
Table
5 Q
uant
ified
cont
ribut
ions
of ea
ch in
dex
on
the
HG
S r
isk for
the
global
load
dom
ain
(10M
W -
130M
W)
dur
ing
the
star
t-up
pro
cess
.

1 2 3 4 5 6 7 8 9 10 11 12 13 14 15 16 17 18 19 20 21 22 23 24 25 26 27 28 29 30 31 32 33 34 35 36 37 38 39 40 41 42 43 44 45 46 47 48 49 50 51 52 53 54 55 56 57 58 59 60 61 62 63 64 65
37
Appendix 3
The major aim of the running-in and no-load tests is to eliminate the instability problems
associated with generator rotation and excitation system. Therefore, the running-in test assists in
controlling the active power output and electrical frequency of generator by regulating the guide
vane opening. The purpose of the no-load test is to evaluate the electrical performances (e.g. no-load
current and power) of generator under the influence of field current. The no-load test shows that the
measured current and power accord with the corresponding characteristic curves. However, it
observes significant vibrations and water pressures of indices in the 100%ne running-in test and
100%Ue no-load test, and the corresponding experimental results for the acceptable working heads
(i.e. 431 m to 440 m) are shown in Table 6.
100%n e 100%U e 100%n e 100%U e 100%n e 100%U e 100%n e 100%U e
X1 23.40 28.60 X1 31.58 28.95 X1 23.80 19.68 X1 19.68 19.68
X2 15.52 17.24 X2 18.97 18.97 X2 11.90 11.75 X2 10.92 13.78
X3 96.95 110.15 X3 100.51 90.86 X3 86.36 97.35 X3 80.26 86.98
X4 151.00 155.00 X4 158.00 160.00 X4 115.00 116.00 X4 121.00 126.00
X5 148.00 157.00 X5 176.00 176.00 X5 133.00 136.00 X5 152.00 157.00
X6 97.00 95.00 X6 100.00 97.00 X6 70.00 74.00 X6 82.00 67.00
X7 113.00 119.00 X7 120.00 113.00 X7 55.00 60.00 X7 76.00 70.00
X8 469.00 487.00 X8 539.00 508.00 X8 449.00 472.00 X8 448.00 492.00
X9 536.00 477.00 X9 492.00 498.00 X9 405.00 401.00 X9 446.00 454.00
X10 69.00 68.00 X10 57.00 64.00 X10 77.00 66.00 X10 94.00 101.00
X11 68.00 78.00 X11 62.00 72.00 X11 72.00 68.00 X11 80.00 81.00
X12 57.00 63.00 X12 61.00 66.00 X12 69.00 60.00 X12 61.00 70.00
X13 32.00 33.00 X13 46.00 42.00 X13 34.00 32.00 X13 19.00 18.00
X14 32.00 37.00 X14 42.00 32.00 X14 29.00 37.00 X14 32.00 24.00
X15 104.00 114.00 X15 93.00 102.00 X15 66.00 64.00 X15 92.00 87.00
X16 10.00 16.00 X16 17.00 15.00 X16 19.00 22.00 X16 12.00 24.00
X17 93.00 74.00 X17 183.00 121.00 X17 122.00 120.00 X17 54.00 48.00
X18 93.00 131.00 X18 154.00 149.00 X18 131.00 150.00 X18 31.00 33.00
X19 53.00 59.00 X19 87.00 51.00 X19 20.00 18.00 X19 47.00 41.00
Parameters U e and ne represent the nominal voltage of generator and the nominal rotational speed of generator, respectively. The details of
index X1~X19 see Table 2. The unit for X1, X2 and X3 is 'kPa', and the unit for the index X4~X19 is 'μ m'. The significant vibration and water
pressure are highlighted in red.
Table 6 Vibration and pressure data in 100%n e running-in test and 100%U e no-load test
Index
Head of 431 m Head of 437 m
Index
Head of 434 m
Index
Head of 440 m
Index
1 2 3 4 5 6 7 8 9 10 11 12 13 14 15 16 17 18 19 20 21 22 23 24 25 26 27 28 29 30 31 32 33 34 35 36 37 38 39 40 41 42 43 44 45 46 47 48 49 50 51 52 53 54 55 56 57 58 59 60 61 62 63 64 65
38
References
[1] Balkhair KS, Rahman KU. Sustainable and economical small-scale and low-head hydropower
generation: A promising alternative potential solution for energy generation at local and regional
scale. Appl. Energy 2017; 188: 378-91. DOI: 10.1016/j.apenergy.2016.12.012
[2] Lucena AFP, Hejazi M, Vasquez-Arroyo E, Turner S, Koberle AC, Daenzer K, Rochedo PRR,
Kober T, Cai YX, Beach RH. Interactions between climate change mitigation and adaptation: The
case of hydropower in Brazil. Energy 2018; 164: 1161-1177. DOI: 10.1016/j.energy.2018.09.005
[3] Schlachtberger DP, Brown T, Schramm S, Greiner M. The benefits of cooperation in a highly
renewable European electricity network. Energy 2017; 134: 469-481. DOI:
10.1016/j.energy.2017.06.004
[4] Dujardin J, Kahl A, Kruyt B, Bartlett S, Lehning M. Interplay between photovoltaic, wind energy
and storage hydropower in a fully renewable Switzerland. Energy 2017; 135: 513-525. DOI:
10.1016/j.energy.2017.06.092
[5] Nash S, Phoenix A. A review of the current understanding of the hydro-environmental impacts of
energy removal by tidal turbines. Renew. Sust. Energ. Rev. 2017; 80: 648-62. DOI:
10.1016/j.rser.2017.05.289
[6] Mendes CAB, Beluco A, Canales FA. Some important uncertainties related to climate change in
projections for the Brazilian hydropower expansion in the Amazon. Energy 2017; 141: 123-138. DOI:
10.1016/j.energy.2017.09.071
[7] Turner SWD, Hejazi M, Kim SH, Clarke L, Edmonds J. Climate impacts on hydropower and
consequences for global electricity supply investment needs. Energy 2017; 141: 2081-2090. DOI:
1 2 3 4 5 6 7 8 9 10 11 12 13 14 15 16 17 18 19 20 21 22 23 24 25 26 27 28 29 30 31 32 33 34 35 36 37 38 39 40 41 42 43 44 45 46 47 48 49 50 51 52 53 54 55 56 57 58 59 60 61 62 63 64 65
39
10.1016/j.energy.2017.11.089
[8] Semmari H, Mauran S, Stitou D. Experimental validation of an analytical model of hydraulic
motor operating under variable electrical loads and pressure heads. Appl. Energy. 2017; 206:
1309-20. DOI: 10.1016/j.apenergy.2017.10.010
[9] Riasi A, Tazraei P. Numerical analysis of the hydraulic transient response in the presence of surge
tanks and relief valves. Renew. Energy 2017; 107: 138-46. DOI: 10.1016/j.renene.2017.01.046
[10] IHA international hydropower association. 2018 Hydropower status report (Fifth Edition).
Launced 24 May 2018. http://hydropower.org/status2018
[11] International Energy Agency, Energy Balances of OECD Countries (2013 Preliminary Edition),
and Energy Balances of Non-OECD Countries, October 2012.
[12] Wen X, Zhou J, He Z, Wang C. Long-Term Scheduling of Large-Scale Cascade Hydropower
Stations Using Improved Differential Evolution Algorithm. Water 2018; 10. DOI:
10.3390/w10040383
[13] Xu BB, Chen DY, Zhang XG, Alireza R. Parametric uncertainty in affecting transient
characteristics of multi-parallel hydropower systems in the successive load rejection. Int. J. Electr.
Power Energy Syst. 2019; 106: 444-54. DOI: 10.1016/j.ijepes.2018.10.029
[14] Xu BB, Jun H-B, Chen DY, Li HH, Zhang J, Cavalcante Blanco CJ, Shen H. Stability analysis
of a hydro-turbine governing system considering inner energy losses. Renew. Energy 2019; 134:
258-66. DOI: 10.1016/j.renene.2018.11.026
[15] Du JY, Yang HX, Shen ZC, Chen J. Micro hydro power generation from water supply system in
high rise buildings using pump as turbines. Energy 2017; 137: 431-440. DOI:
10.1016/j.energy.2017.03.023
1 2 3 4 5 6 7 8 9 10 11 12 13 14 15 16 17 18 19 20 21 22 23 24 25 26 27 28 29 30 31 32 33 34 35 36 37 38 39 40 41 42 43 44 45 46 47 48 49 50 51 52 53 54 55 56 57 58 59 60 61 62 63 64 65
40
[16] Li HH, Chen DY, Arzaghi E, Abbassi R, Kilicman A, Caraballo T, Patelli E, Gao X, Xu BB.
Dynamic Safety Assessment of a Nonlinear Pumped-Storage Generating System in Transient
Processes. Commun. Nonlinear Sci. Numer. Simul. 2019; 67: 192-202. DOI:
10.1016/j.cnsns.2018.07.025
[17] Polak M. Application of conversion model for designing hydrodynamic pumps in turbine mode.
Agronomy Research 2018; 16(4): 1824-1829. DOI:10.15159/AR.18.159
[18] Polak M. The Influence of Changing Hydropower Potential on Performance Parameters of
Pumps in Turbine Mode. Energies 2019; 12(11). DOI: 10.3390/en12112103
[19] Li HH, Chen DY, Zhang XG, Wu YH. Dynamic analysis and modelling of a Francis
hydro-energy generation system in the load rejection transient. IET Renew. Power Gener. 2016; 10:
1140-1148. DOI: 10.1049/iet-rpg.2015.0579
[20] Xia X, Ni W, Sang YJ. A novel analysis method for fault diagnosis of hydro-turbine governing
system. Proc. Inst. Mech. Eng. Part O-J. Risk Reliab. 2017; 231: 164-171. DOI:
10.1177/1748006X16689407
[21] Magdy G, Mohamed EA, Shabib G, Elbaset AA, Mitani Y. SMES based a new PID controller for
frequency stability of a real hybrid power system considering high wind power penetration. IET
Renew. Power Gener. 2018; 12: 1304-1313. DOI: 10.1049/iet-rpg.2018.5096
[22] Fontana N, Giugni M, Glielmo L, Marini G, Zollo R. Operation of a Prototype for Real Time
Control of Pressure and Hydropower Generation in Water Distribution Networks. Water Resour.
Manag. 2019; 33: 697-712. DOI: 10.1007/s11269-018-2131-1
[23] Metzler M, Pelz PF. Draft Tube Design Method for Operation at optimal Coefficient of
Performance in Low Head Hydropower. WasserWirtschaft 2015; 105: 13-17.

1 2 3 4 5 6 7 8 9 10 11 12 13 14 15 16 17 18 19 20 21 22 23 24 25 26 27 28 29 30 31 32 33 34 35 36 37 38 39 40 41 42 43 44 45 46 47 48 49 50 51 52 53 54 55 56 57 58 59 60 61 62 63 64 65
41
(http://apps.webofknowledge.com/full_record.do?product=UA&search_mode=GeneralSearch&qid=
15&SID=5EG5UZVa96TVarGCd1G&page=1&doc=1)
[24] Chen ZM, Baek SH, Cho H, Choi YD. Optimal design of J-groove shape on the suppression of
unsteady flow in the Francis turbine draft tube. J. Mech. Sci. Technol. 33: 2211-2218. DOI:
10.1007/s12206-019-0423-x
[25] Zhang W, Cai FL, Zhou JX, Hua YL. Experimental Investigation on Air-Water Interaction in a
Hydropower Station Combining a Diversion Tunnel with a Tailrace Tunnel. Water 2017; 9: 274. DOI:
10.3390/w9040274
[26] Bozorgi A, Javidpour E, Riasi A, Nourbakhsh A. Numerical and experimental study of using
axial pump as turbine in Pico hydropower plants. Renew. Energy 2013; 53: 258-264. DOI:
10.1016/j.renene.2012.11.016
[27] Wu QQ, Zhang LK, Ma ZY. A model establishment and numerical simulation of dynamic
coupled hydraulic-mechanical-electric-structural system for hydropower station. Nonlinear Dyn.
2017; 87: 459-474. DOI: 10.1007/s11071-016-3053-1
[28] Valentin D, Presas A, Egusquiza E, Valero C, Egusquiza M, Bossio M. Power Swing Generated
in Francis Turbines by Part Load and Overload Instabilities. Energies 2017; 10: 2124. DOI:
10.3390/en10122124
[29] Presas A, Valentin D, Egusquiza M, Valero C, Egusquiza E. Sensor-Based Optimized Control of
the Full Load Instability in Large Hydraulic Turbines. Sensors 2018; 18: 1038. DOI:
10.3390/s18041038
[30] Egusquiza E, Valero C, Presas A, Huang XX, Guardo A, Seidel U. Analysis of the dynamic
response of pump-turbine impellers. Influence of the rotor. Mech. Syst. Signal Proc. 2016; 68-69:

1 2 3 4 5 6 7 8 9 10 11 12 13 14 15 16 17 18 19 20 21 22 23 24 25 26 27 28 29 30 31 32 33 34 35 36 37 38 39 40 41 42 43 44 45 46 47 48 49 50 51 52 53 54 55 56 57 58 59 60 61 62 63 64 65
42
330-341. DOI: 10.1016/j.ymssp.2015.05.034
[31] Li RH, Li CS, Peng XL, Wei W. Electromagnetic Vibration Simulation of a 250-MW Large
Hydropower Generator with Rotor Eccentricity and Rotor Deformation. Energies 2017; 10: 2155.
DOI: 10.3390/en10122155
[32] Perez-Loya JJ, Abrahamsson CJD, Evestedt F, Lundin U. Performance Tests of a Permanent
Magnet Thrust Bearing for a Hydropower Synchronous Generator Test-Rig. Appl. Comput.
Electromagn. Soc. J. 2017; 32: 704-711.
(http://apps.webofknowledge.com/full_record.do?product=UA&search_mode=GeneralSearch&qid=
37&SID=6F76bogiAqIEgyv8YDl&page=1&doc=10)
[33] Xu BB, Chen DY, Zhang H, Zhou R. Dynamic analysis and modeling of a novel fractional-order
hydro-turbine-generator unit. Nonlinear Dyn. 2015; 81: 1263-1274. DOI:
10.1007/s11071-015-2066-5
[34] Rajagopal V, Singh B. Instantaneous Symmetrical Component Theory Based Voltage and
Frequency Controller for Isolated Small Hydropower Generation. Electr. Power Compon. Syst. 2011;
39: 367-386. DOI: 10.1080/15325008.2010.528534
[35] Damdoum A, Slama-Belkhodja I, Pietrzak-David M, Debbou M. Low voltage ride-through
strategies for doubly fed induction machine pumped storage system under grid faults.
[36] Bitew GT, Han MX, Mekonnen SA, Simiyu P. A Variable Speed Pumped Storage System Based
on Droop-Fed Vector Control Strategy for Grid Frequency and AC-Bus Voltage Stability. Electronics
2018; 7: 108. DOI: 10.3390/electronics7070108
[37] Dong H, Ye F, Fu W. Stability reliability of a cutting slope in Laohuzui Hydropower Station in
Tibet of China. Geomat. Nat. Hazards Risk 2019; 10: 935-57. DOI:

1 2 3 4 5 6 7 8 9 10 11 12 13 14 15 16 17 18 19 20 21 22 23 24 25 26 27 28 29 30 31 32 33 34 35 36 37 38 39 40 41 42 43 44 45 46 47 48 49 50 51 52 53 54 55 56 57 58 59 60 61 62 63 64 65
43
10.1080/19475705.2018.1554604
[38] Silva PASF, Rio Vaz DATD, Britto V, de Oliveira TF, Vaz JRP, Brasil Junior ACP. A new
approach for the design of diffuser-augmented hydro turbines using the blade element momentum.
Energy Conv. Manag. 2018; 165: 801-14. DOI: 10.1016/j.enconman.2018.03.093
[39] Zhou DQ, Gui J, Deng ZD, Chen HX, Yu YY, Yu A, Yang CX. Development of an ultra-low
head siphon hydro turbine using computational fluid dynamics. Energy 2019; 181: 43-50. DOI:
10.1016/j.energy.2019.05.060
[40] Martins NMC, Soares AK, Ramos HM, Covas DIC. CFD modeling of transient flow in
pressurized pipes. Comput. Fluids 2016; 126: 129-140. DOI: 10.1016/j.compfluid.2015.12.002
[41] Pereira JG, Andolfatto L, Avellan F. Monitoring a Francis turbine operating conditions. Flow
Meas. Instrum. 2018; 63: 37-46. DOI: 10.1016/j.flowmeasinst.2018.07.007
[42] Cai B, Liu Y, Xie M. dynamic-Bayesian-network-based fault diagnosis methodology
considering transient and intermittent faults. IEEE Trans Autom Sci Eng 2017; 14: 276-285. DOI:
10.1109/TASE.2016.2574875
[43] Cai B, Liu Y, Fan Q, Zhang Y, Liu Z, Yu S, Ji R. Multi-source information fusion based fault
diagnosis of ground-source heat pump using Bayesian network. Appl. Energy 2014; 114: 1-9. DOI:
10.1016/j.apenergy.2013.09.043
[44] Wei BZ, Ji CQ. Study on Rotor Operation Stability of High-Speed Large-Capacity
Generator-Motor: The Accident of Rotor Pole in Huizhou Pumped-Storage Power Station. Water
Power 2010; 36: 57-60. (in Chinese)
(http://kns.cnki.net//KXReader/Detail?TIMESTAMP=637119229804482500&DBCODE=CJFD&T
ABLEName=CJFD2010&FileName=SLFD201009023&RESULT=1&SIGN=VGBdAkkRzJHw8kv
1 2 3 4 5 6 7 8 9 10 11 12 13 14 15 16 17 18 19 20 21 22 23 24 25 26 27 28 29 30 31 32 33 34 35 36 37 38 39 40 41 42 43 44 45 46 47 48 49 50 51 52 53 54 55 56 57 58 59 60 61 62 63 64 65
44
YM3i2dUSMZb0%3d)
[45] Li HH, Xu BB, Riasi A, Szulc P, Chen DY, M'zoughi F, Skjelbred HI, Kong JH, Tazraei P.
Performance evaluation in enabling safety for a hydropower generation system. Renew. Energy 2019;
143: 1628-1642. DOI: 10.1016/j.renene.2019.05.113
[46] Li HH, Chen DY, Zhang H, Wang FF, Ba DD. Nonlinear modeling and dynamic analysis of a
hydro-turbine governing system in the process of sudden load increase transient. Mech. Syst. Signal
Proc. 2016; 80: 414-428. DOI: 10.1016/j.ymssp.2016.04.006
[47] Santoyo-Castelazo E, Gujba H, Azapagic A. Life cycle assessment of electricity generation in
Mexico. Energy 2011; 36: 1488-1499. DOI: 10.1016/j.energy.2011.01.018
[48] Li DY, Wang HJ, Qin YL, Han L, Wei XZ, Qin DQ. Entropy production analysis of hysteresis
characteristic of a pump-turbine model. Energy Conv. Manag. 2017; 149: 175-191. DOI:
10.1016/j.enconman.2017.07.024
[49] Shan W, Cai S, Liu C. A New Comprehensive Evaluation Method for Water Quality: Improved
Fuzzy Support Vector Machine. Water 2018; 10. DOI: 10.3390/w10101303
[50] Yang W, Xu K, Lian J, Bin L, Ma C. Multiple flood vulnerability assessment approach based on
fuzzy comprehensive evaluation method and coordinated development degree model. J. Environ.
Manage. 2018; 213: 440-50. DOI: 10.1016/j.jenvman.2018.02.085
[51] Cui X, Wu X, He X, Li Z, Shi C, Wu F. Regional suitability of virtual water strategy: Evaluating
with an integrated water-ecosystem-economy index. J. Clean. Prod. 2018; 199: 659-667. DOI:
10.1016/j.jclepro.2018.07.192
[52] Al-Zahrani M, Abo-Monasar A, Sadiq R. Risk-based prioritization of water main failure using
fuzzy synthetic evaluation technique. J. Water Supply Res. Technol.-Aqua 2016; 65: 145-161. DOI:
1 2 3 4 5 6 7 8 9 10 11 12 13 14 15 16 17 18 19 20 21 22 23 24 25 26 27 28 29 30 31 32 33 34 35 36 37 38 39 40 41 42 43 44 45 46 47 48 49 50 51 52 53 54 55 56 57 58 59 60 61 62 63 64 65
45
10.2166/aqua.2015.051
[53] Niu C, Wang Q, Chen J, Zhang W, Xu L, Wang K. Hazard Assessment of Debris Flows in the
Reservoir Region of Wudongde Hydropower Station in China. Sustainability. 2015; 7: 15099-15118.
DOI: 10.3390/su71115099
[54] Liang X, Si D, Xu J. Quantitative Evaluation of the Sustainable Development Capacity of
Hydropower in China Based on Information Entropy. Sustainability 2018; 10. DOI:
10.3390/su10020529
[55] An X, Yang J. A method of eliminating the vibration signal noise of hydropower unit based on
NA-MEMD and approximate entropy. Proc. Inst. Mech. Eng. Part E-J. Process Mech. Eng. 2017;
231: 317-328. DOI: 10.1177/0954408915595763
[56] Lu S, Wei J, Bao H, Xue Y, Ye W. The dynamic hydropower troubleshooting information based
on EMD multi-scale feature entropy extraction. Int. J. Mob. Commun. 2017; 15: 677-692. DOI:
10.1504/IJMC.2017.10005657
[57] Farshad S, Sheikholeslami M. Turbulent nanofluid flow through a solar collector influenced by
multi-channel twisted tape considering entropy generation. Eur. Phys. J. Plus 2019; 134. DOI:
10.1140/epjp/i2019-12606-2
[58] Zhang H, Yu Y, Liu Z. Study on the Maximum Entropy Principle applied to the annual wind
speed probability distribution: A case study for observations of intertidal zone anemometer towers of
Rudong in East China Sea. Appl. Energy 2014; 114: 931-938. DOI: 10.1016/j.apenergy.2013.07.040
[59] Wang W, Chen Q, Yan D, Geng D. A novel comprehensive evaluation method of the draft tube
pressure pulsation of Francis turbine based on EEMD and information entropy. Mech. Syst. Signal
Proc. 2019; 116: 772-86. DOI: 10.1016/j.ymssp.2018.07.033
1 2 3 4 5 6 7 8 9 10 11 12 13 14 15 16 17 18 19 20 21 22 23 24 25 26 27 28 29 30 31 32 33 34 35 36 37 38 39 40 41 42 43 44 45 46 47 48 49 50 51 52 53 54 55 56 57 58 59 60 61 62 63 64 65
46
[60] Li HH, Chen DY, Arzaghi E, Abbassi R, Xu BB, Patelli E, Tolo S. Safety assessment of hydro
-generating units using experiments and grey-entropy correlation analysis. Energy 2018; 165:
222-234. DOI: 10.1016/j.energy.2018.09.079
[61] Chang JS. (2005). Transients of hydraulic machine installations, 1st edition. Higher Education
Press, Beijing, China. (in Chinese)
(http://img.sslibrary.com/n/slib/book/slib/10057902/c834ab3a8f2843e097e8aa3ad7741afd/e3c62973
01d349229340ea535d304909.shtml?dxbaoku=false&deptid=900&fav=http%3A%2F%2Fwww.sslibr
ary.com%2Freader%2Fpdg%2Fpdgreader%3Fd%3Dc4fe7d204b0ed79e69ccfc227b7364fc%26ssid%
3D10057902&fenlei=18130903&spage=1&t=5&username=113.140.84.100&view=-1)
[62] National Standard of the People’s Republic of China (GB/T 17189-2007). (2007). Code for field
measurement of vibrations and pulsation in hydraulic machines (turbines, storage pumps and
pump-turbines). China National Standardization Management Committee, Beijing. (in Chinese)
(http://www.gb688.cn/bzgk/gb/newGbInfo?hcno=1C52C4131671CE4A5257F19EA0584414)
[63] Krivchenko (Russia), translated by Chang ZT, Zhou WT, Wu PH. (1981). The power device of a
hydropower station in the transient process, 1st edition. Hydraulic press, Beijing, China. (in Chinese)
(http://img.sslibrary.com/n/slib/book/slib/11066187/67443d63249b4cbca8336ffa7d903383/b60da3fd
779c1556c656d1d9bc801be4.shtml?dxbaoku=false&deptid=900&fav=http%3A%2F%2Fwww.sslibr
ary.com%2Freader%2Fpdg%2Fpdgreader%3Fd%3Db595cbc6b1be242b2141742d0fbb6e77%26ssid
%3D11066187&fenlei=182109&spage=1&t=5&username=113.140.84.100&view=-1)
[64] Hua B. Application research of Bayesian networks into condition-based maintenance system of
hydroelectric set. Ph.D Dissertation. Huazhong University of Science and Technology, Wuhan, China.
2004, pp. 33. (in Chinese)

1 2 3 4 5 6 7 8 9 10 11 12 13 14 15 16 17 18 19 20 21 22 23 24 25 26 27 28 29 30 31 32 33 34 35 36 37 38 39 40 41 42 43 44 45 46 47 48 49 50 51 52 53 54 55 56 57 58 59 60 61 62 63 64 65
47
(https://www.cnki.net/KCMS/detail/detail.aspx?dbcode=CDFD&QueryID=1&CurRec=1&dbname=
CDFD9908&filename=2005036704.nh&urlid=&yx=&uid=WEEvREdxOWJmbC9oM1NjYkdwUlV
ZcHMrU2Q0WmFNRmhlWHh4alU3T0E5Qkc=$R1yZ0H6jyaa0en3RxVUd8df-oHi7XMMDo7mt
KT6mSmEvTuk11l2gFA!!&v=MjE5NzdJUjhlWDFMdXhZUzdEaDFUM3FUcldNMUZyQ1VSTE9
lWmVWdkZ5bmxVNy9NVjEyN0c3TzdHTmJNcTVFYlA=)
[65] Xu BB, Li HH, Pang WT, et al. Bayesian network approach to fault diagnosis of a hydroelectric
generation system. Energy Sci Eng. 2019; 00: 1-9. https://doi.org/10.1002/ese3.383