transforming the urban space through tod: the 3v approach
TRANSCRIPT
www.TransformingTransportation.org
Transforming the Urban Space through TOD:
The 3V Approach
Gerald Ollivier, Senior Infrastructure Specialist, World BankPresented at Transforming Transportation 2017

Transforming the Urban Space through TOD
The 3V Approach
Gerald Ollivier
Transport Cluster Leader
World Bank Hub Singapore
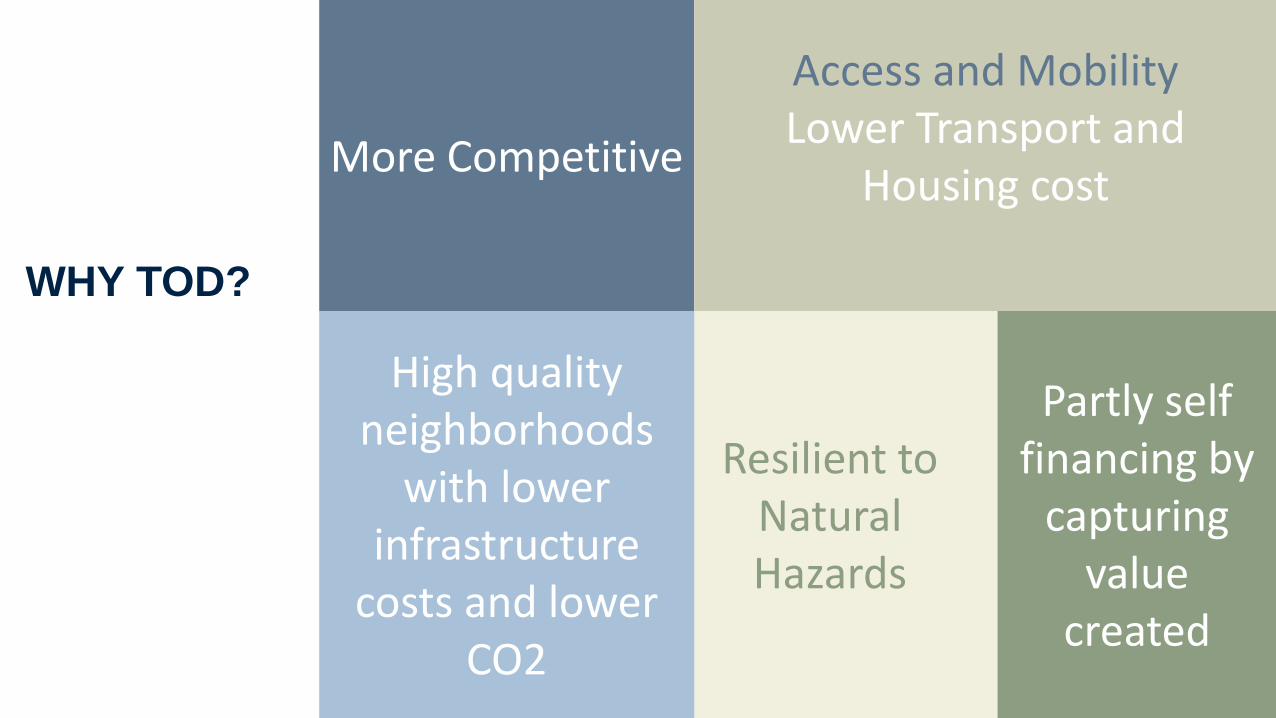
Resilient toNatural Hazards
More Competitive
Access and MobilityLower Transport and
Housing cost
High quality neighborhoods
with lower infrastructure
costs and lower CO2
Partly self financing by
capturing value
created
WHY TOD?

1 Align Human/Economic Densities, Mass Transit Capacity and Network
Characteristics for Greater Accessibility
2 Create Compact Regions with Short Commutes
3 Ensure Resilience of Areas Connected by Mass Transit
4 Plan and Zone for Mixed Use and Mixed Income Neighborhoods at Corridor Level
5 Create Vibrant, People-Centric Public Spaces Around Stations
6 Develop Neighborhoods that Promote Walking and Biking
7 Develop Good Quality, Accessible and Integrated Public Transit
8 Manage Private Vehicle Demand
8P
RIN
CIP
LES
FOR
IN
CLU
SIV
E A
ND
RES
ILIE
NT
TOD
Source: World Bank TOD COP

Planning for
Sustainable
Accessibility
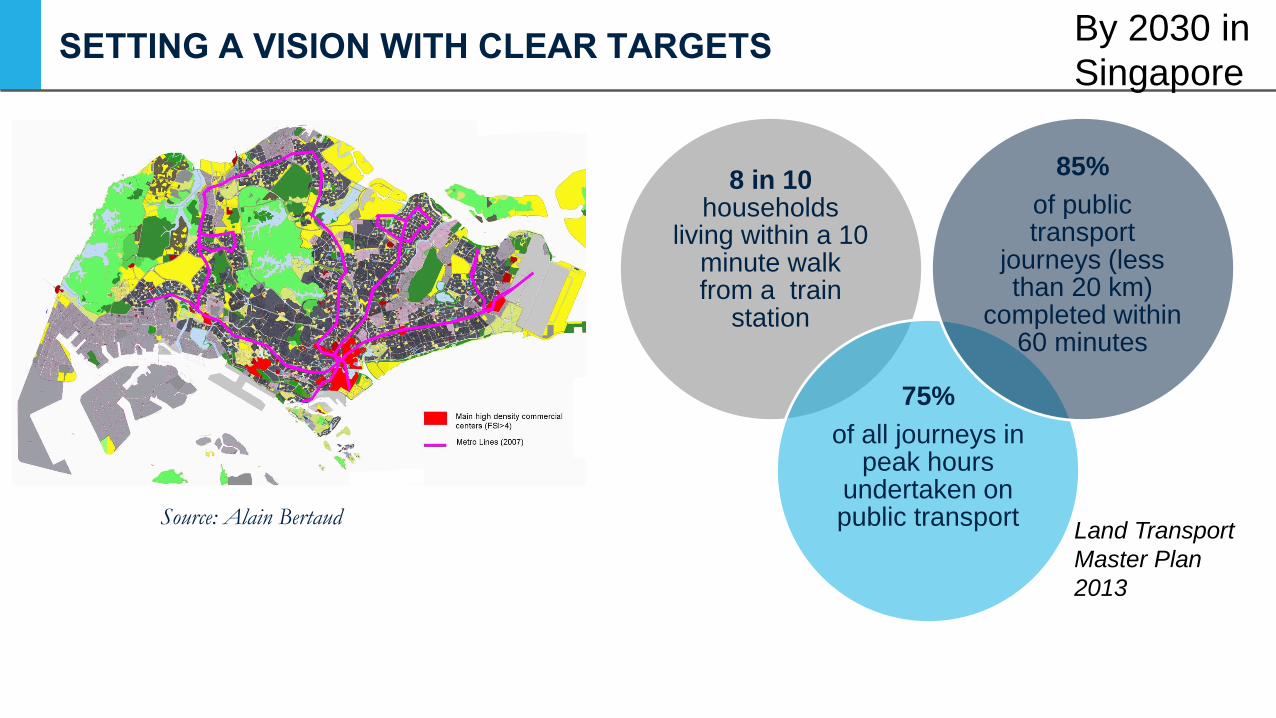
SETTING A VISION WITH CLEAR TARGETSBy 2030 in
Singapore
Land Transport
Master Plan
2013
8 in 10 households
living within a 10 minute walk from a train
station
75%
of all journeys in peak hours
undertaken on public transport
85%
of public transport
journeys (less than 20 km)
completed within 60 minutes
Source: Alain Bertaud

MEASURING JOB ACCESSIBILITY
7Source: The 3V Framework (World Bank)
a. Line 1, 2, and 3 and walking: 12% b. Scenario a plus bus: 28%
c. Scenario b plus TOD: 39% d. Scenario b plus bicycle: 46%
Zhengzhou
• Population:6.4 million
• GDP per capita: US$11k
• Peak hour accessibility
Percent of jobs accessible within 45
minutes by public transit

Articulating
Densities
using the
3V FrameworkSource: Erik FischerSource: Serge Salat

THE SPIKY URBAN ECONOMY OF GLOBAL CITIES

London’s Jobs hierarchy exponent
minus 1, (minus 0.7 for population
like in systems of cities in economic
geography); one third of jobs, 1.5
million jobs, in 16 km2 in London
Source: Urban Morphology Institute.
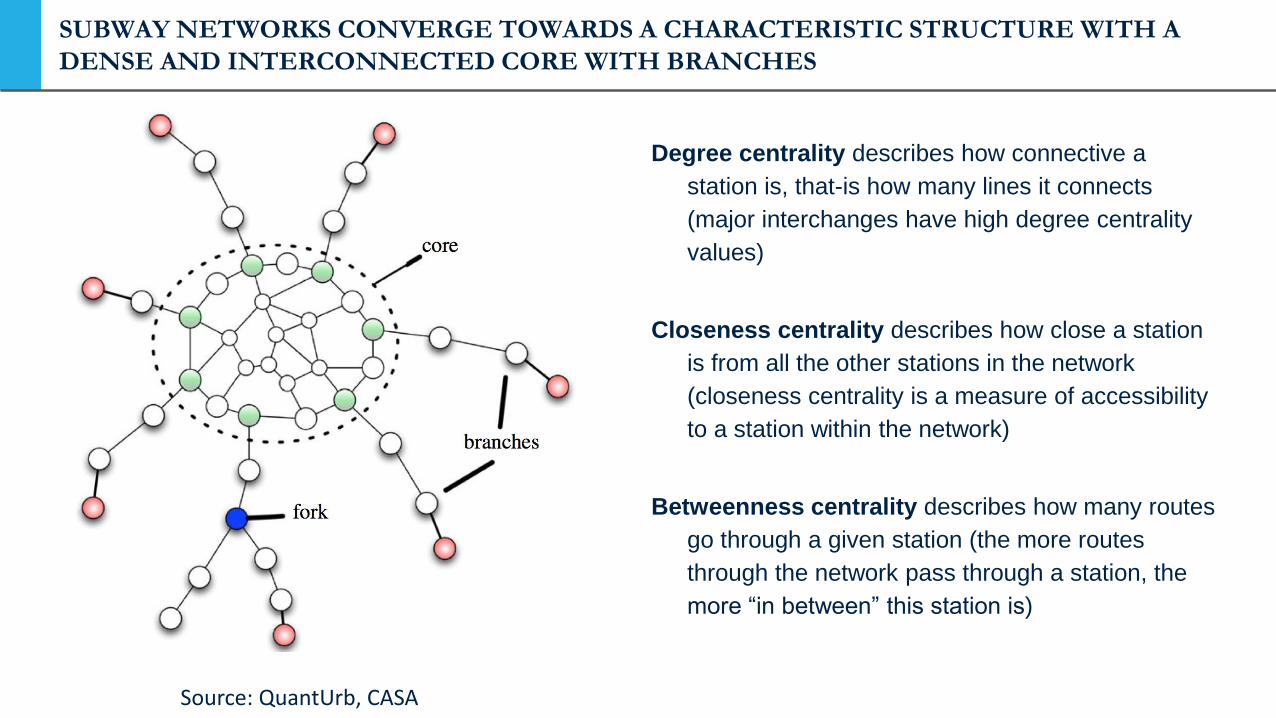
SUBWAY NETWORKS CONVERGE TOWARDS A CHARACTERISTIC STRUCTURE WITH A
DENSE AND INTERCONNECTED CORE WITH BRANCHES
Degree centrality describes how connective a
station is, that-is how many lines it connects
(major interchanges have high degree centrality
values)
Closeness centrality describes how close a station
is from all the other stations in the network
(closeness centrality is a measure of accessibility
to a station within the network)
Betweenness centrality describes how many routes
go through a given station (the more routes
through the network pass through a station, the
more “in between” this station is)
Source: QuantUrb, CASA

NETWORK CENTRALITIES IN LONDON
Centrality Source: Urban Morphology Institute
The stations along Crossrail route where property prices
have outperformed compared to the market are the ones located
in Central London where both jobs and connectivity are highly
concentrated © JLL
12

ZHENGZHOU-ARTICULATING DENSITIES
13
Densities are not uniform Need to articulate densities around network
Source: The 3V Framework (World Bank/Urban Morphology Institute)
Betweenness
centrality of
stations

3V FRAMEWORK
THERE IS NO ‘ONE SIZE FITS ALL SOLUTION: UNDERSTANDING WHERE, WHEN AND
HOW ECONOMIC VALUE CAN BE CREATED REQUIRES A TYPOLOGY
14
THE 3V FRAMEWORK
SERVES THE
FOLLOWING PURPOSES
Provides a quantified basis for understanding
development opportunities around mass transit stations
Facilitates interagency dialogue to identify misalignment
and imbalances between connectivity, accessibility, place
quality and market potential values and create an
aspirational vision of future land use based TOD
Achieves shared development vision with citizens, private
developers, and other stakeholders

PLACE VALUE, NODE VALUE AND MARKET POTENTIAL VALUE
Node Value: importance of a station in the public transport network derived from its passenger traffic
volume, inter-modality and centrality within a network. It is measured through a composite index
Place Value: urban quality of a place and its attractiveness to residents in terms of amenities,
schools and healthcare, type of urban development, local accessibility to daily needs by walking or
biking, quality of the urban fabric around a station, size of blocks, network of streets and pattern of
land use. It is measured through a composite index.
Market Potential Value: unrealized market value of station areas derived through the practice of
real estate market analysis. Measured by a composited index considering major drivers of demand
including current and future human densities, number of jobs accessible within 30 minutes of transit
and major driver of supply (developable land, FAR, market vibrancy)
15
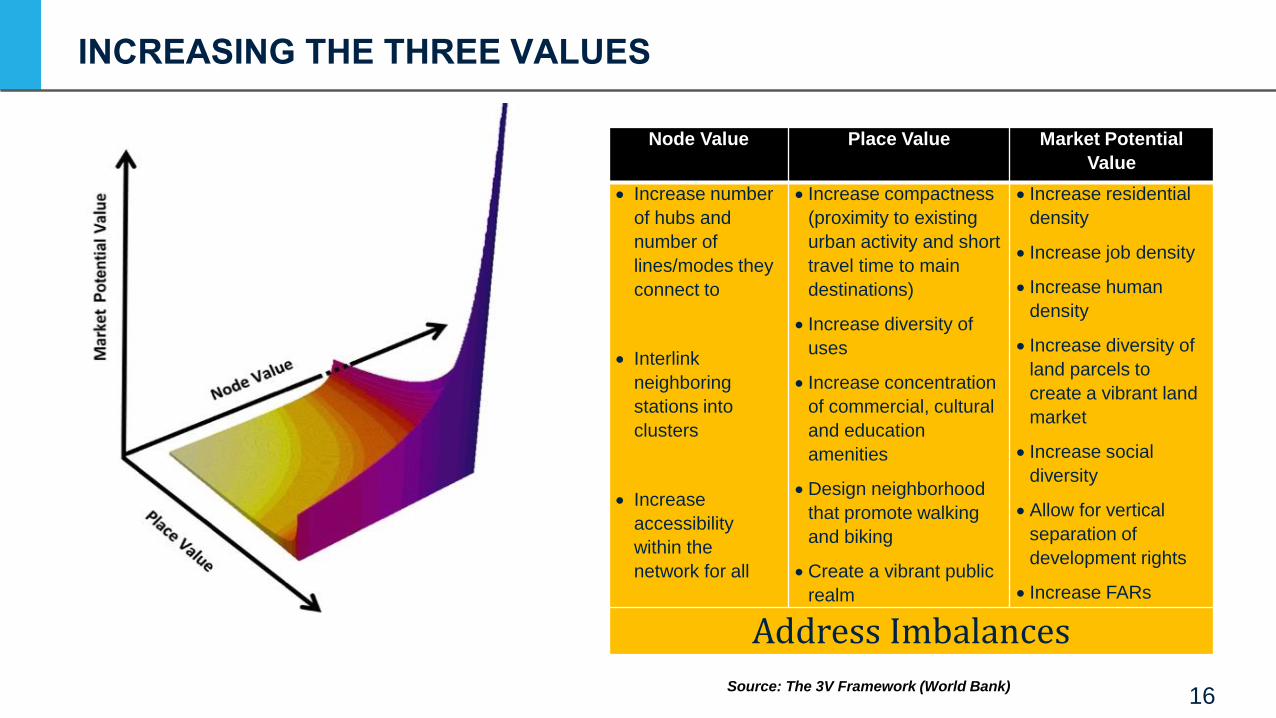
INCREASING THE THREE VALUES
16
Node Value Place Value Market Potential
Value
Increase number
of hubs and
number of
lines/modes they
connect to
Interlink
neighboring
stations into
clusters
Increase
accessibility
within the
network for all
Increase compactness
(proximity to existing
urban activity and short
travel time to main
destinations)
Increase diversity of
uses
Increase concentration
of commercial, cultural
and education
amenities
Design neighborhood
that promote walking
and biking
Create a vibrant public
realm
Increase residential
density
Increase job density
Increase human
density
Increase diversity of
land parcels to
create a vibrant land
market
Increase social
diversity
Allow for vertical
separation of
development rights
Increase FARs
Address Imbalances
Source: The 3V Framework (World Bank)
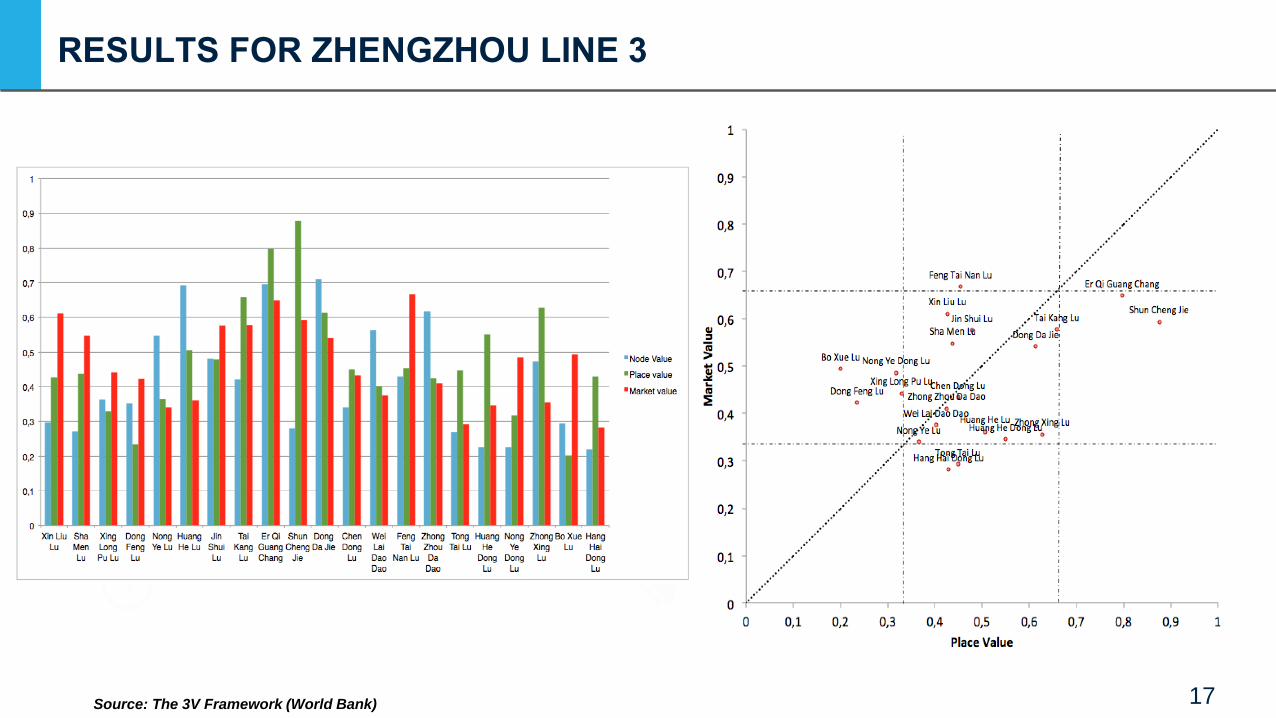
RESULTS FOR ZHENGZHOU LINE 3
17Source: The 3V Framework (World Bank)


OVERALL STRATEGIES
Infill is mainly for dependent nodes in suburban
neighborhoods with single transit lines and low value market. The strategy there is to:
• Promote long term planning
• Increase activity levels and transit service through increased densities
• Plan and fund multimodal transportation system
• Plan for maintaining equity in vulnerable or challenged communities
Intensification is for emerging station areas in urban
neighborhoods with interchanges and emerging markets. The strategy there is to:
• Invest in catalytic TOD projects to prime and push the market
• Promote development oriented planning
• Evaluate and address missing multimodal connections and accessibility
• Prime areas for affordable housing
Transformation is the strategy to be applied in major hubs
where creating a high level of place value through job
concentration and good urban design with major investments
in public spaces can create high peaks of land and real
estate value.
• Invest in aggressive TOD projects to push the market
• Significantly higher densities and lower parking ratios
• Innovative building types and advancements in urban
design & living, employment uses and destination
• Encourage some affordable or work force housing
• Foster increased transit service, capacity and amenities
to support intensity of uses
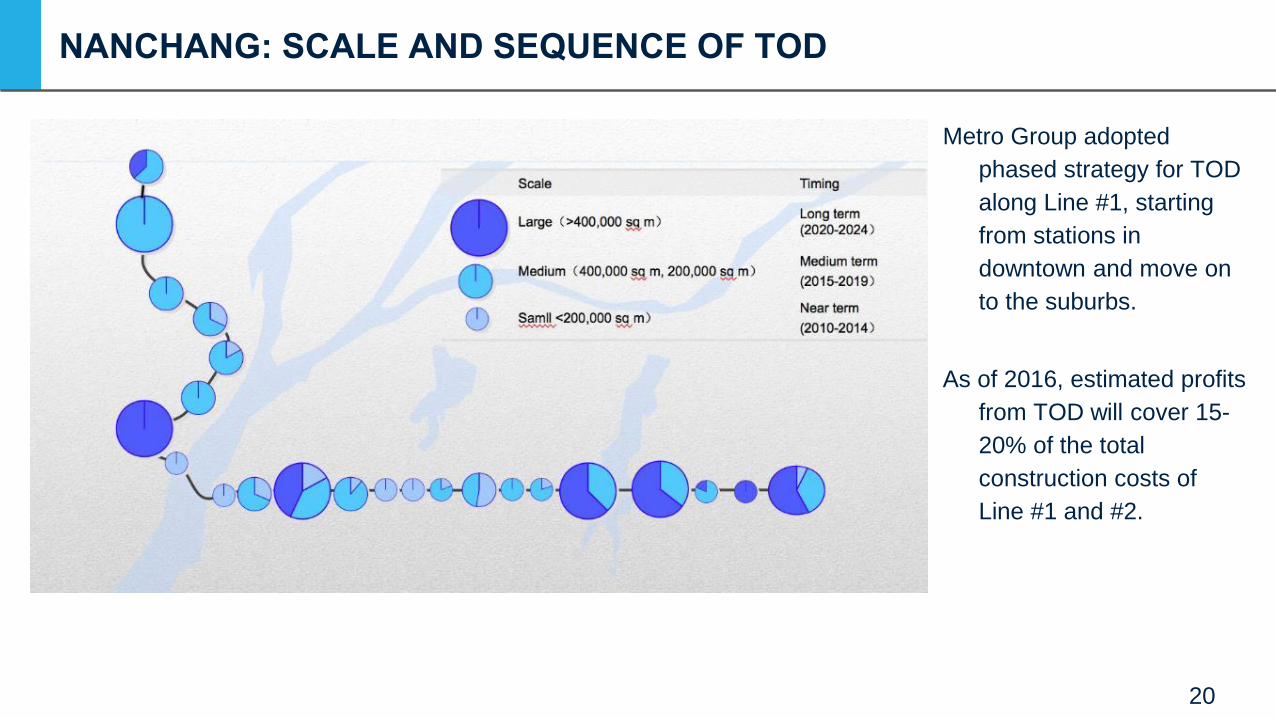
NANCHANG: SCALE AND SEQUENCE OF TOD
Metro Group adopted
phased strategy for TOD
along Line #1, starting
from stations in
downtown and move on
to the suburbs.
As of 2016, estimated profits
from TOD will cover 15-
20% of the total
construction costs of
Line #1 and #2.
20

Community of
Practice on
Transit Oriented
Development
Goal: Developing a critical
mass of expertise and
resources across sectors
and regions to support the
implementation of TOD
principles in cities
Lim
aS
ao P
aolo
Rio
de
Jane
iroS
uraba
yaH
CM
CD
anang
Tia
njin
Nan
chang
Kun
min
gZhen
gzho
uG
uiya
ng
Qin
gya
ngA
ddis
Aba
ba
Dar
es
Sal
aam
Mek
kah
Cap
e T
own
Mex
ico
Bog
ota
Rec
ifeM
umbai
Indi
a R
ail
Sta
tion
City Scale
Land Use Policy and Strategy
Legal and Regulatory Framework
Integrated Land Use and Transport
Modeling of TOD
Leveraging Private Sector
Improving Accessibility around Stations
Capacity Building
Corridor Scale
Understanding Transformation Potential
Integrated urban/transport development
Legal and Regulatory Framework
Design and Planning Guidelines
Feasibility Study
Operational guide
Accessibility Plan and Integrated Transport
Financing Scheme/LVC
Citizen Engagement
Capacity Building
Evaluation
Social housing
Station Scale
Feasibility Study for PPP and TOD/structuring
Conceptual Design
Accessibility planning
Case Studies
Public space at local scale

Transit Oriented Development
Community of Practice Website
now OPEN to External Members by Registration
https://collaboration.worldbank.org/groups/tod-cop
For more [email protected]