transforming natural resource wealth into sustained …documents.worldbank.org/curated/en/... ·...
TRANSCRIPT
Policy ReseaRch WoRking PaPeR 4852
Transforming Natural Resource Wealth into Sustained Growth and Poverty Reduction
A Conceptual Framework for Sub-Saharan African Oil Exporting Countries
Achille Toto Same
The World BankAfrica RegionPoverty Reduction and Economic Management DivisionMarch 2009
WPS4852P
ublic
Dis
clos
ure
Aut
horiz
edP
ublic
Dis
clos
ure
Aut
horiz
edP
ublic
Dis
clos
ure
Aut
horiz
edP
ublic
Dis
clos
ure
Aut
horiz
ed
Produced by the Research Support Team
Abstract
The Policy Research Working Paper Series disseminates the findings of work in progress to encourage the exchange of ideas about development issues. An objective of the series is to get the findings out quickly, even if the presentations are less than fully polished. The papers carry the names of the authors and should be cited accordingly. The findings, interpretations, and conclusions expressed in this paper are entirely those of the authors. They do not necessarily represent the views of the International Bank for Reconstruction and Development/World Bank and its affiliated organizations, or those of the Executive Directors of the World Bank or the governments they represent.
Policy ReseaRch WoRking PaPeR 4852
Oil and mineral revenues raise national savings and hence facilitate investment, capital accumulation, and sustained growth; thus, there are benefits of owning large natural resources. There can be a significant spillover effect from the oil sector to the non-oil sector particularly if governments are committed to bridge the infrastructure gap and promote the non-oil economy and foremost the non-oil tradable sector. Consequently, the capacity for coordinated policy formulation and execution is fundamental as well as sound windfall management mechanisms and institutions. This
This paper—a product of the a product of the Poverty Reduction and Economic Management Division, Africa Region—is part of a larger effort in the department to help African Oil Producing Countries, manage and transform their natural resource wealth into long-term economic growth that spreads the benefits more fairly among their people for an effective poverty reduction. Policy Research Working Papers are also posted on the Web at http://econ.worldbank.org. The author may be contacted at [email protected].
conceptual framework uses the case of Indonesia and the example of Norway to argue that the resource paradox is avoidable. Abundance should not be a curse, but rather a blessing for Sub-Saharan Africa’s oil and mineral exporting countries. The country context and political economy matter a great deal but should not be the main driving forces behind windfall management, to avoid excessive rent-seeking activities, inefficiency, and wasteful spending. The EITI++ implementation can contribute to make a difference, mostly through capacity building, implementation assistance, and coordination support.

Transforming Natural Resource Wealth into Sustained Growth and Poverty Reduction:
A Conceptual Framework for Sub-Saharan African
Oil Exporting Countries
Achille Toto Same

2
Table of Contents I – Introduction ............................................................................................................... 3 II – Sub-Saharan Africa’s Oil Exporting Countries’ Sustained Growth Path: Setting the Stage................................................................................................................................ 6 III – Back to the Main Resource-Rich Macroeconomic Impediment: The Dutch Disease .......................................................................................................................... 13 IV – Effectively Managing Boom and Bust Cycles...................................................... 23 V – Addressing Institutional Issues: Avoiding the Rent-Seeking-Disease in Sub-Saharan Africa’s Oil Exporting Countries.................................................................... 26 VI – Transforming Oil and Mineral Rents into a Sustained Growth-Path and Durable Poverty Reduction in SSA ............................................................................................ 30 VII – Conclusion........................................................................................................... 39 VIII. References.......................................................................................................... 41
I – Introduction
The enormous body of literature on the Resource Curse provides several
explanations for the detrimental effects of natural resources particularly on growth.
Among the persistent and rather robust explanations is the negative effect of real
effective exchange rate appreciation due to the spending effect and subsequently the
resources reallocation effect and its impact on the tradable sector.
The curse is a clear probability and a number of examples, in Sub-Saharan Africa
and elsewhere, clearly indicate that context conditions have to be added to the equation
when studying the exact mechanisms and transmission channels of the “curse”. The curse
does not strike in the same way in a country with sound institutions and good leadership
as in a country with poor institutions and slack political economy environment. These
contexts and conditions deserve differentiation and it is important to make a distinction
between the pre-resource extraction conditions and environment, such as the general level
of development and the political system and resource specific conditions, and their
magnitude and relations between identity groups.
The theoretical challenge of a contextually sensitive study of the political
economy of natural resources should capture complexity. This applies to dynamics and
interplays between the context conditions as well as the direction and nature of the
relationship. This calls for precise concepts; carefully formulated hypotheses that
integrate complexity rather than simplify relationships. The political economy and the
political dynamics seem to be as important as the Dutch Disease and probably in the
context of Sub-Saharan Africa that is what matters the most, given their influence on the
decision underlying the utilization of windfalls.
The resource curse or resource paradox is not unavoidable; a sound resource-led
development strategy and well articulated and efficient public investment program (PIP)
along with sound public finance management (PFM) will contribute to make a difference.
In the context of an oil boom or other mineral boom, the structure of the economy is
fundamentally transformed; these changes, together with the revenues from oil exports,
3

could set the stage for a sustained growth-path and economic development. Natural
resource endowments have helped many countries (Norway, Malaysia, Botswana,
Finland and Indonesia) to grow and diversify, in part by providing a basis for developing
associated technologies and capital goods industries.
The governance aspect is equally important. Actually, fiscal and tax regimes, in
other words, government’s take on oil and mineral exploitation in Africa, are by no
means uniform. A multitude of revenue extraction instruments or systems are currently in
place in different countries in Africa from the government side to capture some of the
benefits for the state and the public. It is therefore critical to understand the environment
in the very beginning and early stages of the rent production or revenue chain by
assessing the arrangements in place to eventually improve transparency throughout the
revenue chain and by the same token improve efficiency and revenue allocation.
Once oil and mineral resources are secured, the next challenge is to ensure
efficiency and sound allocation to promote the development process in general and
poverty reduction in particular. This is done essentially through the national budget. The
budget is the main vehicle and an active policy instrument in the hands of governments to
promote their development strategy and poverty reduction programs through efficient
allocation of resources to implement their medium-term development vision.
The immediate challenge often facing the authorities is to prepare a
comprehensive development strategy to reduce poverty and foster broad-based economic
growth. A well formulated and prioritized budget is critical in this regard. With
substantial oil and mineral wealth, mineral-rich countries should be able to make rapid
progress toward the development process and poverty reduction. Windfalls or oil and
mineral rents are in principle channeled through the national budget, and should be
integrated into the budget; therefore, the quality of budget execution matters.
Nonetheless, the quality of budget execution depends on the quality of budget
preparation.
4

As a matter of improving the overall development performance of mineral-rich
developing countries, the World Bank recently launched (on April 2008) the Extractive
Industries Transparency Initiative Plus Plus (EITI++) initiative, which aims at helping
developing countries, particularly African countries, manage and transform their natural
resource wealth into long-term economic growth that spreads the benefits in the country.
The initiative is the perfect framework for mineral rich countries in Africa, provided that
the initiative is successfully carried out.
The EITI++ in addition to improving transparency and accountability will rightly
focus on the resource chain, including managing revenues and promoting sustainable and
efficient utilization of natural-resource wealth. It could provide governments with a range
of options including technical assistance and capacity building for improving the
management of natural-resource-related wealth for the benefit of the overall economy
and notably the implementation of good policies to promote sustained growth and
poverty reduction.
The purpose of this conceptual framework is an attempt to provide a
comprehensive approach that could contribute to address the resource paradox and
promote sustained growth and hence durable poverty reduction in Sub-Saharan Africa
(SSA). It aims to draw from international experience, country specificities, SSA’s
context, and the very nature of natural-resource abundance. This could eventually support
the EITI++ implementation.
5
II – Sub-Saharan Africa’s Oil Exporting Countries’ Sustained Growth Path: Setting the Stage
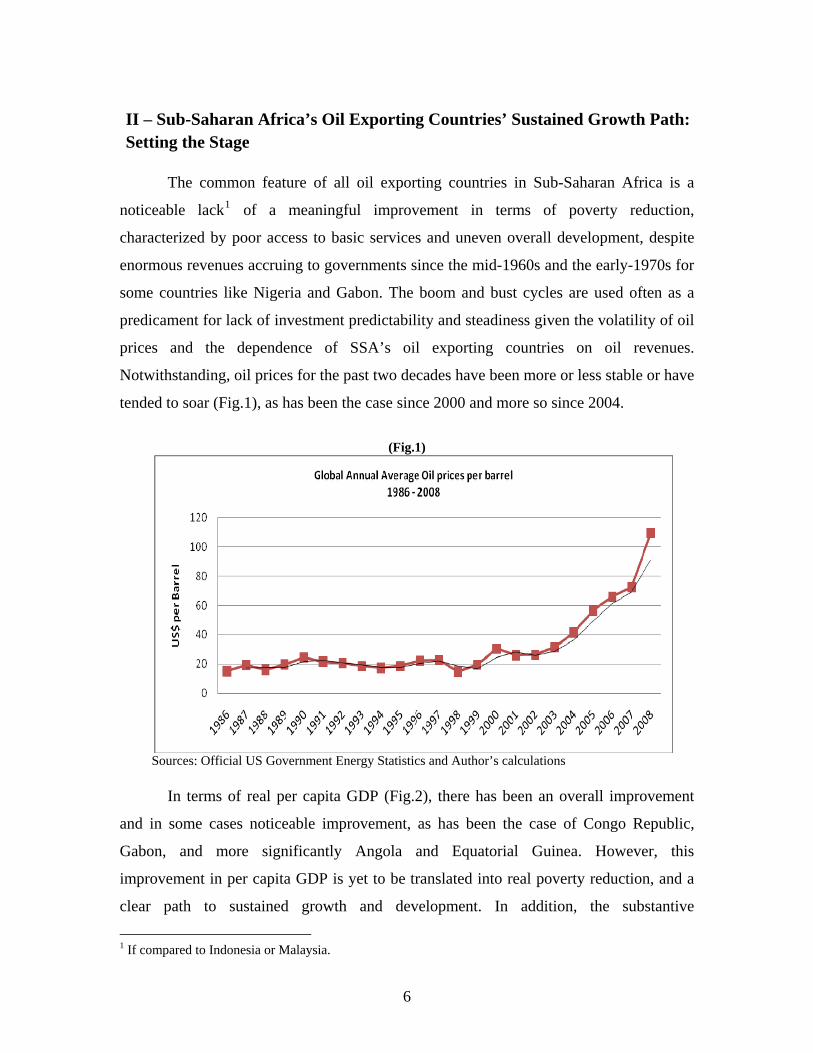
The common feature of all oil exporting countries in Sub-Saharan Africa is a
noticeable lack1 of a meaningful improvement in terms of poverty reduction,
characterized by poor access to basic services and uneven overall development, despite
enormous revenues accruing to governments since the mid-1960s and the early-1970s for
some countries like Nigeria and Gabon. The boom and bust cycles are used often as a
predicament for lack of investment predictability and steadiness given the volatility of oil
prices and the dependence of SSA’s oil exporting countries on oil revenues.
Notwithstanding, oil prices for the past two decades have been more or less stable or have
tended to soar (Fig.1), as has been the case since 2000 and more so since 2004.
(Fig.1)
Sources: Official US Government Energy Statistics and Author’s calculations In terms of real per capita GDP (Fig.2), there has been an overall improvement
and in some cases noticeable improvement, as has been the case of Congo Republic,
Gabon, and more significantly Angola and Equatorial Guinea. However, this
improvement in per capita GDP is yet to be translated into real poverty reduction, and a
clear path to sustained growth and development. In addition, the substantive
1 If compared to Indonesia or Malaysia.
6

improvement in per capita GDP noticed in several of SSA’s oil exporting countries can
be explained by the magnitude of oil revenues relative to the size of their population. This
is not to discount Nigeria’s poor performance in terms of real per capita GDP,
particularly because Nigeria is by far the largest oil exporting country in Africa and has
been in this position since the mid-1960s. Nigeria’s per capita GDP in 2000 remained at
its 1965 level, about US$325 per capita GDP, after having spent more than US$350
billion in oil revenues. The amount spent did not seem to have changed or added
significantly to the standard of living.
(Fig. 2)
Source: World Economic Outlook database, IMF.
Another characteristic common to all SSA’s oil exporting countries is the
significant level2 of government revenue proportional to GDP (Fig.3), with the notable
exception of Cameroon, which is somehow atypical given that Cameroon3 is one of the
most diversified economies in SSA in addition to being an oil exporter with a wide and
sophisticated fiscal base. A comfortable level of government revenue is a critical
advantage to promote the development process. In that context, a sound resource-led
development strategy and well articulated public investment program (PIP) could
2 Chad is the latest SSA’s country to become oil exporting country. Since the on-stream of oil in 2004, there have been some improvements. 3 Excluding South Africa and Nigeria.
7

contribute to make a difference, provided that the promotion of the tradable sector
remains the cornerstone of the development strategy.
(Fig. 3)
Source: World Economic Outlook database, IMF.
Similarly SSA’s oil exporting countries also display a comfortable level of
domestic saving rate relatively to GDP, again with the notable exception of Cameroon. I
benchmarked oil exporting countries against SSA’s middle-income countries4 including
South Africa, also known as the most successful in Africa, to underline the remarkable
level of oil exporting countries’ domestic saving rate. It should be mentioned that some
middle-income countries are also successful mineral-rich countries, like Botswana, with a
sizable domestic saving rate, and South Africa, a different type and level of economy.
The domestic saving rate is noteworthy because of the overall saving and
investment gaps the continent as a whole is facing, in other words the structural
constraint5 that impedes a possible sustained growth path as has been the case of
Indonesia or Malaysia. The good level of domestic saving - thanks to oil exploitation - is
4 SSA’s middle-income countries excluding South Africa are: Botswana, Cape-Verde, Lesotho, Mauritius, Namibia, Seychelles, and Swaziland. 5 SSA’s oil exporting countries and for that matter other mineral-rich countries in Africa are less constrained by the lack of saving and foreign reserves therefore should be able to make substantive investment decisions for poverty reduction.
8

therefore a critical macroeconomic advantage for SSA’s oil exporting countries and
grounds for the substantive investment necessary for a sustained-growth-path and durable
poverty reduction (Fig. 4).
(Fig. 4)
Source: World Economic Outlook database, IMF.
Countries in SSA are unlike the United States and other advanced countries,
where domestic saving6 does not matter very much for investment because these
countries are able to attract enormous flows of foreign direct investment and portfolio
investment.7 As such, they are capable of compensating for the weak level of national
saving. This is not the case when it comes to SSA. The level of national saving needs to
be increased to sustain investment in SSA and, although investment is not the sole engine
of growth, notwithstanding, capital accumulation remains a centerpiece of that process. In
general, it is difficult to find countries that have been able to grow at high and sustained
rates for long periods without an important effort in capital formation or (using another
word) sustained investment. SSA’s oil exporting countries, because of their comfortable
level of domestic saving, are less constrained by the generally weak level of saving in
SSA.
6 However, a certain level is required for basic macroeconomic fundamentals. 7 In aggregate, FDI and portfolio investment are nevertheless international savings.
9

Investment is the centerpiece of growth; consequently ensuring an adequate level
of saving8 should remain a central policy concern, particularly for SSA economies, where
foreign investors seem reluctant to invest beyond investment in extractive industries.
Traditional development theory since WWII has emphasized the very fact that the long-
run rate of economic growth is largely dependent on the saving rate. Saving determines
investment, and they reinforce each other—technological change is implicitly taken as a
function of investment—and thus, the rate of capital accumulation, which is the basic
determinant of long-run growth (Chakravarty 1993; Marglin and Schor 1990). The notion
that raising the investment rate is a key parameter to increasing long-run growth or
sustained growth has been at the heart of growth thinking since David Ricardo.
Correlatively, a comfortable level of exports is critical in developing countries to
sustain an adequate level of necessary imports. It is indispensable to import basic
technology to break the supply side constraint and to modernize the structure of
production. This is more so in SSA, which is characterized by a narrow export base and
weak export performance. Thanks to oil exploitation in SSA’s oil exporting countries, the
level of exports to GDP is more than comfortable. In SSA’s good oil exporting countries,
overall export performance proportionally to GDP is an additional substantive advantage
for their development financing toward a sustained growth path.
Industrial productivity in Tanzania, for example, was hampered by the weak
capacity to export (Ndulu 1986; Devarajan, Easterly, and Pack 1999). At Tanzania’s
independence, more than 80 percent of the manufactured goods consumed in the country
were imported, and the manufacturing sector accounted for only 4 percent of GDP. A
succession of government plans placed heavy emphasis on import-substituting industrial
investments for basic consumer goods, construction, and related capital goods. Between
1965 and 1980, real investment in manufacturing grew by 21 percent a year. And in
1986–90, investment rose to the remarkable level of more than 100 percent of
manufacturing value added. Despite this massive expansion, output per worker fell as
8 Regardless of whether saving is the main force driving growth, ensuring adequate levels of saving is fundamental to provide sufficient financing for investment and to avoid balance-of-payments disequilibria and unnecessary debt burden.
10

production rose slowly and capacity utilization collapsed. The most important factor
appears to have been a critical shortage of imported inputs and spare parts following the
balance-of-payments crisis after 1974. Tanzania’s industrial drive failed because
investment could not generate enough manufactured exports to fund continuing imports
of the materials needed to sustain production. This backdrop is not likely to be the case of
SSA’s oil exporting countries given their good export performance (Fig. 5).
(Fig. 5)
Source: World Economic Outlook database, IMF.
Imports are indispensable inputs in developing economies; therefore, they should
be treated explicitly as a factor of production in long-run growth models. Hence, the
capacity to export, as a means to generate more foreign exchange resources, so as to
finance the desired technology-embodied capital goods and to acquire advanced
technology9 from abroad, is fundamental for the structural transformation (Bochove
1982). This backdrop meant to emphasize the critical importance of good export
performance to fuel sound development financing as illustrated by Malaysia and
Indonesia, which have been able to generate enough manufactured exports to fund
continuing imports of the materials needed to sustain production. SSA’s oil exporting
countries could eventually put their countries on a sustained growth-path given their
abundance of resources and export performance proportional to GDP.
9 Some economists even claim that foreign technology imports are the most important factor in explaining the rapid economic growth of Taiwan (China), Korea, and other newly industrialized countries, by borrowing foreign technology rather than by generating new products or processes.
11

Natural resource income raises national savings and hence facilitates capital
accumulation and growth; thus, there are benefits of owning large natural resources.
There can be a huge spillover effect from the oil sector to the non-oil sector particularly if
governments are committed to bridge the infrastructure gap and to promote the non-oil
tradable sector and the non-oil economy as a whole. This is evidenced by the impressive
real non-oil GDP growth from 1997 to 2008 in almost all SSA’s oil exporting countries.
It is more the case for oil exporting countries where oil exploitation has been intensified,
for example, Angola, Equatorial Guinea, and to some extent Chad. This backdrop is not
to suggest that SSA’s exporting countries are on a sustained growth path - not yet -
instead that there are good prospects and a credible potential; provided good economic
policy implementation, including efficient resource allocation and sound public finance
management to avoid wasteful utilization of resources (Fig.6).
(Fig. 6)
Source: World Economic Outlook database, IMF.
Another advantage of owning large natural resources and revenue is the positive
impact they could have on the overall fiscal balance excluding grants (Fig.7). The overall
fiscal balance is an important aggregate which gives an indication of the ability or not of
a government to finance its development spending without having to resort to excessive
borrowing and official development assistance; although there is a cost to development
and resorting to debt could be a wise investment decision. Nevertheless, large revenues
12
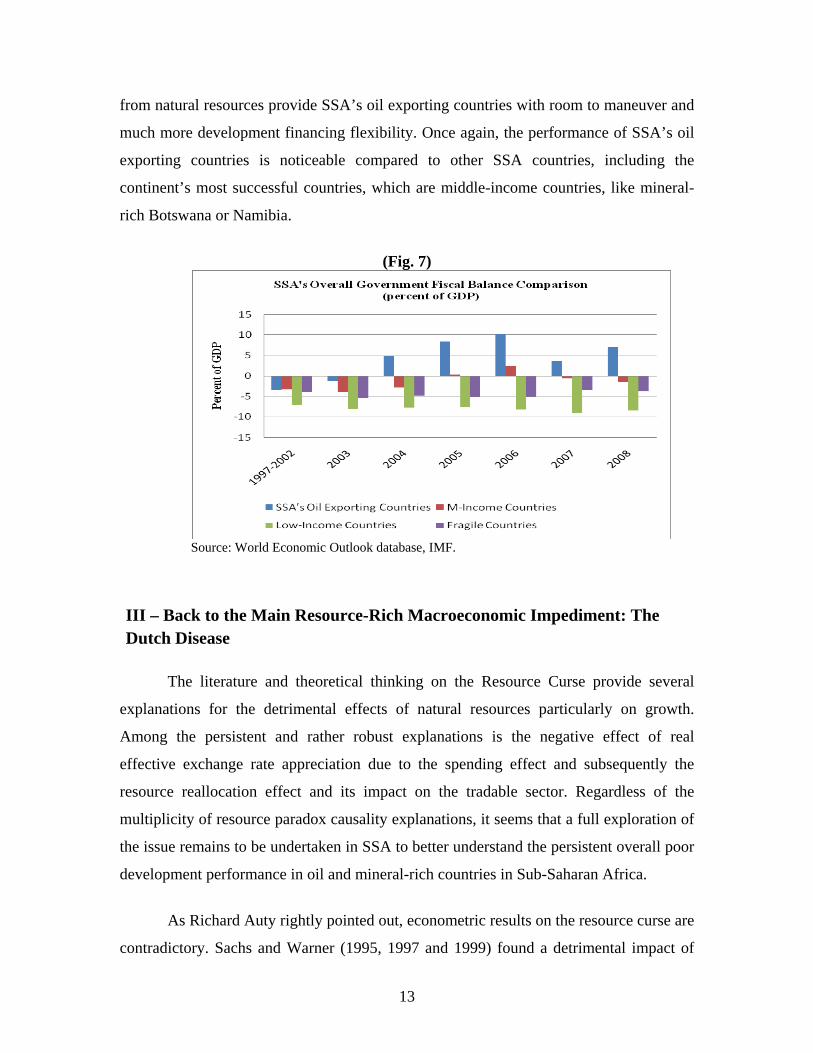
from natural resources provide SSA’s oil exporting countries with room to maneuver and
much more development financing flexibility. Once again, the performance of SSA’s oil
exporting countries is noticeable compared to other SSA countries, including the
continent’s most successful countries, which are middle-income countries, like mineral-
rich Botswana or Namibia.
(Fig. 7)
Source: World Economic Outlook database, IMF.
III – Back to the Main Resource-Rich Macroeconomic Impediment: The Dutch Disease
The literature and theoretical thinking on the Resource Curse provide several
explanations for the detrimental effects of natural resources particularly on growth.
Among the persistent and rather robust explanations is the negative effect of real
effective exchange rate appreciation due to the spending effect and subsequently the
resource reallocation effect and its impact on the tradable sector. Regardless of the
multiplicity of resource paradox causality explanations, it seems that a full exploration of
the issue remains to be undertaken in SSA to better understand the persistent overall poor
development performance in oil and mineral-rich countries in Sub-Saharan Africa.
As Richard Auty rightly pointed out, econometric results on the resource curse are
contradictory. Sachs and Warner (1995, 1997 and 1999) found a detrimental impact of
13
natural resource exports on growth, which they attributed to Dutch Disease. Acemoglu et
al. (2001, 2002 and 2004) found that the nature of institutions is more important than
resources. Lederman and Mahoney (2007) query both results and argue that natural
resource rents boost economic growth.
The Dutch Disease can be a real disease and a source of persistent slow growth, if
there is something special about the sources of growth in manufacturing (decline in
leading technological-knowledge sector) with production externalities or the learning-by-
doing stressed by Matsuyama (1992) where he assumed that there are increasing returns
to scale in manufacturing, but not in the resource sector. Hence an abundance of natural
resource makes the economy specialize in the less dynamic sector of the economy; thus
the economy loses the benefits of increasing returns to scale in manufacturing, which
leads to a decline in growth.
In principle the Dutch Disease10 can be seen as a matter of one sector benefiting
partly at the expense of others, therefore it is not an impediment per se; however the
disease is potentially harmful if there is something special about the reallocation of
resources between sectors, for example from high-tech service industries to low primary
production (Gylfason 2001). The oil boom would therefore induce a decline in a
technologically leading sector of the economy with adverse consequences for long-term
growth. The resource shift can then become a true disease (Sachs 2007).
The paradox effect of natural resource abundance on the economy is commonly
described as an economy experiencing an export boom, and divided into three sectors:
(a) the booming export sector; (b) the lagging export sector – traditional exports - as the
two traded good sectors; and (c) the non-traded goods sector, which essentially supplies
domestic residents and might include retail trade, services and construction. In the
presence of the Dutch Disease, the traditional export sector gets crowded out by the other
two sectors (Corden and Neary in 1982).
10 The Dutch disease is a matter of concerns mainly because of its potentially deleterious consequence for economic growth.
14
Abundant mineral resource-led exports lead to an appreciation of the real
exchange rate by shifting production inputs (capital and labor - resource movement
effect11) to the booming mineral sector and non-tradable sector (retail trade, service, and
construction), thereby reducing the competitiveness of the non-booming sector (mostly
agriculture and manufacturing) and hence participating in their collapse. The shift to the
non-tradable sector accelerates domestic inflation12 (the spending effect of the boom does
increase the price of non-traded goods due to increased demand), which is responsible for
the real exchange rate appreciation. These short-term macro-adjustment problems result
in long-term effects on growth by reducing the country’s economic diversity and
increasing its reliance on exports from its natural resource sector.
Without discounting the robustness of the Dutch Disease transmission
mechanisms above explained, it is however useful to go back to the original context of
Dutch Disease and eventually to see how far the concept could possibly explain SSA’s oil
exporting countries’ development impasse. Indeed, the term Dutch Disease refers to the
fears of de-industrialization that gripped the Netherlands as a result of the appreciation of
the Dutch currency that followed the discovery of natural gas deposits. The appreciation
of the Dutch currency that followed the gas export boom reduced the profitability of
manufacturing and service exports13. Total exports decreased markedly to GDP during
the 1960s. Expansion of petroleum exports in the 1960s not only crowded out other
exports, actually reduced other exports disproportionately and fueled the fears of dire
consequences for Dutch manufacturing.
In fact based on existing data, SSA’s oil exporting countries’ manufacturing
sector almost does not exist and where it does, like it is case of Nigeria, it is neither
knowledge-driven nor globally competitive. It does not perform significantly better than
the natural resources sector; therefore, the positive effects of linkages are negligible. This
11 The marginal productivity of labor in the booming industry will increase and attract labor away from the non-booming industry. This change in the sectoral composition of labor is called the resources movement effect of the boom (Corden, 1982). - Managing Oil Wealth: The Case of Azerbaijan. IMF, 2004. 12 As the matter of fact, the non-tradable sector supply is inelastic in the short term so, when demand expands and resources move into the non-tradable sector, this causes prices to increase thereby induces real exchange rate appreciation. 13 Thorvaldur Gylfason. Lessons from the Dutch Disease: Causes, Treatment, and Cures - Institute of Economic Studies - University of Iceland. August 2001.
15

is clearly what I found in the case of Equatorial Guinea14 and Chad, and it is the case of
other oil exporting countries in Africa, where the manufacturing sector is yet to be
developed, to provide these countries with the much needed employment. Building on
this simple observation, a convincing15 case remains to be made if the Dutch Disease
could possibly be the main factor explaining the poor development performance of Sub-
Saharan Africa’s oil exporting countries.
Besides the simple observation above mentioned, it is not inevitable that existing
natural resources prevent the emergence of a dynamic economy or that the discovery of
such resource acts to dampen an already developed economy. Natural resources can be a
blessing rather than a curse. Norway is a case in point. Norway is one of the leading oil
exporters in the world, the country as yet to show clear symptoms of the Dutch disease.
On the contrary, growth has thus far remained stubbornly high (Thorvaldur Gylfason
2001). Norway was already a developed country when oil was discovered in the 1970s.
Natural resource income may raise national savings and hence facilitate capital
accumulation and growth; hence, there are benefits of owning large natural resources. Oil
exporting economies have averaged twice the savings rate of non-oil exporters globally
from 1960 to 1998 (Hausmann and Rigobon 2002). The position of a country before and
during the influx of wealth is often a factor among the many different variables ranging
from the political system in that economy to the status of other industries, if any, at the
time of resource exportation. The applicability of Dutch Disease is therefore limited in
context, particularly in the case of Africa, given the overall development level of these
countries and the structure of their economy.
Indonesia, besides Norway, is another success story account and the country was
similar to SSA’s oil exporting countries in the early 1970s. With a per capita income of
only $200 in 1974, Indonesia was the poorest country in the world to receive a substantial 14 Achille Toto Same; Mineral-Rich Countries and Dutch Disease: Understanding the Macroeconomic Implication of Windfalls and the Development Prospects. The Case of Equatorial Guinea. - World Bank’s Policy Research Working Paper, 4595. 15 For more accuracy, Sachs and Warner (2001) empirically found that extremely resources-abundant countries such as Nigeria, or Mexico and Venezuela, have not experienced sustained rapid economic growth, in addition, empirical growth studies tend to confirm this casual evidence. But to which extent it is due to Dutch Disease in the case of Nigeria, remains an open question.
16

windfall. With weak administration of the non-oil tax system, oil provided the
overwhelming bulk of government revenues before 1973. The government of Indonesia
therefore had less experience than the governments of most other oil exporters in
managing an economy strongly dependent on oil for foreign exchange. Notwithstanding
this lack of experience, Indonesia’s economic performance since 1973 has been the
strength of the non-oil tradable sectors (agriculture and manufacturing) and of non-oil
exports (Fig. 8); this is in stark contrast with the predictions of an economic model
centering on the Dutch Disease prediction16.
(Fig. 8)
Source: World Development Indicators Database, World Bank.
High non-oil growth rates were maintained throughout the two oil booms17, and at
least some benefits from spending the oil income seem to have spread to most segments
of the population, both rural and urban. Indonesian authorities undertook prudent
macroeconomic policies, which at the time required significant expenditure cuts and
correction of misaligned exchange rates in order to adjust to volatility in oil revenue.
Indonesia’s experience with oil management stands out as relatively successful compared
to other oil-exporting countries. The key factors that contributed to this success are as 16 Indonesia: Windfalls in a Poor Rural Economy- Bruce Glassburner; University of California in Gelb (1988) World Bank. 17 In 1973 and 1979.
17

follows: oil was not the only source of export earnings and export of other commodities
were generating considerable income; authorities did not rely on oil sector revenues alone
and tried to diversify the economy; the Indonesian government adapted macroeconomic
policies to changing external environment and was committed to a broad development
strategy that emphasize raising rural income and resulted in an interrupted growth (Fig.9)
for three decades and the severe Asian financial crisis in the late 1990s that dampened the
economy was short-lived and further demonstrated the strength of Indonesia
fundamentals, evidenced by its quick recovery.
(Fig. 9) Nigeria: Real GDP Growth from the late 1970s - 2006
Source: World Development Indicators Database, World Bank.
Good economic policies and institutional features combined with Indonesia’s
abundance of labor and non-oil resources as well as with technical changes in the food
crop sector, which oil revenues helped to accelerate by financing the diffusion of
improved techniques; together, they resulted in a distinctive pattern of growth and its
economic performance stands out as being successful and today, Indonesia is considered
as a successful emerging economy. The graph below (Fig.10) also shows that agricultural
sector still accounts in average about 20 percent of the overall value added of Indonesia’s
economy and it has been the case since the late 1970s.
18

(Fig. 10) Agriculture and Industry Value Added in % of GDP (From the late-1970s-2007)
Source: World Development Indicators Database, World Bank.
In all accounts the Dutch Disease seems to be avoidable furthermore, a
convincing case remains to be made in the case of SSA if the Dutch Disease is the main
factor explaining the poor development performance of SSA’s oil exporting countries.
Nigeria’s case so far has been the most studied by scholars and development
practitioners. The unanimous conclusion is so far that despite enormous revenues
accruing to the government since the mid-1960s estimated in a cumulative basis about
more than US$400 billion in 2007, the country development performance has been
disappointing; and by the per capita GDP standard, Nigeria remains amongst the 15
poorest nations in the world for which such data are available. There is no doubt that one
way or another, oil has had a detrimental impact on Nigerian development: But it is the
Dutch Disease? Or it is all about political economy and the country context-curse?
Sala-i-Martin and Subramanian (2003) provide evidence that suggests that Dutch
Disease is an inadequate explanation for Nigeria’s growth performance. The waste
explanation, on the other hand, appears to be overwhelming, with oil a key factor causing
a whole series of pathologies that have led to the waste. It is not clear that relative price
movements did in fact consistently disfavor the tradable sector even in the immediate
aftermath of oil windfalls; relative price movements were not correlated with oil prices so
that how oil windfalls were used rather than oil prices per se were more important in
determining relative prices; in fact decision to keep official exchange rate appreciated,
19

were to a greater extent related to the need to create rents, via the black market premium,
at a time when oil revenues were in decline18. Although the role of the agricultural sector
declined, it was offset by an increase in the size of the government sector in economic
activity, and the poor performance of the latter may well be the most important for
Nigeria’s long-term economic decline.
The growth decomposition of Nigeria’s performance since 1965, provided in
Sala-i-Martin and Subramanian (2003), presents two notable characteristics which are:
the rapid accumulation of physical capital, averaging 6.7 percent per year; and negative
TFP growth, averaging 1.2 per year. Oil was responsible for the physical capital
accumulation, suggested by the timing of the surge in investment. Between 1973 and
1980, the years of the two majors oil prices shocks, the capital stock grew at an average
rate of 14 percent per year, which represented a three-fold increase in the country’s
capital stock in 8 years. A substantial part of the increase was public capital spending
financed by the surging oil revenues. Public investment as a share of GDP rose by over 7
percentage points during the period of the oil shocks. Between the 1960s and the end of
the second oil shock the share of public sector in capital formation increased from 20
percent to 55 percent; and the real GDP growth (Fig.11) rate has been erratic compared to
Indonesia for the same period.
(Fig. 11) Nigeria: Real GDP Growth from the early 1970s - 2006
Source: World Development Indicator database, World Bank.
18 For the complete account, also see Gelb et. al 1988.
20
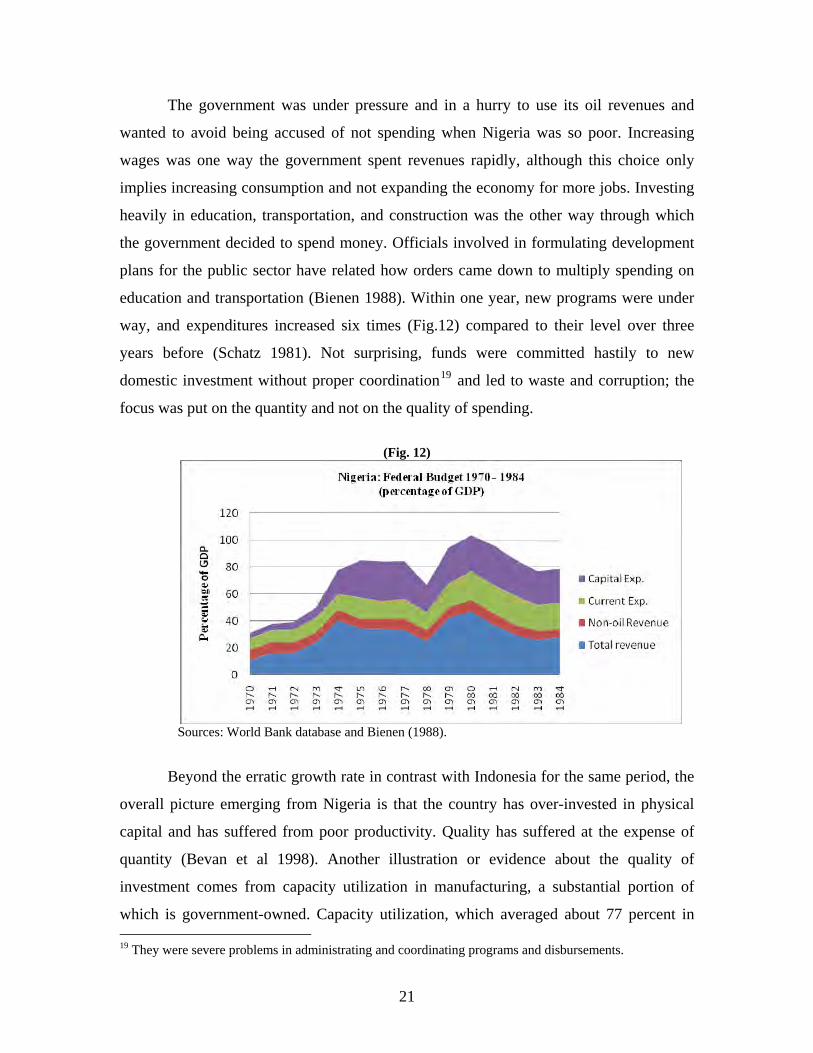
The government was under pressure and in a hurry to use its oil revenues and
wanted to avoid being accused of not spending when Nigeria was so poor. Increasing
wages was one way the government spent revenues rapidly, although this choice only
implies increasing consumption and not expanding the economy for more jobs. Investing
heavily in education, transportation, and construction was the other way through which
the government decided to spend money. Officials involved in formulating development
plans for the public sector have related how orders came down to multiply spending on
education and transportation (Bienen 1988). Within one year, new programs were under
way, and expenditures increased six times (Fig.12) compared to their level over three
years before (Schatz 1981). Not surprising, funds were committed hastily to new
domestic investment without proper coordination19 and led to waste and corruption; the
focus was put on the quantity and not on the quality of spending.
(Fig. 12)
Sources: World Bank database and Bienen (1988).
Beyond the erratic growth rate in contrast with Indonesia for the same period, the
overall picture emerging from Nigeria is that the country has over-invested in physical
capital and has suffered from poor productivity. Quality has suffered at the expense of
quantity (Bevan et al 1998). Another illustration or evidence about the quality of
investment comes from capacity utilization in manufacturing, a substantial portion of
which is government-owned. Capacity utilization, which averaged about 77 percent in 19 They were severe problems in administrating and coordinating programs and disbursements.
21
1975, started declining very quickly, to about 50 percent in 1983. Since the mid-1980s,
capacity utilization has never exceeded 40 percent, and has languished at around 35
percent. In other words, two-thirds of the investment in manufacturing by the government
is consistently wasted.
As Bevan et al (1998) noted, the oil windfalls enabled the government to
substantially increase its expenditure and thus provided increased opportunity for
kickbacks. In fundamental ways, the politics of Nigeria has been shaped by getting access
to the revenues from oil. Successive military dictatorships have plundered oil wealth and
created a huge civil service. Oil revenues financed the building of the famous Ajakouta
steel complex in the 1970s, which is yet to produce a commercial ton of steel. To appease
regional rivalries; steel-production capacity was divided among several locations of the
country. However the decision behind the steel industry was noble as it was a specific
manifestation of the drive for modernization and industrial self-reliance.
The Nigerian explanation shows that the complexity of country context matters in
Africa therefore should imperatively be taken into account, instead of quickly jumping to
conclusion using the Dutch Disease cliché as the main explanation of the poor
development performance of SSA’s oil exporting countries; if we are to efficiently
address the resource paradox issue and help Sub-Saharan African oil exporting countries,
manage and transform their natural resource wealth into long-term economic growth that
spreads the benefits into the country.
The political economy and the political dynamics seem to be more important than
the Dutch Disease causality explanations and probably in the context of Sub-Saharan
Africa that is what matters the most, given their influence on the decisions underlying the
utilization of windfalls. Transparency and accountability in the management of oil
revenues are therefore critical as well as good economic policies, if these countries are to
transform oil and minerals revenue into sustained growth-path and poverty reduction.
22
IV – Effectively Managing Boom and Bust Cycles
Besides the Dutch Disease, an alternative explanation of the curse puts the
emphasis on volatility. Natural resources rents tend to be very volatile and volatility has
been shown to be bad for growth, investment, income distribution, and poverty
reduction20. Managing this volatility is challenging, much of the gain made in a boom
unravels in the bust that follows; if not well managed boom and bust cycles can disrupt
government development programs and poverty reduction spending.
Boom and bust cycles plague oil exporting21 countries, given the importance of
oil in the overall economy and in government revenues. The economic impact includes
unpredictable revenue streams because widely fluctuating export revenues lead to
fluctuating levels in overall government revenues (Mikesell 1997). These frequent
upward or downward adjustments of fiscal expenditures are costly because they
simultaneously discourage private investment and destabilize the government’s budget,
therefore impeding its ability to sustain investment and social provision and service
deliveries (Katz et al. 2004). In addition, once expenditures become entrenched, it is
harder for governments to make budget cuts; rather than reversing their spending patterns
during busts, they often opt to borrow, and hence, risk incurring huge debt burdens.
Nigeria is a case in point, since the collapse of oil prices in the early 1980s.
Nigeria22 experienced rapid external debt buildup and exhausted foreign reserves. Public
and publicly guaranteed external debt increased from $4.3 billion to $11.2 billion, while
foreign exchange reserves were almost exhausted, from $10 billion to $1.23 billion, all
between 1981 and 1983. In early 1980s Nigeria was borrowing heavily from commercial
banks, mostly at floating interest rates. During 1984-1993, the public debt to GDP ratio
increased substantially and reached a staggering 140 percent of GDP. The consistent
20 Also see Gavin and Hausmann (1996), Ramey and Ramey (1995), Aizenman and Marion (1999); and Caballero (2000). 21 Although market volatility is a problem for all exporters of primary commodities, the phenomena is acute for oil exporting countries given the importance of oil in the overall economy. 22 Nigeria’s Growth Record: Dutch Disease or Debt Overhang? World Bank Policy Research Working Paper 4256, June 2007.
23
record of repeated rescheduling23 and continuing arrears since early 1980s have
effectively shut Nigeria out from international market for most of the past two decades.
Fiscal policy has been the major factor behind the debt expansion during the
period of oil price collapse and the subsequent collapse of the real GDP growth rate in
1981 – 1983 (Fig. 11). While the non-oil deficit was reduced substantially as a result of
the sizeable public expenditure cuts (Fig. 12), the drop in oil revenue as a result of the oil
price collapse was much larger. Consequently, the average annual non-oil deficit for the
period exceeded the average oil revenues by more than 50 percent of non-oil GDP. The
resulting large fiscal deficits translated in large current account deficits, which amounted
to $18 billion cumulatively over 1981-1983, in turn led to rapid buildup of unsustainable
external debt Budina, Pang and Van Wijnbergen (2007),
A country with large revenues derived from exploiting a nonrenewable resource
such as oil, typically faces two main problems: (i) the revenue stream is uncertain and
volatile because it depends on the world oil prices, and (ii) that revenue will eventually
dry up. Nonrenewable Resource Funds (NRFs) are proposed to deal with both problems.
First, a fund may be seen as able to stabilize budgetary revenues. When oil price is high,
the fund would receive excess resources, which would then allocate to the budget when
the price is low and therefore revenues. Second, a fund may be seen as a way to save
some of the revenue generated by exploiting the finite stock of the resource, which can
then provide income after it has been depleted. Funds may also be set up for other
reasons such as to counteract the spending effect leading to the real exchange rate
volatility and Dutch Disease, for liquidity and political economy purposes, and to
enhance governance and transparency (Jeffrey Davis et al. 2001).
Norway, for example, has charted a long-run-oriented, tax-based and reasonably
market friendly approach to the management of its oil resources. The oil revenue is
23 In 1982 and 1983, Nigeria accumulated commercial debt arrears for the first time and has been running arrears on its external debt ever since. Nigeria’s arrears on external debt have been rescheduled in successive agreements with the London Club (1984, 1987, 1989 and 1992) and the Paris Club (1986, 1989, 1991, and 2000). The last Paris Club debt reduction agreement was reached in October 2005.
24
deposited in the Norwegian Petroleum Fund24, which is being built up and invested
mostly in foreign securities for the benefit of the current generation of Norwegians when
the reach old age as well as for the future generations, and also in order to shield the
domestic economy from overheating and possible waste. At the same time, however, a
variable proportion of each year’s net oil-tax revenue is transferred from the
government’s Petroleum Fund to the fiscal budget, essentially to cover the non-oil budget
deficit25. Norway example constitutes the state of the art in term of fiscal management
rules; transparency and predictability in the management of oil windfalls utilization.
At end-2006, the fund’s assets were worth 114 percent of GDP and currently it
manages around US$350 billion. Other countries are using Norway’s standards as models
for their own Funds. Fiscal policy in Norway is anchored by a guideline that the
government’s structural non-oil deficit is supposed not to exceed 4 percent of the total
financial assets of the pension fund. The rationale for this guideline is that the long-run
real return on these assets is assumed to be 4 percent, which is about the equivalent of the
real return of the fund – the annual net real return has been 4½ percent since 1997-
Clausen (2008). The non-oil deficit benchmark helps make the dependence on revenues
from natural resources more transparent, hence contributes to a more long-term-oriented
fiscal policy. Only the permanent part of Norway’s oil revenue is being consumed with
this fiscal rule. This ensures a permanent and predictable availability of revenues
provided that Norway keeps its non-oil deficit under the 4½ percent of the total financial
assets of the fund.
Government spending however contains both an investment and a consumption
component; it could ultimately benefit the current generation as well as the future26
generation. Taking into account the investment impact on productivity and the incentives
it creates for private capital accumulation, countries with low capital stocks such as it is
the case of SSA’s oil exporting countries, benefit most if the government spends the
24 The Fund recently became Government Pension Fund. 25 Thorvadur Gylfason. The Paradox of Plenty – For the Statoil-Econ conference volume – Lessons from the Dutch Disease: Causes, Treatment, and Cures. March 2001. 26 Some countries have considered, or turned to the use of savings funds, which seek to create a store of wealth for future generation. This would allow the latter to benefit from part of the revenue arising from the depletion of exhaustible natural resources in the current period.
25

bulk27 of accruing oil revenues with the aim at increasing the return to private investment
and raising the country growth rate, Takizawa, Gardner and Ueda (2004). This result does
not simply follow from the fact that marginal return on investment spending in these
countries would be higher than the return on external financial assets. When the initial
capital stock is low and government spending has positive externalities on production, the
country would be better off spending more of its oil revenue upfront by increasing both
return to private investment and the country’s rate of growth. Hence, if oil revenue
investment lead to long-term benefits (e.g.; health, education and infrastructure), then
spending can permanently raise income, thus minimizing the tradeoff between current
and future generations.
Managing revenue volatility is a tricky task; nevertheless, strengthening the
fiscal28 management, adopting clear rules of the game upfront, and improving
transparency and accountability can help smooth the problem during the bust cycle.
Managing the bust cycle might be less an issue if revenues are well-managed during the
boom period; therefore improving public finance management (PFM) should be a
priority. Investing in the economy to the extent of the absorptive capacity could be a
wise decision, to spread the natural resource wealth into the country and in other to
increase the standard of living. Building up assets should also be a serious alternative
depending of the magnitude of oil revenues and country absorptive capacities.
V – Addressing Institutional Issues: Avoiding the Rent-Seeking-Disease in Sub-Saharan Africa’s Oil Exporting Countries
Existing empirical evidence seems to demonstrate without exception that
countries that have managed to circumvent the resource curse demonstrate superior
organizational settings with sound institutions or good leadership able to insulate
windfalls from political interferences: Norway for example is one of the perfect
illustrations for that matter. With natural resource wealth such as oil, there is so wealth
27 Provided that there is not absorptive capacity issue or it is taken into account in SSA’s oil exporting countries. 28 Also see Achille Toto Same; Windfall Management for poverty Reduction: Improving Public Finance Management. The Case of Chad. World Bank‘s Policy Research Working Paper 4596. April 2008.
26

floating around the government that it is easier to engage in unproductive rent-seeking
activities to appropriate that wealth rather than in creating more wealth. Weak institutions
may lead to wasteful spending or distorted allocation. It is widely recognized that the
quality of political and economic institutions such as the type of property rights
arrangements and the quality of state bureaucracy determines to a great deal whether
natural resource rents will be managed to the benefit of the economy and society, this is
clearly negatively evidenced by the disappointing case of Nigeria, in many regards.
Acemoglu, Johnson, and Robinson (2003), demonstrate that, although the
geography hypothesis emphasizes forces of nature as a primary factor in the poverty or
prosperity of nations, the institutions hypothesis is about manmade influences. According
to this view, some societies are organized in a way that upholds the rule of law;
encourages investment in machinery, human capital, and better technologies; facilitates
broad-based participation in economic and political life by the citizens; and supports
market transactions.
Three crucial elements of these organizational settings of good institutions are as
follows: (i) Enforcement of property rights for a broad cross-section of society, so that a
variety of individuals have incentives to invest and take part in economic life; (ii)
Constraints on the actions of elites, politicians, and other powerful groups so that these
people cannot expropriate the incomes and investment of others in the society or create a
highly uneven playing field; (iii) Providing some degree of equal opportunity for broad
segments of the society, so that they can make investments, especially in human capital,
and participate in productive economic activities
Acemoglu, Johnson, and Robinson (2004) and Rodrik, Subramanian, and Trebbi
(2002) further demonstrated that economic institutions matter for economic growth
because they shape the incentives of the key economic actors in society. In particular,
they influence investments in physical and human capital and technology, as well as the
organization of production. Although cultural and geographical factors may also matter
for economic performance, differences in economic institutions are the major source of
27

cross-country differences in economic growth and prosperity.29 Economic institutions
determine not only the aggregate economic growth potential of the economy but also an
array of economic outcomes, including the distribution of resources in the future. That
means they not only influence the size of the aggregate pie, but how this pie is divided
among different groups and individuals in society. Therefore, the quality of leadership in
SSA’s oil exporting countries is critical to positively influence the rule of the game
toward a sustained-growth-path, and poverty reduction; because political power—hence,
country’s leadership—determines economic institutions and policies.
There is now an international consensus on the critical necessity to strengthen
governance, transparency, and accountability in oil and mineral rich countries for poverty
reduction. Evidence has shown that with good institutions, large revenues generated from
extractive industries enjoyed by some SSA countries can foster economic growth and
reduce poverty; similarly, efficient management of government revenues and spending—
public expenditure management—can have a profound impact on poverty reduction.
Ensuring sound and transparent institutions to adequately managing natural resource and
more so in Sub-Saharan African’s oil and mineral exporting countries is fundamental
given their overall disappointing development performance in spite of their resource
endowments.
The EITI++ initiative aims at addressing this critical issue. Further to improving
transparency and accountability, the EITI++ is rightly focusing on the resource chain
including managing revenues, and promoting sustainable and efficient utilization of
natural-resource wealth. In fact, fiscal and tax regimes, in other words, governments’
takes on oil and mineral exploitation in Africa are by no means uniform. A multitude of
revenue extraction instruments or systems are currently in place in different countries in
Africa from the government side to capture some of the benefits for the state and the
public. It is therefore critical to understand the resource chain in the very beginning and
early stages of rent production by assessing the arrangements in place to eventually
29 For a detailed framework, please see Acemoglu, Johnson, and Robinson (2004).
28

improve transparency throughout the revenue chain and by the same token improve
efficiency and revenue allocation for sustained growth and poverty reduction.
This conceptual framework suggests and promotes the review of all mechanisms
and management arrangements related to oil and mineral revenues in every stage of the
resource chain. However, to avoid political complications and given the sensitivity of the
subject and to make the process more manageable, this framework suggests to stay away
from contract negotiations process between government and international private oil
companies, as well as from the adjudication of rights to extraction. Instead, it suggests to
focus on assessing the overall oil and mineral wealth governance and management
arrangements in place from the collection of taxes and royalties to sound and sustainable
projects, including possibly project monitoring, hence addressing the resource paradox.
For example what is the structure of governments’ rents? Is there any direct or
indirect taxation on international oil and mineral companies? Any corporate taxes? What
is the level of royalties if there are any? Is there any production sharing arrangement? Is
there any state equity fractional ownership? Are there any special mineral taxes
regulations?30 The objective is to help SSA’s oil exporting countries to adequately
manage their windfalls in a manner that spreads the benefits to the economy for sustained
growth and poverty reduction, while avoiding undermining legitimate private corporate
interests. This will require capacity building, economic policy advice and technical
assistance.
The immediate challenge often facing authorities is to prepare a comprehensive
development strategy to reduce poverty and foster broad-based economic growth. A well
formulated and prioritized budget is critical in this regard. With substantial oil and
mineral wealth, mineral-rich countries should be able to make rapid progress toward a
sustained-growth-path and poverty reduction. In general the budget is the financial mirror
of government policy. The preparation process is a powerful tool for coherence. The
budget is both an instrument of economic management and an implicit policy statement,
as it sets relative levels of spending and priorities for different programs and activities. In
30 The purpose here is to secure the source of revenues and to improve transparency in the revenue chain.
29
principle, the starting points for expenditure programming are: (i) a realistic assessment
of resources likely to be available to the government; and (ii) the establishment of fiscal
objectives. The capacity to translate policy priorities into the budget, and then to ensure
conformity of actual expenditures with the budget, depends in large part on the soundness
revenue forecasts for oil exporting countries.
This backdrop calls for a budget formulation and execution strengthening. What
are the budget preparation structures and procedures in place? Are they properly
working? On the capital budget side or the investment budget formulation: is there any
efficient public investment system to support the PIP? The overall assessment of
expenditure framework to improve transparency and accountability is also needed. What
are the budget execution and monitoring mechanisms and procedures in place? This
aspect is critically important.
As is well known, most of corruption activities and mismanagement are
happening around the budget execution stages, where most of the cash is susceptible to
floating around; therefore, it is fundamental to ensure that the principles of transparency
and accountability are well observed. What are the safeguard and mechanisms currently
in place? What are the financial control institutions in place? Are they working properly?
Is there any need to improve the flow of funds during the budget execution? Good
governance, sound institutions and abundance of revenue are necessary and indispensable
however not sufficient by themselves for a sustained growth and durable poverty
reduction: There is also a need to implement good economic policies.
VI – Transforming Oil and Mineral Rents into a Sustained Growth-Path and Durable Poverty Reduction in SSA
In the context of globalization, it is widely recognized that the rate at which a
country grows is substantially determined by three factors: (a) the country’s ability to
integrate in the global economy through trade, investment and innovation (technological
change); (b) its capacity to maintain sustainable government finances and a sound
monetary policy; and (c) the country’s ability to put in place an institutional environment
in which contracts can be enforced and property rights can be established. In addition, in
30
the context of developing countries, like is the case of SSA oil exporting countries;
because the country wealth is generated from the country economic structure, other
things being equal, substantial additional income can be derived only from expanding the
very structure of their economy31 as productivity is improved. In other words, the pure
consumption32 of abundant oil and mineral resources cannot expand the production base
needed for a sustained-growth-path, as no added value is created in the country, through
the simple and pure consumption of oil windfalls.
It is critically important for SSA’s oil exporting countries to start the process of
climbing the value-chain ladder and progressively move into more manufacturing
activities. This can be done by adopting and adapting existing technologies (abundant oil
revenue can help) while adjusting to the global demand and international trade to limit
their dependency on oil revenue, hence paving the way for a sustained growth, job
creation and durable poverty reduction. The oil sector creates very few jobs; therefore the
bulk of employment is inevitably from the non-oil economy. A rentier developing
country which does not expand the structure of its economy condemns itself to an
unsustainable permanent welfare society, unemployment and poverty circle.
The recent global food crisis for example demonstrates the vulnerability and the
dependency of SSA countries on imported foods. Food constitutes by far the largest
single item of household consumption in general. Oil proceeds can be invested in raising
the productivity of farmers by financing improved seed variety for local production
toward food security. This could also fuel job creation in rural areas.
In spite of its existing abundant-oil-wealth, Indonesia consistently invested in the
food crop sector to promote technical changes in the food sector, which oil revenues
helped to accelerate by financing the diffusion of improved techniques. Indonesia’s
pattern of growth and its economic performance stands out as being successful in many
accounts and is considered today as a successful emerging economy, partly because of
31 Oil exploitation will create a temporally growth surge as the rent is spent. But this type of growth can only be short-lived if the non-oil economy is not developed; it could just be like manna from heaven and will generate inflation and high costs, which will make the situation even worst. 32 Particularly in the context of a depletable resource the overall situation may even be worse than the ex-ante situation preceding the establishment of a “rentier” economy, once resources are depleted.
31

economic policy choices the country made. More than three decades later, the agriculture
added value still accounts for about 20 percent of GDP (Fig.10) and the manufacturing
sector has substantially improved. By contrast, the agriculture value added in percentage
of GDP has considerably shrunk in SSA’s oil exporting countries and in some cases tends
to become meaningless33 at best; as the oil sector grows (Fig. 13 and 14). It would have
been a good news, if another non-oil sector of the economy was taking over, but it is far
to be the case although the non-tradable sector seems to flourishing in Angola and
Equatorial Guinea.
(Fig. 13) Agriculture and Industry Value Added in % of GDP (From the late-1970s-2007)
Source: World Development Indicators Database, World Bank.
(Fig. 14) Agriculture and Industry Value Added in % of GDP (From the late-1970s-2007)
Source: World Development Indicators Database, World Bank.
33 Except in Cameroon and Chad where the agriculture sector remains substantial.
32

The huge industrial value added contribution to GDP observed in Equatorial
Guinea, Congo Republic, Gabon and Angola (Fig. 13 and 14) only reflects the
dependency of these countries on oil. To boost job creation, the non-oil economy and
particularly the tradable sector need to be developed to ensure a durable poverty
reduction. This has been clearly the case of Indonesia.
Cameroon (Fig 15) and Chad (Fig.17) have managed so far to keep a significant
level of agriculture value added in percentage of GDP. For Cameroon, it means that the
country is less dependent on the oil economy and confirms the country’s status as being
among the most diversified economies in SSA; however Cameroon is underperforming in
many accounts compared to its potential and resource endowments.
(Fig. 15) Agriculture and Industry Value Added in % of GDP (From the late-1970s-2007)
Source: World Development Indicators Database, World Bank.
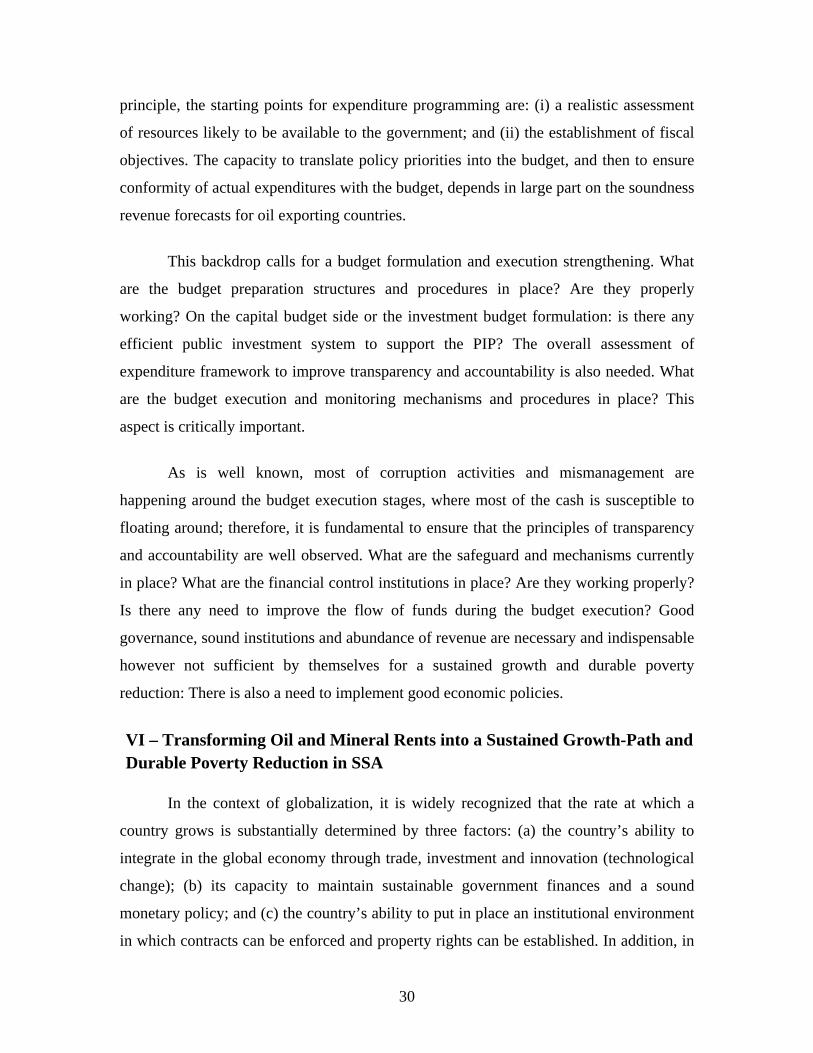
Cameroon could potentially do better in term of job creation and poverty
reduction. In the 1970s and 1980s Cameroon and Indonesia were overall at about the
same level of development. Cameroon was even doing better than Indonesia in terms of
per capita GDP (Fig. 16). Today the structure and importance of Indonesia’s economy are
no longer comparable, although the per capita GDP is not that much divergent.
33
(Fig. 16) Cameroon and Indonesia Comparison: GDP Per Capita (From the late-1970s – 2006)
Source: World Development Indicators Database, World Bank.
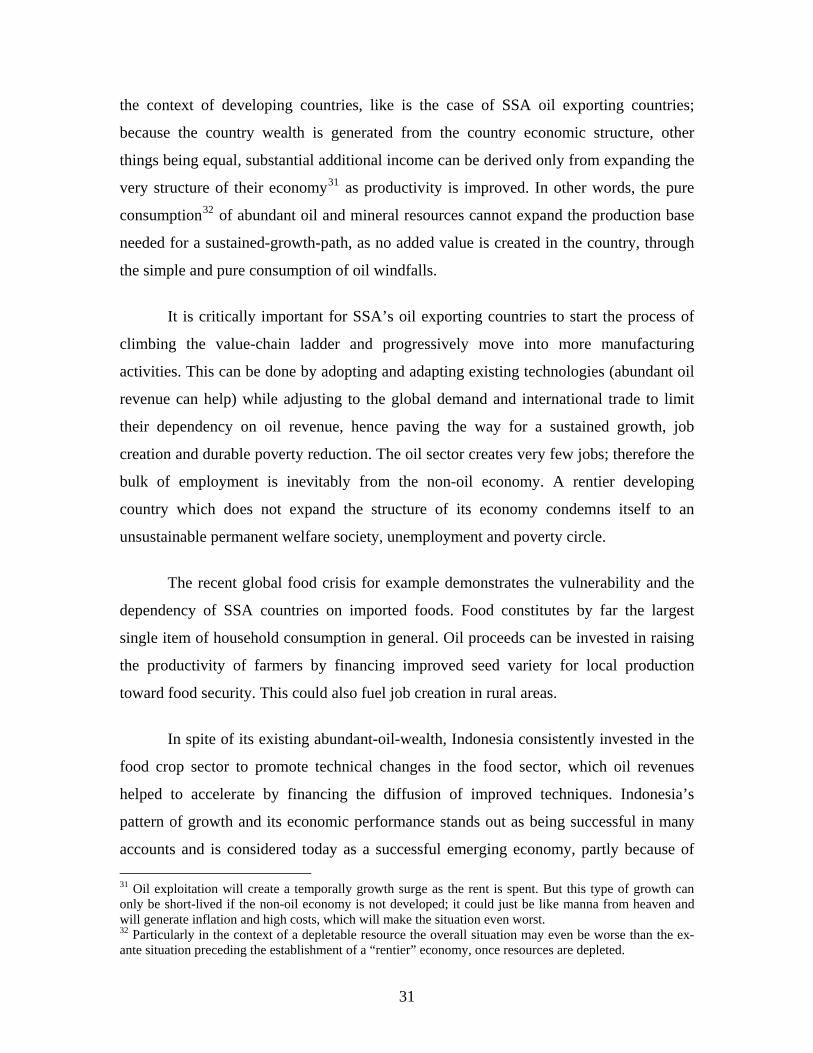
The case of Chad (Fig. 17) underlines its status as a newly oil exporting country.
As we know, Chad became an oil exporting country in late 2004; previous to the oil
exploitation, the country was strongly agricultural with important cotton and cattle
sectors. These sectors, if well reformed and managed, could generate much more
revenues per year for rural poor and could create substantial addition jobs for the rural
poor. Therefore, development of the rural sector and agriculture and breeding sector
reforms should also be among the highest priorities for Chad’s development process.
Pointing out that non-oil revenues were twice the level of oil revenues in 2004 and
surpassed again oil revenues in 2005 is noteworthy (Toto Same 2008b).
(Fig. 17) Agriculture and Industry Value Added in% of GDP (From the late-1970s-2007)
Source: World Development Indicators Database, World Bank.
34

Understanding the fundamentals underlying Indonesia’s economic success might
be useful for SSA oil exporting countries, particularly because of their similarity.
Indonesia’s per capita income was only $200 in 1974. Indonesia’s economic success
between 1965 and the mid-1990s is related to its adoption of the New Economic Order
(NEO) policies in 1965. The new government under the leadership of Suharto swiftly
implemented macroeconomic reforms and programs to attract foreign investment. These
policies, together with investment from the windfalls34 of the 1970s resulted in rapid
economic expansion and a subsequent significant improvement in living standards.
Exceptionally noteworthy has been the strength of the non-oil tradable sector (agriculture
and manufacturing including non-oil exports). The government was committed to a broad
development strategy, that emphasizes raising rural income and was prepared to use key
macro instruments to spread the absorption of windfalls over time and limit the impact of
the oil booms on the non-oil tradable sectors; and strengthened agriculture sector,
infrastructure and industry35. Today, the agriculture sector accounts for about 45 percent
of total employment (Fig. 19) in average and the manufactures share of exports sector has
overtaken the oil share of total exports (Fig.18).
(Fig. 18) Indonesia: Structure of Exports in % of Total Merchandise Exports (From the late-1970s-2006)
Source: World Development Indicators Database, World Bank.
34 Revenues from the oil boom in the 1970s were mostly used to expand public investment, in particular in rural development and human capital while mindful of absorptive capacity (IMF, 2006). 35 For a full account of Indonesia’s also see Gelb et al (1988).
35

What is remarkable and unique in Indonesia’s case and could be replicated to
some extent in SSA oil exporting countries is that, much of the spending on infrastructure
was used to fund labor-intensive public works projects and industry was not neglected in
public investments. Twelve percent of domestically financed spending on development
was allocated to capital participation. The industrial sector as a whole is estimated to
have received almost 20 percent of development spending. Indonesia’s investment in the
economy could be characterized to have been massive and highly qualitative in stark
contrast with Nigeria, where the focus was on the quantity in the expense of the quality,
which led to wasteful spending. Indonesia’s economic policies choices of the recent
decades are reflected on its structure of exports and employment (Fig. 18 and 19).
Indonesia has managed to develop the non-oil economy where jobs and value added of
the economy are mostly created and has avoided the Dutch Disease.
(Fig. 19) Indonesia: Structure of Employment in % of total Employment (From the late-1970s-2006)
Source: World Development Indicators Database, World Bank.
It would have been useful to compare the structure of employment between SSA
oil exporting countries and Indonesia (but there are no data) and particularly between
Nigeria and Indonesia, given that Nigeria is the only country among African oil exporting
countries with a relatively large population to some extent like Indonesia. A large
36

population36 constitutes a significant advantage in terms of market potential and possible
labor to drive the manufacturing development hence, further employment.
Nigeria’s experience shows that the solution is not simply to spend but to spend
wisely and in a coordinated manner. Hundreds of billions of dollars have accrued from
the oil sector in recent decades but unfortunately there is little to show for it in terms of
poverty reduction and improved standards of living. Spending of oil receipts resulted in a
short-term boom in growth (Fig. 11) but this was followed by low or even negative
growth and massive accumulation of debt. Put differently, Nigeria saw a harmful pattern
of boom and bust that locked its economy into a low-growth path. In the presence of
mounting savings from the very recent oil boom, pressures are building up, particularly
by state governments, to spend more given the tremendous existing needs for a stronger
public infrastructure, particularly power, to support a growing private sector and to
reduce poverty. Carefully crafted economy policy is essential to avoid past mistakes. This
also holds for the other SSA oil and mineral exporting countries.
SSA oil exporting countries should be better off with a flexible capital
expenditure program every five years, together with strict implementation monitoring
made possible through an improved PFM/PEM system. This requires excellent budget
preparation, execution, and monitoring. The flexible development planning will be done
in such a manner that the countries could integrate the volatility of oil revenues. The
proposed flexible capital expenditure program can be done, using the lowest oil price-
per-barrel forecast as a baseline scenario. In the worst-case scenario, these countries
could nevertheless implement the flexible capital expenditure program. And in the case
where the prices forecast per barrel are more favorable, additional revenues generated
will be carefully invested in priority sectors or transparently set aside.
The very recent oil boom presents these countries with a unique opportunity to
invest massively and qualitatively to promote the non-oil sector necessary to catalyze the
sustained growth process for a durable poverty reduction and more so for Nigeria because
36 A small population also means that the country is in a position to make rapid progress toward a full employment and durable poverty reduction, through wise absorption and investment of windfalls in the economy.
37

38
of its production sharing agreement contract37 basis. It is time for SSA oil exporting
countries like Gabon, Congo Republic and Cameroon to reorient their development
policy and understand that oil revenues are an exceptional opportunity and not a
renewable source of development financing. Therefore, they should take full advantage
of that favorable situation to strengthen their public finance management in general, and
their public expenditure management in particular and promote the non-oil economy for
Jobs creation and sustained-growth. They may also wish to plan their development
process effectively and improve the efficiency of their public investment system.
37 The production sharing agreement contract is more sensitive to oil volatility and could possibly provide the government with significant revenues during the boom period.
VII – Conclusion
The purpose of this conceptual framework has been to put together a
comprehensive approach that could contribute to address the resource paradox issue in oil
and mineral exporting countries in Africa, while suggesting the strengthening of windfall
management mechanisms and institutions, and the implementation of good economic
policies toward a sustained growth-path and hence, job creation and durable poverty
reduction in Sub-Saharan African oil and mineral exporting countries; drawing from the
international experience, country specificities, SSA’s context and the very nature of
natural-resource abundance.
This conceptual-framework supports the World Bank’s EITI++ initiative, which
aims at helping developing countries, particularly African countries, manage and
transform their natural resource wealth into long-term economic growth that spreads the
wealth among the people. The World Bank’s initiative is a much needed instrument and
support for mineral rich countries in Africa, as it plans to provide governments with a
range of options including technical assistance and capacity building for improving the
management of natural-resource-related wealth for the benefit of the overall economy
and notably the implementation of good policies to promote sustained growth and
poverty reduction.
This conceptual framework demonstrates on one hand, through the case of
Indonesia and the example of Norway that the resource paradox is avoidable and the
abundance should not be a curse rather a blessing for SSA oil exporting countries. On
the other hand, focusing on Nigeria, the conceptual framework equally emphasizes what
not to do, and what went wrong in Nigeria although the desire to promote the country’s
development was persistent. Nigeria demonstrates to perfection that hasty spending and
poor coordination, no matter how many billion of dollars are spent, is not the optimum
solution: the quantity is useful but the quality of spending is crucial. Spending for the
sake of spending is squandering valuable non renewable resources.
39
The oil sector directly generates very few jobs, the bulk of employment is
consequently from the non-oil economy and the non-oil tradable sector; therefore good
economic policies matter to transform rents into sustained-growth, hence job creation and
durable poverty reduction. The capacity of policy formulation and execution in a
coordinated way is thus fundamental. This has been clearly one of the missing pillars in
the case of Nigeria. The country context and political economy matter a great deal but
should not be the main driving forces behind windfall management, to avoid excessive
rent-seeking activities, inefficiency and wasteful spending; Norway is a case in point. The
EITI++ implementation can contribute to make a difference, particularly through capacity
building, implementation and coordination assistance.
40
VIII. References
Abidin, Mahani Z. 2001. Competitive Industrialization with Natural Resources Abundance: Malaysia, in Resource Abundance and Economic Development, ed. By R. Auty (Oxford: Oxford University Press), chapter 9.
Acemoglu, Daron, Simon Johnson, and James A. Robinson. 2001a. “An African Success Story: Botswana.” Working Paper 01–37, Department of Economics, Massachusetts Institute of Technology (MIT), Cambridge, MA.
Auty, Richard M. 1998. Resource abundance and economic development: Improving the performance of resource rich countries. Helsinki: The United Nations University – World Institute for Development Economics Research.
Bevan, D; P Collier, J.W Gunning, 1999, The Political Economy of Poverty, Equity, and Growth: Nigeria and Indonesia, Oxford University Press.
Easterly, W; and R. Levine, 2002, Tropics, Germs and Crops: How Endowments influence Economic Development, mimeo, Center for Global Development and Institute for International Economics.
Engerman, Stanley L; and Kenneth L. Sokoloff, 1994, Factor Endowments, Institutions, and Differential Parths of Growth Among New World Economies: A view from Economic Historians of the United States, National Bureau of Economic Research Working Paper N0. H0066.
Gelb Alan et al. 1988 Oil windfalls blessing or curse? New York: Oxford University Press.
German Overseas Institute (DÜI), May 2005. Context Matters – Rethinking the Resource Curse in Sub-Saharan Africa. Working Papers No1. Mathias Basedau.
Harvey, Charles, and Lewis, S.R. 1990. Policy Choice and Development Performance in Botswana (New York, St .Martins Press).
Haussmann, Ricardo, and Rigobon, R. 2002. An Alternative Interpretation of the Resource Curse: Theory and Policy Implications. Working Paper No 9424 (Cambridge, Massachusetts: National Bureau of Economic Research).
IMF Working Paper WP/03, May 2003 – Xavier Sala-i-Martin and Arvind Subramanian. – Addressing the Natural Resource Curse: An Illustration from Nigeria.
IMF, October 2007, World Economic and Financial Survey. Regional Economic Outlook. Sub-Saharan Africa.
James A. Robinson, Ragnar Torvik, Thiery Verdier. May 2005, Political Foundation of the Resource Curse. Journal of Development Economics.
Katz. Menachem, Bartsch. Ulrich, Malothra. Harinder and Cuc Milan. 2004. Lifting the Oil Curse: Improving Petroleum Revenue Management in sub-Saharan Africa (Washington: International Monetary Fund).
41

42
Meeting the Challenge of the Resource Curse – International Experiences in Managing the Risks and Realizing the Opportunities of Non-Renewable Natural Resource Revenues – United Nations Development Programme – January 2006.
Micheal L. Ross – The Political Economy of the Resource Curse. 1999. Johns Hopkins University Press.
Paul Stevens - Resource Impact - Curse or Blessing? A Literature Survey London: IPIECA – 2003.
Sachs, Jeffrey D; and Warner, Andrew M. (1999) the Big push, Natural Resource Booms and Growth. Journal of Development Economics, Vol59, 43-76.
------ 1995. Natural Resource Abundance and Economic Growth. Working paper 5398 (Cambridge, Massachusetts: National Bureau of Economic Research).
------ 2001 Resource abundance and Economic Development. Oxford University Press. Combating the Resource Curse: An Alternative Solution to Managing Mineral Wealth - Erika Weinthal and Pauline Jones Duke University March 2006 Vol. 4.
------ 2001. The Curse of Natural Resources, European Economic Review, Vol.45, pp 827-38.
------1997. Natural Resource Abundance and Economic Growth. Harvard University, Cambridge MA.(November, 1997.
Schiavo-Compo S. and Tommasi D., Managing Government Expenditure, Asian Development Bank, 1999.
Takizawa. H, Gardner. E. and Ueda. K, 2004. Are Developing Countries Better Off Spending Their Oil Wealth Upfront? IMF Working Paper WP/141(Washington : International Monetary Fund).
W. Max Corden; J. Peter Neary. Booming Sector and De-Industrialization in a Small Open Economy,(Dec, 1982). The Economic Journal, Vol. 92, No 368. Pp 825-848.
Wakeman-Linn. J, Aturupane. C, Danninger. S, Gvenetadze. K, Hobdari. N, and Le Borgne. E, 2004. Managing Oil Wealth: The Case of Azerbaijan. (Washington: International Monetary Fund).
World Bank Policy Research Working Paper 2899, October 2002 – Benn Eifert, Alan Gelb and Nils Borje Tallroth. – The Political Economy of Fiscal Policy and Economic Management in Oil Exporting Countries.
World Bank Policy Research Working Paper 4256, June 2007 – Nina Budina, Gaobo Pang, and Sweder van Wijnbergen. – Nigeria’s Growth Record: Dutch Disease or Debt Overhang?
World Bank, a Chance to Learn: Knowledge and Finance for Education in Sub-Saharan Africa, February 2000.
World Bank, Botswana: An Example of prudent Economic Policy and Growth. Africa Region Findings 2002, p. 161.