transforming medicaid lessons from pioneering states · transforming medicaid lessons from...
TRANSCRIPT
NCSL’s Legislative Conference
Transforming Medicaid Lessons from Pioneering States
Deborah Bachrach
August 20, 2014
1
Drivers of Reform
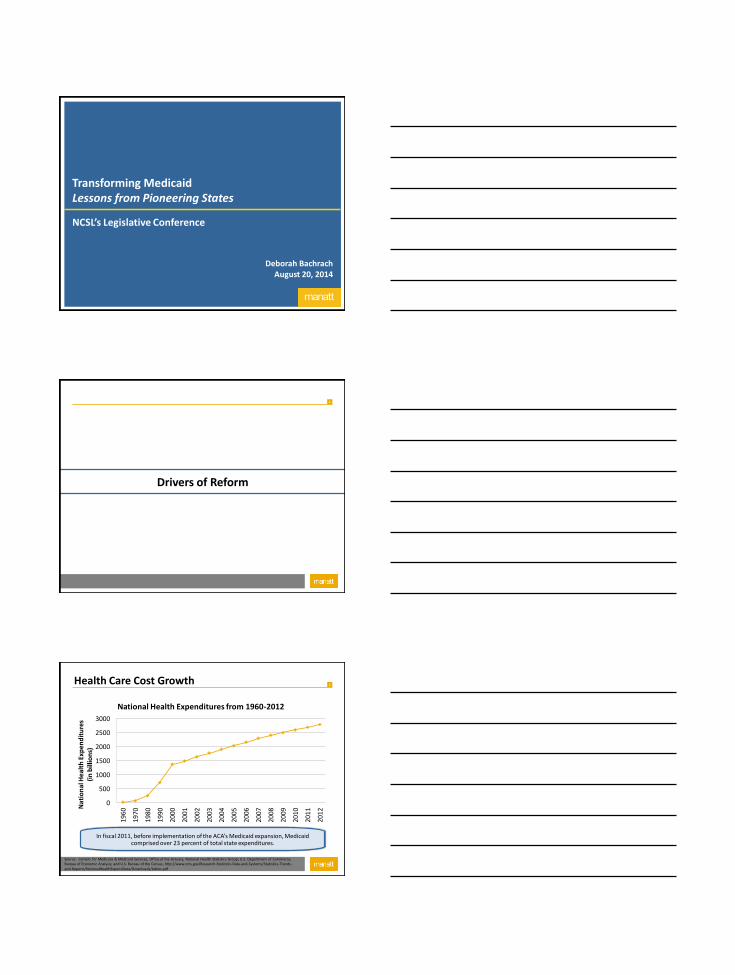
2 Health Care Cost Growth
0
500
1000
1500
2000
2500
3000
196
0
197
0
198
0
199
0
200
0
200
1
200
2
200
3
200
4
200
5
200
6
200
7
200
8
200
9
201
0
201
1
201
2 Nat
ion
al H
ealt
h E
xpen
dit
ure
s
(in
bill
ion
s)
National Health Expenditures from 1960-2012
Source: Centers for Medicare & Medicaid Services, Office of the Actuary, National Health Statistics Group; U.S. Department of Commerce, Bureau of Economic Analysis; and U.S. Bureau of the Census, http://www.cms.gov/Research-Statistics-Data-and-Systems/Statistics-Trends-and-Reports/NationalHealthExpendData/Downloads/tables.pdf
In fiscal 2011, before implementation of the ACA’s Medicaid expansion, Medicaid comprised over 23 percent of total state expenditures.

3
“Triple Aim”
Better Care
Better Health Lower Costs
Triple Aim
4 Medicaid Expansion
Medicaid is broken; Reform
comes first
Payment and Delivery Reform
Expansion States Non Expansion States
Expansion requires reform; reform
requires expansion
5
Reform Strategies
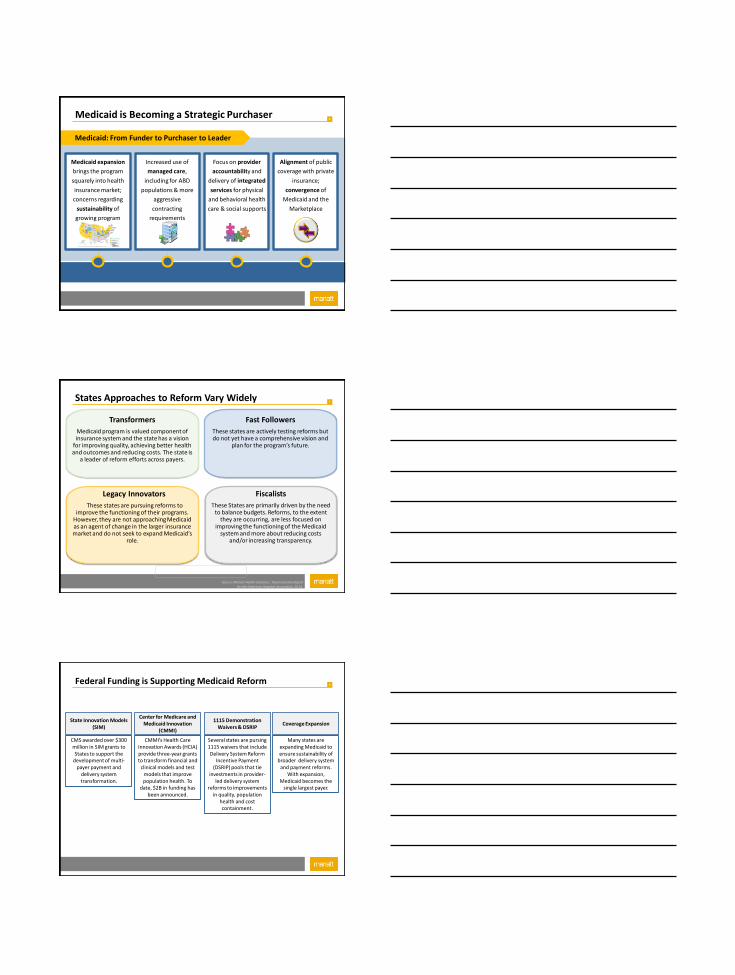
6 Medicaid is Becoming a Strategic Purchaser
Medicaid expansion
brings the program
squarely into health
insurance market;
concerns regarding
sustainability of
growing program
surface
Medicaid: From Funder to Purchaser to Leader
Increased use of
managed care,
including for ABD
populations & more
aggressive
contracting
requirements
Focus on provider
accountability and
delivery of integrated
services for physical
and behavioral health
care & social supports
Alignment of public
coverage with private
insurance;
convergence of
Medicaid and the
Marketplace
7
Fast Followers
These states are actively testing reforms but do not yet have a comprehensive vision and
plan for the program’s future.
Legacy Innovators
These states are pursuing reforms to improve the functioning of their programs.
However, they are not approaching Medicaid as an agent of change in the larger insurance market and do not seek to expand Medicaid’s
role.
Fiscalists
These States are primarily driven by the need to balance budgets. Reforms, to the extent
they are occurring, are less focused on improving the functioning of the Medicaid
system and more about reducing costs and/or increasing transparency.
Transformers
Medicaid program is valued component of insurance system and the state has a vision
for improving quality, achieving better health and outcomes and reducing costs. The state is
a leader of reform efforts across payers.
States Approaches to Reform Vary Widely
Source: Manatt Health Solutions. Taxonomy Developed for the American Hospital Association, 2014.
8
CMMI’s Health Care Innovation Awards (HCIA) provide three-year grants to transform financial and
clinical models and test models that improve population health. To
date, $2B in funding has been announced.
CMS awarded over $300 million in SIM grants to States to support the
development of multi-payer payment and
delivery system transformation.
State Innovation Models (SIM)
Center for Medicare and Medicaid Innovation
(CMMI)
Several states are pursing 1115 waivers that include Delivery System Reform
Incentive Payment (DSRIP) pools that tie
investments in provider-led delivery system
reforms to improvements in quality, population
health and cost containment.
1115 Demonstration Waivers & DSRIP
Many states are expanding Medicaid to ensure sustainability of
broader delivery system and payment reforms.
With expansion, Medicaid becomes the
single largest payer.
Coverage Expansion
Federal Funding is Supporting Medicaid Reform
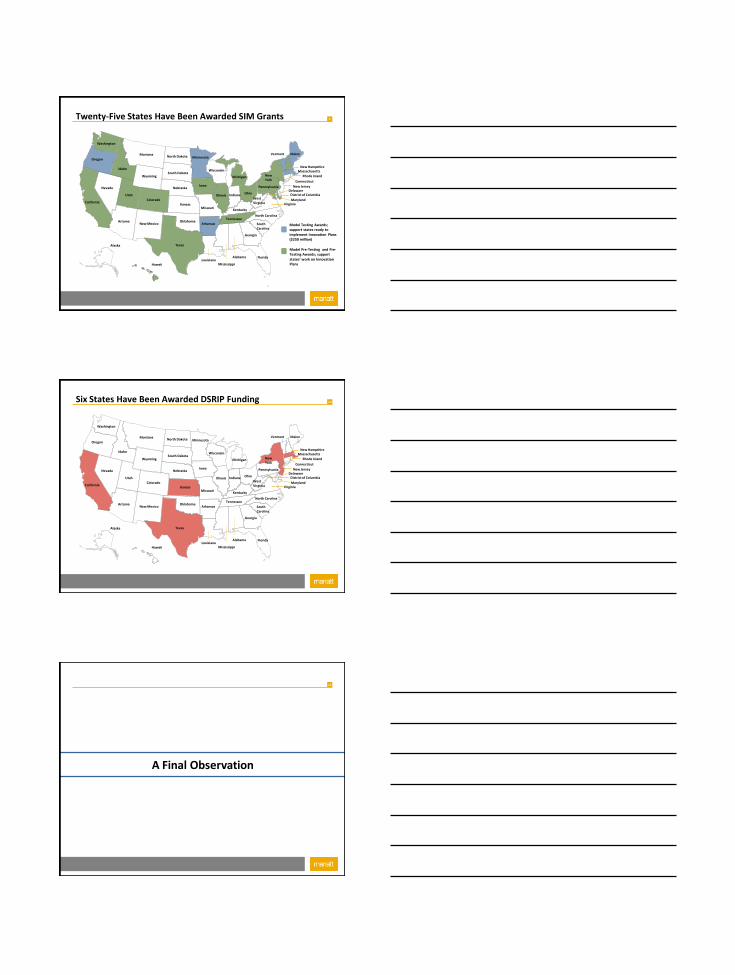
9 Twenty-Five States Have Been Awarded SIM Grants
Alaska
Hawaii
Michigan
California
Nevada
Oregon
Arizona
Utah
Idaho
Montana
Wyoming
Colorado
New Mexico
Nebraska
Maine Vermont
New York
North Carolina
Georgia
South Carolina
Florida Alabama
Mississippi Louisiana
Texas
Pennsylvania
Wisconsin
Minnesota North Dakota
Ohio
West Virginia
South Dakota
Arkansas
Missouri
Iowa
Illinois Indiana
Tennessee
Kentucky
Delaware New Jersey
Connecticut
Massachusetts New Hampshire
Virginia Maryland
Rhode Island
District of Columbia
Kansas
Oklahoma Model Testing Awards; support states ready to implement Innovation Plans ($250 million)
Model Pre-Testing and Pre-Testing Awards; support states’ work on Innovation Plans
Washington
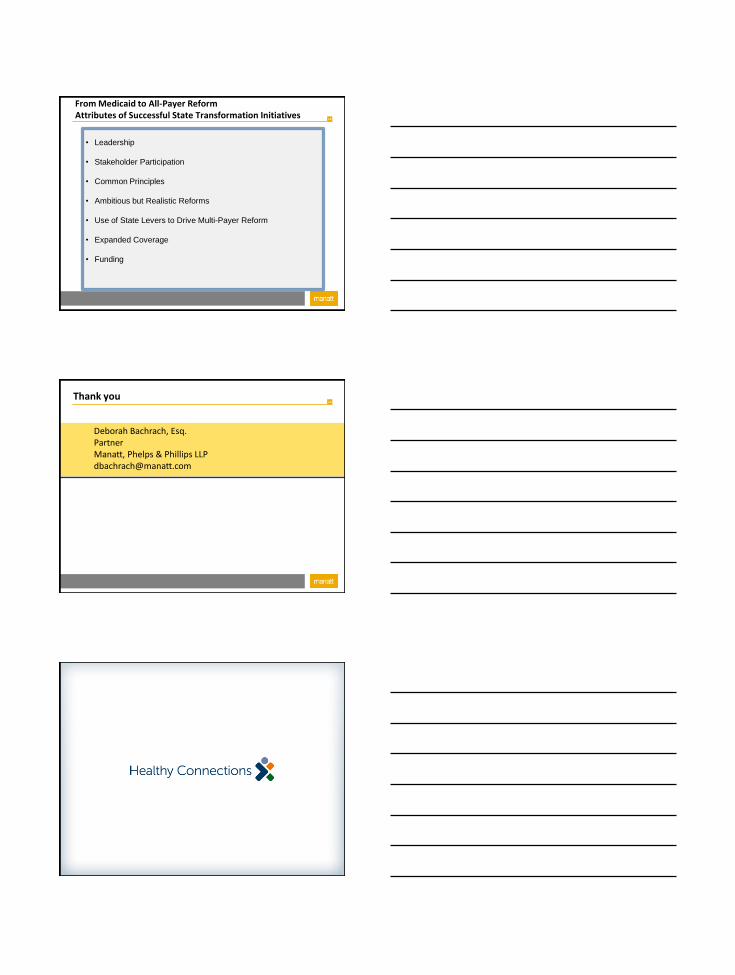
10 Six States Have Been Awarded DSRIP Funding
Alaska
Hawaii
Michigan
California
Nevada
Oregon
Arizona
Utah
Idaho
Montana
Wyoming
Colorado
New Mexico
Nebraska
Maine Vermont
New York
North Carolina
Georgia
South Carolina
Florida Alabama
Mississippi Louisiana
Texas
Pennsylvania
Wisconsin
Minnesota North Dakota
Ohio
West Virginia
South Dakota
Arkansas
Missouri
Iowa
Illinois Indiana
Tennessee
Kentucky
Delaware New Jersey
Connecticut
Massachusetts New Hampshire
Virginia Maryland
Rhode Island
District of Columbia
Kansas
Oklahoma
Washington
11
A Final Observation
12
From Medicaid to All-Payer Reform Attributes of Successful State Transformation Initiatives
• Leadership
• Stakeholder Participation
• Common Principles
• Ambitious but Realistic Reforms
• Use of State Levers to Drive Multi-Payer Reform
• Expanded Coverage
• Funding
13 Thank you
Deborah Bachrach, Esq. Partner Manatt, Phelps & Phillips LLP [email protected]

Transforming Medicaid: Lessons
from South Carolina
National Conference of State Legislatures
Legislative Summit
Anthony Keck, Director │ August 20, 2014 South Carolina Department of Health and Human Services
South Carolina
Meet Our Current Commitments
• Full enrollment
• Competitive rates
• Robust benefits
• Decreased disability wait lists
South Carolina
Find & Meaningfully Connect
• Hotspot geography, conditions,
populations
• Healthy Outcomes
• Healthy Connections Checkup
South Carolina
Fill Service & Financing Gaps
• Handshake strategies
• DSH reform
• ACA waiver in 2017
20
20
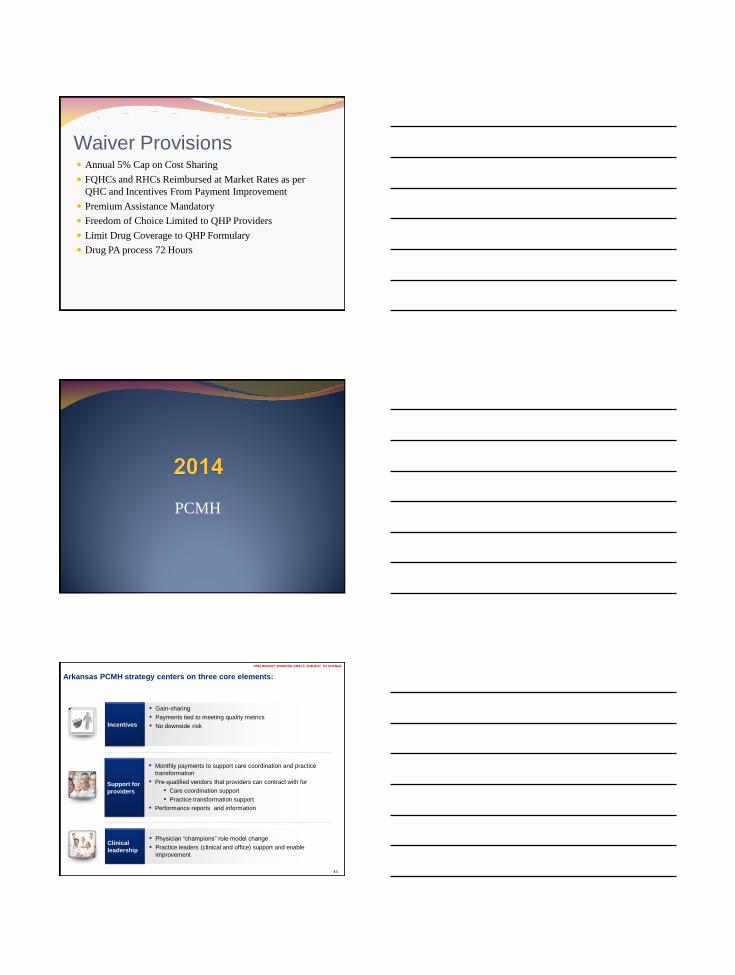
Health Reform in Arkansas:
Payment Improvement
William Golden MD MACP
Medical Director, Arkansas Medicaid
UAMS Professor of Medicine and Public Health

22
Developing Vision

24
25
PRELIMINARY WORKING DRAFT; SUBJECT TO CHANGE
Medicaid and private insurers believe paying for patient results, rather
than just individual patient services, is the best option to control costs and
improve quality
Eliminate coverage of expensive services, or eligibility
Pass growing costs on to consumers through higher
premiums, deductibles and co-pays (private payers), or higher
taxes (Medicaid)
▪ Transition to system that financially rewards value and
patient outcomes and encourages coordinated care
Intensify payer intervention in clinical decisions
to manage use of expensive services (e.g. through prior
authorizations) based on prescriptive clinical guidelines
Reduce payment levels for all providers regardless
of their quality of care or efficiency in managing costs
26
Payers recognize the value of working together to improve our system, with close involvement
from other stakeholders…
Coordinated multi-payer leadership…
▪ Creates consistent incentives and standardized reporting rules and tools
▪ Enables change in practice patterns as program applies to many patients
▪ Generates enough scale to justify investments in new infrastructure and operational models
▪ Helps motivate patients to play a larger role in their health and health care
1 Center for Medicare and Medicaid Services

Preliminary working draft; subject to change
27
The populations that we serve require care falling into three domains
Acute and post-acute
care
Prevention,
screening,
chronic care
Supportive care
Patient populations within scope (examples) Care/payment models
• Healthy, at-risk • Chronic, e.g.,
‒ CHF
‒ COPD ‒ Diabetes
Population-based: medical homes responsible for
care coordination, rewarded for
quality, utilization, and savings against total cost of care
• Acute medical, e.g., ‒ AMI
‒ CHF
‒ Pneumonia • Acute procedural, e.g.,
‒ CABG
‒ Hip replacement
Episode-based: retrospective risk sharing with
one or more providers, rewarded
for quality and savings relative to benchmark cost per episode
• Developmental disabilities
• Long-term care
• Severe and persistent mental illness
Combination of population- and episode-based models:
health homes responsible
for care coordination; episode-based payment for supportive
care services
STRATEGY
28
▪ Based on results,
providers will:
▪ Share savings: if average
costs below commendable
levels and quality targets
are met
▪ Pay part of excess cost:
if average costs are above
acceptable level
▪ See no change in pay: if
average costs are
between commendable
and acceptable levels
How episodes work for patients and providers (2/2)
1 Outliers removed and adjusted for risk and hospital per diems
2 Appropriate cost and quality metrics based on latest and best clinical evidence, nationally recognized clinical guidelines and local considerations
Review claims from
the performance period to
identify a ‘Principal
Accountable Provider’
(PAP) for each episode
Payers calculate average
cost per episode for each
PAP1
Compare average costs
to predetermined
‘’commendable’ and
‘acceptable’ levels2
4 5 6
Calculate
incentive
payments based
on outcomes
after close of
12 month
performance
period
29
PAPs that meet quality standards and have average costs below the
commendable threshold will share in savings up to a limit
Shared savings
Shared costs
No change
Low
High
Individual providers, in order from highest to lowest average cost
Acceptable
Commendable
Gain
sharing limit
Pay portion of excess
costs -
+
No change in payment to
providers
Receive additional payment as share as savings

Implementation
32
Draft thresholds for General URIs
Provider average costs for General URI episodes Adjusted average episode cost per principal accountable provider1
0
10
20
30
40
50
60
70
80
90
100
110
120
130
140
150
Avera
ge c
ost
/ ep
iso
de
D
olla
rs (
$)
Principal Accountable Providers
15
46
67
Antibiotics prescription rate below episode average2
Antibiotics prescription rate above episode average2
1 Each vertical bar represents the average cost and prescription rate for a group of 10 providers, sorted from highest to lowest average cost
2 Episode average antibiotic rate = 41.9%
SOURCE: Arkansas Medicaid claims paid, SFY10
Year 1 acceptable
Year 1 commendable
Gain sharing limit

33
Draft ADHD thresholds
ADHD provider cost distribution
Average episode cost per provider1
0
1,000
2,000
3,000
4,000
5,000
6,000
7,000
8,000
9,000
10,000
11,000
12,000
Av
era
ge
co
st
/ e
pis
od
e
Do
llars
($
)
Principal Accountable Providers
$700
$1,547
$2,223
$5,403
$7,112
1 Each vertical bar represents the average cost and prescription rate for a group of 3 providers, sorted from highest to lowest average cost
RSPMI
Physician or psychologist
SOURCE: Episodes ending in SFY10, data includes Arkansas Medicaid claims paid SFY09 - SFY10
Level II commendable
Level II acceptable
Level II gain sharing limit; Level I acceptable
Level I commendable
Level I gain sharing limit
34
Provider Portal
35
36
37
0
10
20
30
40
50
60
70
80
90
100
URI U URI P URI S
First 9 months of 2011 First 9 months of 2012 First 9 months of 2013
Rat
e o
f A
nti
bio
tic
Scri
pts
per
10
0 V
alid
URI U URI P URI S
First 9 months of 2011 48.12635 81.74514 98.99453
First 9 months of 2012 48.75099 78.95943 98.67569
First 9 months of 2013 39.54913 75.16196 95.91151
Rate of Antibiotic Scripts per 100 Valid Episodes

Coverage Expansion
“The Private Option” Private, Qualified Health Plans to Expand Coverage
Integrated, Market Based
Gradual Expansion
Revising Waiver for Parents Below 17% FPL
Pilot Health Savings Account Project
Designed to Sustain Coverage With Income Fluctuation
Reduce “Churn” (~1/3 of Adults Below 200% FPL)
225,000 Additional Enrollees to Private Market
Integration into Payment Reform
Private Option Benefits Premium Assistance for Silver Level Policy
Cost Sharing Consistent with Medicaid and Marketplace
10 Essential Health Benefits (EHBs)
Medicaid to Provide Additional Coverage
Non Emergency Transportation
Dental/Vision for 19/20 Year Olds
One Insurance Card
Use QHP Coverage Appeals Process
Auto Assignment if No Selection at Enrollment
Waiver Provisions Annual 5% Cap on Cost Sharing
FQHCs and RHCs Reimbursed at Market Rates as per
QHC and Incentives From Payment Improvement
Premium Assistance Mandatory
Freedom of Choice Limited to QHP Providers
Limit Drug Coverage to QHP Formulary
Drug PA process 72 Hours
PCMH
44
PRELIMINARY WORKING DRAFT; SUBJECT TO CHANGE
Clinical
leadership
▪ Physician “champions” role model change
▪ Practice leaders (clinical and office) support and enable
improvement
Support for
providers
▪ Monthly payments to support care coordination and practice
transformation
▪ Pre-qualified vendors that providers can contract with for
▪ Care coordination support
▪ Practice transformation support
▪ Performance reports and information
Arkansas PCMH strategy centers on three core elements:
Incentives
▪ Gain-sharing
▪ Payments tied to meeting quality metrics
▪ No downside risk

Providers can then receive support to invest in improvements, as well
as incentives to improve quality and cost of care
Practice support Shared savings
DHS/DMS will also provide performance reports and
patient panel information to enable improvement
2 3
Invest in primary care to improve
quality and cost of care for all
beneficiaries through:
▪ Care coordination
▪ Practice transformation
Reward high quality care and cost
efficiency by:
▪ Focusing on improving quality of
care
▪ Incentivizing practices to
effectively manage growth
in costs
45
2/3
46
Completion of activity
and timing of reporting
Commit to PCMH Month 0-3
Start your journey Month 6
Evolve your proce-sses Month 12 Activity
Month 16-18 Month 24
▪ Identify office lead(s) for both care coordination and practice transformation1
1
▪ Assess operations of practice and opportunities to improve (internal to PCMH)
2
▪ Develop strategy to implement care coordination and practice transformation improvements
3
▪ Identify top 10% of high-priority patients (including BH clients)2
4
▪ Identify and address medical neighborhood barriers to coordinated care (including BH professionals and facilities)
5
▪ Provide 24/7 access to care 6
▪ Document approach to expanding access
to same-day appointments 7
▪ Document approach to contacting patients who have not received preventive care
9
▪ Document investment in healthcare technology or tools that support practice transformation
10
▪ Join SHARE to get inpatient discharge information from hospitals
11
▪ Incorporate e-prescribing into practice workflows3 12
▪ Integrate EHR into practice workflows 13
Continue to innovate
Activities tracked for practice support payments provide
a framework for transformation
▪ Complete a short survey related to patients’ ability to
receive timely care, appointments, and information from
specialists (including BH specialists)
8
1 - At enrollment; 2 - Three months after the start of each performance period; 3 - At 18 months
PRELIMINARY WORKING DRAFT; SUBJECT TO CHANGE
47
Identification of top 10% of high-priority beneficiaries
Updates
Due date for selection of high
priority beneficiaries
has been extended
to Monday, April 7th
We have received
several questions
around the patient
panel and
beneficiary risk
scores which will be
discussed in the next section

What shared savings could mean for your practice
Attributed beneficiaries: 6,000 Risk-adjusted per beneficiary benchmark cost: $2,000 Practice risk score: 1.0 2014 medium cost threshold: $2,032
$1,800 $ 116 $ 696,000
Per beneficiary payment Annual incentive payment Risk-adjusted cost of care
$ 66 $ 396,000 $1,900
▪ Practices must meet performance
benchmarks on quality
▪ Incentive payments are based on the
greater of two payment calculation
methods
▪ Model is upside-only, providers do not
risk-share
Shared savings will reward eligible entities for performance on quality
and cost of care 3
Manage growth of costs
Providers receive greater of two shared savings methods if they have met performance on quality
<
Provide efficient care State-wide cost
thresholds
Practice costs in performance
period
<
OR
A
B
Practice-specific
benchmark cost
Practice costs in performance
period
PRELIMINARY WORKING DRAFT; SUBJECT TO CHANGE
49
Historical analysis (7/1/12-6/30/13) of quality metrics
-70 -60 -50 -40 -30 -20 -10 0 10 20 30 40 50
Child wellness
Breast cancer
TSH
Asthma
Infant wellness
CHF
Adolescent wellness
Diabetes
2014 Target
Historical results
below target
Historical results at
or above target
PCMH avg PCMH historical results on quality metrics1,2
Delta to target, %
1 Based on 7/1/12 to 6/30/13 historical data; historical results not tied to payment
2 PCMHs with the same delta are represented as a single data point
Delta to target, %
Quality Measurement
• Administrative vs Clinical Data
• Administrative – HbA1C Testing
– LDL Testing
– Composite Values
– Medication Possession Measurement • Oral Agents, Statins, Blood Pressure
– Admission Rates for Short Term Diabetic Complications

Start of New Era?
• New Needs of CME – Comparative Effectiveness
– Value of Therapy to Outcomes
• Coordinating Effective Team for Outcomes – Communication Between Providers, Patients
• Payers/Providers Battle Underuse, Overuse
• Effective Prevention
• Complication Avoidance
• Reward Effectiveness
52
▪ More information on the Payment Improvement Initiative
can be found at www.paymentinitiative.org
– Further detail on the initiative, PAP and portal
– Printable flyers for bulletin boards, staff offices, etc.
– Specific details on all episodes
– Contact information for each payer’s support staff
– All previous workgroup materials
Comments and Questions?