transformations in eu biofuels markets under the renewable
TRANSCRIPT
O C C A S I O N A L P A P E R
Francis X. Johnson
Henrique Pacini
Edward Smeets
Transformations in EU biofuels markets under the Renewable Energy Directive and the implications for land use, trade and forests

Transformations in EU biofuels markets under the Renewable Energy Directive and the implications for land use, trade and forests
OCCASIONAL PAPER 78
Francis X. JohnsonStockholm Environment Institute
Henrique PaciniKTH Royal Institute of Technology
Edward SmeetsSmeets Consulting
Occasional Paper 78
© 2012 Center for International Forestry ResearchAll rights reserved
ISBN 978-602-8693-81-3
Johnson, F. X., Pacini, H., Smeets, E. 2012. Transformations in EU biofuels markets under the Renewable Energy Directive and the implications for land use, trade and forests. Occasional Paper 78. CIFOR, Bogor, Indonesia.
Cover photo by Ricardo FunariSugarcane plantation encroaching on native rainforest near Ribeirao Preto, Sao Paulo State, Brazil.
This report has been produced with the financial assistance of the European Union, under a project entitled, ‘Bioenergy, sustainability and trade-offs: Can we avoid deforestation while promoting bioenergy?’ The objective of the project is to contribute to sustainable bioenergy development that benefits local people in developing countries, minimises negative impacts on local environments and rural livelihoods, and contributes to global climate change mitigation. The project aims to achieve this by producing and communicating policy relevant analyses that can inform government, corporate and civil society decision-making related to bioenergy development and its effects on forests and livelihoods. The project is managed by CIFOR and implemented in collaboration with the Council on Scientific and Industrial Research (South Africa), Joanneum Research (Austria), the Universidad Nacional Autónoma de México and the Stockholm Environment Institute. The views expressed herein can in no way be taken to reflect the official opinion of the European Union.
CIFORJl. CIFOR, Situ GedeBogor Barat 16115Indonesia
T +62 (251) 8622-622F +62 (251) 8622-100E [email protected]
cifor.org
Any views expressed in this publication are those of the authors. They do not necessarily represent the views of CIFOR, the authors’ institutions or the financial sponsors of this publication.
List of figures and tables iv
Abbreviations v
Acknowledgements vii
Executive summary viii
1 Introduction 11.1 Focus of this report 11.2 Approach 21.3 Terminology 21.4 Structure of the report 3
2 Overview of EU biofuels markets 42.1 EU and global biofuels markets 42.2 International trade in biofuels and EU imports 52.3 Woody biomass markets and trade 82.4 Future developments in biofuels markets, trade and feedstocks 10
3 EU biofuels policies and market development 123.1 EU targets/mandates for biofuels and renewable energy 123.2 Share of biofuels in the EU in 2010 and 2020 133.3 Establishment of biofuels sustainability criteria 153.4 Alternatives: National, bilateral and voluntary approaches 153.5 Incentives for advanced biofuels and use of waste 163.6 Market leakage 173.7 Incentive for degraded lands 18
4 Voluntary sustainability schemes: Cost and compliance issues 214.1 Voluntary schemes recognised by the EU 214.2 Costs of implementing sustainability criteria 234.3 Competition between certification schemes 254.4 Cost distribution and compliance for developing countries 274.5 Future sustainability criteria for other types of biomass use 29
5 Expected impacts on land use and forested areas 315.1 Direct land use change and protection of forests 315.2 Approaches for estimating indirect land use 345.3 Review of estimates of iLUC effects 345.4 Discussion of uncertainties 385.5 Key implications for forest protection 38
6 Alternative scenarios for imported biofuels in the EU 416.1 Biofuel imports according to the NREAPs 416.2 Biofuel imports to 2020 and balances across feedstock options 416.3 Second-generation biofuels and outlook for imports 446.4 iLUC effects of biofuel imports beyond 2020 446.5 Discussion of uncertainties 45
7 Conclusions 47
8 References 49
Table of contents
Figures
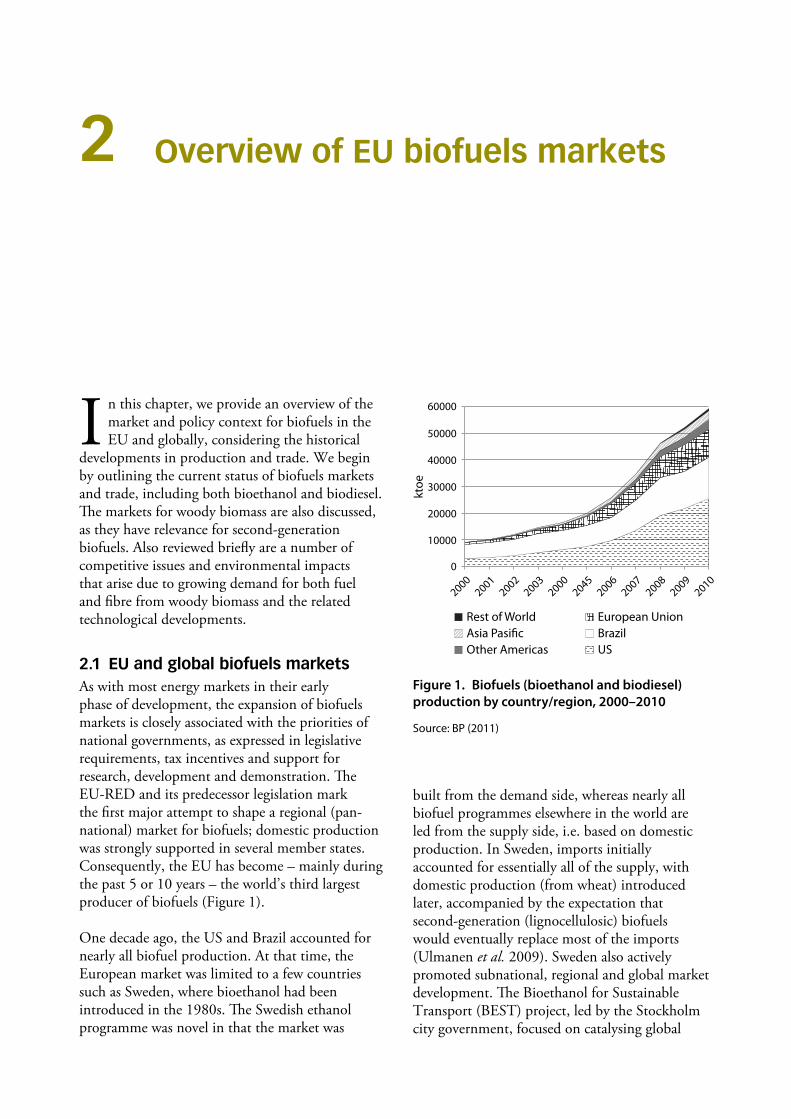
1 Biofuels (bioethanol and biodiesel) production by country/region (ktoe), 2000–2010 4
2 Contribution of different countries and regions to bioethanol production, 2009–2010 5
3 Contribution of different countries and regions to biodiesel production, 2009–2010 5
4 Country or region of origin for EU bioethanol imports in 2009 6
5 Country or region of origin for EU bioethanol imports in 2010 6
6 Country of origin for EU biodiesel imports in 2009 7
7 Country of origin for EU biodiesel imports in 2010 7
8 Growing overlap between the forestry and biofuels industries 9
9 Actual EU biofuel consumption compared with targets in the Biofuels Directive and EU-RED/NREAPS 14
10 Range of membership fees for biofuels sustainability certification under the schemes recognised by the European Commission in July 2011 (USD as of August 2011) 26
11 Estimated yearly certification fees for five of the seven schemes 26
12 Potential distribution of compliance costs with sustainability criteria along biofuels supply chains 28
13 Land type used for cropland expansion in Brazil, as assumed in different studies 37
Tables
1 Summary of estimates of bioenergy potential on degraded or abandoneda lands 19
2 Voluntary biofuels sustainability schemes recognised by the EU 22
3 Description of voluntary schemes for biofuels sustainability recognised by the EU in 2011 23
4 Parameters of the definitions of ‘forest’ 33
5 Summary of modelling approaches used to evaluate iLUC 35
6 Comparison of marginal iLUC effects for various scenarios and share of total LUC from EU and rest of world 36
7 Projected energy demand for transport and contribution of domestic and imported biofuels 42
List of figures and tables
Abbreviations
2BSvs Biomass Biofuel sustainability voluntary scheme
B19 Fuel blend consisting of 19% biodiesel and 81% mineral diesel
B99 Fuel blend consisting of 99.9% biodiesel and 0.1% mineral diesel
ACP African, Caribbean and Pacific Group of States
BEST Bioethanol for Sustainable Transport
CAPRI Common Agricultural Policy Regionalized Impact Modelling System
CARD Center for Agricultural and Rural Development
CBD Convention on Biological Diversity
CDM Clean Development Mechanism
CGE Computable General Equilibrium
CIFOR Center for International Forestry Research
COSIMO Commodity Simulation Model
dLUC Direct Land Use Change
E85 Fuel blend consisting of 15% gasoline and 85% ethanol
EBB European Biodiesel Board
EC European Commission
ECJ European Court of Justice
ECN Energy Research Centre of the Netherlands
EEA European Environmental Agency
EPA Economic Partnership Agreement
ESIM European Simulation Model
EU European Union
EU27 European Union (27 member states)
EU-ETS European Union Emissions Trading System
EU-RED Renewable Energy Directive of the European Union
FAO Food and Agriculture Organization of the United Nations
FAPRI Food and Agricultural Policy Research Institute
FASOM Forest and Agricultural Sector Optimization Model
FQD Fuel Quality Directive
FRA Forest Resource Assessment
FT Free Trade
GAIN Global Agricultural Information Network
GATT General Agreement on Tariffs and Trade
GBEP Global Bioenergy Partnership
vI | Francis X. Johnson, Henrique Pacini and Edward Smeets
GHG Greenhouse Gas
GMO Genetically Modified Organism
GSP Generalized System of Preferences
GTAP Global Trade Analysis Project
ICONE Instituto de Estudos de Comércio e Negociações Internacionais (Institute for International Trade Negotiations, Brazil)
IEA International Energy Agency
IFPRI International Food Policy Research Institute
iLUC Indirect Land Use Change
IMPACT International Model for Policy Analysis of Agricultural Commodities and Trade
ISCC International Sustainability and Carbon Certification
JRC Joint Research Centre of the European Commission
ktoe thousand tonnes oil equivalent (energy)
LDC Least Developed Country
Mtoe million tonnes of oil equivalent
MW Megawatt
NGO Non-Governmental Organisation
NREAP National Renewable Energy Action Plan
NTL No Trade Liberalisation
OECD Organisation for Economic Co-operation and Development
PE Partial Equilibrium
RBSA/Abengoa RED Bioenergy Sustainability Assurance
REDD United Nations Collaborative Programme on Reducing Emissions from Deforestation and Forest Degradation in Developing Countries
REN21 Renewable Energy Policy Network for the 21st Century
RSB Roundtable on Sustainable Biofuels
RSPO Roundtable on Sustainable Palm Oil
RTRS Round Table on Responsible Soy
SVO Straight Vegetable Oil
TBT Technical Barriers to Trade
TL Trade Liberalisation
UNCTAD United Nations Conference on Trade and Development
UNECE United Nations Economic Commission for Europe
UNFCCC United Nations Framework Convention on Climate Change
USDA United States Department of Agriculture.
US, USA United States of America
US EPA United States Environmental Protection Agency
WTO World Trade Organization

Valuable comments from several anonymous reviewers are gratefully acknowledged. Johan Westberg (Stockholm Environment Institute) provided useful comments related to international trade law and practices. Any remaining errors or omissions are the responsibility of the authors. The views expressed herein are strictly those of the authors.
Acknowledgements
The Renewable Energy Directive of the European Union (EU-RED) established targets to be met by 2020, including a separate and uniform target for all member states of 10% renewable energy in the transport sector. Biofuels used to achieve the EU target must meet sustainability criteria, including restrictions on the types of land used and minimum greenhouse gas (GHG) reduction levels. The expansion in biofuels markets creates economic opportunities for developing countries to export to the EU while building their own domestic markets. Imported biofuels can also have lower land use impact and GHG emissions than those produced in the EU.
The global biofuels market is currently dominated by the EU, Brazil and the US, with only the EU having a sustained level of imported biofuels or feedstocks. Domestic production in the EU is dominated by biodiesel from rapeseed, whereas imports are dominated by bioethanol from Brazil and soya biodiesel from Argentina. Least Developed Countries (LDCs) benefit from various preferential tariffs, and are gradually beginning to export to the EU.
For biofuels to be considered sustainable under the EU-RED, they must be accredited by a voluntary or national scheme recognised by the European Commission (EC) or through a bilateral or multilateral agreement. The costs of compliance include not only the direct costs of certification but also the costs of developing new information systems and administrative procedures and modifying equipment or management processes. Small-scale producers will have more difficulty absorbing additional costs; therefore, institutional and technical support should be provided, especially in LDCs. Bilateral or multilateral agreements could provide such support and could also provide incentives for promoting more sustainable land use policies and using degraded lands.
The market for biofuels is thus undergoing a rapid transformation, with many sustainability certification schemes vying for approval. Technological advances, especially via second-generation biofuels, have brought the biofuels industry closer to other biomass-based industries, such as pulp and paper or forestry; it is expected that, in the long term, biorefineries will produce multiple energy and non-energy products in a flexible and more efficient manner. The option of different final markets also implies increased competition for feedstocks, just as agricultural biofuels created competition with food or feed. This blurs the borders between biofuels and biomass, creating a need for broader and more comprehensive sustainability initiatives that can cover all biomass-based materials and products or services.
The risk of undesirable land use change (e.g. deforestation) from biofuels expansion raises a major concern. The EU-RED addresses direct land use change (dLUC) fairly well, although some smaller forested areas are not well covered in the definitions. High-yielding first-generation biofuels, such as bioethanol from sugarcane and sugar beet, tend to have lower indirect land use change (iLUC), whereas lower-yielding first-generation feedstocks such as wheat or soya can have significant land use impacts and GHG emissions. The use of a general iLUC factor rather than a crop-specific factor could penalise those feedstocks and regions that have smaller impacts. The National Renewable Energy Action Plans prepared by the EU member states suggest a high level of biofuel imports of 25–37% but do not distinguish between intra-EU trade and external trade. Significant uncertainties remain in iLUC modelling, particularly in subnational land use dynamics and the general difficulty in capturing socio-economic variables in large models; methodological improvements are needed.
Executive summary
The Renewable Energy Directive of the European Union (EU-RED) has established targets for renewable energy
that its member states must meet by 2020, including a separate and uniform target of 10% renewable energy in the transport sector (EC 2009a). The expectation that most renewable energy sources for transport would be based on liquid biofuels raised concerns about the social and environmental impacts of this increased demand, leading to calls to establish sustainability requirements. Indeed, some organisations were calling for the establishment of sustainability criteria even before the EU-RED was officially proposed (WWF 2006). Sustainability criteria for biofuels were subsequently established in the EU-RED; both domestic and imported biofuels must meet these criteria in order to qualify as contributing to the 10% target.1 The criteria are aimed especially at addressing land use, biodiversity and greenhouse gas (GHG) emissions. Of particular concern is the possibility that forested land might be cleared to produce biofuels, which not only would lead to additional GHG emissions but more generally would defeat the sustainability objectives that underlie renewable energy market development. The combination of the 10% target and the sustainability criteria has transformed the biofuels market both in the EU and globally,
1 It should be noted that biofuels that do not meet (or have not been certified as meeting) the sustainability criteria can still be imported into the EU but will not count towards the target for that member state. However, even when member states aim to exceed their targets, the additional biofuels are quite likely to be certified for sustainability, because of pressure from European institutions, NGOs and the general public.
because of the availability and competitiveness of biofuels in many other world regions.
1.1 Focus of this reportIn this report, we assess this transformation of the EU biofuels markets, with a particular focus on the potential impacts associated with biofuels imported from tropical and subtropical regions where deforestation, poverty and basic economic development pressures raise special concerns. The rapid changes that are occurring in these markets are driven in global terms by soaring demand for food, feed, fibre and fuel as a result of increasing population and wealth. On the one hand, developing countries (located mainly in tropical and subtropical regions, and thus sometimes referred to as the ‘South’) have comparative advantages in biofuel production that they may wish to exploit both for their own energy security and for exports, as a way to provide a new income stream to support economic development, especially in rural areas. At the same time, developed countries (located mainly in temperate regions, and thus sometimes referred to as the ‘North’) with obligations for climate mitigation must be mindful of the GHG implications, which differ widely according to the feedstock, the location and the land being used. An additional global dynamic has been the rapid pace of growth and consumption in China and India, leading to significant increases in global demand for energy, water and land.
This basic tension between climate and development objectives – along with the interface between energy security and food security objectives – has thus brought new North–South
Introduction1
2 | Francis X. Johnson, Henrique Pacini and Edward Smeets
and South–South dimensions into the equation. We do not include explicit analysis on GHGs here because GHG balances have been analysed in great detail in many reports in recent years; rather, we focus on overall market developments and land use implications. Land use change is highly correlated with GHG emissions, but there are other important concerns surrounding land use change, and land use efficiency itself is an important metric in biofuels expansion.
This report therefore aims at a broad characterisation of the transformation in EU biofuels markets across the key drivers and linkages: the socio-economic drivers related to the demand for biomass resources; the physical reallocations of land in response to these pressures; and the interactions between public and private actors, with many new stakeholders emerging in the process. These stakeholders are in turn influencing the policy process, especially the implementation of the sustainability criteria. Various stakeholders have participated in the consultation processes held in the EU and elsewhere on sustainability criteria for biofuels and have been part of the open debate that determines how the legislation is transposed into working institutions at national and regional levels. The feedback from different actors and at different stages has created a rather dynamic policy/market landscape. What began as a regional energy policy process in the EU has turned into a global debate on choices between key energy–climate–development paradigms for the future. The final section of this report therefore considers some alternative scenarios for the EU renewable energy targets in the transport sector. The preceding sections provide some background and analysis of the key factors affecting changes in land use and their relationship with underlying socio-economic incentives.
1.2 ApproachThe analytical approach taken in this report is necessarily broad in scope because of the complex web of issues arising from land use and environmental impacts associated with expansion of biofuels markets stimulated through the EU-RED. The approach includes a review and synthesis followed by a more detailed analysis of two aspects associated with biofuels markets under the EU-RED: 1) the costs and efficacy associated with the sustainability criteria and 2) an exploration of the
range of land use impacts that could be associated with the mandated targets of the EU-RED. These aspects are examined with particular reference to the developing countries that are the potential exporters. The cost of meeting the sustainability criteria can present a barrier for Least Developed Countries (LDCs) that might otherwise benefit economically from the expanding EU biofuels markets; at the same time, the expansion in biofuels production associated with the targets could have land use impacts in developing countries that pose serious environmental threats. It is precisely this combination of economic opportunities and environmental impacts that generates the basic tension in analysing the effects of imports within the EU biofuels market expansion.
1.3 TerminologyAs the terms used when referring to biomass, biofuels, land use and related issues sometimes conflict, this section clarifies the definitions and terminology used in this report. We note below some slight differences from the terminology or units used in the EU-RED and in other legislation and offer brief comments on the significance of the terminology where appropriate.• Biofuels: In the EU-RED, ‘biofuels’ includes
any liquid or gaseous fuels made wholly or in part from biomass. In this report, ‘biofuels’ refers only to liquid biofuels for transport (i.e. excluding gaseous fuels as in the EU-RED). As biogas is more difficult to trade, it is less relevant from an international market context (i.e. imports to the EU).
• Bioliquids: In the EU-RED, ‘bioliquids’ refers essentially to any liquid biofuels used outside the transport sector (e.g. for heat and power production). In this report, we do not explicitly analyse bioliquids, as they are not relevant to the 10% mandate in the transport sector. However, it should be noted that they are made from the same feedstocks and can have similar impacts to biofuels; hence, the EU-RED sustainability criteria must be applied, as for biofuels.
• Biomass: ‘Biomass’ refers to the biodegradable fraction of products, wastes and residues that have (at least some) biological origin. Only the biodegradable fraction of industrial
Transformations in EU biofuels markets under the Renewable Energy Directive and the implications for land use, trade and forests | 3
and municipal wastes can be considered when calculating biofuels produced from such sources.
• Second-generation biofuels: In both the EU-RED and this report, ‘second-generation biofuels’ are defined based on conversion process (rather than feedstock) and include mainly lignocellulosic ethanol and Fischer–Tropsch biodiesel, as well as other advanced biofuels such as biobutanol.
• Biodiesel: In both the EU-RED and this report, ‘biodiesel’ refers to a refined fuel (including both first- and second-generation biofuels) that can substitute for fossil diesel, thus distinguishing these fuels from Straight Vegetable Oil (SVO). SVOs can be substituted for diesel in some applications with minor engine modifications, whereas biodiesel made by refining raw vegetable oils through transesterification can be substituted for fossil diesel (subject to technical standards) with no engine modifications.
• Volume vs. energy content: The requirements set out in the EU-RED are based on energy content, with reporting data often in volumes. Standard conversion factors are provided in the EU-RED annexes. The expected market shares of ethanol and biodiesel are relevant in this respect, because their energy density substitution shares differ for petrol or diesel, respectively.
The distinction between first- and second-generation biofuels adopted here and in the EU-RED is drawn on the basis of conversion processes, in the sense that more advanced techniques are applied at higher efficiencies that make better use of the entire biomass resource. From a policy perspective, the issue is also related to how established the crops are in the agricultural sector and especially the extent of competition with food production and minimisation of land use conflicts: second-generation biofuels that can use woody biomass, along with wastes and residues, will tend to place less pressure on land for food crops. Non-edible crops such as jatropha are also sometimes viewed as second generation or as falling somewhere between first and second generation because they do not compete directly with food crops and can grow on lower-quality soils (Schwaiger et al. 2011). Algae-based biofuels, which are sometimes referred to as third-
generation biofuels, can further minimise land use conflicts and also improve versatility in end-uses because they can be used to create various types of fuels, including not only substitutes for petrol or diesel, but also photobiological hydrogen gas (Brennan and Owende 2010). Their technological immaturity, however, means that they are not relevant to the EU targets for 2020.
Such perspectives can vary in the legislation and policy of different countries and regions, with consequent implications for how biofuels markets develop. In particular, the US Renewable Fuel Standard uses the category of ‘advanced’ biofuels to designate targets and GHG reduction requirements. US legislation classifies Brazilian bioethanol as ‘advanced’; as such, it requires the same minimum level of GHG reductions (50%) as for second-generation biofuels, whereas corn-based ethanol only need fulfil a 20% requirement (US EPA 2010a). This type of differential requirement creates some discontinuities in the global market, although competitive pressures and international trade agreements may ultimately make it more difficult to maintain such differences between European and US requirements.
1.4 Structure of the reportThis report characterises – in fairly broad terms – the transformation underway in EU biofuels markets and policies, with emphasis on the impacts in developing countries related to land use, international trade and forest conservation. Chapter 2 describes the market and policy background and the resulting biofuels expansion, focusing especially on the growing international trade. Chapter 3 assesses the key provisions in the EU-RED and their significance for land use change and associated policies and institutions. Chapter 4 examines the biofuels sustainability criteria of the EU-RED in more detail, with a particular focus on assessing the costs and competitiveness of the seven voluntary schemes recently approved by the EC. Chapter 5 examines some issues related to direct and indirect land use change. Chapter 6 looks at alternative feedstock and land use scenarios for the implementation of the EU-RED, focusing on imported biofuels/feedstocks. Chapter 7 offers some conclusions regarding the effects of the EU-RED targets and sustainability criteria, focusing on land use impacts and the relevant energy/climate policy incentives.
I n this chapter, we provide an overview of the market and policy context for biofuels in the EU and globally, considering the historical
developments in production and trade. We begin by outlining the current status of biofuels markets and trade, including both bioethanol and biodiesel. The markets for woody biomass are also discussed, as they have relevance for second-generation biofuels. Also reviewed briefly are a number of competitive issues and environmental impacts that arise due to growing demand for both fuel and fibre from woody biomass and the related technological developments.
2.1 EU and global biofuels marketsAs with most energy markets in their early phase of development, the expansion of biofuels markets is closely associated with the priorities of national governments, as expressed in legislative requirements, tax incentives and support for research, development and demonstration. The EU-RED and its predecessor legislation mark the first major attempt to shape a regional (pan-national) market for biofuels; domestic production was strongly supported in several member states. Consequently, the EU has become – mainly during the past 5 or 10 years – the world’s third largest producer of biofuels (Figure 1).
One decade ago, the US and Brazil accounted for nearly all biofuel production. At that time, the European market was limited to a few countries such as Sweden, where bioethanol had been introduced in the 1980s. The Swedish ethanol programme was novel in that the market was
built from the demand side, whereas nearly all biofuel programmes elsewhere in the world are led from the supply side, i.e. based on domestic production. In Sweden, imports initially accounted for essentially all of the supply, with domestic production (from wheat) introduced later, accompanied by the expectation that second-generation (lignocellulosic) biofuels would eventually replace most of the imports (Ulmanen et al. 2009). Sweden also actively promoted subnational, regional and global market development. The Bioethanol for Sustainable Transport (BEST) project, led by the Stockholm city government, focused on catalysing global
Overview of EU biofuels markets2
Figure 1. Biofuels (bioethanol and biodiesel) production by country/region, 2000–2010
Source: BP (2011)
Rest of WorldAsia Pasi�cOther Americas
European UnionBrazilUS
60000
50000
40000
30000
20000
10000
0
20002001
20022003
20002045
20062007
20082009
2010
ktoe
Transformations in EU biofuels markets under the Renewable Energy Directive and the implications for land use, trade and forests | 5
demand – while operating at the municipal level – through the introduction of ethanol buses and flexible-fuel vehicles in selected cities in Brazil, Europe and China (BEST 2010).
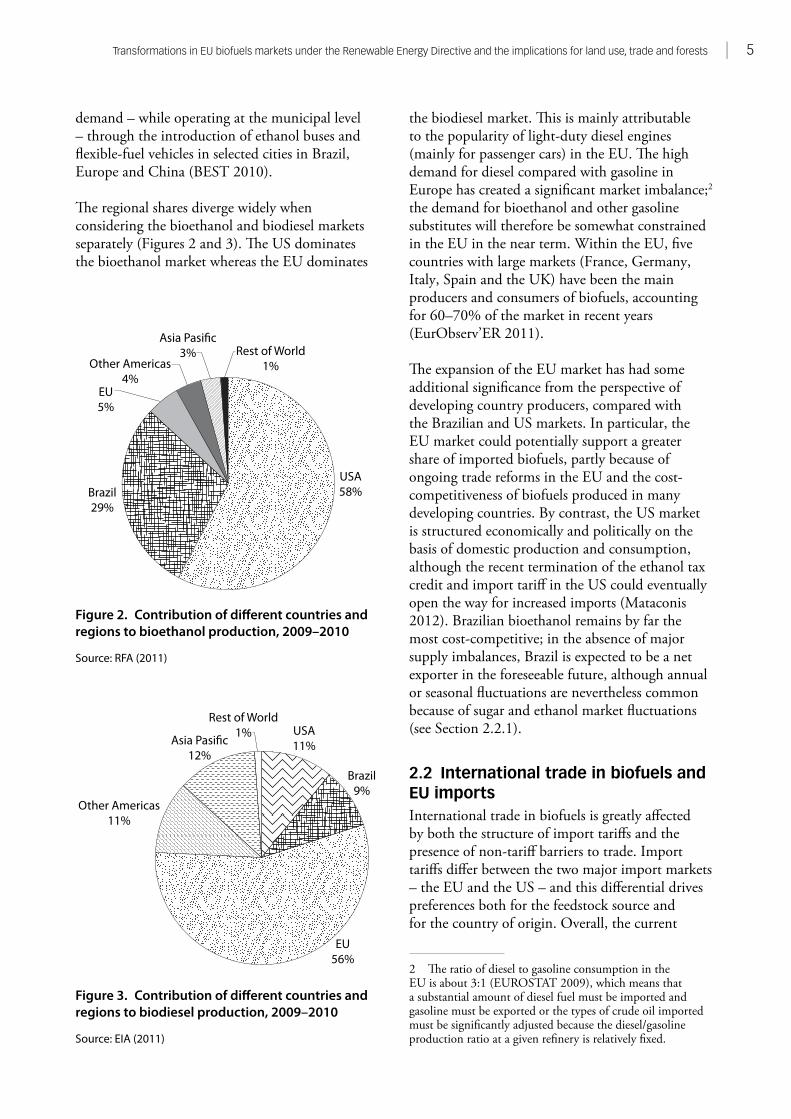
The regional shares diverge widely when considering the bioethanol and biodiesel markets separately (Figures 2 and 3). The US dominates the bioethanol market whereas the EU dominates
the biodiesel market. This is mainly attributable to the popularity of light-duty diesel engines (mainly for passenger cars) in the EU. The high demand for diesel compared with gasoline in Europe has created a significant market imbalance;2 the demand for bioethanol and other gasoline substitutes will therefore be somewhat constrained in the EU in the near term. Within the EU, five countries with large markets (France, Germany, Italy, Spain and the UK) have been the main producers and consumers of biofuels, accounting for 60–70% of the market in recent years (EurObserv’ER 2011).
The expansion of the EU market has had some additional significance from the perspective of developing country producers, compared with the Brazilian and US markets. In particular, the EU market could potentially support a greater share of imported biofuels, partly because of ongoing trade reforms in the EU and the cost-competitiveness of biofuels produced in many developing countries. By contrast, the US market is structured economically and politically on the basis of domestic production and consumption, although the recent termination of the ethanol tax credit and import tariff in the US could eventually open the way for increased imports (Mataconis 2012). Brazilian bioethanol remains by far the most cost-competitive; in the absence of major supply imbalances, Brazil is expected to be a net exporter in the foreseeable future, although annual or seasonal fluctuations are nevertheless common because of sugar and ethanol market fluctuations (see Section 2.2.1).
2.2 International trade in biofuels and EU importsInternational trade in biofuels is greatly affected by both the structure of import tariffs and the presence of non-tariff barriers to trade. Import tariffs differ between the two major import markets – the EU and the US – and this differential drives preferences both for the feedstock source and for the country of origin. Overall, the current
2 The ratio of diesel to gasoline consumption in the EU is about 3:1 (EUROSTAT 2009), which means that a substantial amount of diesel fuel must be imported and gasoline must be exported or the types of crude oil imported must be significantly adjusted because the diesel/gasoline production ratio at a given refinery is relatively fixed.
Figure 2. Contribution of different countries and regions to bioethanol production, 2009–2010
Source: RFA (2011)
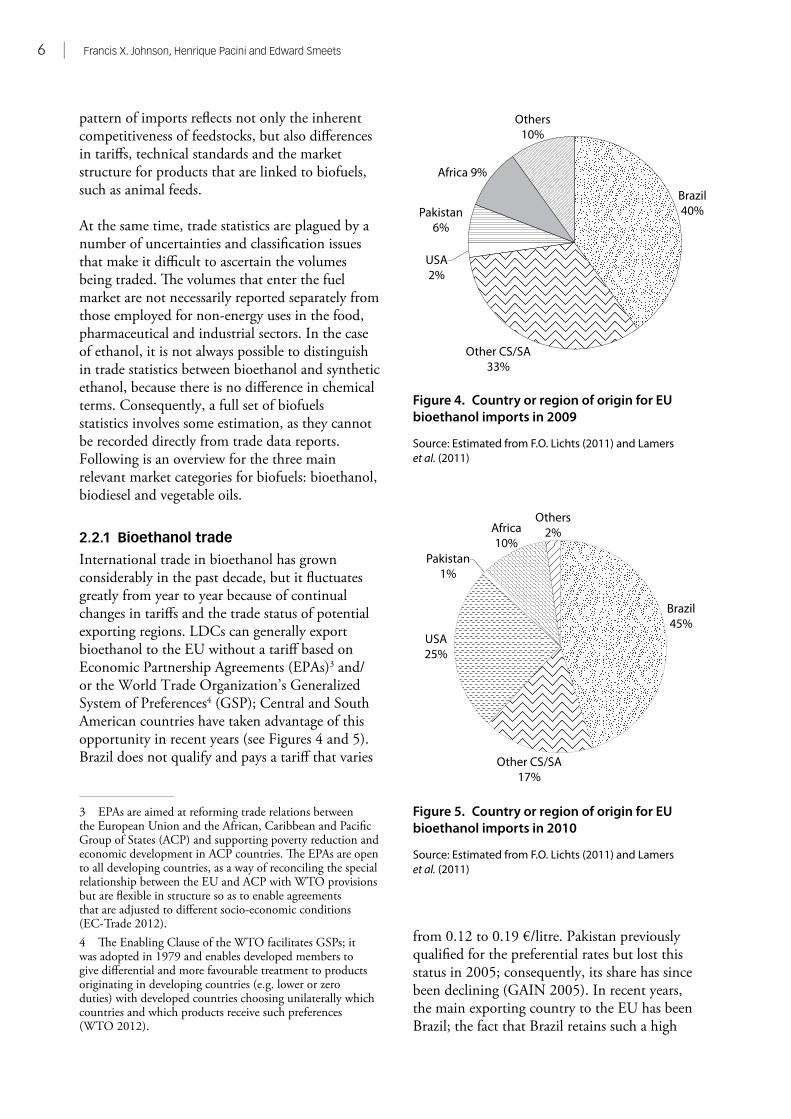
Figure 3. Contribution of different countries and regions to biodiesel production, 2009–2010
Source: EIA (2011)
USA58%Brazil
29%
EU5%
Other Americas4%
Asia Pasi�c3% Rest of World
1%
Other Americas11%
Asia Pasi�c12%
Rest of World1%
Brazil9%
USA11%
EU56%
6 | Francis X. Johnson, Henrique Pacini and Edward Smeets
pattern of imports reflects not only the inherent competitiveness of feedstocks, but also differences in tariffs, technical standards and the market structure for products that are linked to biofuels, such as animal feeds.
At the same time, trade statistics are plagued by a number of uncertainties and classification issues that make it difficult to ascertain the volumes being traded. The volumes that enter the fuel market are not necessarily reported separately from those employed for non-energy uses in the food, pharmaceutical and industrial sectors. In the case of ethanol, it is not always possible to distinguish in trade statistics between bioethanol and synthetic ethanol, because there is no difference in chemical terms. Consequently, a full set of biofuels statistics involves some estimation, as they cannot be recorded directly from trade data reports. Following is an overview for the three main relevant market categories for biofuels: bioethanol, biodiesel and vegetable oils.
2.2.1 Bioethanol trade
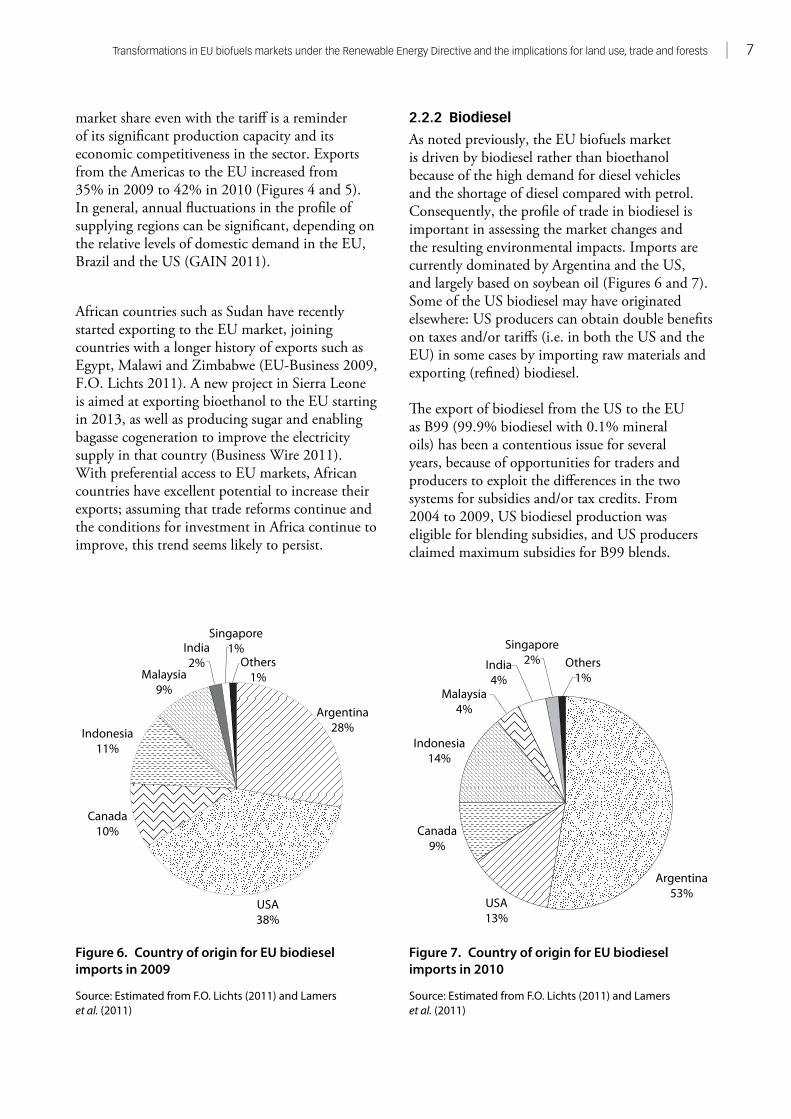
International trade in bioethanol has grown considerably in the past decade, but it fluctuates greatly from year to year because of continual changes in tariffs and the trade status of potential exporting regions. LDCs can generally export bioethanol to the EU without a tariff based on Economic Partnership Agreements (EPAs)3 and/or the World Trade Organization’s Generalized System of Preferences4 (GSP); Central and South American countries have taken advantage of this opportunity in recent years (see Figures 4 and 5). Brazil does not qualify and pays a tariff that varies
3 EPAs are aimed at reforming trade relations between the European Union and the African, Caribbean and Pacific Group of States (ACP) and supporting poverty reduction and economic development in ACP countries. The EPAs are open to all developing countries, as a way of reconciling the special relationship between the EU and ACP with WTO provisions but are flexible in structure so as to enable agreements that are adjusted to different socio-economic conditions (EC- Trade 2012).4 The Enabling Clause of the WTO facilitates GSPs; it was adopted in 1979 and enables developed members to give differential and more favourable treatment to products originating in developing countries (e.g. lower or zero duties) with developed countries choosing unilaterally which countries and which products receive such preferences (WTO 2012).
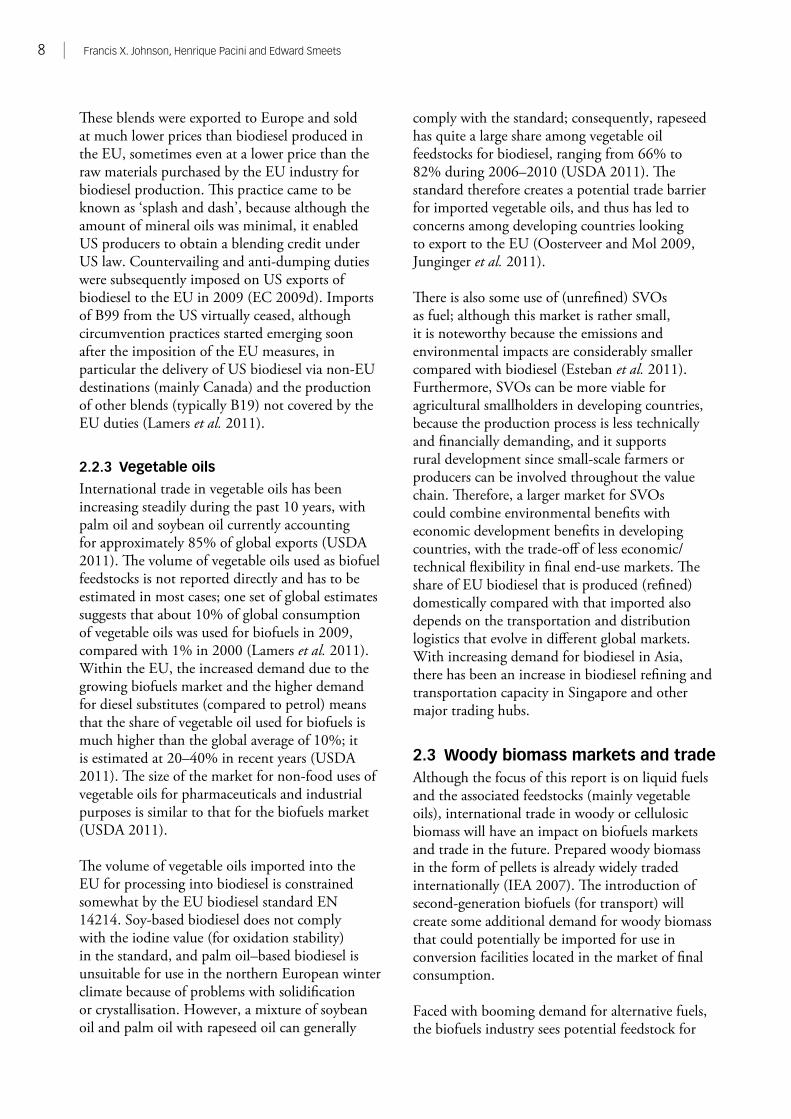
from 0.12 to 0.19 €/litre. Pakistan previously qualified for the preferential rates but lost this status in 2005; consequently, its share has since been declining (GAIN 2005). In recent years, the main exporting country to the EU has been Brazil; the fact that Brazil retains such a high
Figure 4. Country or region of origin for EU bioethanol imports in 2009
Source: Estimated from F.O. Lichts (2011) and Lamers et al. (2011)
Figure 5. Country or region of origin for EU bioethanol imports in 2010
Source: Estimated from F.O. Lichts (2011) and Lamers et al. (2011)
Brazil40%
Others10%
Other CS/SA33%
USA2%
Pakistan6%
Africa 9%
Brazil45%
Other CS/SA17%
Others2%Africa
10%Pakistan
1%
USA25%
Transformations in EU biofuels markets under the Renewable Energy Directive and the implications for land use, trade and forests | 7
market share even with the tariff is a reminder of its significant production capacity and its economic competitiveness in the sector. Exports from the Americas to the EU increased from 35% in 2009 to 42% in 2010 (Figures 4 and 5). In general, annual fluctuations in the profile of supplying regions can be significant, depending on the relative levels of domestic demand in the EU, Brazil and the US (GAIN 2011).
African countries such as Sudan have recently started exporting to the EU market, joining countries with a longer history of exports such as Egypt, Malawi and Zimbabwe (EU-Business 2009, F.O. Lichts 2011). A new project in Sierra Leone is aimed at exporting bioethanol to the EU starting in 2013, as well as producing sugar and enabling bagasse cogeneration to improve the electricity supply in that country (Business Wire 2011). With preferential access to EU markets, African countries have excellent potential to increase their exports; assuming that trade reforms continue and the conditions for investment in Africa continue to improve, this trend seems likely to persist.
2.2.2 Biodiesel
As noted previously, the EU biofuels market is driven by biodiesel rather than bioethanol because of the high demand for diesel vehicles and the shortage of diesel compared with petrol. Consequently, the profile of trade in biodiesel is important in assessing the market changes and the resulting environmental impacts. Imports are currently dominated by Argentina and the US, and largely based on soybean oil (Figures 6 and 7). Some of the US biodiesel may have originated elsewhere: US producers can obtain double benefits on taxes and/or tariffs (i.e. in both the US and the EU) in some cases by importing raw materials and exporting (refined) biodiesel.
The export of biodiesel from the US to the EU as B99 (99.9% biodiesel with 0.1% mineral oils) has been a contentious issue for several years, because of opportunities for traders and producers to exploit the differences in the two systems for subsidies and/or tax credits. From 2004 to 2009, US biodiesel production was eligible for blending subsidies, and US producers claimed maximum subsidies for B99 blends.
Figure 6. Country of origin for EU biodiesel imports in 2009
Source: Estimated from F.O. Lichts (2011) and Lamers et al. (2011)
Figure 7. Country of origin for EU biodiesel imports in 2010
Source: Estimated from F.O. Lichts (2011) and Lamers et al. (2011)
USA38%
Argentina28%
Others1%
Singapore1%India
2%Malaysia
9%
Indonesia11%
Canada10%
Argentina53%
USA13%
Canada9%
Indonesia14%
Malaysia4%
India4%
Singapore2% Others
1%
8 | Francis X. Johnson, Henrique Pacini and Edward Smeets
These blends were exported to Europe and sold at much lower prices than biodiesel produced in the EU, sometimes even at a lower price than the raw materials purchased by the EU industry for biodiesel production. This practice came to be known as ‘splash and dash’, because although the amount of mineral oils was minimal, it enabled US producers to obtain a blending credit under US law. Countervailing and anti-dumping duties were subsequently imposed on US exports of biodiesel to the EU in 2009 (EC 2009d). Imports of B99 from the US virtually ceased, although circumvention practices started emerging soon after the imposition of the EU measures, in particular the delivery of US biodiesel via non-EU destinations (mainly Canada) and the production of other blends (typically B19) not covered by the EU duties (Lamers et al. 2011).
2.2.3 Vegetable oils
International trade in vegetable oils has been increasing steadily during the past 10 years, with palm oil and soybean oil currently accounting for approximately 85% of global exports (USDA 2011). The volume of vegetable oils used as biofuel feedstocks is not reported directly and has to be estimated in most cases; one set of global estimates suggests that about 10% of global consumption of vegetable oils was used for biofuels in 2009, compared with 1% in 2000 (Lamers et al. 2011). Within the EU, the increased demand due to the growing biofuels market and the higher demand for diesel substitutes (compared to petrol) means that the share of vegetable oil used for biofuels is much higher than the global average of 10%; it is estimated at 20–40% in recent years (USDA 2011). The size of the market for non-food uses of vegetable oils for pharmaceuticals and industrial purposes is similar to that for the biofuels market (USDA 2011).
The volume of vegetable oils imported into the EU for processing into biodiesel is constrained somewhat by the EU biodiesel standard EN 14214. Soy-based biodiesel does not comply with the iodine value (for oxidation stability) in the standard, and palm oil–based biodiesel is unsuitable for use in the northern European winter climate because of problems with solidification or crystallisation. However, a mixture of soybean oil and palm oil with rapeseed oil can generally
comply with the standard; consequently, rapeseed has quite a large share among vegetable oil feedstocks for biodiesel, ranging from 66% to 82% during 2006–2010 (USDA 2011). The standard therefore creates a potential trade barrier for imported vegetable oils, and thus has led to concerns among developing countries looking to export to the EU (Oosterveer and Mol 2009, Junginger et al. 2011).
There is also some use of (unrefined) SVOs as fuel; although this market is rather small, it is noteworthy because the emissions and environmental impacts are considerably smaller compared with biodiesel (Esteban et al. 2011). Furthermore, SVOs can be more viable for agricultural smallholders in developing countries, because the production process is less technically and financially demanding, and it supports rural development since small-scale farmers or producers can be involved throughout the value chain. Therefore, a larger market for SVOs could combine environmental benefits with economic development benefits in developing countries, with the trade-off of less economic/technical flexibility in final end-use markets. The share of EU biodiesel that is produced (refined) domestically compared with that imported also depends on the transportation and distribution logistics that evolve in different global markets. With increasing demand for biodiesel in Asia, there has been an increase in biodiesel refining and transportation capacity in Singapore and other major trading hubs.
2.3 Woody biomass markets and tradeAlthough the focus of this report is on liquid fuels and the associated feedstocks (mainly vegetable oils), international trade in woody or cellulosic biomass will have an impact on biofuels markets and trade in the future. Prepared woody biomass in the form of pellets is already widely traded internationally (IEA 2007). The introduction of second-generation biofuels (for transport) will create some additional demand for woody biomass that could potentially be imported for use in conversion facilities located in the market of final consumption.
Faced with booming demand for alternative fuels, the biofuels industry sees potential feedstock for
Transformations in EU biofuels markets under the Renewable Energy Directive and the implications for land use, trade and forests | 9
second-generation biofuels in a range of waste streams, agricultural residues and forestry-based biomass (UNCTAD 2009, REN21 2011). Although wood has many uses (pulp, furniture, structural material, etc.), most of the high-value uses require wood types that are not intended for energy (for which the cheapest cellulosic sources suffice). While there will always be a degree of competition between different end-uses of wood, the feedstock competition for wood conversion into biofuels is expected to be smaller than that associated with agricultural crops. Woody biomass conversion into second-generation biofuels can therefore offer more positive GHG balances and have less impact on food security compared with many (but not necessarily all) agricultural crops.
At the same time, the forestry industry is recognising the new opportunities in bioenergy markets. Pellet production is expanding rapidly, and is expected to reach 46 million tonnes globally by 2020 (Pöyry 2011). Beyond solid biomass, many pulp mills are experimenting with the production of cellulosic ethanol, as well as gasification technologies for the production of Fischer–Tropsch liquids (Hylander 2009). Pulp mills and biofuel plants are seeing increasing overlap in their feedstock base and product output portfolios – bioplastics, renewable electricity, fibres and animal feed are common examples – leading to the rise of multi-product biorefineries (EUBIONET 2011).
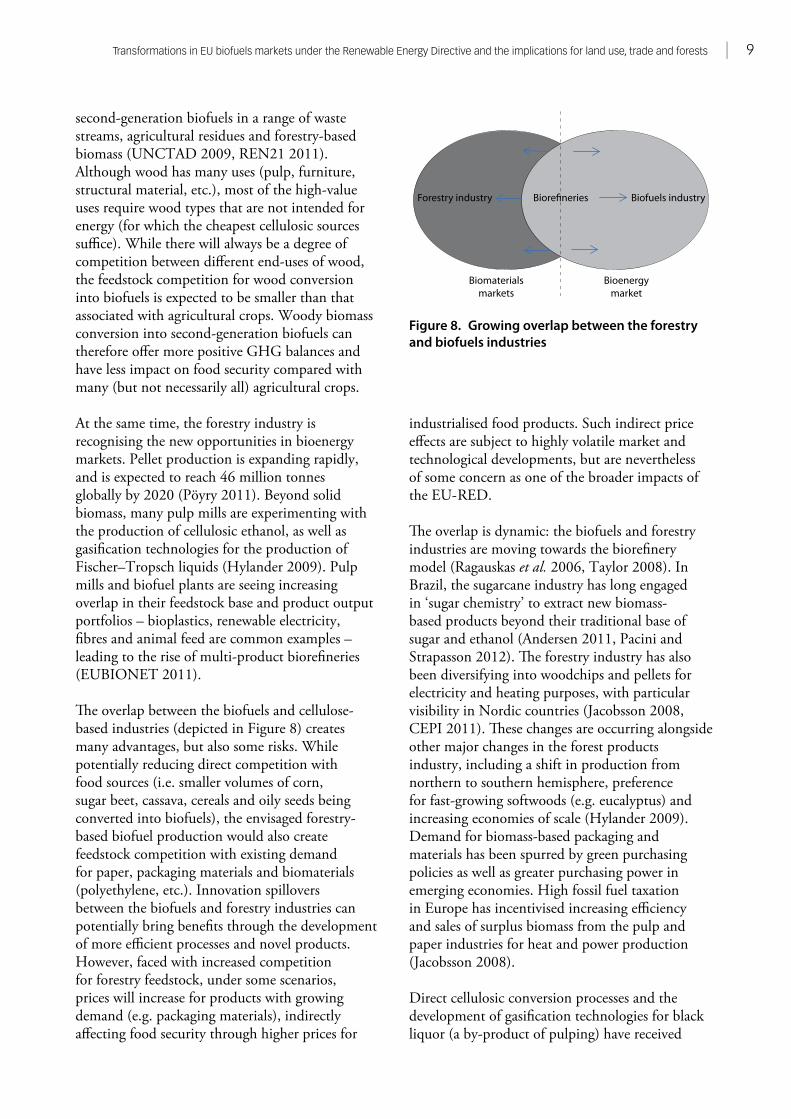
The overlap between the biofuels and cellulose-based industries (depicted in Figure 8) creates many advantages, but also some risks. While potentially reducing direct competition with food sources (i.e. smaller volumes of corn, sugar beet, cassava, cereals and oily seeds being converted into biofuels), the envisaged forestry-based biofuel production would also create feedstock competition with existing demand for paper, packaging materials and biomaterials (polyethylene, etc.). Innovation spillovers between the biofuels and forestry industries can potentially bring benefits through the development of more efficient processes and novel products. However, faced with increased competition for forestry feedstock, under some scenarios, prices will increase for products with growing demand (e.g. packaging materials), indirectly affecting food security through higher prices for
industrialised food products. Such indirect price effects are subject to highly volatile market and technological developments, but are nevertheless of some concern as one of the broader impacts of the EU- RED.
The overlap is dynamic: the biofuels and forestry industries are moving towards the biorefinery model (Ragauskas et al. 2006, Taylor 2008). In Brazil, the sugarcane industry has long engaged in ‘sugar chemistry’ to extract new biomass-based products beyond their traditional base of sugar and ethanol (Andersen 2011, Pacini and Strapasson 2012). The forestry industry has also been diversifying into woodchips and pellets for electricity and heating purposes, with particular visibility in Nordic countries (Jacobsson 2008, CEPI 2011). These changes are occurring alongside other major changes in the forest products industry, including a shift in production from northern to southern hemisphere, preference for fast-growing softwoods (e.g. eucalyptus) and increasing economies of scale (Hylander 2009). Demand for biomass-based packaging and materials has been spurred by green purchasing policies as well as greater purchasing power in emerging economies. High fossil fuel taxation in Europe has incentivised increasing efficiency and sales of surplus biomass from the pulp and paper industries for heat and power production (Jacobsson 2008).
Direct cellulosic conversion processes and the development of gasification technologies for black liquor (a by-product of pulping) have received
Figure 8. Growing overlap between the forestry and biofuels industries
Forestry industry Biofuels industryBiore�neries
Bioenergymarket
Biomaterialsmarkets
10 | Francis X. Johnson, Henrique Pacini and Edward Smeets
public support in Europe to generate both green electricity and biofuels, especially methanol and Fischer–Tropsch diesel (Hylander 2009). The forest products industry is nevertheless concerned about the renewable energy goals for 2020, which would imply a large additional demand for biomass for heating along with the future production of advanced biofuels; the wood deficit for 2020 has been estimated as 100 Mm3 (equivalent to about 13 Mtoe in energy end-use terms5) because of the additional energy-driven demand from the EU-RED (Hylander 2009). This gap is equivalent to nearly half of the expected EU biofuels market demand in 2020; as such, it indicates the future importance of imported feedstock, representing a substantial market opportunity for both developed and developing countries with potential for the expansion of managed forests.
The high costs of woody or cellulosic feedstocks in the EU could therefore eventually lead to considerable growth in demand for imported woody biomass. However, the cost structure of second-generation biofuels is quite different from that of first-generation biofuels; the greatest share of costs is in the conversion platform rather than in the feedstocks (Bradley et al. 2009). Consequently, demand for imported woody biomass for second-generation biofuels is unlikely to be an issue for quite some time. Demand for domestic and imported woody biomass for heat and power will nevertheless contribute to direct and indirect land use pressures and affect the overall biomass supply/demand balance. Furthermore, the rise of biorefineries as sources of both energy and materials will undoubtedly transform the forest products sector in the future and should lead to greater overall efficiency.
2.4 Future developments in biofuels markets, trade and feedstocksMarkets tend to move faster than legislative and regulatory instruments. As such, even though the EU-RED will shift the market somewhat, the underlying competitive forces will determine its long-term development. It is clear that, as international trade in biofuels grows, markets
5 Assuming an average 50% conversion efficiency across all end-uses, 100 million m3 wood = 0.5 × 0.725 tonne/m3 × 0.358 toe/tonne of wood = 13 Mtoe.
will likely expand in a manner different from the supply-side or market-push approaches that have dominated in the past: lower cost imports facilitate a faster-growing market for the importer while allowing exporters to exploit their comparative advantage. LDCs looking to export biofuels or feedstocks can take advantage of preferential tariffs available through the GSP and EPAs as well as related arrangements, such as the Everything but Arms Initiative, which was incorporated into the GSP and confers unlimited, duty-free and quota-free access (EC-Trade 2011). The WTO generally tends to be lenient when it comes to preferences that have economic development objectives.
Barring significant changes in multilateral trade regimes, Brazil will continue to dominate the global trade in bioethanol (and imports into the EU), because few countries can approach its cost-competitiveness; however, if Brazilian and global demand both continue to grow at a brisk pace, shortfalls in Brazilian bioethanol could upset the trade balance (recall/compare Figure 4 and 5). Whereas first-generation bioethanol from the US or other temperate regions could compensate for the shortfall, the environmental impacts would be considerably worse because of the much higher energy and land requirements for corn ethanol. Until second-generation biofuels can enter the market (and for some time thereafter), there is a clear advantage in economic and environmental terms of policies and incentives in developing countries for production of sugarcane-based ethanol. The tariff preferences available to LDCs, especially African producers, therefore offer a clear opportunity for enhanced cooperation on bioethanol; a key question is whether African producers will have the administrative, technical and financial capacity to meet sustainability requirements. Ethiopia, Mozambique, Tanzania and other African countries have been seeking investment for larger-scale production facilities and developing strategies for domestic and export markets (Lerner et al. 2010).
The trends in biodiesel consumption show the dominance of soybean oil and palm oil among the imported biofuels/feedstocks in the EU and globally; in strictly economic terms, both palm oil and soybean oil are preferred to rapeseed oil and can be expected to dominate until second-generation biofuels become competitive and/
Transformations in EU biofuels markets under the Renewable Energy Directive and the implications for land use, trade and forests | 11
or higher GHG reduction standards come into effect during 2017 (which will especially affect soya). The main question for palm oil and soybean oil, therefore, is which operators and regions can meet the EU sustainability criteria; at the same time, each crop has its own associated voluntary sustainability scheme (RSPO 2011, RTRS 2011; see Chapters 3 and 4). In the case of palm oil, the question hinges especially on emissions from land use change as well as the GHG reductions from installation of methane capture at palm oil mills,
which cannot otherwise meet the required GHG reduction targets (EC 2009a, Annex V). In the case of soybean oil, the EU market will become more difficult to access in the future because of the relatively low default GHG emissions level of 31% assigned in the EU-RED (EC 2009a, Annex V). However, this does not mean that the global market will develop in the same way; in particular, US legislation sets a much higher default GHG emission reduction of 57% for soy biodiesel (US EPA 2010a).
The EU-RED represents a major shift in the approach to renewable energy in the EU and globally, through the use of mandated
renewable energy targets and a combination of measures designed to expand renewables rapidly in all sectors. The approach in the transport sector differed from previous efforts in the application of sustainability criteria to biofuels, regardless of whether they originated within the EU. As these criteria included provisions for GHG reductions, the EU-RED marks a significant departure from Kyoto/UNFCCC guidelines by extending responsibility beyond the borders of the consuming country or end-use market, thus making EU bioenergy users responsible for supply-chain emissions throughout the world (Pena et al. 2010). In this respect, the EU has exceeded the requirements of Kyoto, but in doing so, it has also shifted some of the burden – in the requirements for sustainability certification – to developing countries that wish to sell into the EU market (Johnson 2011).
In this chapter, we outline the transport/biofuels components of the EU-RED and discuss their significance in relation to the direction of biofuels markets and trade, starting with the targets established in the EU-RED. The sustainability criteria are then discussed, including the GHG criteria and the incentive provisions associated with biofuels made from wastes and residues, second-generation biofuels and biofuels produced on degraded land. The targets and the sustainability criteria of the EU-RED must also be viewed in relation to the overall EU energy/climate package
of legislation and associated implementation policies, which have some common elements and requirements.
3.1 EU targets/mandates for biofuels and renewable energyThe recent expansion in EU biofuels markets is attributable largely to legislation promoting renewable energy sources in line with the European Community goals of ‘secure, competitive and sustainable energy’ (EC 2007). The first major piece of legislation was the Renewable Electricity Directive, which set an EU target for 21% of electricity generated in 2010 to come from renewable energy sources (EC 2001). It was later accompanied by analogous legislation for the transport sector: the Biofuels Directive established biofuels targets of 2% by 2005 and 5.75% by 2010 (EC 2003). The EU as a whole did not meet the 2010 target, although seven member states did: Austria, France, Germany, Poland, Portugal, Slovakia and Sweden (EC 2011c). Technically, the member states had until the end of 2011 to meet the target, after which the targets were formally replaced by the EU-RED 2020 targets (EurObserv’ER 2011).
In April 2009, the European Parliament and Council adopted the Directive on the Promotion of Renewable Energy Sources, known as the Renewable Energy Directive or EU-RED (EC 2009a). The EU-RED essentially incorporates the two previous directives into a unified and more ambitious instrument establishing specific national
EU biofuels policies and market development
3
Transformations in EU biofuels markets under the Renewable Energy Directive and the implications for land use, trade and forests | 13
targets towards an EU-wide goal of 20% renewable energy in the total primary energy consumption by 2020, thus covering all end-sectors. The renewable energy goal is part of the overall EU 20/20/20 energy/climate strategy and the accompanying package of legislation, which is aimed at achieving a 20% improvement in energy efficiency, a 20% increase in renewable energy and a 20% reduction in GHG emissions (EC 2008b). The EU-RED sets a separate target of 10% renewable energy in the transport sector. Member states are tasked with producing National Renewable Energy Action Plans (NREAPs) to survey their potential and outline individual strategies to meet the targets.
The move from indicative sectoral targets (for renewable electricity in 2001 and biofuels in 2003) into one legally binding overall target (20%) for renewable energy by 2020 represents the essence of the EU-RED (Hodson et al. 2010). In making this shift, the directive seeks to provide investment security and flexibility in order to increase the share of renewables in Europe. However, the inclusion of a mandatory 10% share of renewable energy in transport appears to contradict the ideal of flexibility. The EC position was based on the idea that investment security and clear market signals were needed in the low-performing transport sector, which lags behind the electricity and heating sectors in the share of renewables (EC 2007). Furthermore, CO2 emissions have risen significantly in the transport sector; from 1990 to 2008, CO2 emissions rose by 30%, whereas many other sectors or sources recorded decreases (EEA 2010).
The EU member states have very different proportions of renewable electricity and heating in their economies, but their starting points were similar in regard to the transport sector. It was therefore perceived that a flat 10% share of renewable energy in transport for all member states was appropriate and fair irrespective of their starting points. As noted by Hodson et al. (2010, pp. 174–175), the consumption shares of renewables in transport were all well below 10% when the directive was adopted in 2009. It was further recognised that the target would mainly be met through biofuels in the near term, and therefore the mandatory target would not unfairly impose on individual member states with differing
resource endowments because liquid fuels for transport are easily traded across borders (EC 2009a). Although member states can set voluntary targets higher than 10%, the carbon offset costs tend to be higher in transport than in other sectors, indicating a potential lack of interest in exceeding the legal mandate (McKinsey 2010).
The Fuel Quality Directive (FQD), which is part of the 20/20/20 package, requires, among other provisions, a decrease in GHG emissions from fuels used in the transport sector (EC 2009b). Use of biofuels is a key measure that fuel suppliers will employ to reduce emissions, as it is generally cheaper than other measures such as reducing emissions at oil refining facilities. The provisions related to biofuels are identical to those of the EU-RED, as the two directives were reconciled as part of the legislative process. The requirement for lower emissions for new passenger cars, which is another element in the energy/climate package, provides some credit for use of biofuels, including flex-fuel vehicles (EC 2009c). Therefore, it is important to recognise that the biofuels expansion in the EU is occurring in response to several directives or regulations and not only the EU- RED.
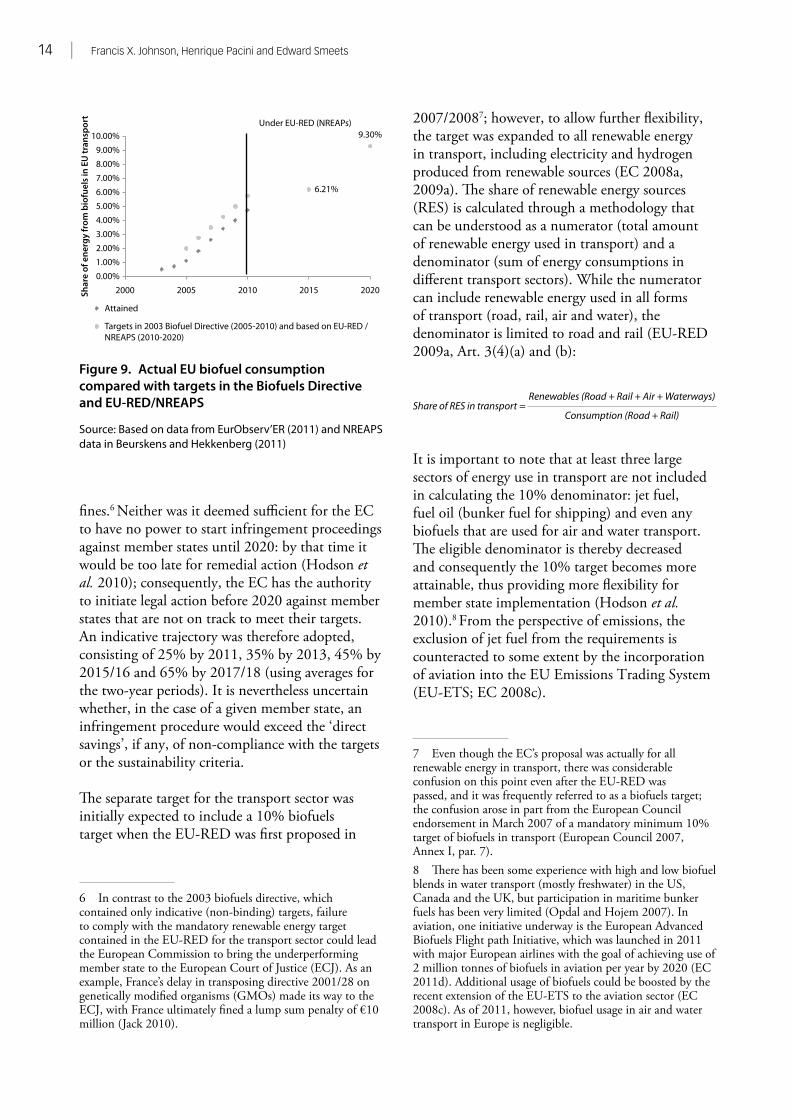
3.2 Share of biofuels in the EU in 2010 and 2020One of the reasons for revisiting biofuels in the EU-RED was the failure to meet the targets in the 2003 Biofuels Directive. Figure 9 compares the actual biofuel consumption with targets set in the 2003 Biofuels Directive and expectations for 2020, as embodied in the NREAPs of the member states. Biofuels are expected to make up the bulk of the contribution to the 2020 targets because of their favourable interface with current transport infrastructure; the shares of biofuels in 2015 and 2020 as estimated in the NREAPs are 6.2% and 9.3% (Beurskens and Hekkenberg 2011, p. 18).
The mandatory character of the EU-RED (including the overall and transport targets and the sustainability criteria) means it is expected to have more force in gaining compliance from member states; non-compliance is more than merely embarrassing, as it can lead to judicial action and
14 | Francis X. Johnson, Henrique Pacini and Edward Smeets
fines.6 Neither was it deemed sufficient for the EC to have no power to start infringement proceedings against member states until 2020: by that time it would be too late for remedial action (Hodson et al. 2010); consequently, the EC has the authority to initiate legal action before 2020 against member states that are not on track to meet their targets. An indicative trajectory was therefore adopted, consisting of 25% by 2011, 35% by 2013, 45% by 2015/16 and 65% by 2017/18 (using averages for the two-year periods). It is nevertheless uncertain whether, in the case of a given member state, an infringement procedure would exceed the ‘direct savings’, if any, of non-compliance with the targets or the sustainability criteria.
The separate target for the transport sector was initially expected to include a 10% biofuels target when the EU-RED was first proposed in
6 In contrast to the 2003 biofuels directive, which contained only indicative (non-binding) targets, failure to comply with the mandatory renewable energy target contained in the EU-RED for the transport sector could lead the European Commission to bring the underperforming member state to the European Court of Justice (ECJ). As an example, France’s delay in transposing directive 2001/28 on genetically modified organisms (GMOs) made its way to the ECJ, with France ultimately fined a lump sum penalty of €10 million (Jack 2010).
2007/20087; however, to allow further flexibility, the target was expanded to all renewable energy in transport, including electricity and hydrogen produced from renewable sources (EC 2008a, 2009a). The share of renewable energy sources (RES) is calculated through a methodology that can be understood as a numerator (total amount of renewable energy used in transport) and a denominator (sum of energy consumptions in different transport sectors). While the numerator can include renewable energy used in all forms of transport (road, rail, air and water), the denominator is limited to road and rail (EU-RED 2009a, Art. 3(4)(a) and (b):
It is important to note that at least three large sectors of energy use in transport are not included in calculating the 10% denominator: jet fuel, fuel oil (bunker fuel for shipping) and even any biofuels that are used for air and water transport. The eligible denominator is thereby decreased and consequently the 10% target becomes more attainable, thus providing more flexibility for member state implementation (Hodson et al. 2010).8 From the perspective of emissions, the exclusion of jet fuel from the requirements is counteracted to some extent by the incorporation of aviation into the EU Emissions Trading System (EU-ETS; EC 2008c).
7 Even though the EC’s proposal was actually for all renewable energy in transport, there was considerable confusion on this point even after the EU-RED was passed, and it was frequently referred to as a biofuels target; the confusion arose in part from the European Council endorsement in March 2007 of a mandatory minimum 10% target of biofuels in transport (European Council 2007, Annex I, par. 7).8 There has been some experience with high and low biofuel blends in water transport (mostly freshwater) in the US, Canada and the UK, but participation in maritime bunker fuels has been very limited (Opdal and Hojem 2007). In aviation, one initiative underway is the European Advanced Biofuels Flight path Initiative, which was launched in 2011 with major European airlines with the goal of achieving use of 2 million tonnes of biofuels in aviation per year by 2020 (EC 2011d). Additional usage of biofuels could be boosted by the recent extension of the EU-ETS to the aviation sector (EC 2008c). As of 2011, however, biofuel usage in air and water transport in Europe is negligible.
Figure 9. Actual EU biofuel consumption compared with targets in the Biofuels Directive and EU-RED/NREAPS
Source: Based on data from EurObserv’ER (2011) and NREAPS data in Beurskens and Hekkenberg (2011)
10.00%
9.00%
8.00%
7.00%
6.00%
5.00%
4.00%
3.00%
2.00%
1.00%
0.00%
Under EU-RED (NREAPs)9.30%
6.21%
Shar
e of
ene
rgy
from
bio
fuel
s in
EU
tran
spor
t
2000 2005 2010 2015 2020
Attained
Targets in 2003 Biofuel Directive (2005-2010) and based on EU-RED /NREAPS (2010-2020)
Share of RES in transport =Renewables (Road + Rail + Air + Waterways)
Consumption (Road + Rail)
Transformations in EU biofuels markets under the Renewable Energy Directive and the implications for land use, trade and forests | 15
3.3 Establishment of biofuels sustainability criteriaThe EU-RED’s importance in promoting biofuels in Europe extends beyond its function as a remedy to the underperforming 2003 directive; it was also intended to incorporate the emerging scientific consensus on the need for more rigorous sustainability accounting, particularly in relation to agro-energy systems and their impacts. Therefore, under the assumption that biofuels would continue to make the bulk of the contribution towards the 2020 targets for renewables, a sustainability scheme was included in the directive to address the risks associated with greater biofuel demand in Europe. The EU-RED and the Fuel Quality Directive include sustainability criteria that are compulsory if biofuels are to be eligible in meeting the 10% renewable energy target (EC 2009a, 2009b). The criteria indicate that biofuels and bioliquids:• should deliver a minimum of 35% savings in
GHG emissions, when compared with life cycles of their fossil-fuel equivalents; these requirements are elevated to 50% after 2017 or 60% in the case of new production/facilities;
• cannot be produced in areas of high biodiversity;
• cannot be produced in untouched forests, protected areas and highly biodiverse savannahs (grasslands); and
• cannot be sourced from areas with high carbon stocks, including wetlands and continuous forests.
Member states are entrusted with ensuring that the sustainability criteria are met, regardless of the geographical origin of the biofuels (EC 2010d).
Only biofuels that are certified as sustainable can:• count towards the EU-RED renewable energy
transport targets;• comply with any related renewable energy
obligations;• receive financial support, in accordance with
EU competitiveness provisions;• be counted towards the GHG emission
reductions target in the Fuel Quality Directive (EC 2009b, Art. 7(a));
• receive investment and/or operating aid in accordance with Community Guidelines
on State Aid for Environmental Protection (EC 2008d);
• be taken into account under the provisions for alternative fuel vehicles of the regulation on CO2 from passenger cars (EC 2009c).
As a complement to the core criteria related to environmental sustainability, a number of socio-economic issues have been flagged for future monitoring by means of periodic reporting, such as the impacts of biofuel demand on food prices and land rights, especially in developing countries. An additional requirement calls for biofuels to be produced under work conditions that observe the conventions of the International Labour Organization. The lack of binding social criteria in the EU-RED led to criticism from NGOs; some of the voluntary standards that have emerged include social criteria (see Chapter 5). However, it should be noted that many NGOs seem to have used the biofuels debate fairly aggressively as a way to increase their public exposure rather than as a way to improve scientific assessments (Pilgrim and Harvey 2010). Balancing the different perspectives that have emerged in relation to biofuels has become more challenging because many of these organisations are based in the EU and do not necessarily have the capacity to understand and incorporate developing country conditions or interests.
3.4 Alternatives: National, bilateral and voluntary approachesThe EU-RED provides three options for market agents or operators to obtain certification of sustainable biofuels:1. via voluntary schemes for producers,
irrespective of origin;2. through bilateral or multilateral agreements
with third countries; and3. through recognition by a member state of
the EU.
The EC has the power to examine and recognise agreements with third countries based on proof of attaining the same requirements as for voluntary schemes, that is, the minimum sustainability requirements for biofuels laid out in the EU-RED. In fact, a number of countries
16 | Francis X. Johnson, Henrique Pacini and Edward Smeets
and regions have started developing their own plans for sustainability certification, not only in response to the EU-RED but also for the sake of their own market development. The Southern African Development Community (SADC) and its member states have been active in this respect, in devising strategies for sustainable biofuels development, with some initial support from donors alongside their own efforts (Lerner et al. 2010).
Voluntary schemes could be developed by industry groups, NGOs, governments or other organisations; unlike the mandatory ‘floor’ set by the EU-RED, such schemes are associated with voluntary compliance by operators. The EC can examine voluntary schemes and decide – via comitology process – whether a voluntary scheme is at least as stringent as the requirements of the EU-RED (EC 2009a, Art. 18(4)). While EU member states can support and promote voluntary schemes via national agencies, they cannot require mandatory compliance with sustainability requirements that are more stringent than those in the directive. While market operators in third countries (i.e. outside the EU) can obtain sustainability recognition if their governments reach an agreement with the EC, the voluntary scheme option has gained initial traction. Voluntary schemes are analysed in further detail in Chapters 4 and 5, focusing on the seven schemes that were approved in mid- 2011.
The choice between the available alternatives has implications in terms of consistency with international trade law. Bilateral or multilateral agreements are somewhat less likely to conflict with the requirements of the World Trade Organization (WTO). Voluntary schemes used under the EU-RED are considered private arrangements and thus are not addressed by international agreements achieved through the WTO (Weiss 2011). If one or several of these agreements can be interpreted as protectionist or trade-distorting, their application might be interpreted as a discriminatory measure. Nearly all of the voluntary schemes are associated with organisations based in developed countries, mainly within Europe. At the same time, biofuels viewed as non-compliant with these schemes are much more likely to come from (tropical) developing countries; this will affect the sales
of those non-compliant biofuels, and thus the schemes could provide cause for complaints of discriminatory treatment with respect to the General Agreement on Tariffs and Trade (GATT) and/or the Technical Barriers to Trade (TBT) agreement (Tran 2010).
Another issue that may affect the argument on free trade and protectionism is the definition of certain ‘no-go’ areas, in particular ‘highly biodiverse grasslands’ (EC 2009a, Art. 17(3)(c)), which remains poorly defined. Such a prohibition could directly affect Brazil and many African countries with great potential for biofuel production. In Brazil, grasslands already converted to agriculture, especially to pastureland, are exactly those considered under Brazilian legislation to be among the main potential areas for the expansion of bioethanol production with the lowest environmental impact. In addition, the potential enforcement by the EC on ‘no-go’ areas has been seen as a tendentious policy and an inequitable or unbalanced measure, given that the European biomes’ biodiversity is in fact more damaged than many other regions (De Miranda 2007), meaning that Europeans would not be directly affected by most of these criteria (Pacini and Strapasson 2012). The definitions of grasslands vary according to national legislation; hence, some of the voluntary schemes recognised by the EC opted not to include highly biodiverse grasslands in their standards, thus refraining from certifying biofuels produced in pasturelands (Pacini and Assunção 2011; see also Section 4.1).
3.5 Incentives for advanced biofuels and use of wasteFirst-generation biofuels that are based on edible crops carry some risk of exacerbating food insecurity through substitution for food crops in some regions and in the effects on food prices (Rosillo-Calle and Johnson 2010). Some first-generation biofuels also present low GHG savings (EC 2009a, Annex V). To stimulate technological development, enlarge the feedstock base, reduce risks to food supply and push for greater GHG savings, advanced biofuels receive additional incentives under the EU-RED. Advanced biofuels such as those based on cellulosic or lignocellulosic non-food material, as well as biofuels made from
Transformations in EU biofuels markets under the Renewable Energy Directive and the implications for land use, trade and forests | 17
waste and residues,9 count double towards the 10% target, on an energy basis (EC 2009a, Art. 21(2), GAIN 2010, Hodson et al. 2010).
Although some waste streams are limited by the level of efficiency and productivity of their main activities (e.g. waste oil from cooking), lignocellulosic sources such as wood and straw represent a large feedstock base for advanced biofuel production; nevertheless, as of 2011, there was only marginal use of such sources for transport energy purposes. In addition to double-counting towards the national targets, the EU-RED includes another incentive for advanced biofuels by attributing them favourable default values in GHG balances (EC 2009a, Annex V); this makes them more interesting for investors because the minimum GHG stringency threshold rises in 2017. Furthermore, those wastes that are industrial in origin – or are otherwise distinct from agriculture, forestry and fisheries – only need to meet the GHG criteria and do not need to be certified in relation to the land-related criteria, that is, the ‘no-go’ areas such as virgin forests.
The economic definition of ‘waste’ is as a ‘non-good’, something with negative price, or in other words something one pays – or is willing to pay – to have less of rather than more (Boyes and Melvin 2010). While the ‘non-good’ definition is not written in the EU-RED, the communication published by the EC on practical guidelines for implementation of the sustainability criteria (EC 2010d) hints at this meaning. According to the communication, a processing residue is a substance that is not the end product(s) for which a production process is intended; that is, it is not a primary aim of the production process and the process has not been deliberately modified to produce it.10 Note the use of the plural in
9 Art. 17(1) of the EU-RED says that ‘biofuels and bioliquids produced from waste and residues, other than agricultural, aquaculture, fisheries and forestry residues, need only fulfil the sustainability criteria” in Art. 17(2) (35% GHG savings). This leaves scope only for industrial (processing) residues to benefit from the lower requirements.10 This definition does not preclude a valued co-product that is used internally within a company or factory, for example. While such co-products might have no market price, they have value within companies and cannot be strictly defined as waste. Nevertheless, the EU-RED might stimulate incentives for use of such co-products for biofuel production.
‘product(s)’, indicating that a production process can have multiple purposes, which is common for biomass/bioenergy.
The case of soya is instructive in some respects. Soya is often exported as soya complex, which is processed into a protein-rich cake for animal feed, with the oil as a residue. The market demand is often driven by the cake, so a market operator could in principle claim that the leftover oil is a waste product and might try to obtain double credit when turning this into biodiesel. This would create a perverse incentive, because soy-based biodiesel is land-intensive and has fairly high life-cycle GHG emissions (Fargione et al. 2008, EC 2009a, Annex V). The land use impacts of soya imports can be separated by combining market value analysis with physical production conditions; because the animal feed has a higher market value, greater land use impacts are associated with the animal feed than with the oil. Animal feed from soya imported into the EU was estimated as requiring 10.5 million ha of land (data for the year 2007) compared with 1.4 million ha for the oil converted into biodiesel (FOE 2008). For the calculation of the soya biodiesel default values in the directive, soybean oil and cake are both considered as co-products and not as residues (EC 2009a, 2010d). Moreover, soybean oil is a conventional good (with positive price) with large markets worldwide. Therefore, it should be difficult for operators to convince authorities to count the oil as waste.
3.6 Market leakageEurope has spearheaded the biofuels sustainability sector by introducing incentives for ambitious biofuel use in combination with a set of mandatory sustainability requirements. However, Europe is far from alone in the push for biofuels expansion (UNCTAD 2009). In the face of uncertainties regarding demand growth, technical possibilities, land use change methodologies and evolution of competing markets (e.g. food, biomaterials), market agents might be unsure as to whether Europe will be the market with the most attractive returns. In this sense, the stringent ‘avant-garde’ European policy on biofuels could cause a ‘leakage effect’ as firms look for less regulated, more secure markets to target for their biofuel operations.
18 | Francis X. Johnson, Henrique Pacini and Edward Smeets
Before the introduction of mandates and sustainability criteria for biofuels, the regulatory burden for biofuels in the EU arose mainly from technical standards, such as the standard used for ethanol trade. The EU, Brazil and the US produced in 2007 a joint report on internationally compatible biofuel standards, in which it was noted that one of the key technical aspects for trade – water content in anhydrous ethanol – was much more stringent in EU regulations than in US or Brazilian requirements (EU–US–Brazil 2007). In the case of Brazilian biofuel exports, ethanol dehydration costs increase rapidly past a certain degree of purity. It is difficult to keep ethanol from gaining humidity during long-haul shipments (e.g. from Brazil to Europe). Compared with the EU, the US has lower entry tariffs and an attractive duty-avoiding loophole through the Caribbean Basin Initiative, which allows dehydration to be performed in Caribbean countries, facilitating duty-free entry into the US market (Do Amaral and Kutas 2007). In combination with the fact that the US does not have sustainability criteria for biofuels beyond GHG thresholds, this has resulted in higher trade volumes between Brazil and the US (Lamers et al. 2011).
A ‘race to the bottom’ in environmental standards seems unlikely because of the advanced status quo of the biofuels industry in Europe, Brazil and the US, which often have global spillover effects in global technology and market developments. However, unless there is a breakthrough in the Doha Round, high entry tariffs for biofuels in the European market might compound this leakage risk by shifting the destination of future biofuel production away from the EU market.11 This could in turn dilute the relevance of sustainability efforts as the EU market shrinks in relation to global market developments. Producers could instead focus on the requirements (or lack thereof) in other attractive markets such as India or China. An international, legally binding biofuels sustainability standard would be one approach to minimise such risks (Schubert and Blasch 2010). A significant contribution in this regard is the multi-year effort launched in 2010 by the International
11 Although LDCs enjoy exemption from entry tariffs into the EU, tariff regimes lack predictability for countries climbing the ladder of development. This is illustrated by the case of Pakistan, whose ethanol had duty-free access into the EU until this benefit was lost in 2005. See GAIN (2005).
Organization for Standardization in developing a bioenergy sustainability standard (ISO 13065), with ISO members in Brazil and Germany sharing the secretariat and coordination (ISO 2011).
3.7 Incentive for degraded landsTo reduce the pressure on agricultural and other productive land, the EU-RED includes an incentive of 29 g CO2/MJ for biofuels that are produced on restored degraded lands, which are defined as being either ‘severely degraded’ or ‘heavily contaminated’ and therefore unfit for food production (EC 2009a, Annex V(C.8). In principle, the incentive could be valuable for stimulating better land management and higher productivity in bioenergy production; indeed, such incentives would be even more valuable if extended in other policy domains to cover all uses of biomass, rather than only for biofuels.
In global terms, a considerable area of degraded land is available, although the productivity of bioenergy feedstocks on degraded or marginal lands depends on many factors; estimates of potentials are based on imaging data, crop growth models and/or additional information on soils and climatic conditions. The actual yield for a particular crop in a specific location would nevertheless vary significantly because site-specific factors could predominate over aggregate conditions. A summary of some global estimates developed from geographically disaggregated data is given in Table 1; several estimates are in the range of 25–50 EJ, which amounts to 5–10% of current global energy consumption. In most estimates, the total potential amounts to more than 20 times the energy needed to meet the projected consumption under EU biofuels targets for 2020 and 4–8 times the projected global demand. In principle, a concerted effort to grow biofuel feedstocks on degraded lands could thus contribute to the avoidance of land use change (direct and indirect) both in the EU and globally.
Translating this biophysical potential into actual production on degraded lands is quite another matter; the yields will often be lower than expected and the economic barriers to establishing biofuels on such lands are quite high. Furthermore, due to low land purchase or rental costs, the economic barriers will be considerably higher in developing

Transformations in EU biofuels markets under the Renewable Energy Directive and the implications for land use, trade and forests | 19
Table 1. Summary of estimates of bioenergy potential on degraded or abandoneda lands
Source Lands included Area(million ha)
Biomass yield(t/ha/year)
Bioenergy potential (EJ/year)
Ratio to projected EU biofuels consumption in 2020b
Ratio to projected global biofuels consumption in 2020c
Van Vuuren et al. (2009)
Global degraded lands not in use as forest, cropland, pastureland or urban areas
n/a 2.5–33 31 15 4
Hoogwijk et al. (2003)
Abandoned agricultural land and degraded grassland systems
430–580 1–10 8–110 4–54 1–15
Tilman et al. (2006)
Agriculturally abandoned and degraded lands
500 4.74 45 22 6
Field et al. (2008)
Abandoned pasturelands and croplands not in use as urban or forest areas
386 3.55 27 13 4
Campbell et al. (2008)
Abandoned pasturelands and croplands not in use as urban or forest areas
385–472 4.3 32–41 16–20 4–6
Nijsen et al. (2011)
Based on downscaling of lands classified in GLASOD database
1836 2.2–10.1 344 169 48
Wicke et al. (2011a)
Salt-affected soils (suitable for woody biomass)
971 3.1 56 28 8
a Degraded lands are areas where toxicity, salinisation, eutrophication or other conditions have made the land unsuitable for food production, whereas abandoned lands are generally agricultural lands that are no longer in use (Campbell et al. 2008, Wiegmann et al. 2008).
b Based on NREAPS projections (Beurskens and Hekkenberg 2011) and assuming conversion efficiency of 60%.
c Based on OECD/FAO = projections (OECD–FAO 2011) and assuming conversion efficiency of 60%.
countries that have fairly low population densities (e.g. most countries in sub-Saharan Africa) and therefore the credit seems more likely to be used in developed regions. The value of the credit also appears to be too low: it is likely to incentivise only the use of very slightly degraded lands and only for high-yielding crops such as oil palm and sugarcane. The difficulty arises because the credit is given on a per-energy basis rather than a per-hectare basis and also because it does not
distinguish between types of land based on their level of degradation (Lange 2010). The economic incentives would thus need to be not only greater but also differentiated to land types. This might be accomplished through changes to the EU-RED or through other international schemes such as the UN-REDD programme (United Nations Collaborative Programme on Reducing Emissions from Deforestation and Forest Degradation in Developing Countries).

20 | Francis X. Johnson, Henrique Pacini and Edward Smeets
The question of whether a particular country will make use of its degraded lands when expanding production of biofuel feedstocks for export to the EU hinges on institutional factors as well as the underlying economics of producing biofuels on degraded lands. Major exporting countries such as Indonesia or Argentina also have their own mandates or targets; even if the economic incentives were sufficient, they might choose to produce biofuels for export on degraded lands and produce biofuels for domestic use on higher-valued lands. Somewhat similar distortions have already been observed within the EU with respect to food and non-food markets; for example, Germany reserves most of its domestically produced rapeseed for biodiesel and imports rapeseed for food uses, because only the biofuel feedstock has to meet sustainability requirements (USDA 2011).
Yet another factor arises because of the path taken in exporting countries to achieve their own targets: if high levels of productivity are pursued along with incentives to use degraded land, then the total area of land use affected could be greatly reduced. It has been estimated that Indonesia, for example, has 13–14 million ha of degraded lands that might be used for palm oil production so as to avoid use of agricultural or forested lands; however, because of the nation’s domestic targets, whether Indonesia will have any surplus for export from new production on degraded lands depends on increasing the overall productivity (yields) in existing and new palm oil production (Wicke et al. 2011a). International cooperation in the form of bilateral or multilateral agreements could therefore perhaps achieve multiple goals more efficiently by aiming at improving productivity and incentivising the use of degraded lands, thereby supporting both domestic and export markets.
A wide variety of voluntary sustainability schemes have emerged in response to the expansion of biofuels and bioenergy
markets globally. The proliferation of schemes has led to considerable confusion from the perspective of policymakers, investors and other market actors: the schemes have different definitions and approaches and cover different impacts; a clear need for harmonisation and coordination has been identified (Scarlat and Dallemand 2011). The schemes also differ in the financial and administrative costs associated with certification and monitoring. Although these costs will be small in financial terms in developed countries, they will be more significant in LDCs, where technical capacity and institutional capacity are much weaker. Consequently, the costs associated with implementing the schemes could present a barrier for some regions and operators.
Furthermore, the safeguards afforded can differ between schemes, especially given that the conditions vary greatly across regions, as was found in an analysis of schemes related to REDD 12 and REDD+. Merger et al. (2011) analysed 10 widely accepted standards for REDD+ activities after initially identifying six criteria to compare and evaluate the different standards: poverty alleviation, sustainable management of forests, biodiversity protection, quantification of net GHG benefits, monitoring and reporting, and certification procedures. The evaluation revealed that no one
12 REDD+, which was concluded at the UNFCCC COP 16 in Cancun, goes beyond REDD by including the role of conservation, sustainable management of forests and enhancement of forest carbon stocks.
standard comprehensively and rigorously covers all six criteria. As a result, it might be necessary to combine two or more certification schemes to fully ensure the social and environmental integrity of REDD+ activities (Merger et al. 2011).
To clarify the status of schemes with respect to the EU market, voluntary schemes could be submitted to the EC for approval according to the requirements of the EU-RED. The EC recognised an initial set of seven schemes in July 2011 (EC 2011a, 2011b). In this section, we analyse the implementation and costs of compliance for the emerging sector of sustainability certification, focusing on these seven schemes, while also drawing on broader experiences and ongoing changes in the biofuels markets. Sustainability certification is itself a market, regardless of whether the actors involved are associated with public or private organisations; competition between the schemes could support the process of harmonisation and integration, so that sustainability certification can serve as an effective tool with low transaction costs.
4.1 Voluntary schemes recognised by the EUA regulatory/market vacuum has existed to some extent since the EU-RED was introduced in 2009, because producers or operators have been uncertain as to how biofuels could be certified as meeting the sustainability requirements. The seven voluntary schemes recently recognised have reduced the uncertainty somewhat; these schemes (Tables 2 and 3) were deemed to adequately cover the
Voluntary sustainability schemes: Cost and compliance issues
4
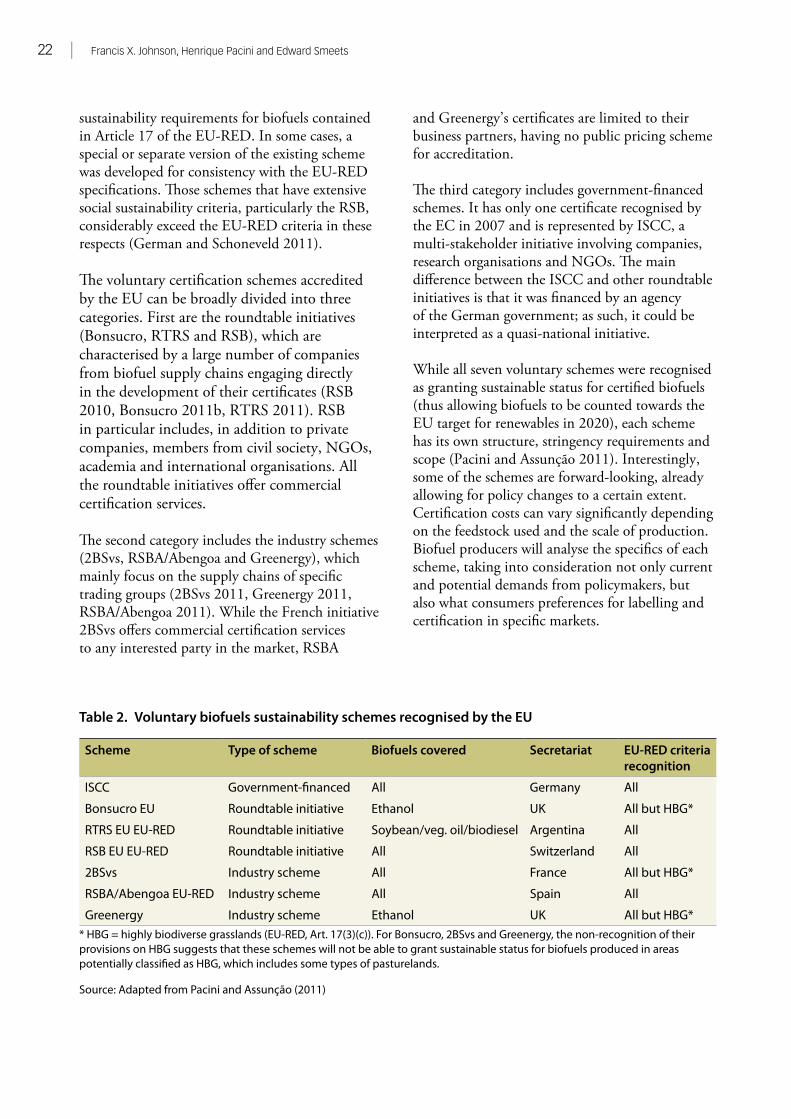
22 | Francis X. Johnson, Henrique Pacini and Edward Smeets
Table 2. Voluntary biofuels sustainability schemes recognised by the EU
Scheme Type of scheme Biofuels covered Secretariat EU-RED criteria recognition
ISCC Government-financed All Germany All
Bonsucro EU Roundtable initiative Ethanol UK All but HBG*
RTRS EU EU-RED Roundtable initiative Soybean/veg. oil/biodiesel Argentina All
RSB EU EU-RED Roundtable initiative All Switzerland All
2BSvs Industry scheme All France All but HBG*
RSBA/Abengoa EU-RED Industry scheme All Spain All
Greenergy Industry scheme Ethanol UK All but HBG** HBG = highly biodiverse grasslands (EU-RED, Art. 17(3)(c)). For Bonsucro, 2BSvs and Greenergy, the non-recognition of their provisions on HBG suggests that these schemes will not be able to grant sustainable status for biofuels produced in areas potentially classified as HBG, which includes some types of pasturelands.
Source: Adapted from Pacini and Assunção (2011)
sustainability requirements for biofuels contained in Article 17 of the EU-RED. In some cases, a special or separate version of the existing scheme was developed for consistency with the EU-RED specifications. Those schemes that have extensive social sustainability criteria, particularly the RSB, considerably exceed the EU-RED criteria in these respects (German and Schoneveld 2011).
The voluntary certification schemes accredited by the EU can be broadly divided into three categories. First are the roundtable initiatives (Bonsucro, RTRS and RSB), which are characterised by a large number of companies from biofuel supply chains engaging directly in the development of their certificates (RSB 2010, Bonsucro 2011b, RTRS 2011). RSB in particular includes, in addition to private companies, members from civil society, NGOs, academia and international organisations. All the roundtable initiatives offer commercial certification services.
The second category includes the industry schemes (2BSvs, RSBA/Abengoa and Greenergy), which mainly focus on the supply chains of specific trading groups (2BSvs 2011, Greenergy 2011, RSBA/Abengoa 2011). While the French initiative 2BSvs offers commercial certification services to any interested party in the market, RSBA
and Greenergy’s certificates are limited to their business partners, having no public pricing scheme for accreditation.
The third category includes government-financed schemes. It has only one certificate recognised by the EC in 2007 and is represented by ISCC, a multi-stakeholder initiative involving companies, research organisations and NGOs. The main difference between the ISCC and other roundtable initiatives is that it was financed by an agency of the German government; as such, it could be interpreted as a quasi-national initiative.
While all seven voluntary schemes were recognised as granting sustainable status for certified biofuels (thus allowing biofuels to be counted towards the EU target for renewables in 2020), each scheme has its own structure, stringency requirements and scope (Pacini and Assunção 2011). Interestingly, some of the schemes are forward-looking, already allowing for policy changes to a certain extent. Certification costs can vary significantly depending on the feedstock used and the scale of production. Biofuel producers will analyse the specifics of each scheme, taking into consideration not only current and potential demands from policymakers, but also what consumers preferences for labelling and certification in specific markets.
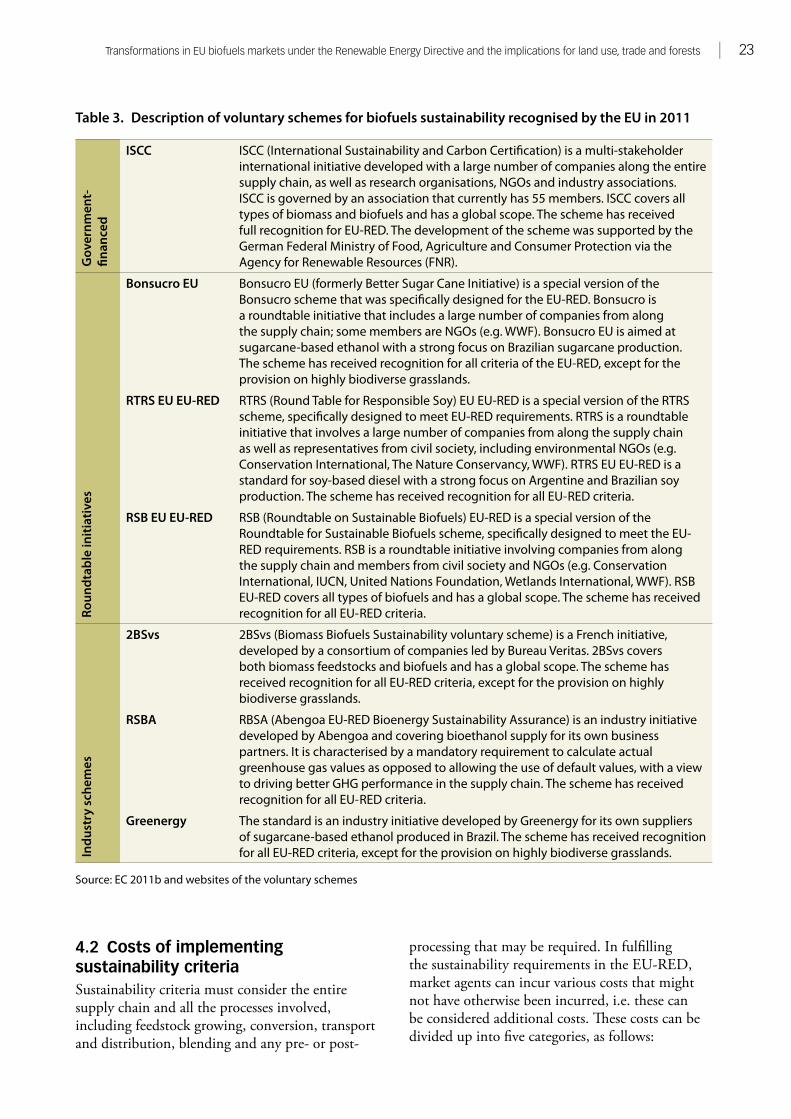
Transformations in EU biofuels markets under the Renewable Energy Directive and the implications for land use, trade and forests | 23
Table 3. Description of voluntary schemes for biofuels sustainability recognised by the EU in 2011
Gov
ernm
ent-
finan
ced
ISCC ISCC (International Sustainability and Carbon Certification) is a multi-stakeholder international initiative developed with a large number of companies along the entire supply chain, as well as research organisations, NGOs and industry associations. ISCC is governed by an association that currently has 55 members. ISCC covers all types of biomass and biofuels and has a global scope. The scheme has received full recognition for EU-RED. The development of the scheme was supported by the German Federal Ministry of Food, Agriculture and Consumer Protection via the Agency for Renewable Resources (FNR).
Roun
dtab
le in
itiat
ives
Bonsucro EU Bonsucro EU (formerly Better Sugar Cane Initiative) is a special version of the Bonsucro scheme that was specifically designed for the EU-RED. Bonsucro is a roundtable initiative that includes a large number of companies from along the supply chain; some members are NGOs (e.g. WWF). Bonsucro EU is aimed at sugarcane-based ethanol with a strong focus on Brazilian sugarcane production. The scheme has received recognition for all criteria of the EU-RED, except for the provision on highly biodiverse grasslands.
RTRS EU EU-RED RTRS (Round Table for Responsible Soy) EU EU-RED is a special version of the RTRS scheme, specifically designed to meet EU-RED requirements. RTRS is a roundtable initiative that involves a large number of companies from along the supply chain as well as representatives from civil society, including environmental NGOs (e.g. Conservation International, The Nature Conservancy, WWF). RTRS EU EU-RED is a standard for soy-based diesel with a strong focus on Argentine and Brazilian soy production. The scheme has received recognition for all EU- RED criteria.
RSB EU EU-RED RSB (Roundtable on Sustainable Biofuels) EU-RED is a special version of the Roundtable for Sustainable Biofuels scheme, specifically designed to meet the EU-RED requirements. RSB is a roundtable initiative involving companies from along the supply chain and members from civil society and NGOs (e.g. Conservation International, IUCN, United Nations Foundation, Wetlands International, WWF). RSB EU-RED covers all types of biofuels and has a global scope. The scheme has received recognition for all EU- RED criteria.
Indu
stry
sch
emes
2BSvs 2BSvs (Biomass Biofuels Sustainability voluntary scheme) is a French initiative, developed by a consortium of companies led by Bureau Veritas. 2BSvs covers both biomass feedstocks and biofuels and has a global scope. The scheme has received recognition for all EU-RED criteria, except for the provision on highly biodiverse grasslands.
RSBA RBSA (Abengoa EU-RED Bioenergy Sustainability Assurance) is an industry initiative developed by Abengoa and covering bioethanol supply for its own business partners. It is characterised by a mandatory requirement to calculate actual greenhouse gas values as opposed to allowing the use of default values, with a view to driving better GHG performance in the supply chain. The scheme has received recognition for all EU- RED criteria.
Greenergy The standard is an industry initiative developed by Greenergy for its own suppliers of sugarcane-based ethanol produced in Brazil. The scheme has received recognition for all EU-RED criteria, except for the provision on highly biodiverse grasslands.
Source: EC 2011b and websites of the voluntary schemes
4.2 Costs of implementing sustainability criteriaSustainability criteria must consider the entire supply chain and all the processes involved, including feedstock growing, conversion, transport and distribution, blending and any pre- or post-
processing that may be required. In fulfilling the sustainability requirements in the EU-RED, market agents can incur various costs that might not have otherwise been incurred, i.e. these can be considered additional costs. These costs can be divided up into five categories, as follows:
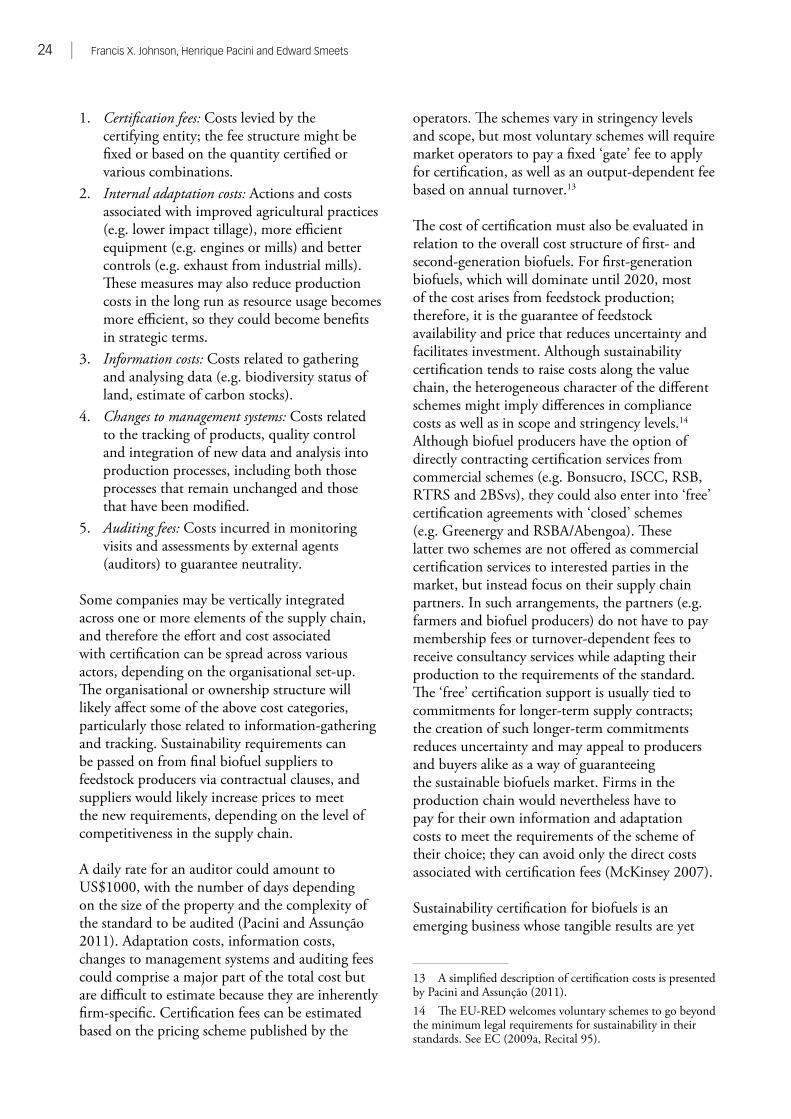
24 | Francis X. Johnson, Henrique Pacini and Edward Smeets
1. Certification fees: Costs levied by the certifying entity; the fee structure might be fixed or based on the quantity certified or various combinations.
2. Internal adaptation costs: Actions and costs associated with improved agricultural practices (e.g. lower impact tillage), more efficient equipment (e.g. engines or mills) and better controls (e.g. exhaust from industrial mills). These measures may also reduce production costs in the long run as resource usage becomes more efficient, so they could become benefits in strategic terms.
3. Information costs: Costs related to gathering and analysing data (e.g. biodiversity status of land, estimate of carbon stocks).
4. Changes to management systems: Costs related to the tracking of products, quality control and integration of new data and analysis into production processes, including both those processes that remain unchanged and those that have been modified.
5. Auditing fees: Costs incurred in monitoring visits and assessments by external agents (auditors) to guarantee neutrality.
Some companies may be vertically integrated across one or more elements of the supply chain, and therefore the effort and cost associated with certification can be spread across various actors, depending on the organisational set-up. The organisational or ownership structure will likely affect some of the above cost categories, particularly those related to information-gathering and tracking. Sustainability requirements can be passed on from final biofuel suppliers to feedstock producers via contractual clauses, and suppliers would likely increase prices to meet the new requirements, depending on the level of competitiveness in the supply chain.
A daily rate for an auditor could amount to US$1000, with the number of days depending on the size of the property and the complexity of the standard to be audited (Pacini and Assunção 2011). Adaptation costs, information costs, changes to management systems and auditing fees could comprise a major part of the total cost but are difficult to estimate because they are inherently firm-specific. Certification fees can be estimated based on the pricing scheme published by the
operators. The schemes vary in stringency levels and scope, but most voluntary schemes will require market operators to pay a fixed ‘gate’ fee to apply for certification, as well as an output-dependent fee based on annual turnover.13
The cost of certification must also be evaluated in relation to the overall cost structure of first- and second-generation biofuels. For first-generation biofuels, which will dominate until 2020, most of the cost arises from feedstock production; therefore, it is the guarantee of feedstock availability and price that reduces uncertainty and facilitates investment. Although sustainability certification tends to raise costs along the value chain, the heterogeneous character of the different schemes might imply differences in compliance costs as well as in scope and stringency levels.14 Although biofuel producers have the option of directly contracting certification services from commercial schemes (e.g. Bonsucro, ISCC, RSB, RTRS and 2BSvs), they could also enter into ‘free’ certification agreements with ‘closed’ schemes (e.g. Greenergy and RSBA/Abengoa). These latter two schemes are not offered as commercial certification services to interested parties in the market, but instead focus on their supply chain partners. In such arrangements, the partners (e.g. farmers and biofuel producers) do not have to pay membership fees or turnover-dependent fees to receive consultancy services while adapting their production to the requirements of the standard. The ‘free’ certification support is usually tied to commitments for longer-term supply contracts; the creation of such longer-term commitments reduces uncertainty and may appeal to producers and buyers alike as a way of guaranteeing the sustainable biofuels market. Firms in the production chain would nevertheless have to pay for their own information and adaptation costs to meet the requirements of the scheme of their choice; they can avoid only the direct costs associated with certification fees (McKinsey 2007).
Sustainability certification for biofuels is an emerging business whose tangible results are yet
13 A simplified description of certification costs is presented by Pacini and Assunção (2011).14 The EU-RED welcomes voluntary schemes to go beyond the minimum legal requirements for sustainability in their standards. See EC (2009a, Recital 95).
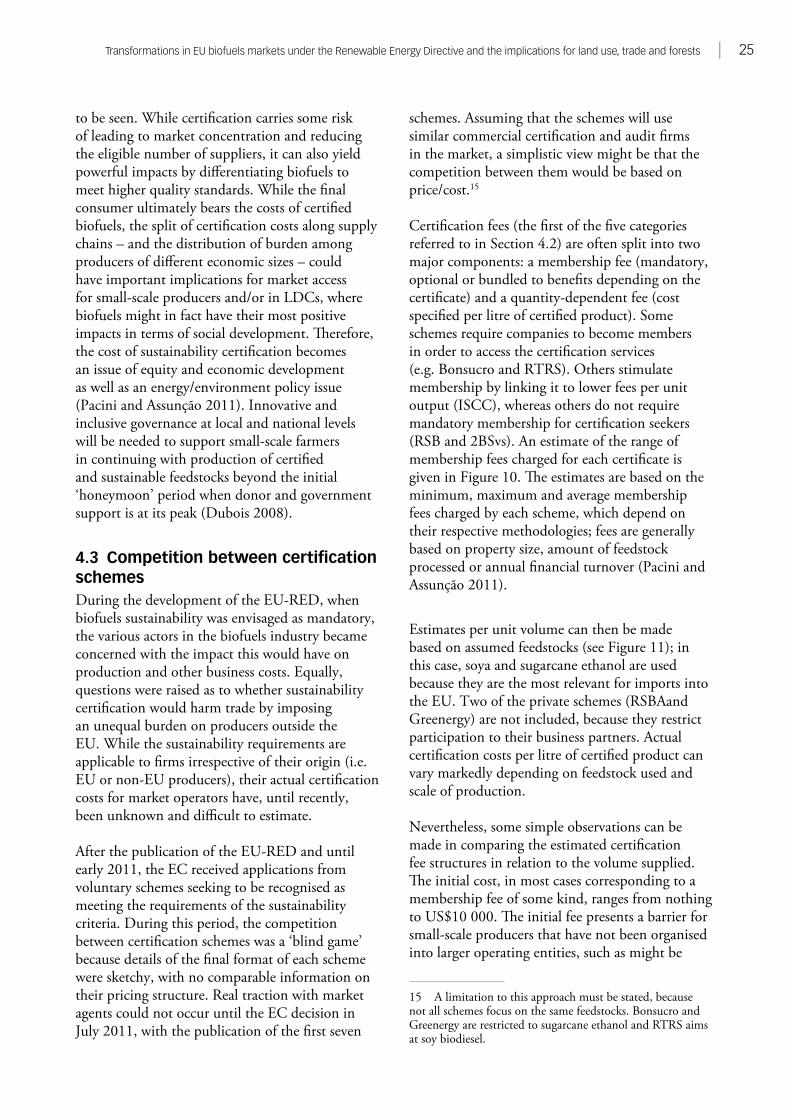
Transformations in EU biofuels markets under the Renewable Energy Directive and the implications for land use, trade and forests | 25
to be seen. While certification carries some risk of leading to market concentration and reducing the eligible number of suppliers, it can also yield powerful impacts by differentiating biofuels to meet higher quality standards. While the final consumer ultimately bears the costs of certified biofuels, the split of certification costs along supply chains – and the distribution of burden among producers of different economic sizes – could have important implications for market access for small-scale producers and/or in LDCs, where biofuels might in fact have their most positive impacts in terms of social development. Therefore, the cost of sustainability certification becomes an issue of equity and economic development as well as an energy/environment policy issue (Pacini and Assunção 2011). Innovative and inclusive governance at local and national levels will be needed to support small-scale farmers in continuing with production of certified and sustainable feedstocks beyond the initial ‘honeymoon’ period when donor and government support is at its peak (Dubois 2008).
4.3 Competition between certification schemesDuring the development of the EU-RED, when biofuels sustainability was envisaged as mandatory, the various actors in the biofuels industry became concerned with the impact this would have on production and other business costs. Equally, questions were raised as to whether sustainability certification would harm trade by imposing an unequal burden on producers outside the EU. While the sustainability requirements are applicable to firms irrespective of their origin (i.e. EU or non-EU producers), their actual certification costs for market operators have, until recently, been unknown and difficult to estimate.
After the publication of the EU-RED and until early 2011, the EC received applications from voluntary schemes seeking to be recognised as meeting the requirements of the sustainability criteria. During this period, the competition between certification schemes was a ‘blind game’ because details of the final format of each scheme were sketchy, with no comparable information on their pricing structure. Real traction with market agents could not occur until the EC decision in July 2011, with the publication of the first seven
schemes. Assuming that the schemes will use similar commercial certification and audit firms in the market, a simplistic view might be that the competition between them would be based on price/cost.15
Certification fees (the first of the five categories referred to in Section 4.2) are often split into two major components: a membership fee (mandatory, optional or bundled to benefits depending on the certificate) and a quantity-dependent fee (cost specified per litre of certified product). Some schemes require companies to become members in order to access the certification services (e.g. Bonsucro and RTRS). Others stimulate membership by linking it to lower fees per unit output (ISCC), whereas others do not require mandatory membership for certification seekers (RSB and 2BSvs). An estimate of the range of membership fees charged for each certificate is given in Figure 10. The estimates are based on the minimum, maximum and average membership fees charged by each scheme, which depend on their respective methodologies; fees are generally based on property size, amount of feedstock processed or annual financial turnover (Pacini and Assunção 2011).
Estimates per unit volume can then be made based on assumed feedstocks (see Figure 11); in this case, soya and sugarcane ethanol are used because they are the most relevant for imports into the EU. Two of the private schemes (RSBAand Greenergy) are not included, because they restrict participation to their business partners. Actual certification costs per litre of certified product can vary markedly depending on feedstock used and scale of production.
Nevertheless, some simple observations can be made in comparing the estimated certification fee structures in relation to the volume supplied. The initial cost, in most cases corresponding to a membership fee of some kind, ranges from nothing to US$10 000. The initial fee presents a barrier for small-scale producers that have not been organised into larger operating entities, such as might be
15 A limitation to this approach must be stated, because not all schemes focus on the same feedstocks. Bonsucro and Greenergy are restricted to sugarcane ethanol and RTRS aims at soy biodiesel.
26 | Francis X. Johnson, Henrique Pacini and Edward Smeets
done through cooperatives or industry groups. The largest fee is for Bonsucro, which is not surprising given the fairly large economies of scale in sugarcane production. Regardless of the feedstock or biofuel, assuming that small-scale growers can
be incorporated into the scheme for the factory to which they deliver their product, these fees do not seem likely to be a barrier. However, the situation may differ for small-scale farmers that supply feedstocks on a spot market or non-contractual
Figure 10. Range of membership fees for biofuels sustainability certification under the schemes recognised by the European Commission in July 2011 (USD as of August 2011)
Source: Based on Pacini and Assunção (2011)
max
average
min
Bonsucro(ethanol)
RSB1 2BSvs RTRS(Soy biodisel)
ISCC Greenergy2 RSBA2$0
$5,000
$10,000
$15,000
$20,000
$25,000
USD
(201
1)
Figure 11. Estimated yearly certification fees for five of the seven schemes
Source: 2BSvs (2011), Bonsucro (2011a), ISCC (2011), Pacini and Assunção (2011), RSB (2011b), RTRS (2011)
Notes: The calculations include average membership costs and quantity-dependent fees (up to 7 million litres of certified sustainable product per year). Costs are given in USD, as of August 2011, including auditing costs of US$1800/two days.
1 For ISCC, the quantity-dependent component is considered as an average of the fees applicable for members and non-members.
2 The 2BSvs scheme has a fixed component based on annual trade volume with no quantity-dependent fee.
* RSB simulations are based on estimated costs for sugarcane ethanol; these may differ for other feedstocks.
Bonsucro(ethanol)
ISCC1 RSB RTRS(Soy biodiesel)
2BSvs2Million litres
$0
$5,000
$10,000
$15,000
$20,000
$25,000
Year
ly c
erti�
catio
n fe
es
0.00
0.24
0.49
0.73
0.97
1.21
1.45
1.70
1.94
2.18
2.42
2.66
2.91
3.15
3.39
3.63
3.87
4.11
4.36
4.60
4.84
5.08
5.32
5.57
5.81
6.05
6.29
6.54
6.78
Transformations in EU biofuels markets under the Renewable Energy Directive and the implications for land use, trade and forests | 27
basis; some schemes (RSPO, RSB) do have taskforces aimed at assisting small-scale farmers, but the situation will differ considerably between regions and it is too early to know how the costs will be absorbed and what barriers may be created.
The fee structure for three of the five schemes (Bonsucro, ISCC, 2BSvs) is almost flat with respect to the volume supplied, whereas the fee structure for RSB and RTRS depends on quantity. Depending on the market size envisaged by a given operator or group of operators – and when those operators have a choice – the schemes with declining marginal cost may be preferable. However, the preference will also depend on the amount of the certification fees in relation to other costs associated with the certification process (recall the discussion in Section 4.2). A small fee in relation to market value suggests that the fees will have no impact unless the volume of biofuels in question is quite small and/or if they are competing in markets where profit margins are extremely thin.
Moreover, the schemes are not ‘perfect substitutes’ for each other and thus direct price competition between these seven schemes will generally not be an issue in the market for certification; each scheme has unique specificities, requirements and scope (recall Table 3). The RTRS, for example, offers a number of different certifications, beyond the one covering the EU-RED. Furthermore, the RTRS covers different implementation mechanisms for the chain of custody, in particular the book and claim method, which relies on tradable certificates rather than the physical flows; consumers or fuel distributors need to purchase certificates equivalent to the sustainable fuel being used (RTRS 2011). The Bonsucro scheme has its own special characteristics in that it covers not only the relevant biofuel itself (bioethanol) but essentially all sugarcane by-products, including sugar, renewable electricity (from bagasse-fired cogeneration) and biomaterials derived from sugarcane.16 The RSB differs from all the others in adopting a higher stringency level than the EU-RED through a two-tier mandatory model, where Tier 1 meets the EU-RED requirements, but also binds accredited firms to migrate to Tier 2, which has more stringent GHG, water and social
16 About Bonsucro: www.bonsucro.com/about.html.
thresholds than the minimum set by the EU-RED (RSB 2010).
Consequently, we can conclude that the differences in approach and product coverage between the certification schemes render price competition irrelevant for developed country producers, although this may not be the case for developing country producers (see Section 4.4). Furthermore, in developed country markets, consumers are more likely to be discerning in the choice of schemes in terms of being environmentally friendly or socially responsible. Yet another concern for feedstock suppliers is choosing a scheme that is somewhat forward-looking, because it is likely that eventually there will be sustainability requirements for other uses of biomass, for both energy (e.g. heat and power) and non-energy uses (e.g. animal feed). Schemes such as Bonsucro and RSB already incorporate some flexibility based on the expectation of future sustainability requirements on biomass, in line with what is being discussed by the European Commission (EC 2010c). In addition, geographical flexibility is important to allow schemes to be useful in other markets of relevance, such as the US and Brazil, which have already moved towards formal sustainability requirements (US EPA 2010b, Pacini and Strapasson 2012). Therefore, schemes that are tilted heavily towards EU-RED requirements will lose their appeal as a global market emerges.
4.4 Cost distribution and compliance for developing countriesA key point of interest for new biofuel producers, especially those in developing countries, is the pattern of distribution of certification costs along the supply chain. While the costs of certifying biofuels are ultimately passed on (to some extent) to the final consumer, the division of certification costs along supply chains could have profound implications for market access for new producers in developing countries and regions where biofuels have their largest potential in terms of socio-economic development. Scenarios for how different actors along the supply chain will absorb costs are illustrated in Figure 12.
Although it can be difficult to infer profit margins of agents at each step of the biofuel production chain, it is safe to assume that firms’ margins

28 | Francis X. Johnson, Henrique Pacini and Edward Smeets
will differ depending on both firm-specific characteristics and the structure of the markets in which they operate. Larger producers could secure higher margins by taking advantage of their market power, not only via economies of scale in sales agreements but also when negotiating purchase prices for production inputs (e.g. fuel, fertiliser, labour from contractors).
The relationships between feedstock producers and processing plants are generally constrained
by two key logistical factors: distance to the conversion facility or factory and the time lag between harvesting and delivery to the factory. Together, these two factors result in a tighter relationship between the owners of the feedstocks/resources and the owners of the factories, mills and/or associated conversion facilities. The distance factor results in some level of spatial market power over nearby feedstock sources, with the time factor in some cases making this relationship even more pronounced. In the case of sugarcane,
Figure 12. Potential distribution of compliance costs with sustainability criteria along biofuels supply chains
Source: Adapted from Boehlje (1999) and Smeets and Faaij (2010)
Note: The dotted line simulates the average increase in costs (the same for all scenarios) while shifting production from conventional biofuels to sustainable biofuels. Scenarios B and C illustrate unequal cost burdens along supply chains.
AEqual burden
throughout supply chain
BHigher burden on
producers
CHigher burden on
consumers
Productioncost
Consumercost
Biofuels supply chain
Feedstock producers MillsTraders
andblenders
Biofuels supply chain
Feedstock producers MillsTraders
andblenders
Biofuels supply chain
Feedstock producers MillsTraders
andblenders
Consumercost
Productioncost
Consumercost
Productioncost
Transformations in EU biofuels markets under the Renewable Energy Directive and the implications for land use, trade and forests | 29
palm oil and some other feedstocks, the harvested crops need to be processed quickly in order to reduce degradation, often making feedstock transport uneconomical beyond a certain radius from the factory. The factories may then become natural monopsonies, that is, the only feasible buyer for that feedstock (Solomon 2009, Pacini and Strapasson 2012). Furthermore, market concentration in a single step of the production chain (e.g. number of feedstock producers or mills in a region) could also influence the way in which producers absorb costs.
The market power of actors in the supply chain and political/economic control over raw materials/feedstocks are other major factors affecting the ability of small-scale farmers to adapt to new sustainability requirements, and can determine how well they can defend their margins while adapting. Although it is socially desirable to have a degree of inclusion of small-scale farming and biofuel processing units (e.g. micro-distilleries), the fixed character of some cost components (e.g. auditing fees), coupled with small-scale actors’ reduced market power, could well result in difficulties for such actors in passing on sustainability adaptation costs, ultimately reducing their operational margins and further complicating small-scale initiatives, most of which are based in developing countries (Pacini et al. 2010).
Producers in LDCs must also cope with a problem that has already been observed in the Clean Development Mechanism (CDM) experience: some countries and subregions (within countries) simply lack the technical and institutional capacity to seek sustainability certification by themselves (De Lopez et al. 2009). In addition, operators in LDC could have difficulties affording services from auditors charging the fees that are established internationally; experience with initiatives such as Fairtrade, which already covers some 1.15 million farmers, could provide valuable lessons on how to address such costs (Fairtrade 2011). Similarly to the logic presented earlier in this chapter, this situation might lead market entrants to request the assistance of biofuel trading groups, while signing longer-term supply contracts in exchange.
Regardless of whether a scheme is open or closed, adaptation to certification requirements and auditing costs would be unavoidable and costly
to producers. Producers can by-pass some of the certification costs by entering agreements with closed schemes, but it is unclear whether this will be an advantageous or feasible channel for new producers in emerging biofuel production regions such as sub-Saharan Africa (Pacini and Batidzirai 2011). The competition between schemes and the ability to pass along certification costs to final consumers will evolve as the market adjusts to the requirements of the EU-RED and other international market requirements in the coming years (Zarrilli 2008, Lee et al. 2011). It is too early to say whether new producers that cannot afford to contract certification services directly from commercial schemes will indeed adhere to closed schemes in exchange for exclusivity contracts. As seen in organic food markets, biofuel certification could potentially transform markets by differentiating biofuels towards consumer preferences (Bolwig et al. 2009).
4.5 Future sustainability criteria for other types of biomass useDuring the development of the EU-RED proposal, concerns were raised that a set of sustainability criteria for biofuels would be insufficient if not followed by legislation covering sustainability for the many other biomass uses beyond liquid biofuels (Kottasz personal communication 2011). These concerns are based on the importance of biomass as a feedstock source for many energy and non-energy uses (Fritsche 2011), as well as its future role as a feedstock for second-generation biofuels. Furthermore, effective land use policy and planning must guide the whole gamut of biomass uses and applications if sustainability concerns are to be effectively addressed (van Dam et al. 2010). The Global Bioenergy Partnership (GBEP) developed (non-binding) guidelines for sustainable bioenergy covering social, environmental and economic pillars for all bioenergy applications, while also aiming to avoid unnecessary trade barriers:
The indicators are intended to inform policy-making and facilitate the sustainable development of bioenergy, and shall not be applied so as to limit trade in bioenergy in a manner inconsistent with multilateral trade obligations. (GBEP 2011, p. 7)
International initiatives have also recognised the need to address other types of biomass for energy
30 | Francis X. Johnson, Henrique Pacini and Edward Smeets
and, in some cases, for non-energy applications; some of the existing biofuels sustainability schemes address co-products and/or other biomass applications (Scarlat and Dallemand 2011).
Non-energy uses of biomass such as timber or pulp and paper constitute enormous markets that intersect with bioenergy markets in terms of feedstock competition and the certification of biomass and bioenergy supply. The world wood pulp market alone totalled close to 170 million tonnes in 2011 (Pulp & Paper International 2011), corresponding to US$148 billion (based on spot prices as of September 2011).17 By comparison, the global market for biofuels is approximately 105 billion litres, comprising 86 billion litres of ethanol and 19 billion litres of biodiesel (REN21 2011). This amounts to a spot market size of US$93.78 billion in September 2011, or 63% of the wood pulp market equivalent.18 With growing overlap between the sectors, different sustainability requirements may send confusing signals to market investors, buyers and regulators.
In addition to the EU-RED’s inclusion of a sustainability scheme for biofuels in transport and bioliquids used in other sectors (electricity, heating and cooling), Article 17(9) of the EU-RED calls on the EC to report on the requirements for a sustainability scheme for energy uses of biomass other than biofuels and bioliquids, particularly the possibility of sustainability standards for solid and gaseous fuels used in electricity, heating and cooling. The EC adopted a report in February 2010 with (voluntary) recommendations on solid and gaseous biomass sustainability (EC 2010c). Biomass produced within the EU falls with the legal framework for agriculture and forest management, thereby providing a degree of security with regard to the sustainable management of biomass in those areas (UNECE 2010).
The land use and GHG impacts of biomass used for heating and electricity have been estimated as rather low compared with liquid biofuels (Fritsche
17 Based on Pix Pulp Benchmark Index, as an average of spot prices for long-fibre pulp (softwood) and short-fibre pulp (softwood) as of 20 September 2011. See www.paperage.com/foex/pulp.html.18 Considering anhydrous ethanol and biodiesel (FAME) spot prices of September 2011. See: www.cepea.esalq.usp.br/english/ethanol/ and www.kingsman.com/.
et al. 2010). However, as the share of imported biomass increases, the uncertainty in such estimates will increase considerably. Trade already plays a major role in solid biomass supply for the EU (especially in pellets for heating) and thus the future feedstock base for market expansion may well be concentrated outside the EU. Although satisfactory environmental controls might exist in some countries, there is a risk of poorer oversight in other regions. This has led to the concern that increasing biomass imports from third countries (i.e. outside the EU) may lead to environmental degradation and unsustainable production of biomass. While the main biomass-importing countries in the EU had developed national sustainability requirements for bioenergy, the requirements were not harmonised across member states, thus creating regulatory confusion and calls for EU action (EC 2010c).
In analysing the issue, the EC encountered substantial difficulties in determining how much biomass is specifically used for energy purposes in Europe, as opposed to other possible uses. When assessing different feedstocks in terms of sustainability aspects of production, land use change, life-cycle GHG performances and conversion efficiencies, the EC did not recommend proposing binding sustainability criteria at the EU level. It did, however, promote guidelines to ensure greater consistency among national schemes regulating the matter, by emphasising methodologies compatible with Article 17 of the EU-RED. It also suggested that small-scale users of biomass (less than 1 MW thermal and/or 1 MW electrical capacity) should be exempt from proving compliance with national schemes. Finally, the EC recommended that member states keep track ofthe origin of biomass used in electricity, heating and cooling installations of 1 MW or more, in order to improve statistics for the sector (to be communicated to the EC) and to better evaluate the effects of biomass extraction in supplying areas, which are often outside the EU (EC 2010c). Further analysis will be undertaken, depending also on the outcome of a public consultation on the topic.19
19 See http://ec.europa.eu/energy/renewables/consultations/20110329_biomass_en.htm.
The EU-RED sustainability criteria are particularly aimed at preventing the conversion of areas of high carbon stock
and high biodiversity for the production of biofuels. In this chapter, the impact of biofuels expansion in the EU on land use and tropical forests is analysed by examining the definitions, implementation and relevant categories of land use. Direct land use change (dLUC) is addressed in Section 5.1. Sections 5.2 and 5.3 examine indirect land use change (iLUC), which is more complex to analyse. Sections 5.4 and 5.5 consider the uncertainties associated with evaluating land use change and the implications for tropical forests.
In 2011, the EC delayed a decision on explicitly addressing iLUC. Rather than introducing crop-specific iLUC factors, the EC is considering raising the overall threshold for GHG savings due to biofuels.20 Although some first-generation biofuels would be able to satisfy a more stringent standard (particularly sugarcane-based ethanol), other first-generation biofuels would be more constrained (EBB 2011). The issue of higher GHG thresholds is politically challenging because it could harm some domestic (EU) industries; however, it could also prompt a faster transition to second-generation technologies, which can more easily meet higher thresholds. The GHG standards will in any case be raised in 2017 to 50% for existing production and 60% for new production (EC 2009a, Art. 17(2)); therefore, those crops falling under these thresholds would have to be phased out fairly soon anyway.
20 See www.reuters.com/article/2011/09/08/us-eu-biofuels-idUSTRE7874NP20110908.
Consequently, the discussion here addresses land use impacts and forested areas more generally, rather than focusing on – or limiting the discussion to – GHG emissions.
5.1 Direct land use change and protection of forestsThe EU-RED and FQD do not allow the use of raw material obtained from land with high biodiversity value or high carbon stock. Both directives require that biofuels not be made from crops grown on high biodiversity land, defined as, among others (EC 2009a, Art. 17(3)):a. primary forest and other wooded land, namely
forest and other wooded land of native species, where there is no clearly visible indication of human activity and the ecological processes are not significantly disturbed;
b. areas designated:i. by law or by the relevant competent
authority for nature protection purposes; or
ii. for the protection of rare, threatened or endangered ecosystems or species (…)
Further, biofuels must not be made from biomass from areas with high carbon stock, defined as, among others (EC 2009a, Art. 17(4)):a. continuously forested areas, namely land
spanning more than one hectare with trees higher than five metres and a canopy cover of more than 30%, or trees able to reach those thresholds in situ;
Expected impacts on land use and forested areas
5
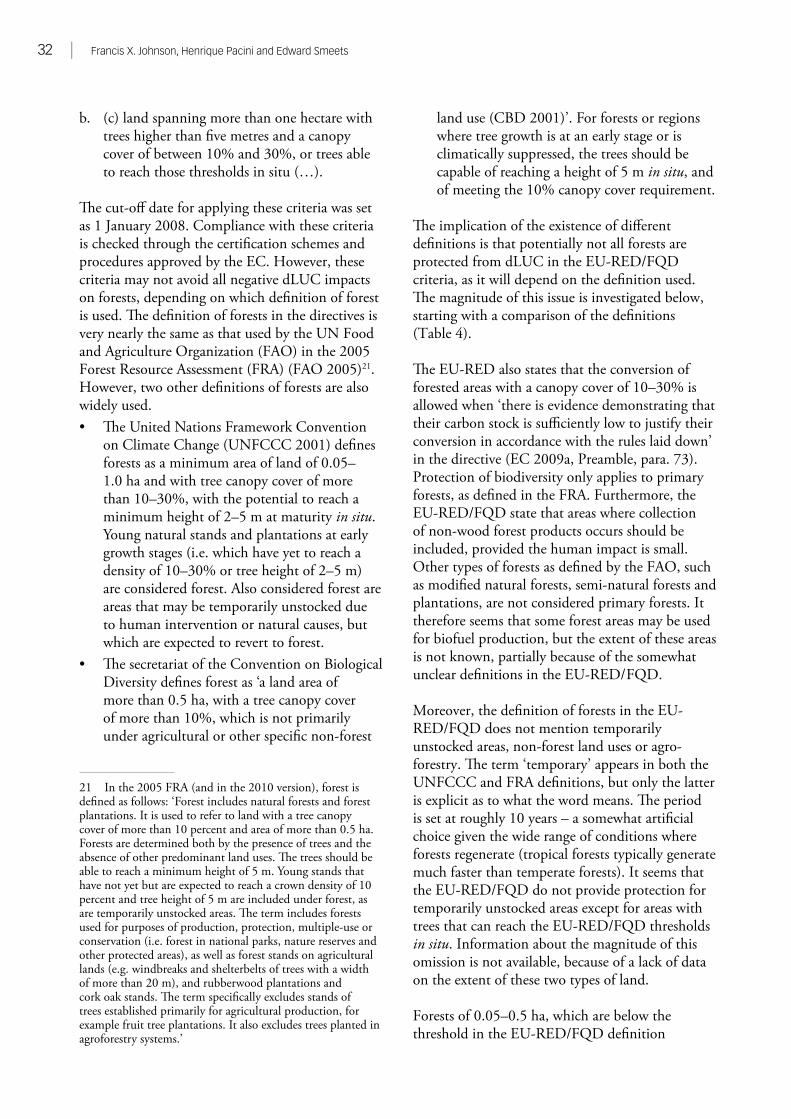
32 | Francis X. Johnson, Henrique Pacini and Edward Smeets
b. (c) land spanning more than one hectare with trees higher than five metres and a canopy cover of between 10% and 30%, or trees able to reach those thresholds in situ (…).
The cut-off date for applying these criteria was set as 1 January 2008. Compliance with these criteria is checked through the certification schemes and procedures approved by the EC. However, these criteria may not avoid all negative dLUC impacts on forests, depending on which definition of forest is used. The definition of forests in the directives is very nearly the same as that used by the UN Food and Agriculture Organization (FAO) in the 2005 Forest Resource Assessment (FRA) (FAO 2005)21. However, two other definitions of forests are also widely used.• The United Nations Framework Convention
on Climate Change (UNFCCC 2001) defines forests as a minimum area of land of 0.05–1.0 ha and with tree canopy cover of more than 10–30%, with the potential to reach a minimum height of 2–5 m at maturity in situ. Young natural stands and plantations at early growth stages (i.e. which have yet to reach a density of 10–30% or tree height of 2–5 m) are considered forest. Also considered forest are areas that may be temporarily unstocked due to human intervention or natural causes, but which are expected to revert to forest.
• The secretariat of the Convention on Biological Diversity defines forest as ‘a land area of more than 0.5 ha, with a tree canopy cover of more than 10%, which is not primarily under agricultural or other specific non-forest
21 In the 2005 FRA (and in the 2010 version), forest is defined as follows: ‘Forest includes natural forests and forest plantations. It is used to refer to land with a tree canopy cover of more than 10 percent and area of more than 0.5 ha. Forests are determined both by the presence of trees and the absence of other predominant land uses. The trees should be able to reach a minimum height of 5 m. Young stands that have not yet but are expected to reach a crown density of 10 percent and tree height of 5 m are included under forest, as are temporarily unstocked areas. The term includes forests used for purposes of production, protection, multiple-use or conservation (i.e. forest in national parks, nature reserves and other protected areas), as well as forest stands on agricultural lands (e.g. windbreaks and shelterbelts of trees with a width of more than 20 m), and rubberwood plantations and cork oak stands. The term specifically excludes stands of trees established primarily for agricultural production, for example fruit tree plantations. It also excludes trees planted in agroforestry systems.’
land use (CBD 2001)’. For forests or regions where tree growth is at an early stage or is climatically suppressed, the trees should be capable of reaching a height of 5 m in situ, and of meeting the 10% canopy cover requirement.
The implication of the existence of different definitions is that potentially not all forests are protected from dLUC in the EU-RED/FQD criteria, as it will depend on the definition used. The magnitude of this issue is investigated below, starting with a comparison of the definitions (Table 4).
The EU-RED also states that the conversion of forested areas with a canopy cover of 10–30% is allowed when ‘there is evidence demonstrating that their carbon stock is sufficiently low to justify their conversion in accordance with the rules laid down’ in the directive (EC 2009a, Preamble, para. 73). Protection of biodiversity only applies to primary forests, as defined in the FRA. Furthermore, the EU-RED/FQD state that areas where collection of non-wood forest products occurs should be included, provided the human impact is small. Other types of forests as defined by the FAO, such as modified natural forests, semi-natural forests and plantations, are not considered primary forests. It therefore seems that some forest areas may be used for biofuel production, but the extent of these areas is not known, partially because of the somewhat unclear definitions in the EU-RED/ FQD.
Moreover, the definition of forests in the EU-RED/FQD does not mention temporarily unstocked areas, non-forest land uses or agro-forestry. The term ‘temporary’ appears in both the UNFCCC and FRA definitions, but only the latter is explicit as to what the word means. The period is set at roughly 10 years – a somewhat artificial choice given the wide range of conditions where forests regenerate (tropical forests typically generate much faster than temperate forests). It seems that the EU-RED/FQD do not provide protection for temporarily unstocked areas except for areas with trees that can reach the EU-RED/FQD thresholds in situ. Information about the magnitude of this omission is not available, because of a lack of data on the extent of these two types of land.
Forests of 0.05–0.5 ha, which are below the threshold in the EU-RED/FQD definition

Transformations in EU biofuels markets under the Renewable Energy Directive and the implications for land use, trade and forests | 33
threshold, but above the UNFCCC threshold, and thus which are not protected, are potentially relevant. Also potentially important for biodiversity and carbon stock changes are other types of wooded land of less than 0.5 ha, with trees below a minimum height of 5 m in situ, or with a crown cover of less than 10%. Data on the extent of these areas are not available, except for areas defined in the FRA 2005 (FAO 2005) as:• ‘Other wooded land: Land not classified as
forest, spanning more than 0.5 hectares; with trees higher than 5 m and a canopy cover of 5–10 percent, or trees able to reach these thresholds in situ; or with a combined cover of shrubs, bushes and trees above 10 percent. It does not include land that is predominantly under agricultural or urban land use. (FAO 2005, p. 169)’
• Other land with tree cover: Land classified as other land, spanning more than 0.5 hectares with a canopy cover of more than 10 percent of trees able to reach a height of 5 m at maturity. [This category includes] groups of trees and scattered trees in agricultural landscapes, parks, gardens and around buildings, provided that the area, height and canopy cover criteria are met; includes tree plantations established mainly for other purposes than wood, such as fruit orchards. Other land is hereby defined as all land that is not classified as forest or other wooded land. Other land includes agricultural land, meadows and pastures, built-up areas, barren land, etc. (FAO 2005, pp. 169– 170)
Globally, the land area of ‘Forests’, ‘Other wooded land’ and ‘Other land with tree cover’ is 3952, 1375 and 75 Mha, respectively (FAO 2005). The category ‘Other land with tree cover’ is not very relevant here: the area is rather small and the biodiversity value and carbon stock are likely limited compared with forests. Furthermore, areas with scattered trees in agricultural landscapes are not well suited to the production of biomass for biofuels, let alone parks and gardens. More important are areas classified as ‘Other wooded land’, whose vegetation type is more similar to that of forests, but with a lower canopy cover. Important regions in this category are Oceania and Africa, with areas classified as forests and other wooded land of 206 and 430 Mha (Oceania) and 635 and 406 Mha (Africa), respectively. For Asia and South America, these figures are 283 and 29 Mha and 832 and 129 Mha, respectively.
Data are not available on the current and future use of areas classified as ‘Other wooded land’ and ‘Land with tree cover’ for the production of biofuels, except where such lands are implicitly included in studies dealing with the traditional use of biomass for energy in developing countries. In existing analyses, typically only the main land use categories are covered (cropland, pastures, grassland, forests). These data suggest that the EU-RED/FQD criteria do provide protection for forested areas, assuming adequate enforcement. A potential bottleneck is the availability of data, especially in developing countries; data on
Table 4. Parameters of the definitions of ‘forest’
Parameter UNFCCC CBD FRA EU-RED-FQD
Binary parameters(1=presence; 0= absence)
Young stands 1 1 1 1
Temporarily unstocked areas
1 0 1 0
Non-forest land uses 0 1 1 0
Agroforestry 0 ? 1 0
Thresholdparameters
Min. area (ha) 0.05–1.0 0.5 0.5 0.5
Min. height (m) 2–5 5 5 5
Crown cover (%) 10–30 10 10 10
Temporary (years) n/a n/a ~10 n/a
Strip width (m) n/a n/a 20 n/a
Source: Adjusted from FAO, IPCC, CIFOR, IUFRO, UNEP (2002), EC (2009a)

34 | Francis X. Johnson, Henrique Pacini and Edward Smeets
carbon storage, previous land use and historical biodiversity values are often scarce or notoriously uncertain. There may also be small areas classified as ‘Other wooded land’ that are not protected by the EU-RED/ FQD.
5.2 Approaches for estimating indirect land useIn this report, indirect land use change (iLUC) is defined as the indirect results of increased demand for biomass and land for energy crop production, which relates to economic/price interactions and the tensions arising from the combination of a fixed quantity of land and population growth (which creates a demand for more biomass for food, feed, fuel, fibre and other uses). iLUC includes the conversion of non-agricultural lands for food production (in another location) to compensate for conversion of agricultural land to biofuel feedstocks production. Changes in land use (e.g. expansion of croplands for biofuel production at the expense of forests) can have unintended impacts on biodiversity and carbon stock. iLUC assessments are typically made using economic models, although some less complicated approaches have also been adopted (for reviews of iLUC studies, see Chalmers et al. 2011; CE-Delft 2010; Prins et al. 2010; Witzke et al. 2008; Dehue et al. 2011; Hart Energy Consulting/CABI 2011; Gnansounou et al. 2008; Kline et al. 2011).
An overview of approaches used to quantify iLUC is shown in Table 5. Common approaches include computable general equilibrium (CGE) and/or partial equilibrium (PE) models. In such models, the principal pathways of market response to higher feedstock demand are higher prices and consequently reduced consumption, but also higher production through higher yields and ultimately an increase in the cultivated area. A fourth family of methodologies consists of studies in which historical data on land use are used in combination with trend extrapolation and expert judgement to estimate iLUC effects.
Partial equilibrium (PE) models are economic models that focus on a subset of economic sectors and do not link explicitly to other sectors of the economy. The limited scope allows a high level of detail of competition for inputs such as labour, water, energy and fertiliser. A major disadvantage
is that economy-wide competition is beyond the scope of most PE models. Further, export and import of agricultural products and inputs are usually modelled in a relatively simple manner.Computable general equilibrium (CGE) models include an entire economic system (national or global) by accounting for interactions between all productive sectors, labour, flow of goods and capital between sectors (or countries), and government policies. Most global and regional CGE frameworks are not structured to model land-use alternatives and the associated emissions sources. CGE modelling efforts are hindered by a lack of data, especially data on vegetation cover linked to underlying economic activity. CGE models also tend to describe market responses more slowly than they actually occur.In the causal descriptive approach, cause and effect relationships are estimated using a combination of extrapolation of historical trends and expert and stakeholder opinion to define and quantify correlations. This approach is sometimes also referred to as the deterministic approach, because the key global calculation parameters are ‘determined’. The models use fairly simple assumptions and calculate results in just a few steps. As a result, the causal descriptive approach is more transparent than the CGE and PE modelling approaches. The causal descriptive approach also allows inclusion of effects other than price-driven changes, such as natural conditions and faster-than-expected increases in consumption. A disadvantage is that uncertainties arise from the use of expert judgement and trend extrapolation.
CGE and PE models are currently the focus of the scientific and policy debate on iLUC, although major improvements are required to reduce the uncertainties, as discussed below.
5.3 Review of estimates of iLUC effectsIn 2010, the Joint Research Centre (JRC) of the EC carried out a detailed review of the impact of biofuels demand in the EU on land use (Edwards et al. 2010, JRC 2010). This is one of the few studies in which harmonised iLUC results are presented in terms of net increase of cropland per marginal unit of biofuel produced. Six of the best-known models worldwide are included: two CGE
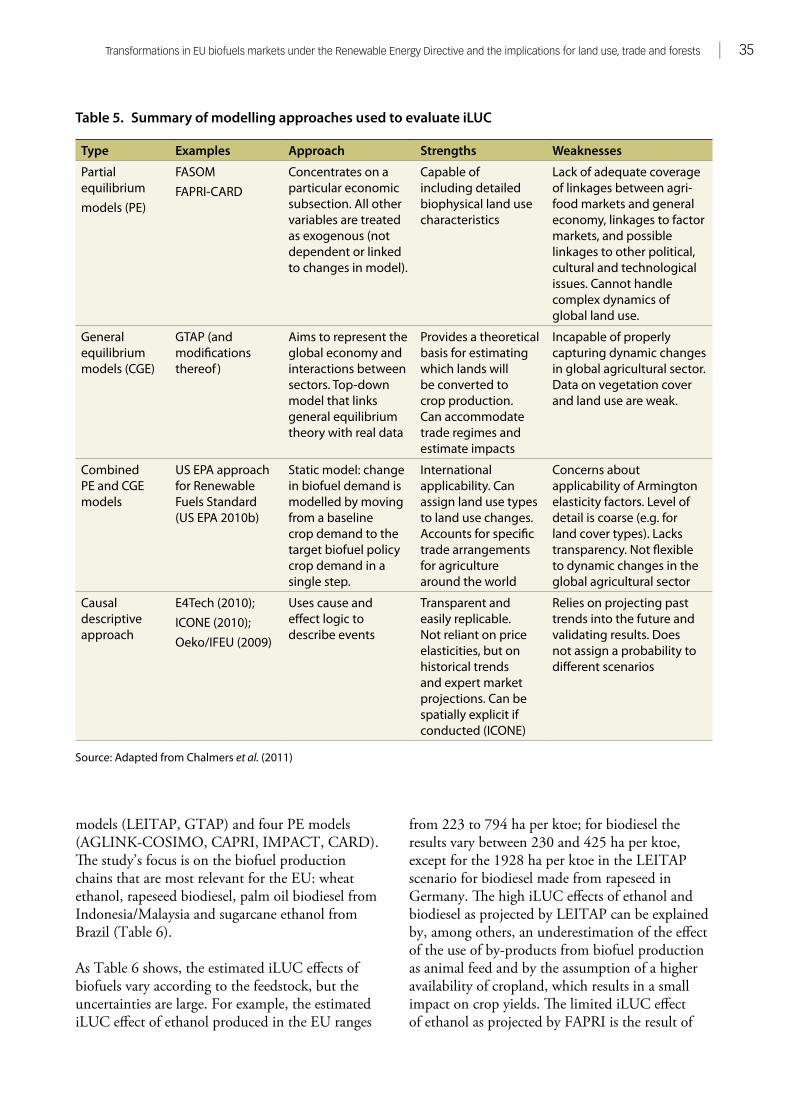
Transformations in EU biofuels markets under the Renewable Energy Directive and the implications for land use, trade and forests | 35
models (LEITAP, GTAP) and four PE models (AGLINK-COSIMO, CAPRI, IMPACT, CARD). The study’s focus is on the biofuel production chains that are most relevant for the EU: wheat ethanol, rapeseed biodiesel, palm oil biodiesel from Indonesia/Malaysia and sugarcane ethanol from Brazil (Table 6).
As Table 6 shows, the estimated iLUC effects of biofuels vary according to the feedstock, but the uncertainties are large. For example, the estimated iLUC effect of ethanol produced in the EU ranges
from 223 to 794 ha per ktoe; for biodiesel the results vary between 230 and 425 ha per ktoe, except for the 1928 ha per ktoe in the LEITAP scenario for biodiesel made from rapeseed in Germany. The high iLUC effects of ethanol and biodiesel as projected by LEITAP can be explained by, among others, an underestimation of the effect of the use of by-products from biofuel production as animal feed and by the assumption of a higher availability of cropland, which results in a small impact on crop yields. The limited iLUC effect of ethanol as projected by FAPRI is the result of
Table 5. Summary of modelling approaches used to evaluate iLUC
Type Examples Approach Strengths Weaknesses
Partial equilibriummodels (PE)
FASOMFAPRI-CARD
Concentrates on a particular economic subsection. All other variables are treated as exogenous (not dependent or linked to changes in model).
Capable of including detailed biophysical land use characteristics
Lack of adequate coverage of linkages between agri-food markets and general economy, linkages to factor markets, and possible linkages to other political, cultural and technological issues. Cannot handle complex dynamics of global land use.
General equilibrium models (CGE)
GTAP (and modifications thereof )
Aims to represent the global economy and interactions between sectors. Top-down model that links general equilibrium theory with real data
Provides a theoretical basis for estimating which lands will be converted to crop production. Can accommodate trade regimes and estimate impacts
Incapable of properly capturing dynamic changes in global agricultural sector. Data on vegetation cover and land use are weak.
Combined PE and CGE models
US EPA approach for Renewable Fuels Standard (US EPA 2010b)
Static model: change in biofuel demand is modelled by moving from a baseline crop demand to the target biofuel policy crop demand in a single step.
International applicability. Can assign land use types to land use changes. Accounts for specific trade arrangements for agriculture around the world
Concerns about applicability of Armington elasticity factors. Level of detail is coarse (e.g. for land cover types). Lacks transparency. Not flexible to dynamic changes in the global agricultural sector
Causal descriptive approach
E4Tech (2010);ICONE (2010);Oeko/IFEU (2009)
Uses cause and effect logic to describe events
Transparent and easily replicable. Not reliant on price elasticities, but on historical trends and expert market projections. Can be spatially explicit if conducted (ICONE)
Relies on projecting past trends into the future and validating results. Does not assign a probability to different scenarios
Source: Adapted from Chalmers et al. (2011)
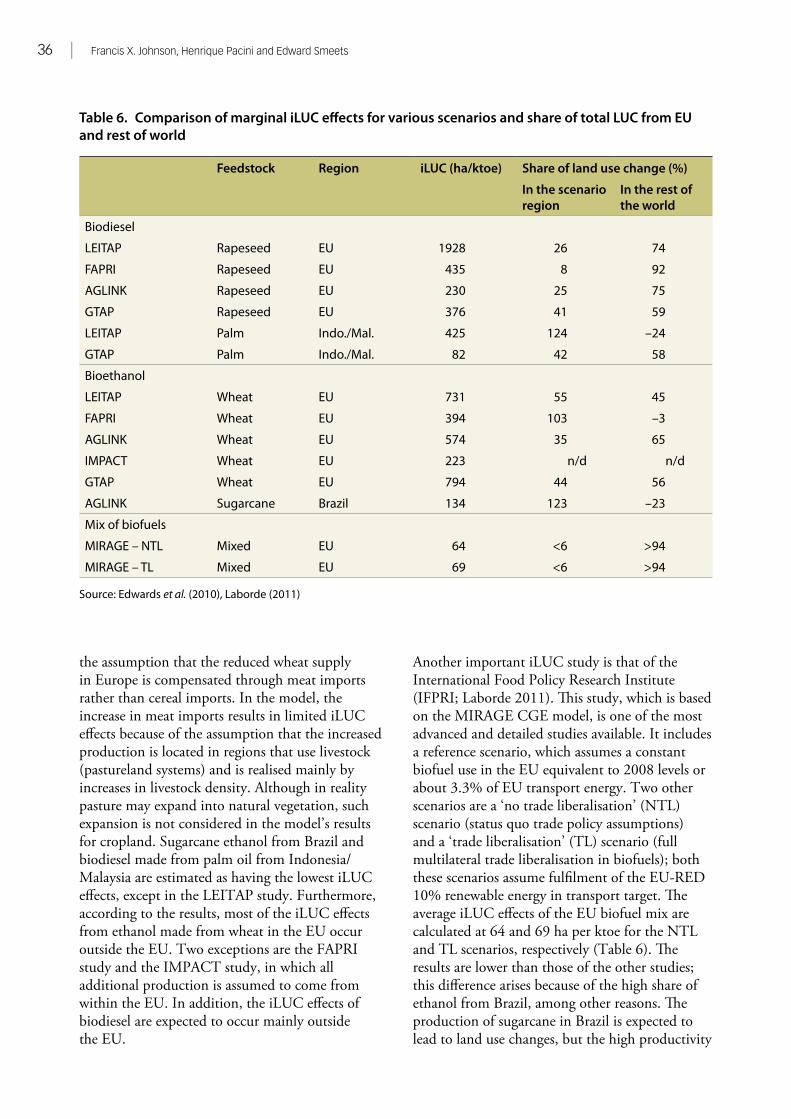
36 | Francis X. Johnson, Henrique Pacini and Edward Smeets
the assumption that the reduced wheat supply in Europe is compensated through meat imports rather than cereal imports. In the model, the increase in meat imports results in limited iLUC effects because of the assumption that the increased production is located in regions that use livestock (pastureland systems) and is realised mainly by increases in livestock density. Although in reality pasture may expand into natural vegetation, such expansion is not considered in the model’s results for cropland. Sugarcane ethanol from Brazil and biodiesel made from palm oil from Indonesia/Malaysia are estimated as having the lowest iLUC effects, except in the LEITAP study. Furthermore, according to the results, most of the iLUC effects from ethanol made from wheat in the EU occur outside the EU. Two exceptions are the FAPRI study and the IMPACT study, in which all additional production is assumed to come from within the EU. In addition, the iLUC effects of biodiesel are expected to occur mainly outside the EU.
Another important iLUC study is that of the International Food Policy Research Institute (IFPRI; Laborde 2011). This study, which is based on the MIRAGE CGE model, is one of the most advanced and detailed studies available. It includes a reference scenario, which assumes a constant biofuel use in the EU equivalent to 2008 levels or about 3.3% of EU transport energy. Two other scenarios are a ‘no trade liberalisation’ (NTL) scenario (status quo trade policy assumptions) and a ‘trade liberalisation’ (TL) scenario (full multilateral trade liberalisation in biofuels); both these scenarios assume fulfilment of the EU-RED 10% renewable energy in transport target. The average iLUC effects of the EU biofuel mix are calculated at 64 and 69 ha per ktoe for the NTL and TL scenarios, respectively (Table 6). The results are lower than those of the other studies; this difference arises because of the high share of ethanol from Brazil, among other reasons. The production of sugarcane in Brazil is expected to lead to land use changes, but the high productivity
Table 6. Comparison of marginal iLUC effects for various scenarios and share of total LUC from EU and rest of world
Feedstock Region iLUC (ha/ktoe) Share of land use change (%)
In the scenario region
In the rest of the world
Biodiesel
LEITAP Rapeseed EU 1928 26 74
FAPRI Rapeseed EU 435 8 92
AGLINK Rapeseed EU 230 25 75
GTAP Rapeseed EU 376 41 59
LEITAP Palm Indo./Mal. 425 124 –24
GTAP Palm Indo./Mal. 82 42 58
Bioethanol
LEITAP Wheat EU 731 55 45
FAPRI Wheat EU 394 103 –3
AGLINK Wheat EU 574 35 65
IMPACT Wheat EU 223 n/d n/d
GTAP Wheat EU 794 44 56
AGLINK Sugarcane Brazil 134 123 –23
Mix of biofuels
MIRAGE – NTL Mixed EU 64 <6 >94
MIRAGE – TL Mixed EU 69 <6 >94
Source: Edwards et al. (2010), Laborde (2011)
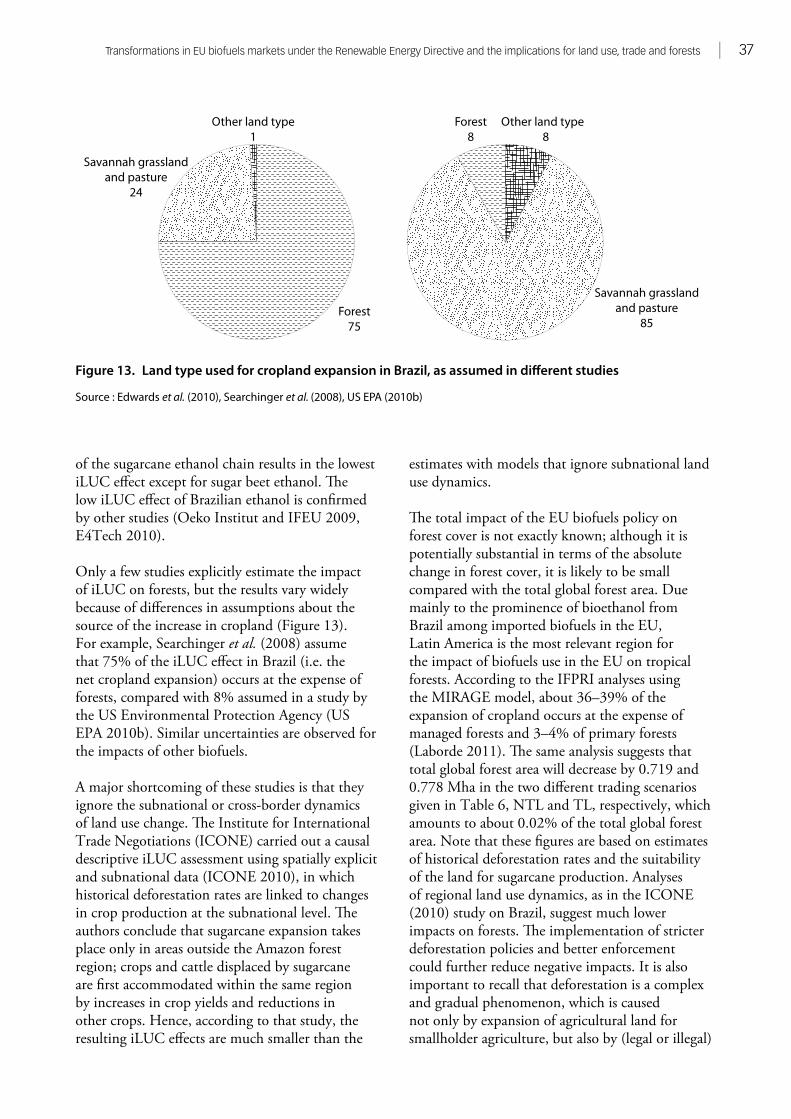
Transformations in EU biofuels markets under the Renewable Energy Directive and the implications for land use, trade and forests | 37
of the sugarcane ethanol chain results in the lowest iLUC effect except for sugar beet ethanol. The low iLUC effect of Brazilian ethanol is confirmed by other studies (Oeko Institut and IFEU 2009, E4Tech 2010).
Only a few studies explicitly estimate the impact of iLUC on forests, but the results vary widely because of differences in assumptions about the source of the increase in cropland (Figure 13). For example, Searchinger et al. (2008) assume that 75% of the iLUC effect in Brazil (i.e. the net cropland expansion) occurs at the expense of forests, compared with 8% assumed in a study by the US Environmental Protection Agency (US EPA 2010b). Similar uncertainties are observed for the impacts of other biofuels.
A major shortcoming of these studies is that they ignore the subnational or cross-border dynamics of land use change. The Institute for International Trade Negotiations (ICONE) carried out a causal descriptive iLUC assessment using spatially explicit and subnational data (ICONE 2010), in which historical deforestation rates are linked to changes in crop production at the subnational level. The authors conclude that sugarcane expansion takes place only in areas outside the Amazon forest region; crops and cattle displaced by sugarcane are first accommodated within the same region by increases in crop yields and reductions in other crops. Hence, according to that study, the resulting iLUC effects are much smaller than the
estimates with models that ignore subnational land use dynamics.
The total impact of the EU biofuels policy on forest cover is not exactly known; although it is potentially substantial in terms of the absolute change in forest cover, it is likely to be small compared with the total global forest area. Due mainly to the prominence of bioethanol from Brazil among imported biofuels in the EU, Latin America is the most relevant region for the impact of biofuels use in the EU on tropical forests. According to the IFPRI analyses using the MIRAGE model, about 36–39% of the expansion of cropland occurs at the expense of managed forests and 3–4% of primary forests (Laborde 2011). The same analysis suggests that total global forest area will decrease by 0.719 and 0.778 Mha in the two different trading scenarios given in Table 6, NTL and TL, respectively, which amounts to about 0.02% of the total global forest area. Note that these figures are based on estimates of historical deforestation rates and the suitability of the land for sugarcane production. Analyses of regional land use dynamics, as in the ICONE (2010) study on Brazil, suggest much lower impacts on forests. The implementation of stricter deforestation policies and better enforcement could further reduce negative impacts. It is also important to recall that deforestation is a complex and gradual phenomenon, which is caused not only by expansion of agricultural land for smallholder agriculture, but also by (legal or illegal)
Figure 13. Land type used for cropland expansion in Brazil, as assumed in different studies
Source : Edwards et al. (2010), Searchinger et al. (2008), US EPA (2010b)
Other land type8
Savannah grasslandand pasture
85
Savannah grasslandand pasture
24
Forest75
Forest8
Other land type1
38 | Francis X. Johnson, Henrique Pacini and Edward Smeets
logging for production of timber and the pulp and paper industry.
5.4 Discussion of uncertaintiesThe review above shows that assessing the exact magnitude of iLUC impacts on tropical forests is problematic because of the many uncertainties inherent in such analyses. Consequently, the results vary widely because of different values for the following key modelling assumptions (adapted from Cornelissen et al. 2009, Edwards et al. 2010 and Marelli et al. 2011):• The choice of the feedstock for the additional
biofuel demand and the location of the increase in demand: In particular, assumptions about biofuel imports can potentially have a large impact on iLUC (see Table 6) and tropical forests, as discussed in the previous sections and Chapter 6. In addition, the impact of the emergence of competitive production technologies for second-generation biofuels can have a major impact, as discussed further in Chapter 6.
• The area, type and level of detail in land use transitions: National-level analyses (which are typical of economic models) may insufficiently capture subnational land use dynamics, as the example of Brazil in the previous section shows.
• The relationship between commodity demand, commodity prices and food demand: Economic relationships are based on historical data, the validity of which is in doubt (Kim and Dale 2011). Current high commodity prices are expected to continue in the future and may exceed the statistical range of previously estimated relationships. In addition, the assumptions related to shifting production from countries with high yields to relatively less developed countries with lower yields are crucial.
• The relationship between agricultural intensification and commodity prices: This is a crucial but poorly investigated aspect. Especially relevant are marginal yield effects (i.e. the yields on new cropland to yields on existing cropland), the effect of price on yields and double cropping, and the rate of yield increase vs. area increase.
• Adoption of existing technology and likelihood for future technological change, especially for second-generation biofuels.
Furthermore, most of the CGE and PE models discussed above do not capture several issues that, if taken into account, could increase or decrease the estimated iLUC effects. An example is the regional (within a country) dynamics of land use change, which, in the case of a large country such as Brazil or Indonesia, can be quite important. Moreover, in CGE and PE models, land use change is essentially reduced to a least-cost optimisation problem, whereas in reality several non-economic factors influence what land use changes take place and where. Some of these drivers are related to political choices (land use and agricultural policy, land rights, etc.) or institutional features (proximity to infrastructure and markets, land use legislation). Nevertheless, it can be argued that the types of economic models reviewed in this chapter offer the best available methodologies for estimating iLUC.
5.5 Key implications for forest protectionAlthough the EU-RED/FQD may provide a good regulatory framework for protection of tropical forest areas from the direct use of biomass from these areas, data availability and enforcement of regulations are another matter. Also important for the direct impacts of biofuel production on biodiversity and carbon stocks is the biomass production system, viz. the cultivation practice, the selection of species, the rotation scheme, the use of low-erosion cultivation methods (e.g. no-till systems) and minimal agrochemical application. Bioenergy plantations can also be included in specific landscape elements, such as corridors, stepping stones and buffer zones. Corridors and stepping stones are pieces of land that assist species in moving between areas of their natural habitat. Buffer zones can help to reduce the impact or risk of soil erosion, flooding and pollution. However, because of the definition of forests used, the EU-RED/FQD might not provide full protection against loss of biodiversity and carbon stock in tropical forests (depending on the definition) or for all tropical areas with some tree cover. The inclusion in the EU directives of broader
Transformations in EU biofuels markets under the Renewable Energy Directive and the implications for land use, trade and forests | 39
definitions of forests and types of land would further avoid the risk of negative impacts on biodiversity and carbon stock changes, if a highly precautionary approach was desirable. A broader scope should include temporarily unstocked areas, non-forest land uses and agroforestry, as well as areas classified as other types of wooded land of less than 0.5 ha, or with trees below a minimum height of 5 m in situ, or with a crown cover of less than 10%. The discussion on definitions has also emerged in relation to other policies within the Kyoto Protocol and especially in the CDM (FAO 2009, Sasaki and Putz 2009).
Especially important for the scope of this report is the overall issue of iLUC. The results presented in the previous sections show that the considerable uncertainties are related to quantifying iLUC effects and that this situation will probably continue. However, at least some differences in results seem to be related to the inability of an approach or model to simulate certain results, rather than to conflicts in the direction or magnitude of impacts. Some general conclusions regarding the impacts of the EU biofuels target are as follows:• World market commodity prices will increase,
in response to increased EU demand for imported biofuels, which will increase the yields of both food and biofuel crops, but the resulting increase in yields will not – by itself – fully mitigate the effects of iLUC.
• Increased use of by-products from biofuel production as animal feed will reduce the iLUC effects of biofuels, but will not offset the iLUC effects completely.
• The increased demand for biofuels in the EU will mainly be met by first-generation biofuels made from food crops.
• The estimated iLUC effects from increased biofuels use in the EU vary, depending on the type of biofuel and crop concerned, but will mainly occur outside the EU. Especially important are imports of bioethanol from sugarcane, which may affect tropical forests in Brazil, and the use of biodiesel from Malaysia/Indonesia, although the magnitude of the impacts is highly uncertain.
• When changes in carbon stock due to iLUC are taken into account, some biofuels can potentially emit more GHG gases than
fossil fuels, although the net GHG emission reduction of the EU biofuel mix is still expected to be positive (Laborde 2011). Ethanol from sugar beet and sugarcane are the biofuels with the most robust GHG emission reductions (i.e. the reductions are positive or in some cases highly positive under a wide range of economic/physical conditions).
Because of the potential impact of iLUC on biodiversity and the GHG balance of biofuels, iLUC is now a key target for policymakers dealing with biofuels. Di Lucia et al. (2012) evaluated various policy approaches to addressing iLUC. The results show that a preventative approach appears to be the most practical choice in terms of effectiveness and stakeholders acceptability, although this also involves a risk of treating scientific uncertainty as certainty (the uncertainty paradox). The following measures can be undertaken to minimise iLUC effects:• The use of marginal, severely degraded or
abandoned land that is not used for food production: However, a potential weakness with the use of marginal land is that crop yields are lower and costs are higher. Perennial crop production systems that are less capital intensive might therefore be more attractive in marginal lands, as second-generation biofuel conversion platforms become more cost-competitive. Where degraded or marginal lands are used, only direct land use-related impacts and GHG emissions would need to be assessed.
• The integration of food and bioenergy production to increase the total biomass production and reduce the pressure on land resources: Examples are agroforestry systems, intercropping and rotational woodlots.
• The intensification of crop and livestock production systems: The efficiency of agricultural systems is well below what is technically feasible, especially in developing countries, but also in some industrialised regions (Smeets et al. 2007). Targeted investments can reduce pressure on land and natural vegetation and even reduce agricultural land requirements for food production.
• The use of wastes and residues: Article 21(2) of the EU-RED specifically encourages the use of biofuels made from wastes and residues,
40 | Francis X. Johnson, Henrique Pacini and Edward Smeets
by double-counting them in the calculation of the contribution towards the renewable energy target.
• The implementation of ‘framework conditions’ that help mitigate the risks of introducing iLUC due to biofuels developments: Measures for achieving this include the implementation of robust land use management practices, equitable and locally appropriate land tenure regimes, regional planning and landscape management systems, effective governance and intensification of agricultural production systems, although potentially not all indirect effects are avoided by these measures. The studies on LUC discussed above typically include historical developments and assume a continuation of current trends. The implementation of integrated land use and vegetation cover policies might reduce negative iLUC effects.
The EC decision to delay rules on including indirect climate impacts provides some time to reach better consensus on iLUC approaches and to allow operators time to adjust to changing conditions (Reuters 2011). This decision is a political compromise designed to protect the interests of the EU biofuels industry, but should also serve to discourage new investments in biofuels with a poor GHG emissions profile. Other policy alternatives might be included in a later phase, such as increasing the minimum GHG savings threshold for biofuels, introducing additional sustainability criteria or attributing an average quantity of GHG emissions to biofuels to reflect the average estimated iLUC impacts. Each of these alternatives obviously has advantages and disadvantages, but a preventative approach is probably the most practical choice in terms of effectiveness and stakeholder acceptability (Di Lucia et al. 2012).
I n this chapter, we consider in more detail the impacts associated with imports of biofuels to the EU based on the National
Renewable Energy Action Plans (NREAPs). Section 6.1 provides an overview of expected biofuels consumption and imports according to the NREAPs. In Section 6.2, the projections of biofuel production and imports as included in the NREAPs are compared with the assumptions and results of studies on the effects of dLUC and iLUC due to the EU biofuels policy. The focus is therefore on the structure of imports, the ratio of bioethanol to biodiesel in production and imports, and the type of feedstock. In Section 6.3, the potential land use effects to the year 2030 are discussed, with special attention given to the impact of second-generation biofuels, and the uncertainties related to these analyses are examined in Section 6.4. Section 6.5 offers some conclusions about the land use impacts of biofuel imports in the EU, with particular regard to the risks to forests.
6.1 Biofuel imports according to the NREAPsThe EU-RED (EC 2009a) includes targets for the share of biofuels in the gross final energy consumption for transport. Under Article 4, each member state of the EU27 is requested to provide an NREAP detailing its strategy to meet its 2020 target, including the technology mix and the trajectory to reach it. The projected use of transport fuels in the EU27 to 2020 and the contribution of various biofuels are shown in Table 7.
Most member states have specified the total final energy demand for transport in 2020 for two scenarios, a reference and an additional energy efficiency scenario, with the overall totals calculated as 35 and 31 Mtoe, respectively. The use of renewable electricity and hydrogen is expected to be very minor (less than 1%).
Biofuels are expected to account for 8.4–9.3% of the total supply in 2020, with renewable electricity and other sources making up the remainder of the 10% target. Most of the increase in the use of biofuels up to 2020 will come from conventional first-generation biofuels made from wheat, corn and sugarcane, etc. The contribution of second-generation biofuels is not reported separately in the NREAPs, but is included in ‘other biofuels’; the contribution of this category is marginal. Biodiesel and bioethanol account for about 73% and 24% of biofuels consumption, respectively. Article 21(2) of the EU-RED explicitly encourages the contribution of biofuels produced from wastes, residues, non-food cellulosic material and lignocellulosic material by double-counting them in meeting the renewable energy target. Biofuels under Article 21(2) (wastes and residues) account for 10% of the total projected biodiesel and bioethanol use in 2020.
6.2 Biofuel imports to 2020 and balances across feedstock optionsAccording to the NREAPs and associated analyses, it is expected that somewhere between 25% and 37% of biofuels used in the EU will
Alternative scenarios for imported biofuels in the EU
6
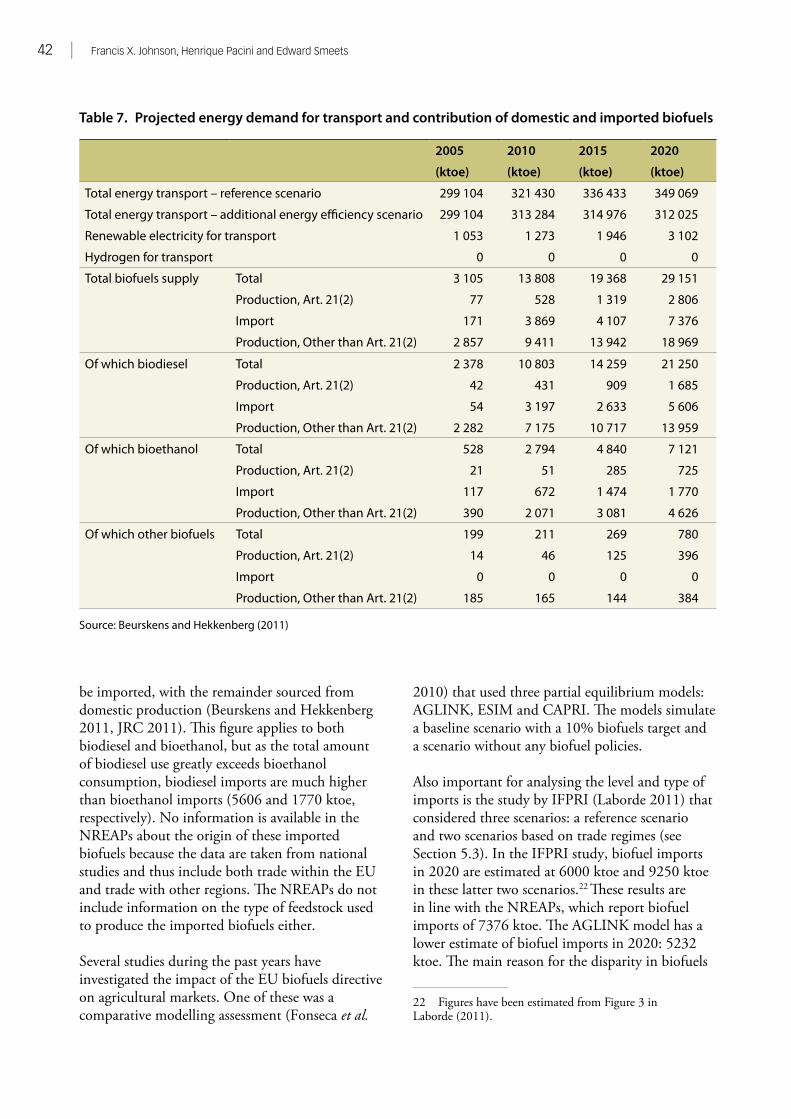
42 | Francis X. Johnson, Henrique Pacini and Edward Smeets
be imported, with the remainder sourced from domestic production (Beurskens and Hekkenberg 2011, JRC 2011). This figure applies to both biodiesel and bioethanol, but as the total amount of biodiesel use greatly exceeds bioethanol consumption, biodiesel imports are much higher than bioethanol imports (5606 and 1770 ktoe, respectively). No information is available in the NREAPs about the origin of these imported biofuels because the data are taken from national studies and thus include both trade within the EU and trade with other regions. The NREAPs do not include information on the type of feedstock used to produce the imported biofuels either.
Several studies during the past years have investigated the impact of the EU biofuels directive on agricultural markets. One of these was a comparative modelling assessment (Fonseca et al.
2010) that used three partial equilibrium models: AGLINK, ESIM and CAPRI. The models simulate a baseline scenario with a 10% biofuels target and a scenario without any biofuel policies.
Also important for analysing the level and type of imports is the study by IFPRI (Laborde 2011) that considered three scenarios: a reference scenario and two scenarios based on trade regimes (see Section 5.3). In the IFPRI study, biofuel imports in 2020 are estimated at 6000 ktoe and 9250 ktoe in these latter two scenarios.22 These results are in line with the NREAPs, which report biofuel imports of 7376 ktoe. The AGLINK model has a lower estimate of biofuel imports in 2020: 5232 ktoe. The main reason for the disparity in biofuels
22 Figures have been estimated from Figure 3 in Laborde (2011).
Table 7. Projected energy demand for transport and contribution of domestic and imported biofuels
2005 2010 2015 2020
(ktoe) (ktoe) (ktoe) (ktoe)
Total energy transport – reference scenario 299 104 321 430 336 433 349 069
Total energy transport – additional energy efficiency scenario 299 104 313 284 314 976 312 025
Renewable electricity for transport 1 053 1 273 1 946 3 102
Hydrogen for transport 0 0 0 0
Total biofuels supply Total 3 105 13 808 19 368 29 151
Production, Art. 21(2) 77 528 1 319 2 806
Import 171 3 869 4 107 7 376
Production, Other than Art. 21(2) 2 857 9 411 13 942 18 969
Of which biodiesel Total 2 378 10 803 14 259 21 250
Production, Art. 21(2) 42 431 909 1 685
Import 54 3 197 2 633 5 606
Production, Other than Art. 21(2) 2 282 7 175 10 717 13 959
Of which bioethanol Total 528 2 794 4 840 7 121
Production, Art. 21(2) 21 51 285 725
Import 117 672 1 474 1 770
Production, Other than Art. 21(2) 390 2 071 3 081 4 626
Of which other biofuels Total 199 211 269 780
Production, Art. 21(2) 14 46 125 396
Import 0 0 0 0
Production, Other than Art. 21(2) 185 165 144 384
Source: Beurskens and Hekkenberg (2011)
Transformations in EU biofuels markets under the Renewable Energy Directive and the implications for land use, trade and forests | 43
imports is that the AGLINK model forecasts a rapid increase in imports of the feedstocks (raw materials) that can be used to produce biofuels (wheat, coarse grains, oilseeds and especially vegetable oils). This assumption results in high(er) levels of biofuel production in the EU and low(er) imports of biodiesel and bioethanol. This effect is even more pronounced in the ENSIM analysis, which indicates that the EU27 will become a net biofuel exporter. In both the AGLINK and ENSIM models, imports of biofuel feedstock are projected to increase rapidly.
The studies differ with respect to their consideration of the contribution of first-generation biofuels towards the 10% renewable energy in transport target. According to the NREAPs, biofuels will contribute 89% of this target, i.e. about 9% of all renewable energy in transport (including biofuels under Art. 21(2); recall Table 7). In the model comparison analyses (Fonseca et al. 2010), first-generation biofuels are assumed to meet 70% of the 10% biofuel target, but the net trade of biofuels is not necessarily higher compared to cases when higher shares are estimated for first-generation biofuels, because of other factors. Especially important for the trade of biofuels is the relative contribution of bioethanol and biodiesel towards the biofuel target. The AGLINK study assumes a 45:55 ratio between biodiesel and bioethanol consumption, which is derived from the vehicle fleet composition. In the NREAPs, the ratio of biodiesel to bioethanol use in 2020 is 3:1, which is also reflected in the current EU biofuel market and trade patterns (recall Section 2.1). The ratio assumed in the IFPRI study is 5:1 for 2008 and 2.5–3:1 in 2020. However, the volume of biodiesel imports in 2020 in the IFPRI study is about half the volume projected in the NREAPs: 2600 in both the NTL and TL scenarios vs. 5606 ktoe in the NREAPs. However, ethanol imports are higher in the IFPRI projections: around 3500–6750 ktoe vs. 4626 ktoe in the NREAPs. According to the AGLINK study, imports of bioethanol and biodiesel in 2020 will increase to 1928 and 3305 ktoe, respectively, but it projects imports of feedstocks for biofuel production to be much higher than the other studies. The AGLINK study also shows that, in the absence of the 45:55 biodiesel:bioethanol ratio, biofuel use would shift from biodiesel to bioethanol. This trend also emerges in the
NREAPs and the IFPRI study. Ethanol demand increases by almost half, with the shortfall met by a higher level of production and imports of feedstock and bioethanol. However, to achieve this share, either the maximum permissible volume of ethanol in low-ethanol blends would have to exceed 10% throughout the EU or a large flex-fuel car fleet would be needed.
A crucial factor for the iLUC effects on forests is the origin of the imports – and in this respect, the results of the various studies are largely similar. The IFPRI report makes projections about the imports of biofuel per region. The high ethanol demand projected in the IFPRI analysis is met almost completely by sugarcane ethanol from Brazil, whereas Malaysia and Indonesia are projected to remain important suppliers of biodiesel. Both sugarcane ethanol and palm oil biodiesel have relatively a low average iLUC per unit of biofuels because of the high yields, but they may have an overall more negative impact on forests because expansion of biofuel production in these regions may occur, in part, at the expense of forest cover. However, the exact iLUC effects of imports cannot be known because of substantial differences in underlying estimates in the various studies. In particular, assumptions about the role of forests in expansion of agricultural land vary widely between models and may not take into account national and local drivers and limitation of land use change. A clear example is the expansion of sugarcane, which is taking place at the expense of Brazilian cerrado rather than forests, whereas several models use national average land expansion coefficients (ranging from 8% to 75% forest; see Chapter 5).
The results also show that the contribution of the various agricultural feedstocks to biofuel production as of 2008 does not change in the scenarios, because the impact of trade liberalisation on the biodiesel sector is weak. Rapeseed accounts for more than half of the supply for biodiesel according to the IFPRI study (using MIRAGE model, as listed in Table 6), and this share could only change rather slowly. The options for expanding and diversifying domestic EU feedstocks for bioethanol are greater than is the case for biodiesel, thus resulting in more significant potential changes compared with the reference case. The NTL and TL scenarios in the IFPRI study (recall Section 5.3) both project
44 | Francis X. Johnson, Henrique Pacini and Edward Smeets
that bioethanol will be produced mainly from sugarcane (varying from 46% to 89% of the bioethanol feedstock supply). However, other studies forecast much smaller imports of Brazilian bioethanol; the FAO and OECD 2009–2018 Outlook study (OECD–FAO 2009) and the EC 2008–2015 Outlook (2009c), for example, both project imports of about 1500 to 2500 ktoe per year. Another important aspect is the overall global supply in bioethanol available for trade after domestic requirements are met; Brazil has shown a rapid increase in sales of flex-fuel cars, a trend that will lead to increased domestic demand if oil prices remain at their recent high levels (recall Section 2.4).
6.3 Second-generation biofuels and outlook for importsA potentially important factor is the development of cost-effective technologies for the production of second-generation biofuels. Second-generation biofuels are those made from lignocellulosic biomass. A major advantage is that residues such as corn stover can be used as feedstock, as can whole crop maize or crops that are not used for food purposes, such as switchgrass. Other advantages are the availability of low-cost residues, the higher yield of woody or grassy energy crops and the lower GHG emissions compared with biofuels made from sugar, starch or oil crops.
Based on the NREAPs and on IEA projections, it can be concluded that second-generation biofuels are not likely to play a major role before 2020 (IEA 2011). Some of the studies discussed above, however, do assume a greater contribution from second-generation biofuels, thus potentially underestimating the iLUC effects. In particular, the AGLINK model assumes a rather optimistic scenario for second-generation biofuels, under which second-generation biofuels enter the market in 2016; this reduces the use of first-generation biofuels to 70%.
None of the studies reviewed above or in Chapter 5 includes projections of biofuel imports into the EU beyond 2020. What will happen beyond 2020 depends on the development of second-generation technology, as well as on the EU biofuels policy at that time. The continuation of biofuel-supporting policies will most likely result
in similar trade patterns to those projected by the studies reviewed above. In particular, ethanol from sugarcane in Brazil is likely to continue to be the most cost-effective biofuel, potentially supplemented with supply from African LDCs. However, less ambitious policies and decreases in financial support will likely reduce the demand for other first-generation biofuels. The production of second-generation biofuels might become economically attractive (without subsidies) beyond 2020, but only if R&D efforts are increased and depending on the price of fossil oil (IEA 2011).
By 2030, about one-quarter of the total global biofuel production is expected to come from second-generation biofuels (IEA 2011). This suggests that, after 2020, most of the increase in biofuel production will be based on second-generation production technologies. Global analyses suggest that the supply of lignocellulosic feedstock is not a limiting factor, but that trade patterns will be different from those of first-generation biofuels (IEA 2011). Regions that are currently not involved in the production of biofuels have great potential in this regard. In particular, Africa, East Europe/Russia, Latin America (beyond Brazil and Argentina) and parts of Asia could potentially be large-scale, low-cost producers of biofuels or untreated lignocellulosic biomass, using only biomass produced on abandoned agricultural land and low productivity land (Hoogwijk et al. 2009). Degraded areas have potential for biomass production using perennial cropping systems (Nijsen et al. 2011, Wicke et al. 2011b), especially because of the associated increase in carbon stocks and favourable impacts on soil quality and biodiversity.
6.4 iLUC effects of biofuel imports beyond 2020Trends in biofuels imports to the EU beyond 2020 and the related impacts in terms of iLUC and forest cover change are uncertain for a number of reasons. These include the uncertain impact of the EU biofuels policy, the development of second-generation biofuel technologies and the use of hybrid and electric vehicles. The IEA predicts a dramatic shift in car sales, with hybrids, plug-in hybrids and electric vehicles representing almost 60% of sales in 2030, compared with around 1% today (IEA 2011). However, several factors can be
Transformations in EU biofuels markets under the Renewable Energy Directive and the implications for land use, trade and forests | 45
considered in speculating about the iLUC effects of biofuel imports into EU after 2020.
First, if second-generation biofuel production technologies are not implemented and the current EU biofuels policies continue (reliance on first-generation biofuels), then the effects of iLUC will probably increase rapidly. The reason is that further expansion of cropland will occur in less climatically favourable regions and/or degraded lands, which will have lower than average yields (Al-Riffai et al. 2010, Laborde 2011).
Second, the biofuel type, feedstock and region are crucial, as some combinations have greater iLUC-related risks than others. Especially important at this moment are the production of bioethanol from sugarcane in Brazil and of palm oil biodiesel in Indonesia and Malaysia. However, it is not possible to draw firm conclusions about which biofuel and feedstock is preferable in terms of iLUC effects on tropical forests. Sugarcane ethanol from Brazil and palm oil biodiesel from Indonesia/Malaysia have on average the lowest iLUC effects mainly because of their high yields, but in these regions, the agricultural frontier is moving into natural forests, and thus the linkages can be direct or indirect.
Finally, the impact of the production and use of second-generation biofuels in the EU in terms of iLUC effects will largely depend on the choice of feedstock. As a rule of thumb, second-generation biofuels are projected to require 30–40% less land than first-generation biofuels when dedicated woody or grassy energy crops are used (Al-Riffai et al. 2010). Assuming that one-quarter of the biofuels consumed in the world in 2030 are second-generation biofuels, then the LUC effects would be 10% lower compared with a scenario with full reliance on first-generation biofuels. Higher reductions are feasible if lignocellulosic wastes and residues are used to produce second-generation biofuels.
6.5 Discussion of uncertaintiesVarious studies have analysed the LUC impact of the EU biofuels directives, but the results are insufficiently accurate and robust to draw firm conclusions about the iLUC effects of biofuel imports into the EU. Crucial uncertainties are the
ratio of biodiesel to bioethanol, the contribution of electricity and second-generation biofuels, and future trade policies/trade liberalisation. Another important obstacle when evaluating the iLUC effects of biofuels trade is that the trade in feedstock for the production of biofuels should be included, but the data typically do not distinguish between usage as food or as biofuel feedstock. Furthermore, the economic models used to evaluate iLUC effects give widely ranging results (see Chapter 5).
It should be noted that most of the studies discussed use somewhat crude assumptions about the trade of biofuels and the relative contributions of bioethanol and biodiesel. The approaches ignore existing trade barriers, such as the lack of a global classification system for biofuels, tariffs, protectionist trade policies, technical standards and the effects of sustainability criteria/certification systems for biofuels. Tariffs and trade policies can have a major impact in shifting trade patterns (recall the biodiesel example discussed in Section 2.2.2).
Another important phenomenon and potential obstacle for trade is the coupling of biofuel-promoting policies to sustainability criteria. Criteria have been developed (or are under consideration) for either feedstocks (such as palm oil) or final products. There is a risk that the criteria, especially in relation to environmental and social issues, could be too stringent or inappropriate to local environmental and technological conditions in developing countries (Johnson 2011). Many developing nations therefore view attempts to introduce sustainability criteria as a form of ‘green imperialism’. Another issue is the possible proliferation of technical standards, environmental and social sustainability schemes and certification systems for biofuel production. A multitude of different and partially incompatible systems have already emerged (Van Dam et al. 2010), although it can be expected that voluntary schemes that are not linked to EC or national biofuel-supporting policies will gradually disappear. Apart from legal and technical barriers, it is unlikely that the land exclusion criteria will substantially affect the availability and costs of EU domestic biomass and biomass imports as currently assumed (COWI Consortium 2008).
46 | Francis X. Johnson, Henrique Pacini and Edward Smeets
The NREAPS and other analyses indicate that imports will supply up to one-third of the biofuels used in the EU until 2020. Biodiesel (or oilseeds and vegetable oils) will probably account for the bulk of the imports. At the same time, ethanol made from sugarcane in Brazil is the most cost-effective option, and is highly competitive at current oil prices. Most CGE and PE economic models therefore predict that ethanol imports will increase in the case of free trade and cost-optimisation of biofuels supply. Biodiesel trade becomes important under the assumption of a 45:55 ratio between biodiesel and bioethanol consumption (as a function of vehicle fleet composition). In that case, Malaysia and Indonesia are important low-cost producers. In general, it seems that iLUC effects are especially important in these regions (e.g. Brazil, Malaysia and Indonesia), where the agricultural frontier is moving into natural forests. However, the exact iLUC effects on
tropical forests are difficult to determine because of the inherent uncertainties in the assumed share of forests among the various land types that are undergoing changes in use.
No data are available for 2020–2030, but many of the main drivers and factors related to first-generation biofuels will probably persist if current policies continue. However, the uncertainties are large, not only because of the potential impact of changes in trade policies, but also because of the potential contribution of second-generation biofuels. If first-generation biofuels continue to be used, then the iLUC effects will probably increase rapidly, because of the increasing scarcity of high-quality cropland and the lower yields in newly cultivated areas. However, the iLUC effects and their geographical distribution could also be much lower if the production and use of second-generation biofuels expand rapidly (IEA 2011).
The target of 10% renewable energy in transport established in the EU-RED and the accompanying sustainability criteria
have transformed the market for biofuels in the EU and globally in several ways. First, the mandated targets create a guaranteed market, offering clearer signals to biofuel producers and investors both in the EU and elsewhere. Second, the viability of the EU biofuels market – and thus the extent to which investment is seen as secure – is effectively defined through the sustainability criteria: only those regions and operators that prove compliance will be eligible to sell (or export) into the EU market. Third, given the higher cost of domestically produced biofuels in the EU and the commercial immaturity of other alternatives in the transport sector, a substantial share of the target is likely to be supplied by imported biofuels.
The EU-RED approach of assigning responsibility for land use change and GHG emissions outside of the national borders where the final energy end-use occurs is novel in that it goes beyond the requirements of the current climate regime. The challenge with respect to biofuel imports is to ensure that the sustainability criteria provide appropriate safeguards but at the same time are designed and implemented in a non-discriminatory manner. Export of high-productivity biofuels from developing countries to the EU can in some cases offer renewable energy at lower economic and resource costs compared with domestic EU sources, with the added bonus of contributing to economic development aims. Consequently, reductions in tariffs and non-tariff barriers for biofuels or agricultural feedstocks could result
in environmental and economic gains for both parties.
The EU-RED provides three main approaches for proving compliance with the sustainability criteria: voluntary schemes, bilateral or multilateral agreements and national (EU member state) schemes. Voluntary schemes have thus far predominated, including seven schemes that were approved by the EC in 2011. The costs of meeting the sustainability criteria include not only the direct fees (membership, auditing, etc.) but also any changes that have to be made to equipment, information technology systems, management routines and services. Small-scale producers, small-scale farmers and/or LDCs will tend to have more difficulty in absorbing such costs; therefore, for the criteria to be more equitable, it will be necessary to provide technical and institutional support. Such support might be more easily achieved through bilateral or multilateral agreements than through the voluntary schemes, because such agreements can extend beyond the certification and verification processes.
The sustainability criteria established by the EU seem to offer reasonable protection against the conversion of natural forests through dLUC, although some areas will fall outside the standard definitions. Furthermore, such schemes cannot address market leakage towards regions without sustainability certification and they also lack the possibility of creating positive incentives, such as the promotion of biofuels on degraded lands. Again, complementary or supplementary approaches via bilateral or multilateral agreements
Conclusions7
48 | Francis X. Johnson, Henrique Pacini and Edward Smeets
could be considered to address fair trade concerns while at the same time facilitating extension of sustainability measures to land use policies for an entire country or region. Such agreements could also address both domestic and export markets and all sectors or biomass uses rather than only biofuels. National certification schemes or similar approaches under development in several non-EU exporting countries might then be adapted and/or made consistent with the EU-RED criteria, while at the same time such schemes – as they originate in the exporting countries – can better represent the national context and priorities of LDCs.
Indirect land use change associated with the biofuels expansion in the EU – and hence the risk posed to forests – can be significant, especially for imported biofuels/feedstocks that are land-inefficient (low yields per hectare), particularly soya. The highest-yielding first-generation biofuels/feedstocks are biodiesel from palm oil and bioethanol from sugarcane. However, oil palm requires a wet climate and grows in the rainforest belt, thus leading to greater risks with respect to the preservation of high carbon and/or high biodiversity regions. The co-products of biofuels – such as animal feed, cogeneration and fertilisers
– will mitigate the land use and GHG impacts, but residual iLUC will always be present, given fixed land resources in relation to the material demands associated with increasing population and wealth.
The recent decision by the EC not to use (or to delay) crop-specific factors for iLUC raises concerns because of the large differences in the impacts of each feedstock. The structural imbalance in favour of diesel vehicles in EU transport creates an inherent problem in the near-term goal of avoiding land use impacts; bioethanol from sugarcane and sugar beet provides the lowest land use and/or GHG impact, whereas the land use and GHG impacts from biodiesel feedstocks can be much greater. Second-generation biofuels will eventually help to reduce the land use impacts, but the NREAPs reveal that they will not be widely available until after 2020; it is therefore important to create or maintain incentives in favour of the more efficient first-generation biofuels at least until 2020. Second-generation biofuels will considerably reduce – but not eliminate – iLUC, and further sustainability and competition concerns will arise in connection with the market intersection with other uses of woody or lignocellulosic biomass.
2BSvs 2011 Biomass Biofuels Sustainability voluntary scheme, Bureau Veritas. http://en.2bsvs.org/ [Accessed 8 April 2012].
Abengoa EU-RED Bioenergy Sustainability Assurance (RSBA/Abengoa) 2011 Abengoa Bioenergy presents its own sustainability standard to the European Commission. Abengoa EU-RED Bioenergy Sustainability Assurance.
Al-Riffai, P., Dimaranan, B. and Laborde, D. 2010 Global trade and environmental impact study of the EU biofuels mandate. International Food Policy Research Institute (IFPRI), Washington, DC, 125 p.
Andersen, A.D. 2011 Innovation systems and natural resources: the case of sugar cane in Brazil. PhD Thesis, Department of Business and Management, Aalborg University, Denmark.
Beurskens, L. and Hekkenberg, M. 2011 Renewable energy projections as published in the National Renewable Energy Action Plans of the European member states – covering all 27 EU member states. Energy Centre of the Netherlands and European Environmental Agency, ECN-E-10-069, Copenhagen, Denmark.
Bioethanol for Sustainable Transport (BEST) 2010 Bioethanol for Sustainable Transport: final project report. www.best-europe.org [Accessed 8 April 2012].
Boehlje, M. 1999 Structural changes in the agricultural industries: how do we measure, analyze and understand them? American Journal of Agricultural Economics 8(5):1028– 1041.
Bolwig, S., Gibbon, P. and Jones, S. 2009 The economics of smallholder organic contract farming in tropical Africa. World Development 37(6): 1094– 1104.
Bonsucro 2011a Bonsucro certification fees: letter to members. Better Sugar Cane Initiative. http://www.bonsucro.com/application_process.html [Accessed 8 April 2012].
Bonsucro 2011b Bonsucro EU production standard. www.bonsucro.com/standard/index.html [Accessed 8 April 2012].
Boyes, W. and Melvin, M. 2010 Microeconomics. 8th ed. South-Western Publishing, Cincinnati, OH, USA.
BP 2011 Statistical review of world energy 2011. www.bp.com/statisticalreview [Accessed 8 April 2012].
Bradley, D., Cuypers, D. and Pelkmans, L. 2009. 2nd Generation Biofuels and Trade: An exploratory study. For IEA Task 40. www.canbio.ca/upload/documents/2nd_generation_biofuels_and_trade.pdf [Accessed 8 April 2012].
Brennan, L. and Owende, P. 2010 Biofuels from microalgae: a review of technologies for production, processing, and extractions of biofuels and co-products. Renewable and Sustainable Energy Reviews 14: 557–577.
Business Wire 2011 Addax Bioenergy signs loan agreement for €258 million renewable energy project in Sierra Leone, 17 June 2011. www.businesswire.com/news/home/20110617005346/en/Addax-Bioenergy-Signs-Loan-Agreement-%E2%82%AC258-Million [Accessed 8 April 2012].
References8
50 | Francis X. Johnson, Henrique Pacini and Edward Smeets
Campbell, J.E., Lobell, D.B., Genova, R.C. and Field, C.B. 2008 The global potential of bioenergy on abandoned agriculture lands. Environmental Science and Technology 42: 5791– 5794.
CE-Delft 2010 Biofuels: indirect land use change and climate impact. CE-Delft, The Netherlands, 62 p, http://www.cedelft.eu/publicatie/biofuels%3A_indirect_land_use_change_and_climate_impact/1068 [Accessed 8 April 2012].
Chalmers, J., Kunen, E., Ford, S., Harris, N. and Kadyzweski, J. 2011 Biofuels and indirect land use change. White paper: challenges and opportunities for improved assessment and monitoring. Winrock International, Arlington, VA, USA.
Confederation of European Paper Industries (CEPI) 2011 The forest sector contribution to the European bio-economy. CEPI guide to the exhibition in the European Parliament, Brussels, 6–9 September 2011.
Convention on Biological Diversity (CBD) 2001 Connecting biodiversity and climate change mitigation and adaptation: report of the Second Ad Hoc Technical Expert Group on Biodiversity and Climate Change. Technical Series No. 41. Secretariat of the Convention on Biological Diversity, Montreal, Canada. www.cbd.int/doc/publications/cbd-ts-41-en.pdf [Accessed 8 April 2012].
Cornelissen, S., Dehue, B. and Wonink, S. 2009 Summary of approaches to account for and monitor indirect impacts of biofuel production. Ecofys, Utrecht, The Netherlands. 76 p.
COWI Consortium 2008 Technical assistance for an evaluation of international schemes to promote biomass sustainability. ECN Energy Research Centre of the Netherlands, Copernicus Institute, Utrecht University, Forest and Landscape Denmark, University of Copenhagen, COWI A/S, Control Union Certifications. Report prepared for DG-Energy, European Commission, Brussels, 172 p.
Dehue, B., Cornelissen, S. and Peters, D. 2011 Indirect effects of biofuel production: overview prepared for the Global Bioenergy Partnership (GBEP). Ecofys, Utrecht, The Netherlands. 72p.
De Lopez, T., Tin, P., Iyadomi, K., Santos, S. and McIntosh, B. 2009 Clean Development Mechanism and the least developed countries: changing the rules for greater participation. Journal of Environment and Development 18(4): 436– 452.
De Miranda, E.E. 2007 Campeões de desmatamento (Who are the deforestation champions?). O Estado de São Paulo, Embrapa’s Satellite Monitoring Centre. Deforestation dynamics, www.desmatamento.cnpm.embrapa.br/conteudo/artigo.htm [Accessed 8 April 2012].
Di Lucia, L., Ahlgren, S. and Erisson, K. 2012 The dilemma of iLUC in EU biofuel policy: an empirical study of policy-making in the context of scientific uncertainty. Environmental Science & Policy 16: 9– 19.
Do Amaral, L.F. and Kutas, G. 2007 Ethanol boom in the US: an export opportunity for the Caribbean and Central American countries? Visages d’Amerique Latine, no. 5, Sept: 88– 94.
Dubois, O. 2008 Making sure that biofuel development benefits small farmers and communities. Unasylva 230 59: 25– 32.
E4Tech 2010 A causal descriptive approach to modelling the GHG emissions associated with the indirect land use change impacts of biofuels. E4Tech, London.
Edwards, R., Mulligan, D. and Marelli, L. 2010 Indirect land use change from increased biofuels demand: comparison of models and results for marginal biofuels production from different feedstocks. Joint Research Centre of the European Commission, Ispra, Italy, EUR 24485 EN, 150 p.
Energy Information Administration (EIA) 2011 Statistical database. http://www.eia.gov/countries/data.cfm. [Accessed 8 April 2012].
Esteban, B., Baquero, G., Puig, R., Riba, J.-R., and Rius, A. 2011 Is it environmentally advantageous to use vegetable oil directly as biofuel instead of converting it to biodiesel? Biomass and Bioenergy 35(3): 1317– 1328.
EUBIONET 2011 Solutions for biomass fuel market barriers and raw material availability. Summary of the EUBIONET III Project results. www.eubionet.net/default.asp?sivuID=25483 [Accessed 8 April 2012].
Transformations in EU biofuels markets under the Renewable Energy Directive and the implications for land use, trade and forests | 51
EurObserv’ER 2011 Biofuels barometer. www.eurobserv-er.org/pdf/biofuels_2011.pdf [Accessed 8 April 2012].
European Biodiesel Board (EBB) 2011 Latest developments in the indirect land-use change (iLUC) debate. EBB, Brussels. www.ebb-eu.org [accessed 20 January 2012].
European Commission (EC) 2001 Directive 2001/77/EC of the European Parliament and of the Council of 27 September 2001 on the promotion of electricity produced from renewable energy sources in the internal electricity market (OJ L283/33, 27.10.2001).
European Commission (EC) 2003 Directive 2003/30/EC of the European Parliament and of the Council of 8 May 2003 on the promotion of the use of biofuels or other renewable fuels for transport (OJ L123/42, 17.5.2003).
European Commission (EC) 2007 Communication from the Commission to the European Council and the European Parliament of 10 January 2007, An energy policy for Europe. COM (2007) 1 final.
European Commission (EC) 2008a Proposal for a directive of the European Parliament and of the Council on the promotion of the use of energy from renewable sources. COM (2008) final.
European Commission (EC) 2008b Annex to the impact assessment – document accompanying the package of implementation measures for the EU’s objectives on climate change and renewable energy for 2020. SEC (2008) 85, vol. 2.
European Commission (EC) 2008c Directive 2008/101/EC of the European Parliament and of the Council of 19 November 2008 amending Directive 2003/87/EC so as to include aviation activities in the scheme for greenhouse gas emission allowance trading within the Community (OJ L 8/3, 13.1.2009).
European Commission (EC) 2008d Community guidelines on state aid for environmental protection (OJ C82/1, 1.4.2008).
European Commission (EC) 2009a Directive 2009/28/EC of the European Parliament and of the Council, of 23 April 2009, on the promotion of the use of energy from renewable sources and amending and subsequently repealing Directives 2001/77/EC and 2003/30/EC. (OJ L 140/16, 5.6.2009)
European Commission (EC) 2009b Directive 2009/30/EC of the European Parliament and of the Council, of 23 April 2009, amending Directive 98/70/EC as regards the specification of petrol, diesel and gas-oil and introducing a mechanism to monitor and reduce greenhouse gas emissions and amending Council Directive 1999/32/EC as regards the specification of fuel used by inland waterway vessels and repealing Directive 93/12/EEC (OJ L 140/88, 5.6.2009).
European Commission (EC) 2009c Regulation (EC) No. 443/2009 of the European Parliament and of the Council of 23 April 2009 setting emission performance standards for new passenger cars as part of the Community’s integrated approach to reduce CO2 emissions from light-duty vehicles (OJ L 140/1, 5.6.2009).
European Commission (EC) 2009d Regulation (EC) No. 194/2009 of 11 March 2009 imposing a provisional countervailing duty on imports of biodiesel originating in the United States of America.
European Commission (EC) 2010a Report from the Commission on indirect land-use change related to biofuels and bioliquids. EC, Brussels. COM (2010) 811 final.
European Commission (EC) 2010b The impact of land use change on greenhouse gas emissions from biofuels and bioliquids. Directorate-General for Energy, Brussels.
European Commission (EC) 2010c Report from the Commission to the Council and the European Parliament on sustainability requirements for the use of solid and gaseous biomass sources in electricity, heating and cooling.
European Commission (EC) 2010d Communication from the Commission on the practical implementation of the EU biofuels and bioliquids sustainability scheme and on counting rules for biofuels. (OJ C 160/8–16, 19.6.2010).
European Commission (EC) 2011a First EU sustainability schemes for biofuels get the go-ahead. European Commission Press Release IP/11/901. http://europa.eu/rapid/pressReleasesAction.do?reference=IP/11/901 [Accessed 8 April 2012].
European Commission (EC) 2011b Memo: certification schemes for biofuels. European Commission MEMO/11/522 http://europa.
52 | Francis X. Johnson, Henrique Pacini and Edward Smeets
eu/rapid/pressReleasesAction.do?reference=MEMO/11/522&format=HTML [Accessed 8 April 2012].
European Commission (EC) 2011c Recent progress in developing renewable energy sources and technical evaluation of the use of biofuels and other renewable fuels in transport in accordance with Article 3 of Directive 2001/77/EC and Article 4(2) of Directive 2003/30/EC. COM(2011) 31 final.
European Commission (EC) 2011d European advanced biofuels flight path initiative. Technical paper: 2 million tons per year: a performing biofuels supply chain for EU aviation. European Commission Technical Paper. http://ec.europa.eu/energy/renewables/biofuels/doc/20110622_biofuels_flight_path_technical_paper.pdf [Accessed 8 April 2012].
European Commission (EC)-Trade 2011 European Commission Directorate for Trade, Everything but Arms Initiative. http://ec.europa.eu/trade/wider-agenda/development/generalised-system-of-preferences/everything-but-arms/ [Accessed 8 April 2012].
European Commission (EC)-Trade 2012 Economic Partnership Agreements. http://ec.europa.eu/trade/wider-agenda/development/economic-partnerships/ [Accessed 8 April 2012].
European Council 2007 Presidency conclusions, 7224/1/07, 2 May 2007.
European Environment Agency (EEA) 2010 Annual European Union greenhouse gas inventory 1990–2008 and inventory report 2010. Submission to the UNFCCC Secretariat. EEA Technical Report No. 6/2010.
European Union (EU)-Business 2009 Sudan ships to EU first export of ethanol, 28 December 2009. www.eubusiness.com/news-eu/sudan-biofuels.23d/view [Accessed 8 April 2012].
European Union–United States–Brazil 2007 White paper on internationally compatible biofuel standards. Tripartite task force: Brazil, European Union and United States of America.
EUROSTAT 2009 Panorama of energy, KS-GH-09-001, Luxembourg. http://epp.eurostat.ec.europa.eu/ [Accessed 8 Apri 2012].
Fairtrade 2011 Monitoring the scope and benefits of Fairtrade. Fairtrade International, London. www.fairtrade.net [Accessed 8 April 2012].
Fargione, J., Hill, J., Tilman, D., Polasky, S. and Hawthorne, P. 2008 Land clearing
and the biofuel carbon debt. Science 319(5867): 1235– 1238.
Fehrenbach, H., Fritsche, U.R. and Giegrich, J. 2008 Greenhouse gas balances for biomass: issues for further discussion. Issue paper for an informal workshop held 25 January, Brussels, Belgium.
Field, C.B., Campbell, J.E. and Lobell, D.B. 2008 Biomass energy: the scale of the potential resource. Trends in Ecology & Evolution 23(2): 65– 72.
F.O. Lichts 2011 World ethanol and biofuels report. 1 February 2011.
Fonseca, M., Burell, A., Gay, H., Henseler, M., Kavallari, A., M’Barek, R., Dominguez, I. and Tonini, A. 2010 Impacts of the EU biofuel target on agricultural markets and land use: a comparative modelling assessment. Joint Research Centre of the European Commission, Institute for Prospective Technology Studies, Ispra, Italy. 130 p.
Food and Agriculture Organization of the United Nations (FAO) 2005 Global forest resources assessment 2005: progress towards sustainable forest management. FAO Forestry Paper 147. FAO, Rome.
Food and Agriculture Organization of the United Nations (FAO) 2009 Definitional issues related to reducing emissions from deforestation in developing countries. Forests and Climate Change Working Paper 5. FAO, Rome.
Food and Agriculture Organization of the United Nations, Intergovernmental Panel on Climate Change, Center for International Forestry Research, International Union of Forest Research Organizations, United Nations Environment Programme (FAO, IPCC, CIFOR, IUFRO, UNEP) 2002 Comparative framework and options for harmonization of definitions. Proceedings of the second expert meeting on harmonizing forest-related definitions for use by various stakeholders, 11–13 September 2002, Rome.
Friends of the Earth (FOE) 2008 Soy consumption for feed and fuel in the European Union. Report prepared by Profundo Economic Research for Friends of the Earth Netherlands.
Fritsche, U.R. 2011 Sustainable biofuels? Some thoughts and data on the iLUC issue in the EU27. Informal Paper, Oeko Institut, Darmstadt, Germany.
Transformations in EU biofuels markets under the Renewable Energy Directive and the implications for land use, trade and forests | 53
Fritsche, U.R., Sims, R.E.H. and Monti, A., 2010 Direct and indirect land-use competition issues for energy crops and their sustainable production – an overview. Biofuels, Bioproducts and Biorefining, 4(6): 692– 704.
Fritsche, U.R. and Wiegmann, K. 2011 Indirect land use change and biofuels. Report prepared for European Parliament Directorate General for Internal Policies, Policy, Department A: Economic and Scientific Policy; Environment, Public Health and Food Safety. IP/A/ENVI/ST/2010-15.
German, L. and Schoneveld, G. 2011 Social sustainability of EU-approved voluntary schemes for biofuels: implications for rural livelihoods. Working Paper 75. Center for International Forestry Research (CIFOR), Bogor, Indonesia. www.cifor.org/publications/pdf_files/WPapers/WP75German.pdf [Accessed 8 April 2012].
Global Agricultural Information Network (GAIN) 2005 EU-25 Agricultural situation. Pakistan, EU’s second largest ethanol exporter, loses privileged status. United States Department of Agriculture (USDA) Foreign Agricultural Service. www.fas.usda.gov/gainfiles/200509/146131044.pdf [Accessed 8 April 2012].
Global Agricultural Information Network (GAIN) 2010 EU-27 annual biofuels report. United States Department of Agriculture (USDA) Foreign Agricultural Service – GAIN.
Global Agricultural Information Network (GAIN) 2011 EU-27 annual biofuels report. United States Department of Agriculture (USDA) Foreign Agricultural Service – GAIN.
Global Bioenergy Partnership (GBEP) 2011 The Global Bioenergy Partnership (GBEP) sustainability indicators for bioenergy. Executive summary. www.globalbioenergy.org [Accessed 8 April 2012].
Gnansounou, E., Panichelli, L., Dauriat, A. and Villegas, J.D. 2008 Accounting for indirect land-use changes in GHG balances of biofuels: review of current approaches. École Polytechnique Fédérale de Lausanne (EPFL), Lausanne, Switzerland. 22 p.
Greenergy 2011 Greenergy sustainability programme for Brazilian bioethanol becomes first voluntary scheme to gain approval under the EU Renewable Energy Directive. Greenergy Press Office, 19 July 2011.
Hart Energy Consulting/CABI 2011 Land use change: science and policy review. Houston, TX, USA/Wallingford, Oxfordshire, UK. 52 p.
Hodson, P., Jones, C. and Van Steen, H. 2010 EU energy law. Vol. III, Book 1: Renewable energy law and policy in the European Union. Claeys & Casteels. Deventer, The Netherlands.
Hoogwijk, M., Faaij, A., van den Broek, R., Berndes, G., Gielen, D. and Turkenburg, W. 2003 Exploration of the ranges of the global potential of biomass for energy. Biomass and Bioenergy 25: 119– 133.
Hoogwijk, M., Faaij, A., de Vries, B. and Turkenburg, W. 2009 Exploration of regional and global cost-supply curves of biomass energy from short-rotation crops at abandoned cropland and rest land under four IPCC SRES land-use scenarios, Biomass and Bioenergy 33(1): 26– 43.
Hylander, B.N. 2009 The shift in technology drivers in the global forest products industry. Paper presented at CAETS2009, Calgary, Canada, 13– 17 July.
International Energy Agency (IEA) 2007 Global wood pellets markets and industry: policy drivers, market status and raw material potential. IEA Bioenergy Task 40 report, http://www.canbio.ca/upload/documents/ieatask 40pelletandrawmaterialstudynov2007final.pdf [accessed 30 April 2012].
International Energy Agency (IEA) 2011 World Energy Outlook 2011. IEA, Paris, France.
International Institute for Trade Negotiations (ICONE) 2010 An allocation methodology to assess GHG emissions associated with land use change. Final report, ICONE, São Paulo, Brazil, 31p.
International Organization for Standardization (ISO) 2011 International Organization for Standardization catalogue of available and in process standards. www.iso.org/iso/catalogue_detail.htm?csnumber=52528 [Accessed 8 April 2012].
International Sustainability and Carbon Certification (ISCC) 2011. International Sustainability and Carbon Certification. www.iscc-system.org/ [Accessed 8 April 2012].
Jack, B. 2010 Enforcing member state compliance with EU environmental law: a critical evaluation of the use of financial penalties. Journal of Environmental Law 23(1): 73– 95.

54 | Francis X. Johnson, Henrique Pacini and Edward Smeets
Jacobsson, S. 2008 The emergence and troubled growth of a ‘biopower’ innovation system in Sweden. Energy Policy 36: 1491– 1508.
Johnson, F.X. 2011 Regional-global linkages in the energy–climate–development policy nexus: the case of biofuels in the EU Renewable Energy Directive, Renewable Energy Law and Policy Journal RELP 2/2011: 91– 106.
Joint Research Centre of the European Commission (JRC) 2010 The impact of land use change on greenhouse gas emissions from biofuels and bioliquids: literature review. JRC, Ispra, Italy. 232 p.
Joint Research Centre of the European Commission (JRC) 2011 Technical assessment of the renewable energy action plans. JRC, Ispra, Italy. Reference Report EUR 24926 EN.
Junginger, M., van Dam, J., Zarrilli, S., Mohamed, F.A., Marchal, D. and Faaij, A. 2011 Opportunities and barriers for international bioenergy trade. Energy Policy 39: 2028– 2042.
Kim, S. and Dale, B. 2011 Indirect land use change for biofuels: testing predictions and improving analytical methodologies. Biomass and Bioenergy 35(7): 3235– 3240.
Kline, K.L., Oladosu, G.A., Dale, V.H. and McBride, A.C. 2011 Scientific analysis is essential to assess biofuel policy effects: in response to the paper by Kim and Dale on ‘Indirect land-use change for biofuels: testing predictions and improving analytical methodologies’, Biomass and Bioenergy, 35(10): 4488– 4491.
Laborde, D. 2011 Assessing the land use change consequences of European biofuel policies. International Food Policy Research Institute (IFPRI), Washington, DC. 110 p.
Lamers, P., Hamelinck, C., Junginger, M. and Faaij, A. 2011 International bioenergy trade: a review of past developments in the liquid biofuel market. Renewable and Sustainable Energy Reviews 15: 2655– 2676.
Lange, M. 2010 The GHG balance of biofuels taking into account land use change. Kiel Institute Working Paper No. 1619, Kiel, Germany.
Lee, J.S.H., Rist, L., Obidzinski, K., Ghazoul, J. and Koh, L.P. 2011 No farmer left behind in sustainable biofuel production. Biological Conservation 144(10): 2512–2516.
Lerner, A., Matupa, O., Mothlathledi, F., Stiles, G. and Brown, R. 2010 SADC biofuel state of play study: an assessment of the biofuel sector development in the Southern African Development Community. Southern African Development Community, Gaborone, Botswana.
Marelli, L., Mulligen, D. and Edwards, R. 2011 Critical issues in estimating ILUC emissions. Outcomes of an expert consultation, 9–10 November 2010, Ispra, Italy. Joint Research Centre of the European Commission, Ispra, Italy. 64 p.
Mataconis, D. 2012 Ethanol tax credit expires after three decades, www.outsidethebeltway.com/ethanol-tax-credit-expires-after-three-decades/ [Accessed 8 April 2012].
McKinsey 2007 Betting on biofuels. The McKinsey Quarterly. www.globalbioenergy.org/uploads/media/07_TheMcKinseyQuarterly_-_Betting_on_biofuels_01.pdf [Accessed 8 April 2012].
McKinsey 2010 Impact of the financial crisis on carbon economics. Version 2.1 of the Global greenhouse gas abatement cost curve. McKinsey & Company, New York.
Merger, E., Dutschke, M. and Verchot, L. 2011 Options for REDD+ voluntary certification to ensure net GHG benefits, poverty alleviation, sustainable management of forests and biodiversity conservation. Forests 2(2): 550– 577.
Nijsen, M., Smeets, E., Stehfest, E. and van Vuuren, D. 2011 An evaluation of the global potential of bioenergy production on degraded lands. Global Change Biology Bioenergy 3(6): 5791– 5794.
Oeko Institut and Institute for Energy and Environment (Oeko/IFEU) 2009 Sustainable bioenergy: current status and outlook. Darmstadt, Heidelberg, Germany. 34 p.
Oosterveer, P. and Mol, A. 2009 Biofuels, trade and sustainability: a review of perspectives for developing countries. Biofuels, Bioproducts & Biorefining 4:66– 76.
Opdal, A.O. and Hojem, J.F. 2007 Biofuels in ships. A project report and feasibility study into the use of biofuels in the Norwegian domestic fleet. Zero Emission Resource Organisation (ZERO), http://www.zero.no/publikasjoner [accessed 30 April 2012].
Organisation for Economic Co-operation and Development and Food and Agriculture
Transformations in EU biofuels markets under the Renewable Energy Directive and the implications for land use, trade and forests | 55
Organization of the United Nations (OECD–FAO) 2009 Agricultural outlook 2009–2018. FAO, Rome, and OECD, Paris.
Organisation for Economic Co-operation and Development and Food and Agriculture Organization of the United Nations (OECD–FAO) 2011 Agricultural outlook 2011–2020. FAO, Rome, and OECD, Paris.
Pacini, H. and Assunção, L. 2011 Sustainable biofuels in the EU: the costs of certification and impacts on new producers. Biofuels 2(6): 595–598 (editorial).
Pacini, H. and Batidzirai, B. 2012 The development of biofuel capacities: strengthening the position of African countries through increased energy security. In: Johnson, F.X. and Seebaluck, V. (eds.) Bioenergy for sustainable development and international competitiveness: the role of sugar cane in Africa. Earthscan/Routledge, London.
Pacini, H. and Strapasson, A.B. 2012 Innovation subject to sustainability: the European policy on biofuels and its effects on innovation in the Brazilian bioethanol industry. Journal for Contemporary European Research (JCER). In press.
Pacini, H., Khatiwada, D. and Lonnqvist, T. 2010 Tailor-made solutions: small-scale biofuels and trade. Bridges Trade BioRes Review 4(4): 10–11. International Centre for Trade and Sustainable Development, Geneva, Switzerland.
Pena, N., Bird, D.N., Frieden, D. and Zanchi, G. 2010 Conquering space and time: the challenge of emissions from land use change, InfoBrief No. 27. Center for International Forestry Research (CIFOR), Bogor, Indonesia.
Pilgrim, S. and Harvey, M. 2010 Battles over biofuels: NGOs and the politics of markets. Sociological Research Online 15(3): 4. www.socresonline.org.uk/15/3/4.html [Accessed 8 April 2012].
Pöyry 2011 Pellets: becoming a global commodity? Perspectives on the global pellet market to 2020. Pöyry PLC, Vantaa, Finland.
Prins, A.G., Stehfest, E., Overmars, K. and Ros, J. 2010 Are models suitable for determining iLUC factors? The Netherlands Environmental Assessment Agency, Bilthoven, The Netherlands. 12 p.
Pulp & Paper International 2011 Outlook 2011, Pulp and Paper International Magazine,
Jan. 2011: 12–13. www.ppimagazine.com/ppiissue/201101?pg=15#pg15 [Accessed 8 April 2012].
Ragauskas, A.J., Williams, C.K., Davison, B.H., Britovsek, G., Cairney, J., Eckert, C.A., Frederick, W.J. Jr., Hallett, J.P., Leak, D.J., Liotta, C.L. et al. 2006 The path forward for biofuels and biomaterials. Science 311: 484– 489.
Renewable Energy Policy Network for the 21st Century (REN21) 2011 Renewables 2011. Global Status Report. www.ren21.net/Portals/97/documents/GSR/REN21_GSR2011.pdf [Accessed 8 April 2012].
Renewable Fuels Association (RFA) 2011 Historical statistics. www.ethanolrfa.org/ [Accessed 8 April 2012].
Reuters 2011 Exclusive: EU to delay action on biofuels’ indirect impact. www.reuters.com/article/2011/09/08/ [Accessed 8 April 2012].
Rosillo-Calle, F. and Johnson, F.X. 2010 Food versus fuel: an informed introduction to biofuels. ZED Books, London.
Roundtable on Sustainable Biofuels (RSB) 2010 RSB terms of reference. RSB, Lausanne, Switzerland. http://rsb.epfl.ch/ [accessed 30 April 2012].
Roundtable on Sustainable Biofuels (RSB) 2011a 2-Tiered system: way forward. RSB Bulletin, March: 2–3. RSB, Lausanne, Switzerland. http://rsb.epfl.ch/ [accessed 30 April 2012].
Roundtable on Sustainable Biofuels (RSB) 2011b RSB Tier 1 standard: explanatory note. RSB, Lausanne, Switzerland. http://rsb.epfl.ch/ [accessed 30 April 2012].
Roundtable on Responsible Soy (RTRS) 2011 Soy amount estimation methodology for RTRS certification. RTRS Secretariat Technical Unit.
Roundtable on Sustainable Palm Oil (RSPO) 2012 Promoting the growth and use of sustainable palm oil. www.rspo.org [Accessed 20 January 2012].
Sasaki, N. and Putz, F. 2009 Critical need for new definitions of ‘forest’ and ‘forest degradation’ in global climate change agreements. Conservation Letters 2(5): 226–232.
Scarlat, N. and Dallemand, J.-F. 2011 Recent developments of biofuels/bioenergy sustainability certification: a global overview. Energy Policy 39(3): 1630–1646.
Schubert, R. and Blasch, J. 2010 Sustainability standards for bioenergy: a means to
56 | Francis X. Johnson, Henrique Pacini and Edward Smeets
reduce climate change risks? Energy Policy 38: 2797– 2805.
Schwaiger, H., Pena, N., Mayer, A. and Bird, D.N. 2011 Technologies to produce liquid biofuels for transportation: an overview. Working Paper 72. Center for International Forestry Research (CIFOR), Bogor, Indonesia.
Searchinger, T., Heimlich, R., Houghton, R., Dong, F., Elobeid, A., Fabiosa, J., Tokgoz, S., Hayes, D. and Yu, T. 2008 Use of US croplands for biofuels increases greenhouse gases through emissions from land use change. Science 319(5867): 1238–1240.
Smeets, E. and Faaij, A. 2010 The impact of sustainability criteria on the costs and potentials of bioenergy production: applied for case studies in Brazil and Ukraine. Biomass and Bioenergy 34: 319–333. www.bioenergytrade.org/downloads/smeetsetal.fbtcasestudiesreport.pdf [Accessed 8 April 2012].
Smeets, E., Faaij, A., Lewandowski, I. and Turkenburg, W. 2007 A bottom-up assessment and review of global bio-energy potentials to 2050. Progress in Energy and Combustion Science 33: 56–106.
Solomon, S. 2009 Post-harvest deterioration of sugarcane. Sugar Tech 11(2): 109–123.
Taylor, G. 2008 Biofuels and the biorefinery concept. Energy Policy 36(12): 4406–4409.
Tilman D., Hill, J. and Lehman, C. 2006. Carbon-negative biofuels from low-input high-diversity grassland biomass. Science 314(5805): 1598–1600.
Tran, C. 2010 Using GATT, Art. XX to justify climate change measures in claims under the WTO Agreements. Environmental Planning and Law Journal 27(5): 346–359.
Ulmanen, J.H., Verbong, G.P.J. and Raven, R.P.J.M. 2009 Biofuel developments in Sweden and the Netherlands: protection and socio-technical change in a long-term perspective. Renewable and Sustainable Energy Reviews 13(6–7): 1406–1417.
United Nations Conference on Trade and Development (UNCTAD) 2009 The biofuels market: current situation and alternative scenarios. UNCTAD report. Geneva, Switzerland. UNCTAD/DITC/BCC/2009/1.
United Nations Economic Commission for Europe (UNECE) 2010 The European forest sector outlook study II: 2010–2030. www.unece.org/
fileadmin/DAM/timber/publications/sp-28.pdf [Accessed 8 April 2012].
United Nations Framework Convention on Climate Change (UNFCCC) 2001 Report of the Conference of the Parties on its Seventh Session, 29 October – 10 September 2001, Marrakesh, Morocco. Addendum part two: action taken by the Conference of the Parties, Volume I. UNFCCC, Bonn.
United States Department of Agriculture (USDA) 2011 Statistical database. www.usda.gov [Accessed 8 April 2012].
United States Environmental Protection Agency (US EPA) 2010a EPA finalizes regulations for the National Renewable Fuel Standard Program for 2010 and beyond www.epa.gov/OMS/renewablefuels/420f10007.pdf [Accessed 8 April 2012].
United States Environmental Protection Agency (US EPA) 2010b Renewable Fuel Standard Program (RFS2) regulatory impact analysis. Assessment and Standards Division, Office of Transportation and Air Quality, US Environmental Protection Agency, Washington, DC. EPA-420-R-10-006.
Van Dam, J., Junginger, M. and Faaij, A. 2010 From the global efforts on certification of bioenergy towards an integrated approach based on sustainable land use planning. Renewable and Sustainable Energy Reviews 14(9): 2445–2472.
Van Vuuren D.P., van Vliet, J. and Stehfest, E. 2009 Future bioenergy potentials under various natural constraints. Energy Policy 37: 4220–4230.
Weiss, W. 2011 Biofuels and the WTO. In: Herrmann, C. and Terhechte, J.P. (eds.), European Yearbook of International Economic Law 2011, 169–204. Springer-Verlag: Berlin and Heidelberg, Germany.
Wicke, B., Sikkema, R., Dornburg, V. and Faaij, A. 2011a Exploring land use changes and the role of palm oil production in Indonesia and Malaysia. Land Use Policy, 28(1): 193–206.
Wicke, B., Smeets, E., Dornburg, V., Vashev, B., Gaiser, T., Turkenburg, W. and Faaij, A. 2011b The global technical and economic potential of bioenergy from salt-affected soils. Energy & Environmental Science 4: 2669–2681.
Wiegmann, K., Hennenberg, K.J. and Fritsche, U.R. 2008 Degraded Land and Sustainable Bioenergy Feedstock Production. Proceedings
Transformations in EU biofuels markets under the Renewable Energy Directive and the implications for land use, trade and forests | 57
of the joint international workshop on Nature Value Criteria and Potential for Sustainable Use of Degraded Lands. Paris, 30 June – 1 July.
Witzke, P., Banse, M., Gömann, H., Heckelei, T., Breuer, T., Mann, S., Kempen, M., Adenäuer, M. and A. Zintl 2008 Modelling of energy crops in agricultural sector models. a review of existing methodologies. Institute for Prospective Technological Studies (IPTS) of the European Commission Joint Research Centre, Seville, Spain.
World Trade Organization (WTO) 2012 Main legal provisions: enabling clause for developing
countries. www.wto.org/english/tratop_e/devel_e/d2legl_e.htm [Accessed 8 April 2012].
WWF 2006 WWF asks for mandatory eco-certification for biofuels. http://wwf.panda.org/what_we_do/footprint/agriculture/soybeans/news/?58620/WWF-asks-for-mandatory-eco-certification-for-biofuels. [Accessed 7 May 2012]
Zarrilli, S. 2008 Making certification work for sustainable development: the case of biofuels. United Nations Conference on Trade and Sustainable Development (UNCTAD), New York and Geneva. www.unctad.org/en/docs/ditcted20081_en.pdf [Accessed 8 April 2012].

cifor.org blog.cifor.org
Significant transformations are underway in EU biofuels markets as a result of the Renewable Energy Directive (EU-RED) established in 2009, and the potential impacts are global in nature due especially to expanding biofuels imports from developing countries. Renewable energy targets have created a more secure market for biofuels in the EU while the biofuels sustainability criteria set by the EU-RED has extended its reach far beyond the borders of the EU by addressing land use changes and natural resource management issues in exporting countries. Tensions between climate and development objectives – alongside the complex interface to meet energy security and food security objectives – have brought new North–South and South–South dimensions into the biofuels equation.
This report reviews and analyses the transformation in EU biofuels markets within this broader international context by focusing especially on three aspects and the linkages between them: land use change, trade and forest protection. The dynamics of international trade in biofuels has been evolving due to a variety of technical and economic factors within the context of physical resource constraints and legislation in the EU, US, Brazil and other countries. Many countries and enterprises are now entering the biofuels market, while new political stakeholders engaging in the policy process are also impacting the direction of these markets. This report aims to explore the changing linkages across regions and policy regimes in biofuels markets, which are raising the possibility of both valuable synergies and serious conflicts with existing needs in the agricultural and forestry sectors.
CIFOR Occasional Papers contain research results that are significant to tropical forestry. The content is peer reviewed internally and externally.
Center for International Forestry ResearchCIFOR advances human wellbeing, environmental conservation and equity by conducting research to inform policies and practices that affect forests in developing countries. CIFOR is a CGIAR Consortium Research Center. CIFOR’s headquarters are in Bogor, Indonesia and it also has offices in Asia, Africa and South America.
This research was carried out as part of the CGIAR Research Programme, ‘Forests, Trees and Agroforestry: Livelihoods, Landscapes and Governance’. The Programme aims to enhance management and use of forests, agroforestry and tree genetic resources across the landscape from forests to farms. The Center for International Forestry Research leads the collaborative programme in partnership with Bioversity International, the International Center for Tropical Agriculture and the World Agroforestry Centre.