transformation through organic growth and …68e603cc-9915-4b9f-816e...1 transformation through...
TRANSCRIPT
1
Transformation through Organic Growth and Operational Excellence
Steve de Kruijff, COO Xstrata Copper North QueenslandAnalyst Visit Ernest Henry Mining – April 2011
2
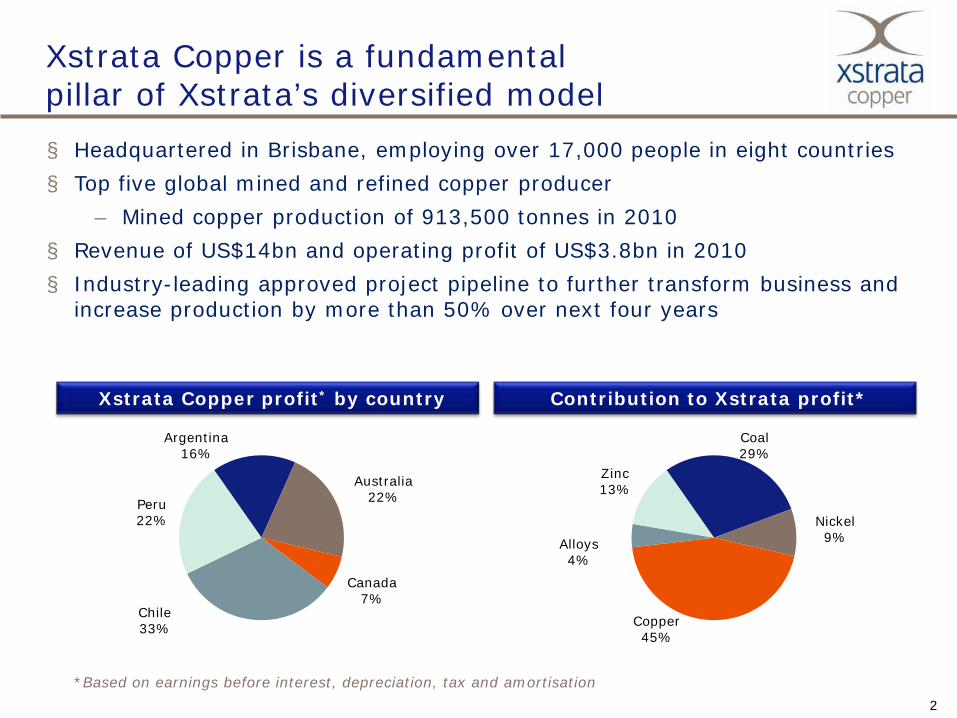
Xstrata Copper is a fundamental pillar of Xstrata’s diversified model
Contribution to Xstrata profit*
Coal29%
Nickel 9%
Copper45%
Alloys4%
Zinc13%
Xstrata Copper profit* by country
Argentina16%
Australia22%
Canada7%
Chile33%
Peru22%
*Based on earnings before interest, depreciation, tax and amortisation
§ Headquartered in Brisbane, employing over 17,000 people in eight countries§ Top five global mined and refined copper producer
– Mined copper production of 913,500 tonnes in 2010§ Revenue of US$14bn and operating profit of US$3.8bn in 2010§ Industry-leading approved project pipeline to further transform business and
increase production by more than 50% over next four years
3
0 500 1000 1500 2000
Xstrata CopperJiangxi Copper
FreeportAurubisCodelco
0 200 400 600 800 1000 1200
Nippon MiningAurubis
Xstrata CopperJiangxi Copper
Codelco
0 500 1000 1500 2000
Anglo AmericanXstrata Copper
BHP BillitonFreeportCodelco
0 500 1000 1500 2000
Xstrata CopperRio TintoFreeport
Phelps DodgeBHP Billiton
Codelco
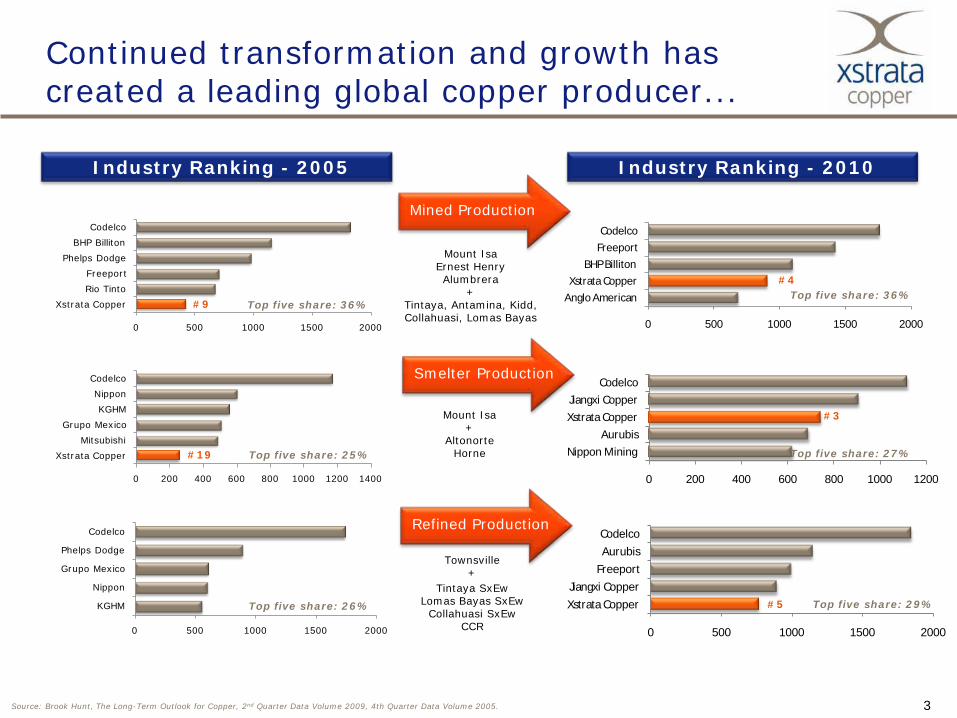
Continued transformation and growth hascreated a leading global copper producer...
Townsville+
Tintaya SxEwLomas Bayas SxEw
Collahuasi SxEwCCR
Mount IsaErnest HenryAlumbrera
+Tintaya, Antamina, Kidd, Collahuasi, Lomas Bayas
Mount Isa+
AltonorteHorne
Industry Ranking - 2010
Top five share: 36%
Top five share: 29%
Top five share: 27%
Source: Brook Hunt, The Long-Term Outlook for Copper, 2nd Quarter Data Volume 2009, 4th Quarter Data Volume 2005.
Industry Ranking - 2005
0 200 400 600 800 1000 1200 1400
Xstrata CopperMitsubishi
Grupo MexicoKGHM
NipponCodelco
0 500 1000 1500 2000
KGHM
Nippon
Grupo Mexico
Phelps Dodge
Codelco
Top five share: 36%
Top five share: 26%
Top five share: 25%
#9
#19
#4
#3
#5
Mined Production
Smelter Production
Refined Production
4
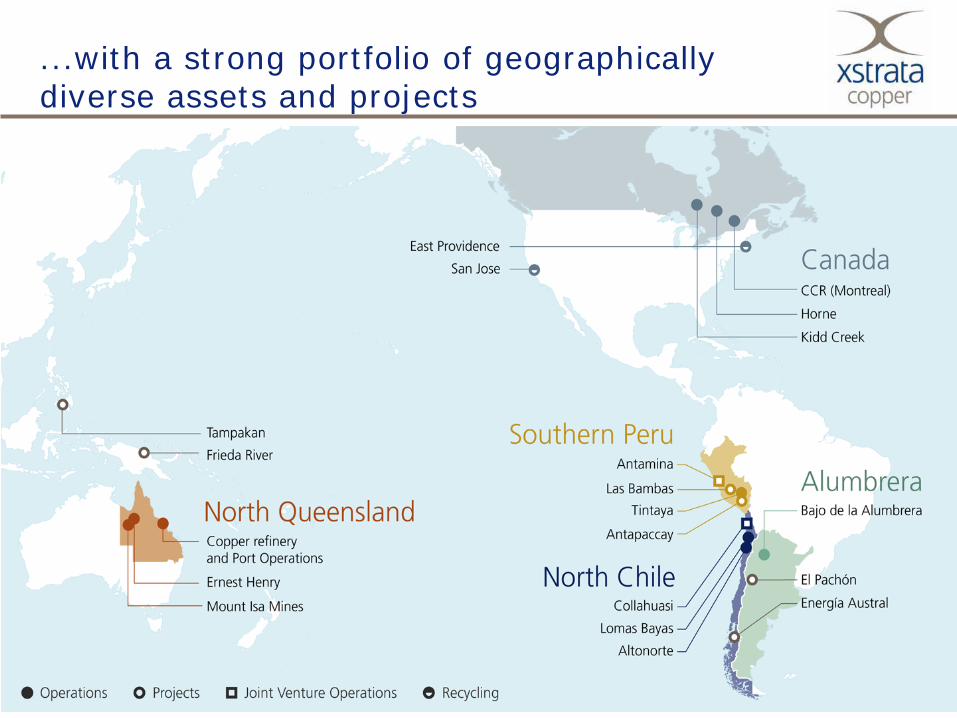
...with a strong portfolio of geographically diverse assets and projects
5
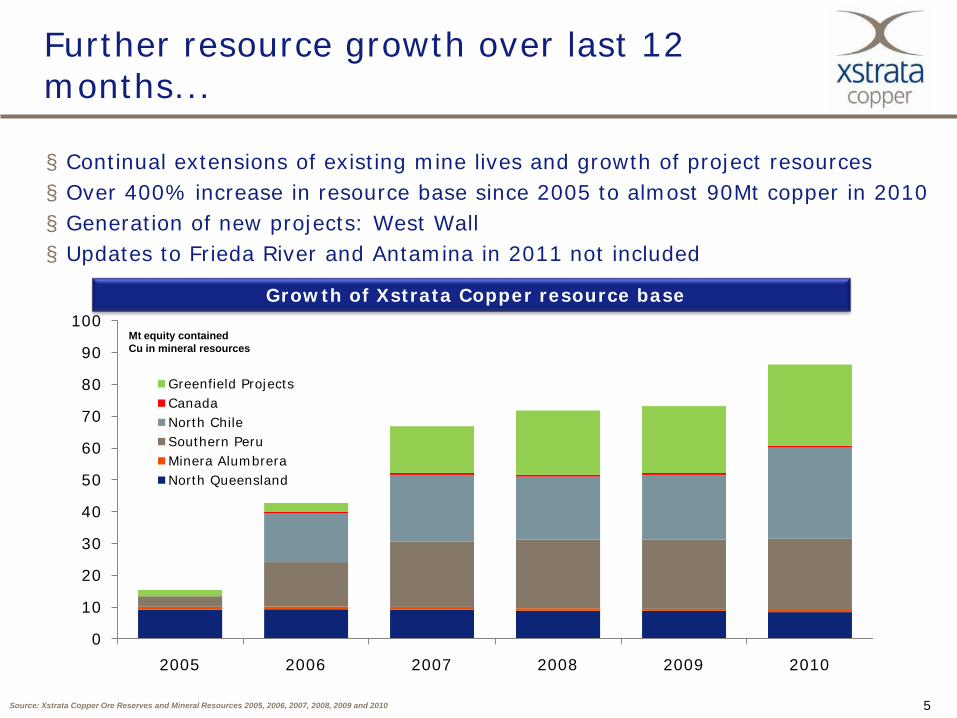
Further resource growth over last 12 months...
Mt equity contained Cu in mineral resources
Source: Xstrata Copper Ore Reserves and Mineral Resources 2005, 2006, 2007, 2008, 2009 and 2010
§ Continual extensions of existing mine lives and growth of project resources§ Over 400% increase in resource base since 2005 to almost 90Mt copper in 2010 § Generation of new projects: West Wall§ Updates to Frieda River and Antamina in 2011 not included
Growth of Xstrata Copper resource base
0
10
20
30
40
50
60
70
80
90
100
2005 2006 2007 2008 2009 2010
Greenfield ProjectsCanadaNorth ChileSouthern PeruMinera AlumbreraNorth Queensland
6Source: Brook HuntNote: * Life extensions included in existing production
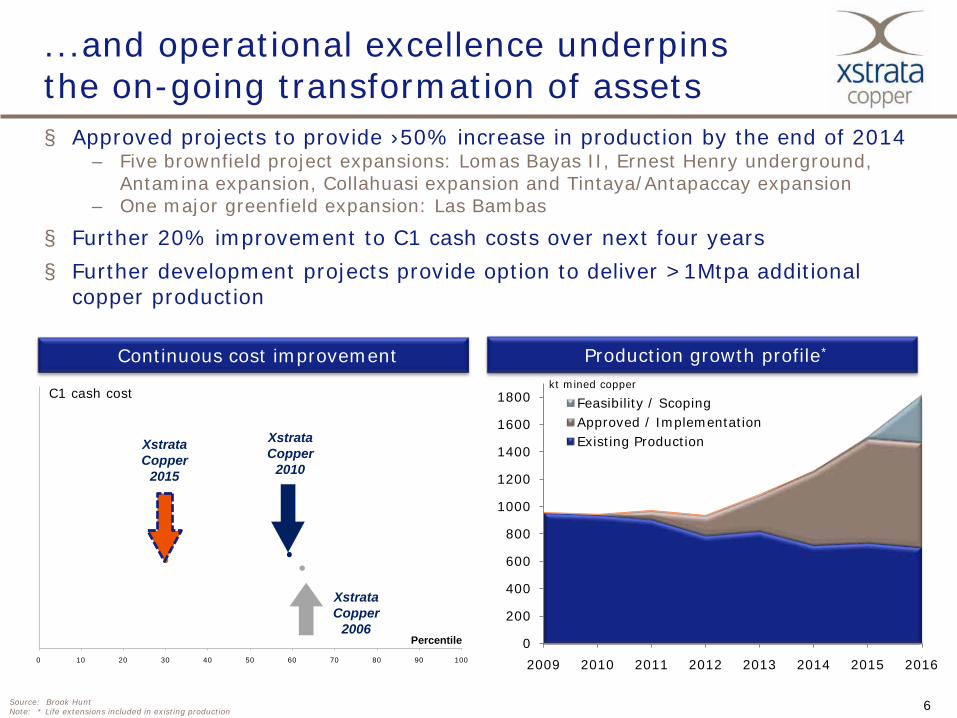
...and operational excellence underpins the on-going transformation of assets
Continuous cost improvement
0 10 20 30 40 50 60 70 80 90 100
XstrataCopper
2010
C1 cash cost
Percentile
XstrataCopper
2015
XstrataCopper
2006
kt mined copper
Production growth profile*
§ Approved projects to provide ›50% increase in production by the end of 2014– Five brownfield project expansions: Lomas Bayas II, Ernest Henry underground,
Antamina expansion, Collahuasi expansion and Tintaya/Antapaccay expansion– One major greenfield expansion: Las Bambas
§ Further 20% improvement to C1 cash costs over next four years§ Further development projects provide option to deliver >1Mtpa additional
copper production
0
200
400
600
800
1000
1200
1400
1600
1800
2009 2010 2011 2012 2013 2014 2015 2016
Feasibility / ScopingApproved / ImplementationExisting Production
77
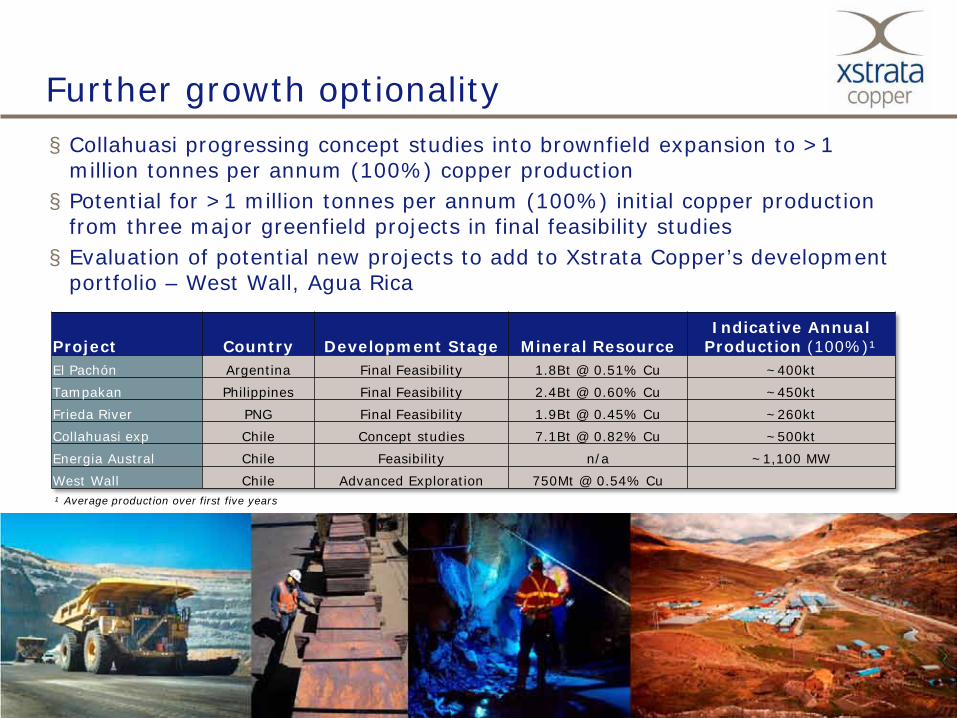
Further growth optionality§ Collahuasi progressing concept studies into brownfield expansion to >1
million tonnes per annum (100%) copper production§ Potential for >1 million tonnes per annum (100%) initial copper production
from three major greenfield projects in final feasibility studies§ Evaluation of potential new projects to add to Xstrata Copper’s development
portfolio – West Wall, Agua Rica
¹ Average production over first five years
Project Country Development Stage Mineral ResourceIndicative Annual
Production (100%)¹El Pachón Argentina Final Feasibility 1.8Bt @ 0.51% Cu ~400ktTampakan Philippines Final Feasibility 2.4Bt @ 0.60% Cu ~450ktFrieda River PNG Final Feasibility 1.9Bt @ 0.45% Cu ~260ktCollahuasi exp Chile Concept studies 7.1Bt @ 0.82% Cu ~500ktEnergia Austral Chile Feasibility n/a ~1,100 MWWest Wall Chile Advanced Exploration 750Mt @ 0.54% Cu
8
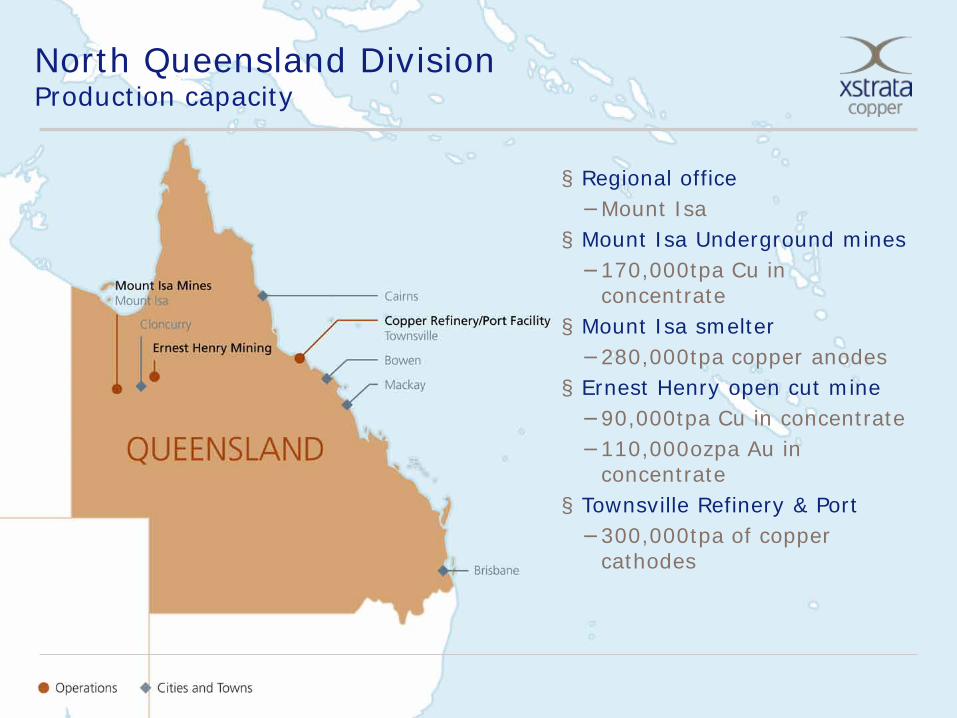
North Queensland DivisionProduction capacity
§ Regional office−Mount Isa§ Mount Isa Underground mines −170,000tpa Cu in
concentrate§ Mount Isa smelter −280,000tpa copper anodes§ Ernest Henry open cut mine−90,000tpa Cu in concentrate−110,000ozpa Au in
concentrate§ Townsville Refinery & Port−300,000tpa of copper
cathodes
9
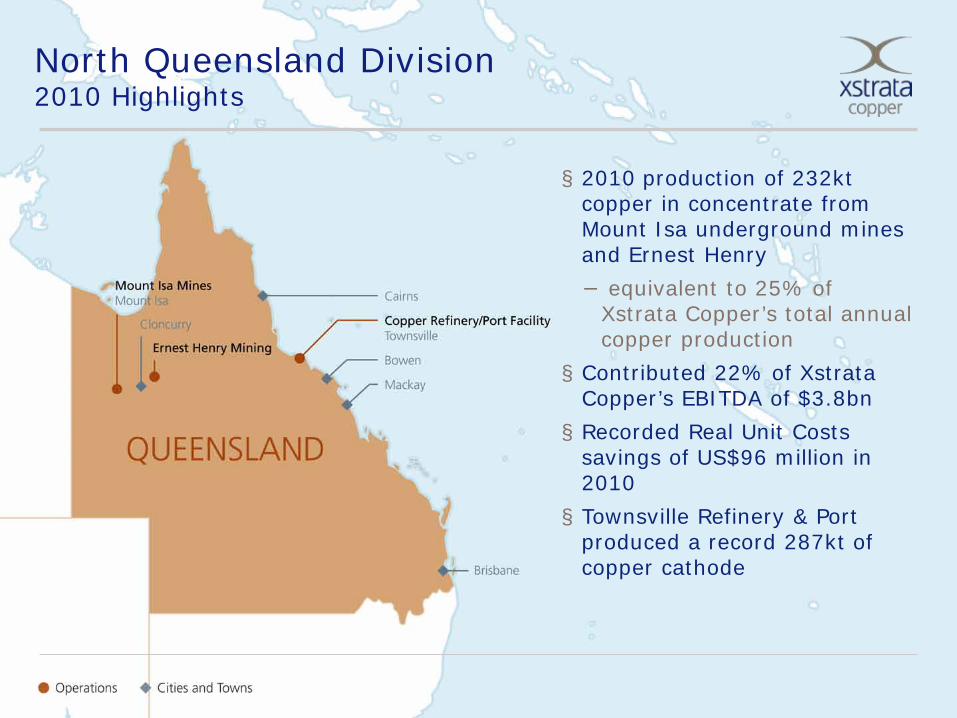
North Queensland Division2010 Highlights
§ 2010 production of 232kt copper in concentrate from Mount Isa underground mines and Ernest Henry − equivalent to 25% of
Xstrata Copper’s total annual copper production
§ Contributed 22% of Xstrata Copper’s EBITDA of $3.8bn § Recorded Real Unit Costs
savings of US$96 million in 2010§ Townsville Refinery & Port
produced a record 287kt of copper cathode
1010
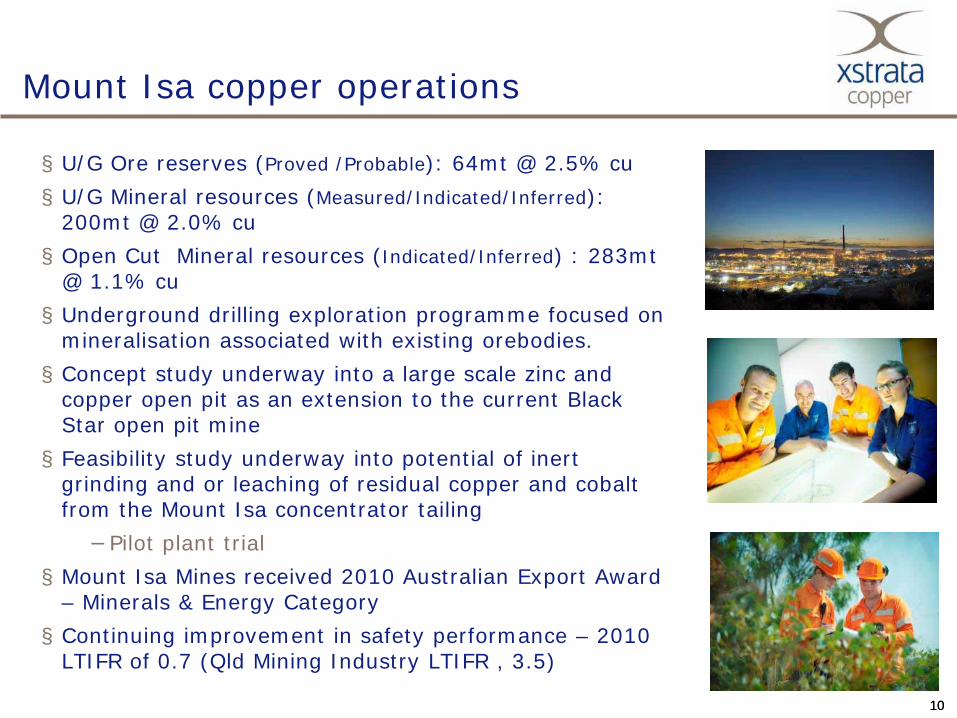
Mount Isa copper operations
§ U/G Ore reserves (Proved /Probable): 64mt @ 2.5% cu§ U/G Mineral resources (Measured/Indicated/Inferred):
200mt @ 2.0% cu§ Open Cut Mineral resources (Indicated/Inferred) : 283mt
@ 1.1% cu§ Underground drilling exploration programme focused on
mineralisation associated with existing orebodies. § Concept study underway into a large scale zinc and
copper open pit as an extension to the current Black Star open pit mine§ Feasibility study underway into potential of inert
grinding and or leaching of residual copper and cobalt from the Mount Isa concentrator tailing−Pilot plant trial
§ Mount Isa Mines received 2010 Australian Export Award – Minerals & Energy Category§ Continuing improvement in safety performance – 2010
LTIFR of 0.7 (Qld Mining Industry LTIFR , 3.5)
11
Copper market update
1212
0
2000
4000
6000
8000
10000
12000
14000
1900 1910 1920 1930 1940 1950 1960 1970 1980 1990 2000 2010
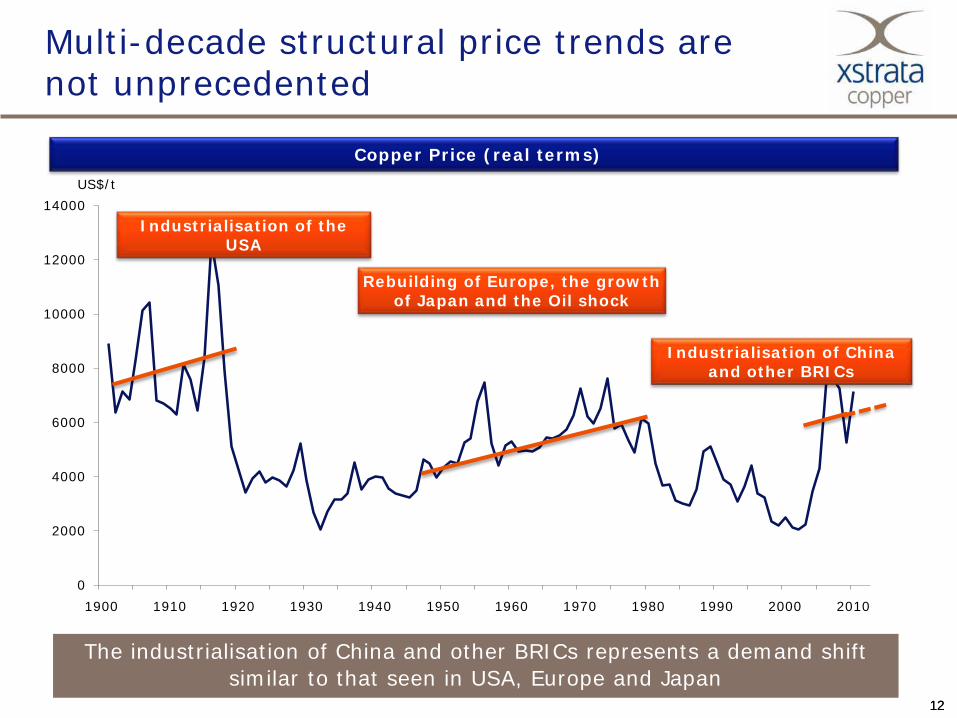
Multi-decade structural price trends are not unprecedented
Copper Price (real terms)
Industrialisation of the USA
Rebuilding of Europe, the growth of Japan and the Oil shock
Industrialisation of China and other BRICs
The industrialisation of China and other BRICs represents a demand shift similar to that seen in USA, Europe and Japan
US$/t
1313
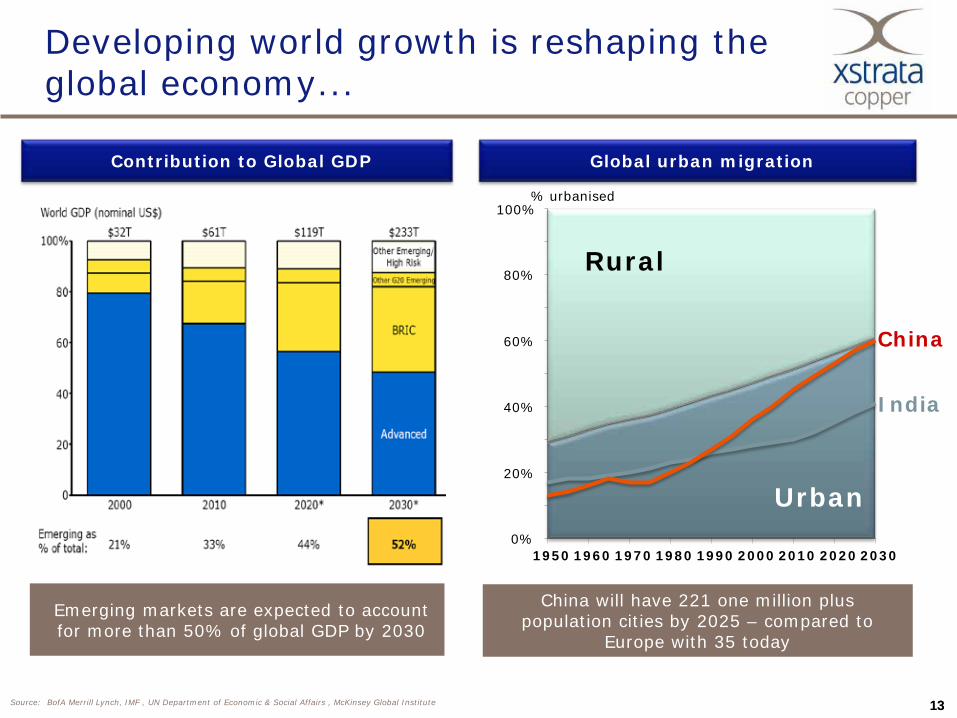
Developing world growth is reshaping the global economy...
Global urban migration
Source: BofA Merrill Lynch, IMF , UN Department of Economic & Social Affairs , McKinsey Global Institute
Contribution to Global GDP
Urban
Rural
India
China
0%
20%
40%
60%
80%
100%
1950 1960 1970 1980 1990 2000 2010 2020 2030
% urbanised
China will have 221 one million plus population cities by 2025 – compared to
Europe with 35 today
Emerging markets are expected to account for more than 50% of global GDP by 2030
1414
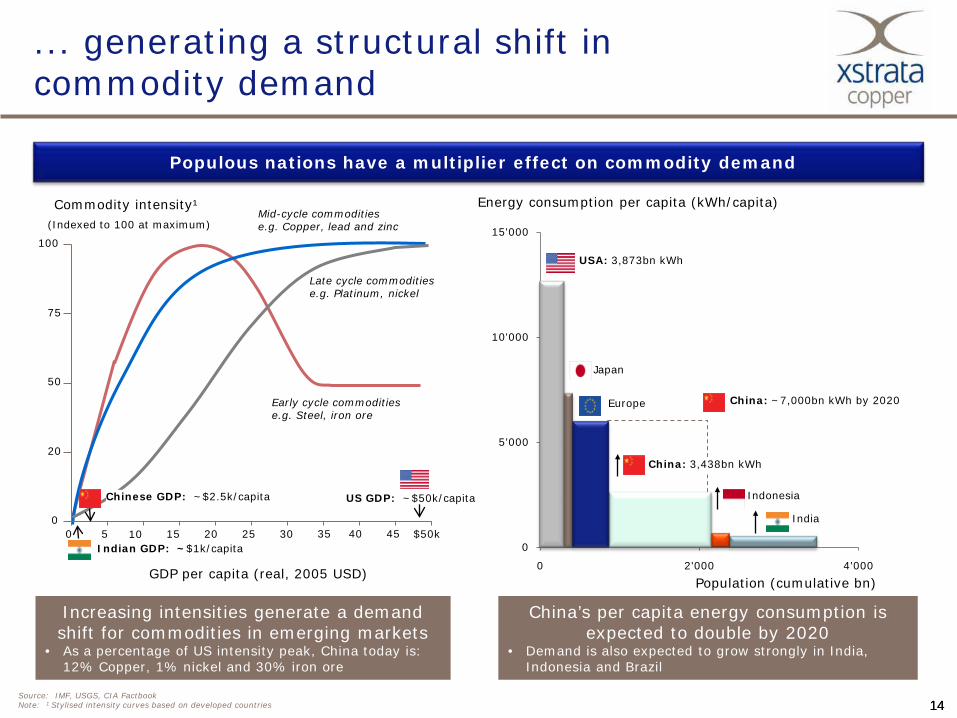
... generating a structural shift in commodity demand
Source: IMF, USGS, CIA FactbookNote: 1 Stylised intensity curves based on developed countries
0
5'000
10'000
15'000
0 2'000 4'000
Population (cumulative bn)
Energy consumption per capita (kWh/capita)
Populous nations have a multiplier effect on commodity demand
Indonesia
India
China: 3,438bn kWh
Japan
Europe
USA: 3,873bn kWh
China: ~7,000bn kWh by 2020
Commodity intensity¹(Indexed to 100 at maximum)
Mid-cycle commoditiese.g. Copper, lead and zinc
Late cycle commoditiese.g. Platinum, nickel
0
20
50
75
100
0 5 10 15 20 25 30 35 40 45 $50k
GDP per capita (real, 2005 USD)
Early cycle commoditiese.g. Steel, iron ore
Chinese GDP: ~$2.5k/capita
Indian GDP: ~$1k/capita
US GDP: ~$50k/capita
Increasing intensities generate a demand shift for commodities in emerging markets
• As a percentage of US intensity peak, China today is: 12% Copper, 1% nickel and 30% iron ore
China’s per capita energy consumption is expected to double by 2020
• Demand is also expected to grow strongly in India, Indonesia and Brazil
1515
-952 -917-987 -966
-800
-700
-1000
-900
-800
-700
-600
-500
-400
-300
-200
-100
02005 2006 2007 2008 2009 2010
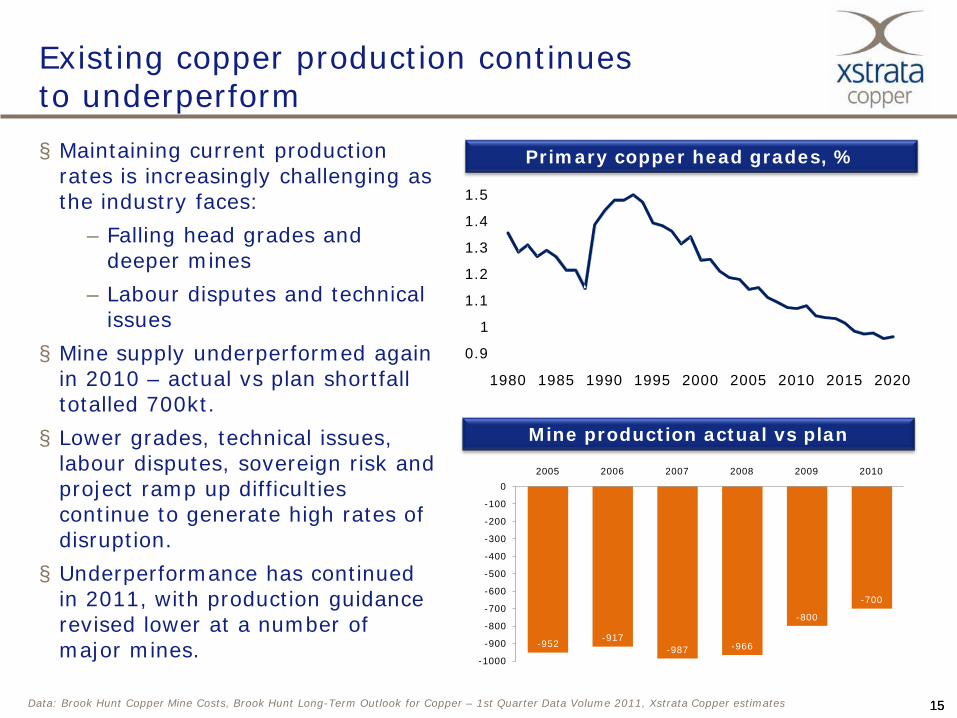
Existing copper production continues to underperform
0.9
1
1.1
1.2
1.3
1.4
1.5
1980 1985 1990 1995 2000 2005 2010 2015 2020
Primary copper head grades, %
Mine production actual vs plan
§ Maintaining current production rates is increasingly challenging as the industry faces:
– Falling head grades and deeper mines
– Labour disputes and technical issues
§ Mine supply underperformed again in 2010 – actual vs plan shortfall totalled 700kt.§ Lower grades, technical issues,
labour disputes, sovereign risk and project ramp up difficulties continue to generate high rates of disruption. § Underperformance has continued
in 2011, with production guidance revised lower at a number of major mines.
Data: Brook Hunt Copper Mine Costs, Brook Hunt Long-Term Outlook for Copper – 1st Quarter Data Volume 2011, Xstrata Copper estimates
1616
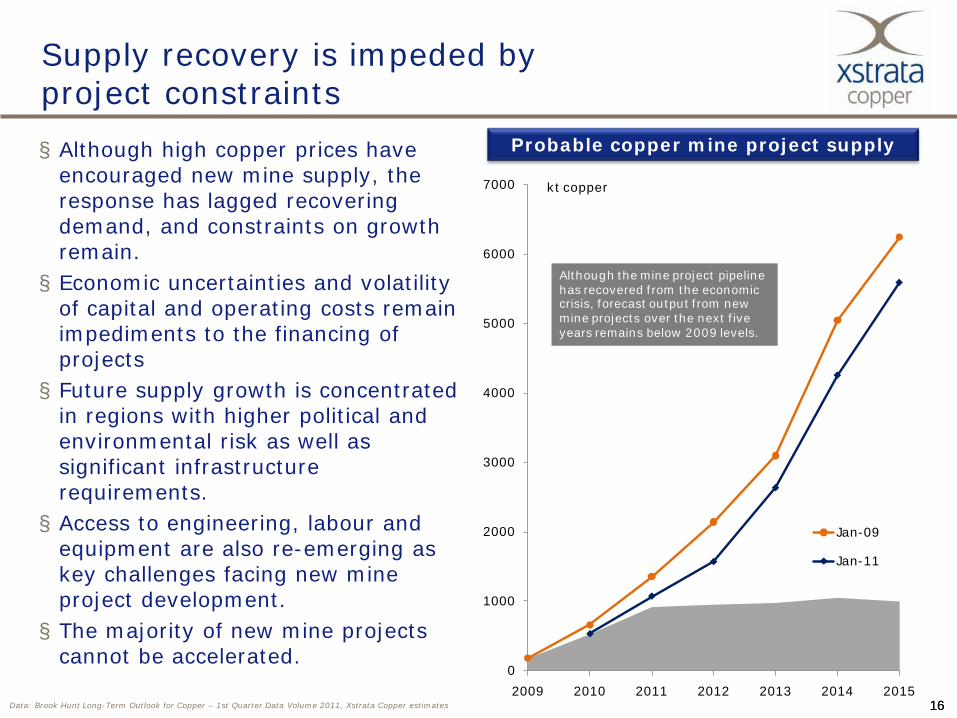
Supply recovery is impeded by project constraints
Probable copper mine project supply§ Although high copper prices have encouraged new mine supply, the response has lagged recovering demand, and constraints on growth remain. § Economic uncertainties and volatility
of capital and operating costs remain impediments to the financing of projects§ Future supply growth is concentrated
in regions with higher political and environmental risk as well as significant infrastructure requirements.§ Access to engineering, labour and
equipment are also re-emerging as key challenges facing new mine project development.§ The majority of new mine projects
cannot be accelerated.
Data: Brook Hunt Long-Term Outlook for Copper – 1st Quarter Data Volume 2011, Xstrata Copper estimates
0
1000
2000
3000
4000
5000
6000
7000
2009 2010 2011 2012 2013 2014 2015
Jan-09
Jan-11
Although the mine project pipeline has recovered from the economic crisis, forecast output from new mine projects over the next five years remains below 2009 levels.
kt copper
1717
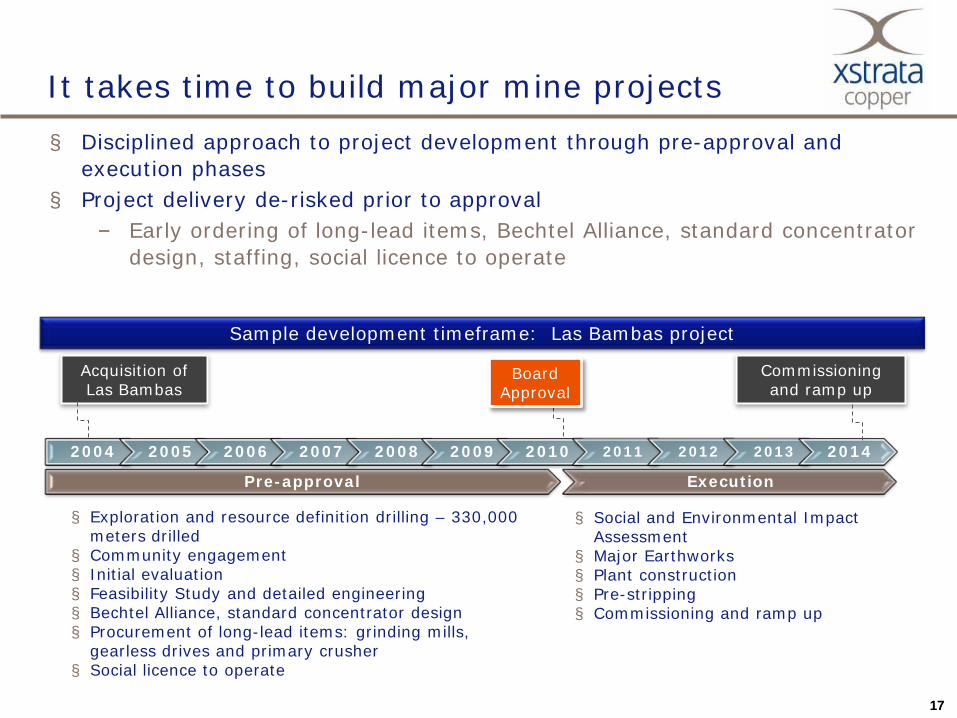
It takes time to build major mine projects§ Disciplined approach to project development through pre-approval and
execution phases§ Project delivery de-risked prior to approval
‒ Early ordering of long-lead items, Bechtel Alliance, standard concentrator design, staffing, social licence to operate
Sample development timeframe: Las Bambas project
2004 2005 2006 2007 2008 2009 2010 2011 2012 2013 2014
Pre-approval Execution
Board Approval
Acquisition of Las Bambas
Commissioning and ramp up
§ Exploration and resource definition drilling – 330,000 meters drilled
§ Community engagement§ Initial evaluation§ Feasibility Study and detailed engineering§ Bechtel Alliance, standard concentrator design§ Procurement of long-lead items: grinding mills,
gearless drives and primary crusher§ Social licence to operate
§ Social and Environmental Impact Assessment
§ Major Earthworks§ Plant construction§ Pre-stripping§ Commissioning and ramp up
1818
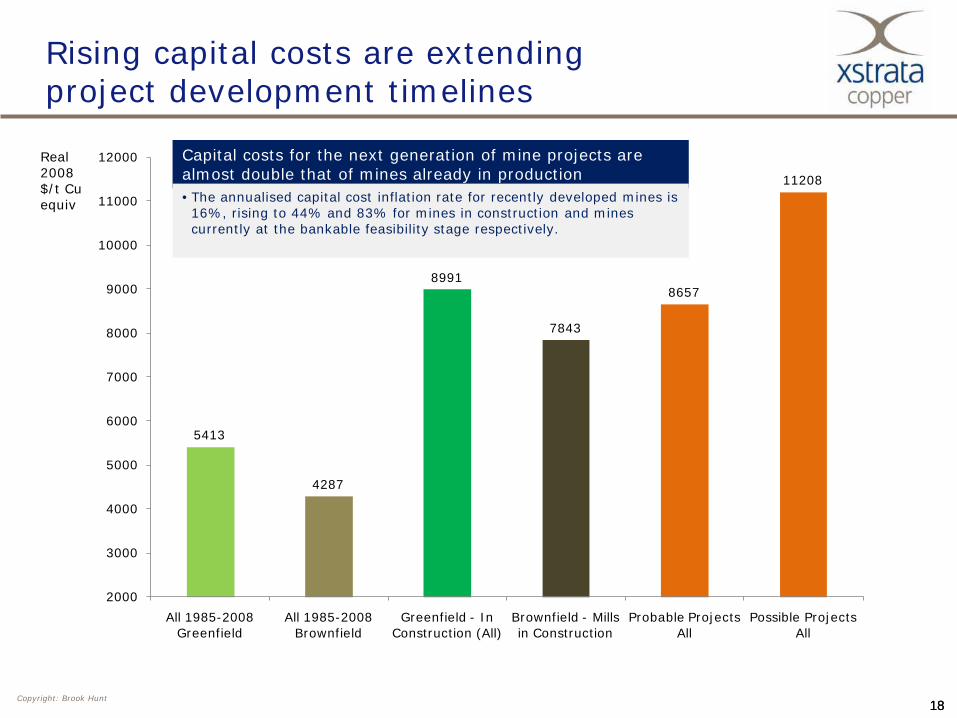
Rising capital costs are extending project development timelines
5413
4287
8991
7843
8657
11208
2000
3000
4000
5000
6000
7000
8000
9000
10000
11000
12000
All 1985-2008 Greenfield
All 1985-2008 Brownfield
Greenfield - In Construction (All)
Brownfield - Mills in Construction
Probable Projects All
Possible Projects All
Real 2008$/t Cu equiv
Capital costs for the next generation of mine projects are almost double that of mines already in production• The annualised capital cost inflation rate for recently developed mines is 16%, rising to 44% and 83% for mines in construction and mines currently at the bankable feasibility stage respectively.
Copyright: Brook Hunt
1919
0200400600800
100012001400160018002000
Q1 2007 Q1 2008 Q1 2009 Q1 2010 Q1 2011e
net imports
production
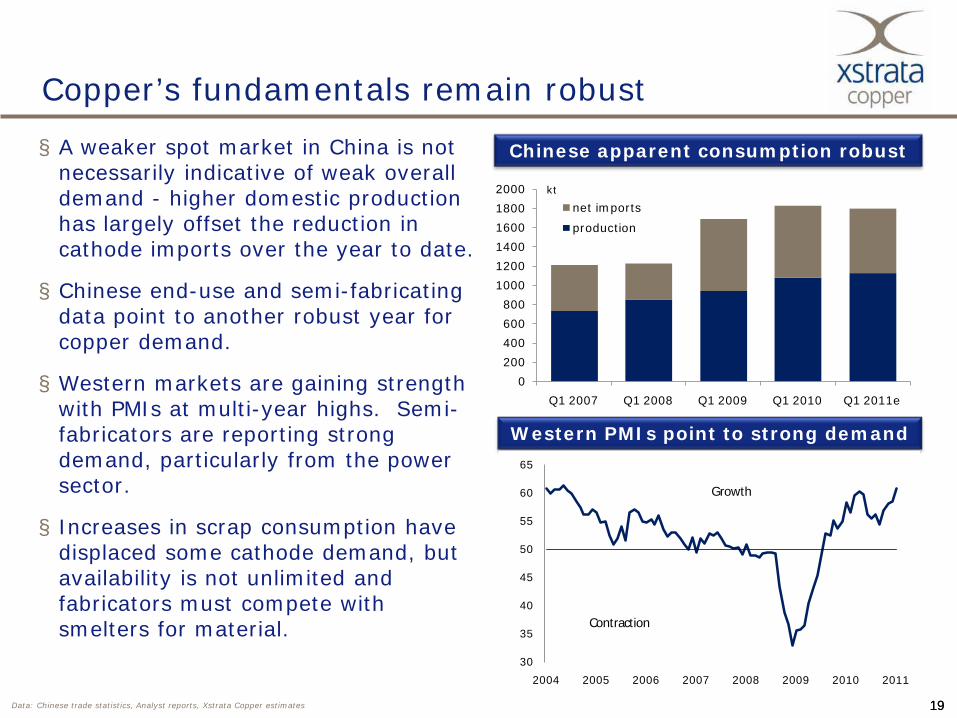
Copper’s fundamentals remain robust
Chinese apparent consumption robust
Western PMIs point to strong demand
§ A weaker spot market in China is not necessarily indicative of weak overall demand - higher domestic production has largely offset the reduction in cathode imports over the year to date.
§ Chinese end-use and semi-fabricating data point to another robust year for copper demand.
§ Western markets are gaining strength with PMIs at multi-year highs. Semi-fabricators are reporting strong demand, particularly from the power sector.
§ Increases in scrap consumption have displaced some cathode demand, but availability is not unlimited and fabricators must compete with smelters for material.
Data: Chinese trade statistics, Analyst reports, Xstrata Copper estimates
kt
30
35
40
45
50
55
60
65
2004 2005 2006 2007 2008 2009 2010 2011
Growth
Contraction
2020
Summary: Above trend copper pricing outlook remains intact
Demand§ Demand growth remains driven by developing economies, which are
investing heavily in copper-intensive sectors such as power infrastructure and construction § Demand in mature economies will see continued growth this year as the
economic recovery broadens.§ Although high prices may encourage some demand rationing; positive
substitution is also ongoing.
Supply§ High rates of disruption and underperformance among operating mines
continue to constrain supply.§ Although high prices have encouraged new projects, development hurdles
mean the risk of delays remains high.§ In the long term, the current pipeline of projects remains insufficient to
meet demand requirements.
21
Xstrata Copper Case Study:Ernest Henry
Myles Johnston, General Manager Ernest Henry Mining
22
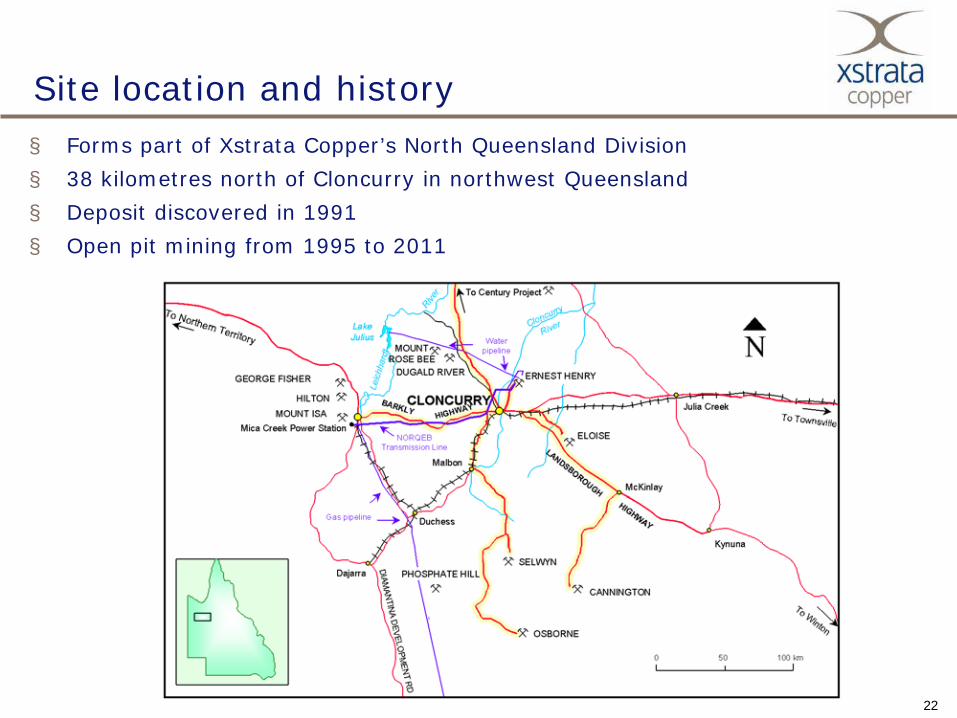
Site location and history§ Forms part of Xstrata Copper’s North Queensland Division§ 38 kilometres north of Cloncurry in northwest Queensland§ Deposit discovered in 1991§ Open pit mining from 1995 to 2011
23
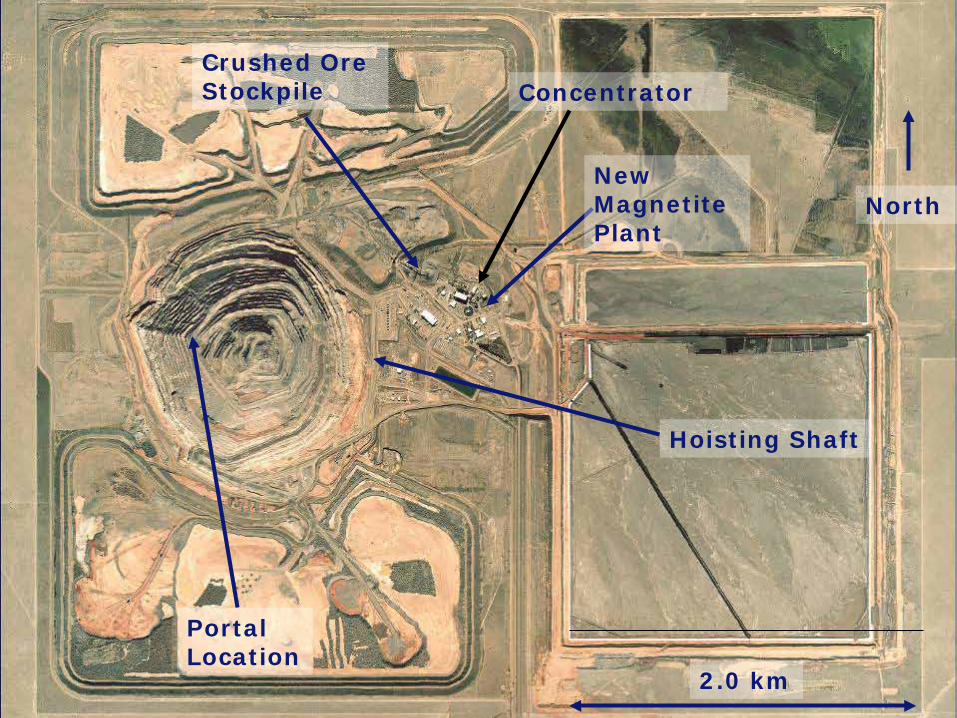
Portal Location
Hoisting Shaft
Concentrator
North
2.0 km
Crushed Ore Stockpile
New Magnetite Plant
24
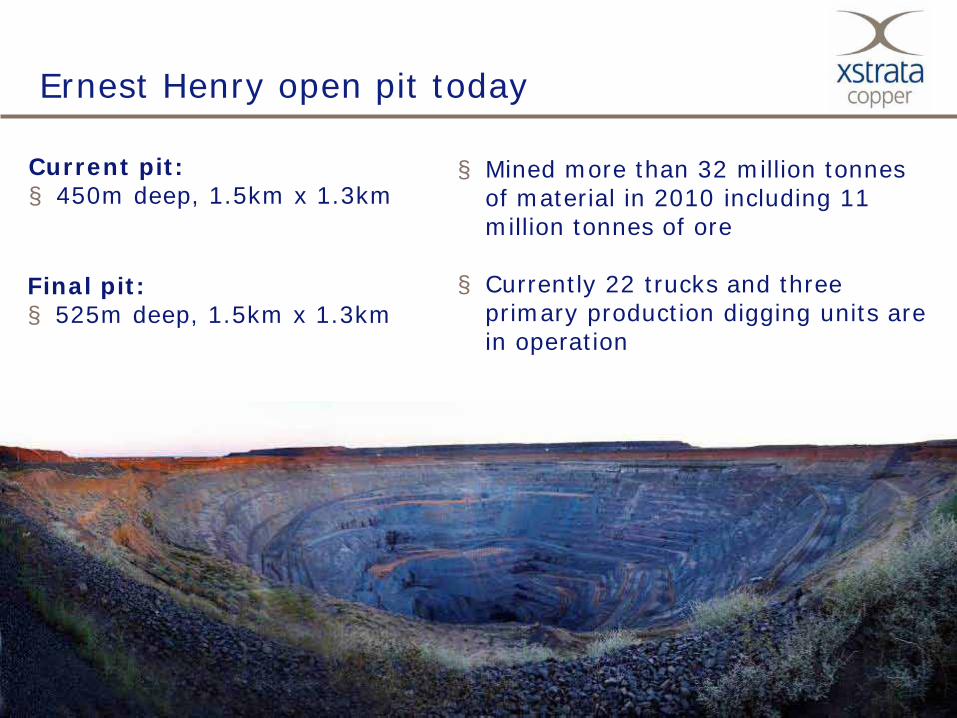
Ernest Henry open pit today
Final pit:§ 525m deep, 1.5km x 1.3km
Current pit:§ 450m deep, 1.5km x 1.3km
§ Mined more than 32 million tonnes of material in 2010 including 11 million tonnes of ore
§ Currently 22 trucks and three primary production digging units are in operation
25
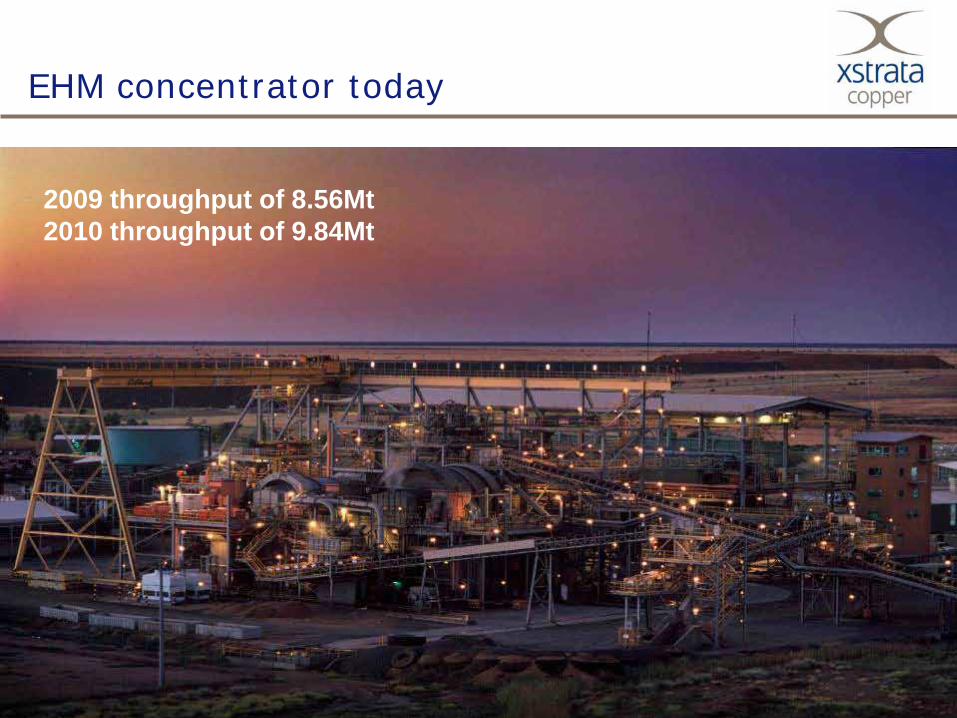
EHM concentrator today
2009 throughput of 8.56Mt2010 throughput of 9.84Mt
26
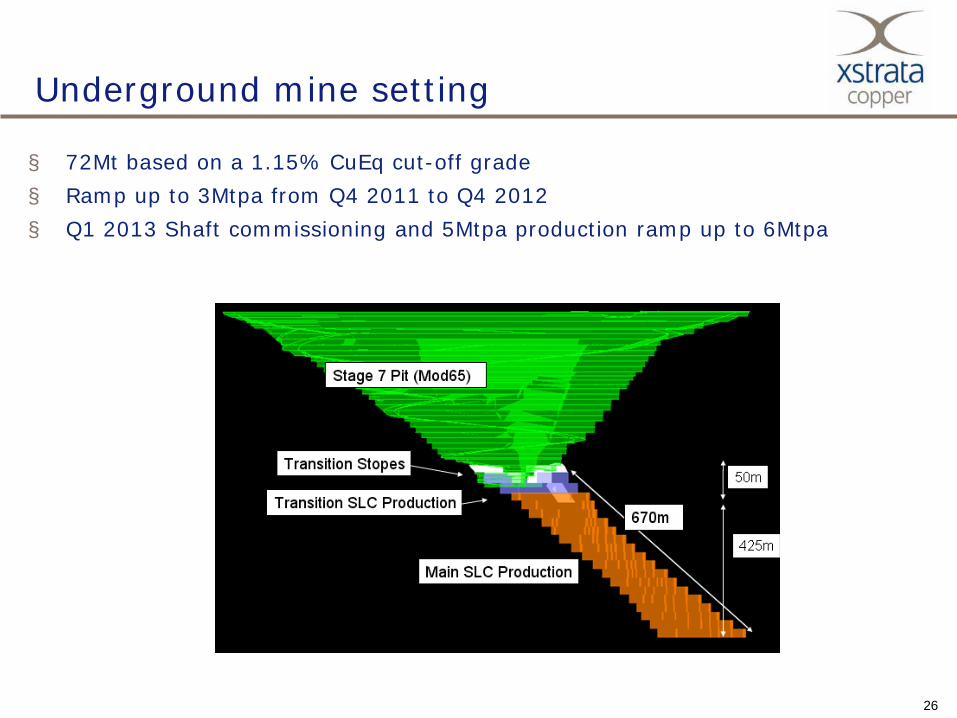
Underground mine setting
§ 72Mt based on a 1.15% CuEq cut-off grade§ Ramp up to 3Mtpa from Q4 2011 to Q4 2012§ Q1 2013 Shaft commissioning and 5Mtpa production ramp up to 6Mtpa
27
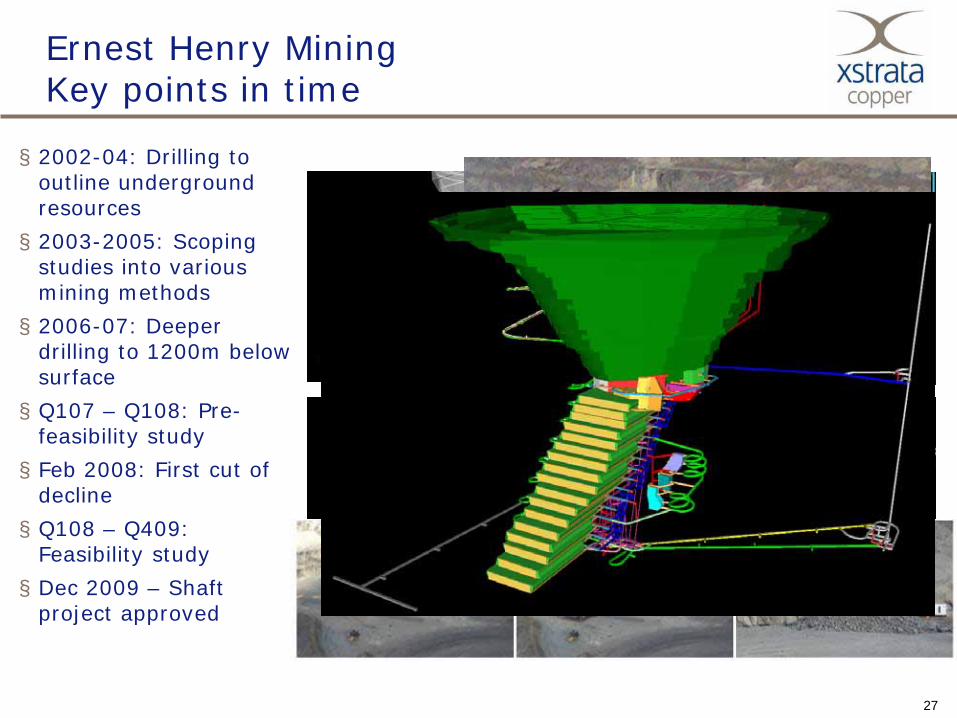
§ 2002-04: Drilling to outline underground resources§ 2003-2005: Scoping
studies into various mining methods§ 2006-07: Deeper
drilling to 1200m below surface§ Q107 – Q108: Pre-
feasibility study§ Feb 2008: First cut of
decline§ Q108 – Q409:
Feasibility study§ Dec 2009 – Shaft
project approved
Ernest Henry Mining Key points in time
28
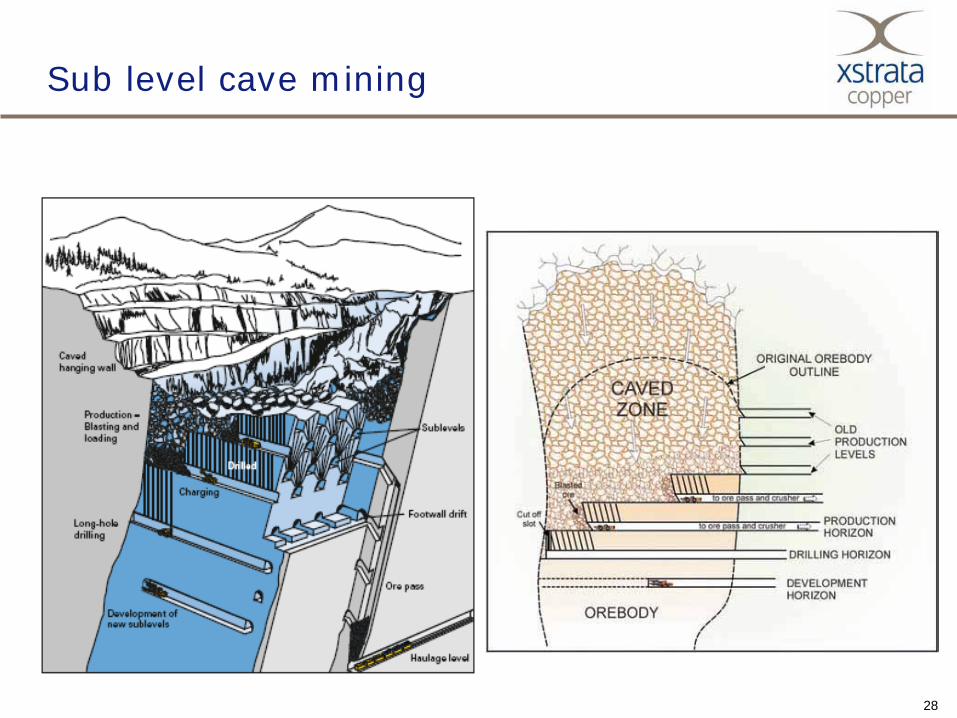
Sub level cave mining
29
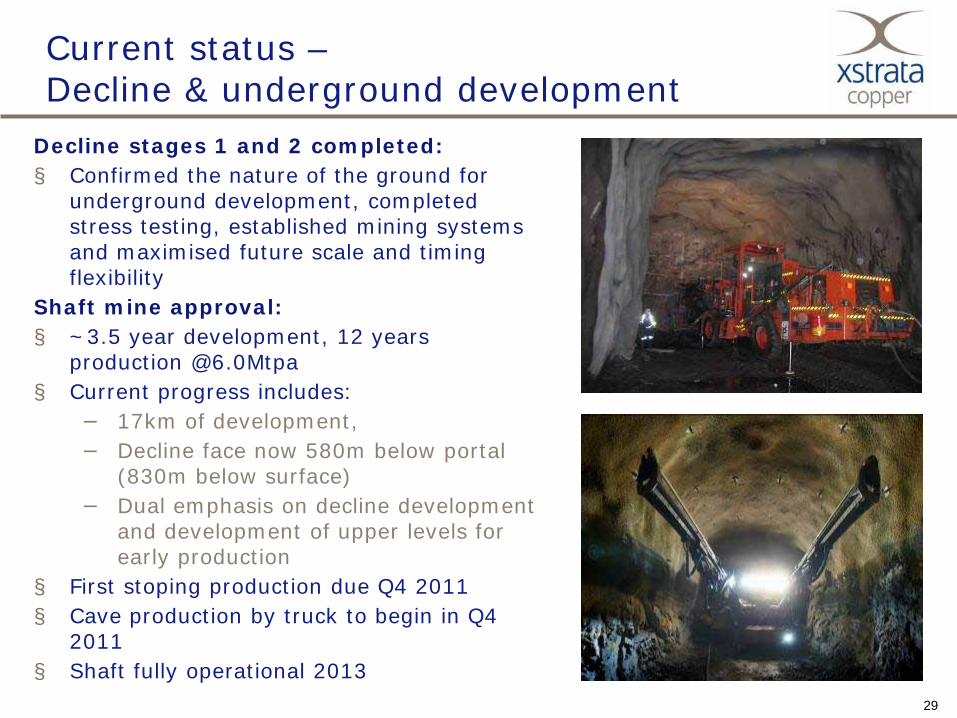
Current status –Decline & underground development
Decline stages 1 and 2 completed:§ Confirmed the nature of the ground for
underground development, completed stress testing, established mining systems and maximised future scale and timing flexibility
Shaft mine approval:§ ~3.5 year development, 12 years
production @6.0Mtpa§ Current progress includes:
− 17km of development, − Decline face now 580m below portal
(830m below surface)− Dual emphasis on decline development
and development of upper levels for early production
§ First stoping production due Q4 2011§ Cave production by truck to begin in Q4
2011§ Shaft fully operational 2013
30
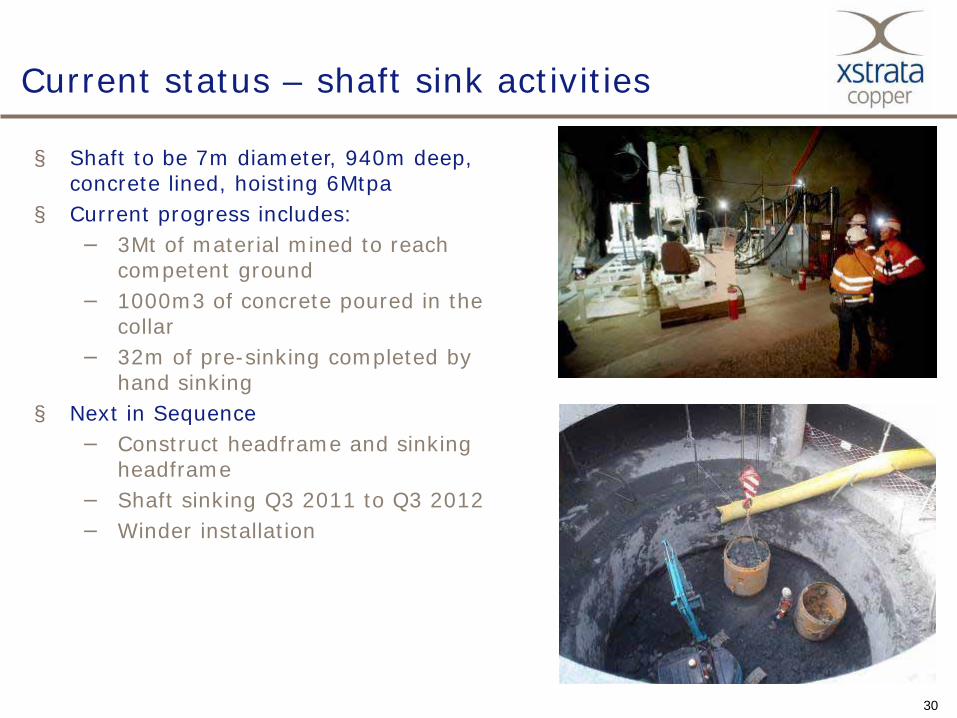
Current status – shaft sink activities
§ Shaft to be 7m diameter, 940m deep, concrete lined, hoisting 6Mtpa
§ Current progress includes:− 3Mt of material mined to reach
competent ground− 1000m3 of concrete poured in the
collar− 32m of pre-sinking completed by
hand sinking§ Next in Sequence
− Construct headframe and sinking headframe
− Shaft sinking Q3 2011 to Q3 2012− Winder installation
31
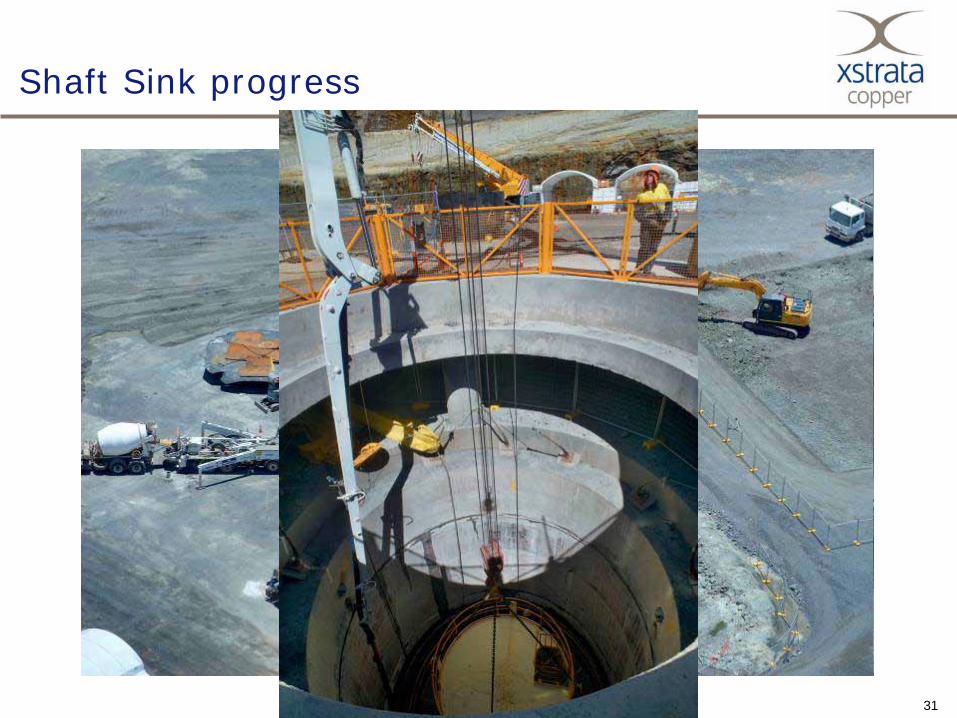
Shaft Sink progress
32
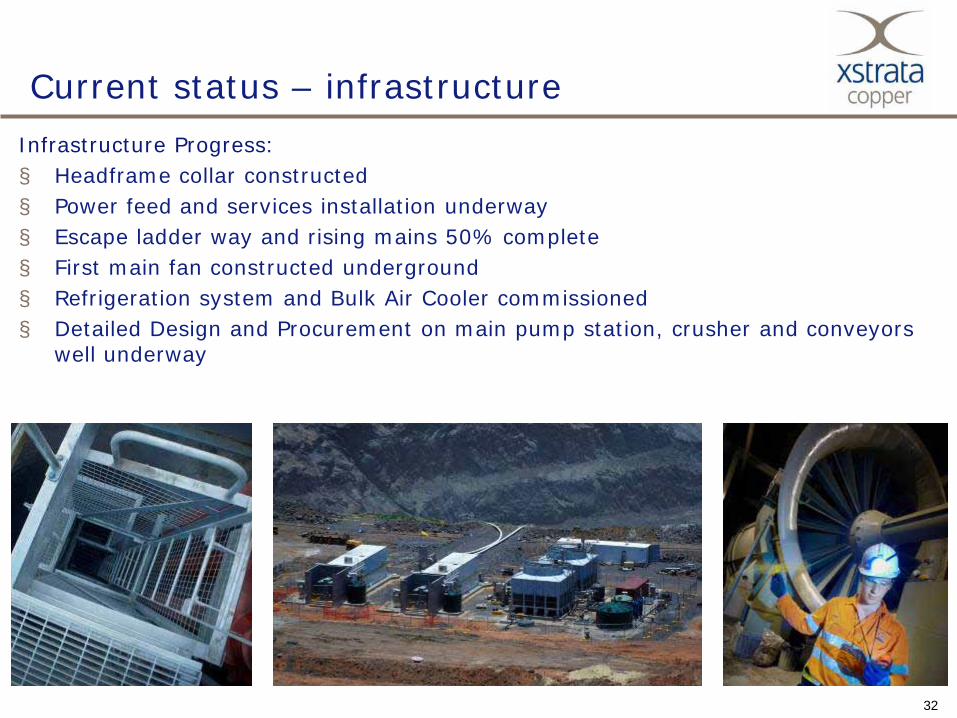
Current status – infrastructure Infrastructure Progress:§ Headframe collar constructed§ Power feed and services installation underway§ Escape ladder way and rising mains 50% complete§ First main fan constructed underground§ Refrigeration system and Bulk Air Cooler commissioned§ Detailed Design and Procurement on main pump station, crusher and conveyors
well underway
33
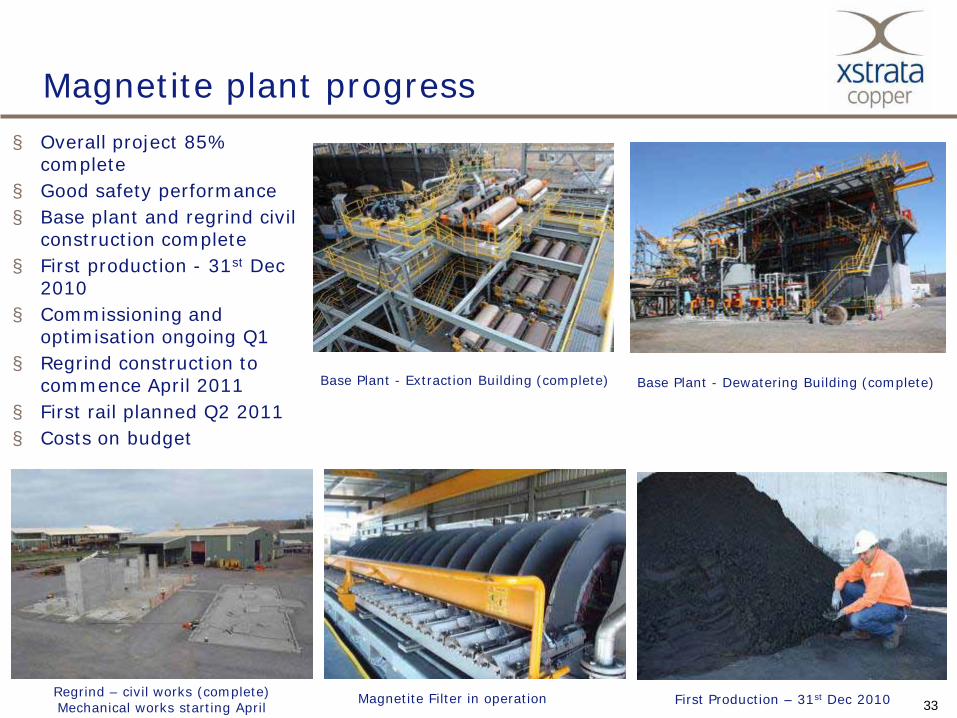
Magnetite plant progress
Base Plant - Dewatering Building (complete)
First Production – 31st Dec 2010
Base Plant - Extraction Building (complete)
Magnetite Filter in operation
§ Overall project 85% complete
§ Good safety performance§ Base plant and regrind civil
construction complete§ First production - 31st Dec
2010§ Commissioning and
optimisation ongoing Q1§ Regrind construction to
commence April 2011§ First rail planned Q2 2011 § Costs on budget
Regrind – civil works (complete) Mechanical works starting April
34
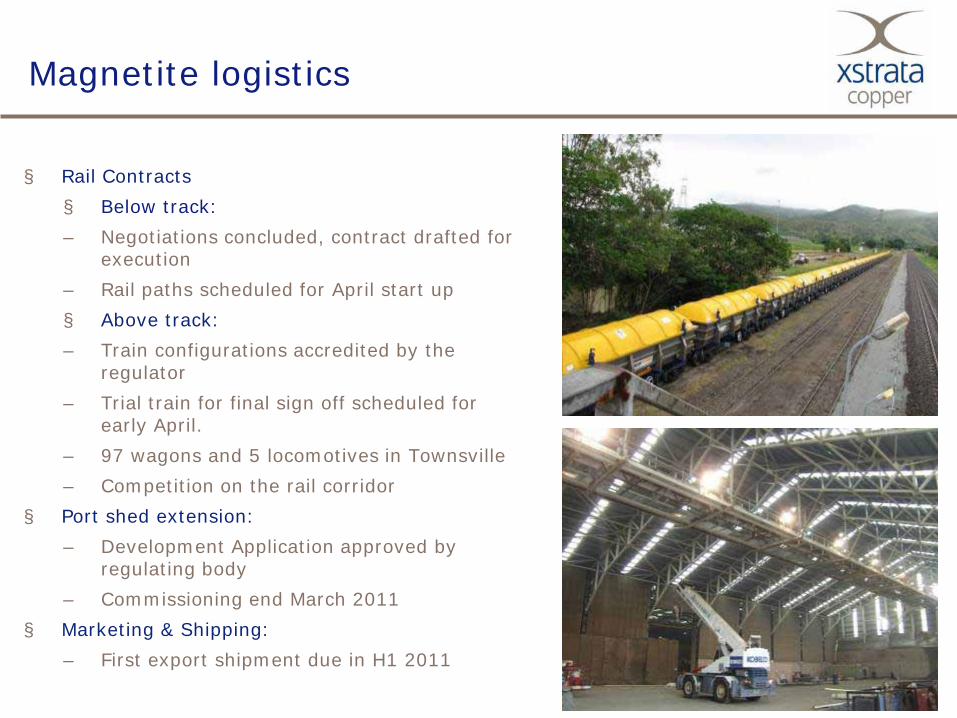
Magnetite logistics
§ Rail Contracts§ Below track: – Negotiations concluded, contract drafted for
execution– Rail paths scheduled for April start up§ Above track:– Train configurations accredited by the
regulator– Trial train for final sign off scheduled for
early April.– 97 wagons and 5 locomotives in Townsville– Competition on the rail corridor
§ Port shed extension:– Development Application approved by
regulating body– Commissioning end March 2011
§ Marketing & Shipping:– First export shipment due in H1 2011
35
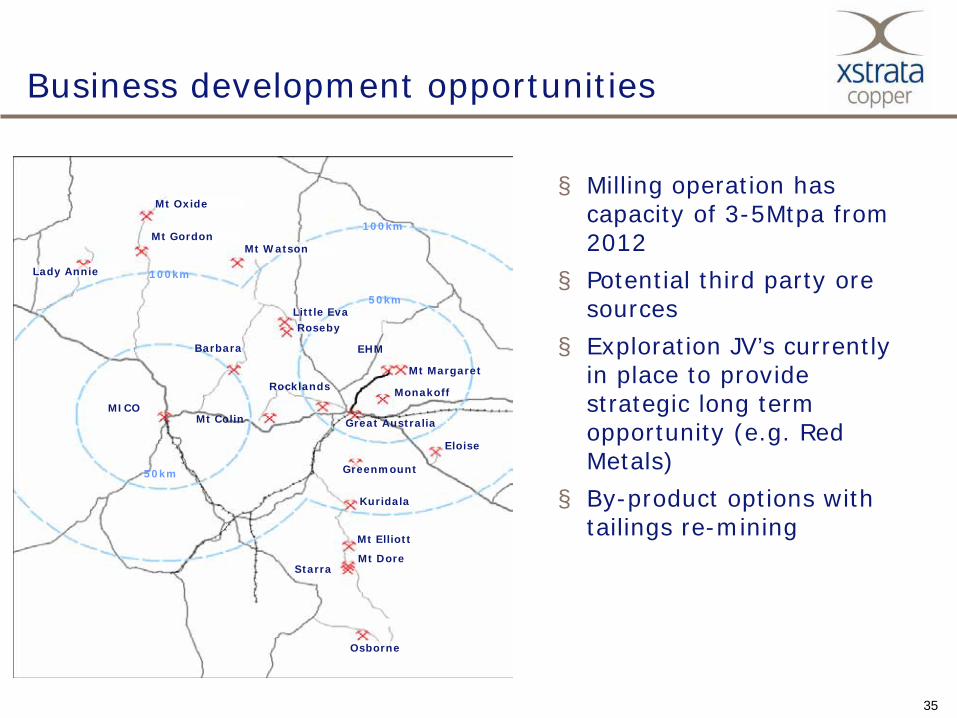
Business development opportunities
§ Milling operation has capacity of 3-5Mtpa from 2012
§ Potential third party ore sources
§ Exploration JV’s currently in place to provide strategic long term opportunity (e.g. Red Metals)
§ By-product options with tailings re-mining
Mt Oxide
Mt Gordon
Lady Annie
Mt Watson
Roseby
EHM
Mt Margaret
Eloise
Osborne
StarraMt Dore
Mt Elliott
Kuridala
Greenmount
Mt Colin
Rocklands
Great Australia
Barbara
MICOMonakoff
50km
50km
100km
100km
Little Eva
36
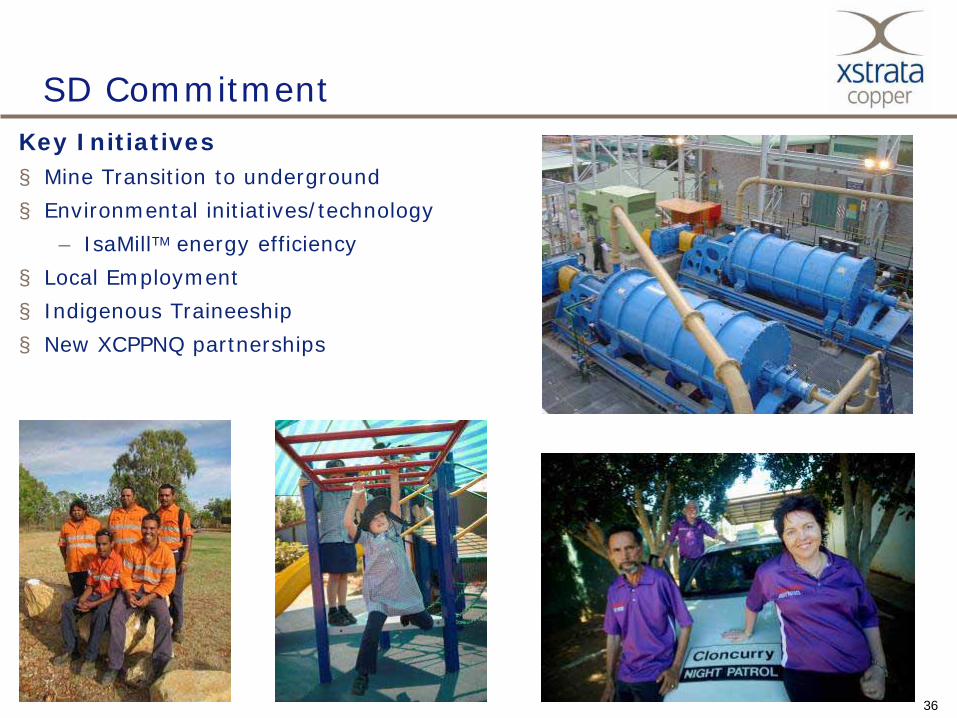
SD Commitment Key Initiatives§ Mine Transition to underground§ Environmental initiatives/technology
– IsaMillTM energy efficiency§ Local Employment§ Indigenous Traineeship§ New XCPPNQ partnerships
37
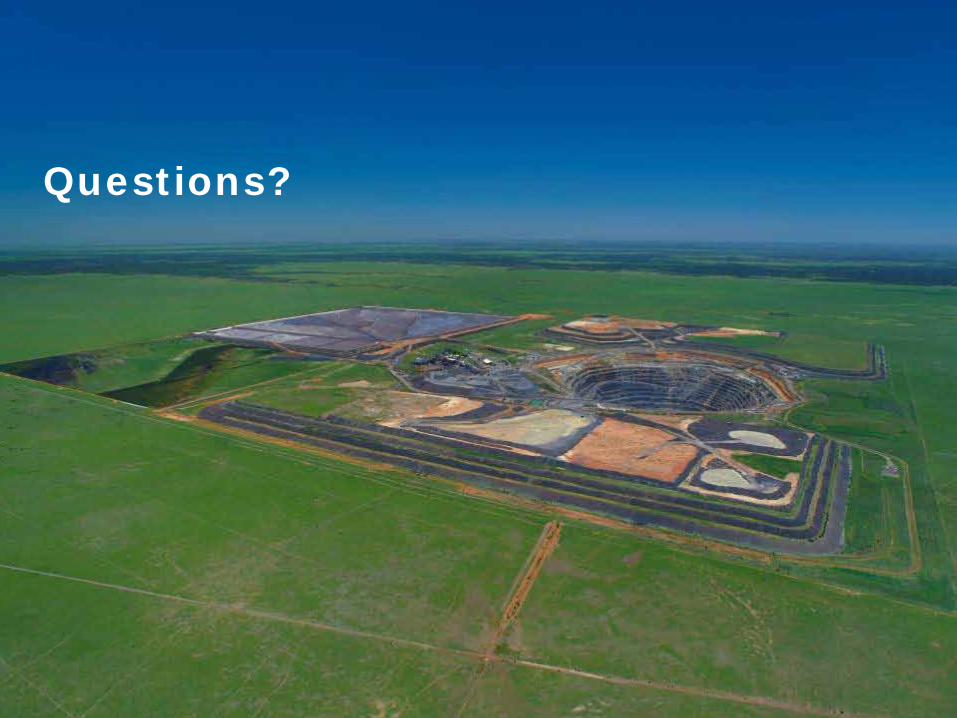
Questions?
38
Xstrata plcBloomberg: XTA LN Equity
Reuters: XTA.L
Websites: www.xstrata.com
www.xstratacopper.com
Xstrata Copper Head Office:Level 9, Riverside Centre
123 Eagle Street, GPO Box 1433Brisbane, Queensland