transformation of a production/assembly washing … · transformation of a production/assembly...
TRANSCRIPT
Transformation of a production/assembly washing machine lines into a Lean Manufacturing System
E. ROMANO, L.C. SANTILLO, P. ZOPPOLI
Department of Materials Engineering and Operations Management University of Naples “Federico II” Piazzale Tecchio – 80125 NAPOLI
ITALY [email protected], [email protected], [email protected] http://www.impianti.unina.it.
Abstract: - The scope of this work is the complete re-organization of production flow according to the Lean Thinking philosophy for the industrial applications. The complete re-organization implementation of material flow management has been performed through the supermarket sizing which replenishment kanban logic has been adopted. To implement this strategy the goal is to achieve "Interdependent connected Processes" adopting the Pull System methodology in the Just in Time production environment. From the narrow sense the JIT manufacturing philosophy is to produce the right quantity at the right time with the right quantity level. In JIT the production is triggered by a kanban signal, which comes from the costumer order or the master production schedule, the signal then flowing backwards. By implementing JIT concepts in manufacturing, many of the practitioners experience advantages such as shorter lead times, fewer inventories, and higher quality. In the case study, developed in the Whirlpool Europe Naples factory, we have a first stage that consists of sizing the amount of "Kanban reintegration" codes, and the second stage in which we have simulated with ARENA and verified the progress of production flow in the hypothesized system, that has underlined the improvement of the business performances and great flexibility. Key-Words: - pull system, kanban, simulation, supermarket pull, Sequential Learning, pattern production schedule. 1 Introduction In modern environments, characterized by high complexity and turbulence, the traditional Ford-like approach of uncoupling production with the market, father of the mass production, cannot work anymore [1]. The lean production aims to make production and market moving at the same time using a batch of management techniques that will give the start to the following approaches: Just in Time, Total Quality Management and Concurrent Engineering. The Japanese experience [2, 3, 4, 5] has shown that the most critical aspect is not related to the specific technological feature, but is related to the organization of the manufacturing process flow. The lean production enabled an increase in terms of flexibility to new market requests (range of the responses offered ex-ante) moving this task to the on multi-capability of the workforce and rearranging, with flows and for processes, the overall enterprise activity, from development to manufacturing and finally to the distribution. It can noted that there was an increase also of time flexibility thanks to a slight usage, of the industrial
automation. The same product continuous innovations are helped by the integration of the new flexibility features and of the human resource involvement, generally arranged in inter-functional teams, in problem solving activities, becoming a competitive advantage for the manufacturers that are capable of reengineering the organizations according to the new criteria. The philosophy of the waste hunting is based on the main principle of creating a “Continuous Process Flow”, a strategy to implement this goal is that one that tends to generate “Interdependent connected Processes” using “Pull System” approach that is strictly related to the Just in Time production idea [8, 9, 10]. The objective of the “continuous flow” that is the waste elimination in every phase, also known as “one-piece flow”, is an ideal state, where every single operation is done only if requested from the next one. If for whatever reason the next operation did not request the up-streamed one the process is stopped to avoid the overproduction that is, according to Ohno, the worst waste [12]. This logics is implemented with the “pure” Pull System. In the systems that are willing
WSEAS TRANSACTIONS on SYSTEMS and CONTROL E. Romano, L. C. Santillo, P. Zoppoli
ISSN: 1991-8763 65 Issue 2, Volume 4, February 2009
to move towards the PULL, on the contrary, everything starts with an order that pulls the production from each cell, with systems using the JIT production, Just in Time, that is achieved using the KANBAN, creating the minimum number of uncoupling inventories and allowing to work towards the optimization of the throughput times of each single cell. It is wanted the production on one piece at time moving it from one process to another without waits; but connecting processes means lead time reduction and waits: therefore the flow is extended more and more that the process reliability increases and the waiting times like set-ups decrease. Moreover, there are areas one-piece flow is not possible, e.g. when frequent set-ups are needed or because suppliers send parts in batch. In this case it should be avoided the planning (push approach) because it would mean only estimating and not knowing what the next process or customer in reality need. On the contrary it can be checked the production implementing Pull/Push interfaces; a first solution could be a system based on “replenishment” kanban system supplying “downstream processes known as: • Supermarket Pull, where the continuous flow is
broken and the upstream processes working in batch following “pattern production”, i.e. a fixed sequence from the upstream production area itself. This approach enables to control the production among the flows and aims to supply accurate instructions of production to the upstream processes without planning based upon the potential downstream requests. When it is not possible to have a product stock, because of the high customization requested or for the high costs or for phase-out matters, or when we got a better synchronization between up and down streams, we got the following available options to the supermarket pull system:
• Sequenced Pull: the supply process produces a fixed quantity in a fixed sequence from the downstream shop directly in front of an order from the customer process (JIS, Just in Sequence).
• Fifo lane (or FiFo sequenced or ConWip): it contains constant quantity in stock in a FIFO sequence and it is placed between the upstream supply process and the downstream customer process, hence if the lane is full the first process should not produce until the second one has not used party of the available stock. In this way it is avoided upstream process overproduction.
In the “flow” standpoint, it can be seen the above mentioned control tools of the materials as next steps towards the “one-piece-flow” ideal state, this
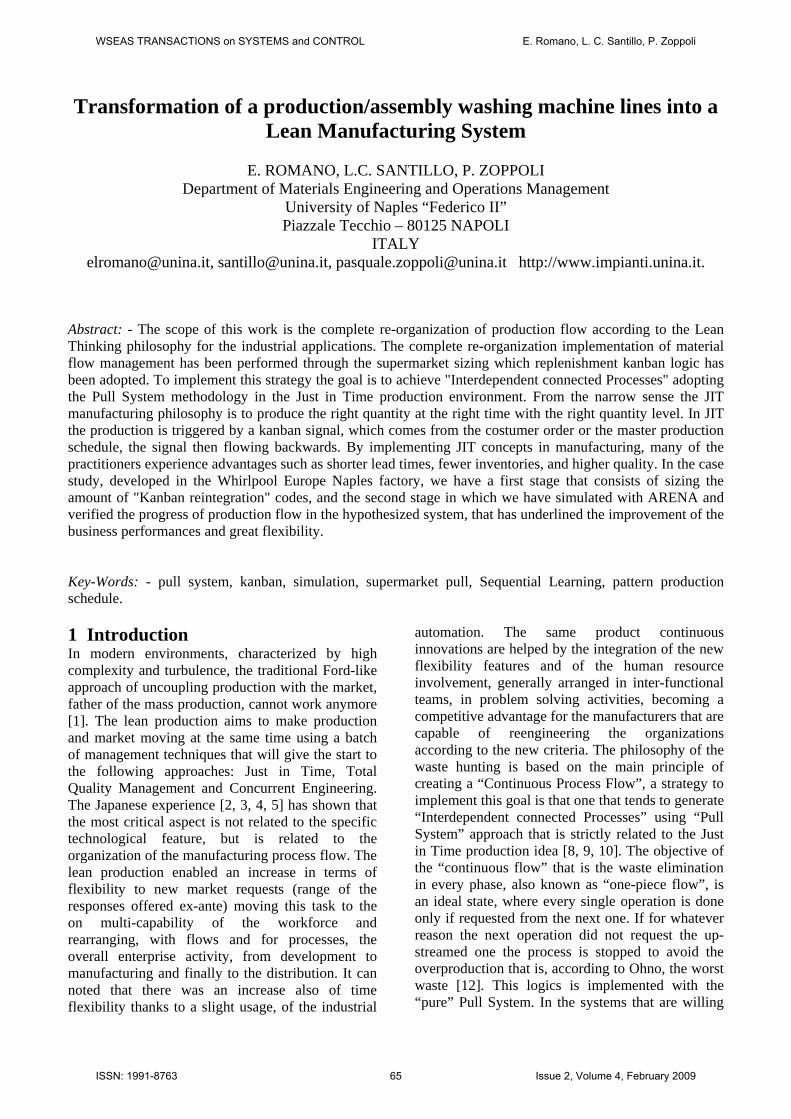
is to say that the “Supermarket” set-up is the first step to this production kind and the FIFO lane is a systems that guarantees a near to ideal material flow [13, 14, 15] (Fig. 1).
Fig. 1: Logic flow from push to pull production 2 Literature review Studies of the influence of a kanban system in a JIT manufacturing system have been a popular topic. Many research have focused on finding the optimal number or size of kanbans in production systems. Studies on JIT system can be classified in two categories: • Evaluations on the performance of JIT systems
in terms of system parameters such as makespan, inventory level, machine utilization and carrying cost;
• Comparison between the traditional Push-type and kanban based on pull manufacturing systems.
Chan and Tang [27] compared the performance of the push and pull systems via simulation approaches. Huang and Kusiak [28] gave an overview and a detail description of three kinds of JIT systems, namely, single, dual and semi dual kanban card systems. Berkley [29] developed simulation models to determine the minimum number of kanbans in achieving a desired production rate. He concluded their study that the optimal number of kanbans can be determined only at trade – offs between costs of frequent material handling and the benefits of lower WIP level. Savsar [30] carried out a study on the optimal kanban size for production in an electronic assembly line. A simulation model was built by Siman for analysis, the kanban size in this case being fixed, instead the number of kanban being varied in order to find the optimal number of kanbans for production to fulfill the weekly demand. The integration of manufacturing information in the JIT systems was investigated by Pourbabai [31]. Mathematical programming models were used to minimize the system objectives, such as maximum
TRADITIONAL IDEAL STATE
Push or Scheduled
Supermarket Pull
Sequenced
Pull (Broadcast)
FIFO Sequenced
Continuous Flow
WSEAS TRANSACTIONS on SYSTEMS and CONTROL E. Romano, L. C. Santillo, P. Zoppoli
ISSN: 1991-8763 66 Issue 2, Volume 4, February 2009

tardiness and makespan. Anwar and Nagi [32] proposed a different point of view to the common belief of best JIT strategy. In their paper they found that the product makespan and the production cost could be reduced further if efficient lot grouping combined with scheduling is adopted. The scheduling problem was solved by integrated mathematical programming and heuristic algorithm techniques. The impact of advance demand information on inventory cost has been investigated by many researchers, but only a few papers focus on a continuous review pull production system. Cohen et al. (1988) is among the first that discusses an inventory system with two different customer classes. Their paper presents a periodic review inventory replenishment model with emergency and non-emergency demands, where priority is given to the emergency shipments in case of insufficient stock. Chen (2001) [37] has a nice argument that the relative preference for unplanned delay by the planned-delay customers (good planer) and the no-planned-delay customers (bad planner) is not easy to determine. Hariharan and Zipkin (1995) [41] coined the term ‘demand Lead time’ and showed that the demand lead time acts to negate the effect of replenishment lead time in a manufacturing system. However, they assume that all the customers are providing the advance order information and the customers do not accept delivery before the specified due dates which are against the assumptions we make. The same assumption of prohibiting early demand fulfillment is made by Gallego and Ozer (2001) [40], where they describe an inventory policy to satisfy customers with different demand lead time. The paper assumes that the replenishment lead time is constant. It focuses on managing inventory in a situation where orders are placed by a firm to replenish the stock. But our concern is a shop floor control that utilizes the advance demand information to improve the service level. As the time spent by the jobs at the servers are stochastic, we cannot afford to assume a constant replenishment time. Karaesmen et al. (2002) [43] describe a single stage production system with a finished good inventory where all the customers provide same amount of advance demand information. They developed a part release policy that minimizes combined holding and backordering cost. A model of serving two different customer classes having different lead time is discussed by Wang et al. (2002) [46], although it considers a multi-echelon distribution network and not a production system. This paper maintains the same assumption that less priority demands will not be
shipped until the elapse of demand lead time. In the context of two demand classes, a periodic review inventory system is discussed by Frank et al. (2003) [39], where all the deterministic demands must be satisfied and the firm may not satisfy the stochastic demands, even if stocks are available in the inventory. It discusses a situation where the firm tries to avoid setup by reserving a certain amount of inventory for the future deterministic demand. However, their model is different from our two demand classes based upon lead time. The restriction on early fulfillment of orders, which is assumed by some of the papers discussed so far, is relaxed by Karaesmen et al. (2004) [44], where a single stage make-to-stock system has been considered with equal demand lead time for all the customers. They identified the conditions under which using advance demand information will be significantly beneficial. Wijngaard (2004) [47] derived an expression for the possible inventory reduction by using advance demand information. Two recent papers (Krishnamurthy and Claudio, 2005 [45]; Liberopoulos and Koukoumialos, 2005 [42]) discuss about the effect of various design parameters on the performance of a pull production system which utilizes advance demand information. Although none of these papers considers different customer classes based on the amount of advance demand information they are providing, the papers are still relevant as they demonstrate the cost advantage of using advance demand information through some simulation experiments. Both the papers describe a system that does not satisfy any demand before the elapse of demand lead time, that means early demand fulfillment is not permitted. The paper by Liberopoulos and Koukoumialos (2005) [42] evaluates the optimal base stock level that minimizes a given holding and backordering cost. One of the key finding by these papers is that the ADI will help to improve service level, without any significantly increase in WIP or finished good inventory. Finally Chan [33] investigates the effect of varying kanban size on the performance of JIT manufacturing systems. He used a simulation approach to determine the performance measures. 3 Problem Formulation The Kanban is a signal of product availability that needs to be managed, each production line should be done by a well delimited space or by a rack, we generally speak of “Supermarket”, in a way that an easy visual check could be easily carried out. The stock level among the different products is directly connected to the kanban number running around;
WSEAS TRANSACTIONS on SYSTEMS and CONTROL E. Romano, L. C. Santillo, P. Zoppoli
ISSN: 1991-8763 67 Issue 2, Volume 4, February 2009

the main objective is to minimize the number of kanbans used. In case that the shop should produce different part codes, the priority is given by the urgency given by the kanban rack. The different rack columns (one for each part code) are divide in 3 zones: the cards for each code are inserted from up to down taking each time zones related to increasing urgency. The operator should produce that code in which cards are in the more urgency positions compared with all the other codes. The parts of the same types are sequenced for the following two main reasons: • F.I.F.O. (First In First Out) management, first
material in, first to be processed; • To streamline tare the replenishment of the
missing codes. The material quantities are strictly established based upon the requests from the customer cell: the codes placed in the supermarket have a high rotation rate and do not wait for more than a prefixed time inside it. The upstream production then is pulled by the part code request in order to reintegrate the supermarket, avoiding storage of materials and delivery delays. With the creation of supermarkets, the codes more used from the line are already present in the cell and in suitable quantities, optimizing the space around the line in order to help the production changes, that mean that the production is managed with a pull system using kanban and supermarket, where the continuous flow is broken and the upstream process works based on batch according to a “pattern production”, that is a fixed production sequence to minimize the set-up and Change Over (C/O) times. The replenishment logic (Fig. 2) foresees that for withdrawal by “Customer Process” corresponds a signal of replenishment, using a production card, that is collected in a suitable location that make it visible that codes have being used and then, picked form that rack to give the production start to replenish codes, according to the fixed rules of the upstream shop; if indeed we imagine a pattern of production as a wheel, as we are used to seeing in practice, the cards for each part code will give the start to the production according to fixed quantities defined by the wheel itself. Then the codes supermarket replenishment will start, in specific locations, in fixed quantities defined by each kanban and with each card connected to the package. In this way the Customer process has always the requested code available in the right and expected place supermarket.
Fig. 2: The material replenishment logic with supermarket and Pattern Production 3 Experimental Design To put in place the right the appropriate kanban control system implies firstly to define the number of cards (and then racks) needed. In reality they create a material lock-up, in order to limit the stocked parts that mean reducing the interpretational stocks, and then reduce the unused money. On the other hand those stocks allow a safe condition form potential line downtimes (both up and down streams). It means that we need to find the better trade off between costs related to stocks and the ones related to line stops. The general rule for the sizing consists in assuring the production fulfilment at a average rate of (Tcop) in front of the safe level that we need to guarantee. Tcop could correspond to, for example, production lead time of a specific production code, or different time interval related to the different safety level, or, could be related to the length of the time interval that is connected to the time needed to complete a cycle form from the consumption point of the specific material to the point of the material replenishment and the related coming back. Following there is a formal and general approach to the supermarket sizing. In order to create a supermarket for each production cell it is needed to gather some information related as the following: 1. drum code to be placed in the supermarket; 2. quantity to keep in the supermarket; 3. available space aside each cell; 4. type and dimensions of the material packaging. 3.1 Case Study: Whirlpool Naples Factory Naples Factory produces Frontloader Washing. Production capability of the plant if around (more than) 1.000.000 of units/year. This volume could be increased or decreased of 20% i.e.: reduced working time form one side, the increase of the working days, additional workforce and extra-time from the other side. The Frontloader Washer range currently produced in Naples has been updated from the long time lasting
WSEAS TRANSACTIONS on SYSTEMS and CONTROL E. Romano, L. C. Santillo, P. Zoppoli
ISSN: 1991-8763 68 Issue 2, Volume 4, February 2009

model called Delta to a new platform called Eureka. This new range has in common the electronic program selector (timer) compared with the former platform Delta, new features and options are available. Looking to only technical aspect, 2 main differentiation parameters could be considered:
Drum Volume (both in kg and liters) Drum Max round Speed (rpm).
The possible values are listed in the following Tab. 1; instead in Tab. 2 it could be found different possible drum volume and round speed combinations. Tab. 1: Drum speed an capacity
Drum speed (round per minutes - rpm) 600 800 1000 1200 1400 1600 capacità del cestello (litri) 42 48 50 53 55 60
Tab. 2: Relation from drum liters and speed
Liters 50 54 58 64
rpm
800 1000 1200 1400 1600
800 1000120014001600
1000 1200 1400 1600
1000 1200 1400 1600
Of course for each specific combination, different drums, tubs and motors are needed in order to assure reliable declared performances. In the specific we have 2 drum types: 473 e 490. Among other differentiation features there is also the color; white is the most market requested, but UK market also asks for Silver cabinet models. The Main components of a Washing Machine are the following ones (Fig. 3): tub, motor, Heating Element, Counterweight, dumpers, Control Panel, Drain Pump, timer, Soap Dispenser, Pressure Switch, valves, hoses, Door, Table Top.
Fig. 3: Product and components representation The Bill of material is made by around 210 parts, gathered in 8 classes: 1) cabinet; 2) drum; 3) Timer with Harness;
4) motor; 5) PP Tub; 6) Rubber parts; 7) Electrical parts; 8) Aesthetical parts and small auxiliary parts. To understand the production process and the material flow, it could be worth to outline as did in Fig. 4. The main production phases of the primary processes are: 1) Raw Material Supply. It looks after the
procurement of the raw material and components needed to assure the requested production. The relationship established with suppliers is a “free-pass” type, that means that there is no in-coming inspection and the right level of quality accountability of the raw material is given to the suppliers with the quality written certification.
2) Assembling: related to the production of the drum, cabinet and front .
3) Mounting. Specific components are used to bring to the final product, creating each sub-assembly and assembly. At the end of this operation a full safety and aesthetical test is carried out (according to EU regulation) and the product is finally packaged.
4) Distribution. Inventory of the washing machines produced, waiting to be shipped to RDC (regional Distribution Center).
Fig. 4: Process production flow chart Currently the drum production is carried out by an automatic line having a cycle time of (Tc) 12 sec. and with a production capability of (Cp) 300 pz/h. The drum produced by the above described line, is transferred to suitable metallic racks in lots of 48 pieces, with relevant transportation, on the Washing Unit Line. Its production parameters are: Tc = 11.25 sec. and Cp= 320 pz/h. In the mounting shop, there is an in-coming goods area in which components coming form the supply chain are placed. Then those components delivered towards the inventories of each area with forklifts. The mounting is done on 2 parallel lines called:
Line 1; Line 2.
The manual mounting lines are thought to be every flexible in terms of human workforce employed and with a max production capability of 160 washer/h each. This maximum value could be suitably tuned
WSEAS TRANSACTIONS on SYSTEMS and CONTROL E. Romano, L. C. Santillo, P. Zoppoli
ISSN: 1991-8763 69 Issue 2, Volume 4, February 2009
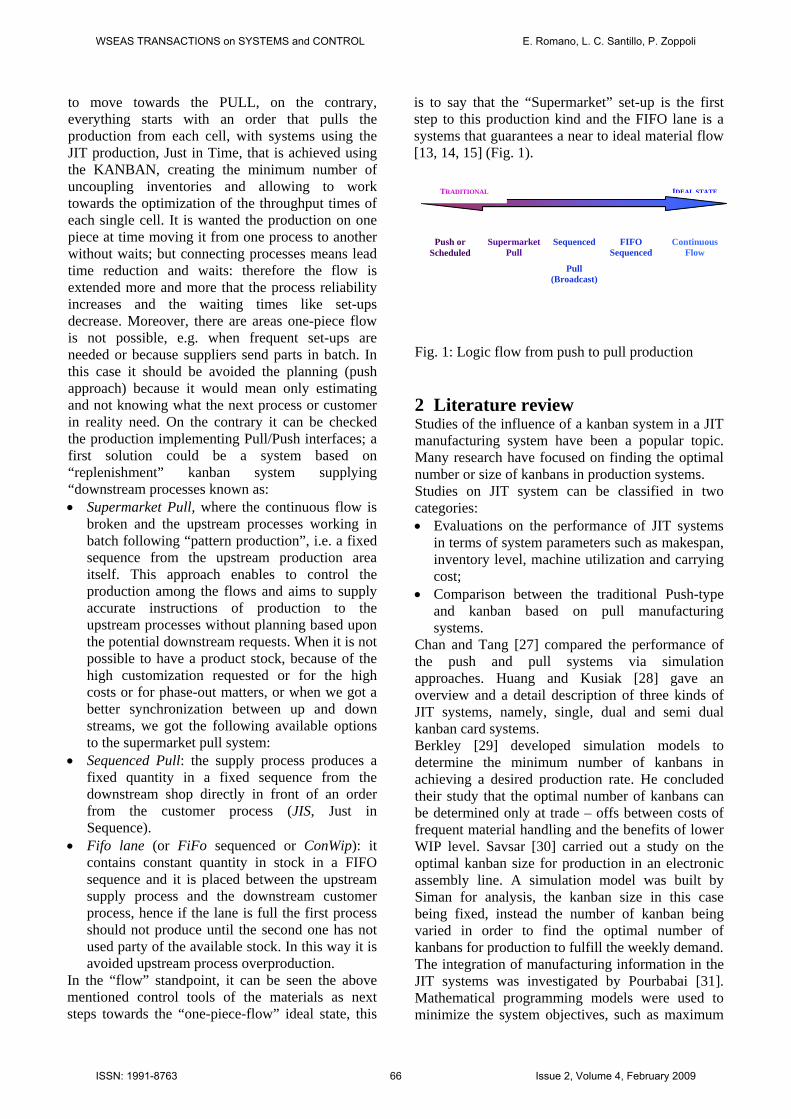
up to follow possible production process variation (Cp=59, 82, 121, 145, 160 washer/h) due to absenteeism and production peaks. 4 Experimental Design of Supermarket Pull The choice of implementing this managing strategy brought the production managers (in Whirlpool) to redesign the material flow according to Lean mindset in the area of the Shop floor, highlighting the need to introduce a supermarket in the upstream of the Washing Unit that will enable to uncouple of the drum and washing machine manufacturing phases. The need find its rational in the attempt to reduce the relevant Change Over time for part code change, in the specific there is a set-up time of 7’ for a code change and of about 30’ for moving from 473 to 490 drum production, both for production speed gap between the drum line and the W.U line that moves with higher speed. Finding, indeed the Pacemaker in the W.U. it could be looked at a process to continuous flow process downstream, being the W.U perfectly time synchronized with the Assembly line and introduce a Supermarket System that assures pull management of line (Fig. 5).
Fig. 5: Production process proposed A first step was a data analysis, starting form the identification of the codes to be kept in the supermarket. From the 2008 Forecast Analysis, coming from Material Management (MM) Department, 18 codes were identified and they have been summarized in 2 macro families related to the dimension of the drum diameter and then find out 3 different Timeframe for the forecasts according with sizing the supermarket. The identification of the 3 Timeframes is due to the market request variation, during which some codes more than others are foreseen to be requested and produced (in the 2nd Timeframe it could be noticed that some codes disappear). Starting from this information it was possible, with ABC analysis to find out the codes to be kept for each time frame: • Runner, the most requested ones that we need to
be kept in the supermarket in bigger quantity;
• Repeater, for them it is worth to have enough parts in the supermarket because the requests are not negligible;
• Stranger, it is not possible to place in the supermarket, because the requests are rare.
Then, supported by the experience of the process responsible, it was established how many codes and which are to be placed in the Supermarket. The next step foresaw the data analysis of the process, in the specific time interval t was settled an reference interval, each working shift during which it was estimated the production drum line uptime defining in function of the above mentioned time, for each timeframe, the Pattern Wheel of part code production to be implemented in the supermarket. In reality Pattern is a production sequence for each shift done by a sequence of minimum production lots for each foreseen code, constituted by a certain number of containers, that are assumed to be of 48 pieces capacity (P.size), evaluated on the basis of the percentages of the forecast and the production related to the uptime, i.e. the overall number of parts that it can be produced in the Production Time. The data is summarized in the following table [11]: Tab. 3: production parameters
DATA BOX
Drum Line
DATA BOX
W.U.
C/T 12 s T/T 11,25 s
Cp 300pz/h Cp 320pz/h
C/O 30 min O.E.E Drum Line C/O 0
Maint. 15 min EPEshift 8 h Maint. 0
A.time 7,5 h P 0,9 A.time 7,33 h
Uptime 90% Q 0,97 Uptime 92%
P.time 405 min Downt. 0,06 P.time 7,33 h
Scrap 3% Uptime 8 Scraps 0
P.size 48 A 0,94 P.size 48
EPEshift 8 h O.E.E 0,82 EPEshift 8 h
It should be noticed that an Availability of the plant at 94% it can be got an Available time of 7,5 h, where the shift lasts 8 h, this means that, considering the Downtime, estimable taking into account that in one shift it can be decided to run one Change over and a second one across the second shift, in total 30 min and one maintenance operation that takes away 15 min, it can reached an Uptime of
WSEAS TRANSACTIONS on SYSTEMS and CONTROL E. Romano, L. C. Santillo, P. Zoppoli
ISSN: 1991-8763 70 Issue 2, Volume 4, February 2009
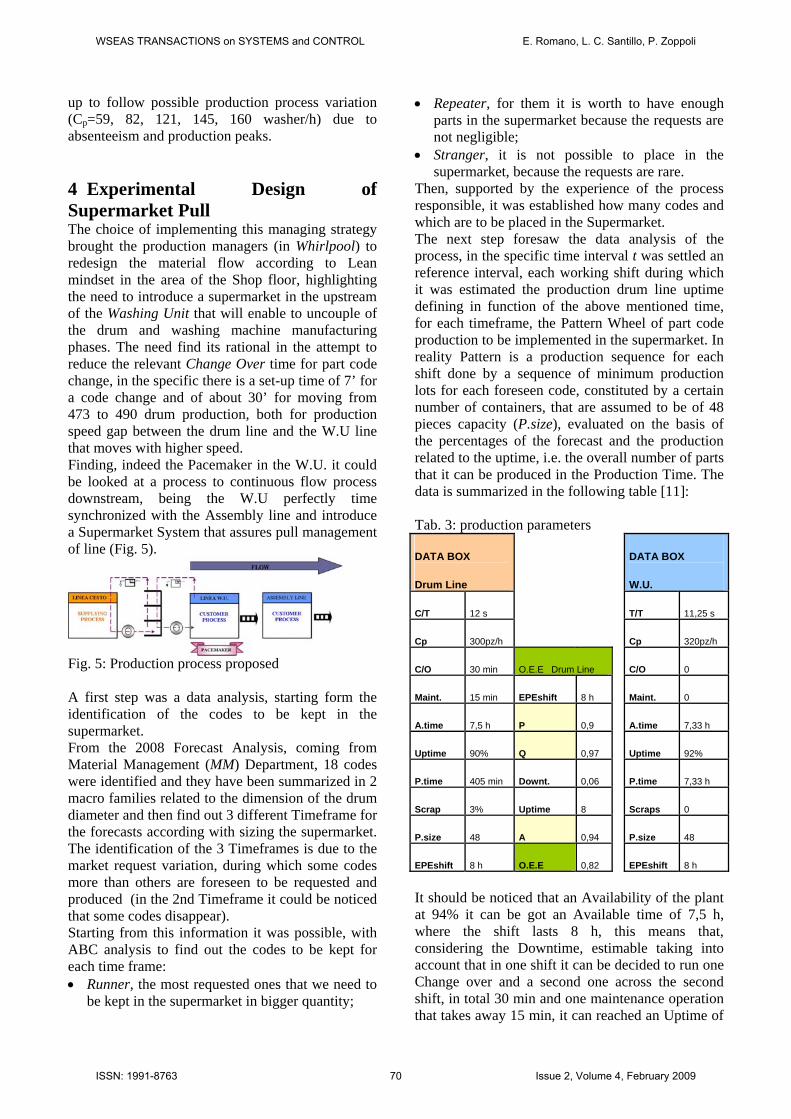
90% that given in minutes brings to 405 min of real production. The production batch will take into account production capability and the Production Time as follows: Production batch = P.Time * Cp (1)
SHIFT WHEEL
PROD.time
C/O
PROD.time
MAINT 1/2 C/0
START
Rotazione Ruota Avanzamento
produttivo
Fig. 6: Production Pattern Wheel based on production parameters The relevant Pattern Wheel including the Downtime is the following:
CP
58D-490
58E-490
64E-490
64D-490
64C-490
58C-490
58B-490C/O
50C
50D
54D
54EC/O
MANU
54B
54C Fig. 7: Production Pattern Wheel in the first timeframe
Finally it was evaluated the size of the supermarket, calculating the Lead Time To Replenish, for each single Timeframe 5 Simulation Model The followed objective was that we need to set up a model that really reflected the logics to be implemented. It was decided to approach with different steps: firstly it was decided the logics and then there was a tune up phase in order also to simplify, trying to reduce variation inputs, gathering elements by macro areas. The basic idea is that the one followed for the pre-sizing faced before, that is the Kanban replenishment logics to Supermarket (Fig. 7), revised in a way that could be implemented in Arena environment [33, 34].
Fig. 7: Kanban replenishment logic proposed
Afterwards it can be found some logical diagrams for the model implementation related to the following phases: • Drum production according to a pre-established
wheel sequence; • Code storage in the supermarket; • Code Withdrawal to supply the W.U. lines.
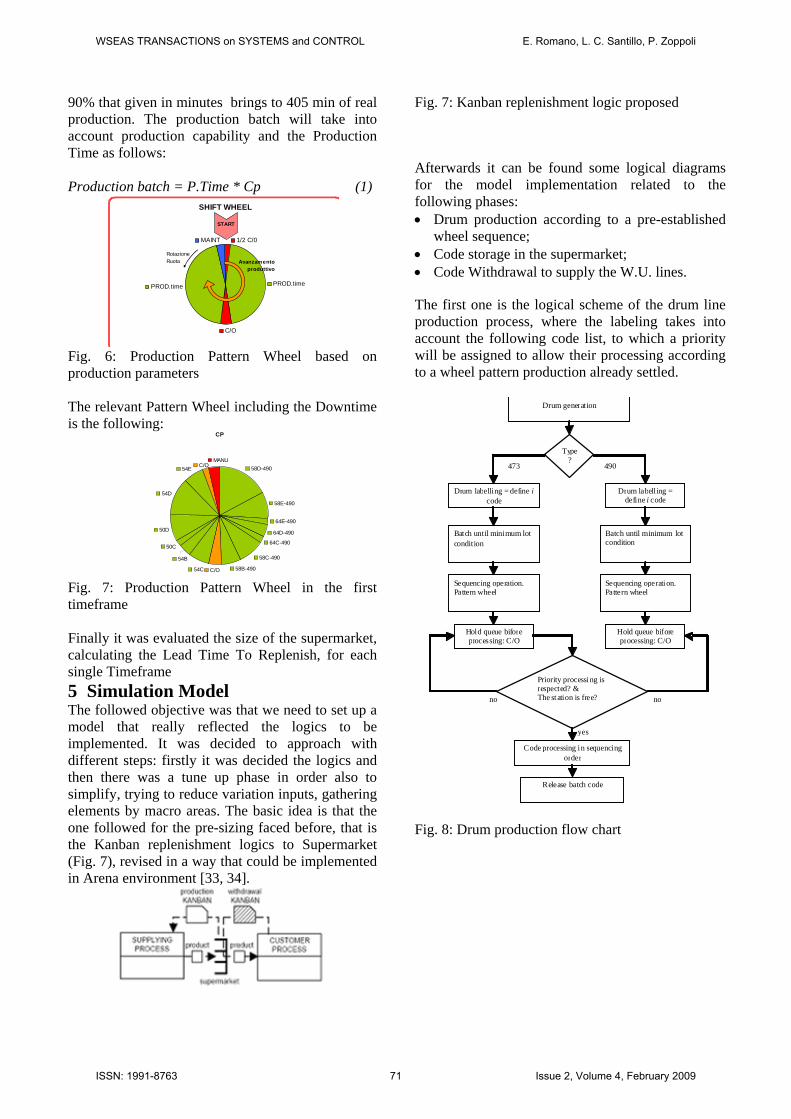
The first one is the logical scheme of the drum line production process, where the labeling takes into account the following code list, to which a priority will be assigned to allow their processing according to a wheel pattern production already settled.
um g e n e
Fig. 8: Drum production flow chart
Dr r a t i o n
T yp e ?
Drum labelling = define ico
473 4 9 0 D
de
Batch until minimum lotcondition
Sequencing operation.Pattern wheel
B a t c h u n t i l m i nimum lot
c o n d i t i o n
S e q u e n c i n g o p eration.
P a t t e r n w h e e l
Code proce s s i n g i n s e q u e n c i n g o r d e r
r u m l a b e l ling =
d e f i n e i code
Relea s e b a t c h c o d e
Priority p r o c e s s i n g i s respect e d ?
& The st a t i o n
i s f r e e ?
Hold queue biforeprocessing: C/O
y e s
no no
H o l q u e u e d bifore pr o c e s s i n g : C/O
WSEAS TRANSACTIONS on SYSTEMS and CONTROL E. Romano, L. C. Santillo, P. Zoppoli
ISSN: 1991-8763 71 Issue 2, Volume 4, February 2009
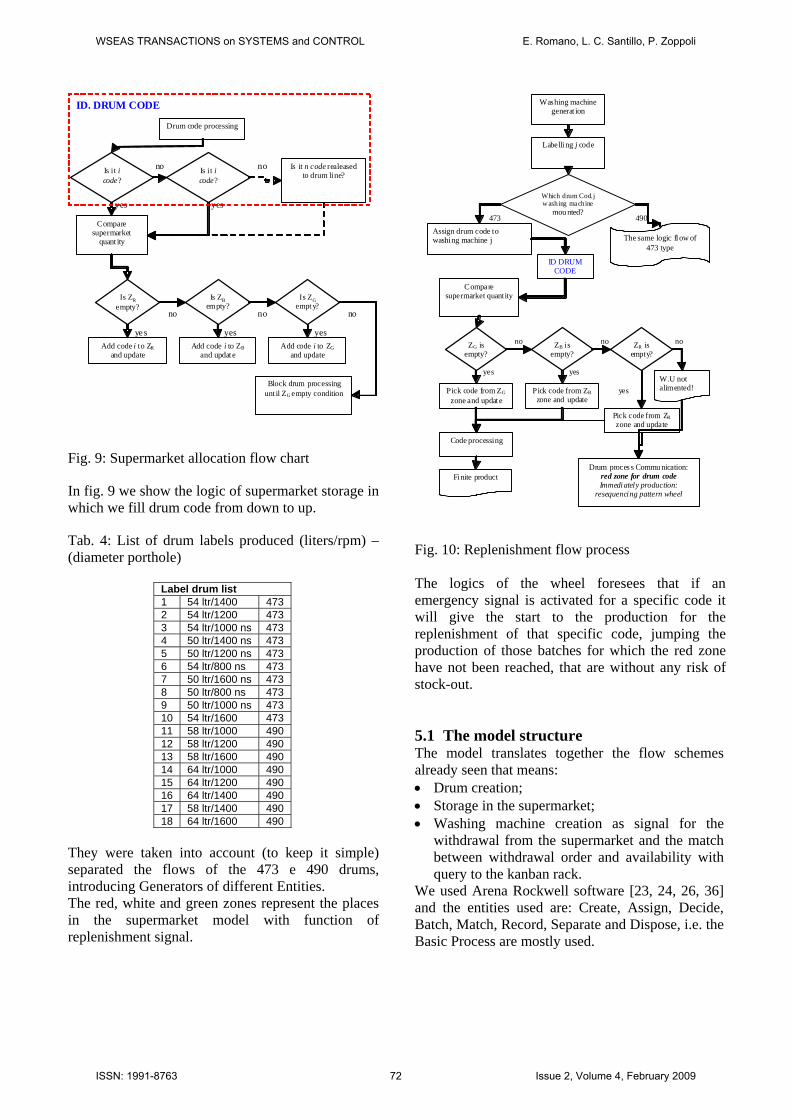
Fig. 9: Supermarket allocation flow chart
In fig. 9 we show the logic of supermarket storage in which we fill drum code from down to up.
Tab. 4: List of drum labels produced (liters/rpm) – (diameter porthole)
Label drum list 1 54 ltr/1400 473 2 54 ltr/1200 473 3 54 ltr/1000 ns 473 4 50 ltr/1400 ns 473 5 50 ltr/1200 ns 473 6 54 ltr/800 ns 473 7 50 ltr/1600 ns 473 8 50 ltr/800 ns 473 9 50 ltr/1000 ns 473 10 54 ltr/1600 473 11 58 ltr/1000 490 12 58 ltr/1200 490 13 58 ltr/1600 490 14 64 ltr/1000 490 15 64 ltr/1200 490 16 64 ltr/1400 490 17 58 ltr/1400 490 18 64 ltr/1600 490
They were taken into account (to keep it simple) separated the flows of the 473 e 490 drums, introducing Generators of different Entities. The red, white and green zones represent the places in the supermarket model with function of replenishment signal.
Fig. 10: Replenishment flow process The logics of the wheel foresees that if an emergency signal is activated for a specific code it will give the start to the production for the replenishment of that specific code, jumping the production of those batches for which the red zone have not been reached, that are without any risk of stock-out. 5.1 The model structure The model translates together the flow schemes already seen that means: • Drum creation; • Storage in the supermarket; • Washing machine creation as signal for the
withdrawal from the supermarket and the match between withdrawal order and availability with query to the kanban rack.
We used Arena Rockwell software [23, 24, 26, 36] and the entities used are: Create, Assign, Decide, Batch, Match, Record, Separate and Dispose, i.e. the Basic Process are mostly used.
Drum code processing
Is it i code?
Compare supermarket
quant ity
yes
Is ZR empty?
Add code i to ZR and update
Is ZB empty?
Add code i to ZB and updat e
Is ZG empty?
Add code i to ZG and update
Block drum processing unt il ZG empty condition
no no no
ye s
yes
yes
Is it i code?
no
yes
no Is it n code realeased to drum line?
ID. DRUM CODE Washing machine generat ion
Labelli ng j code
Which drum Cod.j w ashing machine
mou nted?
Compare supermarket quantity
ZG is empty?
Pick code from ZG
zone and updat e
yes
no
473 490
ZB is empty?
Pick code from ZB zone and update
ZR is empty?
Pick code from ZR zone and update
The same logic fl ow of 473 type
yes
yes
no no no
W.U not alimented!
Drum proces s Commu nication: red zone for drum code Immediately production:
resequencing pattern wheel
Code processing
Finite product
Assign drum code to washing machine j
ID DRUM CODE
WSEAS TRANSACTIONS on SYSTEMS and CONTROL E. Romano, L. C. Santillo, P. Zoppoli
ISSN: 1991-8763 72 Issue 2, Volume 4, February 2009
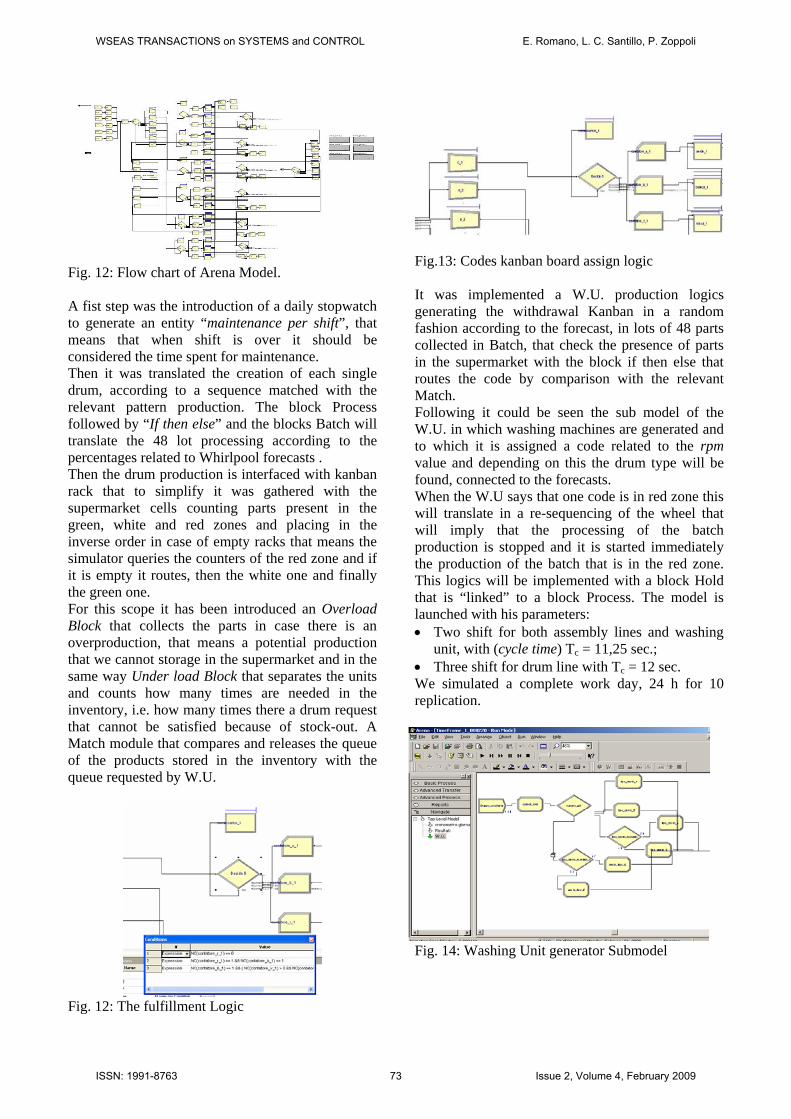
Fig. 12: Flow chart of Arena Model. A fist step was the introduction of a daily stopwatch to generate an entity “maintenance per shift”, that means that when shift is over it should be considered the time spent for maintenance. Then it was translated the creation of each single drum, according to a sequence matched with the relevant pattern production. The block Process followed by “If then else” and the blocks Batch will translate the 48 lot processing according to the percentages related to Whirlpool forecasts . Then the drum production is interfaced with kanban rack that to simplify it was gathered with the supermarket cells counting parts present in the green, white and red zones and placing in the inverse order in case of empty racks that means the simulator queries the counters of the red zone and if it is empty it routes, then the white one and finally the green one. For this scope it has been introduced an Overload Block that collects the parts in case there is an overproduction, that means a potential production that we cannot storage in the supermarket and in the same way Under load Block that separates the units and counts how many times are needed in the inventory, i.e. how many times there a drum request that cannot be satisfied because of stock-out. A Match module that compares and releases the queue of the products stored in the inventory with the queue requested by W.U.
Fig. 12: The fulfillment Logic
Fig.13: Codes kanban board assign logic It was implemented a W.U. production logics generating the withdrawal Kanban in a random fashion according to the forecast, in lots of 48 parts collected in Batch, that check the presence of parts in the supermarket with the block if then else that routes the code by comparison with the relevant Match. Following it could be seen the sub model of the W.U. in which washing machines are generated and to which it is assigned a code related to the rpm value and depending on this the drum type will be found, connected to the forecasts. When the W.U says that one code is in red zone this will translate in a re-sequencing of the wheel that will imply that the processing of the batch production is stopped and it is started immediately the production of the batch that is in the red zone. This logics will be implemented with a block Hold that is “linked” to a block Process. The model is launched with his parameters: • Two shift for both assembly lines and washing
unit, with (cycle time) Tc = 11,25 sec.; • Three shift for drum line with Tc = 12 sec. We simulated a complete work day, 24 h for 10 replication.
Fig. 14: Washing Unit generator Submodel
QuickTime™ and a decompressor
are needed to see this picture.
WSEAS TRANSACTIONS on SYSTEMS and CONTROL E. Romano, L. C. Santillo, P. Zoppoli
ISSN: 1991-8763 73 Issue 2, Volume 4, February 2009

Fig. 15: Replenishment Logic 4 Results and Conclusion Following the analysis processed, it is possible to think that the idea to place a supermarket between the drum and W.U. production phases will guarantee the desired flow of materials. The sizing carried out fully reengineers, in the right way, the logics of managing of the supermarket taking into account the ways of the replenishment by the drum line and that of the Washing Unit, allowing the effective uncoupling of the process as aimed by the Company: this means that it is possible to implement a production of the drums according to the wheel defined with the company support, that will fill up the supermarket according to a rate of depletion given by the pacemaker process, i.e. the W.U. The launch of the model allowed, with trial and error tests, to notice that it is needed a 4 h of advance of the drum line, hence, that is needed the usage of part of the 3rd shift of the Drum Line to avoid a stock-out and then a stop of the W.U. The simulations runs related to the following situations: Concurrent Start of the upstream and down stream lines The Under load scenario was evaluated, i.e. under load, of 28 Kanbans, after about 3 production hours after which the system is able to stabilize again (it is recovered the production according to the sequence that is able to supply the W.U.). Start of the Drum Line in advance It was checked that in this case increasing this advance time the under load decreased. After 4 h, there was no more under load conditions. It was checked that the system was working in under load conditions. It is clear that the under load even of only one entity should create the stoppage of the
system. In reality, for experimental scopes, it is useful to measure the under load, and taking into account this to reduce potentially the size of the supermarket.
If drum type there isn ’t inthe SM then we can ’t
dispacched and then wehave “the underloaded
state ” to this drum code
Start of the drum line - stopping the W.U. It is supplied the overload that is an additional validation of the model. In the hypothesis of fully random sequence by the W.U. and making the Drum line to work for 4 hours in the third shift, it was possible to check that the supermarket sized is capable of supplying the downstream lines without interruptions, nor filling the under load or the overload, so without under or over production. Finally these are the achieved results: • Sizing of a supermarket implementing
Replenishment Kanban Logics; • Sizing of a Kanban rack, that supplies the signals
for a suitable managing of the replenishment production;
• Modeling and implementation with Arena of the process;
• Model validated; • First results with the Time frame 1, that taking
into account the random nature of the material consumption confirm the robustness of the carried out sizing with the assumption to employ the Drum Line for a part of the 3rd shift.
References: [1] Mariotti S., Verso una nuova organizzazione
della produzione. Le frontiere del post-fordismo, Etas, 1994.
[2] Merli G., Total Manufacturing Management. L’organizzazione industriale degli anni ’90, Torino, Petrini Editore, 1987.
[3] Mariotti S., Soluzioni flessibili per il manufacturing, L'Impresa 10-1994.
[4] Morishima M., Cultura e tecnologia nel "successo" giapponese, Bologna, Il Mulino, 1984.
[5] Schonberger R. S., Tecniche produttive giapponesi, Milano, Franco Angeli, 1986.
[6] Stalk G. - Evans P. - Shulman L. E., Competing on Capabilitites: The New Rules of Corporate Strategy, Harward Business Review March-April 1992.
[7] Bonfiglioli, Pensare snello, De Qualitate, 3, 45-50, 2002S.
Stop “production orders”
WSEAS TRANSACTIONS on SYSTEMS and CONTROL E. Romano, L. C. Santillo, P. Zoppoli
ISSN: 1991-8763 74 Issue 2, Volume 4, February 2009
[8] Jeffrey K. Liker, The Toyota Way: 14 Management Principles from the World's Greatest Manufacturer, McGraw-Hill 2004
[9] Shingo, Il sistema Giapponese Toyota, FrancoAngeli, Milano 1987
[10] Rother M., Shook J. Leerning to see. La mappatura del flusso del valore per creare valore ed eliminare i muda, Lean Enterprise Institute (LEI) Brookline MA USA, 2003.
[11] Vorne Industries Inc., Itasca IL USA, The fast guide to OEE, 2002-2005.
[12] Jeffrey K Liker; David Meier, The Toyota Way Fieldbook, A Pratical Guide for Implementing Toyota’s 4Ps, McGraw-Hill 2006.
[13] A.Portioli Staudacher, A.Pozzetti, Progettazione dei sistemi produttivi, Criteri e metodologie, Ulrico Hoelpi Milano.
[14] Nils Boysen, Malte Fliedner, Armin Scholl, A classification of assembly line balancing problems, 12/2006.
[15] Christian Becker, Armin Scholl, A survey on problems and methods in generalized assembly line balancing, 21/2003.
[16] Comfort, J. C. The Simulation of a Master-Slave Event-Set Processor, Simulation, 42 pp. 117-124 (1984).
[17] Sargent, R. G. Event Graph Modelling for Simulation with an Application to Flexible Manufacturing Systems, Management Science 34: 1231-1251 (1997).
[18] Schriber, T. J., An Introduction to Simulation Using, John Wiley, New York 1998.
[19] Law, A. M., Statistical Analysis of Simulation Output Data with SIMSCRIPT II.5, CACI Products Company, La Jolla, Calif. 1990.
[20] Pedgen, C. D., Introduction to SIMAN, Systems Modeling Corp., Sewickley, Pa. 1989.
[21] Pegden, Tennis C., Shannon, Robert E., Sadowski, Randall P, Introduction to Simulation Using SIMAN, Mc Graw Hill, 1995.
[22] Pritsker, A. A. B., Introduction to Simulation and SLAM II, 3d ed., Systems Publishing Corp., West Lafayette, Ind. 1986.
[23] Averill M. Law, W. David Kelton, Simulation Modeling & Analysis, III Edition, Mc Graw Hill 2001.
[24] Schmidt, J. W., and R. E. Taylor, Simulation and Analysis of Industrial Systems, Richard D. Irwin, Homewood, III 1970.
[25] T. Rossi, Simulation Forum 2004 – Gestire il cambiamento nei processi produttivi e logistici. La simulazione come supporto alle decisioni.
[26] W. David Kelton, R.P. Sadowski, D.A. Sadowski, Simulation with Arena, Mc Graw Hill, 2000.
[27] F.T.S. Chan, N.K.H. Tang, Performance of Push, Pull and Hybrid scheduling system in a flow shop manufacturing environment, Proceedings of the International Symposium on Advabnced Manufacturing Processes Systems and Technologies (AMPST), University of Bradford UK, March 1996, pp. 27 – 36.
[28] C.C. Huang, A. Kusiak, Overview of Kanban systems, International J. Computational Integrated Manufacturing, 9 (10) (1996) pp. 169 – 189.
[29] M. Savsar, Simulation analysis of a pull-push system for an electronic assembly line, Int. J. Prod. Econ. 51(3) (1997) pp. 205 – 214.
[30] B. Pourbabai, Loading strategies for a class of just-in-time manufacturing system, Int. J. Adv. Manuf. Technol. 10 (1) (1995) pp. 46 – 51.
[31] M. F. Anwar, R. Nagi, integrated lot-sizing and scheduling for just-in time production of complex assemblies with finite set-ups, Int. J. Prod. Res. 35 (1197) pp. 1447 – 1470.
[32] F.T.S. Chan, Effect of kanban size on jist-in-time manufacturing systems, J. of Materials Processing Technol. 116 (2001) pp. 146 – 160.
[33] P. Yol Jang, Evolution Structure of a Process and Resource Models-based Simulation for the Supply Chain Management, Proceedings of the 11th WSEAS International Conference on APPLIED MATHEMATICS, Dallas, Texas, USA, March 22-24, 2007.
[34] R.C. Berredo, L.N. Canha, P.Ya. Ekel, L.C.A. Ferreira and M.V.C. Maciel, Experimental Design and Models of Power System Optimization and Control, WSEAS TRANSACTIONS on SYSTEMS AND CONTROL, Volume 3, 2008.
[35] M. Paolucci, R. Revetria, F. Tonelli, An Agent-based System for Sales and Operations Planning in Manufacturing Supply Chains, WSEAS TRANSACTIONS on BUSINESS and ECONOMICS Issue 3, Volume 5, March 2008.
[36] B. Fahimnia, L. Luong, R. Marian, Optimization/Simulation Modeling of The Integrated Production-Distribution Plan: An Innovative Survey, WSEAS TRANSACTIONS on BUSINESS and ECONOMICS Issue 3, Volume 5, March 2008.
[37] Chen, F., Market Segmentation, Advanced Demand Information, and Supply Chain Performance. Manufacturing and Service Operations Management, 2001, 3(1), 53.
[38] Cohen, Morris A., Kleindorfer, Paul R. and Lee, Hau L., Service constrained (s,S) inventory systems with priority demand classes
WSEAS TRANSACTIONS on SYSTEMS and CONTROL E. Romano, L. C. Santillo, P. Zoppoli
ISSN: 1991-8763 75 Issue 2, Volume 4, February 2009
and lost sales, Management Science, 1988, 34(4), 482.
[39] Frank, K.C., Zhang, R.Q. and Duenyas. I., Optimal policies for inventory systems with priority demand classes. Operations Research, 2003, 51(6), 993.
[40] Gallego, G. and Özer, Ö., Integrating replenishment decisions with advance demand information. Management Science, 2001, 47(10), 1344.
[41] Hariharan, R. and Zipkin, P., Customer-order Information, Leadtimes, and Inventories. Management Science, 1995, 41(10), 1599-1607.
[42] Liberopoulos, G., and Koukoumialos, S., Tradeoffs between base stock levels, numbers of kanbans, and planned supply lead times in production/inventory systems with advance demand information. International Journal of Production Economics, 2005, 96, 213- 232.
[43] Karaesmen, F., Buzacott, J. A. and Dallery, Y. Integrating advance order information in make-to-stock production systems. IIE Transactions, 2002, 34, 649-662.
[44] Karaesmen, F., Liberopoulos, G. and Dallery, Y., The value of advance demand information in production/inventory systems. Annals of Operations Research, 2004, 126, 135-157.
[45] Krishnamurthy, A., and Claudio, D., Pull systems with advance demand information, Proceedings of the 2005 Winter Simulation Conference. 1733-1742.
[46] Wang, Y., Cohen, M. A. and Zheng, Y. Differentiating customer service on the basis of delivery lead-times. IIE Transactions, 2002, 34, 979- 989.
[47] Wijngaard, J., The effect of foreknowledge of demand in case of a restricted capacity: the single-stage, single-product case. European Journal of Operational Research. 2004, 159, 95-109.
WSEAS TRANSACTIONS on SYSTEMS and CONTROL E. Romano, L. C. Santillo, P. Zoppoli
ISSN: 1991-8763 76 Issue 2, Volume 4, February 2009