transformation and the value of following the
TRANSCRIPT

Mapping a Sector’s Scope Transformation and the Value of Following the Evolving Core Nicola Cetorelli | Michael G. Jacobides | Sam Stern
NO. 963
APRIL 20 21

Mapping a Sector’s Scope Transformation and the Value of Following the Evolving Core
Nicola Cetorelli, Michael G. Jacobides, and Sam Stern
Federal Reserve Bank of New York Staff Reports, no. 963
April 2021
JEL classification: G21, L23, D22
Abstract
A surprisingly neglected facet of sector evolution is the evolutionary analysis of firms’, and thus a
sector’s, scope. Defining a sector as a group of firms that can change their scope over time, we study the
transformation of U.S. banking firms. We undertake a sectoral, population-wide study of business-scope
transformation, with particular focus on which segments banks expand into. As financial intermediation
evolved, a continuously shifting set of activities became associated with “core banking,” with scope
changing and relatedness itself (measured through coincidence) evolving over the banking sector’s
history. Banks that expand scope while staying close to this evolving core attain net performance benefits.
Identification tests show that the benefits of following the evolving core are robust to endogeneity.
Key words: scope, relatedness, diversification, industry evolution, expansion
_________________
Cetorelli: Federal Reserve Bank of New York. Jacobides (corresponding author): London Business School (email: [email protected]). Stern: University of Michigan. This paper expands upon work done in Staff Report 813.
This paper presents preliminary findings and is being distributed to economists and other interested
readers solely to stimulate discussion and elicit comments. The views expressed in this paper are those of
the author(s) and do not necessarily reflect the position of the Federal Reserve Bank of New York or the
Federal Reserve System.
To view the authors’ disclosure statements, visit https://www.newyorkfed.org/research/staff_reports/sr963.html.

1
INTRODUCTION
What is an “industry”? The question is deceptively simple to ask, yet considerably more
difficult to answer (Nightingale, 1978). Economic historians, industry studies, and most
strategy researchers align with Marshall (see Andrews, 1949) in defining industries on the
basis of “similar establishments.” The North American Industry Classification System
(NAICS, 2017: 3) accordingly defines industry segments following “a single principle of
aggregation… units that use similar production processes should be grouped together.”
NAICS, being a classification device, decomposes these units to the finest degree possible.
Yet, while most scholars consider industries as populations of similar firms, they still allow
for those firms’ scope to evolve over time (Nelson & Winter, 1982; Baum & Singh, 1994).
This brings us to a second, related question: How does an industry change? As
Chandler’s pioneering work (1962, 1977) has shown, the evolution of industries is intricately
connected to the changing scope of firms within them. For instance, it is hard to understand
the evolution of the chemicals industry without looking at the changes in firms such as
Dupont; and it is hard to understand Dupont itself without looking at how it broadened its
scope. Likewise, it is hard to understand the evolution of automobile manufacturing without
looking at General Motors or Ford, or to understand General Motors or Ford themselves
without looking at the significant changes in their scope. Chandler shows us that it is
important to understand how firms respond to technological, regulatory, and economic
opportunities, changing the segments in which they operate. What a “chemicals firm” or an
“automobile manufacturer” is, and what segments it covers, changes over time. Accordingly,
the definition and scope of the industry itself evolve as its member firms enter new segments
and leave old ones.
Given the importance that Chandler placed on how firms change their scope over time,
one might expect that scholars of industries (or “sectors”) would have paid careful attention
2
to it in their studies. Yet for all its emphasis on scale, research into sector evolution has, on
the whole, steered clear of questions of scope, as Jacobides and Winter (2005, 2012) point
out. Where such research exists, it is selective (Silver, 1984; Langlois & Robertson, 1995),
and often narrowly focused on the role of transaction costs (Williamson, 1985; Argyres &
Zenger, 2012), leaving us with fragmentary evidence on how a sector’s participants transform
their boundaries over time. Separately, research on the benefits and shortcomings of broad
scope (Palich et al., 2000; Villalonga, 2004a, b; Kuppaswamy & Villalonga, 2015; Folta et
al., 2016) has stayed at the level of the firm and its evolving portfolio of activities, in
isolation from the sectors in which these changes occur.1
Questions of scope in the context of sectors have figured most prominently in
relatedness research, which considers the sector-based similarity of firms on the basis of the
portfolio of activities in which they engage. Gort (1962), Wrigley (1970), and Rumelt (1974)
originally argued that processes, knowledge bases, or human capital shared across multiple
businesses can lead to greater efficiency gains. This was later broadened to encompass the
realization of return synergies from joint operations (e.g., Montgomery & Hariharan, 1991;
Zhou, 2011; Capron & Mitchell, 2013), or from intertemporal efficiencies (Helfat &
Eisenhardt, 2004). Drawing on the analysis of Teece et al. (1994), Bryce and Winter (2009)
and Lien and Klein (2009) have argued that we can infer the synergies between two segments
by observing how many firms have subsidiaries in both, leading to a “bottom-up” indicator,
empirically considering a cross-section of firms, aggregating them over multiple years.2 Yet
1 Population studies that explore aggregate, economy-wide patterns in the prevalence of broad or narrow firms
(e.g. Basu, 2010), or consider the effectiveness of different approaches to managing boundaries (Robins &
Wiersema, 1995), or explore patterns of entry and exit into more or less related industries (Chang, 1996;
Feldman, 2019) have, by and large, ignored industry in their analysis. Empirical research on the merits of
becoming broad vs. narrow is occasionally carried out in the context of a particular sector, yet the focus there
has been on ensuring comparability (such as Palepu’s 1985 investigation of the entropy measure, applied to a
sample of 30 food products firms). By and large, the sectoral context and its evolutionary dynamics are not
directly considered. 2 This was in contrast to previous approaches, which had inferred synergies by the distance of a firms’ activities
in terms of the SIC or NAICS code “tree”—looking, e.g., at how many digits they shared. See Caves et al.

3
while this approach takes a sector-level focus, it does not consider sectoral dynamics, thus
disregarding the fact that relatedness itself may change over time.
What would be the benefits of conducting a sector-level analysis of scope that explicitly
focused on a sector’s evolutionary dynamics? Narrowing the analysis to all the firms in a
single sector would provide a large-scale, quantitative analysis of how sector participants
change their scope, while at the same time keeping track of the activities that constitute the
sector’s “core.” We define the core of a sector as that activity, or set of activities, that are
most commonly engaged in by firms in that sector.3 A sector’s core is not fixed, and may
evolve in response to business opportunities, technological options, and regulatory
conditions. By tracking such changes, we could see whether or not firms that, in changing
their scope, approach or depart from this evolving core are rewarded in terms of performance.
In all, taking such an approach would allow us to see whether the Chandlerian thesis applies
to large samples, and whether “moving with the times” confers a performance benefit.
To undertake such an analysis, we need a sector-level database that includes all the firms
in the sector. Then, by observing the cross-sectional variety of activities that firms engage in,
we can reliably establish what is the sector core, and by observing changes in firms’ activity
portfolios, track the evolution of the core itself. Such comprehensive samples are few and far
between, but we are fortunate to have such a setting for the U.S. banking sector.
In U.S. banking, the technology of financial intermediation changed dramatically during
the 1990s and 2000s. At the outset, banking firms operated with a very narrow scope, with
deposit-taking and loan-making representing the core of the sector. Twenty years later, the
sector had fragmented into a decentralized system in which matching deposit supply and loan
demand increasingly took place through much longer credit intermediation chains, with a
(1980), Jacquemin and Berry (1997), or Palepu (1985) for examples; Rumelt (1974) for a critique and
alternative; and Weiss (2016) for a review of non-NAICS approaches. 3 Activity is defined following the NAICS, representing the five-digit (i.e., detailed) description of the main
business activity undertaken by each subsidiary.

4
wide and varying set of other activities emerging as part of core banking (Cetorelli, Mandel,
& Mollineaux, 2012). To give a sense of this sector transformation, between 1990 and
2006—the year before the onset of the financial crisis—more than 230 distinct U.S. bank
holding companies (BHCs), the main legal vehicle defining the boundaries of a banking firm,
incorporated securities-dealer or broker subsidiaries; about 500 took control of insurance
agencies; and over 1,000 added special purpose vehicle legal entities to their organizations.
While these instances of change in banks’ scope are certainly significant, they actually
represent just the tip of the iceberg in what has been the largest and deepest process of scope
transformation in the history of U.S. banking. Indeed, throughout the 1990s and early 2000s,
more than half of the population of BHCs (accounting for about 97 percent of total sector
assets) either created or took control of tens of thousands of subsidiaries, spanning virtually
every business segment within the financial services sector and beyond. This created new
opportunities for potential synergies across a variety of businesses, and the value of those
synergies changed in response to regulatory, technological, and market conditions that
evolved over time, across all firms.4
Rather than focusing, like Chandler, on firms that shaped particular sectors over time, we
look at the universe of banking firms in the U.S. Our sample illustrates how all such firms
changed their scope, combining their deposit and lending activity—the original core of the
sector—with others activities within the financial services sector, and even beyond it. Our
sample is comprehensive because banking is a regulated segment, so no entity can engage in
the activities that it covers without being included in our database. This provides us with
information on the entire population of firms in the sector, and their ever-evolving scope.
4 For example, the benefits from combining commercial banking with securities dealing and underwriting,
following regulatory changes in the late 1980s/early 1990s, appear to have increased firm-level value-add—
especially in the run-up to the 90s technology boom. Likewise, the surge in asset securitization throughout the
1990s likely created the conditions for banking institutions to add specialty lenders, special purpose vehicles,
and servicers, among others.

5
Our comprehensive data clearly shows how the core of this shifting field of financial
intermediation evolved. It also shows how banks that followed this evolving core performed,
compared with those that didn’t expand, or to those that expanded to segments that were
more related based on traditional, non-sector-specific, or non-dynamic measures (such as
entropy, or NAICS coherence). We provide a thorough empirical investigation of the
marginal impact of expanding, finding that, while expansion overall is detrimental to
performance, expansion into the evolving core is, as Chandler would predict, beneficial.
We find this result to be robust to potential endogenous selection, and to alternative
competing explanations. Specifically, we show that moving into vertically integrated
segments does not yield any benefit (cf. Williamson, 1975); that the inclusion of (sector-
agnostic) entropy measures (Palepu, 1985), constructed as well as our dataset allows, does
not affect the results, and we also show that our results are robust to the use of measures of
capital-market turbulence, which has recently attracted attention (e.g., Kuppuswamy &
Vilallonga, 2015; Matvos, Seru, & Silva, 2018). Finally, our results are maintained when we
consider BHC performance during and after the 2007–2009 financial crisis.
In sum, we confirm the Chandlerian thesis that sectors change through the way firms
change their boundaries. We do so by providing comprehensive and systematic data on an
important sector. Our paper draws on Teece et al. (1994), who, drawing on the survivor
principle originally proposed by Alchian (1950) and reiterated by Stigler (1968), note that the
frequent co-occurrence of activities must imply existing synergies among them. This
powerful idea, more fully developed by Bryce and Winter (2009), has been used to measure
relatedness on the basis of a sample of firms and their NAICS (or SIC) activities. We, too,
draw on the survivor principle; however, following Chandler, our focus is on how sectors
(and the relatedness of the firms within them) evolve. Unlike Bryce and Winter (2009), we do
not focus on the inferences that we can draw from what is stable over time, aggregating

6
across time and across sectors. Rather, we focus on the dynamic story of relatedness that
emerges bottom-up from our sample, as it changes over time, and track the competitive
implications of following this evolving core. In a world of rapidly evolving sectors, from
pharmaceuticals and healthcare to media and telecommunications, where businesses’ scope is
changing constantly over time, such a sector- and time-specific analysis can shed light on
what drives sectoral and corporate change, and how such change impacts performance.
THEORETICAL BACKGROUND: RELATEDNESS AND ITS DYNAMICS
Alfred Chandler’s (1962) groundbreaking analysis of how major firms, from the turn of the
19th century onwards, transformed both themselves and their sectors by growing through
scale, scope, and managerial innovation, has had a profound influence on our understanding
of scope expansions. However, there has been little systematic follow-through on his key
insights. While literature on scope and firm relatedness has proliferated, the focus tends to be
on contemporaneous relationships. Change over time has been relatively neglected, and the
interplay between sectoral- and firm-level scope dynamics has received even less attention.
This leaves a surprising gap in the literature, emphasized in Chandler’s last two books, on the
evolution of electronics (2001) and chemicals companies and pharmaceuticals (2005). The
introduction of his last book sums up this neglected issue:
The continuing evolution of the enterprises and the industries in which they operate
focus on three basic themes: creating barriers to entry, defining the strategic
boundaries of the enterprise, and evaluating the limits to growth of an industry and the
enterprises within it…. [Firms] define their strategic boundaries through competition
with one another. These boundaries reflect the competitive success and failure of the
individual enterprises in terms of technical achievements and financial returns. I use
the term boundaries because these enterprises are nearly always diversified multi-
product producers. (Chandler, 2005: 9–10)
Chandler’s research aims to shed light on this interplay between firm-level scope change and
sector evolution, focusing on evolving patterns at the level of the sector. Using historical
methods, he brings considerable subtlety to his analysis, weaving in organizational,

7
institutional, and competitive factors. This inescapably limits breadth (as he unapologetically
focuses on the largest firms) and the ability to generalize.
While some authors have followed Chandler (such as Silver, 1984, or Langlois &
Robertson, 1995), there has been little systematic work on this topic. Much of it has focused
more narrowly on the question of vertical integration, motivated by the debates in
Transaction Cost Economics (Williamson, 1990), sometimes seen in the context of a deep
sectoral study (Stuckey, 1989) but mostly focusing on the analysis of firms and their
boundaries (Agarwal & Helfat, 2009).5 Evolutionary approaches have also centered on the
question of vertical scope (Langlois, 2004; Jacobides & Winter, 2005, 2012). Analyses of
sector evolution proper have broadly taken scope and boundaries for granted, or treated them
in a limited, coincidental manner (see Malerba et al., 2016). This focus has provided
considerable advances in our understanding of capabilities, technology, institutions, and
profitability, but left scope expansion relatively understudied. Yet, when we consider the
transformations under way in sectors from financial services and telecommunications to
automobile manufacturing (which is mutating into mobility services), it is clear that we have
much to learn from a systematic focus on how firms within sectors change their boundaries.
In a distinct literature stream spanning strategy, finance, and economics, the question of
relatedness and its impacts has received much attention (Palich et al., 2000). As a result, a
more nuanced understanding of the benefits and shortcomings of diversification has
emerged—albeit without an explicit consideration of either the role of scope change or of
sector dynamics.6 In particular, following Gort (1962) and Berry (1971), Rumelt observed
5 Chandler (1962) viewed the focus on vertical scope, and TCE in particular, as an aside that was a distraction.
Tellingly, Williamson (unlike others) is not even cited in Chandler’s final books on scope (2001, 2005). 6 In finance, the expectation is that, as a result of the costs associated with agency frictions within the
organizational hierarchy (e.g., Jensen, 1986; Shleifer & Vishny, 1989), absent capital market imperfections,
diversified firms suffer when compared to their narrower peers—as confirmed by findings that diversification
dents banks’ performance (see e.g., Stiroh, 2015, for a review). At the same time, questions have been raised in
terms of the reasons behind the broadly negative associations between scope and performance. First, research

8
that related scope change could yield benefits (1974: 29). Research on this topic advanced
considerably in the 1980s and 1990s with the growth of the Resource-Based View
(Wernerfelt & Montgomery, 1988; Markides & Williamson, 1994), which has made
significant strides.7 To assess firm-level scope change, in terms of relatedness, following
Jacquemin and Berry (1979) there has been sustained interest in entropy measures (see
Palepu, 1985) to assess a firm’s portfolio breadth and depth. Robins and Wiersema (1995)
provide evidence on the performance impact of scope change and relatedness.
The literature that focuses on change explicitly is much more limited, and has only
recently started garnering serious focus. Chang (1996) provides an early dynamic approach,
mapping the sectors that firms enter into and exit from. The Special Issue in SMJ on the
evolution of firm capabilities (Helfat, 2000) considers firm-level scope evolution (Helfat &
Raubitschek, 2000; Holbrook et al., 2000), and Lieberman et al. (2017) show the connection
between relatedness, exit dynamics, and performance. Feldman (see 2019 for a review)
focuses on divestitures and the timing of entries and exits as they shape performance, also
without a sector focus, whereas in finance there are economy-wide surveys of the evolution
of corporate scope (Basu, 2010). This research has been reinvigorated by burgeoning work on
resource reconfiguration (see Folta et al., 2016). Research has focused not only on evidence
supporting the value of relatedness, but also the underlying mechanisms that make it
attractive, beyond resource sharing, and the role of turnover (e.g. Miller & Yang, 2016).8
has shown that adverse selection could be the culprit—so that performance declines force diversification, and
not the other way around (Chevalier, 2000; Campa & Kedia, 2002; Maksimovic & Phillips, 2002). Second,
methodological limitations or measurement error (Villalonga, 2004a, b) have been identified. Numerous
contributions have expanded this research, pointing out, among others, the connection between diversification
and productivity (Schoar, 2002) and capital market conditions (Almeida, Kim, & Kim, 2015; Matvos, Seru, &
Silva, 2018) that may make diversification more beneficial. 7 Helfat and Eisenhardt (2004) argue that resource complementarity may not just be intra-temporal (i.e., the
contemporaneous use of some common key resources) but may also be inter-temporal (i.e., the ability of firms
to shift resources from one market to another over time). Research on resource redeployment (Folta et al., 2016)
has provided additional nuance and evidence of the potential benefits of redeploying resources across segments. 8 Lieberman et al. (2017), for instance, argue that related diversification allows firms to reconfigure resources
internally. This makes it easier to redeploy resources (and exit a segment) if a particular expansion doesn’t pan
out, making expansion ex ante safer and more attractive.

9
The measurement of relatedness has been a perennial bone of contention in scope-
expansion research (Weiss, 2016). Early measures developed by Wrigley (1970) and Rumelt
(1974), which highlighted the benefit of relatedness, were based on researcher discretion;
they considered different categorical “types” of relatedness, which are still used. The desire
to use consistent measurements and the availability of data encouraged the use of the SIC and
later NAICS classification schemes, and the distance between sectors in terms of their
hierarchical trees, in both strategy (see Chang, 1996; Weiss, 2016; Feldman, 2019) and
finance (e.g., Rajan, Servaes, & Zingales, 2000). Jacquemin and Berry (1979) and Caves et
al. (1980) proposed the most frequently used measures,9 which were also relied upon to
assess a particular firm’s overall portfolio entropy (Palepu, 1985).
NAICS hierarchies, though, do not offer a good assessment of how close segments truly
are, as industry classifications are focused on outputs, whereas relatedness often relates to the
input side—or to sharing common customers and distribution channels. A number of papers
have tried to remedy that. Robins and Wiersema (1995) propose an alternative measure that
draws on the technology and product flows between the segments. Silverman (1999) and
Breschi, Lissoni, and Malerba (2003) propose a patent-based measure. Neffke and Henning
(2013) make a convincing case for using labor-market similarity to assess individual business
relatedness. However, as Pehrsson (2006) and Weiss (2016) mention in their reviews, most
studies of relatedness that eschew SIC/NAICS classifications seem to diverge, and have
failed to establish a single alternative basis for assessing relatedness (see Pil, 2009, for a
summary and meta-analysis).
9 The widely used Jacquemin and Berry (1979) entropy measure draws on the number of a firms’ two-digit SIC
sectors (measuring unrelated diversification), and the number of four-digit SIC segments within each two-digit
group (measuring related diversification), using a Herfindahl-style concentration measure. The concentric index
(e.g., Caves et al. 1980; Montgomery & Hariharan, 1991) also draws on the SIC system hierarchy. It first takes
the product of shares of sales for each pair of businesses at the bottom level of the hierarchy and then multiplies
that result by a digit representing the relationship between the two businesses in the SIC system. It takes the
value 0 when all four-level SIC businesses belong to the same three-digit SIC band, 1 when they belong to the
same two-digit group but different three-digit groups, and 2 when they are in different two-digit categories.

10
A different analytical strand connects relatedness with an evolutionary analysis of
sectors, drawing on the “survivor principle” (Alchian, 1950; Stigler, 1968). This approach
illuminates how some combinations of business activities will be more frequent than others,
and that these combinations (e.g., in terms of particular NAICS or SIC pairs) imply the
existence of relatedness-based synergies (Bryce & Winter, 2009).10 These views are
consistent with the explicitly evolutionary approach taken by Teece et al. (1994) that the
scope of a firm at any given time is the result of its past history (and selection environment)
and of the current pressures to adjust. Thus, the extent to which certain activities can be more
or less related is also a reflection of sector-wide technological factors that should be common
to all firms in operation at a given point in time, as well as the intensity of the selection
environment. The most thorough empirical investigation of “bottom-up” relatedness is Bryce
and Winter (2009), who draw on predominantly manufacturing data to derive their economy-
wide relatedness measures between four-digit SIC codes.11 However, although Bryce and
Winter draw on a panel database, they average out the coincidences they observe in the
data—and, as they concede, “the predictive value of our index rests on the premise that the
methodology captures fundamental aspects of relatedness among industries… accounted for
by relatively durable considerations” (2009).
The issue here is that sectors themselves evolve. New types of relatedness and synergies
may emerge, just as old ones wither away, so that focusing on “average” relatedness over
time will necessarily exclude an important part of the picture—especially in the context of a
sector’s unfolding history. Changing technologies of production and organization, as well as
10 As Teece (1980) and Bryce and Winter (2009) note, the fact that two segments are not found combined in a
single firm at a particular time does not imply that there are no synergies or that they are not related, as it may
just be the case that the market provides a relatively effective means of combining them instead. They also draw
on Richardson (1972) and others, who suggest that combinations within a firm’s boundary can also reflect
experimentation, or the luxury of not needing to be too discriminating when selection pressures are weak. 11 In particular, they draw on the Longitudinal Research Database (LRD) at the Center for Economic Studies
(CES) at the U.S. Census Bureau, and consider four-digit SIC codes, so as to create a map of the actual co-
occurrence of potential SICs, judged against the potential null of any combination. This operationalizes the ideas
in Teece et al. (1994), albeit focusing on manufacturing establishments and creating an economy-wide measure.

11
regulatory evolution, can shift the comparative advantage, e.g., from narrower to broader
firms—along the lines of Chandler’s (1962, 1977, 2001, 2005) analysis. This is precisely
where we see an opportunity for a contribution to theory, and to empirical understanding.
Thus, our twofold contribution is to provide a sector-based measure of relatedness that
evolves over time, reflecting sector-wide trends, and to use it to assess the value of
combinations—as opposed to merely registering their occurrence.12
Fundamentally, though, our contribution lies in offering a new empirical design that
looks at the sector level of analysis as the sector evolves. Our expectation is that the value of
particular sector-segment combinations will change over time, as the landscape of
opportunities and enabling regulations and technologies evolves. We also expect that firms
that move closer to the evolving core of the sector will benefit more from their expansion.
Our concern is not to compare the benefits of growth from scale vs. scope (Chandler, 1962,
1977, 1990), or of entry and exit over time (Chang, 1996); rather, it is to determine whether,
as a sector’s core evolves, moving closer to it yields advantage. We find that it does.
DATA DESCRIPTION
This study considers how Bank Holding Companies (BHCs), the predominant corporate
structures in U.S. banking, changed their scope over time. As regulated entities, all BHCs are
required to report any change to their structure, including subsidiaries entering or exiting the
organization due to acquisitions of going concerns, de novo formations, sales, changes in
ownership status, liquidation, or becoming inactive. For the first time, all this information has
been assembled in a consistent panel covering the entire population (Cetorelli & Stern, 2015).
Online Appendix A1 contains relevant summary statistics of the database.
12 We feel that our approach delivers on the concluding exhortation of Bryce and Winter (2009), who note that
“[strategies] in a diversified firm, require longitudinal assessments of market entry choices. Yet, perhaps
surprisingly, there are a limited number of empirical studies in the literature that take this perspective.”

12
By definition, all BHCs control one or more commercial bank subsidiaries—i.e.
depository institutions that extend credit to households and corporations. Until the late 1980s,
the U.S. banking sector had remained highly homogeneous, with such commercial bank
subsidiaries being the dominant components of each banking firm, and the related deposit and
loan activity representing the core of the sector. This is not surprising, given that U.S. banks
had been effectively constrained for decades by the Glass-Steagall Act of 1933, with bank
regulators maintaining a very narrow concept of the so-called “business of banking”
(Omarova, 2009). This view progressively broadened, however, and by the end of the 1980s
an influential Interpretive Letter of the Office of the Comptroller of the Currency set forth a
very broad interpretation of activities related to banking, and that were therefore permissible
under the laws and regulations of the time (Office of the Comptroller of the Currency, 1989).
From that point onwards, BHCs could operate in an unrestricted environment for the first
time, all subject to the same regulation, launching the significant transformation of scope that
characterized the sector for the following two decades.
This change also coincided with the end of a severe, decade-long banking crisis “…of a
magnitude not seen since the Great Depression…” (FDIC, 1997). The crisis culminated with
the passage of the FDICIA Act in 1991, marking the dawn of modern banking regulation
(Spong, 1994). Hence, for the purposes of our study, 1992 marks the start of our panel. When
the financial crisis of 2007–09 struck, the process of scope transformation came to a sudden
halt, as the result of changing economic incentives as well as significant regulatory reform
introducing new constraints on BHCs’ business scope. We therefore use the period between
1992 and 2006 as a laboratory to analyze the process of scope transformation in the sector.13
Because we focus on firms’ performance, we have merged the database with information on
13 In Online Appendix A7 we have run tests to consider whether expansion into related segments, while
beneficial during the growth era of the 1992–2006 expansion, might cause the demise of banks during or after
the financial crisis. Our analysis confirms that this is not the case: our findings hold even during one of the
sector’s most tumultuous periods.

13
BHCs’ own consolidated financials (both balance sheet and income statement items). The
matched sample consists of a panel of 3,206 unique BHCs for which we have financial data.
This set of firms consistently accounts for the virtual totality of banking assets.
Defining business scope, expansion, and exit
For each subsidiary of a BHC, the database reports its primary and, where applicable,
secondary business activity. Only 3 per cent of all subsidiaries in the database ever report a
secondary business activity, suggesting that for the vast majority of cases, the subsidiaries are
narrow in scope and the database accurately reflects their activities. Also, less than 2 per cent
of the subsidiaries ever change their primary or secondary activities—suggesting that, at least
in terms of organizational structure, firms change their scope predominantly by creating new
subsidiaries or shedding existing ones. Both primary and secondary activities are classified
according to the finest (six-digit) North American Industry Classification System (NAICS)
code. Since full six-digit codes are not available for all segments, we aggregated codes at the
five-digit level.
We define business scope as the number of different five-digit codes that are under a
BHC’s organizational umbrella.14 For example, a BHC that controls (one or more)
commercial banks (NAICS 52211), (one or more) securities brokerage firms (NAICS 52312),
and (one or more) life insurance carriers (NAICS 52411) would have a scope equal to 3. By
extension, we define the expansion of scope as the addition of one or more subsidiaries in a
five-digit NAICS that had never been part of the organization before. From here on, we refer
to such NAICS as “new” segments, indicating that they are new to the firm (as opposed to
new to the sector). We identify an expansion of scope whether it originates from a
14 For robustness, we also ran all our analyses on four-digit NAICS. This analysis (available upon request)
produced consistent results.

14
subsidiary’s primary or secondary segment.15 Conversely, we define exit as the complete
elimination of a previously held NAICS (whether through a sale of the entity, spin-off, or
liquidation).
Commercial banking as common core, and evolution of scope
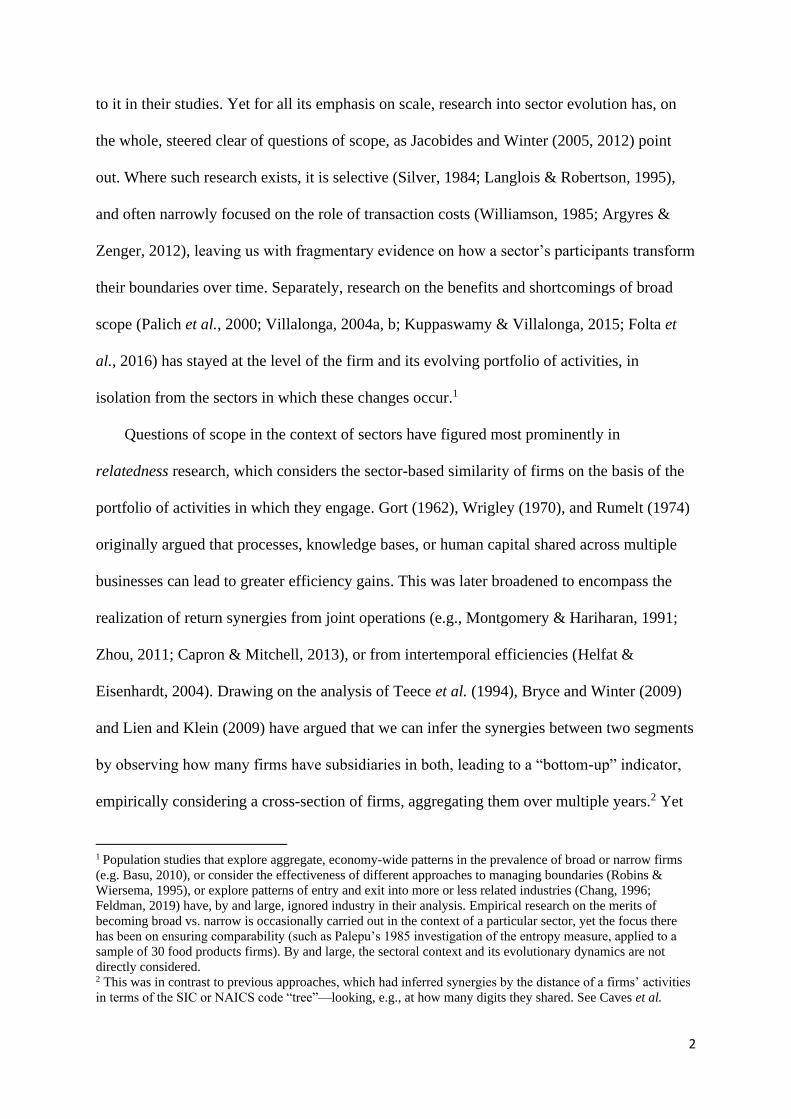
Table 1 displays the composition of subsidiaries in the population of BHCs for reference
years. The first row shows that the entirety of the population has at least one commercial
bank subsidiary (NAICS 52211), thus confirming that commercial banking represents the
common core of the sector—that is, the single segment that remains as a perennial fixture of
the core throughout its evolution during our study period. That commercial banking
represents the sector’s common core is also indicated by the importance of commercial bank
subsidiaries’ assets. Table 2 displays the mean and median ratios of commercial banking
assets to total BHC assets, for the entire population and for those subgroups of BHCs that
expanded their scope at any point. The figures provide further confirmation that commercial
banking represents the common core in the sector—even for BHCs that expand scope. The
finding is unchanged if we construct equivalent ratios using income data instead of asset data.
Figure 1a also shows that most BHCs are “simple” organizations when they are first
observed in the database, with most entities starting as commercial banks (NAICS 52211) or
having subsidiaries in just one or two additional segments. This is a compelling feature of the
population, since in most cases we see a process of business scope transformation driven by a
relatively homogeneous base of similar firms—rather than by “legacy” firms that already had
a more complex scope before becoming BHCs.
As noted previously, the process of expansion is broadly diffused—not just the practice
15 Restricting the identification to consider only subsidiaries’ primary business segment would be a more
conservative approach, under the presumption that if a NAICS is observed as a secondary activity, it might not
be considered economically important enough to qualify as an expansion of scope. At the same time, including
secondary NAICS improves the overall information set on BHCs’ activity. We have run the entire analysis
excluding secondary NAICS’ information, and the results were extremely robust throughout.

15
of a select few. Figure 1b reports, in its upper part, the number of BHCs that pursued some
degree of scope expansion in every year. We see a consistent number—about 200 institutions
per year in the early 1990s—adding new segments, and then a ramping-up over time,
reaching a peak of over 400 per year in the early 2000s. The trend then reverts—but,
remarkably, there is still a relatively consistent cross-section of institutions entering new
segments. Overall, more than half of the observed population engages in at least some degree
of scope expansion.
One might object that much of what we see as strategic may simply reflect the passive
incorporation of businesses resulting from merger and acquisition (M&A) dynamics. But this
is not borne out by the data, which reveals that only 10% of scope expansions were ever the
result of M&A activity between BHCs. Nevertheless, in the analysis of performance, we
explicitly take into account the M&A dynamics within each BHC. Finally, we document that
differences in scope are economically meaningful and not a product of regulatory arbitrage
by estimating the relationship between scope and revenue components. We find that
ownership of an additional unique five-digit NAICS code is associated with an increase in
bank interest and non-interest revenues of about 0.74%. These results are discussed fully in
the Online Appendix A2.
Measuring relatedness, and the evolving core
Since our central question is the differential impact of where firms expand to, we need to
address the “relatedness” of segments head-on. To do so, we start with traditional, static
measures of both NAICS hierarchical distance and NAICS overall coincidence in the BHC
sample, and build up to a new, dynamic measure of inferred relatedness. As stated earlier, all
BHCs control at least one commercial bank subsidiary (NAICS 52211). Commercial banking
was and remains the common core of the sector, even as many BHCs over time embark in
significant scope expansion (see Online Appendix A3 for further details). As such, the

16
metrics of relatedness we present below can be constructed from this point of origin.
Following Caves et al. (1980), our first measure is the “distance relatedness” of a given
NAICS code relative to code 52211. NAICS codes that share the same first four digits with
52211 are assigned a distance of 1; those that share only the first three digits are assigned 2,
etc. The prediction would be that entering more distant segments should have a relatively
worse impact on performance (see a description in, e.g., Markides & Williamson, 1994). A
second, albeit simpler metric of relatedness differentiates between scope expansions into
financial NAICS (codes beginning with 52) and non-financial NAICS (all other codes). This
“NAICS 52 relatedness” is particularly relevant in our context, where narrow banks can be
contrasted with broader BHCs.
However, as Bryce and Winter (2009), Weiss (2016), and others note, NAICS-distance is
a problematic measure of true relatedness, as there may very well be segments that are
“further away” from the common core in terms of classification codes, yet close in terms of
relatedness. In banking, for example, real estate is a non-NAICS-52 segment that is
nevertheless likely to offer direct synergies with commercial banking. Bryce and Winter
(2009), following the suggestion of Teece et al. (1994), proposed an alternative approach,
where the relatedness of two segments is inferred from the data, by the relative frequency
with which those two segments are actually observed in the population under study.
The fact that we have direct and complete observations of the segments for all BHCs in
the population allows us to improve on existing measurements of such overall coincidence, as
we can observe the relative frequency of co-occurrence of each NAICS in relation to the
common core (NAICS 52211). So, for example, in 2005, there were 2,215 BHCs in our
observed population (Table 1). All, of course, had at least one 52211 subsidiary. Out of these
2,215 BHCs, 1,088 (or 49%) also reported subsidiaries with NAICS 52599, which includes,
e.g., mortgage real estate investment trusts, collateralized mortgage obligations, and other

17
special purpose financial vehicles. Also in 2005, 594 BHCs (about 27%) reported control
over insurance agency subsidiaries. In the spirit of Bryce and Winter (2009), these two
segments are considered more related to commercial banking than, say, credit card issuing,
which in the same year was reported by just 20 distinct BHCs (less than 1%). The expectation
here would be that greater coincidence overall would be positively related to the performance
impact of expansion into a new area.16
Following Bryce and Winter (2009), we therefore start by reporting a time-invariant
overall inferred relatedness over the entire sample period. This “overall coincidence” measure
of a given five-digit NAICS code is defined as the average percent of BHCs holding that
NAICS code over the entire sample period.
However, while we draw on Bryce and Winter (2009) to establish the role of overall
coincidence, we depart from their analysis since, unlike them, we are not content to look at
the time-invariant aspects of coincidence.17 For that we consider instead a dynamic measure,
which we define as “modal relatedness,” by calculating the share of BHCs that own each
particular NAICS code at each point in the sample period. This second approach thus yields a
time-varying, cross-sectional ranking of the relative importance of each NAICS segment in
the U.S. banking sector, which allows to capture the sector’s evolution and the shifting
16 That said, there is a scale-specific consideration that might be in play here. If, for instance, some segments
(such as having an in-house executive education subsidiary) are only relevant for larger (and, as such, fewer)
firms, then this segment is less likely to be commonly held across banks. A finer-grained analysis of a segment’s
“coincidence conditional on size” might yield a different set of segments, but also a different subsample. We
fully acknowledge that, beyond “average popularity,” a more refined picture might be possible, but we want to
assess attributes for the sample as a whole, as further analysis would exceed what can be accomplished in a
paper. 17 In addition to focusing on a time-variant measure, we also use a different way to assess relatedness on the
basis of observed coincidence. Bryce and Winter (2009) provide an economy-wide measure of coincidence, by
looking, within their sample, at all the pair-wise combinations of sectors, and calculating a ratio of actual
coincidences divided by theoretically possible coincidences, which yields a score for each pair of sectors. This
creates a matrix of links between sectors, and, for the sectors where the coincidences are not observed in the
data, they ascribe the shortest path distance between every pair of nodes in the weighted distance matrix. This
yields a comprehensive pair-wise measure, which can be used to assess whether an expansion (given the set of
sectors of a firm) into a new four-digit SIC is more or less related, drawing on the inferred relatedness the
sample has yielded. Our interests are narrower, as we focus on how distant various segments are from the
common core (NAICS 55221). This allows us to focus on a more parsimonious, if time-varying measure,
explained below.

18
patterns in BHCs’ structure as they change scope.
We further posit that expanding scope to a commonly owned NAICS code should yield a
relatively better performance outcome. This allows us to capture the fact that adopting certain
NAICS codes may have very different implications at different points in the banking sector’s
evolution, as Chandler’s pioneering contributions showed. Thus, our proposed metric of
modal relatedness captures the evolving frequencies of coincidence of each NAICS over
time. As Table 1 shows, the relative ranking of segment subsidiaries held by BHCs differs
significantly from 1995 and 2000, as technology, competition, and regulation (or perhaps
fads) compel banks to change their scope.
Figure 2 offers a stark visualization of the changing degree of modal relatedness over the
sample period for a representative subset of NAICS codes. For instance, the above mentioned
NAICS 52599 was hardly present within the population in the early 1990s, but became a
staple for BHCs in later years. The reason for its growing popularity was the transformation
of the technology of financial intermediation caused by the asset securitization boom, which
incited banks to move into it, as new synergies emerged as a result. Conversely, NAICS
53111, which includes entities managing residential dwellings, was popular in the early
1990s—presumably a time when balance-sheet assets such as mortgages and their collateral
defined the predominant scope of a commercial bank—but later declined into obscurity,
probably mirroring the subsequent evolution toward the originate-and-distribute model of
intermediation. NAICS 52312, “Securities brokerage,” and 52421, “Insurance agencies and
brokerages,” start at similar levels of popularity but diverge later on.
ANALYSIS
Measuring the correlation of BHC aggregate performance and scope change
Our objective is to assess the performance impact of firms’ change of scope, on the basis of
where they expand, as sectoral patterns of relatedness evolve. First, to establish a baseline, we

19
look at the impact of any instance of scope expansion—that is, the addition of subsidiaries in
new segments by a BHC at a given point in time. Since we run our empirical analysis at an
annual frequency, we use the sum of new NAICS that appeared in a BHC in a year as a
measure of scope expansion. As our interest is in assessing the impact of changing a bank’s
scope, we also look at exits from NAICS. Our data thus allow us to differentiate the
performance impact across banks that build and maintain broader scope, as opposed to those
that enter new segments while exiting others at the same time (“turnover”), consistent with
the idea of strategic renewal (Capron et al., 2001; Folta et al., 2016). To capture these
dynamics, we run the following specification:
𝑃𝑒𝑟𝑓𝑜𝑟𝑚𝑎𝑛𝑐𝑒𝑖,𝑡 = 𝛼 + 𝛽 ∙ 𝐶𝑢𝑚 𝐴𝑑𝑜𝑝𝑡𝑖𝑜𝑛𝑖,𝑡−𝑗 + 𝛾 ∙ 𝐴𝑙𝑙 𝐸𝑥𝑖𝑡𝑖,𝑡−𝑗 + 𝛿 ∙ 𝐶𝑢𝑚𝐴𝑑𝑜𝑝𝑡𝑖𝑜𝑛𝑖,𝑡−𝑗 ×
𝐸𝑥𝑖𝑡𝑖,𝑡−𝑗 + 𝜃 ∙ 𝑆𝑐𝑜𝑝𝑒𝑖,𝑡−𝑗−1 + 𝛯 ∙ 𝑂𝑡ℎ𝑒𝑟 𝐶𝑜𝑛𝑡𝑟𝑜𝑙𝑠𝑖,𝑡−𝑗−1 + 𝛷𝑖 + 𝛹𝑡 + 휀𝑖,𝑡 (1)
The benchmark metric of performance is the BHC i accounting return on equity (ROE)
measured in year t. The standard objection to using accounting metrics of performance is that
they may not properly reflect the overall level of risk-taking. Further, the quality of
accounting standards may not be homogeneous in the cross-section of firms under study.
However, there are good reasons why concerns over the use of accounting metrics are less
acute for this particular study. First, net returns reported in BHCs’ income statements include
a component of “provisioning” for expected losses, which will be naturally correlated with
the level of risk each firm is taking.18 Moreover, in a sector subject to centralized, supervisory
monitoring, accounting standards are bound to be more homogeneous and comparable across
reporting BHCs than they would be for cross-sections of corporations not subject to
supervisory authority. Also, the data strongly indicates that scope transformation occurs
broadly across the entire population of BHCs, and not just among listed companies. For this
18 In fact, one could argue that, for this particular sector, there may be a possible upward bias in the use of
market-based metrics: If scope expansion leads to circumstances where a BHC is “too complex to let fail,”
markets may incorporate a valuation premium associated with this potential regulatory subsidy.

20
reason, we run our benchmark analysis on the entire population of BHCs, thus privileging the
use of ROE as the default metric of performance.19 The main regressor of interest is Cum
(Cumulative) Adoption, defined as the total number of new NAICS that a BHC has added in
the recent past. As we consider potential effects, it is plausible that expanding into a new
segment may require a period of adjustment before any beneficial effect pans out. For
example, one might expect that a commercial bank expanding into, say, investment banking
needs to build a track record before it can generate returns from its new unit. Thus, value-
enhancing scope expansions might initially reduce ROE, and only gradually lead to
increasing ROEs.20 To allow for this, we look at scope expansion activity over the previous n
years, and measure the impact on performance at time t. In our baseline specification, we set
j=3, so that the variables with a t-j subscript are meant to capture a sum over the previous
three years.21
Financial data for individual subsidiaries is not available, so we cannot measure the
intensity of engagement by a BHC in a new segment.22 However, our focus is on banks that
add segments that are new to the banks themselves (i.e. an extensive margin of business
scope expansion), and our data are uniquely positioned to inform us about this.
The variable All Exit, meanwhile, measures the total number of NAICS that the BHC
19 We have nevertheless also performed the analysis using a market-based measure of performance, Tobin’s Q,
as well as metrics of leverage (which also helps assess ROA impact, as ROE = ROA x leverage) and risk,
measured by the banks’ Z-score. See Online Appendix A8. 20 A similar story can be told for M&A, given the well-known concerns that mergers are costly in the short term
because they require firms to integrate their corporate cultures, staff, systems, etc. 21 We ran alternate specifications from one to five years, and the effects were most visible with the three-year
lag—which is also, managerially speaking, a sensible period for the fruits of expansion to affect ROE. Tobin’s
Q impact was, unsurprisingly, over the same period, as the capital markets incorporated these inter-temporal
tradeoffs. The consistency between our ROE, cumulative lag results, and the Tobin’s Q impact, discussed
below, increases our confidence in this specification. Finally, we used different weights, and concluded that
under-weighting recent expansions and over-weighting previous ones (i.e., ones three years out) helped improve
the fit, suggesting that full impact of expansion into new areas does take time, and that three years appears to be
the most effective predictor. 22 For many activities it is also not obvious that total asset size, or total income, would reflect the impact of the
new segment. Some have a small organizational footprint but a significant impact (e.g. asset management
services, data management, financial technology). Be that as it may, we fully acknowledge that the impact of
entry may depend on entry size, and we do not have this information at hand.

21
completely dropped over the same three-year period, while the interaction between these first
two variables captures the phenomenon of “turnover” as defined above. Controls include the
level of scope¸ i.e. the count of unique five-digit NAICS within the BHC, before the three
years of expansions captured by Cum Adoption. We also include basic firm-specific controls
that should have a direct and independent impact on the performance of a bank—and for
which, at the same time, one could argue that the metric of scope could serve as a proxy. For
example, scope per se may not have any particular impact on performance, but could simply
be a reflection of the size of the bank, with larger banks exhibiting higher returns on average,
possibly indicating market power, or easier access to cheaper funding (e.g., Lang & Stulz,
1994). We therefore include the BHC’s log assets in all regressions. Likewise, as noted
earlier, regulation constrains scope expansion for banking firms with declining performance.
Capital adequacy is one of the main factors capturing a bank’s quality standing. Hence, we
include the BHC’s capital-to-asset ratio as a basic control of overall firm quality. Moreover,
we control for any M&A activity over the previous three years, as a way to condition on
possible scope expansions that might be just the indirect consequence of such activity. In
addition, we include the interaction of Cum Adoption with Scope, to allow for non-linear
effects of expanding scope depending on the extent to which scope is broad to begin with.
Finally, in order to account for latent heterogeneity in the population, we include BHC fixed
effects, 𝛷𝑖 , so our analysis informs us on how dynamics of scope transformation affect
firms, accounting for their heterogeneity. Also, both expansion decisions and performance
could be driven by common unobservable factors changing over time. For example, banks
may consider expanding during the upswings of macroeconomic cycles, when their
performance may also improve. We address this issue by adding time fixed effects 𝛹𝑡 to the
specification.
Relatedness and performance

22
Our goal is to capture the impact of relatedness of different NAICS (which may change as the
financial sector evolves), and use this information to assess the performance impact of banks’
entry into more or less related new segments. To estimate the possible differential effect on
performance of expansions with differing degrees of relatedness, we augment the previous
model specification as follows:
𝑃𝑒𝑟𝑓𝑜𝑟𝑚𝑎𝑛𝑐𝑒𝑖,𝑡 = 𝛼 + 𝛽1 ∙ 𝐶𝑢𝑚 𝐴𝑑𝑜𝑝𝑡𝑖𝑜𝑛𝑖,𝑡−𝑗 + 𝛽2 ∙ 𝐶𝑢𝑚 𝑅𝑒𝑙𝑎𝑡𝑒𝑑 𝐴𝑑𝑜𝑝𝑡𝑖𝑜𝑛𝑖,𝑡−𝑗 + 𝛾 ∙
𝐴𝑙𝑙 𝐸𝑥𝑖𝑡𝑖,𝑡−𝑗 + 𝛿 ∙ 𝐶𝑢𝑚 𝐴𝑑𝑜𝑝𝑡𝑖𝑜𝑛𝑖,𝑡−𝑗 × 𝐸𝑥𝑖𝑡𝑖,𝑡−𝑗 + 𝜃 ∙ 𝑆𝑐𝑜𝑝𝑒𝑖,𝑡−𝑗−1 + 𝛯 ∙ 𝑂𝑡ℎ𝑒𝑟 𝐶𝑜𝑛𝑡𝑟𝑜𝑙𝑠𝑖,𝑡−𝑗−1 +
𝛷𝑖 + 𝛹𝑡 + 휀𝑖,𝑡 (2)
Where, as before, Cum Adoption measures the total number of new NAICS a BHC added
over the previous three years, and where Cum Related Adoption measures the degree of
relatedness to core banking of the new NAICS included in Cum Adoption. We capture Cum
Related Adoption using the four alternative relatedness metrics described above: distance,
NAICS 52, overall coincidence, and modal relatedness. This specification allows us to
compare the impact of moving into NAICS that are (a) close in terms of their hierarchical
tree; (b) financial or non-financial by nature; (c) frequently found in BHC portfolios on
average; or (d) in NAICS that are popular at a specific time in the sector’s evolution,
respectively.
RESULTS
Table 3, column 1 reports the results based on specification (1). This is a benchmark
specification where we look for the impact on performance of unconditional scope expansion,
as captured by Cum Adoption. As the results in column 1 indicate, the act of expanding into
new NAICS is unconditionally associated with a lower return on equity.23
23 While expansion might reduce ROE, it might still be beneficial from the vantage point of total value creation,
provided that the additional returns produced (ROE-dilutive as they may be) are higher than the cost of capital,
leading to a positive NPV. See Jacobides, Winter, and Kassberger (2012) for a broader discussion of total profits
vs profitability, and Levinthal and Wu (2010) for a specific illustration of how the pursuit of scale-free resource
advantages can reduce profitability and increase profits in diversification. That said, our measure looks at the
relative benefits of different types of expansion, so focusing on ROE provides a clean measure.

23
Accounting for exiting strategies is also important, suggesting that firms that engage
more broadly in scope expansion but also retrench when (presumably) their results are poor,
on net display higher ROE. At the same time, the results in column 1 indicate that overall
turnover of segments (as captured by the Cum adoption x exit interaction term) does not
improve ROE —if anything, lowers it slightly.
The regression results also indicate that the impact of unconditionally expanding scope
seems to have a non-linear component, with expansion among institutions with large initial
scope gradually becoming associated with a positive impact.24 The importance of
unconditional scope expansion is shown even after controlling for BHCs’ M&A activity,
which we estimate to be associated with lower ROE as well.25
We continue with the presentation of our main results, where we establish empirical
evidence of the differential impact on performance of scope expansion based on the
relatedness of the new segments at the time of expansion. Table 3, column 2 shows the results
of a regression based on specification (2), where Cum Related Adoption measures the average
distance (measured from NAICS 52211) of NAICS codes adopted over the previous three
years. The estimated coefficient for Cum Adoption remains similar to estimates in column 1,
and the coefficient for Cum Related Adoption implies that expansion into NAICS that, on
average, share one fewer digit with code 52211 is associated with only slightly lower ROE.
24 The robustness of this result, however, is challenged in robustness tests (presented in the Online Appendix),
which suggest that the non-linearity is driven by a subset of BHCs that enter the database while already
relatively broad in scope to start with (so that we cannot follow their entire evolution). What matters for us,
though, is that the main result on unconditional scope expansion remains unchanged, even after the robustness
tests. 25 While the baseline control for M&A activity is represented by the cumulative number of subsidiaries acquired
through M&A over the previous three years, we tried three alternative specifications, for which we ran the full
set of analyses reported in the paper (results available upon request). First, we used an indicator variable that
was activated if M&A activity occurred; second, we considered all adoptions that were the result of M&A
separately; and third, we excluded from the computation of the cumulative adoptions those that were the result
of an M&A event at the top-holder level. None of these affected our results. The robustness is also due to the
fact that—as remarked earlier—only a small fraction of all scope adoption events come from M&A activity.

24
Together, the stable effect from overall adoption and the small coefficient for related
adoption may result from the fact that code distance is a poor measure of relatedness.
Next, we try the alternative distance-based metric that separates expansion in NAICS 52
segments from any other. In this alternative specification, Cum Related Adoption is the sum
of newly adopted segments that are within the 52 range. Column 2 reports that Cum Adoption
is associated with lower ROE, and Cum Related Adoption is associated with higher ROE of a
similar magnitude. This implies that expansion into non-financial (i.e., non-52) NAICS codes
is associated with a fall in ROE of about 0.32%, while expansion into financial (i.e., 52)
NAICS is associated with a negligible difference in ROE. If we assume that this relatedness
measure has less measurement error than the distance-based measure in column 1, then these
results imply that expansion into banking-related NAICS codes has less of an effect on
overall ROE than expansion into non-financial NAICS codes.
We next turn to the overall coincidence measure of relatedness, computing it, following
the implementation of Bryce and Winter (2009), as a time-invariant average for each NAICS
over the entire sample. Cum Related Adoption is measured as the sum of overall coincidence
relatedness for all of the NAICS that the BHC has adopted over the past three years. Is there a
significant differential impact on performance associated with scope expansion in NAICS
that, on average over the sample period, are more commonly held by BHCs? The estimated
coefficient on Cum Related Adoption in Column 3 implies that adopting NAICS codes that
are, on average, owned by one percentage point more BHCs over the sample period is
associated with 2.13 basis points higher ROE. This estimate is not very precise, which we
believe to be understandable given that the banking sector has undergone significant change
over the sample period. Indeed, this was the reason we focused on this sector.
Finally, we focus our attention on the evolving metric of modal relatedness, shown in
Column 4, which captures the dynamic nature of relatedness. As depicted in Table 1 for three

25
representative years, and in Figure 2 for selected NAICS over time, modal relatedness is the
time-varying percentage of BHCs in the entire population that hold a given NAICS as part of
their portfolio of subsidiaries.26 Cum Related Adoption is measured as the sum of modal
relatedness for all of the NAICS that the BHC has adopted over the past three years. Thus,
column 4 reports that adopting NAICS codes that are owned by one percentage point more
BHCs in that sample period is associated with 2.15 basis points higher ROE.
Column 4 strongly indicates that expanding into segments that are more popular among
BHCs at the time of expansion is associated with higher ROE. Using the estimates in column
4, we can compare the effects of expanding into a given NAICS code when it is popular or
unpopular. We run this exercise focusing on a single NAICS code, reporting the hypothetical
impact of its addition to the organizational structure of a BHC for different degrees of
prevalence among BHCs at the time of adoption. Take, for instance, NAICS 52421,
“Insurance agencies and brokerage.” Over the sample period, it had a minimum modal
relatedness of 12.2%, and a maximum of 37.5%, with fluctuations over time. A BHC that
adopted this NAICS at its nadir of modal relatedness is expected to exhibit a lower ROE of
approximately 0.15 percentage points (-0.39 + 0.0215*12.2). Adopting this NAICS at its
maximum modal relatedness would be associated with a higher net ROE of 0.36 percentage
points. Hence, adopting the same NAICS at different points in time can have very different
implications for ROE.
The findings, then, suggest that dynamic measures of relatedness are not only
theoretically appealing, but also have (in the context of a shifting sector) the ability to explain
more variance, more consistently than other measures that rely upon NAICS distance or
26 If modal relatedness is a stock variable, which corresponds to existing research on relatedness inferred by
coincidence, we also consider its “flow” counterpart as an additional measure of relatedness. As such, we
classify individual NAICS on the basis of how many BHCs expanded in them over the previous year. This
yielded a natural ranking, with “hot” NAICS at the top, with the understanding that the fact that many BHCs
choose to enter the same segments at the same time may indicate bigger rewards at that time. Using such a flow
metric yielded consistent results (available on request).

26
overall coincidence across time (à la Bryce & Winter, 2009). We concur with Weiss (2016)
that measures of overall coincidence are superior to those obtained by looking at the NAICS
tree, and find that looking at the shifting coincidence patterns (i.e., the evolving core of modal
NAICS) provides even stronger results, reflecting the changing dynamics of the sector. We
find that the average coincidence of NAICS is not strongly correlated with success, whereas
the evolving coincidence, in the spirit of Chandler (1977, 2001, 2005), appears to be strongly
correlated with success.
Disentangling treatment and selection effects for BHC expansion
Scope transformation is obviously a choice and not a random occurrence, which raises a
question over the interpretation of our results. Specifically, banking firms that are improving
in terms of ROE may expand in particular ways, or firms with certain characteristics may
systematically choose to make strategic scope expansion choices that suit them, so that our
main results that rely on modal relatedness could be the result of selection rather than
treatment. Our analytical strategy should help to address the impact of selection. First, we
draw our inference from model specifications with BHC-level fixed effects, so that any time-
invariant, BHC-specific trait that drives expansion dynamics is fully absorbed. Second, our
panel regressions include important covariates, such as asset size, level of capitalization,
scope before expansion takes place, alternative exiting strategies, and M&A occurrences,
which should account for selection through effective use of observables. However, there may
still be interpretation challenges. For example, it may still be the case that banks who have
been on a better performance path in the past might tend to choose more conservative scope
expansion strategies, thus adopting NAICS that are already comparatively popular among
BHCs. Such hypothetical systematic difference in expansion choices, solely based on past
performance, would represent a violation of the parallel trend assumption: the future ROE of
BHCs that adopt NAICS with high modal relatedness is higher not because these NAICS

27
contribute more to overall performance, but simply because their ROE was already on a
steeper uptrend than that of BHCs expanding in NAICS with lower modal relatedness.
Conditioning on observable covariates and fixed effects may not be sufficient to assuage this
concern.
We test the parallel trend assumption using a standard procedure: We identified all
BHCs that expanded their scope in a given year and separated them into two groups based on
whether they expanded into a NAICS segment with one of the 10 highest modal relatedness
scores that year.27 We then ran regressions of ROE on up to five years of lags of this modal
relatedness dummy variable. If the ROEs of these two groups of BHCs follow a roughly
parallel trend, the point estimates on the lags of the modal dummy should be close to zero.
Figure 3 confirms this. On average BHCs that expanded into high modal relatedness NAICS
exhibit roughly the same performance in the proximity of the expansion decision as BHCs
that did not.
Confirming a non-violation of the parallel trend assumption provides comfort to a
causal interpretation of our results. Yet, the parametric assumptions implicit in our model
specification (the vector of observables have a linear impact on the outcome variable) may
still generate selection biases. In particular, it is still possible that the outcome variable
follows a different dynamic process for treated and untreated units, so that extrapolating the
counterfactuals from the simple average treatment effect estimated in the benchmark
regressions may still embed some biases. To address this issue, we complement the
parametric approach used in our main analysis with three semiparametric treatment effects
strategies developed in the field of program evaluation. With the first approach, a regression
adjustment method, we allow for the dynamic process for the outcome variable (BHCs’
27 Sensitivity tests setting the modal relatedness “cutoff” as top 5 and top 15 of the rank ordering of segment
popularity yielded qualitatively similar results.

28
performance) to be different for BHCs that expanded into NAICS segments with high modal
relatedness (treated) from those that did not (untreated), and the estimations of the effect of
the treatment are adjusted accordingly. The second approach, an inverse-probability weights
method, is based on the estimation of the likelihood to be treated, so that in garnering the
effect of the treatment, individual observations are weighted differently on the basis of such
estimated likelihoods. The third is a combination of the two: a double-robust estimator
method, considered to be the preferred approach in the literature (Imbens & Wooldridge,
2009). More details on the implementation of these alternative methods, and the
corresponding results are presented in Online Appendix A5. The results, in Table A5,
corroborate our main findings, offering strengthened support to the conjecture that
expansions in segments with high modal relatedness yield relatively beneficial effects on
future BHC performance.
REFINEMENTS AND ROBUSTNESS
Vertical integration and changes in scope; change in entropy measures
We ran a battery of tests to confirm the robustness of our choice of relatedness metric. First,
we wanted to run a horse race between cumulative related adoption based on modal
relatedness and NAICS 52 relatedness, which was also positive in the results reported in
Table 3. Column 1 of Table 4 shows that when including both NAICS 52 and modal
relatedness, the latter is more important: The static NAICS 52 coefficient is reduced by 30%
when compared to its standalone regression, while the coefficient on modal relatedness
decreases by only 13%.
We also want to ensure that our results are not the spurious outcome of some other
potential confounding variables. As such, we consider two motivations for changing a firm’s
scope: a potential desire to bolster vertical integration (VI) given the presence of
Williamsonian transaction costs, and the potential desire to overcome external financing

29
frictions during periods of adverse capital market conditions. We construct a metric of how
vertically related a BHC’s scope expansions are by drawing on Input-Output Accounts Data
(IO table) from the Bureau of Economic Analysis (BEA).28 This is done as follows. Let n be
the five-digit NAICS adopted by the BHC at time t. From the input table at time t-1 we sum
across the inputs that n gives to each of the NAICS the BHC already holds. A high value of
the sum indicates that the addition of n significantly increases the upstream vertical
integration of segments in which the BHC is active. The sum is dynamic in that as a BHC
expands its scope, its opportunities for vertical integration also increase: In a BHC with a
large scope, there are more NAICS with which the new NAICS n can be vertically related.
We then normalize the inputs sum by dividing from it the total amount of inputs (across all
segments, regardless of whether they are held by the BHC) used by the NAICS that the BHC
already held prior to its expansion. The resulting metric, which we call Added VI, thus
captures the extent to which a given scope expansion increases the proportion of upstream
production that is housed within the BHC.
Column 2 of Table 4 includes Added VI (summed over all NAICS adopted over the past
three years) and its interaction with modal relatedness, allowing us to assess the extent to
which a firm enters into a commonly held VI sector in our BHC population.29 We find, first,
that VI is negative, and second, that the interaction between Cum Modal Adoption and VI is
positive: The value of VI increases with a segment’s relatedness, positively affecting ROE.
More important, adding the variable picking up the relative contribution to VI of the adopted
28 These tables provide information on how industries in the U.S. economy interact. For a given three-digit
NAICS industry i, the BEA constructs the input component of the IO table by calculating the annual U.S.
economy-wide dollar value of inputs provided by each three-digit NAICS industry (including industry i itself)
for the production of output by industry i. If industry i takes a large proportion of its inputs from industry j, then
we can reason that industry j is upstream in the production chain of industry i, and that the two industries are
vertically related. 29 Modal relatedness of some vertically related segments increases over time, and others less so. This reflects
BHCs choosing which of their related segments to hold. NAICS 541 (“Professional, Scientific, and Technical
Services”), which includes NAICS 54199 (mostly, specialized B2B service providers) and NAICS 54119
(“Legal Services”) gains popularity, while NAICS 561 (“Administrative and Support Services”) loses popularity
over our sample period, even though both maintain similar vertical linkages.

30
segment in our analysis does not detract from (evolving) relatedness, and thus our key
variable of interest, Cum Modal Adoption, remains robust.
Another potential explanatory feature, explored in the diversification literature, is the
“entropy measure,” introduced by Jacquemin and Berry (1979) and developed further by
Palepu (1985). This static measure, used in general population (as opposed to sector study)
settings, can be duly modified, to help us see whether the variance in ROE is not caused by
firms following the evolving core of the sector, but rather because of the way their
diversification pattern (in terms of the evolution of their Palepu score) evolves. Our objective
is to see whether the benefits of moving closer to the shifting core of the sector would be
robust to a firm-level variable that would consider the BHC’s changing entropy profile. So,
replicating our model specification, we ran a regression where we included total
diversification (in the Palepu sense) at time t-4 and then the change in both total and related
diversification (again, following the Palepu-style formulation above) over the following three
years, as we have to provide a dynamic equivalent of a static measure. Column 3 of Table 4
shows that the new variables do not explain variance in our setting. In Column 4 we included
such variables in a horse race with our metrics of scope adoptions. Both Cum Adoption and
Cum Modal Adoption preserve their sign and magnitude. Online Appendix 3A contains
details about the construction of such measures.
Finally, our results are also robust to the possible confounding factor of coinsurance
from diversification (Online Appendix A3), and likewise to running the analysis using
market-based metrics of performance (Tobin’s Q), and alternative metrics of risk, such as
leverage and the BHC’s Z-score (see Online Appendix A8).
CONCLUSION
This paper has shed light on the dynamics of sector transformation through the expansion of
firms into new segments, focusing on U.S. banking, through the BHC population from 1992

31
to 2006. As Chandler (1962, 1977) noted, the transformation of corporations is part and
parcel of the process of sector evolution. Chandler’s last two books, on the evolution of
electronics (2001) and pharmaceuticals and chemicals (2005), showed how the biggest firms
in these two sectors transformed both themselves and the sector as a whole, by broadening
their boundaries. However, the richness and detail of Chandler—like that of other business
historians who described such evolution, such as Silver (1984) and Langlois and Robertson
(1995)—comes at the cost of an inability to capture the entire sector, or to provide precise
estimates of the impact (or indeed appropriateness) of changes in scope. Drawing on a data
set of unprecedented depth and detail, we conduct a large-scale study of a significant sector in
a time of flux, examining firms’ changes in scope and experimentation with new activities as
they try to take advantage of their regulatory and institutional environment. Since the rules
are identical for all participants, and BHCs all start out as narrow, we can see how such
expansion played out. We find that the sector has a clearly defined core that evolves over
time, and that following this core pays off.
Our paper complements research in sector evolution with a comprehensive, large-scale
sector study of scope transformation, focusing on its drivers and consequences. Within this,
the established wisdom is partly confirmed. Expanding into new business segments is found
not to be beneficial, and has a performance impact that is an order of magnitude greater than
creating a new subsidiary in an existing segment.30
We also consider relatedness. First, we consider its impact as measured by hierarchical
NAICS distance and estimate a small and imprecise effect on ROE. We then consider a
coarser distinction between financial and non-financial expansion and find that non-financial
expansion is associated with lower ROE than financial expansion. Drawing on Bryce and
Winter (2009), we construct a time-invariant measure of relatedness based on the prevalence
30 We corroborate this point in the extension analysis reported in Online Appendix A6.

32
of certain NAICS codes but estimate imprecise results, which may be caused by the static
nature of this measure. Lastly, we consider a dynamic measure of relatedness based on how
many BHCs currently hold a given NAICS. We estimate that expansion into popular NAICS
is associated with higher overall ROE. This result withstands a battery of endogeneity tests,
suggesting that there is a persistent treatment effect of adopting NAICS that are currently
popular among other BHCs—“following the times,” as it were. This result is robust to the
inclusion of measures of vertical integration, changes in the entropy of expanding BHCs, and
measures of market risk, and still holds if we exclude BHCs with a minority of assets in
commercial banking. Finally, we also show that M&A at BHC level does not drive our
results, suggesting that this expansion is the result of a desire to broaden the scope of the
banking firm.
Our paper is the first to offer a systematic account of the dynamics of relatedness, based
on coincidence and sectoral evolution, and also the first to connect this measure to
performance. This extends the thesis of Teece et al. (1994) and shows that there is a net
benefit of expanding into the evolving core of a sector, which is not driven by selection. We
thus find support for the Chandlerian thesis, and also establish why sector studies should be
used to understand scope changes, and vice versa. Our approach, consistent with historically
based work emphasizing the role of shifting business models in financial services (Cetorelli
et al., 2012; Jacobides et al., 2014), may thus help us revisit the nature and benefits of
relatedness (Rumelt, 1982; Weiss, 2016) and the drivers of resource renewal (Folta et al.,
2016).
Our results are robust to using market-based metrics of performance, and are robust to
measures relating to vertical integration, capital market volatility, and firm-level entropy
changes. As to why BHCs would expand into segments that do not increase ROE, a number

33
of reasons can be put forth, although our paper does not discern them.31 Our paper is also
limited in terms of its normative implications. We have explicitly focused on a benign period
of increasingly permissive policy, regulatory flux, and radical technological change that
transformed both the process of financial intermediation and the scope of the majority of
firms. While we find that related expansion in banking may have helped BHCs in this
favorable period, and has not adversely affected their fate during the financial crisis, we did
not explore the broader social welfare impact that has resulted from the transformation of
BHCs. Benefits for BHCs who transform their scope do not imply concomitant benefits for
society as a whole; nor do they rule out the possibility of associated negative systemic
externalities (Tett, 2009; Rajan, 2011; Jacobides et al., 2014). This in an important issue, and
one that deserves dedicated study.
That said, our paper provides the first systematic, large-scale, longitudinal study of scope
changes and their performance implications in a sector, and raises the need to better combine
our understanding of scope and sector evolution—a path we hope will be more widely
followed.
31 There are three categories of reasons that we think can explain this pattern. The first is economically rational:
The most straightforward reason is that, whereas these moves reduce ROE, they still increase total profits and
have a positive NPV, inasmuch as the returns are higher than the cost of capital. As Levinthal and Wu (2010)
have noted, diversification can cause profitability to decline while total profits continue increasing, so that
economically rational expansion dilutes the rates of return. Less plausibly, it may be the case that while
unrelated expansions may not contribute to performance year in, year out, they can still contribute to the benefits
of scope expansion in particularly adverse states of nature. The second set of reasons for this pattern relates to
managerial agency: Different managerial teams have different risk appetites and may “gamble” on new
directions—an area we will consider in future research. The third set of reasons relates to fundamental
uncertainty: New segments entail uncertainty and experimentation, so there may be little ex ante understanding
of what will add value in the first place. Our paper cannot distinguish between these three sets of explanation.
Our aim was to document the pattern and leave the exploration of these competing hypotheses for future
research.

34
Acknowledgements
We would like to thank seminar participants at London Business School, The Wharton
School’s Management Department, Harvard Business School’s Strategy Group, MIT’s TIES
Group, LMU Munich’s ISTO, Cambridge University’s Judge School, Hitotsubashi U.
(Tokyo), EPFL, ETHZ, ESSEC, University of Rome III, BI Norwegian Business School,
EBRD, the Bank of England, Banque de France, the Fed Board, the New York, Boston, and
Cleveland Fed and the 2018 Chicago Financial Institutions Conference. Henri Servaes, Elias
Papaioannou, Andrew Scott, Emilie Feldman, Raffaella Sadun, Priyank Gandhi and Jacopo
Carmassi and anonymous reviewers provided useful feedback, and Connie Helfat offered
valuable Editorial guidance. Jacobides acknowledges financial support from the Institute of
Innovation and Entrepreneurship and RAMD at London Business School. Michael Blank has
provided invaluable research support. All remaining errors are our own.

35
References
Andrews, P.W.S., 1949. Manufacturing Business. Macmillan, London.
Agarwal, R. and Helfat, C.E., 2009. Strategic renewal of organizations. Organization science 20(2):
281-293.
Alchian A. 1950. Uncertainty, evolution and economic theory. Journal of Political Economy 58(3):
211-221.
Almeida H, Kim CS, Kim HB. 2015. Internal capital markets in business groups: evidence from
the Asian financial crisis. The Journal of Finance 70(6): 2539-2586.
Argyres, N.S. and Zenger, T.R., 2012. Capabilities, transaction costs, and firm boundaries.
Organization Science 23(6): 1643-1657.
Basu, N., 2010. Trends in corporate diversification. Financial Markets and Portfolio Management
24(1): 87-102.
Baum, J.A. and Singh, J.V. eds., 1994. Evolutionary dynamics of organizations. Oxford Univ Press.
Berry CH. 1971. Corporate growth and diversification. The Journal of Law and Economics 14(2):
371-383.
Breschi S, Lissoni F, Malerba F. 2003. Knowledge-relatedness in firm technological
diversification. Research policy 32(1): 69-87.
Bryce D, Winter S. 2009. A general interindustry relatedness index. Management Science 59(9):
1570-1585.
Campa J, Kedia S. 2002. Explaining the diversification discount. The Journal of Finance 57(4):
1731-1762.
Capron L, Mitchell W, Swaminathan A. 2001. Asset divestiture following horizontal acquisitions:
a dynamic view. Strategic Management Journal 22(9): 817-844.
Capron L, Mitchell W. 2013. Build, Borrow, or Buy: Solving the Growth Dilemma. Harvard
Business Review Press: Cambridge, MA.
Caves R, Porter M, Spence A, Scott J. 1980. Competition in an Open Economy: A Model Applied
to Canada. Harvard University Press: Cambridge, MA.
Cetorelli N, Mandel B, Mollineaux L. 2012. The evolution of banks and financial intermediation:
framing the analysis. FYBNY Economic Policy Review 18(2): 1-12.
Cetorelli N, Stern S. 2015. Same name, new businesses: evolution in the bank holding company.
Liberty Street Economics (September).
Chandler, A.D., Jr. 1962. Strategy and structure: chapters in the history of American industrial
enterprises. USA: Massachusetts Institute of Technology.
Chandler, A.D., Jr. 1977, The Visible Hand: The Managerial Revolution in American Business.
The Belknap Press of Harvard University Press.
Chandler, A.D., Jr. 1990. Scale and Scope: The Dynamics of Industrial Capitalism, Boston: The
Belknap Press of Harvard University Press.
Chandler, A.D. Jr. 2001, Inventing the Electronic Century: The Epic Story of the Consumer
Electronics and Computer Industries. Harvard University Press.
Chandler, A.D. Jr. 2005, Shaping the Industrial Century: The Remarkable Story of the Evolution
of the Modern Chemical and Pharmaceutical Industries. Harvard University Press.
Chang, S.J., 1996. An evolutionary perspective on diversification and corporate restructuring:
entry, exit, and economic performance during 1981–89. Strategic Management Journal 17(8):
587-611.

36
Chevalier J. 2000. Why do firms undertake diversifying mergers? An analysis of the investment
policies of merging firms. Working paper, The University of Chicago GSB and NBER.
FDIC. 1997. History of the eighties, an examination of the banking crises of the 1980s and early
1990s.
Feldman, E.R. Corporate Strategy: Past, present, and future. Strategic Management Review
Forthcoming.
Folta T.B., Helfat C.E., Karim S. (eds). 2016. Resource Deployment and Corporate Strategy (Book
35). Emerald Insight: Bingley, UK.
Gort M. 1962. Diversification and Integration in American Industry: A Study by the National
Bureau of Economic Research. Princeton University Press: Princeton, NJ.
Helfat C.E. 2000. Guest editor's introduction to the special issue: the evolution of firm capabilities,
Strategic Management Journal, 21(10-11): 955-9.
Helfat C.E., Eisenhardt K.M. 2004. Inter‐temporal economies of scope, organizational modularity,
and the dynamics of diversification. Strategic Management Journal 25(13): 1217-1232.
Helfat C.E., Raubitschek, R.S. 2000. Product sequencing: co‐evolution of knowledge, capabilities
and products. Strategic Management Journal, 21(10-11): 961-979.
Holbrook D., Cohen, W.M., Hounshell, D.A., Klepper, S. 2000. The nature, sources, and
consequences of firm differences in the early history of the semiconductor industry, Strategic
Management Journal, 21(10-11): 1017–41.
Imbens, G.W., Wooldridge, J.M., 2009. Recent developments in the econometrics of program
evaluation. Journal of Economic Literature 47(1): 5-86.
Jacobides, M.G., Winter, S.G., 2005. The co‐evolution of capabilities and transaction costs:
Explaining the institutional structure of production. Strategic Management Journal 26(5): 395-
413.
Jacobides, M.G., Winter, S.G., 2012. Capabilities: Structure, agency, and evolution. Organization
Science 23(5): 1365-1381.
Jacobides, M.G., Winter, S.G., Kassberger, S. 2012. the dynamics of wealth, profit, and sustainable
advantage. Strategic Management Journal 33(12): 1384-1410.
Jacobides, M.G., Drexler M., Rico J., 2014. Rethinking the Future of Financial Services: A
Structural and Evolutionary Perspective on Regulation. Journal of Financial Perspectives 2(1).
Jacquemin AP, Berry CH. 1979. Entropy measure of diversification and corporate growth. The
Journal of Industrial Economics 27(4): 359-369.
Jensen MC. 1986. Agency costs of free cash flow, corporate finance, and takeovers. American
Economic Review 76(2): 323-29.
Kuppuswamy V, Villalonga B. 2015. Does diversification create value in the presence of external
financing constraints? Evidence from the 2007–2009 financial crisis. Management Science 62(4):
905 – 923.
Lang L, Stulz R. 1994. Tobin’s q, corporate diversification, and firm performance. Journal of
Political Economy 201(6): 1248-1280.
Langlois, R.N., 2004. Chandler in a larger frame: markets, transaction costs, and organizational
form in history. Enterprise & Society 5(3): 355-375.
Langlois, R.N. and Robertson, P.L., 1995. Firms, markets and economic change: A dynamic theory
of business institutions. Routledge.
Levinthal DA. Wu, B. 2010. Opportunity costs and non-scale free capabilities: Profit maximization,
corporate scope, and profit margins, Strategic Management Journal 31(7):780 – 801.

37
Lieberman MV, Lee GK, Folta TB. 2017. Entry, exit and the potential for resource redeployment.
Strategic Management Journal 38(3): 526-544.
Lien LB, Klein PG. 2009. Using competition to measure relatedness. Journal of Management
34(4): 1078-1107.
Maksimovic V, Phillips G. 2002. Do conglomerate firms allocate resources inefficiently across
industries? Theory and evidence. The Journal of Finance 47(2): 721-768.
Malerba, F, Nelson R, Orsenigo L, Winter S., 2016. Innovation and the evoluation of industries:
history-friendly models. Cambridge University Press.
Markides C, Williamson P. 1994. Related diversification, core competencies and corporate
performance. Strategic Management Journal 15(S2): 149-165.
Matvos G, Seru A, Silva RC. 2018. Financial market frictions and diversification. Journal of
Financial Economics 127(1): 21-50.
Miller DJ, and Yang H. 2016. Product turnover: Simultaneous product market entry and exit. in
Folta T.B., Helfat C.E., Karim S. (eds). 2016. Resource Deployment and Corporate Strategy
(Book 35). Emerald Insight: Bingley, UK.
Montgomery C, Hariharan S. 1991. Diversified expansion by large established firms. Journal of
Economic Behavior and Organization 15(1): 71-89.
Neffke F, Henning M. 2013. Skill relatedness and firm diversification. Strategic Management
Journal 34(3): 297-316.
Nelson, R, Winter S. 1982, An Evolutionary Theory of Economic Change. The Belknap Press of
Harvard University Press.
Nightingale, J. 1978. On the Definition of `Industry' and `Market'. The Journal of Industrial
Economics, 27(1), 31-40.
Office of the Comptroller of the Currency. 1989. Interpretive letter no. 494.
Omarova S. 2009. The quiet metamorphosis: how derivatives changed the `business of banking’.
Miami Law Review 63: 1041-1109.
Palepu, K., 1985. Diversification strategy, profit performance and the entropy measure. Strategic
Management Journal 6(3): 239-255.
Palich LE, Cardinal LB, Miller CC. 2000. Curvilinearity in the diversification-performance
linkage: an examination of over three decades of research. Strategic Management Journal 21(2):
155-174.
Pehrsson A. 2006. Business relatedness measurements: state-of-the-art and a proposal. European
Business Review 18(5): 350-363.
Pil F. 2009. Diversification, Relatedness, and Performance, Gabler Wissenschaft: Wiesbaden.
Rajan R, Servaes H, Zingales L. 2000. The cost of diversity: the diversification discount and
inefficient investment. The Journal of Finance 55(1): 35-80.
Rajan R. 2011. Fault Lines: How Hidden Fractures Still Threaten the World Economy. Princeton
University Press: Princeton, NJ.
Richardson GB. 1972. The organisation of industry. The Economic Journal 82(327): 883-896.
Robins J, Wiersema MF. 1995. A resource‐based approach to the multibusiness firm: empirical
analysis of portfolio interrelationships and corporate financial performance. Strategic
Management Journal 16(4): 277-299.
Rumelt R. 1974. Strategy, Structure, and Economic Performance. Harvard University Press:
Cambridge, MA.

38
Rumelt R. 1982. Diversification strategy and profitability. Strategic Management Journal 3(4):
359-369.
Schoar A. 2002. Effects of corporate diversification on productivity. The Journal of Finance 57(6):
2379-2404.
Shleifer A, Vishny RW. 1989. Management entrenchment: the case of manager specific
investments. Journal of Financial Economics 25(1): 123-39.
Silver, M. 1984. Enterprise and the scope of the firm : the role of vertical integration. Robertson
Oxford.
Silverman BS. 1999 Technological Resources and the Direction of Corporate Diversification:
Toward an Integration of the Resource-Based View and Transaction Cost Economics,
Management Science, 45(8): 1109-1124.
Spong K. 1994. Banking Regulation: Its Purposes, Implementation and Effects. Federal Reserve
Bank of Kansas City: Kansas City, MO.
Stigler G. 1968. The Organization of Industry. Irwin: Homewood, IL.
Stiroh K. 2015. Diversification in banking. In The Oxford Handbook of Banking (2nd edition),
Berger A, Mollineux P, Wilson J (eds.), Oxford University Press, Oxford, UK; 219-243.
Stuckey, J.A. 1989. Vertical Integration and Joint Ventures in the Aluminum Industry. Harvard
Economic Studies, Cambridge, MA: Harvard University Press.
Teece D, Rumelt R, Dosi G, Winter S. 1994. Understanding corporate coherence: theory and
evidence. Journal of Economic Behavior and Organization 23(1): 1-30.
Teece DJ. 1980. Economies of scope and the scope of the enterprise. Journal of Economic Behavior
& Organization 1(3): 223-247.
Tett G. 2009. Fool’s Gold: The Inside Story of J.P. Morgan and How Wall St. Greed Corrupted Its
Bold Dream and Created a Financial Catastrophe. Free Press: New York.
United States. Office of Management and Budget. 2017. North American Industry Classification
System.
Villalonga B. 2004a. Diversification discount or premium? New evidence from the business
information tracking series. The Journal of Finance 49(2): 479-506.
Villalonga B. 2004b. Does diversification cause the ‘diversification discount’? Financial
Management 33(2): 5-27.
Weiss M. 2016. Related diversification: a critical reflection of relatedness and the diversification-
performance linkage. In Advances in Mergers and Acquisitions (Book 15), Finkelstein S, Cooper
C (eds). Emerald Group Publishing Limited: Bingley, UK; 161-180.
Wernerfelt B, Montgomery CA. 1988. Tobin's q and the importance of focus in firm performance.
The American Economic Review 78(1): 246-250.
Williamson O.E., 1975. Markets and Hierarchies: Analysis and Antitrust Implications. Free Press:
New York.
Williamson O.E., 1985. The Economic Institutions of Capitalism: Firms, Markets, Relational
Contracting. Free Press: New York.
Williamson, O.E., 1990. A comparison of alternative approaches to economic organization.
Journal of Institutional and Theoretical Economics. 146(1): 61-71.
Wrigley L. 1970. Divisional autonomy and diversification. Unpublished doctoral dissertation,
Harvard Business School.
Zhou YM. 2011. Synergy, coordination costs and diversification choices. Strategic Management
Journal 32(6): 624–639.
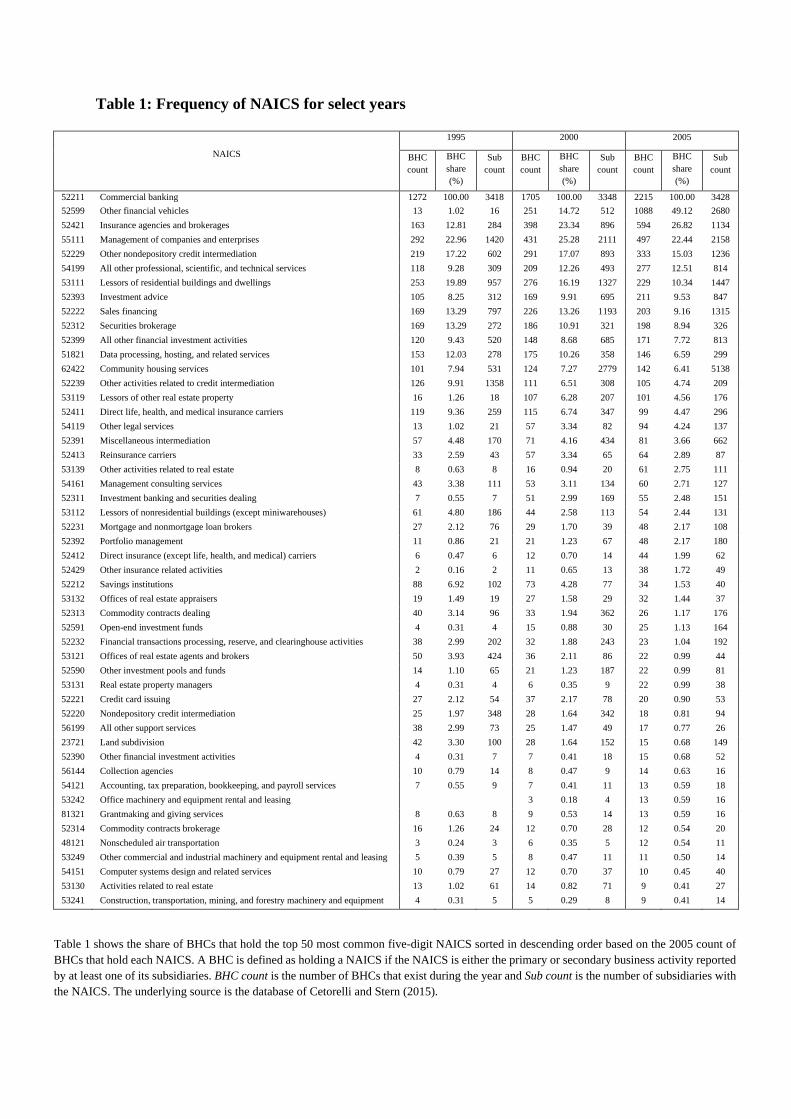
Table 1: Frequency of NAICS for select years
NAICS
1995 2000 2005
BHC
count
BHC
share
(%)
Sub
count
BHC
count
BHC
share
(%)
Sub
count
BHC
count
BHC
share
(%)
Sub
count
52211 Commercial banking 1272 100.00 3418 1705 100.00 3348 2215 100.00 3428
52599 Other financial vehicles 13 1.02 16 251 14.72 512 1088 49.12 2680
52421 Insurance agencies and brokerages 163 12.81 284 398 23.34 896 594 26.82 1134
55111 Management of companies and enterprises 292 22.96 1420 431 25.28 2111 497 22.44 2158
52229 Other nondepository credit intermediation 219 17.22 602 291 17.07 893 333 15.03 1236
54199 All other professional, scientific, and technical services 118 9.28 309 209 12.26 493 277 12.51 814
53111 Lessors of residential buildings and dwellings 253 19.89 957 276 16.19 1327 229 10.34 1447
52393 Investment advice 105 8.25 312 169 9.91 695 211 9.53 847
52222 Sales financing 169 13.29 797 226 13.26 1193 203 9.16 1315
52312 Securities brokerage 169 13.29 272 186 10.91 321 198 8.94 326
52399 All other financial investment activities 120 9.43 520 148 8.68 685 171 7.72 813
51821 Data processing, hosting, and related services 153 12.03 278 175 10.26 358 146 6.59 299
62422 Community housing services 101 7.94 531 124 7.27 2779 142 6.41 5138
52239 Other activities related to credit intermediation 126 9.91 1358 111 6.51 308 105 4.74 209
53119 Lessors of other real estate property 16 1.26 18 107 6.28 207 101 4.56 176
52411 Direct life, health, and medical insurance carriers 119 9.36 259 115 6.74 347 99 4.47 296
54119 Other legal services 13 1.02 21 57 3.34 82 94 4.24 137
52391 Miscellaneous intermediation 57 4.48 170 71 4.16 434 81 3.66 662
52413 Reinsurance carriers 33 2.59 43 57 3.34 65 64 2.89 87
53139 Other activities related to real estate 8 0.63 8 16 0.94 20 61 2.75 111
54161 Management consulting services 43 3.38 111 53 3.11 134 60 2.71 127
52311 Investment banking and securities dealing 7 0.55 7 51 2.99 169 55 2.48 151
53112 Lessors of nonresidential buildings (except miniwarehouses) 61 4.80 186 44 2.58 113 54 2.44 131
52231 Mortgage and nonmortgage loan brokers 27 2.12 76 29 1.70 39 48 2.17 108
52392 Portfolio management 11 0.86 21 21 1.23 67 48 2.17 180
52412 Direct insurance (except life, health, and medical) carriers 6 0.47 6 12 0.70 14 44 1.99 62
52429 Other insurance related activities 2 0.16 2 11 0.65 13 38 1.72 49
52212 Savings institutions 88 6.92 102 73 4.28 77 34 1.53 40
53132 Offices of real estate appraisers 19 1.49 19 27 1.58 29 32 1.44 37
52313 Commodity contracts dealing 40 3.14 96 33 1.94 362 26 1.17 176
52591 Open-end investment funds 4 0.31 4 15 0.88 30 25 1.13 164
52232 Financial transactions processing, reserve, and clearinghouse activities 38 2.99 202 32 1.88 243 23 1.04 192
53121 Offices of real estate agents and brokers 50 3.93 424 36 2.11 86 22 0.99 44
52590 Other investment pools and funds 14 1.10 65 21 1.23 187 22 0.99 81
53131 Real estate property managers 4 0.31 4 6 0.35 9 22 0.99 38
52221 Credit card issuing 27 2.12 54 37 2.17 78 20 0.90 53
52220 Nondepository credit intermediation 25 1.97 348 28 1.64 342 18 0.81 94
56199 All other support services 38 2.99 73 25 1.47 49 17 0.77 26
23721 Land subdivision 42 3.30 100 28 1.64 152 15 0.68 149
52390 Other financial investment activities 4 0.31 7 7 0.41 18 15 0.68 52
56144 Collection agencies 10 0.79 14 8 0.47 9 14 0.63 16
54121 Accounting, tax preparation, bookkeeping, and payroll services 7 0.55 9 7 0.41 11 13 0.59 18
53242 Office machinery and equipment rental and leasing 3 0.18 4 13 0.59 16
81321 Grantmaking and giving services 8 0.63 8 9 0.53 14 13 0.59 16
52314 Commodity contracts brokerage 16 1.26 24 12 0.70 28 12 0.54 20
48121 Nonscheduled air transportation 3 0.24 3 6 0.35 5 12 0.54 11
53249 Other commercial and industrial machinery and equipment rental and leasing 5 0.39 5 8 0.47 11 11 0.50 14
54151 Computer systems design and related services 10 0.79 27 12 0.70 37 10 0.45 40
53130 Activities related to real estate 13 1.02 61 14 0.82 71 9 0.41 27
53241 Construction, transportation, mining, and forestry machinery and equipment 4 0.31 5 5 0.29 8 9 0.41 14
Table 1 shows the share of BHCs that hold the top 50 most common five-digit NAICS sorted in descending order based on the 2005 count of
BHCs that hold each NAICS. A BHC is defined as holding a NAICS if the NAICS is either the primary or secondary business activity reported
by at least one of its subsidiaries. BHC count is the number of BHCs that exist during the year and Sub count is the number of subsidiaries with
the NAICS. The underlying source is the database of Cetorelli and Stern (2015).

40
Table 2: Evolution of the sector’s common banking core
Year
All BHCs Scope expanding BHC
Mean Median Mean Median
Bank asset ratio Bank asset ratio Bank asset ratio Bank asset ratio
1992 0.815 0.979 0.776 0.884
1993 0.819 0.985 0.775 0.894
1994 0.822 0.987 0.772 0.881
1995 0.827 0.989 0.780 0.900
1996 0.839 0.991 0.795 0.942
1997 0.847 0.992 0.811 0.970
1998 0.865 0.993 0.835 0.984
1999 0.871 0.994 0.844 0.987
2000 0.881 0.995 0.859 0.991
2001 0.892 0.996 0.873 0.993
2002 0.903 0.997 0.886 0.995
2003 0.912 0.997 0.900 0.996
2004 0.917 0.997 0.906 0.996
2005 0.921 0.997 0.909 0.997
2006 0.891 0.996 0.886 0.995
Table 2 displays both mean and median bank-to-total-BHC-asset ratios, calculated for the entire population in a
year and for the subset of scope expanding BHCs. The numerators are the total assets of the commercial bank
subsidiaries (NAICS 52211 entities) of each BHC, while the denominators are the consolidated assets of the
BHCs, thus including the contribution of non-52211 subsidiaries.

41
Table 3: Impact of scope expansion on performance
(1) (2) (3) (4) (5)
Unconditional Distance NAICS 52 Coincidence Modal
Cumulative adoption -0.132 -0.119 -0.325 -0.185 -0.386
(0.0715) (0.0911) (0.121) (0.108) (0.117)
Cum. related adoption -0.0152 0.298 0.0213 0.0215
(0.0576) (0.141) (0.0299) (0.00781)
All exit 0.193 0.194 0.183 0.194 0.198
(0.104) (0.104) (0.105) (0.104) (0.104)
Cum. adoption X exit -0.0198 -0.0200 -0.0187 -0.0201 -0.0199
(0.00970) (0.00976) (0.00906) (0.00972) (0.00975)
Cum. adoption X scope 0.00877 0.00852 0.0120 0.0102 0.0146
(0.00452) (0.00471) (0.00477) (0.00478) (0.00438)
Cumulative M&A -0.336 -0.337 -0.333 -0.329 -0.331
(0.101) (0.101) (0.0993) (0.100) (0.0998)
Scope (lagged) -0.218 -0.217 -0.228 -0.222 -0.242
(0.0619) (0.0628) (0.0613) (0.0626) (0.0612)
Log assets -1.205 -1.207 -1.222 -1.175 -1.186
(0.593) (0.595) (0.590) (0.603) (0.591)
Capital ratio -0.435 -0.435 -0.437 -0.434 -0.436
(0.0735) (0.0735) (0.0733) (0.0734) (0.0736)
Constant 34.11 34.15 34.40 33.73 33.94
(7.854) (7.885) (7.822) (7.978) (7.834)
Bank fixed effects Yes Yes Yes Yes Yes
Year fixed effects Yes Yes Yes Yes Yes
Observations 10226 10226 10226 10226 10226
Adjusted R2 0.032 0.032 0.033 0.032 0.034
Table 3 reports regressions of performance on both unconditional and related adoption of new NAICS based on specification
(1) and (2). The dependent variable is a BHC’s return on equity. An adoption is defined as the appearance of a new five-digit
NAICS within a BHC’s organizational structure. Cumulative adoption is the count of a BHC’s adoptions over a consecutive
three-year period. Cum. related adoption is a sub-specification of Cumulative adoption based on the adoption relatedness
definition specified in each column header. Distance (Column 2) defines related adoption as the average distance (one, two,
three or four digits) from NAICS 52211 of the NAICS adopted by the BHC. NAICS 52 (Column 3) is the subset of the
cumulative adoption count of adoptions in NAICS 52. Coincidence (Column 4) defines related adoptions by using a Bryce
and Winter metric of relatedness as a time-invariant average calculated over the whole time period of analysis. Modal (Column
5) defines related adoptions as the sum of the shares of BHCs that hold the NAICS a BHC adopt at the time of adoption.
Regressions include both BHC and year fixed effects. Standard errors are in parentheses and are clustered at the BHC level.
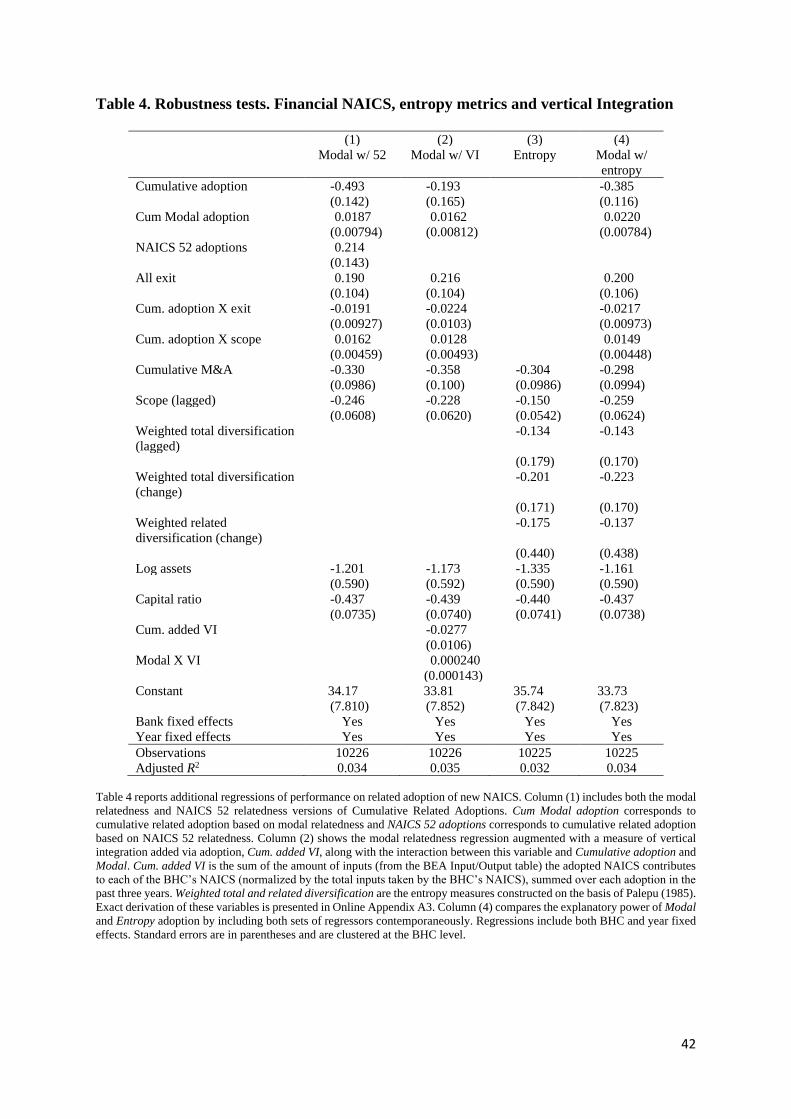
42
Table 4. Robustness tests. Financial NAICS, entropy metrics and vertical Integration
(1) (2) (3) (4)
Modal w/ 52 Modal w/ VI Entropy Modal w/
entropy
Cumulative adoption -0.493 -0.193 -0.385
(0.142) (0.165) (0.116)
Cum Modal adoption 0.0187 0.0162 0.0220
(0.00794) (0.00812) (0.00784)
NAICS 52 adoptions 0.214
(0.143)
All exit 0.190 0.216 0.200
(0.104) (0.104) (0.106)
Cum. adoption X exit -0.0191 -0.0224 -0.0217
(0.00927) (0.0103) (0.00973)
Cum. adoption X scope 0.0162 0.0128 0.0149
(0.00459) (0.00493) (0.00448)
Cumulative M&A -0.330 -0.358 -0.304 -0.298
(0.0986) (0.100) (0.0986) (0.0994)
Scope (lagged) -0.246 -0.228 -0.150 -0.259
(0.0608) (0.0620) (0.0542) (0.0624)
Weighted total diversification
(lagged)
-0.134 -0.143
(0.179) (0.170)
Weighted total diversification
(change)
-0.201 -0.223
(0.171) (0.170)
Weighted related
diversification (change)
-0.175 -0.137
(0.440) (0.438)
Log assets -1.201 -1.173 -1.335 -1.161
(0.590) (0.592) (0.590) (0.590)
Capital ratio -0.437 -0.439 -0.440 -0.437
(0.0735) (0.0740) (0.0741) (0.0738)
Cum. added VI -0.0277
(0.0106)
Modal X VI 0.000240
(0.000143)
Constant 34.17 33.81 35.74 33.73
(7.810) (7.852) (7.842) (7.823)
Bank fixed effects Yes Yes Yes Yes
Year fixed effects Yes Yes Yes Yes
Observations 10226 10226 10225 10225
Adjusted R2 0.034 0.035 0.032 0.034
Table 4 reports additional regressions of performance on related adoption of new NAICS. Column (1) includes both the modal
relatedness and NAICS 52 relatedness versions of Cumulative Related Adoptions. Cum Modal adoption corresponds to
cumulative related adoption based on modal relatedness and NAICS 52 adoptions corresponds to cumulative related adoption
based on NAICS 52 relatedness. Column (2) shows the modal relatedness regression augmented with a measure of vertical
integration added via adoption, Cum. added VI, along with the interaction between this variable and Cumulative adoption and
Modal. Cum. added VI is the sum of the amount of inputs (from the BEA Input/Output table) the adopted NAICS contributes
to each of the BHC’s NAICS (normalized by the total inputs taken by the BHC’s NAICS), summed over each adoption in the
past three years. Weighted total and related diversification are the entropy measures constructed on the basis of Palepu (1985).
Exact derivation of these variables is presented in Online Appendix A3. Column (4) compares the explanatory power of Modal
and Entropy adoption by including both sets of regressors contemporaneously. Regressions include both BHC and year fixed
effects. Standard errors are in parentheses and are clustered at the BHC level.

Table 5: Description of Key Variables
Variable Description Unit of
observation
Source
Adoption Addition of a new five-digit NAICS to a BHC’s
organizational structure.
NAICS-
BHC-year
FR Y-6 Annual Report of Bank
Holding Companies; FR Y-10
Report of Changes in
Organizational Structure Cumulative
Adoption
Count of a BHC’s Adoptions over the preceding three years. BHC-year
Exit Disappearance of a five-digit NAICS from a BHC's
organizational structure.
NAICS-
BHC-year
All Exit Count of a BHC's Exits over the preceding three years. BHC-year
Scope Count of unique five-digit NAICS within a BHC’s
organizational structure.
BHC-year
Cumulative M&A Number of subsidiaries acquired by a BHC from other BHCs
over the preceding three years.
BHC-year
Return on Equity Ratio of net income to equity of a consolidated BHC. BHC-year FR Y-9C Consolidated Report of
Condition and Income
Log assets Natural log of total assets held by a consolidated BHC. BHC-year
Capital ratio Ratio of regulatory capital to total assets of a consolidated
BHC.
BHC-year
Coincidence
Relatedness
Share of BHCs that hold a given NAICS code in a given
year, averaged over the entire sample period by NAICS code.
NAICS FR Y-6 Annual Report of Bank
Holding Companies; FR Y-10
Report of Changes in
Organizational Structure Modal
Relatedness
Share of BHCs that hold a given NAICS code in a given
year.
NAICS-year
Cumulative
Related Adoption
– Distance
Average distance between each unique NAICS codes that a
BHC adopted over the preceding three years and the code
"52211." Distance between two five-digit codes is defined as
the number of digits that do not match between the two
codes. All digits that follow the first unmatched digit are
considered unmatched. For example, codes "53111" and
"52211" have a distance of four because they do not match on
the second digit.
BHC-year
Cumulative
related adoption –
NAICS 52
A subset of Cumulative Adoption restricted to financial
NAICS (first two digits are “52”).
BHC-year
Cumulative
Related Adoption
– Coincidence
Sum of Coincidence Relatedness for all NAICS adopted by a
BHC in the preceding three years.
BHC-year
Cumulative
Related Adoption
–Modal
Sum of Modal Relatedness for all NAICS adopted by a
BHC in the preceding three years.
BHC-year

44
Variable Description Unit of observation Source
Added VI A measure of potential vertical integration between an
adopted five-digit NAICS segment and an existing
BHC organizational structure. Consider a BHC that
adopts segment 𝑝 in year 𝑡 and held a subset, 𝑀 ∈ 𝑁,
of all segments in the previous year, 𝑡 − 1. Let 𝑥𝑛,𝑚,𝑡
represent the IO table input of segment 𝑛 to segment
𝑚 in year 𝑡. Added VI is defined as,
𝐴𝑑𝑑𝑒𝑑 𝑉𝐼𝑡 =∑ 𝑥𝑝,𝑚,𝑡−1
𝑀𝑚=1
∑ ∑ 𝑥𝑛,𝑚,𝑡−1𝑁𝑛=1
𝑀𝑚=1
BHC-year Input-Output Accounts Data
(IO table) from the Bureau of
Economic Analysis (BEA)
Cum. Added VI
The sum of Added VI for all NAICS adopted by a
BHC in the preceding three years.
BHC-year
Total
Diversification
A measure of BHC diversification analogous to
entropy from Palepu (1985). Let 𝑃𝑖 be the share of
subsidiaries with five-digit NAICS segment 𝑖 over the
total number of subsidiaries held by the BHC. For a
BHC holding 𝐼 unique segments, Total Diversification
is defined as,
𝐷𝑇 = 𝑃𝑖 ∑ ln (1
𝑃𝑖)
𝐼
𝑖=1
BHC-year FR Y-6 Annual Report of Bank
Holding Companies; FR Y-10
Report of Changes in
Organizational Structure
Related
Diversification
A measure of BHC diversification centered on related
NAICS groups following Palepu (1985). Consider a
three-digit NAICS group, 𝑗, held by a BHC and five-
digit NAICS segment, 𝑖 ∈ 𝑗, within group 𝑗. We
define related diversification of group 𝑗 as,
𝐷𝑅𝑗 = ∑ 𝑃𝑖𝑗
𝑖∈𝑗
ln (1
𝑃𝑖𝑗),
where 𝑃𝑖𝑗 is the ratio of subsidiaries in segment 𝑖 to
subsidiaries in group 𝑗. For a BHC with 𝐽 groups,
Related Diversification is defined as,
𝐷𝑅 = ∑ 𝐷𝑅𝑗
𝐽
𝑗=1
𝑃𝑗 ,
where 𝑃𝑗 is the ratio of subsidiaries in group 𝑗 to total
subsidiaries in the BHC.
BHC-year

Figure 1a: BHC scope upon entry
Figure 1a shows a histogram of initial activity scope for all BHCs that file the Y-9C and become BHCs during the sample
period (1992–2006). Initial activity scope is the number of unique five-digit NAICS that a BHC holds during its first year as
a top-tier BHC, based off the reported primary or secondary NAICS of its controlled subsidiaries. The data underlying the
activity scope measure is from the Cetorelli and Stern (2015) database of organizational structure.
Figure 1b: Annual number of BHCs with adoptions or exits
Figure 1b shows, among Y-9C-filing BHCs, how many BHCs make at least one adoption and/or at least one exit during each
year over the sample period (1992–2006). An adoption occurs for a given year when a BHC controls a subsidiary with a five-
digit primary or secondary NAICS code that prior to that year the BHC had never held within its organization. An exit occurs
for a given year when it is the final year that a BHC holds a five-digit NAICS that it has held in prior years. The data underlying
the adoption and exit statistics is from the Cetorelli and Stern (2015) database of organizational structure.
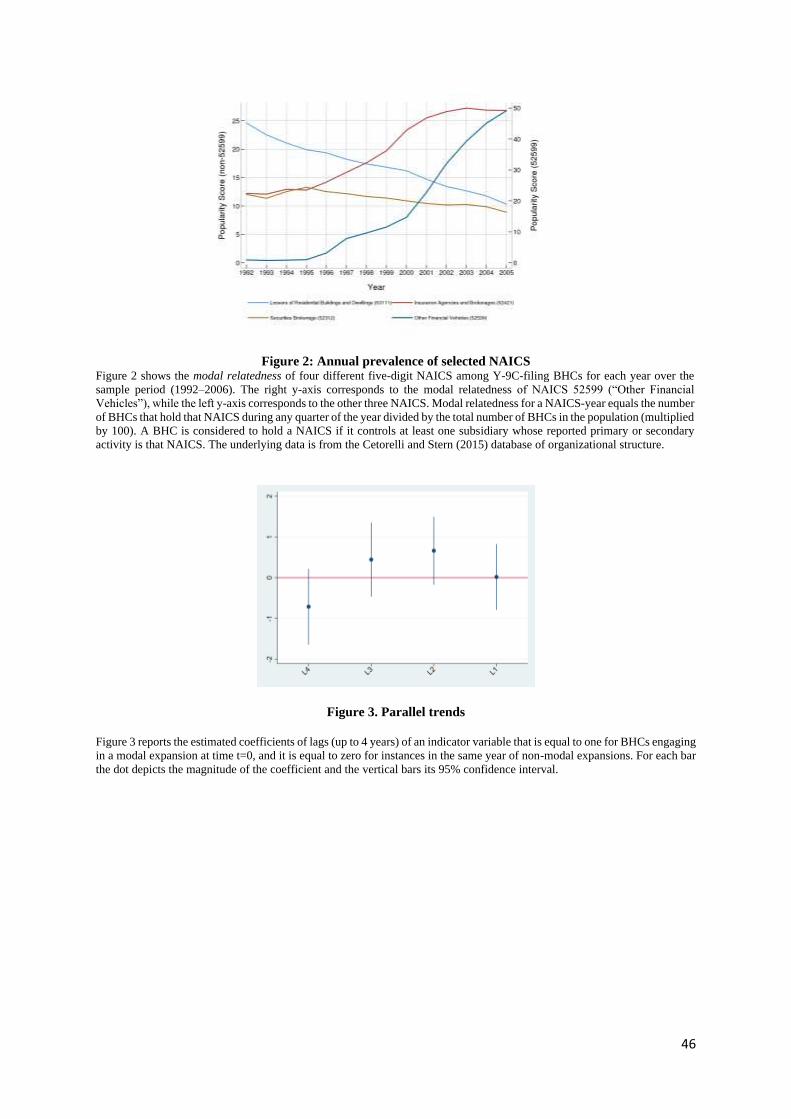
46
Figure 2: Annual prevalence of selected NAICS Figure 2 shows the modal relatedness of four different five-digit NAICS among Y-9C-filing BHCs for each year over the
sample period (1992–2006). The right y-axis corresponds to the modal relatedness of NAICS 52599 (“Other Financial
Vehicles”), while the left y-axis corresponds to the other three NAICS. Modal relatedness for a NAICS-year equals the number
of BHCs that hold that NAICS during any quarter of the year divided by the total number of BHCs in the population (multiplied
by 100). A BHC is considered to hold a NAICS if it controls at least one subsidiary whose reported primary or secondary
activity is that NAICS. The underlying data is from the Cetorelli and Stern (2015) database of organizational structure.
Figure 3. Parallel trends
Figure 3 reports the estimated coefficients of lags (up to 4 years) of an indicator variable that is equal to one for BHCs engaging
in a modal expansion at time t=0, and it is equal to zero for instances in the same year of non-modal expansions. For each bar
the dot depicts the magnitude of the coefficient and the vertical bars its 95% confidence interval.

47
MAPPING A SECTOR’S SCOPE TRANSFORMATION AND THE VALUE OF
FOLLOWING THE EVOLVING CORE:
ONLINE APPENDIX
A1. Summary statistics
Table A1 offers a snapshot of key firm-level characteristics for the entire population of BHCs in our
sample, for three reference years: 1995, 2000, and 2005. The table illustrates the dynamics in the
sector, seen through the change in terms of total asset distribution, number of subsidiaries, and scope
of segments (i.e., number of unique NAICS). It also documents the relative munificence and stability
of the environment, as evidenced by the stable and healthy performance variable data. Table A2
provides a different aggregation of our panel, which combines all our observation years and groups
them on the basis of the intensity of the scope expansion of each BHC. The top panel shows
summary statistics for BHCs that never expand scope over the period of analysis (1992–2006); the
center panel captures BHCs that expanded scope by adding subsidiaries in up to five unique five-
digit NAICS; and the bottom panel summarizes those with the most extensive scope expansion
strategies (more than five). Not surprisingly, size correlates with scope expansion. We also see that
lower expansion strategies correlate with stronger capital ratios and lower risk, as captured by the Z-
score, and relatively lower performance as captured by ROE.
A2. Properly capturing changes in business scope
While we believe that our database presents the most detailed and extensive analysis of banking
scope (and, arguably, the most detailed database of scope transformation of any major sector), there
is a risk of both Type I and Type II errors in our measure of changes in scope. First, there may be
subsidiary additions that have little to do with actual economic activity, driven perhaps by tax or
regulatory arbitrage (although creating a tax shield or circumventing regulatory restrictions could

48
still be considered synergistic strategies).32 Second, one could argue that scope expansion could still
take place within the boundaries of a commercial bank entity, even without a subsidiary addition. For
instance, a commercial bank could obviously engage in mortgage lending without necessarily adding
a specialist mortgage lender to its structure, so that the addition of such a lender may signal the
“start” of a new activity that actually began earlier.
To check on the first type of concerns, we run regressions with both interest income ratio
(revenues from interest-earning assets over total revenues) and non-interest income ratio (revenues
from fee-based activities over total revenues) as dependent variables, and BHC scope as regressor. If
a large scope is merely an artifact of the tax and regulatory landscape, or any other arbitrage
opportunity, we should not find any systematic association with income. The results, reported in
Table A3, show the opposite: high scope is consistently associated with greater income, especially in
the non-interest component—as we would predict, since most adopted segments are likely to
generate fee-based rather than interest-based revenues.33
The second concern is also unlikely to apply in our setting. While certain segments, such as
specialty lending, could be pursued by a commercial bank, there were significant legal restrictions.
Indeed, the BHC is the vehicle that U.S. law has designed for a bank to pursue broader segments.
Having said that, in specific circumstances we could accurately map NAICS types to balance-sheet
items. If those segments were already being significantly pursued by an existing subsidiary, the
addition of a new one would simply present a new way of organizing these segments. Yet, regression
analysis confirms that adding subsidiaries in either credit-card lending or rental and leasing for the
first time led to a significant rise in the respective balance-sheet line items (results available upon
32 An example of scope expansion driven by regulation may be represented by BHCs adding community housing services
subsidiaries (NAICS 62422). The main driver of such decision is U.S. regulation mandating BHCs to meet the credit
needs of the communities they operate in (See, e.g., Cetorelli & Wang, 2016). These subsidiaries are therefore
contributing to the scope expansion of a BHC, but they are hardly related to its performance. If BHC scope expansion
were to be driven predominantly by such regulatory factors, we should not see a systematic relationship between NAICS
number (the extensive margin of scope, which we focus on) and income. This is precisely what this section addresses. 33 A larger BHC footprint is also associated with higher income expenses, suggesting that adding subsidiaries in new
activities has direct economic consequences. It also is associated with higher interest income—a first indication that
broadening out leads to synergies across activities.

49
request). Also, even if this were an issue, it would induce a conservative bias in our estimates.34
A3. Additional robustness tests
Accounting for BHCs with broad scope at first appearance in the database
When we first introduce the role of unconditional scope expansion on performance, a possible
concern is that there may be BHCs that, when they first appear in the database, may already have a
broad scope (e.g. financial conglomerates such as insurance companies that acquire a bank charter at
some point, and therefore become BHCs). The issue is that we cannot observe the dynamics that
brought them to that point. Our attempted workaround is to run a separate regression excluding
BHCs that were already “complex” in scope (i.e. three or more separate NAICS) at the outset. The
results of this alternative regression (equivalent to column (1) of Table 3) are in column 1 of Table
A4, indicating overall robustness of the negative relationship between unconditional scope expansion
and performance.
BHCs departing from the sector’s common core
A possible concern regarding our main results is that there could be BHCs that radically depart from
the common core, so that our definition of modal relatedness would not be appropriate for such firms
(for example, there could be firms that turned into BHCs having started out in different sectors, e.g.
insurance, and still maintained insurance as their core business even after they became BHCs). We
believe this concern is marginal, as the virtual totality of BHCs do start as commercial banks (recall
Figure 1). Nevertheless, we ran robustness tests where we excluded from the sample BHCs where
commercial banking accounts for a relatively smaller share of total BHC assets (less than 30%, 40%,
and even 50% of total assets). The main results were unchanged, confirming that our data is properly
34 Further, we consider the fact that NAICS industry classifications are revised over time—a potential challenge in
maintaining a consistent panel database. However, this is not an issue in our case, since the industry codes assigned to
subsidiaries and reported to the regulatory authorities are either confirmed or updated in the event of changes in the
classification system, and then the information is rendered backward-compatible in the database according to the most
recent classification.

50
capturing a sector that has a common core, while still experiencing significant transformation. The
results are reported in columns 3–5 of Table A4.
Confounding factor of coinsurance from diversification
The literature on diversification has recently stressed how a significant motivation for scope
expansion is related to deteriorating capital market conditions. If firms expect to face external
financing constraints during an upcoming period of market stress, then the benefits of expanding
scope increase due to the potential coinsurance effects of diversification. One possible explanation
for our finding that adoption of popular NAICS is associated with higher ROE could be that what
makes segments popular is exactly that they provide BHCs with the greatest ability to smooth cash
flows during times of capital market volatility.35 We can explicitly control for this potential
confounding factor by interacting Cum Adoption with the TED spread at time t, a measure of market
volatility found to be a driver of diversification in recent literature (Kuppaswamy & Villalonga,
2015; Matvos et al., 2018).36 If the positive relationship between ROE and adopting NAICS with
high modal relatedness is solely the result of expansions being more beneficial when they occur in
distressed financial conditions, the positive sign on Cum Related Adoption should go away with the
inclusion of this variable. This does not occur, with the coefficient remaining essentially unchanged
(results in column 5 of Table A4). This indicates that the beneficial effects of diversification in times
of financial stress found in the extant literature cannot explain the differentially beneficial effects of
expansion into popular NAICS.
Considering a Palepu-style entropy measure as an alternate driver of our results
The Palepu (1985) measure compares unrelated diversification (i.e. business activities that span
35 If, for example, BHCs anticipate an upcoming period of market turmoil, and the set of NAICS that supplies the largest
coinsurance benefits is similar across BHCs, then we might expect much of the population to expand into these NAICS
and experience better performance during the upheaval, possibly leading to a positive effect of scope expansions into
popular NAICS and unrelated to the synergy-dynamics arguments. 36 This literature finds evidence of performance benefits from scope diversification in times of financial turmoil. We
actually confirm this empirical finding, but given our focus on scope expansion strategies, we do not report the related
analysis. Our focus is on the robustness of our core results.

51
different two-digit NAICS/SIC sectors) with related diversification (i.e., business activities that span
different four-digit segments within the same two-digit sector). The entropy measure computes the
composite score, weighing this dispersion with the share of the revenue (or sales) in each category.
Following Palepu (1985), we computed analogous metrics for the banking sector. Data
limitations constrain our implementation to the count of subsidiaries in each three- and five-digit
NAICS subgroup rather than more standard measures of subgroup activity (e.g. total sales). Let 𝑃𝑖 be
the share of subsidiaries in the 𝑖th five-digit NAICS segment over the total number of subsidiaries in
the BHC. For a BHC holding 𝐼 five-digit segments, total diversification is defined as
𝐷𝑇 = 𝑃𝑖 ∑ ln (1
𝑃𝑖)
I
i
.
This measure of total diversification is analogous to entropy in Palepu (1985). For each three-
digit NAICS group indexed by 𝑗, we define related diversification within a given three-digit group as
𝐷𝑅𝑗 = ∑ 𝑃𝑖𝑗
ln (1
𝑃𝑖𝑗)
𝑖∈𝑗
,
where 𝑃𝑖𝑗 is the share of subsidiaries in the 𝑖th five-digit segment over the number of subsidiaries in
the three-digit group 𝑗. For a BHC with 𝐽 three-digit groups, overall related diversification is defined
as
𝐷𝑅 = ∑ 𝐷𝑅𝑗𝑃𝑗
𝐽
𝑗
,
where 𝑃𝑗 is the share of subsidiaries in the 𝑗th three-digit group over the total number of subsidiaries
in the BHC.
Lastly, we define unrelated diversification as
𝐷𝑈 = ∑ 𝑃𝑗 ln (1
𝑃𝑗)
𝐽
𝑗
.
Note that total diversification equals the sum of related and unrelated diversification:

52
𝐷𝑇 = 𝐷𝑅 + 𝐷𝑈.
The results of regressions including the entropy metrics are in Table 4.
Expanding into new vs. existing segments
A possible objection to the way we capture scope expansion is that we are ultimately just picking up
the addition of subsidiaries to a BHC’s structure, and that there may be nothing special about the
addition of subsidiaries in a new NAICS. We therefore re-run the regressions to test the robustness of
our Cum expansion variable by examining the cumulative addition (and removal) of subsidiaries in
already-existing NAICS. After all, adding subsidiaries in general could be interpreted as a way to
pursue diversification through an “intensive margin”—that is, by changing the relative importance of
existing segments. Specifically, we included measures of subsidiary expansion and exit in existing
segments, and likewise an explicit control for a change in scope pursued through a change in the
scale of operation of existing segments, picked up by the ratio of non-bank to bank assets. The
results of this test (not reported but available upon request) confirms that scope expansion as
captured by the addition of subsidiaries in new NAICS has a robust association with performance.
A4. Selection. Details on the semi-parametric methods
This appendix offers details on the implementation of the semi-parametric methods used to test the
robustness of our main finding: that expansion into NAICS segments with high modal relatedness is
associated with higher ROE. Implicit in the benchmark approach presented in the paper is the
assumption that in the construction of the theoretical counterfactuals for treated and untreated units
(i.e., what the effect on the outcome variable would be for treated units had they not expanded scope
in popular segments, and likewise the effect for untreated units had they pursued expansion in more
popular segments instead) that the relationship between observables and the outcome variable, or
with the likelihood to be treated is linear. With that assumption, the average treatment effect provides
a reliable estimate of the impact of the treatment. The methods used to test the robustness of the

53
benchmark results relax this assumption, by explicitly estimating the dynamic process for either the
outcome variable or the likelihood of being treated separately for treated and untreated units (see,
e.g., Imbens & Wooldridge, 2009).
The first approach implemented in the robustness tests is based on a regression adjustment
model. In this approach we allow for the outcome variable, post-expansion ROE, to be modeled
separately for the treated and the untreated units. By doing so, we relax the implicit assumption of a
constant differential in the average treated effect conditional on other covariates. Hence we
implement this specification estimating post-expansion ROE as a function of basic (lagged) BHC
covariates: total assets, capital-to-asset ratio, and lagged ROE.
The second approach focuses instead on the scope expansion choice itself, modeling the
propensity to engage in scope expansion as a function of lagged covariates. This model then weighs
the different observations in the control group on the basis of their individual estimated propensity
scores, thus yielding a modified control group—based on their inverse-probability weights—that is
more comparable to the treatment group represented by expanding BHCs. The basic covariates used
in estimating the propensity to engage in scope expansion are: (a) total assets; (b) lagged ROE; (c)
whether the BHC had performed expansion in the previous year; and (d) a measure of non-
performing loans (which proxies for the relative “success” of the banking firm in core banking
segments, and is hence a potential indicator of the incentive to depart from, or stay with, such
segments).37
The third approach, broadly considered in the literature as a preferred solution, combines the
previous two methods. Such double robust estimators have the advantage of achieving robustness to
potential mis-specifications in the parametric choices in both the regression adjustment and the
propensity score models.38 Of course, the double robust estimator is consistent if either the regression
37 Both models are robust to the set of covariates used to perform the estimations. 38 Nevertheless, we have conducted robustness tests of the double robust approach under alternative model specifications
to improve our confidence in the quality of the results.

54
adjustment model or the propensity score models are correctly specified (although the method is still
consistent if one of the two models is mis-specified; Imbens & Wooldridge, 2009). However, as the
results below indicate, the estimates from these alternative models yield qualitatively very similar
results, and results that are likewise consistent with the basic model specification and the various
other specifications we have run in robustness tests. In particular, we have run a battery of alternative
specifications including a wider array of covariates (year indicators, whether an expanding BHC had
exited from other NAICS, the BHC’s overall scope, and whether the BHC had engaged in M&A
events) to assuage the potential concerns of mis-specification due to omitted variables, and we have
attained very consistent results (not shown but available upon request). Moreover, testing confirms
that the overlap assumption, i.e. the assumption that each unit has a positive probability to be treated,
holds (results not reported but available upon request). All these should add confidence to the
interpretation of the results from the double robust estimator, and that a potential issue of
specification in these approaches is unlikely to play an important role in our conclusions (see also,
e.g., Acemoglu et al., 2019 for a similar argument).
As noted above, the implementation of these methods requires the comparison of the estimate of
the potential outcome for the two groups, treated and untreated. Because we are focusing on
strengthening confidence in our results on expansions into modally related segments, we run these
robustness analysis on the population of expanders, and define the treatment—as explained earlier—
as an expansion into a NAICS that had one of the top 10 highest modal relatedness scores in the year
of expansion. In line with the arguments presented in the main paper, we define the outcome variable
as the ROE observed three years after the treatment.39
We report the results of these estimations in Table A5, Panel A. From the 3,206 unique BHCs
over the 1992–2006 period, we have a pooled cross-section of scope expansion events, totaling 1,003
39 Choosing ROE at different points in time in the future, or even an average among multiple years post-treatment, does
not change the quality of the results. These results are described later and reported in Table A5 Panel B.

55
observations. Of these, 744 are considered treated as per our definition above, and 259 untreated. We
have run the regression adjustment model assuming a linear specification, and the propensity score
model adopting a logit specification (however, the results are robust to an alternative probit
specification). In all specifications robust standard errors were computed via bootstrapping.
The first column reports the results of a naïve OLS estimator, presented here just as a
reference, which shows a positive estimated average treatment effect (ATE), with a coefficient equal
to 2.39. Column 2 then reports an estimated ATE of 2.94 from the regression adjustment model. The
effect weakens somewhat when we employ the propensity score matching method (column 3).
Finally, the double robust estimator yields consistent results, with an estimated ATE of 3.00.
In Panel B we perform a battery of sensitivity tests. For example, while we define the binary
modal indicator variable with a top 10 cutoff in the rank ordering of segments’ popularity in the
BHC population, we re-run the estimations by using two alternative cutoffs that would still be within
a reasonable range of what should capture the most popular NAICS segments: top five and top 15.
We present the results, for convenience just on the double robust estimator method, in columns 1 and
2 of Figure A6, Panel B. The estimations show that defining the modal indicator variable more
conservatively (top five segments) leads to a reduction in the ATE, as we are now more likely to
observe higher ROE within the untreated group. When the cutoff is made wider instead (but still
relatively close to the benchmark cutoff), the estimates are much closer to those obtained in the
benchmark case.
Likewise, we wanted to probe robustness in defining the outcome variable, so instead of
looking at ROE three years out, we also used an average of post-treatment ROE over the three years
following expansion (so, year t+1–t+3), and also an average between t+2 and t+4. The results are
shown in columns 3 and 4 of Table A5, Panel B—again, based on the double robust estimator
method. The estimated ATEs are close to those in column 4 of Panel A.

56
Overall, the results support the main findings that expansions into NAICS with high modal
relatedness have a beneficial impact on future performance, and they assuage legitimate concerns
associated with potential selection and endogeneity bias as driving the empirical relationship
between scope expansion and performance.
A5. Scope transformation and the 2007–2009 crisis
One might argue that while strategically expanding scope helped BHCs during the good times, being
an expanding BHC (and, in particular, adopting popular NAICS) led the same firms on to the rocks
during the storm that followed—a sort of strategic time-bomb. Would our findings hold if we looked
at BHC performance during and after the crisis that followed our study period? Is there any evidence
that pursuing scope expansions in the years prior to the crisis lead to worse performance during the
crisis and produced long-lasting effects throughout the years that followed?
To answer these questions, we consider the impact of scope expansion in the years prior to the
crisis on the severity of the drop in performance during or after the crisis.40 We construct as
alternative dependent variables the peak-to-trough ROE and peak-to-trough Tobin’s Q, defined as
the difference in the performance measure between the worst-performing year over 2007–2015 (the
“trough”) and 2006 (the pre-crisis “peak”). The independent variables are Cum adoption, Cum
related adoption (based on modal relatedness), and exits from NAICS over the five years preceding
the crisis—i.e., 2001–2006.41
The results of these regressions are presented in Table A8. As we can see, expansions overall do
not seem to drive the peak-to-trough fall, and more narrowly, neither is modal relatedness associated
40 We are flexible in that we allow for BHC-specific cycles. For example, some BHCs might experience their worst year
of performance during the industry-level trough (2009), while others might experience their worst year afterwards (say,
2012) because of idiosyncratic characteristics (say, a BHC heavily exposed to the European sovereign debt crisis). Our
measure accommodates both (and any other) possibilities. 41 Switching to five years in these specifications, we take a more conservative approach, in that we allow for scope
expansions occurring further back in time to still be the seeds of bad outcomes during and after the crisis. We also
experimented with other windows, from three to seven years, without materially affecting the results; we also shortened
the period to 2006–2009 and measured the simple percentage drops from 2006–2009. These results, available upon
request, also do not change the thrust of the conclusions.

57
with the severity of crisis-period problems. The only relationships that we observe are, for Tobin’s
Q, the capital ratio (which reduces the magnitude of the hit, as one would expect), and for ROE, exits
(which seem to reduce the magnitude of the problems) and Exit x Cum adoption (which has a
negative coefficient). As such, there does not seem to be support for the hypothesis that expansions
(into high modal relatedness segments in particular) only had positive influences in the boom period,
but that this led to demise during the crisis. Related expansions enhanced performance in relative
terms on the way up, without creating significant measures in the tumultuous period of the crisis, and
the post-crisis period.
A6. A market measure of performance, and the role of risk
Earlier, we explained why we strongly prefer the use of an accounting profitability measure.
However, we have also performed the basic analysis using Tobin’s Q (available for the listed firms).
The analysis shows remarkable consistency. Specifically, we observe analogous results when we
consider the importance of Cum Related Adoptions (Table A7): there is a base negative impact on
scope expansion, but the metrics of relatedness are all positive. Other results (lagged scope, controls)
are equivalent to those presented in our main results, Table 3. Overall, the Tobin’s Q robustness
analysis suggests that our results are not picking up a particularity of accounting measures.
In addition to Tobin’s Q, we considered other measures of interest, such as leverage, to see
whether scope expansion was associated with an increase of the risk that a BHC needed to carry. We
found no consistent evidence that expansion into new subsidiaries, and especially in high modal
relatedness segments, increases leverage (thus making profits riskier). Unlike ROE or Tobin’s Q,
leverage’s impact is inconsistent and varies between specifications. (Results are available upon
request.)
A more direct analysis of risk comes from the analysis of Z-score. This measure is computed
routinely in banking as an estimate of the number of standard deviations below the mean that
consolidated profits would have to fall to make consolidated equity negative, and as such constitutes

58
a plausible metric of distance from default (Boyd & Graham, 1986). Our analysis (available upon
request) shows that while the average impact of entering new segments is negative (i.e., it increases
risks, compared to either not expanding or gaining subsidiaries in existing NAICS), there is no
particular increase of risk attributed to adopting popular NAICS (i.e. those with high modal
relatedness). Exits increase riskiness (perhaps unsurprisingly, as exits may also be instigated by
banks that are failing at their core), but both Exit x Entry and Scope x Entry are positive, suggesting
that both turnover and learning can not only help boost ROE, but also potentially reduce risks.
Relatedness does not seem to have adverse effects on risk or leverage.
Appendix References
Acemoglu, D., Naidu, S., Restrepo, P. and Robinson, J.A., 2019. Democracy does cause growth. Journal
of Political Economy 127(1): 47-100.
Boyd J, Graham S. 1986. Risk, regulation, and bank holding company expansion into nonbanking. FRB of
Minneapolis Quarterly Review 10(2): 2-17.
Bryce D, Winter S. 2009. A general interindustry relatedness index. Management Science 59(9): 1570-
1585.
Cetorelli N, Wang, R. 2016. Bank Regulation and Bank Complexity, Liberty Street Economics (April).
Cetorelli N, Stern S. 2015. Same name, new businesses: evolution in the bank holding company. Liberty
Street Economics (September).
Imbens, G.W., Wooldridge, J.M., 2009. Recent developments in the econometrics of program evaluation.
Journal of Economic Literature 47(1): 5-86.
Kuppuswamy V, Villalonga B. 2015. Does diversification create value in the presence of external financing
constraints? Evidence from the 2007–2009 financial crisis. Management Science 62(4): 905 – 923.
Matvos G, Seru A, Silva RC. 2018. Financial market frictions and diversification. Journal of Financial
Economics 127(1): 21-50.
Palepu, K., 1985. Diversification strategy, profit performance and the entropy measure. Strategic
Management Journal 6(3): 239-255.
United States. Office of Management and Budget. 2017. North American Industry Classification System.

59
Table A1: Summary statistics. Population snapshots
Table A1 reports summary statistics for the entire population of BHCs in operation at three distinct points in time during our
sample period, end of year 1995, 2000 and 2005. ROE is the return on equity of a BHC, Assets is total asset size of the
consolidated BHC, Capital Ratio is the ratio between regulatory capital and total asset. Z-score is calculated as the sum of
ROA and the capital ratio (equity over assets) divided by the standard deviation of ROA across the previous four years.
Subsidiary Count is the total number of subsidiaries controlled by a BHC. NAICS Count is the total number of unique business
activities, based on 5-digit NAICS codes, as reported by a BHC’s subsidiaries. The second column reports the total number
of BHCs in the sample in the corresponding year. The remaining columns report mean and conventional percentiles of the
distribution for each variable.
Variables N Mean SD Min P25 P50 P75 Max
ROE (%) 1069 13.57 5.42 -29.00 11.09 13.55 16.15 36.09
Assets ($Mil) 1069 3,351.69 16,899.29 150.19 207.33 309.19 701.72 269,013.00
Capital Ratio (%) 1069 8.84 2.31 2.49 7.35 8.65 9.99 19.35
Z-Score 1069 115.85 186.94 1.69 35.37 64.88 116.64 1,346.66
Subsidiary Count 1069 11.11 48.63 1.00 1.00 3.00 6.00 1,008.00
NAICS Count 1069 3.58 5.95 1.00 1.00 2.00 3.00 70.00
ROE 1526 13.19 7.25 -59.96 9.78 12.97 16.59 36.09
Assets ($Mil) 1526 3,743.13 31,068.94 150.11 206.65 309.01 632.16 738,205.00
Capital Ratio (%) 1526 9.01 2.75 3.18 7.22 8.58 10.19 20.06
Z-Score 1526 138.04 206.31 1.20 37.43 72.15 141.97 1,346.66
Subsidiary Count 1526 10.38 63.97 1.00 1.00 3.00 5.00 1,293.00
NAICS Count 1526 3.43 5.12 1.00 1.00 2.00 4.00 83.00
ROE 2103 13.67 7.62 -64.37 9.73 12.93 17.15 36.09
Assets ($Mil) 2103 4,994.18 54,273.57 150.46 224.76 347.56 663.55 1,489,891.00
Capital Ratio (%) 2103 9.38 2.47 3.18 7.88 8.91 10.27 20.06
Z-Score 2103 114.86 181.94 0.19 37.38 66.78 119.05 1,346.66
Subsidiary Count 2103 10.75 89.56 1.00 2.00 3.00 5.00 2,867.00
NAICS Count 2103 3.46 4.24 1.00 2.00 2.00 4.00 65.00
1995
2000
2005

60
Table A2: Summary Statistics. Cross sections by intensity of scope expansion
Table A2 reports summary statistics for the population of BHCs conditional on the intensity of scope expansion during our
sample period. Never Adopters are BHCs that throughout their existence in the population between 1992 and 2006 never
add subsidiaries with a business activity in a 5-digit NAICS the BHC did not already have. 1st-5th Adoptions identifies
BHCs that add up to five new 5-digit NAICS to their organization over the period of analysis. >5th Adoptions identifies
BHCs that add more than five new 5-digit NAICS to their organization over the period of analysis. ROE is the return on
equity of a BHC, Assets is total asset size of the consolidated BHC, Capital Ratio is the ratio between regulatory capital
and total asset. Z-score is calculated as the sum of ROA and the capital ratio (equity over assets) divided by the standard
deviation of ROA across the previous four years. Subsidiary Count is the total number of subsidiaries controlled by a BHC.
NAICS Count is the total number of unique business activities, based on 5-digit NAICS codes, as reported by a BHC’s
subsidiaries. The second column reports the total number of BHC-year observations for each sub group. The remaining
columns report mean and conventional percentiles of the distribution for each variable.
Variables N Mean SD Min P25 P50 P75 Max
ROE (%) 6160 12.15 8.84 -64.37 9.14 12.38 15.69 36.09
Assets ($Mil) 6160 404.49 1,843.70 150.02 181.90 228.60 332.36 99,679.70
Capital Ratio (%) 6160 9.92 2.89 3.18 8.00 9.41 11.29 20.06
Z-Score 6160 134.01 217.49 0.19 36.55 71.04 136.79 1,346.66
Subsidiary Count 6160 2.36 4.67 1.00 1.00 2.00 3.00 152.00
NAICS Count 6160 1.72 1.23 1.00 1.00 1.00 2.00 28.00
ROE (%) 9063 13.45 7.11 -64.37 10.10 13.25 16.62 36.09
Assets ($Mil) 9063 1,818.00 9,567.12 150.03 287.77 471.41 942.51 441,957.34
Capital Ratio (%) 9063 8.87 2.29 3.18 7.43 8.56 9.83 20.06
Z-Score 9063 97.99 137.30 0.19 33.89 60.81 110.05 1,346.66
Subsidiary Count 9063 7.00 17.45 1.00 2.00 4.00 6.00 673.00
NAICS Count 9063 3.80 3.11 1.00 2.00 3.00 4.00 61.00
ROE (%) 1424 14.12 7.15 -56.10 11.13 14.36 17.40 36.09
Assets ($Mil) 1424 45,715.68 136,804.97 275.22 1,877.94 6,233.20 31,729.77 1,586,201.00
Capital Ratio (%) 1424 8.21 2.18 3.18 6.96 7.95 8.99 20.06
Z-Score 1424 80.80 94.27 0.72 27.29 54.84 96.16 1,346.66
Subsidiary Count 1424 97.34 244.75 1.00 11.00 20.00 52.50 2,932.00
NAICS Count 1424 14.88 12.29 1.00 7.00 10.00 17.00 83.00
Never Adopted
1-5 Adoptions
> 5 Adoptions

61
Table A3: Components of ROE and activity scope
(1)
Int. inc.
(2)
Nonint. rev.
(3)
Nonint. exp.
(4)
Int. inc.
(5)
Nonint. rev.
(6)
Nonint. exp.
Unique 5-digit NAICS -0.0205 0.784 0.890 0.160 0.584 0.883
(0.0778) (0.126) (0.159) (0.0964) (0.118) (0.174)
Log assets -2.159 0.792 -2.683 -5.155 -4.387 -11.91
(0.292) (0.420) (0.566) (0.693) (0.695) (0.977)
Capital ratio -3.750 -0.799 -3.569 -2.538 -0.897 -2.732
(0.103) (0.154) (0.186) (0.104) (0.0975) (0.148)
Constant 109.9 8.063 104.7 139.0 74.33 213.7
(3.881) (5.642) (7.454) (9.135) (9.098) (12.84)
Bank fixed effects No No No Yes Yes Yes
Year fixed effects No No No Yes Yes Yes
Observations 16742 16742 16742 16742 16742 16742 Adjusted R2 0.355 0.154 0.230 0.290 0.071 0.190
Table A3 reports regression results from a regression of different components of ROE on BHC activity scope. The sample
consists of all FR Y-9C-filing BHCs, both listed and non-listed ones, between 1992 and 2006. The dependent variable is some
component of net income, indicated by the column title, divided by equity. Int. inc. (Columns 1 and 3) is net interest income
over equity, Nonint. rev. (Columns 2 and 5) is noninterest revenue over equity, and Nonint. exp. (Columns 3 and 6) is total
noninterest expenses over equity. Scope is defined as the count of unique five-digit NAICS reported by a BHC’s subsidiaries.
Log assets is the natural log of the total asset size of the consolidated BHC, while Capital ratio is the ratio between regulatory
capital and total asset. The regression frequency is annual, with all variables taken from year t. Columns 4 through 6 include
both BHC and year fixed effects. Standard errors are in parentheses and are clustered at the BHC level.
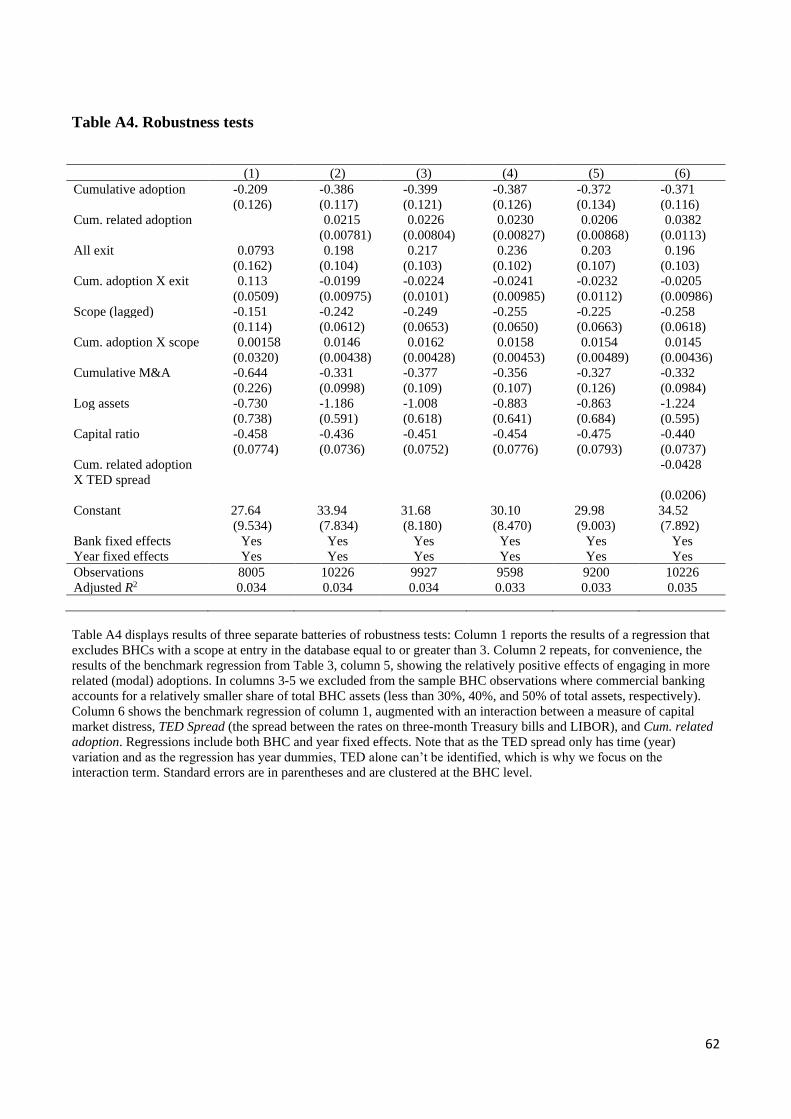
62
Table A4. Robustness tests
(1) (2) (3) (4) (5) (6)
Cumulative adoption -0.209 -0.386 -0.399 -0.387 -0.372 -0.371
(0.126) (0.117) (0.121) (0.126) (0.134) (0.116)
Cum. related adoption 0.0215 0.0226 0.0230 0.0206 0.0382
(0.00781) (0.00804) (0.00827) (0.00868) (0.0113)
All exit 0.0793 0.198 0.217 0.236 0.203 0.196
(0.162) (0.104) (0.103) (0.102) (0.107) (0.103)
Cum. adoption X exit 0.113 -0.0199 -0.0224 -0.0241 -0.0232 -0.0205
(0.0509) (0.00975) (0.0101) (0.00985) (0.0112) (0.00986)
Scope (lagged) -0.151 -0.242 -0.249 -0.255 -0.225 -0.258
(0.114) (0.0612) (0.0653) (0.0650) (0.0663) (0.0618)
Cum. adoption X scope 0.00158 0.0146 0.0162 0.0158 0.0154 0.0145
(0.0320) (0.00438) (0.00428) (0.00453) (0.00489) (0.00436)
Cumulative M&A -0.644 -0.331 -0.377 -0.356 -0.327 -0.332
(0.226) (0.0998) (0.109) (0.107) (0.126) (0.0984)
Log assets -0.730 -1.186 -1.008 -0.883 -0.863 -1.224
(0.738) (0.591) (0.618) (0.641) (0.684) (0.595)
Capital ratio -0.458 -0.436 -0.451 -0.454 -0.475 -0.440
(0.0774) (0.0736) (0.0752) (0.0776) (0.0793) (0.0737)
Cum. related adoption
X TED spread
-0.0428
(0.0206)
Constant 27.64 33.94 31.68 30.10 29.98 34.52
(9.534) (7.834) (8.180) (8.470) (9.003) (7.892)
Bank fixed effects Yes Yes Yes Yes Yes Yes
Year fixed effects Yes Yes Yes Yes Yes Yes
Observations 8005 10226 9927 9598 9200 10226
Adjusted R2 0.034 0.034 0.034 0.033 0.033 0.035
Table A4 displays results of three separate batteries of robustness tests: Column 1 reports the results of a regression that
excludes BHCs with a scope at entry in the database equal to or greater than 3. Column 2 repeats, for convenience, the
results of the benchmark regression from Table 3, column 5, showing the relatively positive effects of engaging in more
related (modal) adoptions. In columns 3-5 we excluded from the sample BHC observations where commercial banking
accounts for a relatively smaller share of total BHC assets (less than 30%, 40%, and 50% of total assets, respectively).
Column 6 shows the benchmark regression of column 1, augmented with an interaction between a measure of capital
market distress, TED Spread (the spread between the rates on three-month Treasury bills and LIBOR), and Cum. related
adoption. Regressions include both BHC and year fixed effects. Note that as the TED spread only has time (year)
variation and as the regression has year dummies, TED alone can’t be identified, which is why we focus on the
interaction term. Standard errors are in parentheses and are clustered at the BHC level.

63
Table A5. Panel A Semiparametric estimates of the effect of modal expansion on ROE
OLS RA IPW IPWRA
Treatment effect 2.388 2.943 1.560 2.998
(1.025) (0.916) (0.681) (1.150)
Table A5, Panel A presents semiparametric estimates of the effect of modal expansion on future ROE. Column 1 reports the results of a
naïve OLS regression, where we report the estimated coefficients of the indicator variable for the treated units. Column 2 report the
estimates of the average treatment effects on the treated using a regression adjustment model. Column 3 report the estimates of the
average treatment effects on the treated using an inverse propensity score reweighting, and column 4 report the estimates obtained with
a doubly robust estimator, combining the regression adjustment and the inverse propensity score reweighting. In all estimates, the
outcome variable is defined as the ROE observed three years after the scope expansion event, and the treatment indicator (modal
expansion) is defined as a NAICS segment that was a top 10 most held in the BHC population in the year the expansion occurred. Below
each estimate, we report robust standard errors obtained via bootstrapping.
Table A5. Panel B Semiparametric estimates. Sensitivity tests
Top 5
Modal
Indicator
Top 15
Modal
Indicator
ROE avg
(t+1-t+3)
ROE avg
(t+2-t+4)
Treatment effect 0.775 1.956 2.035 2.320
(0.512) (1.111) (0.727) (0.770)
Table A5, Panel B presents sensitivity tests on the semiparametric estimates of the effect of modal expansion on future ROE. In all
columns, the methods used is the double robust estimator. Column 1 reports the estimate of the average treatment effects on the treated
where the treatment indicator was defined as a NAICS segment that was a top 5 most held in the BHC population in the year the
expansion occurred. Column 2 report the estimate of the average treatment effects on the treated where the treatment indicator was
defined instead as a NAICS segment that was a top 15 most held in the BHC population in the year the expansion occurred. In Column
3 the outcome variable is defined as the average ROE observed between years t+1 and t+3 after the scope expansion event. In Column
4 the outcome variable is defined as the average ROE observed between years t+2 and t+4 after the scope expansion event. Below each
estimate, we report robust standard errors obtained via bootstrapping.

64
Table A6: Post-2006 peak-to-trough change in ROE/Tobin’s Q (2007-2015) and
related 2001-2006 adoption activity
(1)
ROE
(2)
Tobin’s Q
Cumulative adoption
-0.0529 0.00382
(0.119) (0.00271)
Cum. related adoption
-0.00948 -0.000230
(0.00707) (0.000174)
All exit -0.349 -0.00101
(0.211) (0.00292)
Cum. adoption X exit 0.0410 0.0000559
(0.0245) (0.000348)
Cum. adoption X scope -0.0103 -0.000147
(0.00791) (0.000119) Cumulative M&A
0.204 -0.00503
(0.129) (0.00258)
Scope (lagged)
0.104 0.00148
(0.0854) (0.00121)
Log assets -0.196 -0.00571
(0.262) (0.00426)
Capital ratio -0.103 -0.00712
(0.134) (0.00208)
Constant 1.732 0.0261
(4.196) (0.0635)
Observations 616 247 Adjusted R2
0.006 0.039
Table A6 presents regressions of the change in BHC performance over the crisis on pre-crisis adoption activity. The
dependent variable is based on a BHC’s return on equity in Column 1 and a BHC’s Tobin’s Q (calculated as the BHC’s
market value (approximated by the sum of the market value of equity plus the book value of debt) over the BHC’s book
value (total assets), multiplied by 100) in Column 2. The dependent variable equals the minimum value of a BHC’s
ROE/Tobin’s Q over 2007-2015 (the “crisis” period) minus ROE/Tobin’s Q in 2006 (the pre-crisis “base” year).
Cumulative adoption is the count of a BHC’s adoptions over the five-year pre-crisis period (2001-2006). Cum. related
adoption is a sub-specification of the cumulative adoptions count over the same period (2001–2006) defined as the sum
of shares of BHCs that hold the NAICS a BHC adopt (Modal from Tables 3 and 8). The regression frequency is annual.
Cumulative adoption, All exit, Cum. related adp, and Cumulative M&A are calculated over the pre-crisis 2001–2006
period, and Scope at 2000. The sample for Column 1 consists of all BHCs that file the FR Y-9C for each year between
2000–2009; the sample for Column 2 is further restricted to publically-listed BHCs. Standard errors are in parentheses
and are clustered at the BHC level.

65
Table A7: Tobin’s Q and related adoptions
(1) (2) (3) (4)
Distance NAICS 52 Coincidence Modal
Cumulative adoption -0.272 -0.529 -0.375 -0.566
(0.120) (0.161) (0.140) (0.150)
Cum. related adoption 0.0350 0.438 0.0647 0.0288
(0.0972) (0.192) (0.0396) (0.0100)
All exit 0.107 0.0936 0.112 0.108
(0.131) (0.133) (0.131) (0.129)
Cum. adoption X exit -0.0107 -0.00947 -0.0115 -0.0106
(0.0121) (0.0116) (0.0125) (0.0125)
Cum. adoption X scope 0.0100 0.0144 0.0128 0.0166
(0.00645) (0.00661) (0.00710) (0.00754)
Cumulative M&A 0.283 0.286 0.297 0.282
(0.134) (0.136) (0.132) (0.132)
Scope (lagged) -0.467 -0.482 -0.477 -0.496
(0.0916) (0.0906) (0.0918) (0.0922)
Log assets -4.860 -4.925 -4.763 -4.794
(0.785) (0.788) (0.772) (0.778)
Capital ratio 0.296 0.295 0.300 0.296
(0.133) (0.133) (0.133) (0.133)
Constant 174.9 175.9 173.6 174.1
(11.17) (11.20) (10.96) (11.07)
Bank fixed effects Yes Yes Yes Yes
Year fixed effects Yes Yes Yes Yes
Observations 3542 3542 3542 3542
Adjusted R2 0.356 0.358 0.357 0.358 Table A7 reports regressions of performance on related adoption of new NAICS based on specification (2). The dependent variable is
Tobin’s Q, calculated as the BHC’s market value (approximated by the sum of the market value of equity plus the book value of debt)
over the BHC’s book value (total assets), multiplied by 100. Cum. related adoption is a sub-specification of Cumulative adoption (see
Table 1) based on the adoption relatedness definition specified in each column header. Distance (Column 1) defines related adoption as
the average distance (one, two, three or four digits) from NAICS 52211 of the NAICS adopted by the BHC. NAICS 52 (Column 2) is
the subset of the cumulative adoption count of adoptions in NAICS 52. Coincidence (Column 3) defines related adoptions by using a
Bryce and Winter metric of relatedness as a time-invariant average calculated over the whole time period of analysis. Modal (Column
4) defines related adoptions as the sum of the shares of BHCs that hold the NAICS a BHC adopt at the time of adoption. Regressions
include both BHC and year fixed effects. Standard errors are in parentheses and are clustered at the BHC level.