transferring biomarker into molecular probe: melanin · pdf file ·...
TRANSCRIPT

S1
Supporting Information
Transferring Biomarker into Molecular Probe: Melanin
Nanoparticle as a Naturally Active Platform for
Multimodality Imaging
Quli Fan,†,‡ Kai Cheng,
† Xiang Hu,
† Xiaowei Ma,
† Ruiping Zhang,
† Min Yang,
†
Xiaomei Lu,‡ Lei Xing,
§ Wei Huang,
‡ Sanjiv Sam Gambhir,
† Zhen Cheng*
,†
S2
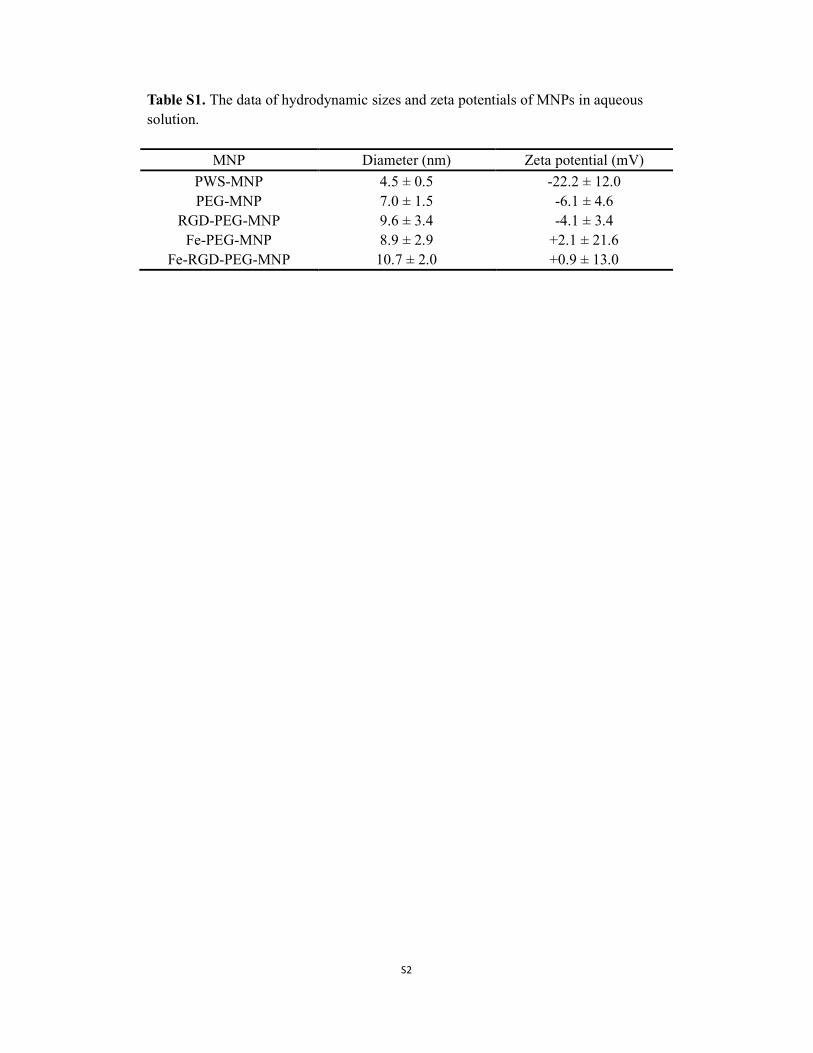
Table S1. The data of hydrodynamic sizes and zeta potentials of MNPs in aqueous
solution.
MNP Diameter (nm) Zeta potential (mV)
PWS-MNP 4.5 ± 0.5 -22.2 ± 12.0
PEG-MNP 7.0 ± 1.5 -6.1 ± 4.6
RGD-PEG-MNP 9.6 ± 3.4 -4.1 ± 3.4
Fe-PEG-MNP 8.9 ± 2.9 +2.1 ± 21.6
Fe-RGD-PEG-MNP 10.7 ± 2.0 +0.9 ± 13.0
S3
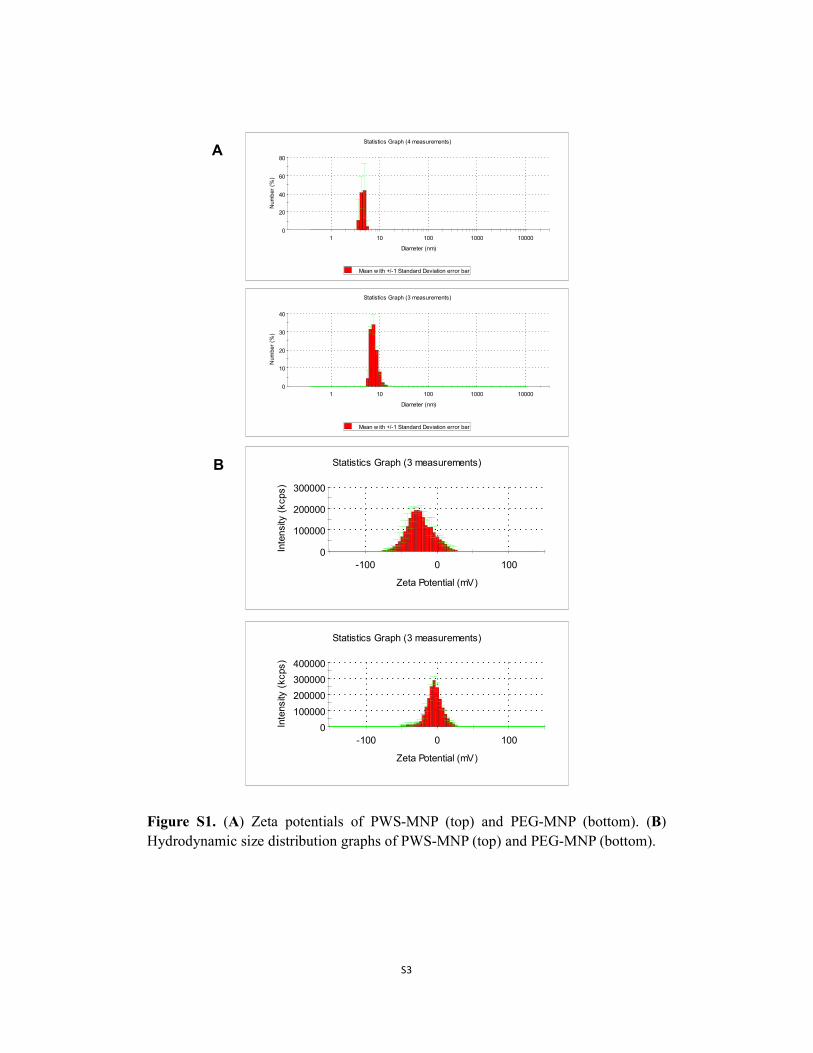
Figure S1. (A) Zeta potentials of PWS-MNP (top) and PEG-MNP (bottom). (B)
Hydrodynamic size distribution graphs of PWS-MNP (top) and PEG-MNP (bottom).
0
20
40
60
80
1 10 100 1000 10000
Num
ber (%
)
Diameter (nm)
Statistics Graph (4 measurements)
Mean w ith +/-1 Standard Deviation error bar
0
10
20
30
40
1 10 100 1000 10000
Num
ber (%
)
Diameter (nm)
Statistics Graph (3 measurements)
Mean w ith +/-1 Standard Deviation error bar
0
100000
200000
300000
-100 0 100
Inte
nsity
(kcps)
Zeta Potential (mV)
Statistics Graph (3 measurements)
0
100000
200000
300000
400000
-100 0 100
Inte
nsity
(kcps)
Zeta Potential (mV)
Statistics Graph (3 measurements)
A
B

S4
Figure S2. (A) FT-IR spectra of pristine melanin granule, PWS-MNP and PEG-MNP.
(B) 1H NMR spectra of PWS-MNP and PEG-MNP in D2O.
In FT-IR spectra, PEG-MNP showed characteristic absorption peaks of PEG at 2880
cm-1 (alkyl C-H stretching) and 1110 cm
-1 (C-O-C stretching).
1H NMR further
confirmed the existence of PEG on the MNP. A new peak at 3.5 ppm attributing to
PEG (–OCH2CH2O-) appeared in the 1H NMR of PEG-MNP.
A
B

S5
Figure S3. (A) The plot of the relationship between the weight ratio of the product
A
B
C

S6
composition (PEG : PWS-MNP) and the feed ratio (WPEG : WPWS-MNP); (B) The
relationship of PEG-MNP with the amine group on PEG-MNP determined by
fluorescamine; (C) The UV-vis-NIR absorption spectra of PWS-MNP and PEG-MNP.
In Fig. S3A, it was showed that the saturation weight ratio of PEG to PWS-MNP is
about 1.2 : 1. Combined with the molecular weight of PWS-MNP, the number of PEG
chain on every PEG-MNP is preliminary calculated to be about 10. In Figure S3B, it
was showed that there existed 19 PEG chains on one MNP. Form Fig. S3C, the
extinction coefficiency of PWS-MNP at 680 nm was 4.0 × 104 cm
-1M
-1.

S7
Figure S4. (A) Hydrodynamic size distribution graphs of RGD-PEG-MNP (top),
Fe-PEG-MNP (middle), and Fe-RGD-PEG-MNP (bottom); (B) Zeta potentials of
RGD-PEG-MNP (top), Fe-PEG-MNP (middle), and Fe-RGD-PEG-MNP (bottom).
0
10
20
30
40
50
1 10 100 1000 10000
Num
ber
(%)
Diameter (nm)
Statistics Graph (2 measurements)
Mean w ith +/-1 Standard Deviation error bar
0
10
20
30
40
50
1 10 100 1000 10000
Num
ber
(%)
Diameter (nm)
Statistics Graph (3 measurements)
Mean w ith +/-1 Standard Deviation error bar
0
10
20
30
40
1 10 100 1000 10000
Num
ber (P
erc
ent)
Size (d.nm)
Statistics Graph (3 measurements)
Mean with +/-1 Standard Deviation error bar
0
100000
200000
300000
400000
500000
600000
700000
-200 -100 0 100 200
Inte
nsity
(kcps)
Zeta Potential (mV)
Zeta Potential Distribution
Record 16: RGD-M Record 17: RGD-M Record 18: RGD-M
0
100000
200000
300000
400000
500000
600000
-200 -100 0 100 200
Inte
nsity (kcps)
Zeta Potential (mV)
Zeta Potential Distribution
Record 45: M-Fe Record 46: M-Fe Record 47: M-Fe
0
100000
200000
300000
400000
500000
600000
-200 -100 0 100 200
Inte
nsity (kcps)
Zeta Potential (mV)
Zeta Potential Distribution
Record 28: RGD-M-Fe Record 31: RGD-M-Fe Record 32: RGD-M-Fe
A
B

S8
Figure S5. From left to right: pictures of (1) 1 mL of 20 µM PWS-MNP aqueous
solution after adding 0.2 mL of 10 mM FeCl3, (2) 1 mL of 20 µM PWS-MNP aqueous
solution after adding 0.2 mL of 10 mM CuCl2, (3) 1 mL of 20 µM PEG-MNP
aqueous solution after adding 0.2 mL of 10 mM FeCl3, (4) 1 mL of 20 µM PEG-MNP
aqueous solution after adding 0.2 mL of 10 mM CuCl2. It was showed that
PEG-encapsulation will hamper the formation of precipitation of MNPs after adding
metal ions.

S9
Figure S6. Photobleaching of MNPs. RGD-PEG-MNP and PEG-MNP samples (n = 3
for each) were exposed to increasing durations of 680 nm laser light, at power density
of 8 mJ/cm2. After 60 min of laser exposure, the optical absorption of all the MNPs
was reduced by ~3%.
Figure S7. MTT assay using NIH-3T3 and U87MG cells with MNP concentration
3.125, 6.25, 12.5 and 25 µM after 24 h incubation at 37 °C.

S10
Figure S8. 3D PAI imaging of U87MG tumor (region enveloped by yellow dotted
line) with MNP using NEXUS 128.
In Figure S8, we could see clearly the blood vessel signals and its distribution in
tumor at prescan. After injection with MNP, the blood vessel signal gradually
increased with injection time and the tumor profile became much clearer.

S11
Figure S9. (A) T1-weighted MRI images (1.0T, spin-echo sequence: repetition time
TR = 700 ms, echo time TE = 5.5 ms) of Fe-RGD-PEG-MNP with different
concentrations; (B) MRI of U87MG tumor (region enveloped by yellow dotted line)
with T1 MRI sequence : TR: 300 ms, TE: 6.1 ms.
A
B

S12
Figure S10. PBS stability study of 64Cu-RGD-PEG-MNP and
64Cu-PEG-MNP. After
24h incubation, only ~3% 64Cu
2+ was released from the MNPs.

S13
64Cu-RGD-PEG-MNP
64Cu-RAD-PEG-MNP
Figure S11. Representative decay-corrected coronal (top) and transaxial (bottom)
small animal PET images (left) and the overlaying of CT (grey) and PET (color)
images (right) of U87MG tumors (region enveloped by white dotted line) acquired at
2, 4 and 24 h after tail vein injection of 64Cu-RGD-PEG-MNP (A) and
64Cu-RAD-PEG-MNP (B). The tumor uptake of
64Cu-RGD-PEG-MNP and
64Cu-RAD-PEG-MNP in mice (n = 3) at 2h, 4h, and 24h after injection (C). Origin 8.0
was used to determine statistical significance. Data present mean +/- SD. * p < 0.05
(one sided Student’s t-test).
A
B
C
S14
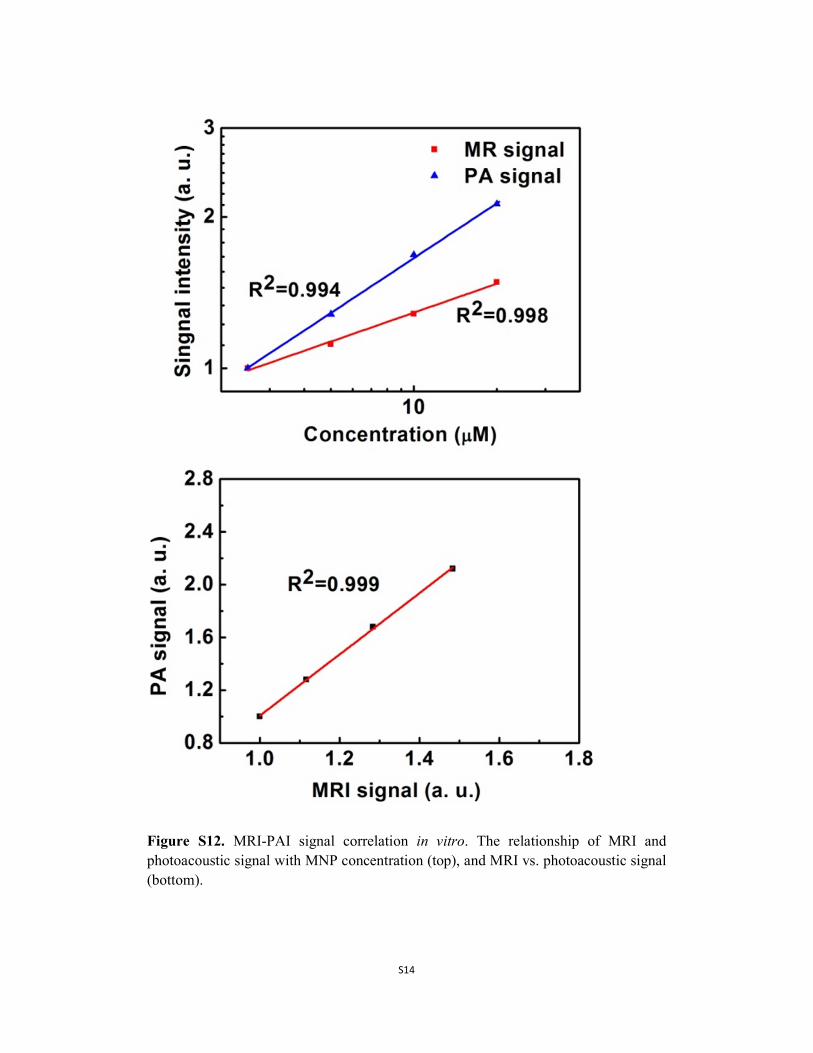
Figure S12. MRI-PAI signal correlation in vitro. The relationship of MRI and
photoacoustic signal with MNP concentration (top), and MRI vs. photoacoustic signal
(bottom).
S15
HN
HN
HN O
O
O
O
O
OH
OH
H2NO
OO
NH2113
HN
HN
HN
O
O
O
O
O
HO
OH
NH
NH
NH
O
O
O OO
OH
HO HN
HN
HN O
O
O
O
O
OH
OH
HN
HN
HN
O
O
O
O
O
HO
OH
NH
NH
NH
O
O
O OO
OH
HO
H2NO
OO
NH113
HNO
OO
NH2113
HNO
OO
NH2113
HN
HN
HN O
O
O
O
O
OH
OH
HN
HN
HN
O
O
O
O
O
HO
HO
NH
NH
NH
O
O
O OO
OH
HO
H2NO
OO
NH113
HNO
OO
NH2113
HNO
OO
NH2113
HN
HN
HN O
O
O
O
O
OH
OH
HN
HN
HN
O
O
O
O
O
HO
HO
NH
NH
NH
O
O
O OO
OH
HO
H2NO
OO
NH113
HNO
OO
NH2113
HNO
OO
NH2113
Fe3+
64Cu
2+
Fe3+
64Cu
2+
PWS-MNP PEG-MNP
Fe-PEG-MNP
64Cu-PEG-MNP

S16
HN
HN
HN O
O
O
O
O
OH
OH
HN
HN
HN
O
O
O
O
O
HO
OH
NH
NH
NH
O
O
O O
O
OH
HO
H2NO
OO
NH113
HNO
OO
NH2113
HNO
OO
NH2113
Sulfo-
SMCC
RGD-SH
HN
HN
HN O
O
O
O
O
OH
OH
HN
HN
HN
O
O
O
O
O
HO
OH
NH
NH
NH
O
O
O OO
OH
HO
HNO
OO
NH113
HNO
OO
NH113
HNO
OO
NH113
C
O N
O
O
S RGD
C
N
O
OS
RGD
O
N
O
OS
RGD
O
HN
HN
HN O
O
O
O
O
OH
OH
HN
HN
HN
O
O
O
O
O
HO
HO
NH
NH
NH
O
O
O OO
OH
HO
HNO
OO
NH113
HNO
OO
NH113
HNO
OO
NH113
C
O N
O
O
S RGD
C
N
O
OS
RGD
O
N
O
OS
RGD
O
HN
HN
HN O
O
O
O
O
OH
OH
HN
HN
HN
O
O
O
O
O
HO
HO
NH
NH
NH
O
O
O OO
OH
HO
HNO
OO
NH113
HNO
OO
NH113
HNO
OO
NH113
C
O N
O
O
S RGD
C
N
O
OS
RGD
O
N
O
OS
RGD
O
Fe3+
64Cu
2+
Fe3+
64Cu
2+
PEG-MNP
RGD-PEG-MNP
64Cu-RGD-PEG-MNP
Fe-RGD-PEG-MNP
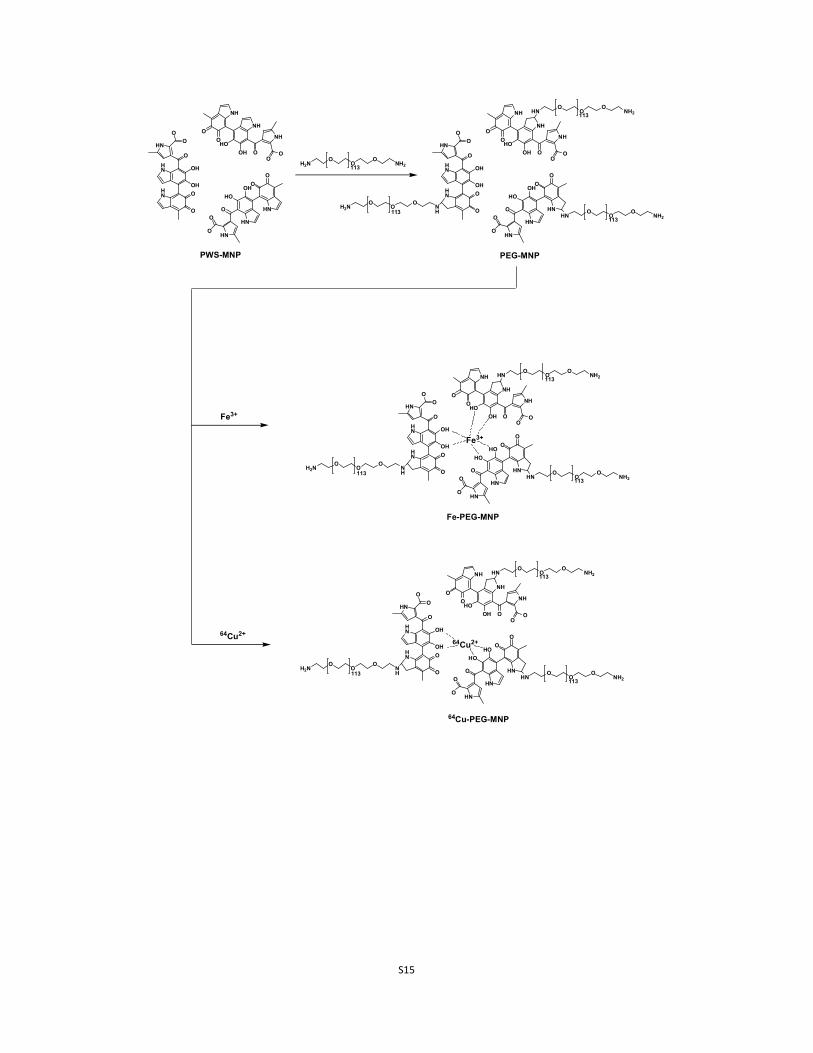
Figure S13. Synthetic route for Fe3+-, or
64Cu
2+-chelated PEG-MNPs and
RGD-PEG-MNPs