transfer and transitions in the middle years of schooling ...€¦ · isbn 1 84478 024 4 june 2003...
TRANSCRIPT

Transfer and Transitions in theMiddle Years of Schooling (7-14):Continuities and Discontinuitiesin LearningMaurice Galton, John Gray and Jean RuddockUniversity of Cambridge
with
Mary Berry, Helen Demetriou, Janet Edwards,Paul Goalen, Linda Hargreaves, Steve Hussey, Tony Pell
and Ian Schagen and Maria CharlesNational Foundation for Educational Research
Research Report RR443
RESEARCH
Research Report No 443
Transfer and Transitions in the Middle Years of Schooling (7-14): Continuities and Discontinuities
in Learning
Maurice Galton, John Gray and Jean Rudduck University of Cambridge
with Mary Berry, Helen Demetriou, Janet Edwards,
Paul Goalen, Linda Hargreaves, Steve Hussey, Tony Pell and Ian Schagen and Maria Charles
National Foundation for Educational Research
The views expressed in this report are the authors' and do not necessarily reflect those of the Department for Education and Skills. © Queen’s Printer 2003 ISBN 1 84478 024 4 June 2003

Table of Contents Page Executive Summary i Chapter 1: Introduction to the Project 1 Chapter 2: The Primary Side of the Transfer Divide: Heads’ Perceptions and Pupil Progress
5
Introduction 5 Interviews with Primary Heads 8 Discussion 25 Tracking progress between Key Stage 1 and Key Stage 2 25 Discussion 39 Implications for policy 41
Chapter 3: Continuities and Discontinuities at Transfer 43 Levels of initiative 44 The changing contexts of transfer 47 Pupils’ attitudes at transfer 50 Dips in attainment at transfer 58 The case studies of transfer 60 Some suggestions and conclusions for transfer 71
Chapter 4: Managing Institutional and Personal Transitions – Developing the Work in Schools
75
Project 1: How friendships affect learning, at transfer and beyond
76
a) The exploratory phase of the study 77 b) The development phase of the study 83 c) Review 85 Project 2: Helping pupils to re-commit themselves to learning 85 a) The work with schools 87 b) Outline of the analysis and development strategies in the
schools 89
c) Review 91 Project 3: How the transition from one year to another in the same school can affect learning
92
a) Year 8’s identity crisis: data from earlier research 93 b) What schools are doing now 96 c) Review 99 Summary 99
Chapter 5: Rethinking the Middle Years of Schooling: 103

Summary and Recommendations The Primary side of the transfer divide 104 Implications for policy on the primary side 106 Taking stock of the current situation at transfer 106 Implications for schools and LEAs in relation to transfer 108
Managing institutional and personal transitions 109 Revisiting some key issues 112 Overall recommendations 116
References 117 Appendix1
1 Copies of the Appendix for Chapter 2 may be obtained from John Gray, Faculty of Education, Cambridge University, Hills Road Site, Cambridge CB2 2PH.
i
Executive Summary The project was concerned with factors which affect pupils’ progress between the ages of 7 and 14. We start by considering the primary side of the transfer divide, move on to the transfer to secondary school, and then explore some areas where schools intervene when progress stalls during Key Stage 3. Taking the long view has enabled us to build a fuller picture of pupils’ progress and also to redress the imbalance in earlier research which focused on transfer between schools rather than transitions between years within the same school. Practice in over a dozen LEAs and more than 50 schools is described and analysed; more than 300 primary schools were also represented in the data-bases used to track pupil progress during Key Stage 2 whilst a further 50 primary heads contributed. The project (January 2000 to December 2002) builds on an earlier review which concluded that schools’ arrangements for transfer were mainly working well but also highlighted the need to understand more about ‘dips’ in attitude, engagement and progress at key transition points (notably Years 3 and 8) and the post-transfer period (Galton, Gray and Rudduck, 1999). The Primary side of the transfer divide Headteachers’ views and experiences: 50 primary heads (drawn randomly from those administering QCA’s ‘optional’ tests for at least the last three years) were interviewed about transition issues. Most schools discussed individual pupil progress at staff meetings and looked for ‘departures from the expected’; few used the data for framing sustained action. The most common concerns were the performances of boys and SEN pupils and the existence of ‘dips’. Heads acknowledged the existence of a ‘push’ during Year 6. Two strategies dominated heads’ approaches to Year 6: regular use of ‘practice tests’ (reported by 82%) and the provision of ‘booster’ classes (74%). A majority concentrated their more experienced teaching staff in Y6 classes, reduced the scope of the curriculum taught during Y6 and focused the efforts of any support staff here (around 60% in each case). Heads who made use of booster classes were divided about their usefulness. Two thirds employed some form of ‘intervention’ in Years 3, 4 or 5 or, more occasionally, in all three. These were mainly ‘booster’ type activities or, in some cases, forms of setting. 76% of heads expressed generally negative views about testing but were nonetheless proactive in terms of intervention; only 14% adopted a positive and proactive stance. The latter were more likely to extend interventions into KS1, employ setting, use practice tests regularly, locate more experienced teachers in Y6 and deploy support staff to boost KS2 results. Tracking pupils’ progress from KS1 to KS2: The analysis of pupil progress in reading and maths between Key Stages 1 and 2 employed data on ‘optional’ tests collected by the NFER for QCA. It tracked individual pupils’ progress, for the first time, across Years 2, 3, 4, 5 and 6. This unique data-set had complete data on over 3,000 pupils.
ii
Pupils’ progress across KS2 was first grouped into one of four progress ‘routes’ for both reading and maths. Around 40% of pupils made roughly ‘equal-sized’ steps from year to year in reading and a slightly higher proportion in maths. Around 25% of the pupils in reading and a third in maths made ‘variable’ progress. Limited numbers of pupils were also found on routes involving ‘increasingly’ large steps and ‘decreasingly’ small ones. Some pupils ‘dipped’ every year, not just in Year 3 as previous evidence had suggested. The analysis explored whether the ‘route’ taken affected pupils’ performance. In reading pupils who were on the ‘equal-sized’ steps route made most progress but their advantage was modest – about three months’ more than pupils on the ‘decreasing’ steps route. In maths, pupils who were on the ‘decreasing’ steps route (a fast start followed by smaller steps or ‘consolidation’ in subsequent years) made the expected two levels of progress, whilst those on the ‘increasing’ steps route lagged further behind, eventually by around half a level. Across the two subjects, there is some support for the desirability of pupils making ‘equal-sized’ steps which neither compensate for a ‘slow’ start nor rely on a ‘spurt’ in the finishing straight. Pupils attending ‘more effective’ primary schools throughout KS2 made as much as half a level more progress (roughly a year) when compared to their counterparts at ‘less effective’ schools. However, when schools were classified in terms of their pupils’ ‘routes’, there was hardly any difference between them in their pupils’ levels of progress. Implications for policy on the primary side of transfer:
* Greater emphasis on targets which reward schools for all levels of pupil progress and not just the Level 4 hurdle. The proposed use of value-added measures in primary schools will help with this.
* Encouragement to schools should redistribute their efforts away from Y6 ‘push’
strategies towards earlier interventions in Years 3 and 4. * Support to develop and expand the menu of evaluated ‘interventions’ schools
employ in pursuit of their teaching and learning objectives. Taking stock of the current situation at transfer Schools are paying increased attention to curriculum and pedagogic issues at transfer. This contrasts with some three years ago when almost all schools concentrated on administrative matters or easing pupils’ social passage from primary to secondary. As a result of the increasing number of visits between Y6 and Y7 staff, secondary teachers are now better informed about the KS2 programmes of study but many still hold over-optimistic views of primary practice. The reality is that for many pupils much of Y6, in the run up to the tests, consists largely of revision with an emphasis on whole class direct instruction. This squeeze on the curriculum and the restricted range of pedagogy employed in Y6 has implications for teaching at the lower end of the secondary school.
iii
Measurement of pupils’ attitudes immediately before transfer and in the November and July following the move to secondary school suggests that the present Y7 curriculum is still not sufficiently challenging – or different from Y6. By the end of their first year after transfer many pupils were finding school a less enjoyable experience but, despite the dip in enjoyment, motivation remained relatively high. In both mathematics, and more especially in science, it appeared that pupils who made most progress after transfer did not express very positive attitudes to these subjects. Only in English was attitude and attainment positively correlated. Pupils stated that in Y7 there was more variety in English and that it was more interesting. By contrast, many pupils said that mathematics involved doing similar things (albeit more complex) in Y7 to those they had done in Years 5 and 6. However, more pupils in mathematics gained at least one National Curriculum level after transfer compared to English. In Y7 science, pupils spent much of their time copying out details of experiments or writing out instructions under the teacher’s guidance; able pupils said they were easily bored by these lessons. The effectiveness of some recent transfer initiatives: Nine schools were the subject of case studies. They were chosen because Y7 pupils made significantly high positive attitude gains after transfer compared to the remaining schools in the sample. They shared certain characteristics. Most used some form of Bridging Unit, had extended induction programmes and provided summer programmes for both gifted pupils and those needing to catch up in literacy and numeracy. Several had instituted exchange visits between Y6 teachers and Y7 subject specialists. Some schools were exploring the use of the Internet for linking Y6 and Y7 pupils in ‘buddying’ schemes. Bridging Units were usually started in the last few weeks of the primary school and continued for several weeks after transfer to secondary; they were designed to support curriculum continuity. They did this to a limited extent but their main value was in promoting dialogue between primary and secondary colleagues on issues of pedagogy and assessment; this occurred more often when schools constructed their own units. A number of secondary schools were beginning to experiment with post induction programmes in an attempt to develop pupils as professional learners. These programmes typically involve the development of study skills, introduction to problem solving strategies and the identification of preferred learning styles. Pupils were generally very enthusiastic about them.
Implications for schools and LEAs in relation to transfer:
∗ Schools need further encouragement to pursue initiatives that place increased emphasis on the academic rather than the social aspects of transfer. More attention needs to be paid to pedagogic strategies known to improve both pupil attainment and intrinsic motivation.
∗ Schools need to look beyond assessment data when making professional
judgements about pupils’ progress. Successful transfer requires a degree of
iv
coherence across the different subject departments so teachers can plan for the continuities and discontinuities in (and between) the different disciplines.
∗ LEAs can play a crucial part in evaluating transfer initiatives and need to
allocate periods of inspector/adviser’s time to activities related to transfer. Managing institutional and personal transitions In this strand of the project we focused on three different transition experiences. i. How friendships affect learning, at transfer and beyond: Our starting point was evidence that at transfer friendships were widely seen as a means of social support while their potential for academic support tended to be overshadowed by anxiety about distraction. In the exploratory phase we conducted interviews in 9 secondary and 3 primary schools and in the development phase we worked with 5 secondaries. Some key observations:
∗ Pupils are discerning about friends whom they do and do not work well with, and which friends are helpful in relation to different subjects and tasks. The data suggest that, at transfer and beyond, pupils might be given a greater say in the construction of seating patterns and working groups.
∗ It can be important for teachers to recognise the value of peer support in the
classroom and to find ways of legitimising it.
∗ Pupils in top sets who lack confidence, and who find a pressured and competitive teaching style difficult to cope with, rely on friends for academic and social support.
ii. Helping pupils to re-commit themselves to learning: We were interested in how tensions and pressures can lead pupils to adopt particular persona and the difficulties they have in dropping them. We worked with teachers in 7 schools on strategies that would help pupils who have turned away from learning get back on track. In one-to-one discussions, some pupils said that they wanted to change from ‘dosser’ or ‘shirker’ to ‘worker’ but didn’t know how to: some described themselves as ‘addicted’ to ‘messing about’; some found it difficult to escape the norms of their anti-work peer group; and others felt that their reputations were so indelibly inscribed in teachers’ minds that a fresh start was not possible. Some key observations:
∗ The process of disengagement can be reversed if pupils feel that significant others in the school are able to see and acknowledge some of their strengths.
∗ Anti-work identities, once established, are difficult to change and it is better to
intervene early in pupils’ school careers. Whatever support is given, it needs to be sustained over a period of time; one-off sessions are not enough.
v
∗ Things that could make a difference for these pupils include more time in school to talk about difficulties, targets that they can identify themselves, and recognition of effort and small successes.
iii. How transitions in the same school can affect learning: Schools give more attention to the exits and entrances years than to the in-between years; Year 8, for instance, is widely seen by pupils as unimportant and they adjust their effort accordingly. Moreover, there is no tradition of organising induction events that would help pupils look forward with excitement and confidence to the year ahead. We gathered information from 13 secondary schools. Some key observations:
∗ It can be useful for schools to monitor the messages that they are giving about the status of different years and to check out what pupils’ views of the year ahead are and with what, retrospectively, they felt they needed more help.
∗ Schools need to ensure that they are sustaining the view, in all they say and
do, that Year 8 matters.
∗ Pupils would welcome more opportunities, as they move up through school, to be more autonomous in their learning and to feel that they can make a contribution as valued members of the school community.
Data from the three projects outlined in this section suggest a need for transition to be put more firmly on the agenda and for some of the energy and imagination that teachers currently put into preparing for transfer to go into preparing pupils for year on year transitions. The data also confirm the usefulness of consulting pupils about their experiences of transfer and about their images of the transition years. Revisiting some key issues There are some important over-arching concepts that need to be re-interpreted in the light of our data and reviewed by schools and local and national policy-makers. Continuities and discontinuities: The dominant assumption has been that continuities in pupils’ learning need to be strengthened. But when we tuned in to what Y6 and Y7 pupils were saying it became clear that while continuity matters for some aspects of transfer, discontinuity is also important – especially for pupils. Continuity has been mainly thought about in terms of the curriculum and is currently supported by ‘Bridging Units’. However, there can be problems if the transfer school receives pupils from a large number of feeder schools, where the units have been handled in different ways, and if pupils regard them as ‘last year’s work’. Ironically, while policy makers and schools have given attention to curricular continuity they have thought less about continuity in ways of learning. Schools need to review the balance of continuities and discontinuities around the transfer experience, bearing in mind that, for pupils, discontinuity marks a new and important stage in their school careers. In particular, a shift of focus is needed towards strategies
vi
that sustain the ‘excitement’ of learning (and the commitment to learning that such excitement can generate) beyond the initial stages of transfer. To allow sufficient time for this to develop, some ‘liaison initiatives’ may need to be cut back in scope. Progression: Progression is mainly thought about in terms of pupils’ passage through the curriculum. More attention needs to be given to planned advances in pedagogy as well as pupils’ developing understanding of the processes of learning and of themselves as learners. It may also be helpful for primary and secondary schools to establish common frameworks for advances in pedagogy by progressively developing pupils’ experiences of, and capacity to manage, learning in different ways.
For young people, being a year older matters. Pupils want - and expect – to be treated more like adults and to have more autonomy and trust; disappointment can lead to disengagement. Their increasing social maturity needs to be marked and planned for by yearly enhancements of opportunities and responsibilities.
Pressures towards achievement: The dominance of the Key Stage assessments in structuring schools’ approaches to teaching and learning was clearly evident in our research. A climate now needs to be encouraged which gives greater emphasis to the development of learning over time, rather than one where learning comes to be seen as a series of extended (but nonetheless comparatively short) test or exam-led bursts. However, the temptation to take short-term initiatives to ‘boost’ pupil performance at the margins (and, in the process, to accept that there will probably be some ‘loss of learning’ over the ensuing months) is understandably difficult for teachers to resist. In both sectors greater attention needs to be focused on how schools attempt to innovate. There is a recurring tendency to overload. In the area of transfer and transitions many schools will need help in deciding which potentially promising initiatives to develop and which existing practices to cut back on. Overall Recommendations Our report acknowledges the very real progress that schools have made in ensuring that transfer is a relatively anxiety-free experience for pupils and their families. A large number of schools, with support from LEAs and government policy-makers, could now usefully direct their attention to:
∗ the academic (as opposed to social) dimensions of transfer and the specific strategies which help to sustain pupils’ progress; this is a concern for both primary and secondary schools.
∗ the coherence of the interventions primary schools have in place to sustain
pupils’ progress during the ‘middle years’ as opposed to investing most of their energy in ‘catch-up’ strategies, especially during Year 6; this is mostly an issue for primary schools.

vii
∗ the balance of pre and post-transfer activities; in particular, the time and resources invested in post-transfer activities designed to sustain the excitement of learning and to help pupils develop a language for thinking and talking about their learning; this is mainly a concern for secondary schools.
∗ the social and the academic dimensions of within-school transitions including:
ways of marking pupils’ social maturity by increased responsibility and induction events for the in-between years that give pupils a positive orientation to the next year and a more confident understanding of what its academic demands will be. These concerns are relevant to both sectors.
To make time for these activities, primary and secondary schools will need to consider which aspects of their liaison activities are supporting the learning of their pupils, which activities need to be modified and which might usefully be reduced.
1
Chapter 1: Introduction to the Project The work described in this Report builds on an earlier review of research on transfer and transition (Galton, Gray and Rudduck 1999). The review concluded that successful efforts had been made by primary and secondary schools, with support from LEAs, to minimise anxiety and disorientation at transfer. However, it also indicated that there were issues to do with sustaining academic progress and pupils’ commitment to learning once the novelty of the move to ‘the big school’ had diminished. The review also pointed out that relatively little attention was being given to transitions. Within the project we defined ‘transfer’ as the move from one school to another and ‘transition’ as the movement of pupils to a new class at the end of each academic year, within the same school, and also as the personal transition that some pupils struggle to make from one learner identity to another. The DfES called for proposals to respond to the issues identified by the review and our proposal was accepted2. The Project started in January 2000 and ended in December 2002, with analysis continuing until April 2003. In the project we focused on three things: * diagnostic work in which available data from Year 2 (Y2) and Year 6 (Y6) National
Curriculum statutory tests would be combined with results of the QCA’s year-by-year ‘optional’ tests to explore in greater detail patterns of attainment in the primary phase with a view to understanding the run-up to transfer; data from primary headteachers about their experience of testing were also to be included (the research was led by John Gray);
* work on transfer with LEAs and schools who wanted to develop and evaluate
strategies designed to overcome some of the problems identified in our review (the research and development work was led by Maurice Galton);
* work on transition, looking at strategies which might help sustain pupils’ commitment
to learning across the middle years of secondary schooling, and strategies which support disengaged pupils in renewing their interest and effort in learning. We were also able to review links between friendship and learning at transfer and beyond (the research and development work was led by Jean Rudduck).
In addition we built up a resource file (accessible through the web3) of examples of work from schools other than those working closely with us on the transfer and transition activities. We were particularly interested in reports of approaches that focused on
2 At the start of the new project Homerton College was the grant holder. Since the creation of an enlarged Faculty of Education in August 2001 administrative responsibility later transferred to the University of Cambridge 3 http://creict.homerton.cam.ac.uk/transfer/

2
effective ways of taking account of pupils’ prior learning, that increased engagement by involving pupils in new ways of teaching and learning, and that enabled pupils to understand and take responsibility for their learning in ways that helped them to become confident and motivated learners. We were also able to undertake a small descriptive study of ways in which Information and Communication Technology (ICT) could facilitate the move from primary to the secondary schooling. Involving Schools and LEAs Through an article in the Times Educational Supplement LEAs and schools were invited to register an interest in the project’s research agenda. In addition, two one-day conferences were held at Homerton College, Cambridge, at which LEA representatives outlined the activities already taking place in their authority and indicated the areas where they would be willing to contribute to the research. In all, some 40 LEAs expressed interest in taking part; almost all were interested in the evaluation of pupil progress at transfer. Given the project’s resources, it was not possible to engage in research partnership with all 40 and the team therefore decided to offer two levels of support: in nine LEAs, the evaluation of the impact of transfer strategies on pupils’ progress would be conducted by the project team working closely with schools; in the remaining LEAs, accounts of interesting strategies would be edited and placed on the website, and materials to support self-review would be made available, but with the offer of support for the analysis of data. The nine LEAs where we worked most closely with schools were selected because they were already engaged in work on transfer which represented a range of different intervention strategies. The basis of school involvement for the diagnostic and transition work will be discussed later in the Report. Time frames The work on transfer centred on the 2000-2001 and 2001-2002 academic years; and involved two cohorts of pupils transferring to secondary school. The last data collection point was in July 2002. Within the diagnostic work the original intention had been to follow, using data from the recently constructed QCA optional tests, pupils’ progress in Y7 and Y8 as well as throughout Key Stage 2. However, delays in the developments of the tests meant that they were unavailable until the 2001 summer term. As a result, a more limited, small-scale investigation involving up to 1,000 pupils from schools within the 9 closely cooperating LEAs was undertaken. This investigation enabled us to look at ‘dips’ in attitudes and motivation between Years 6 and 7 as well as the links between pupil attitudes and achievement. The changing national context During the period of the project there were several national developments that impinged on our study in interesting ways. First, according to Ofsted (2000) the literacy and numeracy strategies at Key Stage 2, which emphasised whole class interactive teaching as the key component for the three-part lesson, moved to a point where teachers were

3
sufficiently confident to introduce a degree of flexibility into their teaching. The opportunities provided by a more flexible pedagogy are in line with our data that reflect pupils’ enthusiasm for a variety of approaches within lessons and for opportunities for discussion-based and problem-solving approaches. A decision was then made to pilot a Key Stage 3 strategy and this was implemented during the period of the Project. Second, there was hearsay evidence, confirmed in a research report by Galton and MacBeath (2002) that teachers were taking testing so seriously in the primary school that the more creative dimensions of the curriculum were at risk of being squeezed in order to make room for intensive preparation for the tests. This situation relates directly to the work of the project in that the interviews with primary heads, undertaken to identify patterns of pupil progress at Key Stage 2, throw light on the impact of the tests on teaching and learning. Third, there was evidence (Galton and MacBeath, 2002) that the upper years of primary schooling, partly as a result of a preoccupation with the tests, were becoming more like secondary schools; some participants in the project had expected that, as a result of closer liaison at transfer, secondary schools might try to build, for the first few terms, a learning environment that was closer in spirit and style to that of the primary school. Our discussion of the issues of continuity and discontinuity at transfer bears on this development. Fourth, the introduction in the mid-90s of the QCA optional tests in Years 3, 4 and 5 has made it possible to track pupil progress across the whole of Key Stage 2. With the help of the NFER, we arranged for the database to be constructed and interviewed fifty headteachers who were making use of the optional tests. We were able to provide a detailed analysis of the patterns of progress of pupils moving through Key Stage 2. These data paved the way for discussion of patterns of progress in academic performance as well as attitudes to learning and schooling in Key Stage 3. Fifth, the growth of interest in pupil perspectives, which has been supported by the government and other agencies (particularly the QCA) legitimates the emphasis we have given to pupil voices in some of our work within the project – while maintaining a commitment to presenting the views of teachers. During the Project two other reviews of different aspects of transfer were undertaken (Arnold, 2002; Ofsted, 2002b). In addition, work was also reported on the evaluation of pupils’ progress in the Key Stage 3 strategy (Barnes et al, 2003; Ofsted, 2003; Stoll et al, 2003). Reference is made to these studies, as appropriate, in the text. The structure of the Report and some key issues The Report has three main chapters and a concluding discussion. The first chapter reports and comments on the patterns of progress emerging from the Key Stage 2 data and the observations of 50 primary headteachers on aspects of testing and related issues. The second chapter reports the data on the impact of transfer on pupils’ progress in different subjects and on pupils’ attitudes to school; it also describes some of the different

4
transfer strategies being managed by schools and LEAs. The third chapter reports work with schools on friendships and learning at transfer and beyond; on the challenges of helping disengaged pupils make the transition from ‘shirker’ to ‘worker’; and on the approaches adopted by a few schools to put more emphasis on the transition from one year to another and the implications for pupils’ learning. Among the key issues that the project highlights are these:
∗ the balance between continuities and discontinuities at transfer;
∗ the balance between the social and academic dimensions of schooling at transfer and beyond and particularly in relation to the monitoring of progress;
∗ ∗ the balance between investing heavily in the ‘exit and entrance’ years (and
years with a test or exam) and investing in other periods of schooling; ∗ ∗ the balance between investing effort in pre-transfer activities and investing
effort in post-transfer and transition activities.

5
Chapter 2: The Primary Side of the Transfer Divide: Heads’ Perceptions
and Pupil Progress
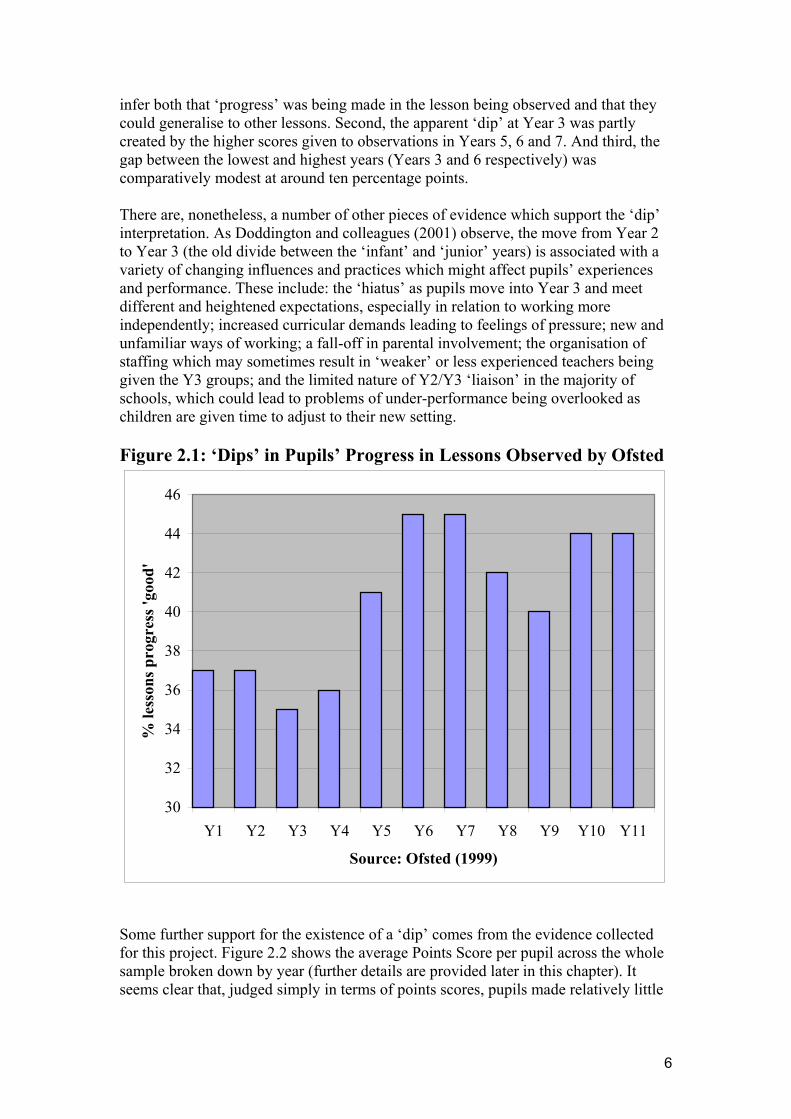
John Gray, Steve Hussey, Ian Schagen4 and Maria Charles Introduction This chapter explores two issues. First, primary heads’ perceptions of the ways in which they have been handling transition issues as pupils move through from Key Stage 1 to Key Stage 2. It considers how they set expectations for pupil progress, the ‘interventions’ they undertook to boost progress and some of the pressures they experienced in the run-up to transfer. Second, it attempts to establish whether pupils’ progress between the two Key Stages can be at least partially explained by the ‘routes’ or ‘steps’ they take from one year to the next (Year 3 to Year 4, Year 4 to Year 5 and so on). Are some patterns of progress associated with greater pupil progress than others? And, if there are, what is the particular contribution made by the school they have attended? Previous research has shown that a variety of factors over and above those which individual pupils bring with them to school can make a difference to their progress during the primary years. Amongst these the most obvious are the particular effects of the primary school attended (Mortimore et al, 1988). The same research suggests that up to 10% of the variance in pupil performance at Key Stage 2 may be attributable to differences between schools. Researchers and policy-makers have then tried to locate the sources of such potentially unequal progress by exploring various aspects of schools’ policies and practices. Such efforts, in turn have resulted in recent years in a raft of ‘improvement’ initiatives intended to enhance pupil progress including so-called ‘booster’ classes, some Easter and summer schools and other activities beyond the confines of the conventional school day. These have been launched with the intention both of tackling low achievement in core skills such as reading and mathematics (hereafter referred to as maths) and generally facilitating pupil progress en route to Key Stage 2. Another line of enquiry has explored the question of whether there have been particular stages of pupils’ careers when they appear to have marked time or even regressed. This has been a particular concern of Ofsted’s. During the mid-1990s they commented on the higher number of ‘unsatisfactory’ lessons observed in Year 3 (Ofsted, 1995) and later pointed again to their conclusion that achievement was ‘weakest in Years 3 and 4’ (Ofsted, 1997). Indeed, this ‘pattern’ was still evident two years after that (Ofsted, 1999). Ofsted’s figures undoubtedly show a ‘dip’ around Year 3 and another around Years 8 and 9 (see Figure 2.1). However, some caution is needed in interpreting this evidence on several counts. First, pupil progress was being judged on the basis of observations of classroom events rather than measured pupil performance; the inspectors had to 4 Ian Schagen and Maria Charles both work at the NFER.
6
infer both that ‘progress’ was being made in the lesson being observed and that they could generalise to other lessons. Second, the apparent ‘dip’ at Year 3 was partly created by the higher scores given to observations in Years 5, 6 and 7. And third, the gap between the lowest and highest years (Years 3 and 6 respectively) was comparatively modest at around ten percentage points. There are, nonetheless, a number of other pieces of evidence which support the ‘dip’ interpretation. As Doddington and colleagues (2001) observe, the move from Year 2 to Year 3 (the old divide between the ‘infant’ and ‘junior’ years) is associated with a variety of changing influences and practices which might affect pupils’ experiences and performance. These include: the ‘hiatus’ as pupils move into Year 3 and meet different and heightened expectations, especially in relation to working more independently; increased curricular demands leading to feelings of pressure; new and unfamiliar ways of working; a fall-off in parental involvement; the organisation of staffing which may sometimes result in ‘weaker’ or less experienced teachers being given the Y3 groups; and the limited nature of Y2/Y3 ‘liaison’ in the majority of schools, which could lead to problems of under-performance being overlooked as children are given time to adjust to their new setting. Figure 2.1: ‘Dips’ in Pupils’ Progress in Lessons Observed by Ofsted
30
32
34
36
38
40
42
44
46
Y1 Y2 Y3 Y4 Y5 Y6 Y7 Y8 Y9 Y10 Y11
Source: Ofsted (1999)
% le
sson
s pro
gres
s 'go
od'
Some further support for the existence of a ‘dip’ comes from the evidence collected for this project. Figure 2.2 shows the average Points Score per pupil across the whole sample broken down by year (further details are provided later in this chapter). It seems clear that, judged simply in terms of points scores, pupils made relatively little

7
progress in Year 3, especially in maths and at least by comparison with progress made in the later years and notably Year 6. The case for interventions in the ‘in-between’ years (Years 4 and 5) has been given less attention, at least in comparison with Year 3; there have also been fewer large-scale initiatives. By contrast, Year 6 and the run-up to the Key Stage 2 assessments have seen a flurry of developments, mostly introduced by schools themselves but with some external encouragement and support from LEAs and central government. There have also been a few more radical initiatives such as ‘summer’ schools where the intention has been to help targeted groups of pupils ‘catch up’ by providing sustained experiences of literacy and numeracy. Figure 2.2: Average End-of-Year Points Scores per Pupil in Reading and Maths Between KS1 and KS2 by Year
14
18
22
26
30
Y2 Y3 Y4 Y5 Y6
Poin
ts s
core
ReadingMaths
Perhaps the most striking development during the primary stages has been the introduction of the National Literacy and Numeracy Strategies. One of the intentions here (beyond the obvious one of seeking to improve overall standards of attainment) has been to provide a common framework for schools and teachers to plan pupils’ progress and experiences. In the process, issues of continuity and progression over the course of the primary years have been given considerable prominence. Several strands of research and policy-making come together, then, to contribute to the view that younger pupils should be encouraged to get off to ‘a good start’ in Year 3 that is subsequently sustained throughout their primary schooling. It might seem reasonable to suppose that the majority of pupils build up their ‘profiles’ in a steady and consistent manner but, in reality, the proportion of pupils making progress in this way has yet to be established. It has been widely reported in the press that a Year 6 ‘push’ for performance takes place, as primary schools do their utmost to prepare their
8
pupils for the Key Stage 2 tests. But whether schools themselves can be characterised in terms of their pupils’ progress paths is also unknown. ‘Dips’ are one possible variant from the notion of steady progress, but there are also others. Broadly speaking, four possible ‘routes’ or patterns of ‘steps’ between Key Stages 1 and 2 can be conceived. These four categories are, of course, over-arching ones which summarise greater underlying diversity. They can be explained briefly in the following terms:
* ‘equal-sized’ steps, where progress each year is broadly similar; * ‘increasing’ steps, where each step gets larger than that taken the previous
year; * ‘decreasing’ steps where the opposite happens and each step is smaller than its
predecessor; and * ‘variable’ steps, where no consistent patterns from one year to the next can be
identified. Naturally, the actual distribution of pupils and schools across these different ‘routes’ or ‘steps’ is a matter for empirical investigation, as is the question whether the ‘routes’ or patterns of ‘steps’ taken between the key stages actually make a difference to eventual performance. This issue has not been explored before, chiefly, of course, because of the lack of any suitable data-sets tracking pupils’ and schools’ year-on-year progress. Consequently four key questions drive the analysis of pupil progress that follows: How do pupils’ profiles build up over time? How far does this matter in terms of their subsequent performance? Do schools vary in the ‘routes’ or patterns of ‘steps’ with which they are asociated? And, if they do, to what extent do such differences affect pupils’ overall progress? But first it seemed prudent to enquire what primary heads themselves thought about some of the issues raised here. Interviews with Primary Heads As part of the research we undertook 50 interviews with primary heads, all of whom had been involved in administering the QCA’s ‘optional’ tests to their pupils and attempting, to a greater or less extent, to track, understand and improve their pupils’ performance. The interviews tackled a variety of concerns5. They sought to establish heads’ views about the period between Key Stages 1 and 2, the factors they believed structured their work including the demands of external accountability, what steps they took to inform themselves about pupils’ progress from year to year, how they planned ‘interventions’ and with what perceived results, as well as some of the ways in which they hoped to develop in the future. Methods and sample The heads in this national sample were drawn at random from those administering QCA’s ‘optional’ test to their pupils in Years 3, 4 and 5. An additional requirement was that they should have been doing so for some time in order to ensure that they had a reasonable amount of experience in tracking pupils’ progress from year to year. Since over 90% of primary schools are now involved in the optional testing 5 The interviews were conducted by Steve Hussey.

9
arrangements, the group is likely to be generally representative of primary headteachers as a group.6 The interviews were conducted over the phone by a highly experienced interviewer, using a semi-structured approach, and lasted between half an hour and an hour; they were fully transcribed before analysis took place. Why collect data on trends in pupil performance? What did heads do with the optional test data once it had been collected? The answers may seem obvious but a significant minority of the heads we interviewed had not really clarified what they wanted to do with the data. Given the extent of the investment they had already made, however, many were unsurprisingly concerned to make more use of the evidence they had assembled. Common justifications referred to heightening expectations and diagnosing problems. By way of example, one head told us:
“I have files on each cohort in the school and it goes into that database and then, you know, we look at that and see what lessons we can learn from that on a cohort basis, on a curriculum basis and also in terms of individual pupil progress – and that’s discussed with the staff”.
Other heads looked back a few years to the period when they had little data available, but nonetheless felt more confident about the position in their school: “We were quite horrified, I think it’s fair to say, that the results we were achieving in English at the end of KS2 way back in 1996 were out of line with the standards in maths and science”. But having data and being able to make use of it have turned out to be different things. “Not a great deal”, commented one head. “Just look at them and think, ‘Yeah, that wasn’t very surprising’. And put them in the folder. To be honest, it was just one more thing”. Another reported feeling overwhelmed by the evidence:
“The tests give us a lot of data, too much data really...You’ve not seen my desk! I’m snowed under with data and information. The trouble with the optional tests is that I think that they give us a lot of good stuff, useful stuff, but it’s just seeing the wood... and acting upon it”.
Setting expectations for pupil progress Most of the heads we interviewed fell somewhere between the two ‘positions’ outlined above. They were interested in what the data had to say but lacked either the willingness to invest more time or, for that matter, the expertise to explore their implications more thoroughly. A common response was to share the results with other members of staff. In fact, 92% of the heads we interviewed said that they routinely did this the results with established staff, whilst over half (54%) shared them with parents. The process described in the following account was common in many schools:
6 The claims to representativeness here are couched in somewhat conditional terms because we have been informed by QCA that whilst over 90% of primary schools purchase the tests for their pupils to take, this does not necessarily mean that they administer them systematically, although most are believed to do so. The heads interviewed in this study did administer them to their pupils in the relevant years. A very high proportion of the heads who were initially approached agreed to be interviewed.

10
“We tend to, at the next available staff meeting, bring all the data together and look at it as a whole school. (I: Is there any particular analysis that you do to them?) No particular or systematic analysis. Because of the size of the school we probably just go through each pupil looking for surprises”.
When pressed, this head talked about ‘surprises’ being ‘departures from the expected’, an issue to which we shall return. Other heads, however, had clearer views about how the data should be handled. One said:
“It’s no good giving out lots of sheets of paper for somebody to do exactly the same work as somebody else has already done. What you need to do is to feed back things that are going to influence the teaching, that’s going to make the learning better.... So then you cherry pick really. You decide what’s most relevant to your situation, what’s the bit that you can most easily tweak, should you need to tweak it”.
In another school more focused enquiries of the data appeared to take place. The head and colleagues were equally clear about what they were looking for and what they needed to know:
“We’re looking obviously on the one hand for improvement.....So we’re looking for the strengths and weaknesses, tracking children through but also tracking year groups through and groups of children so that we can begin to build up a picture over time of these groups”.
Few heads, we found, used their data analyses directly as the basis for framing sustained action and intervention. Mostly they adopted a more limited and sceptical approach. In this respect the responses of one particular head we interviewed, who had very clear views about what actions were required, was unusual:
“Because I’m very anxious that the school is seen to be moving forward and is seen as an effective school, I’ve got to make sure that my children make accelerated progress. The only way I can do that really is if we cut up the amount of progress a child has to make into four equal stages so that we can say, ‘OK. End of Year 3 as measured by the Year 3 QCAs, we expect this number of children to have reached this level’. We use the QCA like milestones to match our performance, otherwise they have to make too much progress or an impossible amount of progress between Year 5 and Year 6 and it puts too much pressure on staff”.

11
This head had also worked out how he would respond to data on children’s progress:
“So half way through the Key Stage, when they’ve done their QCA Year 3 and Year 4s and they come into Year 5, 50% of this class are not going to make the progress they should have and the staff need to be aware of this. Otherwise you blame the child, or you blame the parents or you blame ‘that lot down there’ who send us these children instead of thinking creatively about what skills they are going to have to teach these children”.
Our evidence suggests that these heads had a clear view of how they expected pupils’ attainments to develop over time. Essentially, they were drawing on a ‘linear’ model in which pupils took equal-sized steps from one year to the next and where some ‘action’ was probably prudent if they did not. Across the whole range of interviews we found considerable evidence that schools had developed common responses to the situations they found themselves in. Most had worked out how they would handle the data emerging from the testing programmes, most recognised some kind of ‘dip’ or plateau during Year 3 and/or Year 4, and most were aware of a subject where pupils were ‘under-achieving’, writing being the subject most commonly mentioned (see Table 2.1).
Table 2.1: Schools’ Analyses of Evidence from the Optional Tests
Area of Activity or Analysis % of heads
Defined procedures to deal with test results 74% Using software to process data 70% Identifying ‘dip’ or ‘plateau’ in Y3 and/or Y4 68% Identifying a subject where pupils ‘under-achieved’ (usually writing, sometimes reading, occasionally science or maths)
74%
Reporting boys’ ‘under-performance’ 56% Reporting ‘ethnic’ ‘under-performance’ 24% Paying special attention to SEN pupils 40%
Lessons derived from data-analyses We were interested in whether the schools had identified any ‘patterns’ in the course of their analyses. Three common responses emerged (see Table 2.1 above); these were: * the performances of boys (relative to girls); * the performance of SEN pupils; and * the presence of ‘dips’ at particular time-points. One head had found evidence of all three:

12
“Well, based on this last year’s set of data, it confirmed to me that we’d an increasing problem in reading... the other one was in relation to SEN... And the other one that confirmed what we knew was the gender one because the boys tend to make very good levels of progress, our girls still do better but only just. And the other one that’s interesting was that it confirmed where we tend to have dips in performance”.
Some schools had identified boys’ performance as a problem from a relatively early stage.
“Yes, we do find, Year 4 in particular, towards the end of Year 4, we get occasional groups of boys who are perhaps sort of losing interest a bit in the academic work in school”.
But whilst gender-related aspects of performance were a recurring theme, during other interviews some doubts were also expressed. One head responded: “I get kind of uptight (about the gender issue)....good teaching for boys is good teaching for girls and vice-versa. And so I’m looking, you know, at children”. Another said: “In our school we seem to buck the trend and the boys outperform the girls”. Prospects for intervention? In offering their perceptions of what was happening many heads talked in terms which, broadly speaking, identified the main factors influencing pupils’ progress as being largely beyond their control. One described the situation in the following terms:
“I’m sure there are dips and spurts in progress but I haven’t done that level of analysis. We don’t do anything to combat this; I think it’s more to do with social factors than what we’re doing. I think it goes in spurts and that depends largely on what is happening in their own lives, outside influences, not so much what is happening in schooll.
In fact, some did refer to aspects of school organisation and ethos which might be affecting pupils’ progress. Factors commonly identified included: * the transition from Year 2 to Year 3; * the change in assumptions accompanying this transition; and * curriculum changes. Talking about the transition from Key Stage 1 to Key Stage 2 and the extent to which expectations changed, one head remarked:
“...it has always been an accepted fact that the transfer from Infants to Juniors is a difficult transition and children often do struggle. Our school has a target group of children whose progress has been seen to have dipped and we do concentrate on them in Year 3”.
13
In another case a head talked about the change of ‘ethos’ associated with this early transition:
“I think from the children’s point of view it’s a very different work ethic in Key Stage 2. I mean the SATs [sic] themselves are very different. They’re timed for a start”.
There were also echoes of some of the concerns voiced by secondary teachers about the confidence that could be placed in primary schools’ results. Talking about the Key Stage 1 results passed on to her school, one head complained:
“One of my concerns is that our KS1 results always seem to be all over the place....there seems to be little consistency.....It’s almost as if we’re still wrestling with the children at KS1 to get them into that mental state and I think some of this still happens in Years 3 and 4”.
Whilst 70% of the schools reported using software (usually Assessment Manager or Excel) to process their data, we were interested in whether heads undertook rather more detailed analyses of the results on pupils’ progress than these programmes facilitated. The vast majority, it seemed, did not. A few tracked pupil progress systematically between Key Stage 1 and Key Stage 2. When we enquired of this group if they had noted any ‘patterns’, however, their responses suggested that they had not. Their points of reference were usually the national norms for the year group or for a particular sub-group. The year-by-year ‘patterns’ of pupil progress outlined in the previous chapter were not referred to. The overall picture presented by the interviews suggests that the heads had a fairly clear grasp of the general picture presented by the test data but experienced some difficulty in turning such insights into action. In seeking to increase the rate of pupil progress, they needed to encourage their colleagues to take additional initiatives over and above those which were already in place. In situations where many teachers believed they were already over-stretched, some teacher ‘resistance’ was anticipated and had, indeed, been experienced. Intervening to ‘make a difference’ What steps did the schools take to improve pupil performance during the primary years? Nearly all the heads interviewed acknowledged the existence of a ‘push’ during the run-up to the Key Stage 2 assessments in Year 6. Two thirds also claimed to have been implementing some measures during Years 3, 4 and/or 5 although activities here seemed more limited. Only a minority (30%) confined their efforts largely or exclusively to Year 6. Two approaches dominated heads’ approaches to Year 6: regular use of ‘practice tests’ (reported by 82%) and the provision of so-called ‘booster’ classes (74%). Most schools reported receiving some additional funding (directly or indirectly from central government) for this latter activity.

14
A majority concentrated their more experienced teaching staff on the Year 6 classes, reduced the scope of the curriculum taught during Year 6 and focused the efforts of any support staff available on the needs of this age-range (around 60% in each case, see Table 2.2). A small minority (22%) also committed other resources they had available for use at their ‘discretion’ to these tasks.
Table 2.2: Schools’ main ‘interventions’ in run-up to KS2 assessments in Year 6
Area of ‘Intervention’ % of heads
Using practice papers regularly to prepare pupils for Year 6 assessments
82%
Using ‘booster’ money for additional classes or in-school/ out-of-school activities
74%
Reducing scope of the curriculum taught during Y6 58% Concentrating experienced teaching staff in Y6 60% Focusing support staff efforts on KS2 tests 62% Using other sources of funding to support KS2 preparations
22%
Reorganising the Year 6 curriculum The area which attracted the most powerful commentaries related to concerns about possible ‘narrowing’ of the Year 6 curriculum. The heads varied in terms of the strategies they had adopted but the strength of feeling was nonetheless obvious. One head remarked:
“There is narrowing in Year 6. I mean it’s pretty appalling actually, what goes on. I really do dislike it. Particularly in science for instance where it is just revision... So you tend to be rushing through Year 6 saying, ‘Do you remember you did this?”
Another head complained that their efforts to resist the ‘narrowing’ brought about by the tests had been undermined by the actions of other schools:
“Unfortunately, in the past, we ploughed our own furrow and found that the children were not showing the same amount of success as other children within our town...So having heard how others do it, we had to join in, using the same process.....It’s right throughout the school”.
Another talked of reorganising Year 6 into two parts – the first part as a ‘revision year’ and the final part as a ‘return to the normal curriculum’:
15
“We have a rolling programme of different foci over a sort of two year programme so that by the time they’ve reached Year 6, they’ve addressed everything at least once and most things twice and then we treat Year 6 as a revision year but possibly with a focus on a particular area that hasn’t been visited since Year 3 or 4. The children get fed up. But I mean we just, like most schools I suppose, we plan to have a lot of other areas of the curriculum, in a intensive way, as soon as the SATs [sic] are finished”.
The reorganisation of the Year 6 curriculum into periods before and after the formal assessments was referred to by others. “After the SATs [sic] have been taken the curriculum blossoms. From May onwards there’s a great deal more drama and art and PE”. Whilst a substantial minority of heads were reluctant to admit that they had given in to the considerable pressures they felt under to ‘narrow’ the curriculum, only one of those we interviewed put forward the view that he was determined to hold out. “We’ve tried to do the opposite in a way. We’ve tried to go for a more broad and balanced curriculum”. As our interviews progressed we became aware that the ‘narrowing’ issue touched a raw nerve amongst our sample of primary heads. It was clearly a topic which had consumed many hours of debate; it was not a topic, apparently, on which they could remain ‘neutral’. We sensed a determination amongst our sample to hold to a broader vision of the primary school curriculum. However, even that position generated scepticism amongst some of our respondents. One said: “I’d like to be generous (about heads who claim they are not narrowing the curriculum) and say that they are simply mistaken. But I think many of them may have been misleading you. The simple truth is that schools operate on a competitive basis and the degree of accountability we all face means that we all do an amount of teaching for the tests”. Test preparation Curriculum ‘narrowing’ is an example of the indirect influence of the tests on the primary school curriculum. The heads were quick to point to instances, however, where there was a direct influence as well. One head argued:
“But it does narrow down for Year 6, simply because of the test formula – a lot of it is that the child must feel confident. I mean, if a child feels confident, they’re going to attack those tests but to be confident they have got to be very very familiar”.
As part of the process of test preparation considerable time was spent on aspects where difficulties were anticipated:
“We try and highlight the areas of the tests where we think they may struggle and concentrate our efforts here”.
In some schools the ‘logic’ of test preparation penetrated further and affected the nature of the activities pupils were asked to undertake:

16
“In the beginning of the Spring term, one of the afternoon lessons every week is a science revision period because (a) I’m a scientist and (b) I recognise that this is the only fact learning subject they’re tested on at the end of Key Stage and they have to remember four years’ worth of facts... ”.
There were other ways in which the tests’ demands affected what was placed on the curriculum:
“Obviously, in things like English, we make sure that we always do a weekly extended writing piece and we make sure that we cover in the last half term as many of the genres of writing that we can possibly think about because it’s revision really”.
Finally, the majority of heads (60%) reported that they took steps to ensure that Year 6 pupils were taught by experienced teachers who could commit their experience of testing and assessment to the cause of raising measured test performance. One head talked of looking for a teacher who was “a refiner, a polisher, somebody that’s really going to look at past test papers and say ‘Well, what was it that made the difference between a four and a five?” Heads’ reports of the ways in which they have come to organise Year 6 suggest that something approaching a two-part year has emerged. During the period up to May the focus tends to be largely (in some cases exclusively) on those subjects which are going to be assessed – English, maths and science. After that they re-introduce other areas of the curriculum which may have been ‘neglected’ in the interim – in particular the creative arts. One consequence of these arrangements, of course, is that pupils are unlikely to have kept up their ‘basic skills’ (those tested in the Key Stage 2 assessments) with the same intensity for a period of several months prior to transfer to secondary school. The use of ‘booster’ classes ‘Booster’ classes, as their name implies, are intended to raise pupil performance at the borderlines by providing a mixture of smaller group sizes and focused support. Around three-quarters of the schools in our sample made use of them. Heads who used them extensively identified a number of positive features. These included: * the opportunities given by smaller groupings; * the effects on pupils’ confidence; and * the possibilities of tailoring teaching more closely to pupils’ needs. One head, who confessed to being an ‘enthusiast’, mentioned how:
“the smaller group gives you the opportunity to do more speaking and listening. It gives you the chance to articulate their understanding of the text or their understanding of an
17
answer or to have time spent on something that they’re finding difficult”.
Another noted the pick-up in pupil responses after a relatively short period of time:
“... they work because the children we select for Boosters are just so despondent about how you do a test and they have it explained... The first time they are presented with a paper, their mark is abysmally low. But, three weeks later, because they know how a paper works and their knowledge isn’t any better, but their scores are dramatically better, and that is nothing to do with the teaching”.
Booster classes were also used as part of setting arrangements to create more manageable group sizes in Year 6:
“These arrangements came about as a result of trying to make it easier to target Year 6 pupils prior to SATs [sic] and also to target more help to the children as well. We have booster classes and that kind of thing mixed in too”.
Whilst schools were learning to make better use of booster classes and to realise some of the benefits of the additional funding offered, others were becoming more aware of the difficulties of organising effective provision:
“Yes, we’ve had some success in some cases. But they’ve not made 100% difference. It’s not just a matter of cramming knowledge into these kids. Problems can also be linked to things like lack of confidence, emotional problems and so on”.
In another case the constituency for the group had changed. Pupils who, in previous years, had volunteered an interest in participating, were now targeted instead:
“Our boosters have not been so good this year because of commitment on both sides, children and teachers... I think this is because of the way we’ve arranged it. Last year, when we had them, we invited all children to come along and this year we’ve just asked certain children. The problem is that I think this has labelled these children as failing in some way”.
Initial enthusiasm for booster classes had also become more realistic. A number of heads reported that they were now more cautious in their claims about the outcomes:
“I have to be very honest here and say that a lot of the children we get to level 4 (because of the boosters), if we left them alone wouldn’t get a level 4. If I put my hand on my heart, they’re not really on a level 4”.

18
“Yes and no. Yes (boosters) are working from the point of view of edging or should I say pushing children over from level 3 to level 4. But in a school such as ours, where the biggest problem is not getting the children to a 4 but to read, write and add up, then things like boosters are really the wrong way of addressing the problem”.
In a minority of cases heads were now quite dismissive about the possibilities of ‘short-term intervention and commitment’:
“The last few weeks before a test? I don’t think it’s going to make an awful lot of difference”.
To summarise heads’ responses, most had some experience and many welcomed the additional resources ‘booster’ strategies offered. There was a clear desire, however, to use the funding made available under this scheme to develop more sustained ways of tackling perceived problems of under-achievement. Some saw themselves as being highly constrained in the ways in which they could address such concerns whilst others perceived greater flexibility and potential. Whatever their particular response, however, many felt that it had taken them a couple of years to learn how best to make such interventions work effectively. ‘Interventions’ in Years 3, 4 and 5 ‘Interventions’ in Years 3, 4 and 5 were less frequently mentioned by the heads in the sample, at least in comparison with what was done in Year 6. Nonetheless, two thirds (66%) reported doing something (see Table 2.3).
Table 2.3: Schools’ main ‘interventions’ in Years 3, 4 and 5
Area of ‘Intervention’ % of heads
Some additional activities taken in one or more of Years 3, 4 or 5
66%
Introducing setting in maths and/or English 16% Redirecting ‘booster’ money to similar interventions in Years 3, 4 and 5
18%
Changing some aspect of the school’s ‘pedagogical’ approach
4%
Much of what was being done had been in place for a number of years. It had simply been adapted or facilitated by recent developments. As one of the heads (who mentioned several small-scale activities) said:
“We have quite a few initiatives. They didn’t necessarily come about because of boosting SAT results. Some we already had, others we put in because we thought they would be a benefit to the children and some we
19
put in directly because of SATs [sic] because the government gave us booster funding... We’ve got Reading Recovery which we started doing quite a while ago (in Years 1 and 2).”
A small minority of schools had responded to the pressures by introducing forms of setting alongside booster classes. In one school setting had been introduced in maths for Years 3 and 4 and then, again, for Years 5 and 6. This school was on the point of introducing similar arrangements for English because the ‘booster arrangements’ they had in place needed supplementation; Year 4 was ‘a particularly poor year’. Some schools were experimenting with the use of ‘booster-type’ arrangements throughout Key Stage 2:
“Every year in Years 3, 4 and 5, we have Maths Springboard, which is a set of boosters if you like, lasting I suppose about six weeks, twelve hours in total. In Year 6 we’ve obviously got our boosters. We employ a member of staff for two mornings a week to boost and then in the run-up to the actual SATs [sic] themselves. The staff will also take additional boosters after school”.
Other schools talked about working intensively in ‘booster’ contexts with pupils who were falling behind in Years 4 and 5 and “who’ve got serious areas of weakness – not special needs but for instance someone who’d been a really appalling speller and has reached Year 4 and hasn’t got any other strategies”. There was a fairly general perception amongst the heads that ‘intervening early’ made some difference to pupils’ progress. How much progress, however, they found difficult to assess. The majority of those who were intervening at this stage were fairly confident that they were having some impact but a few also expressed some doubts. Describing her school’s involvement in a particular scheme, one head told us about the ideas lying behind a maths ‘booster’:
“It’s called Springboard National Numeracy and, if you’re a bit wonky, you get ‘springboarded’ up. You can tell from my tone that I’m a bit sceptical... I just think it’s quite an interesting idea if you were just a little bit poor at maths you could do these few extra lessons and then you could be quite good at maths (laughs), especially if you were taken in a group because you were quite poor at maths and told to sort it out.”
In brief, a majority of the schools in the sample were experimenting with some form of ‘intervention’ in either Years 3, 4 or 5 or, more occasionally, all three. Again, the picture that emerges is one of heads feeling their way towards strategies which might ‘make a difference’ rather than setting up arrangements which they were confident would work.

20
Changes to pedagogy Only two of the heads (just four per cent of the sample) talked about changing aspects of their schools’ pedagogical approaches. In one of these two instances the rethinking that had taken place had been both thorough and extensive and had lead to a series of significant changes. This school had started around 1997 by considering the QCA’s ‘action points’ that are published at the end of each year as a form of feedback. To meet them, the head (and subsequently her colleagues) had begun to ‘recognise that it was the teaching that had to change, not to pass the exams for the children but to improve their understanding and skills’. The school’s review started slowly by looking at how children ‘explained their understanding’. Two areas were identified for more detailed exploration – comprehension and answers in science where pupils were ‘required to explain what they had done or to quote evidence’. Aspects of narrative writing were also considered. A number of further points for teaching flowed from these analyses. Initially Year 6 was the focus but subsequently the challenge turned to seeking to ‘embed that teaching’ across the whole school. ‘Professional skills’ were sharpened through discussion and training in a series of areas including grammar, comprehension, language through literature, spelling and handwriting. As a result a view of the specific teaching that was needed to teach both narrative and non-narrative writing began to emerge. The final stage involved the creation of new schemes of work along with criteria for marking which were employed across the whole school. Teachers’ planning was monitored and feedback offered with further action points. Classroom teaching was also observed, again with feedback to staff. These developments then became part of the school’s new policy for teaching and learning which involved both teachers and pupils:
“We observed the teaching having built an understanding of what teaching and learning in schools should look like by agreeing a teaching and learning policy that we worked on as a whole staff... We do a lot of work where there is a dialogue between teacher and class about work, so the children begin to establish why things are successful and why they are not and what they need to do next... We do a lot of moderation work... We’ve improved our planning style so that we can have appropriate learning objectives. We’re clear about sharing the purpose with pupils for all the teaching that we do and we do direct teaching of key points”.
It needs to be noted, however, that the commitment of these two heads to changing aspects of their colleagues’ pedagogy was unusual. Most initiatives stopped well short of this. Heads’ responses in a climate of testing Underlying the heads’ responses to our questions about specific aspects of their practice we detected two basic ‘dimensions’ with respect to the various changes they

21
and their schools were experiencing. The first related to their general attitudes towards the testing and assessment activities they and their colleagues were involved in. Some were ‘positive’ in their responses and saw advantages in the reforms of the last decade. Others, by contrast, were more sceptical and, occasionally, hostile, noting a variety of dysfunctional consequences they believed flowed from current strategies for primary school improvement. The second dimension concerned heads’ responses to the situation they found themselves in. Some adopted a ‘reactive’ stance - they and their schools undoubtedly implemented changes but only when they judged them to be ‘necessary’ or ‘unavoidable’. Another group, by contrast, were much more ‘proactive’ - they took a lead in initiating change and exploiting the various possibilities for development available to them. We rated each of the 50 heads interviewed as part of this research in terms of these two dimensions. These were essentially global judgements, based on the totality of what heads said, rather than precise measurements. As we shall show shortly, however, these basic ‘positions’ do seem to have had some implications for subsequent planning and action. The rating exercise suggested that the greater majority of heads ranged from feeling somewhat negative about the assessment reforms to very negative. But, at the same time, the greater majority tended to be fairly proactive. This produced the somewhat unexpected picture suggested by Figure 2.3 where the two dimensions have been put together to produce four ‘positions’.
Figure 2.3: Heads’ ‘positions’ in relation to testing and interventions
___________________________________________________________________ Negative 2 38 Reactive Proactive 3 7 Positive Key: Attitudes towards testing: ‘negative’/’positive’ Responses in terms of ‘interventions’: ‘reactive’/’proactive’
By far the largest group, making up three-quarters (38 heads, 76%) of the total sample, fell into the ‘negative but proactive’ category. The next largest category (14% of the total) was the ‘positive and proactive’ group. The ‘negative and reactive’ group turned out to be very small indeed at just four per cent.
22
‘Negative but proactive’ heads The ‘positions’ of the ‘negative but proactive’ majority are undoubtedly familiar. Many of them voiced their doubts openly about the implications of ‘high-stakes’ testing but then responded pragmatically in terms of the ‘interventions’ they developed. As one head (not previously quoted in this account) observed:
“Although I don’t tend to express doubts about testing, my personal feeling is that it would be far better for the money to be spent in trying to improve children for their learning by providing actual resources in schools as opposed to spending x million pounds on a testing programme”.
Developing a concern, which was reflected by many other heads in this group, he continued:
“What I do tend to find in the whole testing regime is that teachers are sort of teaching according to what they think will achieve better test results rather than trying to provide a more broad and balanced curriculum for children and I think that’s a major issue.......The sort of issue that says, ‘get results by giving them extra work for a few weeks before a test’, I think is flawed. I mean, it’s all to do with having a greater focus on how children learn and children don’t learn by being crammed for tests”.
Heads in this group referred frequently to the various ‘pressures’ on them, their colleagues and their pupils. They also rehearsed with us some of their frustrations:
“I think it’s only when you hear what’s happening in other schools, with parents particularly, that you begin to feel that these children are having too much pressure put on them. You know, last year at one school I know, there was a class having not done their SAT tests very well, then sort of had to have almost a piece of dictation on why they hadn’t done it properly.”
Other heads were concerned about the consequences for the curriculum that resulted from the various pressures they experienced to perform well in the tests. These views were variously expressed by different heads but with equal degrees of forcefulness, as the following responses reveal:
“In many schools, in many classes, I think the timetable is more or less put to one side (in Year 6)... I think that’s inevitable, given the current climate. Doesn’t mean to say we like it but we do it”.
“I looked back through the records and I thought, ‘Well, it’s not as good because they’re not motivated and they’re not as

23
excited about what we’re doing’... I think unless we get that curriculum back, you’ve got a lot of disaffected children.”
Pressures flowing directly from target-setting were also commented on frequently:
“Many of our children start here as level 1 and the SATs [sic] are all about the ‘magic 4’. Obviously very many of them are never going to reach it. They make real progress but they’re not hitting that magic number... Very frustrating. It’s the reason why morale is low. We’re not seen to be trying our best.”
Another head talked about his misgivings in terms of overall results when he found himself, unexpectedly, admitting two children whose Key Stage 1 results indicated that they were very low performers:
“And then these two arrived and they were ‘W’. I reported it straightaway to the governors. When you look at the results, I said to them, they’re going to be 80% and that’s nothing to do with our teaching... So yeah, I do think of the results straightaway and so do the teachers”.
Additional pressures stemming from Ofsted inspections were also mentioned frequently. The depth of ‘negative’ feeling amongst some members of this group of heads was hard to avoid during the interviews. What is perhaps surprising is the extent to which they nonetheless responded ‘proactively’. This is an issue to which we shall return shortly after considering the responses of the second largest group in Figure 2.3, the heads whom we describe as ‘positive and proactive’. ‘Positive and proactive’ heads This was a much smaller group. Its members were aware of some of the limitations of the testing and assessment reforms but nonetheless saw considerable benefits:
“Yeah, we do a lot of testing but I think that helps us, lets us do a better job for them. We have, as you’ll be aware, various catch-up programmes we’ve put into place”.
“We find testing very useful. It depends on how you look at it, doesn’t it? And whether you can be positive towards it? It’s a tool, another tool to help you. That’s how we look at it”.
Others in this group, which made up 14 per cent of the total group interviewed, offered fuller justifications for their attitudes towards testing:
“... all tests, by their nature, have limitations and, as long as you bear those in mind, you can actually learn a huge

24
amount from them. They don’t restrict us, we’re not narrow, we are genuinely extraordinarily broad and balanced in what we offer and we don’t allow the tests and the test agenda to dictate what we do.”
“Testing, the voluntary and the statutory tests, allow me to see if something here’s not quite right and it allows you to go back and have another look... I’m on the assessment team for the county and I know for a fact that there are lots of people out there who don’t (think testing is worthwhile). So making something statutory doesn’t make it work... I’m positive about most of the initiatives that have come from government over the last few years. I think primary education has improved. I think children get a far better lot and I think parents get a far better lot”.
The differences of perspective between the two groups of heads (the ‘positive and proactives’ and the ‘negative but proactives’) were striking. But how far did these differences affect the ways in which they planned and implemented changes in their schools? In short, what were the consequences for action? Differences in heads’ approaches to ‘intervention’ Table 2.4 compares the extent of ‘interventions’ by the ‘positive and proactive’ heads with the ‘negative but proactive’ group. As a broad generalisation, the former tended to do more than the latter. For example, 86% of the ‘positive and proactives’ indicated that their school was involved in ‘interventions’ between KS1 and KS2 compared with 66% of the ‘negative but proactives’.
Table 2.4: Contrasts in Heads’ Approaches to ‘Intervention’
Nature of ‘Intervention’ Positive/ Proactive Heads (%)
Negative/ Proactive Heads (%)
‘Interventions’ around Key Stage 1 40% 26% ‘Interventions’ between KS1 and KS2 86% 66% ‘Interventions’ confined to Y6 only 14% 29% Use of (some) setting 29% 13% Narrowing of curriculum 43% 66% Regular use of practice tests 100% 86% More experienced teachers in Y6 71% 63% Support staff used to boost KS2 results 86% 60% Changes in ‘pedagogical’ approach 29% 0% Use of ‘booster’ classes 71% 79%
Heads in the ‘positive and proactive’ group were, in addition, more likely to introduce setting, to use practice tests, to locate more experienced teachers in Year 6 and to deploy support staff to boost KS2 results. They were more likely to encourage

25
‘interventions’ around Key Stage 1 and to deny that there had been any narrowing of the curriculum. In a variety of respects, therefore, the two groups differed; however, these were essentially matters of degree. Whatever the differences in attitudes towards testing, in practice, in none of the areas listed in Table 4.4 do they seem to have spilled over into markedly different approaches to intervention. Both groups have been interpreting the options for action, to a greater or lesser extent, in the same ways and by and large have confined their approaches to a fairly narrow menu. Discussion There was a common pattern and a simple logic to schools’ perceptions of what was required to raise their pupils’ performance as they neared the end of their primary schooling. Virtually all stepped up the pressure on pupils the closer they got to the Key Stage 2 assessments. They devoted more time to the assessed subjects, analysed and explained the ‘requirements’ of the assessments in considerable detail, focused increasingly on pupils on the ‘borderlines’ of desired targets (especially Level 4) and ensured that all were familiar with the test situation. Indeed, in a considerable number of schools the broader curriculum was largely suspended in the run-up to the actual assessments, with only the final months of Year 6 being employed to restore some ‘balance’ to the pupils’ overall curricular experiences. Many heads complained that they had ‘no choice’ but to react in these ways. Certainly, the recent provision of extra funding to enable schools to edge closer to their Key Stage 2 targets has probably reinforced any latent tendency there may have been in the system to respond in these ways. There was relatively little innovation outside these areas. Many heads believed they had increased the negative and potentially cumulative effects on pupils’ learning of focused test preparation. It seems unlikely that this is what the policy-makers intended but this is how the majority of heads perceived the options. It was only a confident head that seemed willing to resist the pressures, real or perceived. The evidence from the previous chapter about the stage at which ‘interventions’ might take place is mixed. For reading, it was the pupils who took fairly ‘equal-sized’ steps between Key Stages 1 and 2 who made the most progress. In maths it was those who got off, relatively speaking, to a ‘good start’. In both subjects maintaining progress post-Key Stage 1 would seem to be advantageous but in neither case was the advantage accruing to pupils on these two ‘routes’ especially marked. Whatever the evidence on pupil progress showed, however, only a small minority of schools in the sample had put strategies in place which suggested that they had identified this concern as a priority. In practice, even fewer had overhauled or reconstructed their approaches during Years 3 and 4; most were leaving ‘intervention’ until a good deal later in the Key Stage 2 cycle. Tracking progress between Key Stage 1 and Key Stage 2 This section addresses a number of issues about pupils’ progress between Key Stages 1 and 2. First, it establishes the extent to which pupils take different ‘routes’ between the two national assessment points. Second, it considers whether pupils on some ‘routes’ make more progress than those on others. Third, it establishes the extent to which overall levels progress are associated with the particular primary school attended. And finally, it attempts to assess whether pupils in primary schools associated with particular ‘routes’ make more progress than others.

26
The assessment data for these analyses are drawn from data-sets constructed by the NFER as part of a programme of evaluation commissioned by the QCA into their ‘optional’ tests. These tests were first piloted and introduced in the mid-1990s to enable schools to track the performance of their pupils at the end of Years 3, 4 and 5, using assessment instruments with similar characteristics to those employed in the national testing programmes at Key Stages 1 and 2. The tests are ‘optional’ in two senses: first, there is no formal obligation for schools to take them; and second, the results are entirely confidential to the schools themselves. Since their introduction, however, use has expanded considerably with the result that over 90% of English primary schools have been using them in some way or other. 7 We concentrate, in the analyses that follow, on pupils’ progress in reading and written maths. In both these areas pupils were awarded both age-standardised scores and national curriculum levels and grades (e.g. 2A). Other measures which were also available included writing, spelling and mental maths, but these are not analysed here. Statistics on pupil progress To assess progress over time the national curriculum levels and grades were converted to equivalent ‘point scores’. The approach adopted here has become more common in recent years. The scoring system works on the basis laid out in Table 2.5.
7 As part of its monitoring contract for QCA the NFER has invited random samples of schools to submit results for all their pupils in Years 3, 4 and 5 along with various pieces of background and contextual information about them. The present analysis capitalises on the realisation that the repetition of these surveys over time is capable of producing data-sets which track the progress of individual pupils through the primary years. If a school submitted results for its Year 3 pupils the first year it participated, then Year 4 results for most of these same pupils would become available if the school took part again in the subsequent year. If it took part for a third year, then the bulk of the pupils who had been in Year 3 two years previously would now be in Year 5. Schools were asked at the time they provided Year 3 results to also include information about pupils’ previous performance at Key Stage 1 and to give permission for their results to be matched, on a confidential basis, to Key Stage 2 results available from a national data-base. The data-sets collected by the NFER on behalf of QCA provide several opportunities for tracking pupils’ progress over substantial parts of their careers from Key Stage 1 to Key Stage 2. These data-sets have been numbered successively as Cohorts 1, 2 and 3. At the time when the project commenced, however, only one cohort (number 3) was at the stage where a complete run of performance data (on KS1, Y3, Y4, Y5 and, in due course, KS2) could be anticipated. As previous experience suggested that matching exercises are always more time-consuming than might be supposed, it was decided to concentrate the bulk of our efforts on creating the Cohort 3 sample; this cohort had the potential to provide a fairly complete and, in many respects, unique data-set. This group of pupils were in Year 6 in the Summer of 2001 when they took their KS2 assessments. In the 315 schools in this cohort, 4408 pupils had some data available over all five years. However, when looking at a single outcome (such as reading or written maths), smaller numbers (3055 and 3155 respectively) had complete data available on each outcome for each year.
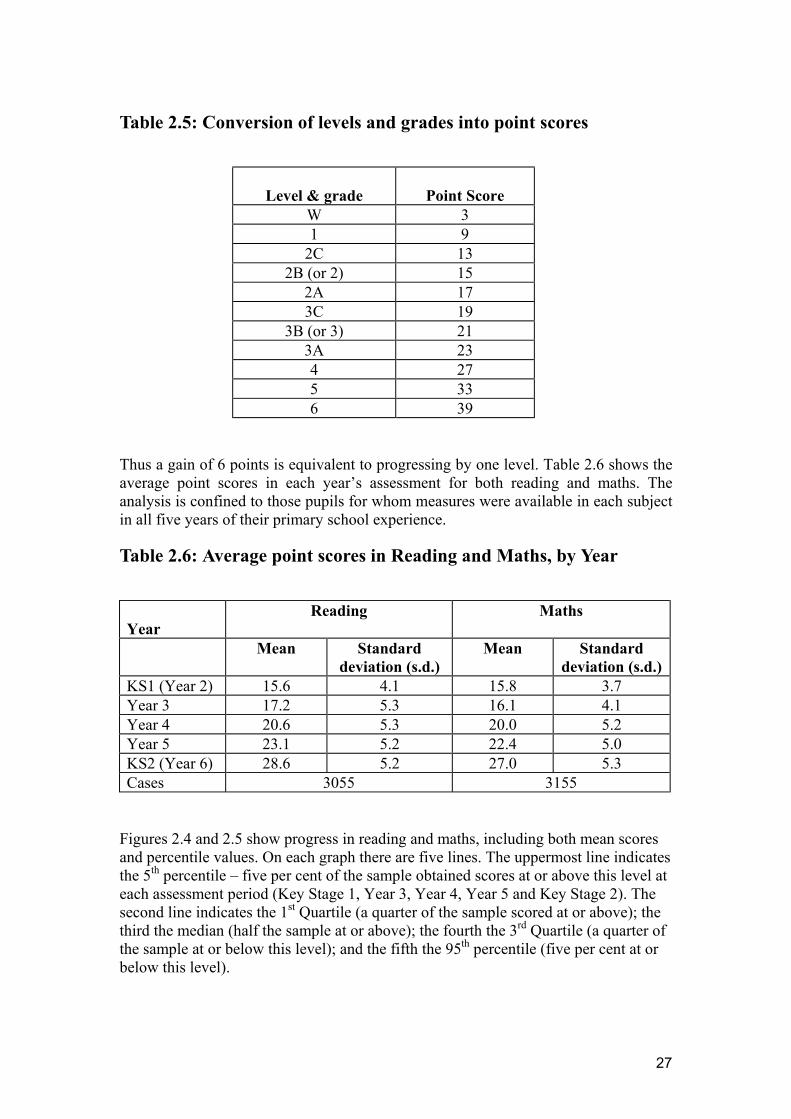
27
Table 2.5: Conversion of levels and grades into point scores
Level & grade
Point Score W 3 1 9
2C 13 2B (or 2) 15
2A 17 3C 19
3B (or 3) 21 3A 23 4 27 5 33 6 39
Thus a gain of 6 points is equivalent to progressing by one level. Table 2.6 shows the average point scores in each year’s assessment for both reading and maths. The analysis is confined to those pupils for whom measures were available in each subject in all five years of their primary school experience.
Table 2.6: Average point scores in Reading and Maths, by Year
Year
Reading Maths
Mean Standard deviation (s.d.)
Mean Standard deviation (s.d.)
KS1 (Year 2) 15.6 4.1 15.8 3.7 Year 3 17.2 5.3 16.1 4.1 Year 4 20.6 5.3 20.0 5.2 Year 5 23.1 5.2 22.4 5.0 KS2 (Year 6) 28.6 5.2 27.0 5.3 Cases 3055 3155
Figures 2.4 and 2.5 show progress in reading and maths, including both mean scores and percentile values. On each graph there are five lines. The uppermost line indicates the 5th percentile – five per cent of the sample obtained scores at or above this level at each assessment period (Key Stage 1, Year 3, Year 4, Year 5 and Key Stage 2). The second line indicates the 1st Quartile (a quarter of the sample scored at or above); the third the median (half the sample at or above); the fourth the 3rd Quartile (a quarter of the sample at or below this level); and the fifth the 95th percentile (five per cent at or below this level).

28
Figure 2.4: Progress in Reading from Key Stage 1 to Key Stage 2
0
5
10
15
20
25
30
35
2 3 4 5 6 Year
Poi
nt s
core
s 5th percentile 1st Quartile Median Mean 3rd Quartile 95th percentile
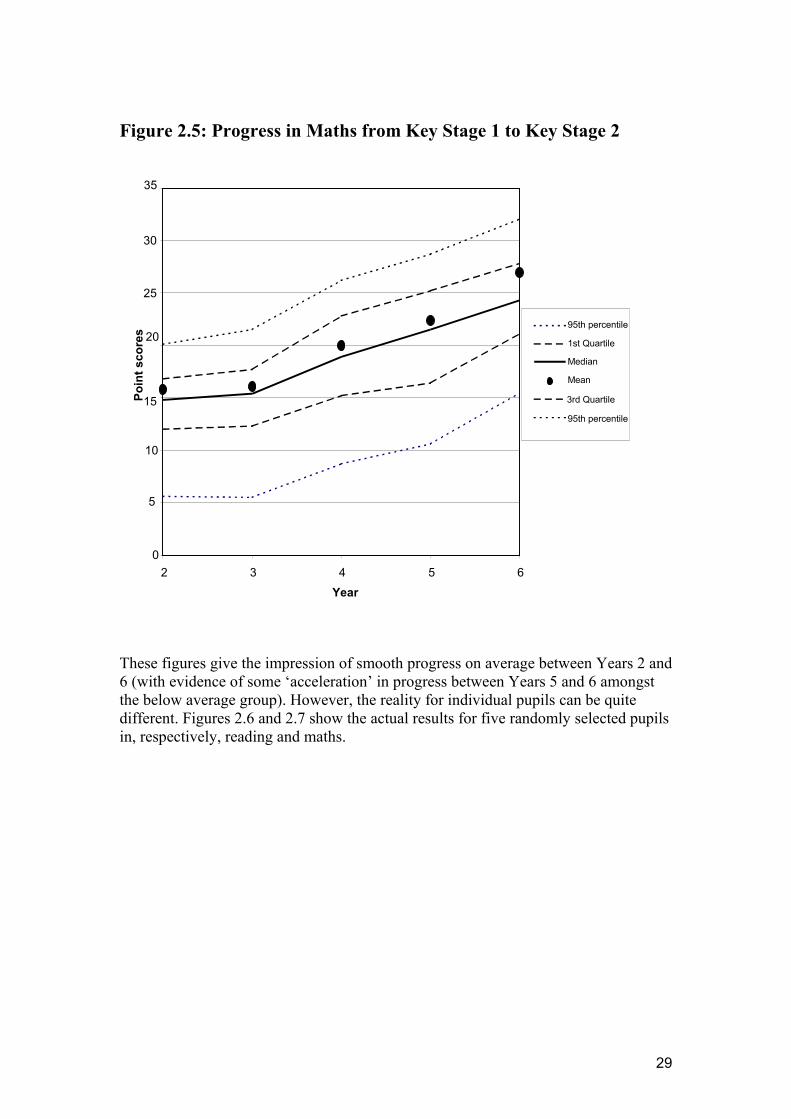
29
Figure 2.5: Progress in Maths from Key Stage 1 to Key Stage 2
0
5
10
15
20
25
30
35
2 3 4 5 6 Year
Poin
t sco
res 95th percentile
1st Quartile
Median
Mean
3rd Quartile
95th percentile
These figures give the impression of smooth progress on average between Years 2 and 6 (with evidence of some ‘acceleration’ in progress between Years 5 and 6 amongst the below average group). However, the reality for individual pupils can be quite different. Figures 2.6 and 2.7 show the actual results for five randomly selected pupils in, respectively, reading and maths.
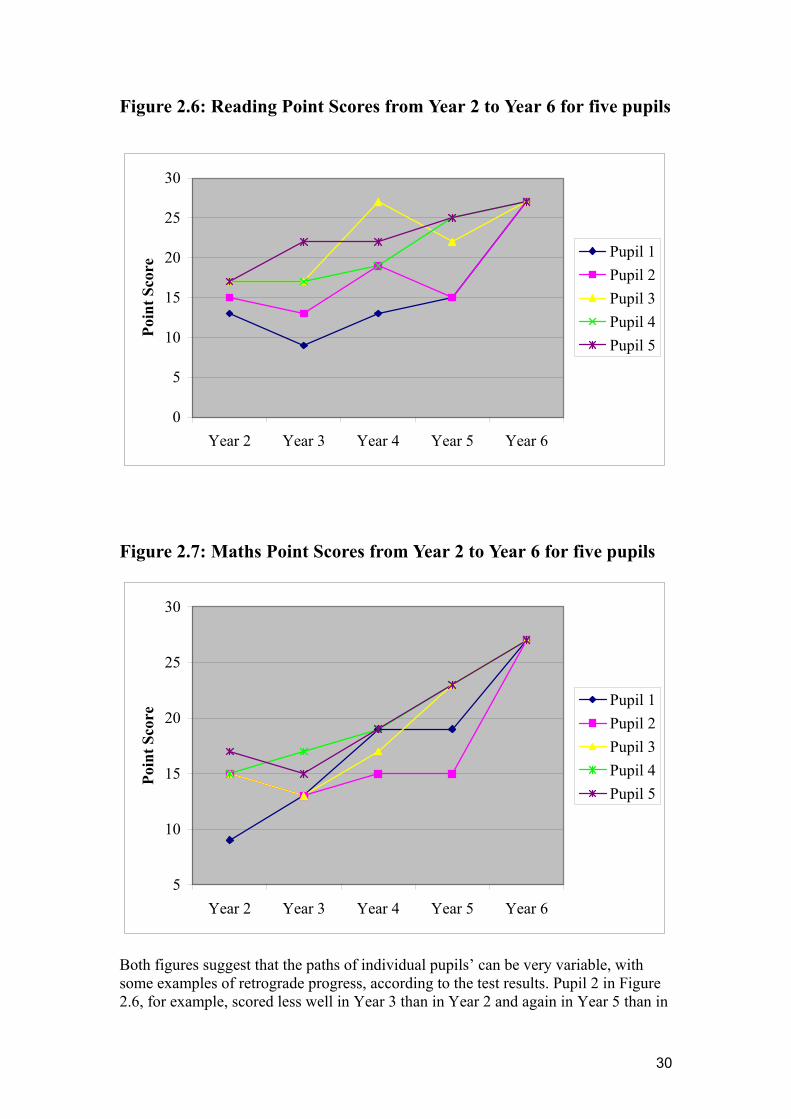
30
Figure 2.6: Reading Point Scores from Year 2 to Year 6 for five pupils
Figure 2.7: Maths Point Scores from Year 2 to Year 6 for five pupils
5
10
15
20
25
30
Year 2 Year 3 Year 4 Year 5 Year 6
Poin
t Sco
re
Pupil 1Pupil 2Pupil 3Pupil 4Pupil 5
Both figures suggest that the paths of individual pupils’ can be very variable, with some examples of retrograde progress, according to the test results. Pupil 2 in Figure 2.6, for example, scored less well in Year 3 than in Year 2 and again in Year 5 than in
0
5
10
15
20
25
30
Year 2 Year 3 Year 4 Year 5 Year 6
Poin
t Sco
re
Pupil 1Pupil 2Pupil 3Pupil 4Pupil 5

31
Year 4. It is interesting, however, that all 10 randomly sampled pupils ended up with roughly the same score even if the ‘routes’ by which they got there differed. The impression of some variability is reinforced by the pattern of correlations in Table 2.7. These show that there were strong correlations between pupils’ results in adjacent years and different subjects; however these are by no means perfect. For example, knowing how well a pupil performed in Year 2 is correlated fairly highly with performance in Year 3 (0.74) but the correlations fall successively with each subsequent year; the correlation between Year 2 performance in reading and Year 6 performance in the same subject was as low as 0.59.
Table 2.7: Correlations between Point Scores each Year in Reading and Maths
Reading
Year 3
Year 4
Year 5
Year 6
Year 2
0.74 0.69 0.66 0.59
Maths
Year 3
Year 4
Year 5
Year 6
Year 2
0.70 0.69 0.67 0.65
There were similar patterns in maths (see Table 2.7). It seems that whilst performance one year gives a pretty good prediction of performance the next year, the longer the time-span the lower the correlation. In short, pupils’ progress across the years seems to combine elements of both stability and change. Categorising individual pupils’ progress paths As the paths taken by individual pupils from Year 2 to Year 6 seem so variable, we need to look at ways of categorising them. One particular approach has been adopted here; others are equally possible. As a first step, pupil progress in terms of differences in point scores between years was computed; means and standard deviations are given in Table 2.8 below for both reading and maths.

32
Table 2.8: Progress Scores from Year to Year in Reading and Maths
Years
Reading Maths
Mean S.d. Mean S.d. Year 2 to Year 3 1.6 3.6 0.3 3.1 Year 3 to Year 4 3.4 3.6 3.9 3.2 Year 4 to Year 5 2.5 3.5 2.4 3.1 Year 5 to Year 6 5.4 4.1 4.5 3.5
The progress made by each pupil between two successive years was then allocated to one of three categories, depending on how far they had progressed. The categorisations were done on the following basis: * ‘Low’ progress (code L) if the pupil’s progress was one standard deviation below
the mean progress made by all pupils between those years, or lower; * ‘High’ progress (code H) if the progress was one standard deviation above the
mean progress between those years, or higher; * ‘Steady’ progress (code S) for making progress within one standard deviation
above or below the mean for all pupils. Using this approach, between 60% and 80% of pupils were awarded code S each year. However, when the codes were combined to give a four-letter code combination for each pupil’s progress between Year 2 and Year 6, there was much more evidence of variation. In practice, in both subjects, only about 30% of pupils had the combination SSSS, showing steady progress across all four years. Clearly there is a wide variety of other possible combinations of the three letter codes aggregated over the four yearly progress opportunities. For example, HHHH would imply consistently higher than average progress, while LLLL would show the exact opposite. Other possible ‘progress paths’ include: * HLHL – ‘oscillating’ progress; * LLHH – late ‘pick-up’ * HHLL – good start and then ‘stalled’ In order to judge what the overall expected progress from any given code combination might be, Table 2.9 shows the mean progress in each subject from year to year, broken down by the progress code.

33
Table 2.9: Annual Expected Progress in Reading and Maths, by Progress Code
Year
Reading Maths
H(igh) L(ow) S(teady) H(igh) L(ow) S(teady) Year 2 to Year 3 6.7 -3.5 1.6 4.9 -4.7 0.3 Year 3 to Year 4 9.3 -3.3 2.9 8.9 -0.6 4.0 Year 4 to Year 5 9.3 -3.1 3.1 6.6 -2.6 1.9 Year 5 to Year 6 11.6 -1.5 5.5 11.6 -1.3 5.2
Thus a path of SSSS would give an expected total progress of 13.1 (1.6 + 2.9 + 3.1 + 5.5) in reading and 11.4 in maths (i.e. around 2 levels). HLHL would give an expected total progress score of 11.2 in reading and 9.6 in maths, and so forth. It will be noted that, in some cells of the table, progress is recorded in minus terms. This indicates that a pupil might have slipped back a bit (for example from a 2A to a 2B or 2C; see Table 2.5 earlier). At this stage it is worth pointing out that there are, in principle, 81 possible ‘progress paths’ based on the above system. For the purposes of this investigation a smaller number of categories were needed. We recognise that categorisations using more options and different allocation decisions would be possible. After some experimentation, and without knowledge of what the consequences would be with respect to total progess, we decided to classify them into the following four groups: 1. Equal-sized steps: In this case, the progress codes are the same for each of the
four years (e.g. LLLL, SSSS, HHHH), or there may be just a single year in the middle for which there is a different code (e.g. SSLS, SHSS, LLSL). Progress is largely consistent over time.
2. Increasing steps: In this case, the codes change from lower progress initially to
higher progress later (e.g. LLSS, LSSH, SSHH). Progress has increased over the course of KS2.
3. Decreasing steps: In this case, the codes change from higher progress initially to
lower progress later (e.g. HHSS, HSSL, SSLL). Progress over the course of KS2 has decreased.
4. Variable steps: Other patterns of progress, not covered above (e.g. LSLH, LHSL,
LHSS, SSLH, SHLS, etc.). Table 2.10 shows the actual distributions of these four progress categories for reading and maths.
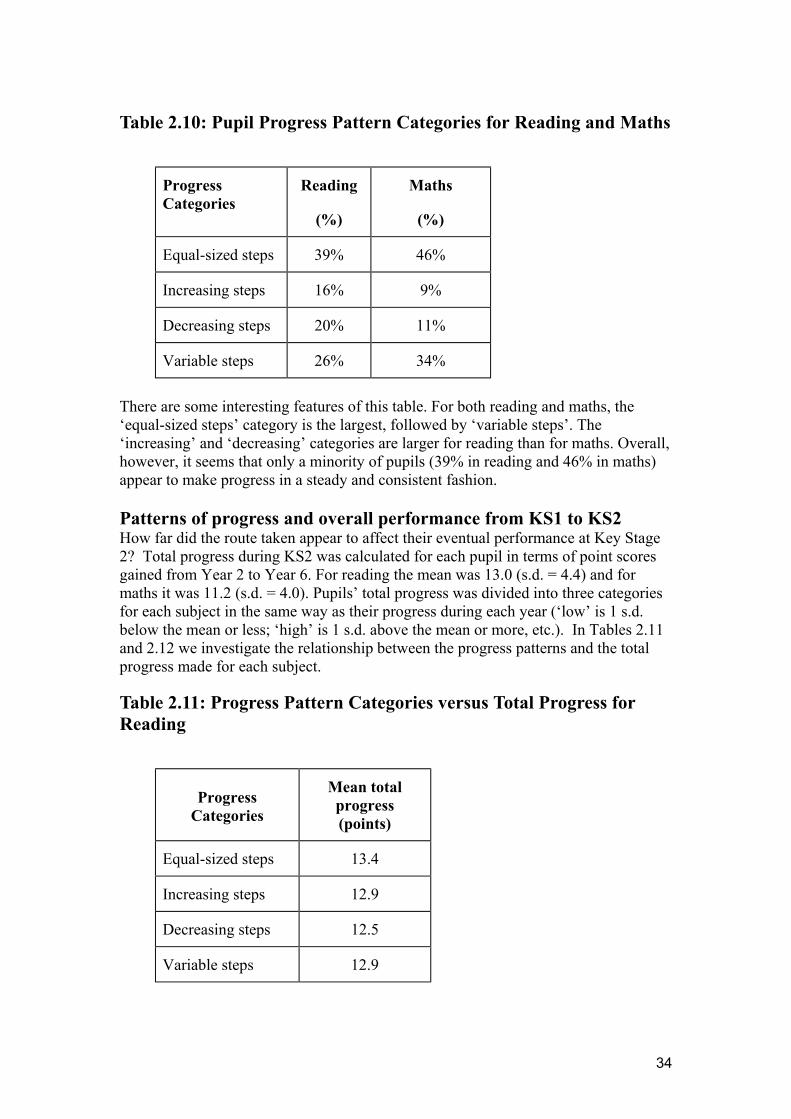
34
Table 2.10: Pupil Progress Pattern Categories for Reading and Maths
Progress Categories
Reading
(%)
Maths
(%)
Equal-sized steps 39% 46%
Increasing steps 16% 9%
Decreasing steps 20% 11%
Variable steps 26% 34%
There are some interesting features of this table. For both reading and maths, the ‘equal-sized steps’ category is the largest, followed by ‘variable steps’. The ‘increasing’ and ‘decreasing’ categories are larger for reading than for maths. Overall, however, it seems that only a minority of pupils (39% in reading and 46% in maths) appear to make progress in a steady and consistent fashion. Patterns of progress and overall performance from KS1 to KS2 How far did the route taken appear to affect their eventual performance at Key Stage 2? Total progress during KS2 was calculated for each pupil in terms of point scores gained from Year 2 to Year 6. For reading the mean was 13.0 (s.d. = 4.4) and for maths it was 11.2 (s.d. = 4.0). Pupils’ total progress was divided into three categories for each subject in the same way as their progress during each year (‘low’ is 1 s.d. below the mean or less; ‘high’ is 1 s.d. above the mean or more, etc.). In Tables 2.11 and 2.12 we investigate the relationship between the progress patterns and the total progress made for each subject.
Table 2.11: Progress Pattern Categories versus Total Progress for Reading
Progress Categories
Mean total progress (points)
Equal-sized steps 13.4
Increasing steps 12.9
Decreasing steps 12.5
Variable steps 12.9
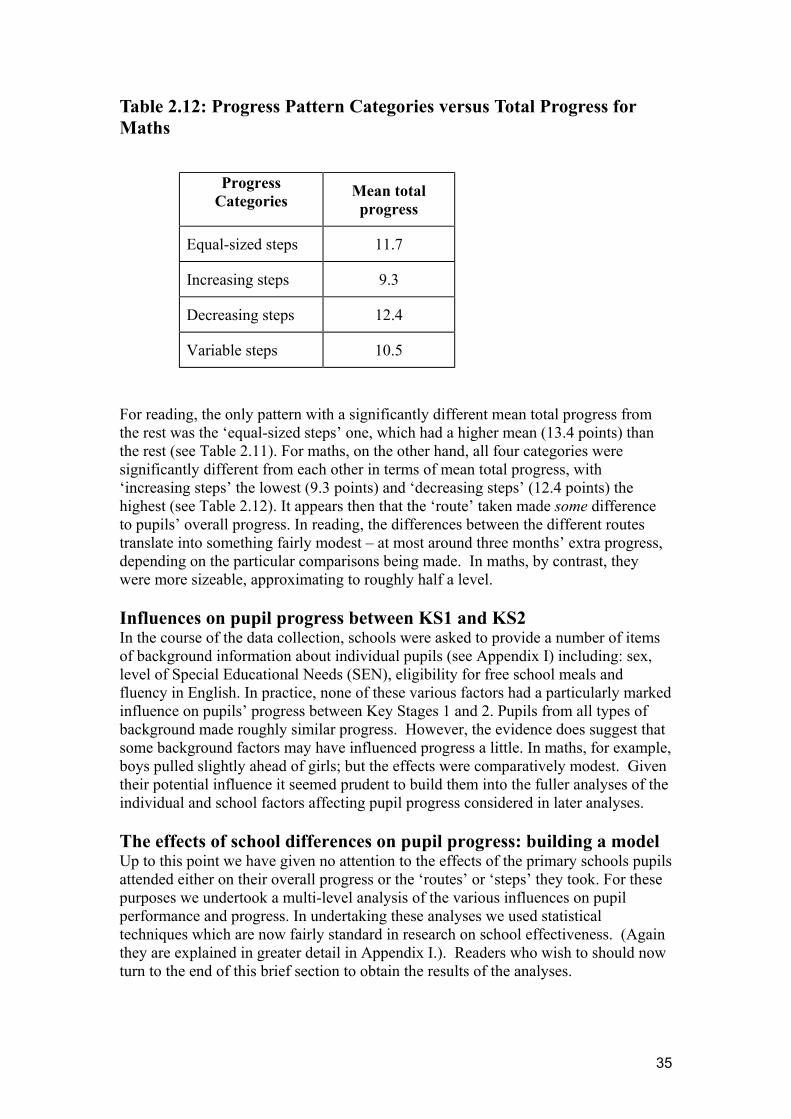
35
Table 2.12: Progress Pattern Categories versus Total Progress for Maths
Progress
Categories Mean total progress
Equal-sized steps 11.7
Increasing steps 9.3
Decreasing steps 12.4
Variable steps 10.5
For reading, the only pattern with a significantly different mean total progress from the rest was the ‘equal-sized steps’ one, which had a higher mean (13.4 points) than the rest (see Table 2.11). For maths, on the other hand, all four categories were significantly different from each other in terms of mean total progress, with ‘increasing steps’ the lowest (9.3 points) and ‘decreasing steps’ (12.4 points) the highest (see Table 2.12). It appears then that the ‘route’ taken made some difference to pupils’ overall progress. In reading, the differences between the different routes translate into something fairly modest – at most around three months’ extra progress, depending on the particular comparisons being made. In maths, by contrast, they were more sizeable, approximating to roughly half a level. Influences on pupil progress between KS1 and KS2 In the course of the data collection, schools were asked to provide a number of items of background information about individual pupils (see Appendix I) including: sex, level of Special Educational Needs (SEN), eligibility for free school meals and fluency in English. In practice, none of these various factors had a particularly marked influence on pupils’ progress between Key Stages 1 and 2. Pupils from all types of background made roughly similar progress. However, the evidence does suggest that some background factors may have influenced progress a little. In maths, for example, boys pulled slightly ahead of girls; but the effects were comparatively modest. Given their potential influence it seemed prudent to build them into the fuller analyses of the individual and school factors affecting pupil progress considered in later analyses. The effects of school differences on pupil progress: building a model Up to this point we have given no attention to the effects of the primary schools pupils attended either on their overall progress or the ‘routes’ or ‘steps’ they took. For these purposes we undertook a multi-level analysis of the various influences on pupil performance and progress. In undertaking these analyses we used statistical techniques which are now fairly standard in research on school effectiveness. (Again they are explained in greater detail in Appendix I.). Readers who wish to should now turn to the end of this brief section to obtain the results of the analyses.

36
The multilevel results are of interest in their own right, but the main focus for this analysis is on the school-level residuals, which indicate how each school’s aggregated progress varies from what might be expected. Figure 2.8 below shows the random variances from the multilevel model at each level, for each outcome (reading and maths). The ‘base case’ for each subject shows the results when no explanatory variables are fitted, the ‘full model’ when all the explanatory variables (such as prior performance, gender and so on) are taken into account. As expected, both school and pupil variances are reduced by fitting explanatory variables, but the bottom level variance, which basically relates to ‘noise’ or measurement uncertainty, seems unaffected. Figure 2.8: Random Variances from Multilevel Models
The variance between schools is about 9% of the total variance in all cases; this can be worked out from Figure 2.8 in rough terms by estimating what percentage of the total column in each case is made up by the bit marked as the ‘school’s contribution’8. An estimate of this order certainly implies that the primary school attended does have an impact on its pupils’ progress overall, once other factors have been taken into account. This finding is also consistent with previous research on this topic (Teddlie et al 2000). We found some schools were doing considerably better than expected; they may have been adding up to 3 points of extra progress, on average, to all their pupils. Three points is equivalent to half a national curriculum level, or about one year of nominal progress. The differences between certain primary schools in their ‘effectiveness’ in boosting pupil progress underlines the point that schools can ‘make a difference’; such differences are not trivial and seem potentially important.
8 For example, the total percentage in the first column is about 28.5. The proportion attributable to the school is about 2.6. 2.6 as a percentage of 28.5 is 9%.
������������������������������������������������������������������������������������������������������������
������������������������������������������������������������������������������������������������������������������
������������������������������������������������������������������������������������������
������������������������������������������������������������������������
������������������������������������������������������������������������������������������������������������������������������������������������������������������������������������������������������
�������������������������������������������������������������������������������������������������������������������������������������
������������������������������������������������������������������������������������������������������������������������������������������������������������������������������������
������������������������������������������������������������������������������������������������������������������������������������������������
������������������������������������������������������
��������������������������������������
������������������������������������
������������������������������������
0
5
10
15
20
25
30
Reading base case Reading full model Maths base case Maths full model
Var
ianc
e in
out
com
e sc
ore
���School���Pupil
������ Time

37
Do different schools have different progress paths? In an earlier section we established that the ‘routes’ or ‘steps’ pupils took between Key Stage 1 and Key Stage 2 made some difference (albeit a very modest one) to their overall progress. We now consider whether schools can be differentiated in the same way and then go on to explore whether such differences might be associated with differences in pupils’ overall progress across the primary years. For the purposes of this analysis school-level ‘routes’ or ‘steps’ were defined in a similar way to those for pupils. Three categories (‘Low’, ‘Steady’ and ‘High’) for progress from one year to the next were established; these were based on the school-level progress residuals and their standard errors, in the following way:
* A school was allocated to a ‘Low’ progress category (code L) if the school
progress residual was one standard error below zero between two years, or lower; * High’ progress (code H) if the school progress residual was one standard error
above zero between two years, or higher; or * ‘Steady’ progress (code S) if it fell in between. The year-on-year progress categories were then combined into 4-letter combinations describing the exact path and then into the four broad categories outlined below using the same basic procedures as were used for pupils. The results are shown in Table 2.13. Table 2.13: School Progress Pattern Categories for Reading and Maths
Reading (%)
Maths (%)
Equal-sized steps 29% 30%
Increasing steps 22% 16%
Decreasing steps 20% 22%
Variable steps 29% 32%
Totals 100% 100%
Just under a third of the primary schools in the sample could be characterised as ones where the pupils took ‘equal-sized’ steps (29% for reading and 30% for maths). In similar proportions of schools, however, pupil progress could be characterised as ‘variable’ (29% and 32% respectively). To what extent are overall progress and the ‘route’ taken linked? There were sufficient differences between the ‘routes’ taken by pupils in the different schools to raise the question whether overall progress was linked to the ‘routes’ describing the schools. To pursue this issue total progress from Year 2 to Year 6 was

38
divided into three categories as before, using the total progress residuals and their standard errors to define the categories. In Tables 2.14 and 2.15 we investigate the relationship between the progress patterns and the total progress made by pupils in each school for each subject. Table 2.14: School Progress Pattern Categories versus Total Progress for Reading
Progress Categories
Mean total progress
Equal-sized steps 0.04
Increasing steps 0.20
Decreasing steps 0.04
Variable steps -0.21
The second column of Table 2.14 summarises the mean ‘total progress’ for pupils in the relevant category of progress path. These are based on the residuals and represent the average progress above or below the expected total amount from Year 2 to Year 6. Despite the differences noted above, none of the progress pattern categories in the table were significantly different (in statistical terms) from each other in terms of mean total progress. Substantively they were also very small, representing very small proportions of a single level. Table 2.15: School Progress Pattern Categories versus Total Progress for Maths
Progress Categories
Mean total progress
Equal-sized steps -0.01
Increasing steps -0.24
Decreasing steps 0.35
Variable steps -0.12
In relation to maths the biggest differences appeared to be between those taking the ‘decreasing steps’ route by contrast with the ‘increasing steps’ one (see Table 2.15). Unfortunately (and somewhat frustratingly), the differences in the table turned out not to be significantly different from each other in statistical terms. It seems that pupils in all ‘types’ of school made broadly similar progress.
39
The stability of school progress paths from year to year The analysis in previous sections established that schools differed in terms of their progress paths. But did schools which fell into one category of the typology in one year reappear in the same category the next? If they did, this would reinforce the view that such differences as have been noted between the effects of the different ‘routes’ merited further investigation. To what extent, in other words, were schools’ effects stable from one cohort to the next? (Readers who wish may prefer to skip to the last paragraph of this section). In 143 schools we had data on two cohorts of pupils from Key Stage 1 to Key Stage 2. Consequently they could be compared in terms of their progress ‘routes’ and total progress categories. In reading, 39 schools (27%) had the same progress route category across both cohorts and 43 (30%) had the same total progress categories. However, just 10 schools (7% of the total) stayed in the same progress route category and, at the same time, in the same total progress category. There were similar results in maths. 51 schools (36%) had the same progress route category across both cohorts and 49 (34%) had the same total progress categories. Again, however, just 16 schools (11% of the total) stayed in the same category in terms of both. Part of the reason for this relative lack of stability may stem from the discovery that the correlations between total progress for the two cohorts were not significantly related for either reading or maths. In brief, the primary schools where one cohort of pupils made considerable progress between Key Stage 1 and Key Stage 2 were not the same primary schools as those where the subsequent cohort made considerable progress between the same two time-points. Relatively little is known about how stable primary schools’ contributions to pupil progress across numbers of cohorts actually are but these results certainly seem to indicate that the stability of that contribution varies quite considerably from one cohort to the next9. Discussion This chapter began with a discussion of the extent to which there were observable ‘dips’ in pupil performance between Key Stage 1 and Key Stage 2 and especially in Year 3. The evidence provided by Ofsted pointed in this direction but was basically indirect, being based upon lesson observations rather than measured pupil performance. Our data certainly support the view that some pupils failed to make ‘expected’ levels of progress in reading and maths during Year 3. In reading, for example, the average progress made by all pupils was less than two points (equivalent to moving from a level 2B to a level 2A) and in maths it was much smaller than this at just 0.3 points, but with considerable variations between pupils (see Table 2.8). By contrast, in later years pupils were much more likely to make the ‘expected’ half a level during the course of the year. Some pupils (roughly one-in-seven) may even have fallen back. It needs to be noted, however, that this observation was also true for groups of pupils negotiating Year 3 to the end of Year 4 and Year 4 to the end of Year 5. Conversely, every year there was a group of pupils who made at least a level’s progress during the course of the year. Only when we come to the ‘push’ from Year 5 to the end of Year 6 (the Key Stage 2 assessments) do we find that almost all pupils moved up the Point
9 See Teddlie et al (2000) for a fuller discussion.

40
Scores ladder. In a minority of cases (again roughly one-in-seven) ‘progress’ at this point was quite spectacular with pupils apparently moving up the equivalent of two levels in a year. It is the ‘slow’ start which has tended to attract attention but the ‘fast’ finish is potentially of equal interest. Both run counter to the view that, ideally, progress is steady and even. Previous research in this area has looked at pupils’ performance over the period from Key Stage 1 to Key Stage 2 as a series of unconnected snapshots10. A particular strength of this study is the way in which it has been possible to link the records of individual pupils to create a profile of their emerging performance over time. These analyses suggest four common ‘routes’ or ‘steps with respect to pupil progress. The largest of these groupings was pupils who made roughly ‘equal-sized’ steps from year to year. Around four-out-of-ten pupils progressed in this manner in reading and a slightly higher proportion in maths (see Table 2.10). The next most common grouping, however, had no clearly identifiable trajectory; around a quarter of the pupils in reading and a third in maths made ‘variable’ progress. Whilst it was true that some pupils in both reading and maths got off to a ‘slow’ start and then accelerated (the category described as ‘increasing’ steps in Table 2.10) in both cases this was the most infrequent ‘route’ (taken by 16% and 9% of pupils respectively). These proportions seem too low to talk of so-called ‘dips’ being the most noteworthy characteristic of pupils’ performance between Key Stages 1 and 2. Some pupils ‘dipped’ every year of the study, not just in Year 3. A crucial question, of course, is whether the ‘route’ or ‘steps’ taken between Key Stages 1 and 2 matters in terms of Key Stage 2 performance. The answers here seem to differ according to the subject. In reading the ‘route’ which recorded the greatest progress was the one associated with ‘equal-sized’ steps (see Table 2.11). Pupils following this ‘route’ made just over two levels’ progress between the two Key Stages but then pupils following the ‘least successful’ ‘route’ (‘decreasing steps’ – fast start followed by smaller steps in subsequent years) performed just about the same in terms of progress made. The difference between them was at most a matter of three months’ progress. In maths, by contrast, the differences were more substantial. Here it was the pupils associated with the ‘decreasing steps’ route who made the expected two levels of progress whilst those on the ‘increasing steps’ route increasingly lagged behind, eventually by around half a level (see Table 2.12). Looking across the two subjects and combining the evidence, there seems to be some support for the desirability of pupils following an ‘equal-sized’ steps approach which neither compensates for a ‘slow’ start nor a ‘spurt’ in the finishing straight. For whatever reasons this was, in both subjects, the experience of well under half the pupils in the cohort. Previous research has suggested that pupil progress can vary according to the level of ‘effectiveness’ of the primary school attended. This conclusion is supported by the current research. Pupils attending ‘more effective’ primary schools throughout Key Stage 2 seem to have had their progress boosted as much as half a level (roughly a year of nominal progress) when compared with their counterparts at ‘less effective’ ones. Unfortunately, it was not part of the remit of this research to explore the reasons for such differences which have been variously attributed to such factors as leadership
10 See, for example, Charles, M et al (2000) Data Collection Years 3,4 and 5: Optional Tests 2000, Slough: NFER.
41
and management, teacher quality and effectiveness, curriculum planning and focus, teaching styles and pupil mix. Of particular interest was the question of whether schools (like pupils) could be characterised as supporting different ‘routes’ or patterns of ‘steps’ in relation to pupil progress. When we constructed school categories two dominated the typology. In both reading and maths around 30% of the schools fell in the ‘equal-sized’ steps category whilst in similar proportions of schools pupil progress seemed to be ‘variable’ (see Table 2.13). However, when we explored the extent to which these various categories of school ‘routes’ were related to overall pupil progress between Key Stages 1 and 2 we found little evidence of differences (see Tables 2.14 and 2.15). Those differences we did note were neither substantively nor statistically significant. Schools where the pupils tended to make ‘even-sized’ steps over the four years between Key Stages 1 and 2 made no greater progress, on average, than those which engaged in a late ‘push’. The figures suggested a small disadvantage to pupils in schools where progress seemed to come in ‘variable’ spurts but the substantive differences were very small – at the most a few weeks’ progress spread over the four years. Such differences are probably too small to serve as a basis for intervention. Furthermore, in an additional and unexpected twist, schools’ contributions to pupils’ overall progress and to the ways in which they got there seemed to vary from one cohort to the next. First, less than a third of schools were in the same total progress categories with respect to reading for both the two cohorts of pupils studied; in other words, if a school did well in boosting progress with one cohort of pupils, it was unlikely to do equally well with a subsequent cohort. Second, less than a third of the schools were in the same progress ‘route’ category across the two years; the majority changed categories from one cohort to the next. The net effect of these two findings was that well under one-in-ten schools stayed in the same overall progress category and, at the same time, in the same ‘route’ category across the two consecutive cohorts. The vast majority, in other words, varied in the contribution they made to pupils’ progress and the ways in which they got there11. Generally, however, they confirm the cautious assessment offered previously with respect to the effects of ‘routes’ taken on overall progress. Implications for policy What are the implications of these findings for policy? Taking the interview and progress data together, three strategies suggest themselves. 1. Targets which reward all levels of progress. It would be helpful to introduce
and place greater emphasis on targets which rewarded schools for all levels of pupil progress (and not just in relation to the Level 4 hurdle). Something like this has already happened at GCSE where an overall Points Score has been developed alongside the 5A*-C grade pass measure. Such measures, in combination with the wider use of so-called value-added approaches to judging performance, send out the message that all levels of pupil progress matter, not just the higher ones. Such changes are in the process of being introduced into primary schools.
11 Some limitations to the data mean that these particular conclusions are less firmly-based than those based on a single cohort.
42
2. Redistribution of effort (and any marginal resources) towards Years 3 and 4. Schools should be encouraged to understand more about the various patterns of progress their pupils experience and to match their ‘interventions’ accordingly. In reality, hardly any of the schools had the kind of purchase on pupils’ progress afforded by the analyses presented in this chapter. Most heads appeared to assume, in the absence of evidence to the contrary, that most of their pupils took roughly ‘equal-sized’ steps across the years. The proportions of pupils for whom this is a valid assumption are considerably smaller than they commonly supposed. Only a small minority of heads were able to piece together insights into their pupils’ performance which pointed (albeit in a rather rough and ready way) to the existence of a variety of ‘routes’. Such schools were trying to develop approaches which were simultaneously more sustained and more flexible – they tracked pupils as they moved up the school, for example, or redeployed some of their additional funding to create greater continuity for their pupils long before they encountered the demands of the Key Stage 2 assessments. Encouraging schools to analyse how they distribute their efforts across the years and to find ways of being less reliant on Year 6 ‘pushes’ strategies could benefit both pupils and teachers. They might also help to reduce the widespread scepticism we encountered amongst secondary schools about the levels reached by their newly-arrived charges.
3. Development of a larger (but still restricted) menu of evaluated
‘interventions’. Schools should be encouraged to expand the repertoire of ‘interventions’ they employ in pursuit of their teaching and learning objectives. A common response amongst our sample, when encountering evidence of ‘under-performance’ in one or other area of the curriculum, was initially to extend the amounts of time given to the topic and then to undertake a more concise analysis of what was required in terms of the assessment criteria. Both strategies have their place, of course, but any pre-existing orientations to respond in this way have probably been strengthened by the resources and advice proffered by policy-makers. Not surprisingly, heads who confined their efforts to these sorts of activities reported that they were becoming increasingly frustrated – they felt, rightly or wrongly, that they had reached the limits of what could ‘reasonably be expected’. What many lacked was access to a ‘menu’ of half-a dozen or so approaches which they could call upon flexibly to match the emerging needs of different groups of pupils. These might be deployed in some years, but not others, and possibly with some groups of pupils, but not others. As we shall show in Chapter 4, a number of secondary schools have successfully developed such approaches. Some of these, necessarily modified to take account of the rather different circumstances facing primary schools, might be considered.
43
Chapter 3: Continuities and Discontinuities at Transfer
Maurice Galton, Janet Edwards, Linda Hargreaves and Tony Pell12
Nine LEAs agreed to participate in the main transfer strand. They were chosen because they had already taken steps to identify problems associated with transfer and in some cases had instituted action designed to overcome perceived weaknesses. The contributions of these LEAs and their schools to the concerns of the research project are summarised below: * Two LEAs (Authorities L and B) offered their schools a complete set of ‘Bridging
Units’13 in the three core subjects. These units were designed to improve curriculum continuity by having Y6 pupils begin work in English, mathematics or science towards the end of the summer term. Pupils then took this work with them when they moved to their transfer school and completed the various units under the supervision of their new teachers. In the case of one LEA the units were developed within the authority while in the other modified versions of the QCA’s materials were used. In both these authorities, therefore the LEA advisers were chiefly responsible, in consultation with selected teachers, for the construction and management of the programme.
* Two other LEAs (Authorities W and D) also instituted ‘Building Bridges’
programmes but the choice of topic and the production of materials were left to individual pyramids. Some schools chose to use existing material such as Cheshire LEA’s ‘Bubbles’ science unit while others focused on a range of locally-produced cross curriculum topics including the development of thinking skills.
* Two other LEAs (Authorities E and F) had recently conducted surveys of secondary
headteachers and heads of science departments, respectively, and on the basis of these reports invited individual secondary schools to produce a programme of action for which funding was provided.
* Another LEA (Authority G), prior to the introduction of the Literacy Hour and daily
mathematics lesson, had instituted a major programme of reform at primary level designed to raise standards of literacy and numeracy by improving the quality of teaching. This was supported with extensive after school tuition and by ‘catch up’ summer schools for Y6 pupils. The next stage of this programme, which coincided
12 Janet Edwards was responsible for collecting and editing schools’ responses for our web site, Tony Pell carried out the statistical analysis and Maurice Galton and Linda Hargreaves carried out the various case studies. 13 Throughout the text we have used ‘Bridging Unit’ as a general term to cover a range of curriculum materials designed to provide continuity between work during the final weeks in the primary school and work at the beginning of secondary school. The ‘transition units’ in the Key Stage 3 strategy were developed later and therefore were unlikely to be identified within the schools and LEAs reported on here.

44
with the start of Phase II of our project, was to develop strategies for improving continuity between Years 6 and 7 that took account of these improvements in the primary school.
* A further LEA (Authority H), with a long-standing interest in the issues of transfer,
invited a number of pyramids to build on existing initiatives in English and mathematics. A series of workshops were arranged in which the teachers responsible for liaison with the feeder schools were trained in the use of observation and other evaluation techniques in order to identify any weaknesses in current transfer procedures with a view to taking further remedial action in the following year. Uniquely among the participating LEAs, a considerable amount of time was provided for advisers to support this action research by acting as external observers, conducting pupil interviews and piloting various evaluation instruments.
* One further LEA (Authority J) was included at a later stage because of interest in
extending the use of the evaluation instruments to cover Key Stage 1 as well as Key Stages 2 and 3. This Authority has a high proportion of separate Infant and Junior schools which allowed comparison of the effects of transfer as opposed to transition between Key Stage 1 and 2.
Other schools and LEAs that had expressed an interest in participating in the project were invited to maintain links through a specially constructed web site (http://creict.homerton.cam.ac.uk/transfer) where the latest research and the various evaluation materials were made available. Schools were also able to enter information directly concerning their own recent transfer initiatives so that these could be shared with others. To date some 90 entries have been posted. Levels of initiative Taverner et al (2001) have identified three levels of LEA participation in various transfer initiatives. Level 1, the highest level of support, was where the LEA took on an ‘Initiate and Facilitate’ role. Schools were provided with both national and local documentary evidence about various aspects of transfer in need of further development. Funding was available for school based initiatives, various forms of INSET provided and documents produced to help schools address key areas of concern. In our study Authorities L, B and G appeared to meet most of these criteria. Local Authority H went further and became active partners in the evaluation process. For example advisers in both Authorities L and H were trained in the use of systematic observation by the Cambridge team. Whereas the advisers in Authority L employed the technique to monitor classroom practice and feed back this information to participating schools, in Authority H advisers trained teachers to carry out their own observation and helped in the subsequent analysis. In the latter case, therefore, the participation was not so much facilitation but active collaboration suggesting that a further higher level might be added to Taverner et al’s classification. The second level involved an ‘Identify and Disseminate’ role where LEAs attempted, as a result of visits or surveys, to identify best practice which was then collated and shared with other schools. LEAs W, D and to a certain extent, E and F appeared to fulfil these
45
roles to a greater or lesser degree. Here the crucial factor appeared to be the commitment and availability of the advisor/advisory teacher with responsibility for coordinating transfer initiatives. In two cases (D and F) the retirement or promotion of the adviser concerned meant that their duties were reallocated to others in their department. In the third case, (Authority W) the adjustments were at a higher administrative level within the LEA and the line management of the advisory teacher responsible for coordinating the transfer programme became less clearly defined with a consequent decline in the priority given to transfer issues. In all four instances the degree of collaboration between the LEA and the project team declined over the lifetime of the study although we continued to sustain relationships with individual schools. The least intensive role involved the LEA in a ‘Collate and Combine’ role. Here individual school documents were collected, organised and then re-distributed to schools in the form of guidelines. Authority J was perhaps at this stage with respect to KS1/KS2 transition. The evaluation data collected were therefore mainly used to help the LEA decide on an appropriate course of action rather than to inform schools about current practices Looking back over the course of Phase II of this present project there would appear to be a link between the levels of LEA participation, as defined by Taverner et al (2001) and the quality and effectiveness of the various transfer initiatives established by schools. Among Level 1 LEAs schools were generally quicker to respond to requests for help and appeared more concerned and interested in transfer issues. Furthermore, all but two of the ten schools, which were selected for detailed case study, on account of significant above average scores on the various evaluation measures came from Level 1 LEAs. Beyond the initiatives taking place in the 9 LEAs there is clear evidence that, across the country as a whole, there has been a shift in emphasis with regard to the concerns that schools are seeking to address at transfer. Through links by newsletter with the LEAs who initially expressed interest in the Transfer strand, through other contacts made in the course of giving presentations to teacher conferences, and as a result of a further request for information published in the Centre for Study of Comprehensive Schools’ (CSCS) journal, All in Success, we have collected details of current transfer activities using a specially prepared template. This information has been edited and placed on our web site where we have classified some 90 entries under the 5 headings constructed for the Phase I review. Although it was not always possible to classify each entry unambiguously (since, for example, many curriculum initiatives also have a pedagogic component) the last four years has seen schools devote less attention to the administrative and social aspects of transfer as Table 3.1 demonstrates. Now, nearly half (46%) of recent initiatives focus on curriculum continuity and progression. Over three-quarters of these curriculum initiatives involved some form of Bridging Unit. This represents a shift since the 1999 survey when almost all (90%) of transfer initiatives reported were concerned either with administrative matters or easing the passage of pupils from primary to secondary school. New initiatives here (6% administrative and 32% social) mainly concerned ways of speeding up data transfer between the primary and transfer schools and in more direct interventions for pupils deemed to be at risk during the immediate transfer period. In the latter case buddying schemes, where the present Y7 pupils linked up with selected pupils in Y6, or

46
the support of adult, non-teaching staff mentors for children already showing signs of disengagement in primary school appeared to be a developing trend. These learning mentors then worked with the same pupils following transfer to secondary school. In the 1999 survey there were no cases that attempted to improve pedagogy or to help pupils manage the learning more effectively after transfer. Now some 16% of recorded initiatives cover these areas. Whereas in the past it was customary for secondary teachers from the transfer school to visit primary feeders it was rare to find Y6 teachers returning these visits. Now there is increasing evidence that mutual exchanges between Y6 and Y7 teachers are taking place with the cost of cover for primary colleagues supplied, in some cases, by the transfer school. Moreover, rather than consisting of informal visits to each other’s classrooms, these exchanges now tend to consist of highly focussed observations of some aspect of classroom practice. Secondary schools are also devoting more attention to aspects of pupils’ learning involving the use of study skills, the development of cognitive strategies for problem solving and the identification of personal, preferred learning styles. In most cases these activities are integrated within on-going PSHE programmes, but in a few cases schools are concentrating these activities within dedicated post-transfer induction schemes at the start of the autumn term. This shift in transfer activity, illustrated in Table 3.1, is supported by recent reviews by Arnold (2002) and Suffolk LEA (2002) and contrasts with the rather pessimistic verdict of OFSTED (2002b). If it were to be replicated in other studies and on considerably larger and more strictly representative samples it would signify an important change. Furthermore, in seeking to shift the focus of transfer more towards curriculum and pedagogy, English schools would appear to be in advance of their counterparts in other countries, including the USA (Anderson et al 2000). Few of these more recent initiatives highlighted in Table 3.1 have been formally evaluated, however, and as our own case studies suggest, there may well be a gap between the declared aims and objectives of these school-based transfer projects and actual practice.

47
Table 3.1 Classification of Initiatives on Transfer since Phase I Type of initiative Percentage
of Initiatives Examples
Administrative (designed to smooth transfer process)
6
Meetings between senior staff, Heads of Year, subject coordinators, SENCOs etc., Electronic data transfer, Target setting, communication with parents
Social (aimed at reducing pupils’ anxieties about the move to the new school)
32
Induction day, Open evenings, Use of secondary school facilities by Y6 pupils (ICT, drama, sports). Increased support for pupils ‘at risk’, Buddy/mentoring schemes, Joint celebration events, Extended pre-transfer induction activity
Curriculum (maintaining continuity and progression)
46
Informal observations by secondary staff in feeder schools, Joint training days. Foundation programme taught by single teacher in Y7 Bridging Units, Summer schools for gifted and low achievers
Pedagogic (helping Y7 teachers to build on effective primary practice)
9
Y6 and Y7 teacher exchanges, Shared (focussed) observation in both year 6 & 7 classes, Use of Advanced Skills Teachers, booklets on good practice, Citizenship, thinking skills and cognitive acceleration teaching programmes, joint marking exercises
Management of Learning (helping Y7 students in learning to learn)
7
Extended post-transfer induction programmes mainly in PSHE & Humanities including acquisition of study skills, thinking strategies etc. Identifying preferred learning styles. Improving motivation, of disaffected learners, peer tutoring.
The percentages were based on responses from 88 schools. Initiatives that were rare at the time of the Phase I review in 1999 have been highlighted in bold. The changing contexts of Transfer In the first chapter we referred to the squeeze on the primary curriculum, particularly in Y6. Evidence for this squeeze can be found in the interview responses of the headteachers reported in Chapter 2. This imbalance in the KS2 curriculum as currently practised (in contrast to the written schemes of work) has implications for the ways in which both primary and secondary teachers’ respond to the shift in emphasis at transfer towards academic rather than social concerns. At the commencement of Phase 2 of this study, for example, we began to notice an increasingly negative tone in the responses of some primary teachers to recently introduced initiatives such as the QCA Bridging Units in mathematics. Year 6 teachers expressed a lack of enthusiasm to the extent that some refused to mark the exercise books which accompanied the pupils to their new secondary
48
school. The pupils of these teachers also told us that they “didn’t want to do more primary work when they moved on up to secondary school.” A nation-wide survey of 250 primary teachers offers further evidence which helps to explain these attitudes (Galton & MacBeath 2002). Year 6 teachers reported that the introduction of the Literacy Hour and daily mathematics lesson, while generally welcomed had nevertheless resulted in less time being given to other subjects. Typically, the time devoted to science had been reduced from 3 to 2 hours per week since a similar survey was undertaken in the late nineteen nineties (Galton & Fogelman 1998). Art was allocated a nominal 50 minutes weekly while music received around half an hour. Time for activities such as drama, food technology and for pursuing individual pupils’ interests and ideas was said to be minimal. Furthermore, as the responses of headteachers in Chapter 2 testify, the pressures resulting from attempts to raise pupils’ scores on the Statutory National Tests, thereby improving the school’s position in the league tables, have, in some cases, resulted in further reductions in the allocated time given to arts and design subjects. Supporting evidence can be again be found in Galton and MacBeath’s (2002) survey, where teachers stated that pupils who were borderline Level 3/4 could miss out on art and music in the run up to the tests in order to attend additional booster classes in one or other of the core subjects. Consequently, for many teachers, the summer period after the Statutory Tests is now used mainly to compensate for the earlier restricted curriculum diet and this accounted, in part, for the lack of enthusiasm for the Bridging Units in mathematics. The effect of teaching for the test also appears to have constrained the extent to which the teaching approaches that are employed within the core curriculum areas are sufficiently challenging and stimulating (Hardman et al 2001; English et al 2002; Hargreaves and Galton 2002). Despite the recent push for greater use of whole class interactive teaching certain patterns of classroom interaction appear to be remarkably similar across the upper primary and lower secondary school and indeed are very similar to the figures from earlier research undertaken in the late nineteen seventies (Galton et al 1980). Direct teaching still dominates with instruction delivered at a relatively fast pace in order to facilitate maximum curriculum coverage. Ofsted (2002a) have recently presented their findings from case studies of successful primary schools where pupils were receiving a broad, balanced and stimulating curriculum. However, schools in the study shared certain characteristics that perhaps made them atypical. The head teachers were all very experienced and were able to recruit high quality staff (support staff as well as teachers). These head teachers had the confidence to implement national reforms flexibly and within their own time-lines and were concerned to take the leading role in implementing curriculum change, rather than delegating responsibility to subject coordinators. Many of the primary head teachers that we have interviewed during the present and the recent Galton and MacBeath (2002) study did not share the above advantages. Most reported that they felt under enormous pressure from Ofsted and from the need to raise
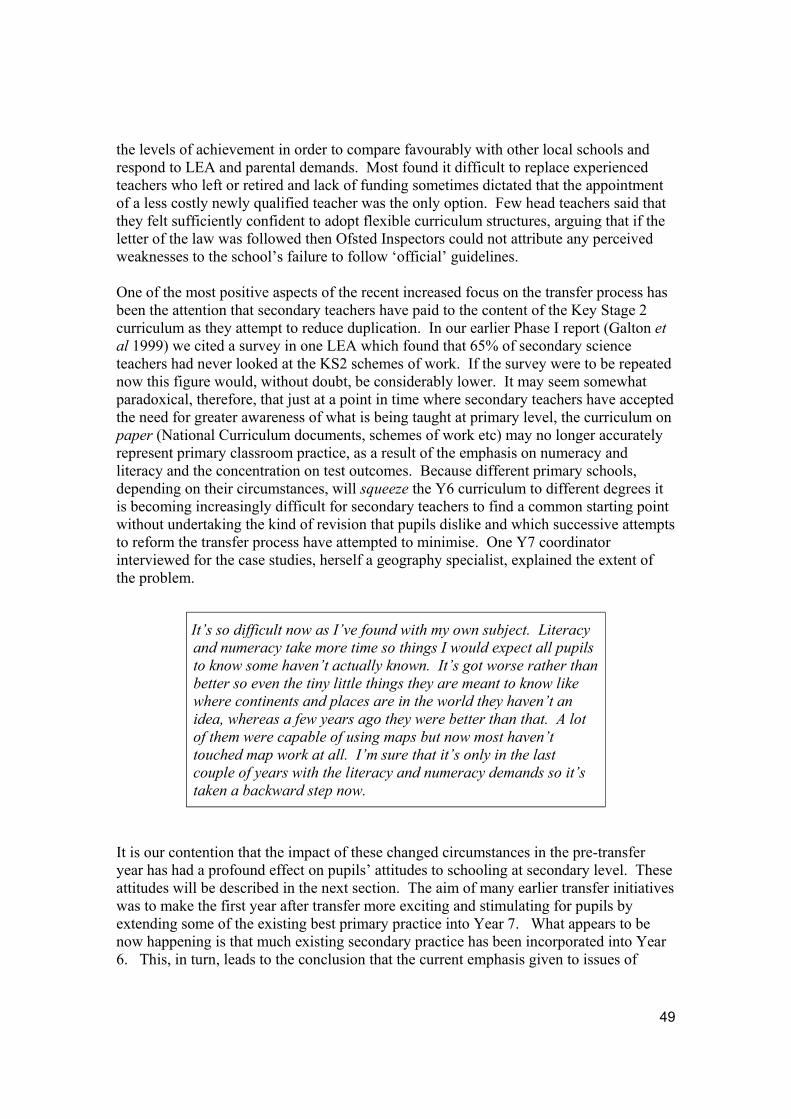
49
the levels of achievement in order to compare favourably with other local schools and respond to LEA and parental demands. Most found it difficult to replace experienced teachers who left or retired and lack of funding sometimes dictated that the appointment of a less costly newly qualified teacher was the only option. Few head teachers said that they felt sufficiently confident to adopt flexible curriculum structures, arguing that if the letter of the law was followed then Ofsted Inspectors could not attribute any perceived weaknesses to the school’s failure to follow ‘official’ guidelines. One of the most positive aspects of the recent increased focus on the transfer process has been the attention that secondary teachers have paid to the content of the Key Stage 2 curriculum as they attempt to reduce duplication. In our earlier Phase I report (Galton et al 1999) we cited a survey in one LEA which found that 65% of secondary science teachers had never looked at the KS2 schemes of work. If the survey were to be repeated now this figure would, without doubt, be considerably lower. It may seem somewhat paradoxical, therefore, that just at a point in time where secondary teachers have accepted the need for greater awareness of what is being taught at primary level, the curriculum on paper (National Curriculum documents, schemes of work etc) may no longer accurately represent primary classroom practice, as a result of the emphasis on numeracy and literacy and the concentration on test outcomes. Because different primary schools, depending on their circumstances, will squeeze the Y6 curriculum to different degrees it is becoming increasingly difficult for secondary teachers to find a common starting point without undertaking the kind of revision that pupils dislike and which successive attempts to reform the transfer process have attempted to minimise. One Y7 coordinator interviewed for the case studies, herself a geography specialist, explained the extent of the problem.
It’s so difficult now as I’ve found with my own subject. Literacy and numeracy take more time so things I would expect all pupils to know some haven’t actually known. It’s got worse rather than better so even the tiny little things they are meant to know like where continents and places are in the world they haven’t an idea, whereas a few years ago they were better than that. A lot of them were capable of using maps but now most haven’t touched map work at all. I’m sure that it’s only in the last couple of years with the literacy and numeracy demands so it’s taken a backward step now.
It is our contention that the impact of these changed circumstances in the pre-transfer year has had a profound effect on pupils’ attitudes to schooling at secondary level. These attitudes will be described in the next section. The aim of many earlier transfer initiatives was to make the first year after transfer more exciting and stimulating for pupils by extending some of the existing best primary practice into Year 7. What appears to be now happening is that much existing secondary practice has been incorporated into Year 6. This, in turn, leads to the conclusion that the current emphasis given to issues of
50
continuity and progression following the move from primary school may now need to be re-evaluated. Pupils’ attitudes at transfer Following initial discussion with representatives of the LEAs and participating schools it was agreed to provide several attitude inventories which estimated the pupils’ enjoyment of school, their liking of English, mathematics, science and ICT together with a measure of their motivation. Three LEAs (D, F and J) did not take part in the attitude testing. Their particular transfer initiatives either had a different focus, or they developed alternative measures or the retirement of key advisory staff caused the project to lose impetus. Another LEA (L) only took part in the 2001-2002 survey due to its participation in the Key Stage 3 pilot. In E, also a KS3 pilot authority, the focus was entirely upon science attitudes. The bulk of the data came from three LEAs (B, W and G), one of which was also taking part in the KS3 pilot. In Local Authority H only schools directly linked with the Phase II transfer project took part because the authority was also conducting its own transfer review in other schools. As the testing moved into the second year some of these nominated schools shifted the focus of their enquiries in an attempt to shed more light of the 2000-2001 results. One school, for example, modified the attitude scale for use with arts subjects. Another concentrated on extended systematic observation of Y6 and Y7 mathematics lessons. Among the participants, individual schools were free to pick and choose from among the battery of attitude measures according to the specific focus of their initiative. For all these reasons the numbers of pupils tested on a specific attitude measure varies but in all cases the numbers have been sufficient to establish norms against which individual schools can make their own evaluation. All the measures have acceptably high reliability with Cronbach Alpha coefficients above 0.80. Attitudes were measured on three occasions throughout the school year; first in July before transfer, second in November following the move to secondary school and third the following July. November was chosen because most previous research suggests that the first half term marks the end of the initial ‘settling in’ period following the move from primary school [see for example Beynon (1985) and Youngman & Lunzer (1977)]. Measurements were undertaken during the 2000-2001 school year (Cohort 1) and again in 2001-2002 (Cohort 2). The complete set of attitude scales are referred to as the ‘Sam series’ because of a unisex stick person 'Sam' (Samantha or Samuel) who acts as a device to facilitate valid answers. On the front page of each questionnaire pupils were informed that Sam 'goes to school' and 'gets a bit puzzled by life'. The pupils were then asked to answer questions using either five or four point Likert style scales about 'how they feel today' in order to help people like Sam tomorrow. Teachers reported that pupils appeared to enjoy completing the questionnaires. In presenting the results each scale has been adjusted so that zero indicates the most negative attitude and the average ratings are presented as a percentage of the maximum possible score on these transposed scales14.
14 For example the School Enjoyment scale had 8 items which were scored from 1= least like me to 4= most like me. The maximum possible score is thus 32 and the minimum is 8. When the scale is transposed
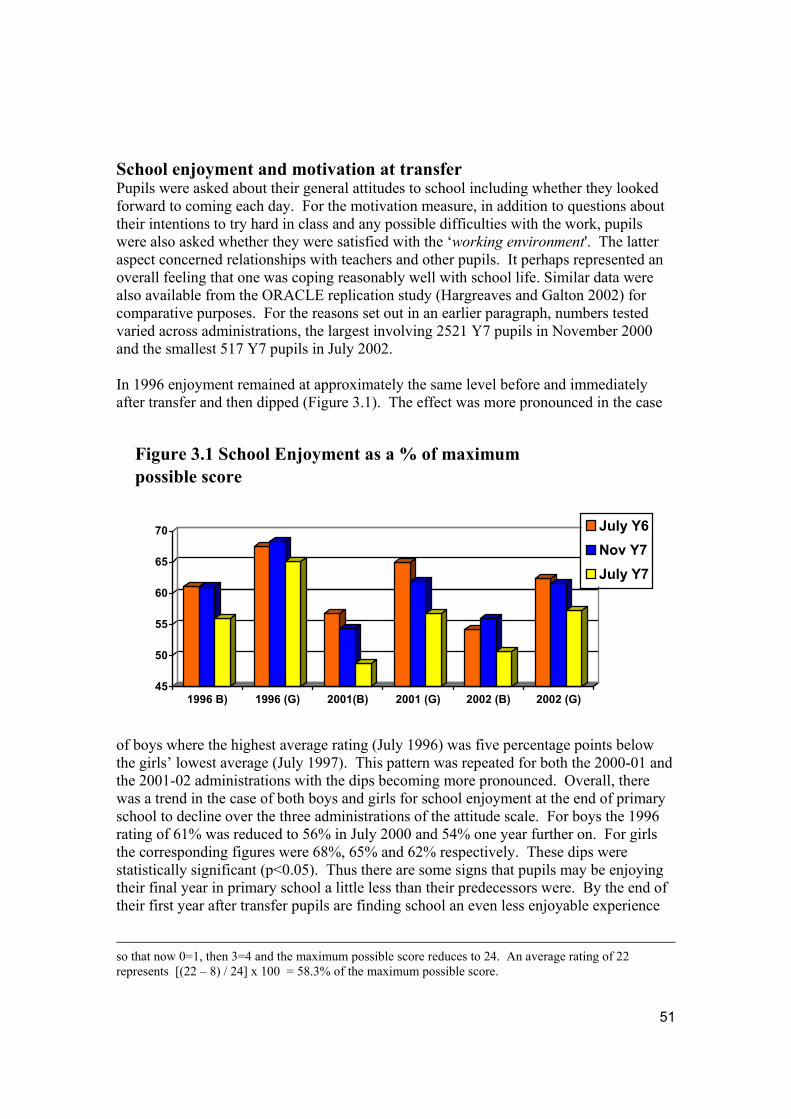
51
School enjoyment and motivation at transfer Pupils were asked about their general attitudes to school including whether they looked forward to coming each day. For the motivation measure, in addition to questions about their intentions to try hard in class and any possible difficulties with the work, pupils were also asked whether they were satisfied with the ‘working environment'. The latter aspect concerned relationships with teachers and other pupils. It perhaps represented an overall feeling that one was coping reasonably well with school life. Similar data were also available from the ORACLE replication study (Hargreaves and Galton 2002) for comparative purposes. For the reasons set out in an earlier paragraph, numbers tested varied across administrations, the largest involving 2521 Y7 pupils in November 2000 and the smallest 517 Y7 pupils in July 2002. In 1996 enjoyment remained at approximately the same level before and immediately after transfer and then dipped (Figure 3.1). The effect was more pronounced in the case
45
50
55
60
65
70
1996 B) 1996 (G) 2001(B) 2001 (G) 2002 (B) 2002 (G)
Figure 3.1 School Enjoyment as a % of maximum possible score
July Y6Nov Y7July Y7
of boys where the highest average rating (July 1996) was five percentage points below the girls’ lowest average (July 1997). This pattern was repeated for both the 2000-01 and the 2001-02 administrations with the dips becoming more pronounced. Overall, there was a trend in the case of both boys and girls for school enjoyment at the end of primary school to decline over the three administrations of the attitude scale. For boys the 1996 rating of 61% was reduced to 56% in July 2000 and 54% one year further on. For girls the corresponding figures were 68%, 65% and 62% respectively. These dips were statistically significant (p<0.05). Thus there are some signs that pupils may be enjoying their final year in primary school a little less than their predecessors were. By the end of their first year after transfer pupils are finding school an even less enjoyable experience
so that now 0=1, then 3=4 and the maximum possible score reduces to 24. An average rating of 22 represents [(22 – 8) / 24] x 100 = 58.3% of the maximum possible score.
52
although there would appear to be some slight improvement in 2001-02 compared to the previous year in the case of boys. In the case of motivation (see Figure 3.2) there was little change across either the three administrations during a school year or over time. The lowest average value recorded was for boys in the last weeks before leaving primary school in 1996 (66% of maximum possible score). None of the differences, however, reached significance level. The contrast with school enjoyment is somewhat puzzling, as one would expect that a lack of enthusiasm for school would be accompanied by a corresponding decline in motivation.
The motivation measures were therefore subject to further analysis using a sample of pupils from another research project. This measure was originally constructed for use in the ORACLE study (Galton et al 1980) and items were subsequently added during the ORACLE replication strengthening the contributions concerning the working environment. As with most motivation inventories the distinction between intrinsic and extrinsic types of motivation was adopted so that pupils generally worked hard because they found the subject matter interesting or, alternatively, because they wanted to succeed at school to get a good job. In the reanalysis, somewhat surprisingly, the items relating to the intrinsic motivation scale were found to make a negligible contribution to a pupil’s overall score. Pupils worked hard because they were clear that doing so was necessary if they were to succeed as adults, as one exchange during an interview with a Y7 pupil typifies:
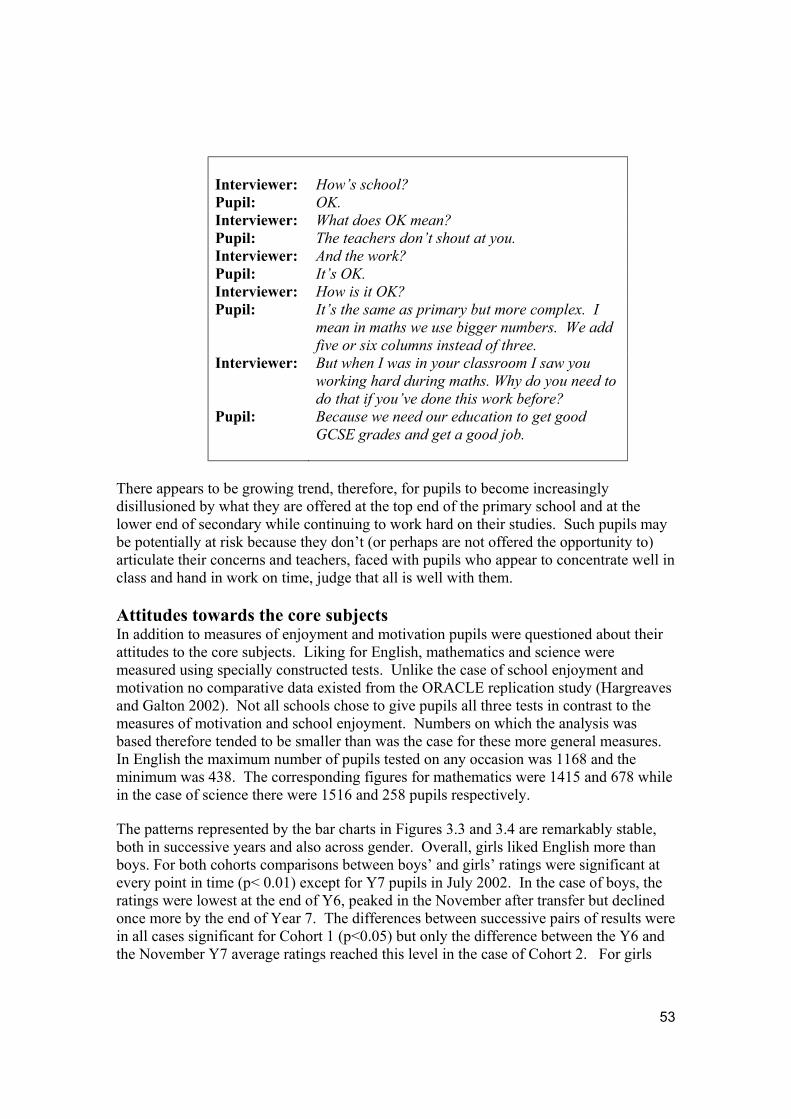
53
There appears to be growing trend, therefore, for pupils to become increasingly disillusioned by what they are offered at the top end of the primary school and at the lower end of secondary while continuing to work hard on their studies. Such pupils may be potentially at risk because they don’t (or perhaps are not offered the opportunity to) articulate their concerns and teachers, faced with pupils who appear to concentrate well in class and hand in work on time, judge that all is well with them. Attitudes towards the core subjects In addition to measures of enjoyment and motivation pupils were questioned about their attitudes to the core subjects. Liking for English, mathematics and science were measured using specially constructed tests. Unlike the case of school enjoyment and motivation no comparative data existed from the ORACLE replication study (Hargreaves and Galton 2002). Not all schools chose to give pupils all three tests in contrast to the measures of motivation and school enjoyment. Numbers on which the analysis was based therefore tended to be smaller than was the case for these more general measures. In English the maximum number of pupils tested on any occasion was 1168 and the minimum was 438. The corresponding figures for mathematics were 1415 and 678 while in the case of science there were 1516 and 258 pupils respectively. The patterns represented by the bar charts in Figures 3.3 and 3.4 are remarkably stable, both in successive years and also across gender. Overall, girls liked English more than boys. For both cohorts comparisons between boys’ and girls’ ratings were significant at every point in time (p< 0.01) except for Y7 pupils in July 2002. In the case of boys, the ratings were lowest at the end of Y6, peaked in the November after transfer but declined once more by the end of Year 7. The differences between successive pairs of results were in all cases significant for Cohort 1 (p<0.05) but only the difference between the Y6 and the November Y7 average ratings reached this level in the case of Cohort 2. For girls
Interviewer:
How’s school?
Pupil: OK. Interviewer: What does OK mean? Pupil: The teachers don’t shout at you. Interviewer: And the work? Pupil: It’s OK. Interviewer: How is it OK? Pupil: It’s the same as primary but more complex. I
mean in maths we use bigger numbers. We add five or six columns instead of three.
Interviewer: But when I was in your classroom I saw you working hard during maths. Why do you need to do that if you’ve done this work before?
Pupil: Because we need our education to get good GCSE grades and get a good job.

54
liking for English again peaked in November but then fell back in the following July to the same level as the primary school. However, the dips tend to be smaller than was the case for boys. None of the differences between successive pairs of girls’ ratings reached significance level in the case of Cohort 1 (2000-2001) but for Cohort 2 the reverse was true (p<0.05).
Mathematics presented a different picture but again the patterns of differences were consistent across both cohorts and gender. In all cases liking for mathematics was
20
25
30
35
40
45
50
55
Eng 01 Eng 02 Math 01 Math 02 Sci 01 Sci 02
Figure 3.4 Girls' Attitudes to Core Subjects (as percentage of maximum score)
Y6 July
Y7 Nov
Y7 July
20
25
30
35
40
45
50
55
Eng 01 Eng 02 Math 01 Math 02 Sci 01 Sci 02
Figure 3.3 Boys' Attitudes to Core Subjects (as percentage of maximum score) Y6 July
Y7 Nov
Y7 July

55
highest in the July of the final year of primary school, had dipped by the November of Year 7 and had fallen even further by the end of the first year at secondary school. Boys started by enjoying mathematics more than girls in Year 6 but this was no longer true by secondary school. Furthermore in all cases the ratings for Cohort 2 are significantly lower than for Cohort 1 indicating that liking for mathematics has declined over a two-year period. Both the dips between successive measurements of the ratings and year by year differences were statistically significant (p<0.05). As might be predicted, boys enjoyed science more than girls did. The boys’ scores were generally 5% higher in all cases, more so for Y7 pupils in July 2002 where the difference was nearly double this figure. The overall patterns were similar to mathematics but where dips occurred they were less extreme, since the initial scores in Year 6 started from a lower base. In the case of both boys and girls the differences between the Y6 scores and the November scores in Y7 were not significant for either cohort or gender but the dips between November and the following July were (p<0.01). The attitude dips in mathematics and science suggest that there is a need to investigate further why these trends are different from those found for English. Furthermore in science there is added evidence to suggest that these trends extend further back into the primary school. A study of pupils’ attitudes to science involving children from age five to eleven found that for both boys’ and girls’ enthusiasm for science fell year on year from Y1 to Y6 although the differences between Y3 and Y4 were negligible (Pell & Jarvis 2001). Girls matched boys’ performance up to Year 4 but then fell away in Years 5 and 6 to yield similar differences to those recorded in Figures 3.3 and 3.4. Unfortunately no similar attitude data were available for mathematics at primary level to discern whether similar trends exist. Links between attitudes and attainment at transfer At KS3 level, it has been difficult to investigate dips in attainment in the same detail as was the case for the various age groups between KS1 and KS2. This is because, unlike most primary schools there has been, as yet, no widespread take up of QCA Optional Tests so that no consistent measure of attainment was available. There are also continuing arguments about the validity of comparing equivalent levels across key stages (Wiliam 2001). Many secondary schools used the NFER’s Cognitive Aptitude Tests (CATS) or other alternatives; another participating authority had its own well-established measures of literacy. Furthermore, no QCA Y7 test for science has yet been developed as part of the KS3 strategy. The most consistent measure of a pupil’s ability available was the score from the Y6 National Curriculum tests. In other cases teachers were asked to estimate pupils’ attainment levels at the end of year 7 using the National Curriculum criteria supported by the various kinds of test results where available. Levels were then converted to point scores using the same scaling employed in the KS1 to KS2 analysis in Chapter 2 (Table 2.5). Table 3.2 shows the association between attitudes to English, mathematics, science and attainment respectively. The magnitude of the statistically significant correlations, although not large, nevertheless depicts reasonably consistent trends.
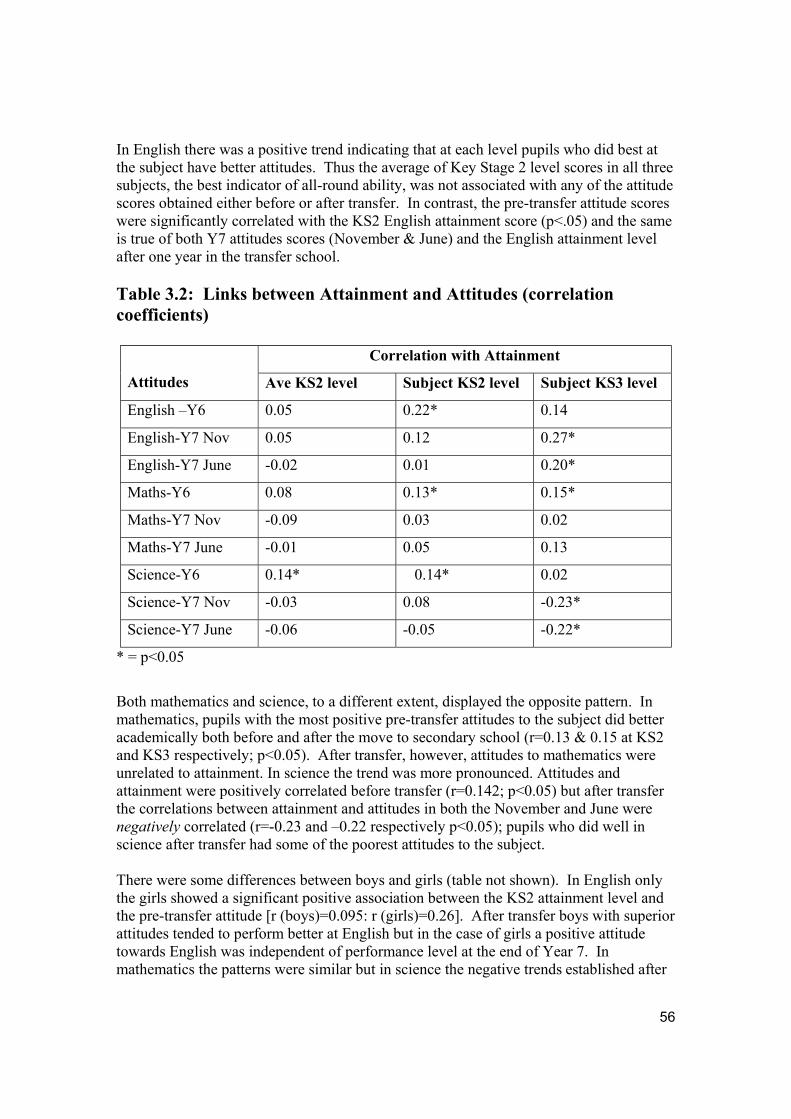
56
In English there was a positive trend indicating that at each level pupils who did best at the subject have better attitudes. Thus the average of Key Stage 2 level scores in all three subjects, the best indicator of all-round ability, was not associated with any of the attitude scores obtained either before or after transfer. In contrast, the pre-transfer attitude scores were significantly correlated with the KS2 English attainment score (p<.05) and the same is true of both Y7 attitudes scores (November & June) and the English attainment level after one year in the transfer school. Table 3.2: Links between Attainment and Attitudes (correlation coefficients)
Correlation with Attainment
Attitudes Ave KS2 level Subject KS2 level Subject KS3 level
English –Y6 0.05 0.22* 0.14
English-Y7 Nov 0.05 0.12 0.27*
English-Y7 June -0.02 0.01 0.20*
Maths-Y6 0.08 0.13* 0.15*
Maths-Y7 Nov -0.09 0.03 0.02
Maths-Y7 June -0.01 0.05 0.13
Science-Y6 0.14* 0.14* 0.02
Science-Y7 Nov -0.03 0.08 -0.23*
Science-Y7 June -0.06 -0.05 -0.22*
* = p<0.05
Both mathematics and science, to a different extent, displayed the opposite pattern. In mathematics, pupils with the most positive pre-transfer attitudes to the subject did better academically both before and after the move to secondary school (r=0.13 & 0.15 at KS2 and KS3 respectively; p<0.05). After transfer, however, attitudes to mathematics were unrelated to attainment. In science the trend was more pronounced. Attitudes and attainment were positively correlated before transfer (r=0.142; p<0.05) but after transfer the correlations between attainment and attitudes in both the November and June were negatively correlated (r=-0.23 and –0.22 respectively p<0.05); pupils who did well in science after transfer had some of the poorest attitudes to the subject. There were some differences between boys and girls (table not shown). In English only the girls showed a significant positive association between the KS2 attainment level and the pre-transfer attitude [r (boys)=0.095: r (girls)=0.26]. After transfer boys with superior attitudes tended to perform better at English but in the case of girls a positive attitude towards English was independent of performance level at the end of Year 7. In mathematics the patterns were similar but in science the negative trends established after
57
transfer were a consequence of the girls who were doing well in science having the poorest attitudes (r= -0.26 [November] and -0.36 [June]). For boys although both correlations were negative, indicating a similar trend, they did not reach significance level. Our informal observations in schools during case study visits suggest some reasons for these trends. Our findings are similar to those reported by Local Authority H. In English, in Year 7, less time was spent on reading and more on writing. This writing was related mainly to fiction although more often within set deadlines. While there was more whole class and group discussion activities these often involved dramatic interpretation of fictional characters allowing opportunities for independent and creative thinking. In one class, for example, pupils had to predict how a certain character in the story would behave in the following chapter and the class had to debate the pros and cons of the various suggestions put forward. Pupils stated that in Year 7 there was more variety in English and that it was more interesting. By contrast, many pupils said that mathematics involved doing similar things in Y7 as they had done in Years 5 and 6 although the calculations involved bigger numbers. There was less class discussion, pupils were expected to work more quickly and lessons were less enjoyable as a consequence. In science pupils spent much of their time copying out details of experiments or writing out instructions under the teacher’s guidance in Year 7. As a result, in both mathematics and science, there was less variety than in English and pupils spent most lessons either listening to the teacher or writing. Able pupils, in particular, said they were easily bored by these lessons and preferred the more active and varied involvement experienced in English.
Pupil 1: Take maths. I used to like it but not anymore because we keep on going over the same things again and again [general agreement].
Pupil 2: Like fractions. You did like five lessons on fractions which kept going on again and again
Pupils: Boring. Boring [everyone shouting]
Pupil 2: At the start of every lesson they refresh your memory
Pupil 1: In primary we did fractions and then we done it at the end of year 5
All Pupils:
[talking over each other] I think we did. And now we are doing it now. But it’s so boring. It’s dead easy now.
In several of the schools we visited considerable emphasis was placed on the development of thinking skills in Science during Year 7, mainly through the use of CASE (Cognitive Acceleration in Science Education) materials developed by Adey and Shayer (1994). However, CASE lessons usually took place over a double lesson period every
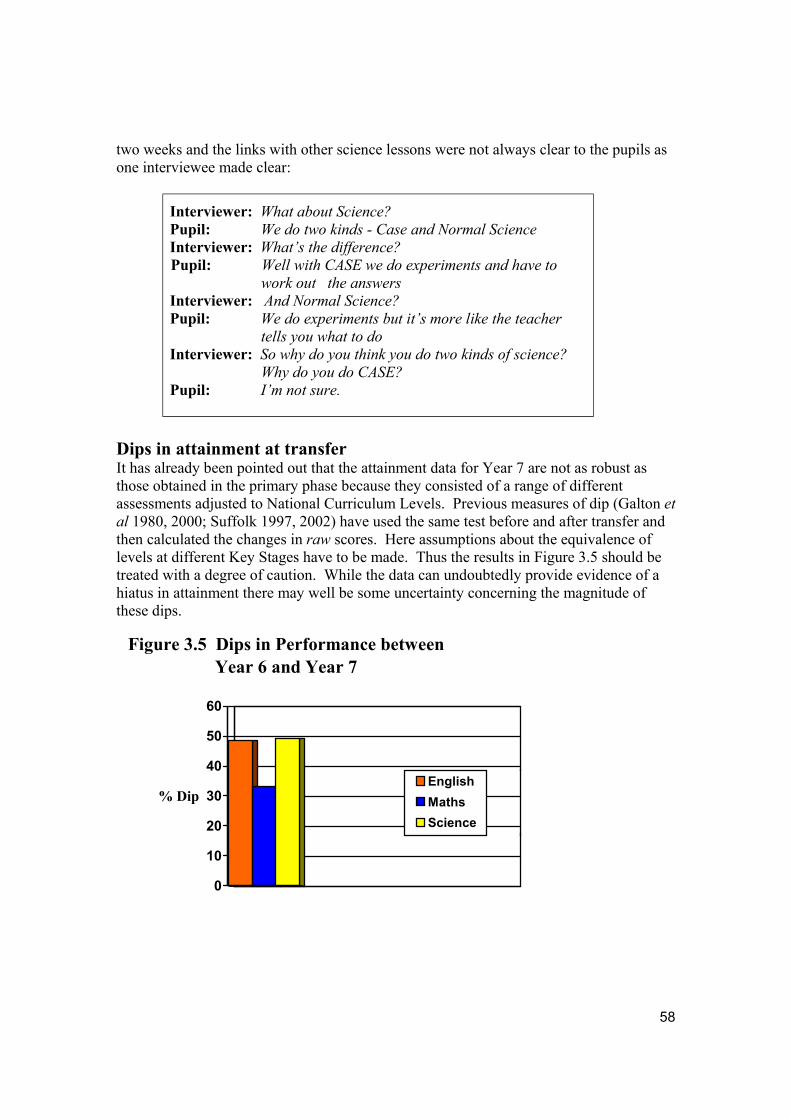
58
two weeks and the links with other science lessons were not always clear to the pupils as one interviewee made clear:
Interviewer: What about Science? Pupil: We do two kinds - Case and Normal Science Interviewer: What’s the difference? Pupil: Well with CASE we do experiments and have to
work out the answers Interviewer: And Normal Science? Pupil: We do experiments but it’s more like the teacher
tells you what to do Interviewer: So why do you think you do two kinds of science?
Why do you do CASE? Pupil: I’m not sure.
Dips in attainment at transfer It has already been pointed out that the attainment data for Year 7 are not as robust as those obtained in the primary phase because they consisted of a range of different assessments adjusted to National Curriculum Levels. Previous measures of dip (Galton et al 1980, 2000; Suffolk 1997, 2002) have used the same test before and after transfer and then calculated the changes in raw scores. Here assumptions about the equivalence of levels at different Key Stages have to be made. Thus the results in Figure 3.5 should be treated with a degree of caution. While the data can undoubtedly provide evidence of a hiatus in attainment there may well be some uncertainty concerning the magnitude of these dips.
0
10
20
30
40
50
60
% Dip
Figure 3.5 Dips in Performance between Year 6 and Year 7
EnglishMathsScience

59
On these present measures around half the pupils in English and Science (49% and 49% respectively) made no gain in their level score one year after moving from primary to secondary school. For mathematics, however, the corresponding figure was 33%. Even allowing for the unreliability of these Y7 estimated scores, expressed in terms of Key Stage 3 levels, the relatively high proportion of the sample failing to make progress suggest that transfer to secondary school is still associated with subsequent under-performance in the case of certain pupils. Supportive evidence for this conclusion can be found in the evaluation of the Y7 Optional Test scores in the Key Stage 3 Pilot Schools (Stoll et al 2003:68). The main analysis was carried out at school level using value added scores but it is also reported that while only 39% of pupils failed to make a gain of one level in mathematics, the corresponding figure for English was 66%. Thus the trends are similar in both cases. Transfer and the Key Stage 3 Strategy Our remit was not directly concerned with the effects of the KS3 Pilot and roll-out strategies on classroom pedagogy, pupils’ attitudes and motivation. Nevertheless, of the six LEAs where we collected data on these variables three were taking part in the Pilot. In one of these LEAs (E) only science attitudes and motivation were measured, in another (L) data in all three core subjects were available in 2000-01 but not in 2001-02 unlike (G) where data were collected in both academic years. Case study visits were made to schools in (L) and (G). Our findings, which produced similar patterns from year to year would appear to be at variance at certain points with those of two other studies (Stoll et al 2003; Ofsted 2003). Both these national evaluations found evidence of changes in classroom practice and in Ofsted’s case in English (but to a lesser extent mathematics) these have had a positive impact upon learning and upon transfer (Ofsted 2003). Stoll and her colleagues reported that the pilot programmes had a positive effect on pupils’ attitudes. Pupils were ‘mainly positive about teaching and learning, more so than in other recent research’ (Stoll et al 2003). We think, however, that any discrepancies between our own and these conclusions about changes in classroom practice can be attributed mainly to differences in the methodology employed. In the case of pupils’ attitudes the structure and format of the questionnaires, the timing of their administration, the manner of their analysis, and the interpretation placed upon certain key responses is the most likely source of any reported differences. There were also areas of agreement. Stoll et al (2003) found no significant shifts in pupils’attitude in pilot and non-pilot schools (p65) and this accords with our own findings showing no major differences between schools from the three Pilot LEAs and those in the remaining authorities. As with this present study, they also found girls enjoyed school significantly more than boys did (p64) although, interestingly, the reported levels of enjoyment appeared to be higher for both sexes in Year 8 than for both November and June administrations with our sample of Y7 pupils. It might have been expected that Y7 pupils would display greater enthusiasm in the immediate post-transfer period where there exists a certain novelty element. There are also certain similarities between some our findings and those of Barnes et al’s (2003) small-scale evaluation of the KS3 Pilot strategy for the Association of Teachers

60
and Lecturers (ATL), although this latter study only sampled a self-selected panel from among the association’s membership. Teachers of English, among ATL’s members, thought that the strategy provided a much-needed structure but that they struggled within the time available to find a balance between the development of pupils’ language skills and the development of the imagination through the enjoyment of literature (p14). Conversations with Y7 teachers during our case study visits tended to echo these sentiments. In mathematics ATL teachers said that because of lack of time the use of interactive whole class teaching was often restricted to the mental starter activities. A frequent comment was that the amount of work to be covered and the pressures of time injected a lot of pace into the lessons with colleagues tending to revert to a didactic approach (p31). Again, our own observations and those from the Suffolk (2002) evaluation tend to confirm these findings. In science, we have referred elsewhere to the way that teachers tended to employ direct teaching in what pupils termed 'normal science’ lessons, in contrast to the less frequent but intellectually more challenging investigations such as CASE. Stoll et al.(2003 p64) also point to the limited attention so far given to creating more challenging learning environments, particularly involving the use of small group work. This despite the finding (ibid. p63) that 90% of pupils said they enjoyed and valued group work. It could be that it is, in part, this continued emphasis on direct instruction that accounts for the persistent attitude dips The case studies of transfer The case study schools were chosen because their pupils made significantly high positive attitude gains after transfer compared to the remaining schools in the sample. Four Local Authorities (B, H, L and W) each provided two case study schools and one school was visited in Local Authority G, making 9 cases in all. In the case of Local Authority B one of the chosen schools did not take part in the attitudes survey but was picked because it offered a rarely encountered example of a post-transfer induction programme. Schools were visited for one or two days during the 2001-02 academic year and in the case of post-transfer induction in September 2002. On every visit the Head of Year 7 and the appropriate subject coordinator was interviewed. Three groups of Y7 pupils (with between 6 and 8 members), representative of the full ability range, were also interviewed. For the rest of the time one Y7 class was observed during lessons. The case study schools employed several common strategies: * All but two used some form of Bridging Unit; * 8 had summer schools for those who needed to catch up in literacy and numeracy; * 4 ran summer programmes for gifted pupils in arts or drama; * 5 had extended induction programmes over and above the normal one-day visit
during the summer term. These included regular use of the transfer school facilities, such as the gym, playing fields, ICT, drama studios, etc. One transfer school provided after school clubs for feeder schools and another organised a science problem-solving day in which Y6 and Y7 pupils worked together in groups;
* 2 schools had a programme of exchange visits between Y6 and Y7 teachers where the visiting teacher carried out detailed observations of the host teacher’s lesson. This contrasted with the more usual practice where only the Y7 teacher visits the main
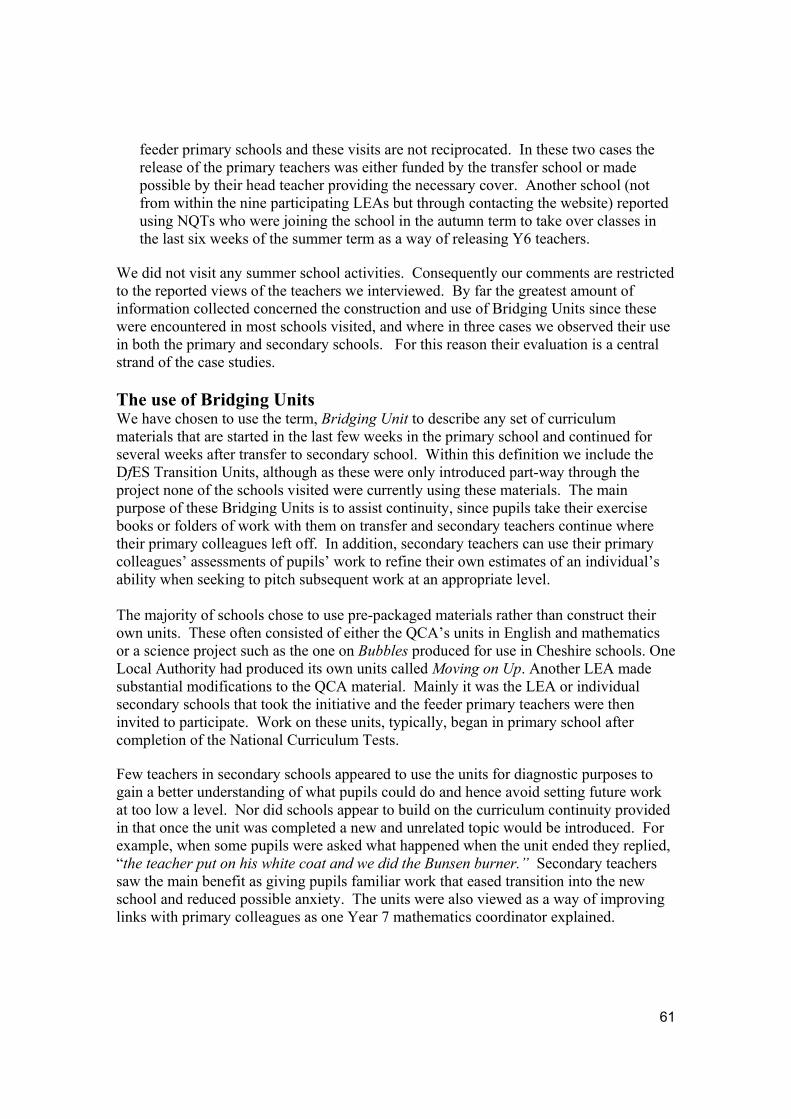
61
feeder primary schools and these visits are not reciprocated. In these two cases the release of the primary teachers was either funded by the transfer school or made possible by their head teacher providing the necessary cover. Another school (not from within the nine participating LEAs but through contacting the website) reported using NQTs who were joining the school in the autumn term to take over classes in the last six weeks of the summer term as a way of releasing Y6 teachers.
We did not visit any summer school activities. Consequently our comments are restricted to the reported views of the teachers we interviewed. By far the greatest amount of information collected concerned the construction and use of Bridging Units since these were encountered in most schools visited, and where in three cases we observed their use in both the primary and secondary schools. For this reason their evaluation is a central strand of the case studies. The use of Bridging Units We have chosen to use the term, Bridging Unit to describe any set of curriculum materials that are started in the last few weeks in the primary school and continued for several weeks after transfer to secondary school. Within this definition we include the DfES Transition Units, although as these were only introduced part-way through the project none of the schools visited were currently using these materials. The main purpose of these Bridging Units is to assist continuity, since pupils take their exercise books or folders of work with them on transfer and secondary teachers continue where their primary colleagues left off. In addition, secondary teachers can use their primary colleagues’ assessments of pupils’ work to refine their own estimates of an individual’s ability when seeking to pitch subsequent work at an appropriate level. The majority of schools chose to use pre-packaged materials rather than construct their own units. These often consisted of either the QCA’s units in English and mathematics or a science project such as the one on Bubbles produced for use in Cheshire schools. One Local Authority had produced its own units called Moving on Up. Another LEA made substantial modifications to the QCA material. Mainly it was the LEA or individual secondary schools that took the initiative and the feeder primary teachers were then invited to participate. Work on these units, typically, began in primary school after completion of the National Curriculum Tests. Few teachers in secondary schools appeared to use the units for diagnostic purposes to gain a better understanding of what pupils could do and hence avoid setting future work at too low a level. Nor did schools appear to build on the curriculum continuity provided in that once the unit was completed a new and unrelated topic would be introduced. For example, when some pupils were asked what happened when the unit ended they replied, “the teacher put on his white coat and we did the Bunsen burner.” Secondary teachers saw the main benefit as giving pupils familiar work that eased transition into the new school and reduced possible anxiety. The units were also viewed as a way of improving links with primary colleagues as one Year 7 mathematics coordinator explained.

62
Interviewer: What do you and your colleagues see as the main purpose of these units?
Teacher: That’s a difficult one. The main idea, I think, is to have a link with the primaries, to help act as liaison. So it has made us more open, honest, sharing and the idea of liaison is to make pupils more comfortable when they get to us. So we are trying to make sure we are being kind and giving them all the induction they need and making transfer smooth so there is not enough of a difference for them to feel they are at a new school.
In some cases primary teachers did not mark the work or write comments on the pupils’ folders so secondary colleagues were unable to use the material for diagnostic purposes. One Year 7 teacher remarked, “I could see from looking at the books that they were pupils’ not teachers’ corrections”. When asked about this some primary teachers responded with, what in the past, was a frequently heard complaint that “secondary schools never take any notice of the information we pass on anyway so why should we bother?” Others argued that after the stress and pressures of the ‘high stakes’ testing they and their pupils needed to relax and do some of the fun things that had been dropped from the curriculum. Doing more mathematics was not seen as fun! Such negative comments were less frequent where existing relationships between feeder and transfer schools were well established and where the primary schools had felt fully involved in the design and planning of the bridging programme. For this reason both primary and secondary teachers generally viewed self-initiated units more positively because it allowed ideas to be shared at the planning stage and these discussions often raised important questions on matters of pedagogy and assessment. Uncertainties as to the main purposes of the Bridging Units among teachers were also reflected in the pupils’ attitudes. While most of the Y7 interviewees said that they were concerned about coping with the work at secondary school, they were also adamant that they wanted new challenges. Bridging Units, by emphasising continuity, can leave pupils with the impression that “it’s the same work as at primary school,” even though the work is pitched at Year 7 level, as the following extended interview transcript illustrates.
Interviewer: What did the teachers tell you? Did they tell you
why you were doing this work? Pupil 1: No. Interviewer: No reason at all? Pupils: [talking over one another] They said we were
practising. They were giving us some work to do to get us ready for secondary school. It will be a good idea and it will continue next year.
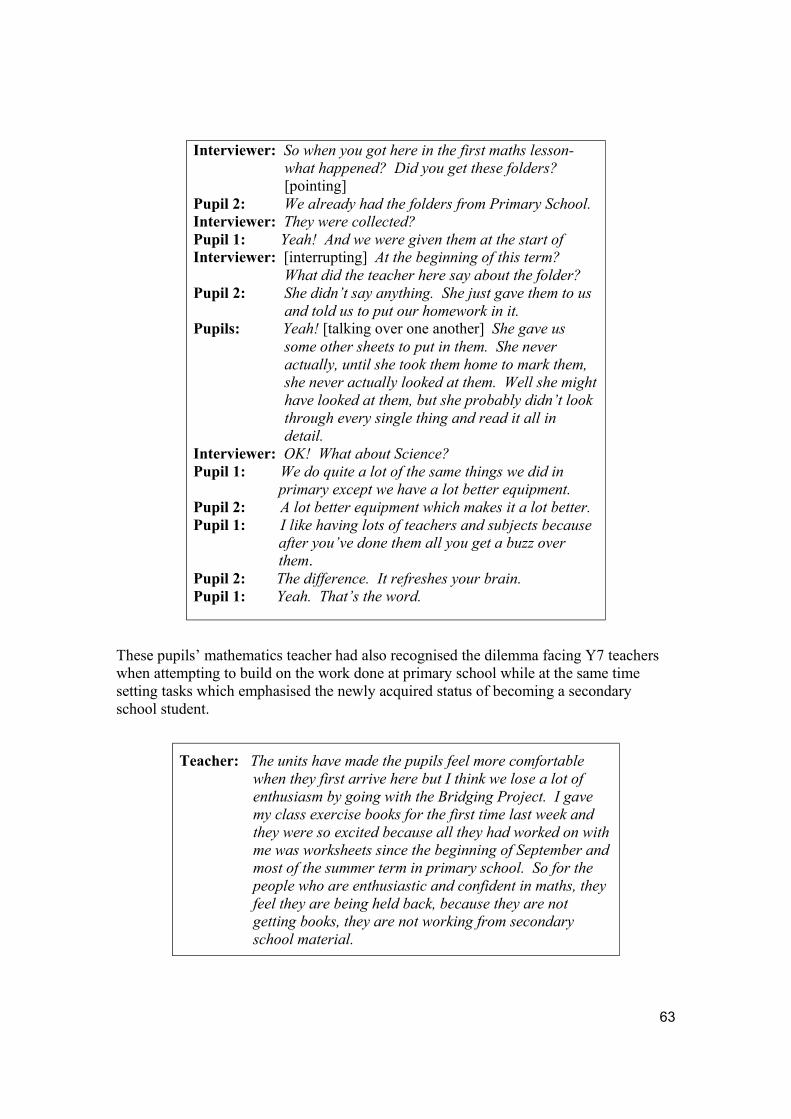
63
Interviewer: So when you got here in the first maths lesson-what happened? Did you get these folders? [pointing]
Pupil 2: We already had the folders from Primary School. Interviewer: They were collected? Pupil 1: Yeah! And we were given them at the start of Interviewer: [interrupting] At the beginning of this term?
What did the teacher here say about the folder? Pupil 2: She didn’t say anything. She just gave them to us
and told us to put our homework in it. Pupils: Yeah! [talking over one another] She gave us
some other sheets to put in them. She never actually, until she took them home to mark them, she never actually looked at them. Well she might have looked at them, but she probably didn’t look through every single thing and read it all in detail.
Interviewer: OK! What about Science? Pupil 1: We do quite a lot of the same things we did in
primary except we have a lot better equipment. Pupil 2: A lot better equipment which makes it a lot better. Pupil 1: I like having lots of teachers and subjects because
after you’ve done them all you get a buzz over them.
Pupil 2: The difference. It refreshes your brain. Pupil 1: Yeah. That’s the word.
These pupils’ mathematics teacher had also recognised the dilemma facing Y7 teachers when attempting to build on the work done at primary school while at the same time setting tasks which emphasised the newly acquired status of becoming a secondary school student.
Teacher: The units have made the pupils feel more comfortable
when they first arrive here but I think we lose a lot of enthusiasm by going with the Bridging Project. I gave my class exercise books for the first time last week and they were so excited because all they had worked on with me was worksheets since the beginning of September and most of the summer term in primary school. So for the people who are enthusiastic and confident in maths, they feel they are being held back, because they are not getting books, they are not working from secondary school material.
64
Not all schools had a similar problem. It was noticeable, particularly in science, that where primary and secondary colleagues engaged in joint planning of these units that there was both continuity and a greater variety of activities so that the pupils’ interest and motivation was sustained after transfer. In one school, for example, pupils studied the life cycle of the silk moth. In another pupils explored aspects of the local environment, with each feeder school having a particular area of investigation. Once in the secondary school pupils from different feeders were placed in groups and required to share their findings in order to create the bigger picture. Even where the Bridging Unit appeared to be successful, however, it was rare for teachers to share any information obtained about pupils with colleagues from other subject areas. One LEA therefore developed Bridging Units in all three core subjects but this too caused problems. Pupils from the schools in this Authority expressed the strongest objection to having to continue with work begun in the feeder school. Primary teachers also expressed resentment at having a large proportion of the timetable taken up with core subjects when they had hoped to spend the weeks after the National Curriculum Tests doing extra art, drama, music and design and technology, by way of compensation. Some of the LEAs were of a size to allow all feeder schools to participate in the Bridging Unit activity. Even here there were problems in that some primary schools didn’t always follow the suggested programme. As a result, when pupils arrived at secondary school, the number and the nature of the topics covered varied because “some schools went a bit further than they should have done and some didn’t so that there was a knock on effect”. In larger LEAs the units only worked well where there were compact pyramids. Otherwise the effects of parental choice and competition for places in more favoured secondary schools meant that only a few pupils might come from a particular primary school and these children would not have done the first part of the unit. This made it difficult to organise lessons in the period after transfer. One secondary science teacher explained, “We had some pupils who hadn’t a clue having not done the experiments in primary school. I had to pair them with kids who had but it didn’t really work”. The rigid organisational structure operating at the secondary level and the ‘territorial’ claims of subject departments and Heads of Year have the potential to undermine the effectiveness of initiatives such as Bridging Units. We came across several examples of such problems. In the case of the silk moth investigation, for example, although pupils spoke with great enthusiasm about the activity, some were unable to complete the investigation until the following summer term after transfer. This was because the secondary school science was organised so that Y7 pupils rotated between the biology, physics and chemistry departments on a termly basis and the chemistry and physics teachers were reluctant to delay the start of their course for a few weeks so that all pupils could complete the Bridging Unit immediately following transfer. Generally, the demarcation between pastoral and curriculum responsibilities in Y7 remains unclear in most schools. In some cases the Head of Y7 was also Head of Lower School in attempt to merge these roles. Other schools moved the Head of Y7 with the year group so that in successive years s/he became Head of Y8 and Y9. It was hoped that the Heads of Years
65
could use this shared experience to give more overall purpose to the Key Stage 3 phase. Neither strategy seemed particularly effective, mainly because Year 7 co-ordinators felt that most heads of subject departments gave higher priority to the work in Years 10 and 11 and to the improvement of grades at GCSE. This manifested itself in a variety of ways. For example, in the case of the silk moths, heads of science departments resisted the suggestion that the curriculum in the first two weeks of the Autumn term should be used to complete the Bridging Unit. However, they were prepared to re-arrange the timetable to accommodate the fortnightly CASE lessons, because the latter claimed to increase GCSE scores by up to two grades. In other cases Y7 co-ordinators said that staff who were integral members of the transition team were given additional duties in the GCSE years without prior consultation. In summary, therefore, even those Bridging Units to which pupils responded enthusiastically appear only to bring about limited improvements in continuity. For this to occur a considerable amount of joint planning and evaluation needs to take place between teachers in the feeder and transfer schools. This joint activity perhaps appears to be the most important outcome since it often promotes discussion on pedagogy and assessment issues with the potential to bring about changes in teaching and learning. A similar conclusion is reached by the Suffolk (2002) transfer review. Senior management in the schools involved therefore need to balance the costs incurred and the observable benefits in comparison with other initiatives, such as peer observation and post-induction, which may provide more effective ways of improving the quality of teaching and learning. Teacher exchanges Other than the use of Bridging Units, the increase in visits between teachers to one another’s schools was the next most frequently cited strategy during the case study interviews. This finding is supported from entries to our website and resource file. Prior to Phase II most of these visits involved either the Y7 coordinator or the SENCO sitting in on lessons in the feeder schools. The main purposes were to smooth the transfer processes by identifying pupils with special learning or behavioural problems and to allay anxieties about what the new teachers would be like by providing a physical presence. In fewer cases heads of subject departments also visited the main feeder schools, although the subsequent impact on the Y7 curriculum appeared to be somewhat limited. More recently Y6 teachers have begun to reciprocate these visits by linking with one of the core subject specialists with a Y7 class. Often the cost of cover for the primary colleague was met from funds provided by the transfer school. These visits were organised in several different ways. Most were informal where the visiting teacher acted as a classroom assistant, helping out with group activities and individual seatwork. They provided opportunities to talk with pupils, assess the quality of the work and gain a better understanding of the range of subject matter being covered. English specialists in Y7 have greatly valued these visits as a means of gaining insights into the working of the Literacy Hour in Key Stage 2.
66
In a few cases this arrangement has been extended so that teachers exchange classes. The Primary teacher takes a Y7 class for, say, mathematics and English for part of a morning and tracks the pupils during the remaining periods, while the two Y7 subject specialists each teach a Y6 class for half of the morning. Such arrangements, however, were difficult to organise and, for this reason, often only involve a single primary school from the pyramid. Employing, during the final weeks of the summer term, newly qualified teachers (NQTs) who will be joining the school at the beginning of the next academic year can create greater flexibility. Paid at instructor rates, these NQTs can provide more or less continuous cover. So far, however, this arrangement has only been used in the feeder schools. Whichever one of the above arrangements was followed, it was noticeable that the perspectives of teachers after these visits tended to conform to a stereotypical view of the classroom so that, for example, secondary teachers would often enthuse about the challenging work taking place in the Y6 classroom or remark on the extent and effectiveness of collaborative group work. This conflicted with our own observations and also the accounts of primary lessons that pupils provided during interviews. One explanation for the disparity concerns the timing of these visits nearly all of which took place in June after the end of the National Curriculum tests and when secondary teachers had more free time because they no longer had to teach Year 11 classes. But, as was pointed out earlier, this is just the time when primary teachers attempt to make up for the narrow curriculum provided during the run-up to the assessments. Secondary teachers who visit primary schools in the second half of the summer term may therefore see exciting practice but they do not see typical practice. Another reason for the mismatch between these descriptions and the reality of classroom practice may also have to do with the lack of a clear focus during the observation. In Local Authority H teachers were trained to use a modified version of the ORACLE systematic observation system (Galton et al 1980). This version concentrated on classroom organisation, pupil engagement, the nature of the activity (whether cognitively challenging) and the pupil’s response. In other LEAs teachers adopted a less structured approach but concentrated on a particular aspect of the lesson. For example, one pair of teachers examined whether boys or girls tended to dominate in groups, while another pair agreed to look at the frequency of challenging questions. Elsewhere, two teachers agreed to videotape their lessons and play them back to colleagues at the next meeting of their pyramid. A common experience of these teachers, who focused to a greater or lesser degree on certain aspects of the lessons, was that it led to greater depth in the analysis. One teacher for example found:

67
Teacher: The observation system was very frustrating. It
didn’t seem to represent what we were seeing, the overall picture. We could see who was and wasn’t working but not the different ways they were doing it or how they went about getting help.
Interviewer: So what did you do? Teacher: We made up our own checklist.
In a similar manner the teachers who looked at challenging questions gradually shifted their attention to the avoidance strategies some pupils used to evade giving answers and this led both of them to reconsider their current approach to questioning. Thus the use of peer-focused observation seemed to lead to the analysis of classroom practice at a deeper level. By focusing on particular aspects of the pupils’ classroom behaviour the teachers’ attention was often drawn to other more salient features, which in turn led in some cases to a reappraisal of existing teaching strategies. Post induction programmes A number of secondary schools are beginning to experiment with post induction programmes. This is particularly the case where the transfer school receives pupils from a large number of feeders. It is felt that the limited amount of time available on the pre-transfer induction day does not allow the incoming pupils sufficient opportunity to adjust to their new role as secondary pupils and that beginning normal lessons on the first day of the autumn term then provides too traumatic a transition for some. A second advantage is that it allows teachers to form an opinion about the capabilities of pupils prior to placing them into sets or streams. Most importantly, such programmes attempt to build upon Lahelma and Gordon’s (1997) concept of the professional pupil by helping these new secondary students to manage their own learning more effectively. Thus a key objective of such programmes is to make explicit to these new secondary pupils the school’s expectations about ways in which they will need to work in order to achieve success. A typical post induction programme can last up to two weeks. Generally, the Y7 form tutors take the lead role but other subject specialists are also expected to participate during their periods with Y7 classes. In one instance we observed a science tutor working with a class on a comprehension exercise designed to improve the pupils’ note-taking skills. Induction programmes will be likely to include some or all of the following: * Familiarisation exercises where pupils have to use maps/timetables etc to find the
quickest legitimate routes from form room to their other classes (mathematics, science, art etc), learn about the school and other pupils.
* Study skills programmes designed to support work in the subject areas. * Self-knowledge and self-awareness activities where pupils identify preferred learning
styles, work at improving social skills, and endeavour to enhance self-esteem etc. * Sessions to improve learning by identifying useful thinking strategies (e.g. concept
maps)
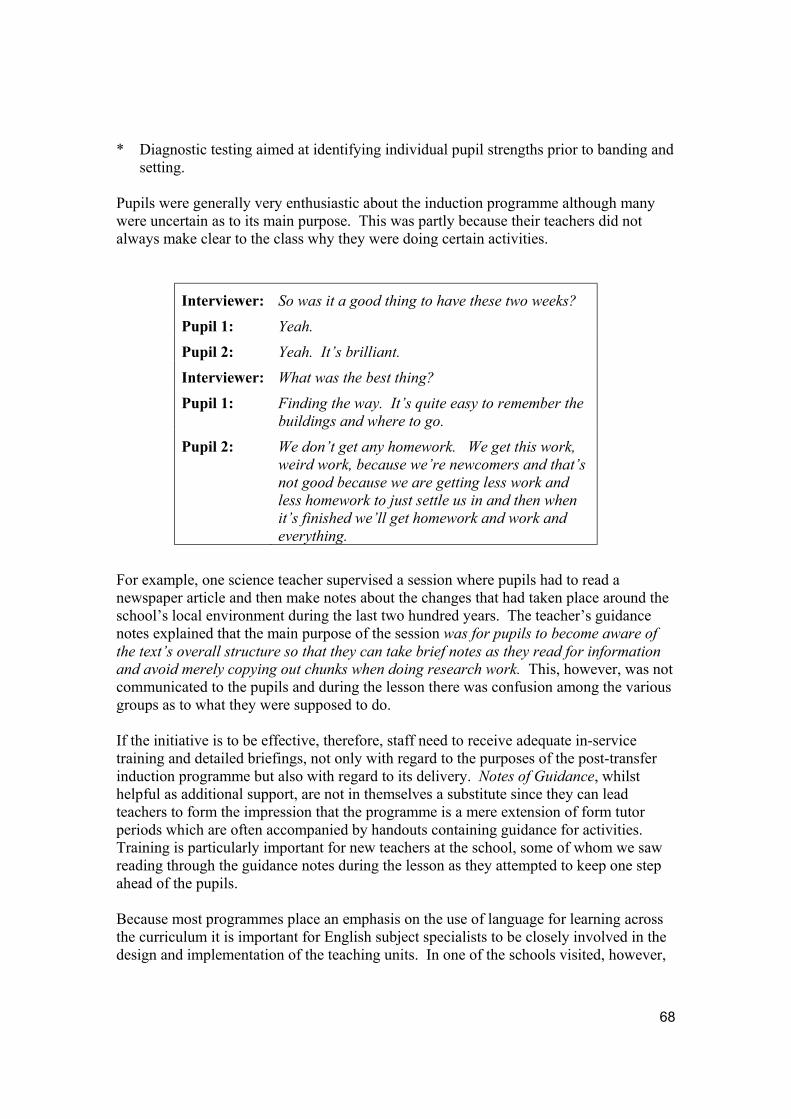
68
* Diagnostic testing aimed at identifying individual pupil strengths prior to banding and setting.
Pupils were generally very enthusiastic about the induction programme although many were uncertain as to its main purpose. This was partly because their teachers did not always make clear to the class why they were doing certain activities.
Interviewer: So was it a good thing to have these two weeks?
Pupil 1: Yeah.
Pupil 2: Yeah. It’s brilliant.
Interviewer: What was the best thing?
Pupil 1: Finding the way. It’s quite easy to remember the buildings and where to go.
Pupil 2: We don’t get any homework. We get this work, weird work, because we’re newcomers and that’s not good because we are getting less work and less homework to just settle us in and then when it’s finished we’ll get homework and work and everything.
For example, one science teacher supervised a session where pupils had to read a newspaper article and then make notes about the changes that had taken place around the school’s local environment during the last two hundred years. The teacher’s guidance notes explained that the main purpose of the session was for pupils to become aware of the text’s overall structure so that they can take brief notes as they read for information and avoid merely copying out chunks when doing research work. This, however, was not communicated to the pupils and during the lesson there was confusion among the various groups as to what they were supposed to do. If the initiative is to be effective, therefore, staff need to receive adequate in-service training and detailed briefings, not only with regard to the purposes of the post-transfer induction programme but also with regard to its delivery. Notes of Guidance, whilst helpful as additional support, are not in themselves a substitute since they can lead teachers to form the impression that the programme is a mere extension of form tutor periods which are often accompanied by handouts containing guidance for activities. Training is particularly important for new teachers at the school, some of whom we saw reading through the guidance notes during the lesson as they attempted to keep one step ahead of the pupils. Because most programmes place an emphasis on the use of language for learning across the curriculum it is important for English subject specialists to be closely involved in the design and implementation of the teaching units. In one of the schools visited, however,

69
the English department had opted out of the programme because of the need to concentrate on the Key Stage 3 strategy. In another school both mathematics and science departments had declined to participate for similar reasons. When some departments are not involved there is an added danger that the skills taught during the induction programme will not be reinforced by subsequent use. This happened, for example, after the exercise on note taking where, during the course of subsequent lessons on the same day, these pupils did not make another note. Consequently, none of the pupils during interview were able to demonstrate either an awareness of the point of the exercise or demonstrate the ability to apply the knowledge and skills gained in this session to other parts of the curriculum. Post-transfer induction programmes clearly have considerable potential but need much greater investment of staff time, both for training and for implementation. Like other transfer initiatives knowledge gained by some teachers about certain pupils was not generally passed on to colleagues in other curriculum areas, either because of the rigidity of departmental structures or because the activity itself was not given sufficient priority against the competing demands of other Key Stage 3 initiatives. In some of the Education Action Zones visited the reluctance of English, mathematics and science departments to participate fully in the post-induction programmes was overcome by extending the role of the learning mentors. Initially, the task of these ancillary staff was to support pupils at risk by attempting to reduce truancy and offering help with personal problems both in and out of school. We encountered cases where training was being given so that these mentors could support learning by helping pupils apply what was learned in the post-induction programme to other curriculum areas. One Y7 coordinator, for example, had introduced the concept of learning styles and trained the mentor to represent the homework set in mathematics in ways which reflected pupils’ different preferences. Even when little attempt was made to ensure that these generic skills were applied to most parts of the curriculum, pupils still reported that they valued these post transfer induction programmes as a means of learning what it was like to become a secondary pupil. It gave them confidence to cope with their new environment, helped them to meet new staff in a more relaxed atmosphere than in subject classes and taught them how to plan and organise their work. One interesting finding concerned the administration of further diagnostic tests during the second week of the induction programme. We had assumed that pupils would have found the experience distressing and would express considerable anxiety about the effects of being placed with a fresh set of pupils as a consequence of the resulting banding and setting. However pupils said that although they found the Cognitive Aptitude Tests difficult, they preferred their use for setting and banding to either their primary teacher’s ratings or the National Curriculum test results. Mainly, as the following extract from an interview with the pupils illustrates, this was because they felt that the CATs’ assessment, although difficult, offered a ‘level playing field’ unlike the situation in their respective primary schools where performance in the Y6 tests was dependent on the approach adopted by the teacher. Some primary schools, for example, had devoted a large part of the Autumn and Spring terms to revision, while others had only begun this process in the
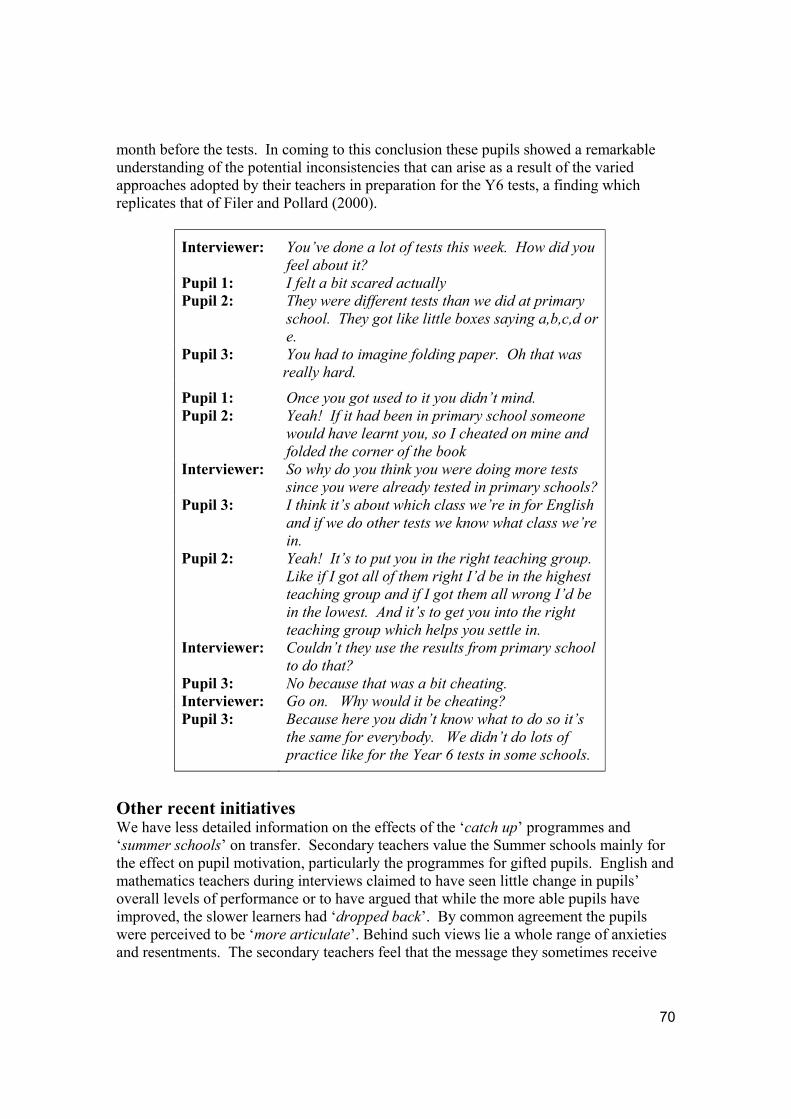
70
month before the tests. In coming to this conclusion these pupils showed a remarkable understanding of the potential inconsistencies that can arise as a result of the varied approaches adopted by their teachers in preparation for the Y6 tests, a finding which replicates that of Filer and Pollard (2000).
Interviewer: You’ve done a lot of tests this week. How did you feel about it?
Pupil 1: I felt a bit scared actually Pupil 2: They were different tests than we did at primary
school. They got like little boxes saying a,b,c,d or e.
Pupil 3: You had to imagine folding paper. Oh that was really hard.
Pupil 1: Once you got used to it you didn’t mind. Pupil 2: Yeah! If it had been in primary school someone
would have learnt you, so I cheated on mine and folded the corner of the book
Interviewer: So why do you think you were doing more tests since you were already tested in primary schools?
Pupil 3: I think it’s about which class we’re in for English and if we do other tests we know what class we’re in.
Pupil 2: Yeah! It’s to put you in the right teaching group. Like if I got all of them right I’d be in the highest teaching group and if I got them all wrong I’d be in the lowest. And it’s to get you into the right teaching group which helps you settle in.
Interviewer: Couldn’t they use the results from primary school to do that?
Pupil 3: No because that was a bit cheating. Interviewer: Go on. Why would it be cheating? Pupil 3: Because here you didn’t know what to do so it’s
the same for everybody. We didn’t do lots of practice like for the Year 6 tests in some schools.
Other recent initiatives We have less detailed information on the effects of the ‘catch up’ programmes and ‘summer schools’ on transfer. Secondary teachers value the Summer schools mainly for the effect on pupil motivation, particularly the programmes for gifted pupils. English and mathematics teachers during interviews claimed to have seen little change in pupils’ overall levels of performance or to have argued that while the more able pupils have improved, the slower learners had ‘dropped back’. By common agreement the pupils were perceived to be ‘more articulate’. Behind such views lie a whole range of anxieties and resentments. The secondary teachers feel that the message they sometimes receive

71
from the LEA was that ‘we have sorted out Key Stage 2, if any problems remain it must be down to you’. Some are under considerable pressure to deliver on the Y7 Progress Tests and there remains a degree of scepticism regarding the interpretation of attainment levels, as illustrated by one science teacher’s comment that ‘We did this group marking exercise - the primary teachers said it was a clear 5 but we had it down for a 3 at the most’. A second, although small-scale, strand of the present study concerned innovative uses of ICT to support transfer. We circulated LEAs to ask for examples of innovative practice and have made use of BECTA’s ICT Research Network in an attempt to identify cases for further investigation. Half a dozen schools were identified in this way, contacted by telephone and agreed to provide details of their uses of ICT at transfer. Some of this information has now been entered on the transfer website. By far the greatest use of technology has been to improve the transfer of information between the secondary transfer schools and their feeder primaries. Here Essex, Suffolk and Durham have been in the forefront of developments. Some schools have made use of e-mail to support ‘buddying’ arrangements whereby pupils in the current Year 6 are allocated a buddy from among the current Year 7 pupils. This arrangement is continued after transfer. More innovative uses of the technology, such as setting up video-conferencing to allow secondary specialists to teach across the whole of the feeder schools, or communicating by e-mail data from science experiments where each feeder primary school investigated the effect of an independent variable under different conditions are relatively infrequent. One reason may be the delay in converting primary schools to broadband as well as the ability of some LEAs as providers to support the more advanced uses of the technology. Despite this limitation, pupils’ attitudes to ICT were higher than those recorded for the three core subjects and these positive differences were maintained both before and after transfer. Some suggestions and conclusions for transfer 1. The Social and the Academic. In general, transfer schools now have a broader range
of liaison activities in place for new pupils, both before and after transfer. Besides induction days there are often special counselling sessions for pupils identified as being ‘at risk’, summer catch up classes for low achieving pupils and ‘Arts’ summer schools for the gifted. Some schools have ‘buddy’ systems with Y7 pupils e-mailing Y6 peers and then keeping these contacts in Y7 and Y8.
There is little evidence that schools do more with Y6 test scores than use them for setting and banding. In the transfer schools, target setting is usually done by using the CATs tests or other standardised measures, because schools believe these are better predictors of performance at KS3 and GCSE than the KS2 statutory tests or the Y6 teacher assessments. This judgement is arrived at, in part, because schools claim that the teaching groups constructed from the available primary data tend to be less stable, particularly in cases where the Y7 intake is drawn from a large number of primary schools. Using CATs’ results, therefore, means that the forms and sets are unlikely to undergo rearrangement during the course of the year, avoiding the necessity of pupils
72
having to adjust to new teachers and perhaps break existing friendships. Where Y6 results are used, however, not all LEAs give sufficient support to schools in ensuring earlier and quicker transfer of relevant information using information technology.
2. Continuities and discontinuities. Transfer schools still have difficulty in striking a
balance between the need to provide new and exciting challenges in the work they set Y7 pupils while at the same time ensuring a smooth progression between primary and secondary school and meeting KS3 targets. Bridging Units are the main means of linking work before and after transfer but knowledge gained in one subject area is rarely shared with colleagues elsewhere. Units in all three core subjects tend to be difficult to manage and some pupils react against what they perceive to be extended primary work now that they are at big school. Bridging Units can also create problems if the transfer school receives pupils from a large number of feeder schools.
Post-induction weeks appear to be a very effective way of helping pupils cope with the discontinuities of secondary schooling while allowing teachers to get to know something of their new pupils’ capabilities, interests etc. Effective post-transfer induction programmes help create a sense that learning in secondary school is different from that experienced at primary and that it requires pupils to take greater responsibility for its management. They can provide a practical demonstration of the status passage taking place at transfer, marking the shift from child to young adult. They are best carried out as a cross-curricular activity, rather than situated mainly within PSHE, since this gives pupils the opportunity to transfer and apply similar skills across different subjects as well as helping teachers to appreciate similarities and differences in the approaches to teaching and learning used by colleagues from other departments.
3. Curriculum and pedagogy. Secondary schools now have a more constructive view
of the teaching taking place in primary schools, particularly with respect to the Literacy Hour and daily mathematics lesson. The timing of these exchanges, which at present mostly take place in the final weeks of the summer term prior to transfer, can offer a distorted view of current primary practice. Exchange visits, spread throughout the school year, and involving peer observation in both Y6 and Y7 classes, appear to be one of the most successful ways of promoting better understanding between the two phases. There is, however, too little focus on exploring specific pedagogic strategies that are known from research to improve pupil attainment and motivation. These include amongst other things, * helping pupils to work together cooperatively, * the effective use of appropriate questioning techniques and * the capacity of pupils to evaluate their own learning.
4. Balancing assessment data and professional judgements. The most significant change since Phase I of our research has been the rapid increase in the use of Bridging Units. In too many cases, however, these tend to be seen by secondary teachers as a way of reassuring pupils that the work at secondary school will not be too different from that encountered in Y6 and not as a means of promoting increased

73
continuity. Teachers in both primary and secondary phases expressed a willingness to explore ways of improving the effectiveness of such initiatives. In practice, the pressures of an overloaded curriculum, the various requirements associated with the new reforms and the demands and consequences of the statutory assessments meant that the teachers were limited in the amount of time they could make available. The senior management at secondary level was also less likely to afford such transfer initiatives high priority, if the school’s GCSE results continued to show a healthy upward trend. What is not appreciated in such cases is that these improvements in academic performance are often gained at the expense of deteriorating pupil attitudes towards school and towards core subjects. Traditionally, and target setting exaggerates this trend, secondary schools have deemed pupils to be at risk if they performed poorly academically or if their behaviour was anti-social and disruptive. There are, it would appear, another group of pupils, mainly boys, who reach their targets, are generally cooperative and well behaved, but who are increasingly disillusioned by the offerings of the National Curriculum as it is represented in today’s classrooms. Schools need to identify and monitor such pupils more carefully.
5. Developing coherence across subject departments. An important determinant of
successful transfer is the degree of coherence that is established between the different subject departments in the secondary school so that they can plan for the continuities and discontinuities across the different disciplines. We have noted examples of where this coherence was lacking. As a result there was likely to be little flexibility in timetabling so that promising initiatives were abandoned or compromised. For this reason post-transfer activity was often arranged outside the main timetable during tutor periods or as an adjunct of PSHE lessons. With such arrangements we found little evidence of transfer of learning to the main subjects. Teachers of mathematics and science, and to a lesser degree English, cited the pressures of coping with new reforms, meeting assessment targets etc., as reasons why they could not participate in such programmes. Unless ways can be found to secure the greater involvement of all Y7 staff in such post-transfer activities, and to provide them with sufficient training, then the current efforts expended by small groups of enthusiastic teachers are not likely to yield significant long-term benefits.
6. The critical importance of evaluation. Few of the 88 transfer initiatives in Table
3.1 had been evaluated by those most closely involved. The exception seemed to occur among those placing entries on the website among Education Action Zones (EAZs) where the central team had time and resources to support the participating schools. Elsewhere, including some of the case studies, teachers again cited the heavy reform programme and the pressure to meet assessment targets as the main reasons why little or no evaluation was undertaken. They also argued that they lacked sufficient knowledge or skill to attempt such activity. The evidence suggests therefore that LEAs have a crucial role to play in supporting transfer, particularly in helping to select appropriate instruments and to gather and analyse data on the impact of the various initiatives taken by schools. However, some advisers told us that they faced a dilemma when asked by schools to help in this way since OFSTED inspectors were in the habit of challenging their LEAs during inspections as to why their human

74
resources were not being fully used to maximise support for weak or failing schools. Few LEAs actually allocated specific periods of inspector/adviser’s time to help evaluate transfer initiatives even though as in the case of the nine authorities taking part in the case studies all had earmarked funding within the EDP. Without thorough evaluation it is often the case that the rhetoric of school-based initiatives outstrips the reality. If schools lack the time and the necessary skills to conduct evaluations of transfer and LEA advisers are unable or unwilling to take on part of the evaluator’s role, then (on past experience) many of the current transfer initiatives are likely to be superficial and largely ineffective.
All this suggests that if further progress on transfer is to come about in the light of the above suggestions, then the current curriculum, assessment and inspection frameworks needs to be re-appraised to reduce perceived pressures on teachers and give them greater encouragement to innovate. This might lead, to a reduction in the degree of teacher frustration that we often encountered at interview and facilitate the subsequent development of frameworks for learning, building on the work undertaken within the Foundation Subject Strand of the Key Stage 3 Strategy, but incorporating more cross-curricular secondary initiatives, which we consider to be an essential feature of future transfer programmes.

75
Chapter 4:
Managing Institutional and Personal Transitions - Developing the Work in Schools
Jean Rudduck, Mary Berry, Helen Demetriou and Paul Goalen
This strand of the project was shaped by the recognition that we need young people who can sustain, through primary and secondary schooling, * an enthusiasm for learning * confidence in themselves as learners * a sense of purpose and achievement * a sense of progression in responsibility and autonomy that matches their increase
in age and social maturity. Much more attention has been given to cross-institutional transfer than to within-school transition experiences but teachers, policy makers and researchers are increasingly aware of the importance of giving more attention to transitions if pupils are to sustain their commitment to learning at difficult moments in their school careers. Transitions can also lead to changes in pupils’ developing sense of self and self-as-learner as they move from one year to another, or from one stage of education to another. Our three projects focused on different transition experiences: 1. the relationship between friendships, independence and learning as pupils move
from school to school and year to year; 2. the transition from one learner identity to another (e.g. from ‘dosser’ to ‘worker’); 3. year to year transition (especially from Year 7 to Year 8) within the same school) These three topics were identified in earlier research involving students’ perspectives on learning and schooling; they are important but often overlooked. For example, Project 1 was identified in work on transfer where friendship was often seen in negative terms, as a signal that ‘certain young people’ needed ‘separating’. By contrast, our own interviews with pupils in both primary and secondary schools suggested that friendships could be important sources of learning support for many pupils and that teachers might usefully take account of pupils’ constructions of friendship in relation to their commitment to learning and their progress. In addition, the capacity to make distinctions between the social and academic dimensions of friendship seemed to be a mark of pupils’ growing social maturity and independence. Project 2 emerged from earlier work (Rudduck et al, 1996) which showed that not all young people who were switched off wanted to remain so; pupils talked about the difficulties of swimming against the tide of peer group pressure and ‘getting back on
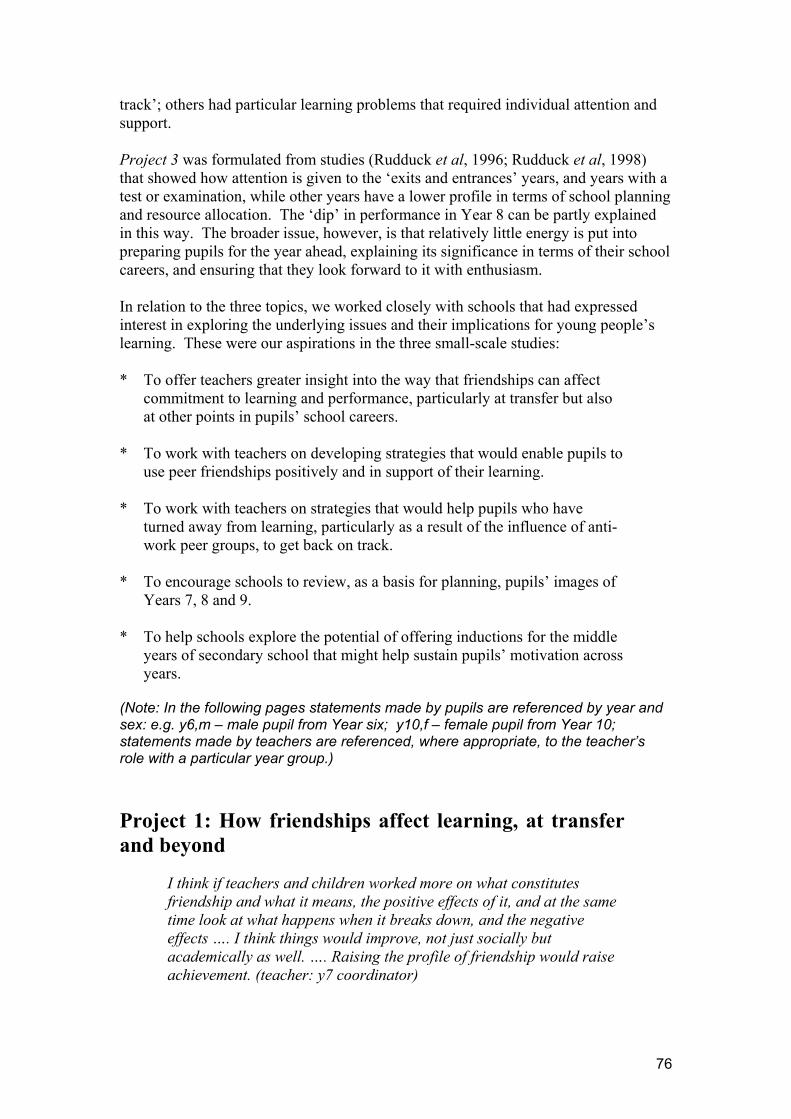
76
track’; others had particular learning problems that required individual attention and support. Project 3 was formulated from studies (Rudduck et al, 1996; Rudduck et al, 1998) that showed how attention is given to the ‘exits and entrances’ years, and years with a test or examination, while other years have a lower profile in terms of school planning and resource allocation. The ‘dip’ in performance in Year 8 can be partly explained in this way. The broader issue, however, is that relatively little energy is put into preparing pupils for the year ahead, explaining its significance in terms of their school careers, and ensuring that they look forward to it with enthusiasm. In relation to the three topics, we worked closely with schools that had expressed interest in exploring the underlying issues and their implications for young people’s learning. These were our aspirations in the three small-scale studies: * To offer teachers greater insight into the way that friendships can affect
commitment to learning and performance, particularly at transfer but also at other points in pupils’ school careers.
* To work with teachers on developing strategies that would enable pupils to
use peer friendships positively and in support of their learning. * To work with teachers on strategies that would help pupils who have
turned away from learning, particularly as a result of the influence of anti-work peer groups, to get back on track.
* To encourage schools to review, as a basis for planning, pupils’ images of
Years 7, 8 and 9. * To help schools explore the potential of offering inductions for the middle
years of secondary school that might help sustain pupils’ motivation across years.
(Note: In the following pages statements made by pupils are referenced by year and sex: e.g. y6,m – male pupil from Year six; y10,f – female pupil from Year 10; statements made by teachers are referenced, where appropriate, to the teacher’s role with a particular year group.) Project 1: How friendships affect learning, at transfer and beyond
I think if teachers and children worked more on what constitutes friendship and what it means, the positive effects of it, and at the same time look at what happens when it breaks down, and the negative effects …. I think things would improve, not just socially but academically as well. …. Raising the profile of friendship would raise achievement. (teacher: y7 coordinator)

77
They are not just friends to play with or muck about (with). They are there to help you. (y3,f)
As adults, we often think of schools as being about learning in classrooms but for pupils school is more than that - as a Year 8 pupil explains: ‘I think you need a balance of academic and social thingies together to make someone work really well’. From the perspective of many pupils, being at school is a social occasion as much as an opportunity for academic learning, and friends are the most important part of the social world of school.
Int. What do you look forward to at school, in the morning when you say, ‘Oh I want to go to school because.....’ ?
Y2,b I like seeing my friends when I come to school, and lining up. Y8,g School’s great – apart from the lessons.
Blatchford’s (1998) study of the social dynamics of the playground suggests that there is, in fact, an alternative set of social learnings going on outside the classroom in breaktimes: learning how to initiate activities and work out rules for shaping the behaviours of participants in games, learning how to mediate in disputes, and so on. Interestingly, pupils may not recognise these learnings and do not talk about them as such and, in the current climate of concern about performance and academic standards, they tend to be undervalued by adults. But, as we have seen in the earlier sections of this report, a key issue is the way that schools and pupils balance the social and academic concerns of schooling. Numerous research studies have focused on the nature and dynamic of friendships (see, for example, Newcomb and Brady, 1982; Ladd, 1990; Berndt and Keefe, 1995) but relatively little attention has been given to issues of friendship and performance, where the academic and the social worlds of school are bridged. Nor has there been much exploration of pupils’ perceptions of the links between friendship and performance. Within a project on transfer and transition, our starting point was evidence that at transfer friendships were widely seen (especially by parents) as a means of social support while their potential for academic support tended to be overlooked. The project had two phases: exploratory and developmental. a) The exploratory phase of the study The initial fieldwork was carried our between January and June 2000 by Helen Demetriou, Paul Goalen and Jean Rudduck. The team talked with teachers and pupils in 14 secondary and primary schools. It was not difficult to get pupils and teachers talking about friendships. As Paley (1986) has said, ‘Whenever the discussion touched on fantasy, fairness or friendship (‘the three Fs’ I began to call them), participation zoomed upward’.
We deliberately went into primary schools in order to understand how pupils, pre-transfer, were thinking about friendships and learning and we talked with pupils (and their teachers) in Years 3 and 6 (ie at the start and end of KS2). In secondary schools

78
we talked with pupils (and their teachers) from Years 8 and 10. Year 8 is now widely seen as a year when academic motivation can weaken and Year 10 is, according to pupils, when ‘the stuff that counts’ starts. These seemed good moments in pupils’ school careers to explore the relationship between friendship and performance.
We identified three interesting issues, the first about friendship and gender, the second about friends and schoolwork, and the third about changing patterns of friendship over time. First, clear gender differences emerged in the way that friendships operate
and potentially affect learning: girls tend towards intense relationships with one or two friends and with high and often sustained emotional distress when friendships go wrong; the emotional fall out and the antipathy can prevent them from working constructively. In contrast, boys tend towards looser associations with an extended group of friends and disputes are quickly over and quickly forgotten; schoolwork is less susceptible, therefore, to fall-out from the break-up of friendships.
This observation, although interesting and relevant to our understanding of gendered patterns of progress, fell outside our immediate concern with transfer and transition and we are not therefore expanding on it in this report. Second, we learned that many pupils are intelligently articulate about
friends whom they work well with and friends whom they do not work well with. They use friends in different ways, sometimes valuing complementary skills and sometimes different skills, depending on the nature of particular tasks or the demands of particular subjects. In the main, teachers are unaware of pupils’ perceptions of friendship and learning and are therefore unable to build on it in supporting different learning preferences.
Third, the data from older pupils indicated, not surprisingly perhaps, that academic dependence on friends can narrow and become quite specific as pupils get older.
Here we use some of the interview data to illustrate the different perspectives offered by pupils on these two issues. The challenge is to think how we can make use of the information – in relation to grouping practices at transfer and later – in ways that support pupils’ learning and help them to work constructively with others. i) What pupils say about friends they work well with and friends they don’t work well with. Pupils often offer detailed commentaries on friends as working partners. Where teachers may use a broad brush policy for grouping, pupils offer a fine grained picture which suggests that one policy, for all occasions and for all pupils, may not work. Most pupils want to have friends in the same year group but not always in the same class or at the next desk: it depends on the subject, the nature of the task, and their understanding of their own capacity for self-discipline and distraction. Many are keenly aware of their own weaknesses in concentrating and know that they are not
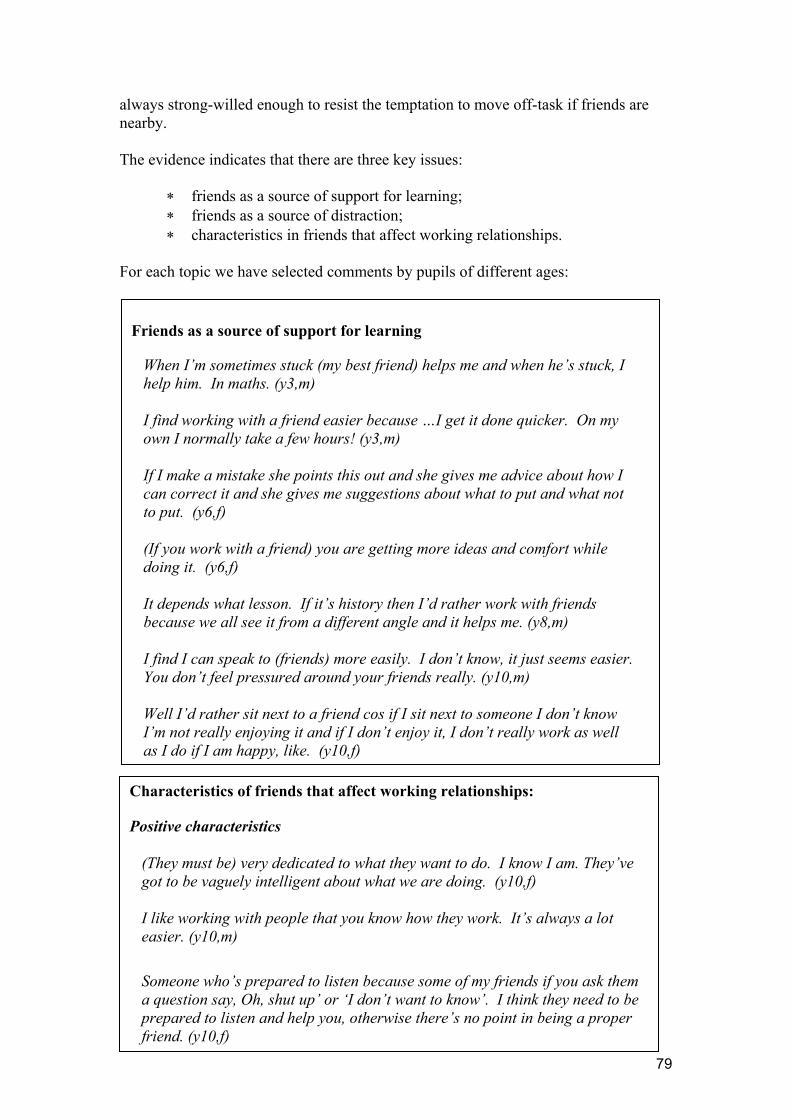
79
always strong-willed enough to resist the temptation to move off-task if friends are nearby.
The evidence indicates that there are three key issues:
∗ friends as a source of support for learning; ∗ friends as a source of distraction; ∗ characteristics in friends that affect working relationships.
For each topic we have selected comments by pupils of different ages:
Friends as a source of support for learning
When I’m sometimes stuck (my best friend) helps me and when he’s stuck, I help him. In maths. (y3,m) I find working with a friend easier because …I get it done quicker. On my own I normally take a few hours! (y3,m) If I make a mistake she points this out and she gives me advice about how I can correct it and she gives me suggestions about what to put and what not to put. (y6,f) (If you work with a friend) you are getting more ideas and comfort while doing it. (y6,f) It depends what lesson. If it’s history then I’d rather work with friends because we all see it from a different angle and it helps me. (y8,m) I find I can speak to (friends) more easily. I don’t know, it just seems easier. You don’t feel pressured around your friends really. (y10,m) Well I’d rather sit next to a friend cos if I sit next to someone I don’t know I’m not really enjoying it and if I don’t enjoy it, I don’t really work as well as I do if I am happy, like. (y10,f)
Characteristics of friends that affect working relationships: Positive characteristics
(They must be) very dedicated to what they want to do. I know I am. They’ve got to be vaguely intelligent about what we are doing. (y10,f) I like working with people that you know how they work. It’s always a lot easier. (y10,m)
Someone who’s prepared to listen because some of my friends if you ask them a question say, Oh, shut up’ or ‘I don’t want to know’. I think they need to be prepared to listen and help you, otherwise there’s no point in being a proper friend. (y10,f)

80
Friends as a source of distraction or irritation When we’re in silent reading (Oliver) starts telling me funny things and it’s rather annoying because he puts me off when I’m trying to read. (y3,m) (Victor) is one of my friends but he sometimes gets on my nerves. When we’re working he puts me off my colouring by saying, ‘You can’t get green walls’. (y3,f)
Some of the girls are my friends but you don’t really work with them because they’re always telling you they want to work and always telling you off because they’re girls. (y6,m)
If you don’t know many people in your class I think that you will get on more because there will be nothing else to do. If you are with your friends you may have a little laugh and you won’t get as much done. (y8,m) It was quite hard to work (after transfer) when I had my old friends. I sometimes got distracted a bit because I was really friendly with them. I was with them in every subject and got a bit fed up, … If I’m there on my own I know I can’t talk to anyone so I’ve got to do the work. (y10,f)
Characteristics of friends that affect working relationships:
Negative characteristics
He is a good friend … but sometimes he doesn’t cooperate very well. Sometimes he doesn’t listen that well and sometimes he does – he’s kind of half and half. (y6,m ) Some people I don’t get on with because our ideas are so different that we can’t work together. Usually you can adjust and you can compromise. (y10,f) He’s one of my friends but he messes around quite a lot. I sit next to him in science and when we do experiments I end up working with him. He’s a nice person but he doesn’t have much of an attention span so whenever we are using water there’s a problem because he’ll be squirting water everywhere. We often get strange results. (y 10,m)
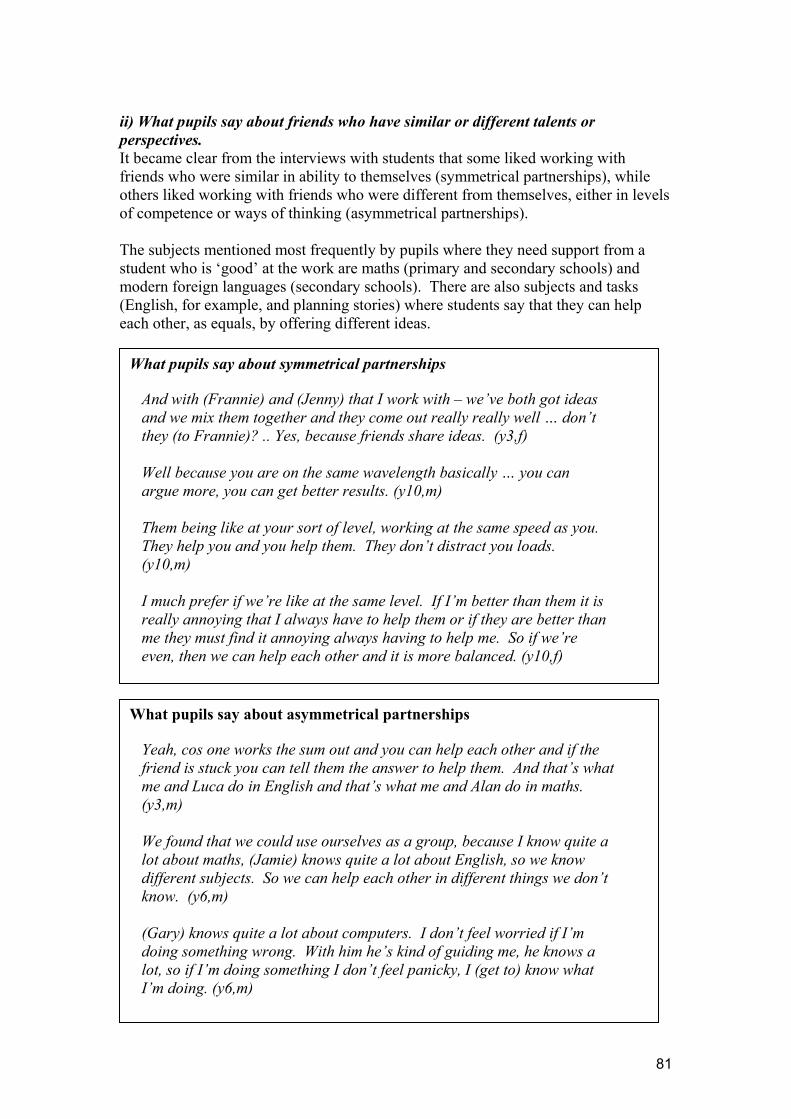
81
ii) What pupils say about friends who have similar or different talents or perspectives. It became clear from the interviews with students that some liked working with friends who were similar in ability to themselves (symmetrical partnerships), while others liked working with friends who were different from themselves, either in levels of competence or ways of thinking (asymmetrical partnerships). The subjects mentioned most frequently by pupils where they need support from a student who is ‘good’ at the work are maths (primary and secondary schools) and modern foreign languages (secondary schools). There are also subjects and tasks (English, for example, and planning stories) where students say that they can help each other, as equals, by offering different ideas.
What pupils say about symmetrical partnerships And with (Frannie) and (Jenny) that I work with – we’ve both got ideas and we mix them together and they come out really really well … don’t they (to Frannie)? .. Yes, because friends share ideas. (y3,f)
Well because you are on the same wavelength basically … you can argue more, you can get better results. (y10,m) Them being like at your sort of level, working at the same speed as you. They help you and you help them. They don’t distract you loads. (y10,m) I much prefer if we’re like at the same level. If I’m better than them it is really annoying that I always have to help them or if they are better than me they must find it annoying always having to help me. So if we’re even, then we can help each other and it is more balanced. (y10,f)
What pupils say about asymmetrical partnerships
Yeah, cos one works the sum out and you can help each other and if the friend is stuck you can tell them the answer to help them. And that’s what me and Luca do in English and that’s what me and Alan do in maths. (y3,m) We found that we could use ourselves as a group, because I know quite a lot about maths, (Jamie) knows quite a lot about English, so we know different subjects. So we can help each other in different things we don’t know. (y6,m) (Gary) knows quite a lot about computers. I don’t feel worried if I’m doing something wrong. With him he’s kind of guiding me, he knows a lot, so if I’m doing something I don’t feel panicky, I (get to) know what I’m doing. (y6,m)
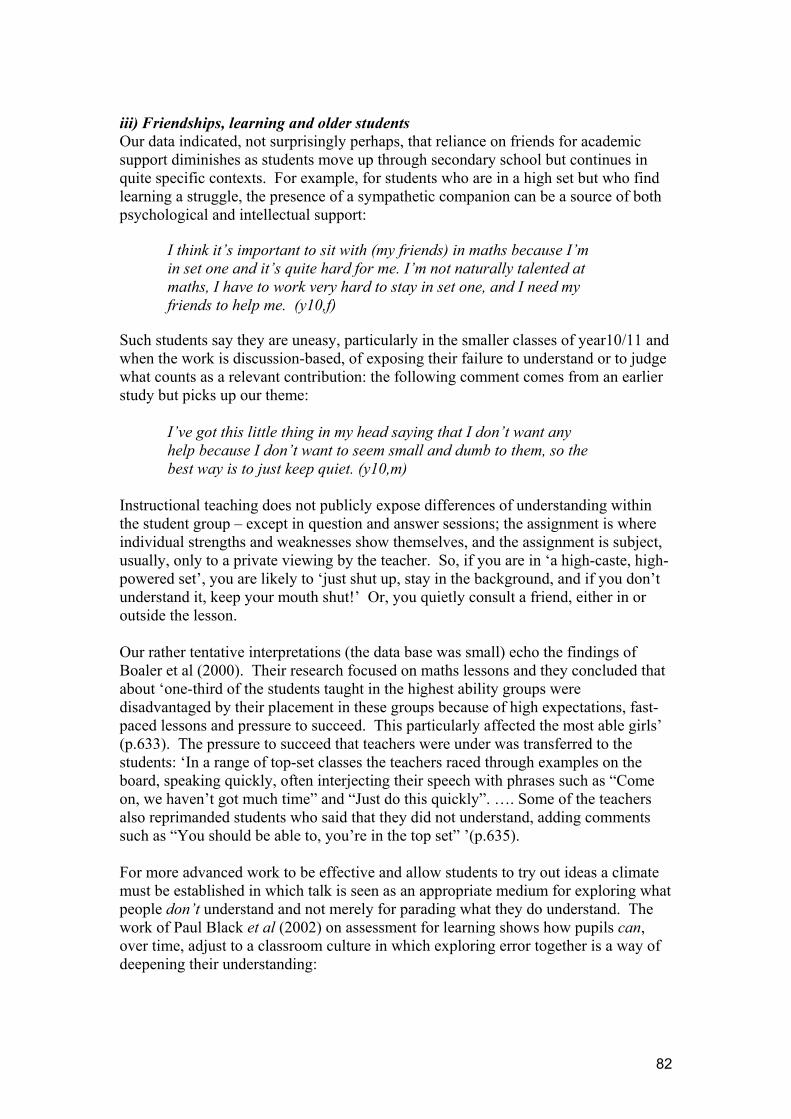
82
iii) Friendships, learning and older students Our data indicated, not surprisingly perhaps, that reliance on friends for academic support diminishes as students move up through secondary school but continues in quite specific contexts. For example, for students who are in a high set but who find learning a struggle, the presence of a sympathetic companion can be a source of both psychological and intellectual support:
I think it’s important to sit with (my friends) in maths because I’m in set one and it’s quite hard for me. I’m not naturally talented at maths, I have to work very hard to stay in set one, and I need my friends to help me. (y10,f)
Such students say they are uneasy, particularly in the smaller classes of year10/11 and when the work is discussion-based, of exposing their failure to understand or to judge what counts as a relevant contribution: the following comment comes from an earlier study but picks up our theme:
I’ve got this little thing in my head saying that I don’t want any help because I don’t want to seem small and dumb to them, so the best way is to just keep quiet. (y10,m)
Instructional teaching does not publicly expose differences of understanding within the student group – except in question and answer sessions; the assignment is where individual strengths and weaknesses show themselves, and the assignment is subject, usually, only to a private viewing by the teacher. So, if you are in ‘a high-caste, high-powered set’, you are likely to ‘just shut up, stay in the background, and if you don’t understand it, keep your mouth shut!’ Or, you quietly consult a friend, either in or outside the lesson. Our rather tentative interpretations (the data base was small) echo the findings of Boaler et al (2000). Their research focused on maths lessons and they concluded that about ‘one-third of the students taught in the highest ability groups were disadvantaged by their placement in these groups because of high expectations, fast-paced lessons and pressure to succeed. This particularly affected the most able girls’ (p.633). The pressure to succeed that teachers were under was transferred to the students: ‘In a range of top-set classes the teachers raced through examples on the board, speaking quickly, often interjecting their speech with phrases such as “Come on, we haven’t got much time” and “Just do this quickly”. …. Some of the teachers also reprimanded students who said that they did not understand, adding comments such as “You should be able to, you’re in the top set” ’(p.635). For more advanced work to be effective and allow students to try out ideas a climate must be established in which talk is seen as an appropriate medium for exploring what people don’t understand and not merely for parading what they do understand. The work of Paul Black et al (2002) on assessment for learning shows how pupils can, over time, adjust to a classroom culture in which exploring error together is a way of deepening their understanding:
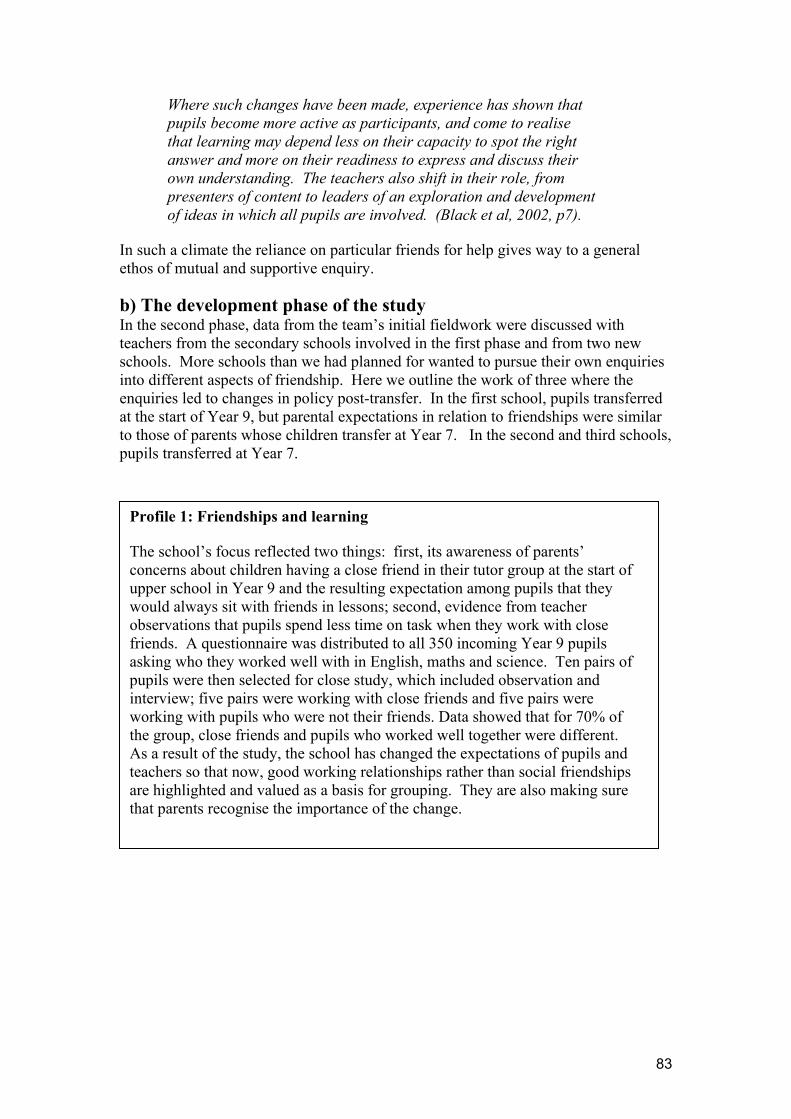
83
Where such changes have been made, experience has shown that pupils become more active as participants, and come to realise that learning may depend less on their capacity to spot the right answer and more on their readiness to express and discuss their own understanding. The teachers also shift in their role, from presenters of content to leaders of an exploration and development of ideas in which all pupils are involved. (Black et al, 2002, p7).
In such a climate the reliance on particular friends for help gives way to a general ethos of mutual and supportive enquiry. b) The development phase of the study In the second phase, data from the team’s initial fieldwork were discussed with teachers from the secondary schools involved in the first phase and from two new schools. More schools than we had planned for wanted to pursue their own enquiries into different aspects of friendship. Here we outline the work of three where the enquiries led to changes in policy post-transfer. In the first school, pupils transferred at the start of Year 9, but parental expectations in relation to friendships were similar to those of parents whose children transfer at Year 7. In the second and third schools, pupils transferred at Year 7.
Profile 1: Friendships and learning The school’s focus reflected two things: first, its awareness of parents’ concerns about children having a close friend in their tutor group at the start of upper school in Year 9 and the resulting expectation among pupils that they would always sit with friends in lessons; second, evidence from teacher observations that pupils spend less time on task when they work with close friends. A questionnaire was distributed to all 350 incoming Year 9 pupils asking who they worked well with in English, maths and science. Ten pairs of pupils were then selected for close study, which included observation and interview; five pairs were working with close friends and five pairs were working with pupils who were not their friends. Data showed that for 70% of the group, close friends and pupils who worked well together were different. As a result of the study, the school has changed the expectations of pupils and teachers so that now, good working relationships rather than social friendships are highlighted and valued as a basis for grouping. They are also making sure that parents recognise the importance of the change.
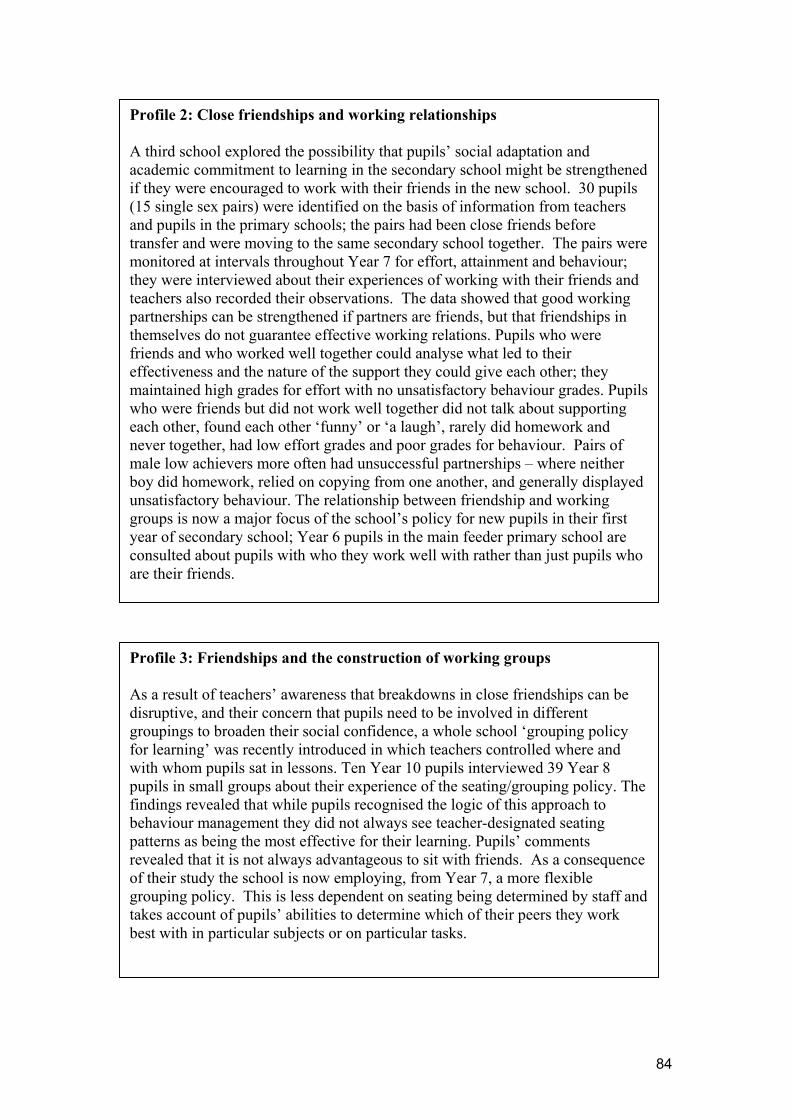
84
Profile 2: Close friendships and working relationships A third school explored the possibility that pupils’ social adaptation and academic commitment to learning in the secondary school might be strengthened if they were encouraged to work with their friends in the new school. 30 pupils (15 single sex pairs) were identified on the basis of information from teachers and pupils in the primary schools; the pairs had been close friends before transfer and were moving to the same secondary school together. The pairs were monitored at intervals throughout Year 7 for effort, attainment and behaviour; they were interviewed about their experiences of working with their friends and teachers also recorded their observations. The data showed that good working partnerships can be strengthened if partners are friends, but that friendships in themselves do not guarantee effective working relations. Pupils who were friends and who worked well together could analyse what led to their effectiveness and the nature of the support they could give each other; they maintained high grades for effort with no unsatisfactory behaviour grades. Pupils who were friends but did not work well together did not talk about supporting each other, found each other ‘funny’ or ‘a laugh’, rarely did homework and never together, had low effort grades and poor grades for behaviour. Pairs of male low achievers more often had unsuccessful partnerships – where neither boy did homework, relied on copying from one another, and generally displayed unsatisfactory behaviour. The relationship between friendship and working groups is now a major focus of the school’s policy for new pupils in their first year of secondary school; Year 6 pupils in the main feeder primary school are consulted about pupils with who they work well with rather than just pupils who are their friends.
Profile 3: Friendships and the construction of working groups As a result of teachers’ awareness that breakdowns in close friendships can be disruptive, and their concern that pupils need to be involved in different groupings to broaden their social confidence, a whole school ‘grouping policy for learning’ was recently introduced in which teachers controlled where and with whom pupils sat in lessons. Ten Year 10 pupils interviewed 39 Year 8 pupils in small groups about their experience of the seating/grouping policy. The findings revealed that while pupils recognised the logic of this approach to behaviour management they did not always see teacher-designated seating patterns as being the most effective for their learning. Pupils’ comments revealed that it is not always advantageous to sit with friends. As a consequence of their study the school is now employing, from Year 7, a more flexible grouping policy. This is less dependent on seating being determined by staff and takes account of pupils’ abilities to determine which of their peers they work best with in particular subjects or on particular tasks.

85
c) Review We gave some evidence earlier of the way that friends can constrain each others’ learning. But both our own and earlier research highlight the potentially positive aspects of friendship. For instance, Ladd (1990) showed that primary school students with more classroom friends on entering school, students who maintained their friendships over time, and students who readily made new friends tended to have more favourable perceptions of school as well as higher levels of performance. Wentzel and Caldwell (1997) confirm the common-sense argument that positive, work-oriented groups and pairs strengthen achievement because members offer each other assistance. As Hartup (1996) claimed, ‘friends provide one another with cognitive and social scaffolding’ and Newcomb and Brady (1982) found that in tasks involving work-focused friends there was more extensive exploration and rigorous and mutually-oriented conversation.
Our own data, from pupils and teachers in the participating schools, suggest that pupils themselves are reflective about the social and academic potential of friendships and that consultation with pupils in particular school contexts can offer good guidance for policies on seating and grouping, at transfer and beyond. Pupils are able to distinguish who they work well with on different tasks or in different subjects, and when it is helpful for pupils with similar or complementary skills to work together. The data also show the importance of the informal peer-support systems in the classroom – which teachers may want to legitimise and strengthen. In some settings pupils can feel more comfortable acknowledging their difficulties to a friend than to a teacher and friends will sometimes be able to spend more time explaining approaches and ideas in ways and words that pupils find helpful. As students move up through secondary school, and as setting increases, the possibility of their being in the same set as their friends decreases; on the other hand most students accept and even welcome greater social independence. One situation, however, in which the support of a friend remains important is when students in top sets are not fully confident of their capacity to keep up. Even here, a change in pedagogy – to a less competitive and pressured learning style, where it is acceptable to admit to not understanding something - could help. For a summary of key observations and issues see the end of Chapter 4. Project 2: Helping pupils to re-commit themselves to learning In this study we interpreted ‘transition’ in terms of changing one’s image as learner. We were interested in how tensions and pressures can lead pupils to adopt particular attitudes and persona in school and classroom and the difficulties they have in dropping them:
‘It’s all right saying “Change”; but you can’t just stop like that, can you? (y10, m).
86
A student who seemed to have adopted an anti-boff persona as a way of avoiding tasks which he knew he was not good at acknowledged that messing about had become ‘addictive’. Students who have become the class joker find it particularly difficult to change because their peers have certain expectations of them – as this young woman explained:
I think trouble with me were when I come to school I messed about from day one so people got me as a mess-abouter from day one so like if I didn't mess about, "Oh, you're boring". You know what I mean? (y11,f)
But when it gets to exam time the old magic no longer works; instead of being the popular ‘licensed fool’, students may find themselves rejected by the mates they once entertained. In such a situation, students may find it easier to give up than to try to change direction and catch up with their work. Students can also feel that their image and habits are held in place by their teachers - who have files and memories in which their behaviours, and, indeed, their characters, are indelibly recorded:
.... you mess around ... you get a reputation for yourself as a trouble causer and you can't lose it - it's like there. (y11,m)
Some students in this position understand what is at stake and are often surprisingly insightful and tolerant:
Me personally I’ve brought a reputation upon myself. I’m known to be the class clown and that and it’s got me in a lot of trouble. And so I’ve decided to change and it’s just really hard to, like show the teachers that ‘cos .... and when, like, I went on report, and I got, like, A1, A1, best, top marks. But there’s been some lessons where it’s slipped and they’re (saying) like, ‘Oh, he’s still the same’. I can understand how they feel about that. (y10, m)
It is not surprising that students respect teachers who believe in ‘a fresh start’. One spoke with warmth of a teacher who began the lesson by reminding the class that while their learning needs to be carried forward, each lesson is a clean slate as far as their behaviour is concerned. In the past, a common resort of the desperate teacher or school has been to offer ‘a fresh start’ by transferring a difficult student to another form or another school but those who have experienced such transfer say that students in the new setting know that comers-in are ‘baddies’ and so their reputation travels with them. In another project (see Rudduck et al, 1996) interviews conducted a few weeks before the start of the 16+ exams revealed a lot of regrets from the pupils who had been, for whatever reasons, too laid back about work and/or who had regularly sought to disrupt the work of their classmates. Interestingly, pupils mostly directed the blame to themselves, even though in our view the system had often created the conditions in the first place which led to a non-work persona being adopted. They also tended to see the situation as irredeemable:
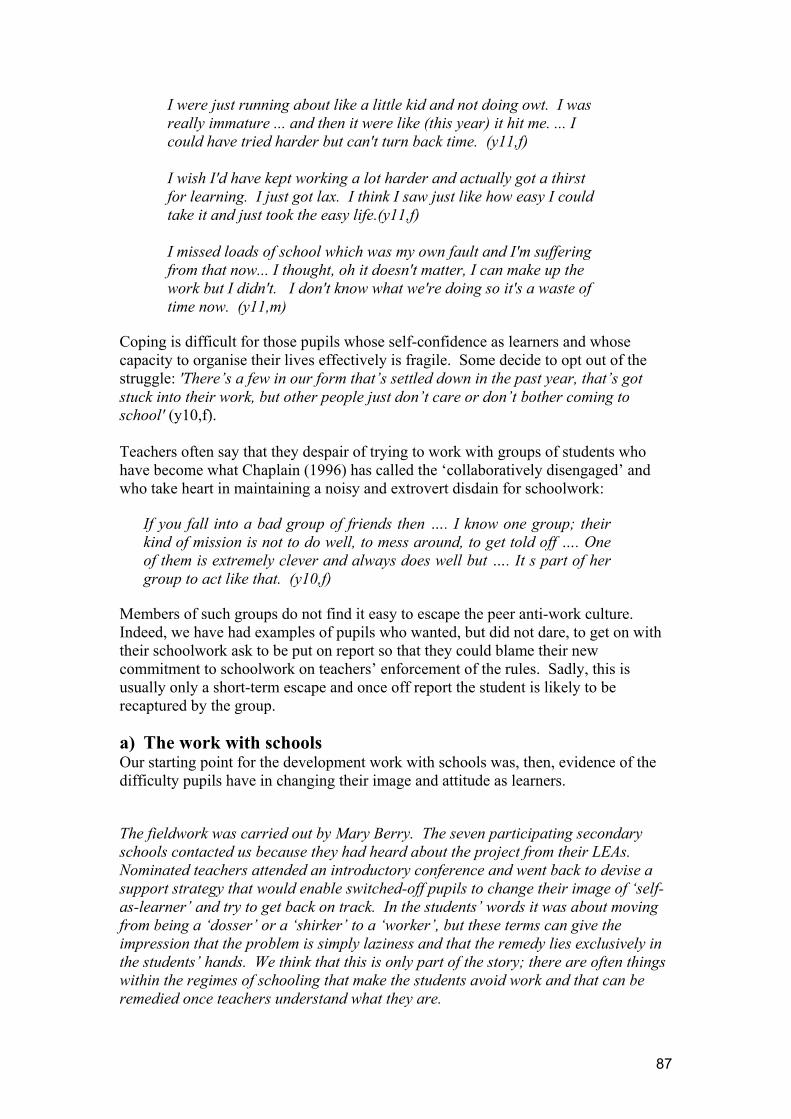
87
I were just running about like a little kid and not doing owt. I was really immature ... and then it were like (this year) it hit me. ... I could have tried harder but can't turn back time. (y11,f)
I wish I'd have kept working a lot harder and actually got a thirst for learning. I just got lax. I think I saw just like how easy I could take it and just took the easy life.(y11,f) I missed loads of school which was my own fault and I'm suffering from that now... I thought, oh it doesn't matter, I can make up the work but I didn't. I don't know what we're doing so it's a waste of time now. (y11,m)
Coping is difficult for those pupils whose self-confidence as learners and whose capacity to organise their lives effectively is fragile. Some decide to opt out of the struggle: 'There’s a few in our form that’s settled down in the past year, that’s got stuck into their work, but other people just don’t care or don’t bother coming to school' (y10,f).
Teachers often say that they despair of trying to work with groups of students who have become what Chaplain (1996) has called the ‘collaboratively disengaged’ and who take heart in maintaining a noisy and extrovert disdain for schoolwork:
If you fall into a bad group of friends then …. I know one group; their kind of mission is not to do well, to mess around, to get told off …. One of them is extremely clever and always does well but …. It s part of her group to act like that. (y10,f)
Members of such groups do not find it easy to escape the peer anti-work culture. Indeed, we have had examples of pupils who wanted, but did not dare, to get on with their schoolwork ask to be put on report so that they could blame their new commitment to schoolwork on teachers’ enforcement of the rules. Sadly, this is usually only a short-term escape and once off report the student is likely to be recaptured by the group. a) The work with schools Our starting point for the development work with schools was, then, evidence of the difficulty pupils have in changing their image and attitude as learners.
The fieldwork was carried out by Mary Berry. The seven participating secondary schools contacted us because they had heard about the project from their LEAs. Nominated teachers attended an introductory conference and went back to devise a support strategy that would enable switched-off pupils to change their image of ‘self-as-learner’ and try to get back on track. In the students’ words it was about moving from being a ‘dosser’ or a ‘shirker’ to a ‘worker’, but these terms can give the impression that the problem is simply laziness and that the remedy lies exclusively in the students’ hands. We think that this is only part of the story; there are often things within the regimes of schooling that make the students avoid work and that can be remedied once teachers understand what they are.

88
There were several common stages that the schools moved through. First they had to identify the ‘disengaged’ students that they were most troubled about. Interestingly, although these students were often displaying, publicly, a disregard for work, behind the façade, in one-to-one discussion, some said that they desperately wanted to change but didn’t know how to. It’s a difficult task: not only do you have to change your image of yourself but also change the images that other people – peers and teachers – hold of you. The next step was to find a way of talking with the target students about the reasons for their disengagement. Some students, of course, are reluctant to open up to someone in the school but may do so with an outsider – whether youth worker or researcher – or in a group discussion. The data might reveal problems with pedagogy, problems in falling behind and the difficulty of catching up, problems in lack of responsibility or opportunities to take initiatives compared with their lives outside school, or a feeling that they are not valued highly by the school. Individually, they may acknowledge that they are part of a group that maintains a collective ‘it’s not cool to work’ attitude and they feel unable to, or frightened of, taking a different line. Then again, some pupils switch off because they have been pushed too hard too early; timing the pressure to work well is important. Having identified the students who were in need of help and found out from them what they thought the source of their disengagement was, it was then time to consider the circumstances that might trigger change and to plan interventions.
The triggers for change tend to be different for different students. For some, the process of consultation may in itself be a turning point, helping students rid themselves of the feeling that ‘they don’t listen to us’. For others, it is moving into what they see as an important year - and ‘important years’ tend to be the years with major tests or examinations. At these moments, some students will manage to change their own behaviours because they realise the time has come when learning needs to be taken seriously. For others, re-assurance about their own capability is what can provide the trigger for change: as one said, ‘SATs [sic] proved to me I could do it’. Others may be able to build a new confidence in themselves by being asked to take on a special role or responsibility, or by being able to use, in the classroom, skills and talents developed outside school that do not usually find a place in the routine curriculum (for instance the student who gained self-respect and the respect of others by being given space to run a lunch-hour workshop for his peers on electronic design). The process of disengagement can be reversed if students feel that significant others in the school are able to see and acknowledge some of their strengths. The next stage was to plan the intervention in ways that fit the context and the needs of the students: * Some schools have found it works when disengaged students are invited to choose
a teacher to be their mentor. This is an extra load for teachers but some say they find it more acceptable knowing that they have been ‘chosen’. The teacher and the student have meetings – initially on a regular basis and later, when trust is established, as the student wants them – where problems with learning can be explored and worked through and manageable targets set so that students can build up a sense of achievement and progress.

89
* Alternatively, schools might rely on regular conversations with youth workers as a
way of supporting students in their ‘retracking’ – so that the target students know that someone is always there for them.
* Some schools have set up special units which provide space - a safe haven -for
disengaged and/or disruptive students to cool down, get help talking through the problems they may have with the routines of learning in school, and guidance about catching up.
* Legitimated peer support can also be valuable as students who are struggling will
often respond more positively to peers who know they are having a difficult time. Even quite young pupils can manage mediator roles with skill and sensitivity provided that they receive some training and access to advice in difficult circumstances.
* Some schools (in a parallel project) have tried an approach that tackles power
networks within the peer group. The strategy is to identify leaders of anti-work groups and to support them in the task of exercising a benign pro-work influence on their followers. Such groups may be structured horizontally (i.e. the members are all in the same year cohort) or vertically (i.e. members are in different years but have something in common; in some settings the bond may be that the pupils belong to an out-of-school gang). Missionary roles are not generally popular with young people but an early demonstration, by teachers and by peers, of concern, support and respect for the leaders of such groups in their new persona can help them to try to sustain the more positive role model.
b) Outline of the analysis and development strategies in the schools While most teachers had an immediate concern, understandable in the present performance-oriented climate, with the very difficult task of bringing Year 10 students back on track so that they might make a better showing in the Year 11 GCSE examinations, they also recognised the advantage of identifying students at risk of disengaging in the earlier years when disaffection has not hardened into habit and when, consequently, ‘rescue’ attempts are less complex.
These are the approaches that our seven schools took: * Re-tracking at KS4 of disengaged students in the context of a new Learning
Support Unit. Data from students suggested that key triggers to switching off were feeling that teachers didn’t listen or fearing that their mates would scorn them if they shared a commitment to learning. The Unit’s staff offered a sense of security, opportunities to be listened to, achievable targets and recognition of progress.
* Re-tracking at KS4 of students who had lost impetus in particular subjects:
practical agendas for improvement were identified from group interview data, and then implemented and reviewed.
* Re-tracking at key transition points: Year 9 to10 and Year 7 to 8; the scheme
involved sustained support from youth workers. Evidence of impact came from
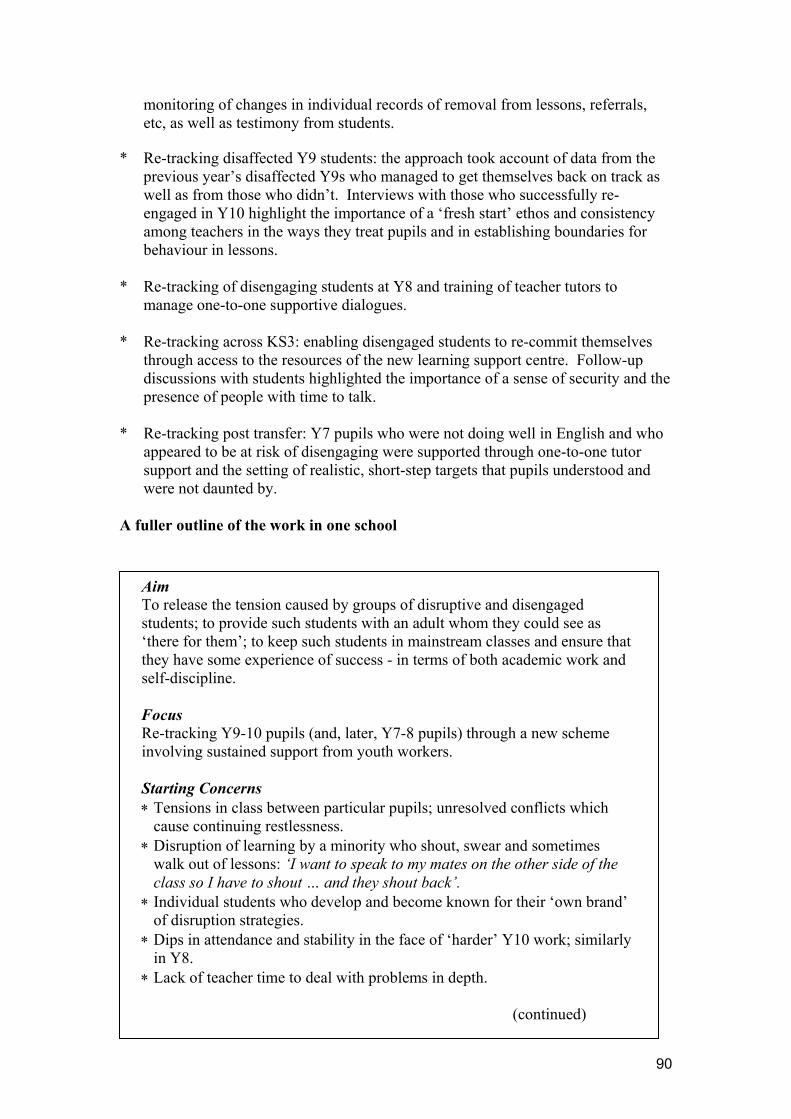
90
monitoring of changes in individual records of removal from lessons, referrals, etc, as well as testimony from students.
* Re-tracking disaffected Y9 students: the approach took account of data from the
previous year’s disaffected Y9s who managed to get themselves back on track as well as from those who didn’t. Interviews with those who successfully re-engaged in Y10 highlight the importance of a ‘fresh start’ ethos and consistency among teachers in the ways they treat pupils and in establishing boundaries for behaviour in lessons.
* Re-tracking of disengaging students at Y8 and training of teacher tutors to
manage one-to-one supportive dialogues. * Re-tracking across KS3: enabling disengaged students to re-commit themselves
through access to the resources of the new learning support centre. Follow-up discussions with students highlighted the importance of a sense of security and the presence of people with time to talk.
* Re-tracking post transfer: Y7 pupils who were not doing well in English and who
appeared to be at risk of disengaging were supported through one-to-one tutor support and the setting of realistic, short-step targets that pupils understood and were not daunted by.
A fuller outline of the work in one school
Aim To release the tension caused by groups of disruptive and disengaged students; to provide such students with an adult whom they could see as ‘there for them’; to keep such students in mainstream classes and ensure that they have some experience of success - in terms of both academic work and self-discipline. Focus Re-tracking Y9-10 pupils (and, later, Y7-8 pupils) through a new scheme involving sustained support from youth workers. Starting Concerns ∗ Tensions in class between particular pupils; unresolved conflicts which
cause continuing restlessness. ∗ Disruption of learning by a minority who shout, swear and sometimes
walk out of lessons: ‘I want to speak to my mates on the other side of the class so I have to shout … and they shout back’.
∗ Individual students who develop and become known for their ‘own brand’ of disruption strategies.
∗ Dips in attendance and stability in the face of ‘harder’ Y10 work; similarly in Y8.
∗ Lack of teacher time to deal with problems in depth.
(continued)
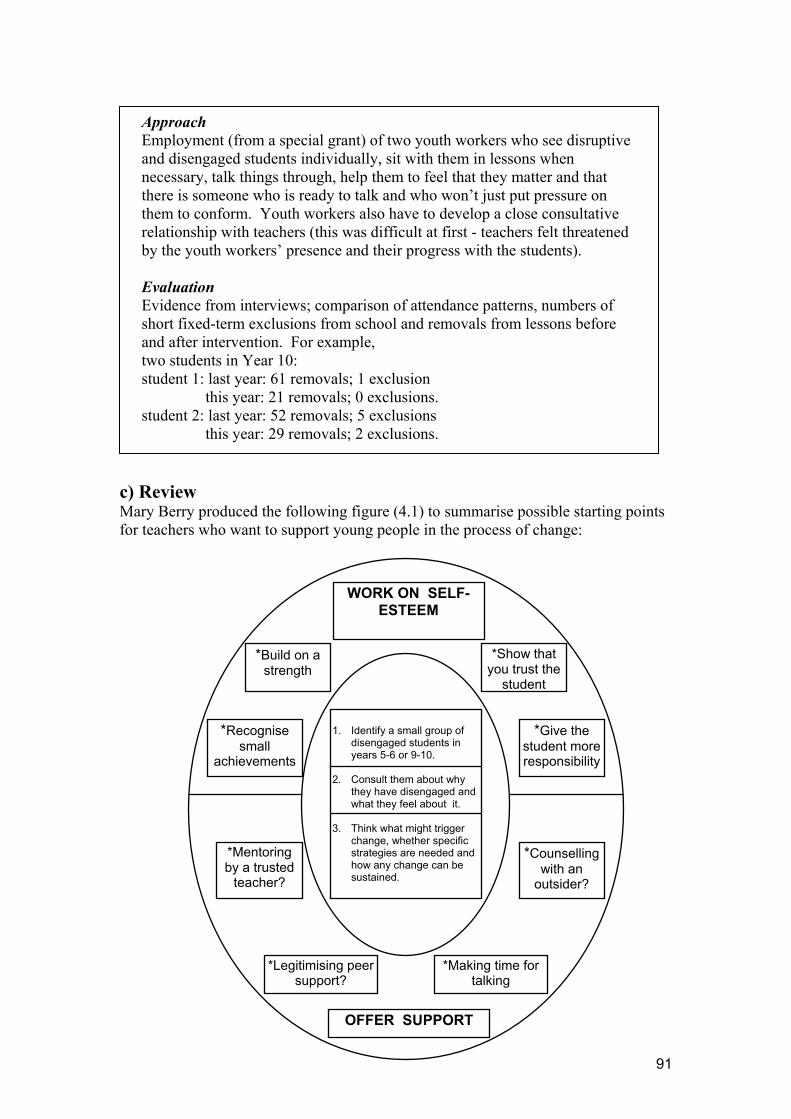
91
c) Review Mary Berry produced the following figure (4.1) to summarise possible starting points for teachers who want to support young people in the process of change:
WORK ON SELF-ESTEEM
*Build on a strength
*Show that you trust the
student
*Recognise small
achievements
*Give the student more responsibility
*Mentoring by a trusted
teacher?
*Counselling with an
outsider?
*Legitimising peer support?
*Making time for talking
OFFER SUPPORT
1. Identify a small group of
disengaged students in years 5-6 or 9-10.
2. Consult them about why
they have disengaged and what they feel about it.
3. Think what might trigger
change, whether specific strategies are needed and how any change can be sustained.
Approach Employment (from a special grant) of two youth workers who see disruptive and disengaged students individually, sit with them in lessons when necessary, talk things through, help them to feel that they matter and that there is someone who is ready to talk and who won’t just put pressure on them to conform. Youth workers also have to develop a close consultative relationship with teachers (this was difficult at first - teachers felt threatened by the youth workers’ presence and their progress with the students). Evaluation Evidence from interviews; comparison of attendance patterns, numbers of short fixed-term exclusions from school and removals from lessons before and after intervention. For example, two students in Year 10: student 1: last year: 61 removals; 1 exclusion this year: 21 removals; 0 exclusions. student 2: last year: 52 removals; 5 exclusions this year: 29 removals; 2 exclusions.

92
These were some of the things that proved important for young people who were finding learning a struggle: * time to talk in school; * targets they can identify themselves, with short term results; * recognition and rewards; * positive letters home.
The following things were important to the ‘rescue’ process: * drawing on the expertise of other professionals (e.g. youth workers); * consistency among teachers (e.g. in handling of targets and negative behaviours); * parental involvement where possible; * helping students learn to negotiate; * spaces in school for cooling out and/or private discussions; * responding to early evidence of disengagement - the process of re-commitment is
more difficult at the end of pupils’ school careers. The rescue process can be vulnerable to two sets of anxieties: * teachers can feel threatened by the intervention of other professionals; * students can be ridiculed (‘geeks’, ‘lunatics’) for trying to settle down to work. For a summary of key insights and issues see the end of Chapter 4. Project 3: How the transition from one year to another in the same school can affect learning From the adult perspective the path of learning is relatively straightforward: pupils move through the different years of schooling, building up a resource of knowledge, understanding and skills which provide a foundation for tackling the next, more advanced stage of work. An expectation of progress is built into the sequence of transitions across schools and it is what gives structure to the national curriculum and its related programme of assessment. From the pupils’ perspective the route through school is much more uneven and more difficult to negotiate and sustain. We do not help matters by the way we have traditionally given so much more importance to exits and entrances years than to the years in-between.
Mary Berry led our small-scale initiative on year on year transitions. We set out to identify – through information supplied by the LEAs contributing to Maurice Galton’s transfer study – schools that were giving attention to pupils’ perceptions of the different years of secondary school. We were interested in the implications of these for pupils’ learning and for school policy-making. The account starts with our earlier analysis of pupils’ experiences of Year 8 collected over several years and across different LEAs. It was this that led us to think seriously about the importance of investing more time and resources in helping pupils manage year on year transitions within the same school.
93
a) Year 8’s identity crisis: data from earlier research15 From the early 1990s the Chief Inspectors’ Annual Reports included tables which showed a ‘dip’ in progress at Year 8 and also at Year 3. In both cases the tendency was to blame poor teaching. Our interviews with Year 8 pupils suggested that the situation was more complicated than that. We checked out our preliminary analysis with pupils in different schools in different parts of the country and found a high degree of consistency in pupils’ perceptions of Year 8.
Data from interviews suggest that there are 'twin peaks' in pupils' engagement in secondary school - at Years 7 and 11. In Year 7 pupils' attention is captured by the social novelties of the new school: most pupils are caught up in the excitement of exploring new spaces ('it's very easy to get lost'), new opportunities ('more things to do in the breaks'), and a wider range of facilities (drinks machines) and resources (astro-turf, computers). Learning (other than social learning) can be overshadowed by the excitements and social risks of 'the big school'. Engagement peaks again in Years 10 and 11 but this time it is driven by the need to get good grades and for many pupils it is sustained through anxiety and stress. What is missing for many pupils between the two high points of engagement is a clear understanding of what learning leads to and how later learning builds on earlier learning, not only in terms of content but also in terms of ways of working. This may not be surprising given that each year of secondary schooling is fenced-off and made relatively self-contained. The problem is compounded, as the interview data showed, by the lack of a clear and compelling identity for Years 8 and 9 – but particularly for Year 8. We asked Year 9 pupils to sum up each year of secondary school, as they had experienced it or as they had anticipated it. Year 8 was seen as a nondescript year: in the first quotation, Year 8 is not mentioned; in the second, it is mentioned but has no distinctive purpose:
In Year 7 it's all new, in Year 9 you are doing your options, in Year 10 you are starting your GCSE's and in Year 11 you are there. (1996)
Year 8 is the year between Year 7 and SATs [sic]. (1998)
There are no obvious challenges in Year 8 that Year 7 pupils can look forward to. This is the time when routine sets in, when engagement can flag:
You think, "Oh god! I've got this today!" and so on. It gets really boring and you don't feel excited any more coming to school. (1996)
Year 7 you have just moved from a different school and in Year 8 you have already been there and you have nothing important to think about. (1998)
15 Here we are bringing together data from interviews with Year 8 pupils in three northern secondary schools (see Rudduck et al, 1996); and data from eight Cambridge and Lincolnshire schools (see Rudduck et al, 1998). To distinguish the data sets, the report dates are given in brackets.

94
Year 7 is getting used to the school and teachers where Year 8 is very laid back in that sense. (1998)
Year 8 is a year which teachers think will look after itself but in fact it is, for pupils, a relatively featureless year - one that needs rescuing and given a positive learning-identity. Another feature that pupils drew attention to was the low status of Year 8 – a message communicated unwittingly but in numerous ways by schools themselves. Both features of Year 8 have worrying implications for pupils’ learning. Not surprisingly, if pupils pick up messages that some aspects of schooling, some subjects and some years are less important than others they may choose to ration their effort accordingly. By reinforcing the impression that the Year 11 examinations are what really matters, schools may be giving unintended messages to pupils that the earlier years don't matter so much - that what matters is tests and examinations:
Once you get to Year 9 I think that is where it starts getting more important. (1998)
It's like end of fourth year and beginning of fifth year you start doing stuff that counts; it's got nowt to do with first, second or third. (1996)
I always feel like - Oh I shouldn't be working this hard because it is only Year 8. (1998)
Some heads have said that they usually put their most experienced teachers with the top sets and/or with the examination groups; they also think about which teachers are good with Year 7 pupils. But it seems that relatively little attention is given to the kind of teacher that Year 8s need or to styles of teaching and learning that will challenge them and sustain their engagement (‘We get all the naf teachers in Year 8’). By the end of Year 7 pupils are ready for new challenges; if they are not stretched and excited by the academic content of lessons, then their attention can turn away from learning. However, we discovered that for some Year 8 pupils
(Schoolwork) feels the same (level of) difficulty it was a year ago. (1996)
You've done some of it in Year 7. Year 8 work is not too difficult; it is more or less the same. (1998)
Year 8, therefore, seems to be a pivotal year when pupils need to be helped to think and act strategically in relation to their learning and to understand how a commitment to learning now can enhance life chances. At the same time schools need to ensure that they are sustaining the view, in all they say and do, that Year 8 matters – and follow this through into lifting the excitement of teaching and learning. Another thread in the story of Year 8, as it emerged from the interviews, is that pupils, no longer the youngest in the school, feel less raw and vulnerable: they would like teachers to recognise that they are a year older; they value occasions when they are given responsibility, whether for hearing a younger pupil read or helping to organise a fund-raising activity. Again and again in the interviews pupils called for more responsibility and more trust as they moved up through school.
95
We also learned from talking to pupils that a tension can start to build up in Years 7 and 8 between the pull of the peer group and the demands of school work. The strength of 'anti-boffin' peer pressure can make it difficult for individual pupils to be seen to commit themselves to 'academic' learning. Schools need – and this is easier said than done - to take steps to establish a culture where all pupils feel that it is acceptable to learn and where individual pupils have support in establishing and sustaining a positive sense of self-as-learner.
Anderman et al (1994) claim that explanations for the 'disturbing downturn in motivation’ during this middle period lie largely in the mismatch between the environment of learning in the school (broadly conceived) and pupils' 'heightened awareness of emerging adulthood'. Early adolescence, they say, is a period when ‘autonomy, self-determination, and social-interaction' are very important for young people (p.294). However, the typical school environment of the middle years has relatively few opportunities for pupils to make important decisions (hence, in our research, the significance for pupils of options choices, however restricted, towards the end of Year 9). The distinctive contribution of Anderman et al’s commentary is the bringing together of issues of school organisation, motivation and performance - a relationship that our own research also highlights as important.
In summary, our early interview data allowed us to construct a fuller picture of what can go wrong in Year 8:
* the impact on motivation of Year 8 having no clear identity in pupils' eyes; * the examination work (i.e.Years 10 and 11) being presented, and seen, as being
what really matters in school; * the widespread failure to acknowledge pupils’ social maturity and their readiness
to take on more responsibility when they are no longer the youngest in the secondary school; and
* the low priority given in staffing matters to the kind of teacher that Year 8 needs. If Year 7 is characterised by the process of initiation into a new social context and new ways of learning, year 8 needs to be marked by opportunities for greater responsibility and creativity, occasions for thinking and talking about learning, and for establishing skills of organisation and self-direction in readiness for the decision-making of Year 9 and the pressures of Years 10 and 11. Pupils who do not build good foundations at this stage, in terms of both ways of working and subject knowledge, can find later that they have left things too late and that it is easier to give up than to try to catch up.
This was the picture that emerged from our 1996 and 1998 research: What we did in the Transfer and Transitions project was first to check out whether this view of Year 8 still holds and, if so, to consider what interventions might help lift the image of Year 8 in pupils’ eyes and what schools were actually doing to help pupils look forward with excitement and confidence to Year 8 – and also to Years 9 and 10.
96
b) What schools are doing now The project took the form of an information gathering exercise rather than an intervention. We wanted to find out what, if anything, schools were doing about: * preparing pupils for the learning agenda of the year ahead; and * sustaining engagement during the year.
We sought information from LEAs involved in the Transitions and Transfer Project about schools that were thought to be doing something interesting and were given the names of thirteen schools in all - in the North East, in East Anglia and in Sussex. We found that most schools were concerned with Year 8 (this was perhaps not surprising given successive Ofsted reports on the Year 8 dip in progress). We checked out whether pupils’ views of Year 8 echoed those of our earlier study and the data did in fact confirm the broad parameters of our earlier analysis. Year 8 was still seen by many pupils as an undemanding and not particularly important year:
One problem with Year 8 is that there is nothing new to do.
Year 8 is the easy year. This is because you’re already settled in, and you haven’t got any major tests at the end of the year. It’s the only real year when you get a rest. Year 8 needs to be a new experience. Not just a repeat of Year 7 Pupils do not think they have to work so hard.
In responding to the problem, schools were putting more effort into special, one-off events during the year than into induction events that would help Year 7s to see Year 8 as an important year. Neither were they planning any initiatives round the one-off events that would help sustain pupils’ excitement and help to build a learning-oriented focus throughout the year. A similar picture emerged from the other schools where the focus was on Years 9 and 10. There was no evidence from any of the schools of an overall policy to address transition issues across Years 8, 9 and 10.
The interventions and events in Years 8, 9 and 10 that we documented fell into three broad categories: some were designed to mark pupils’ seniority as they moved up into a new year; some were designed to provide more excitement in the curriculum at vulnerable moments; and others were designed to provide a focal point for the new year – something that pupils would know about and look forward to. (i) Markers of social advancement These included: uniform changes; opportunities to exercise choice as pupils move up through school (although the choice is often related to uniform rather than to decision-making in the curriculum); the provision of a dedicated year cohort area (such as a common room); the identification of special privileges and responsibilities in school (such as Y8 pupils acting as guides to school visitors, or Year 8s having their own pupil council, or Year 8s being mentored by older pupils).
97
We had an interesting collection of data from a socially advantaged and high achieving boys’ school. The pupils were very articulate and we were able to discuss the problem of Year 8 directly with them. What emerged from their written analyses and recommendations for improving Year 8 was a pre-occupation with uniform and hierarchy - but with little mention of the academic work of Year 8:
As completely changing the uniforms each year would (money-wise) disagree with parents and no uniform would be unruly (sic), I have come up with a plan. If on each blazer, there was a strip of Velcro, each year pupils could buy a different coloured braid/strip to signify their Year – gradually getting lighter or darker towards the end of school. This would suit everyone.
There was a particularly plaintive statement from a Year 8 boy who clearly suffered, because of his small stature, and was seen still as a Year 7 – and was sometimes chased by older pupils because of this:
Have a slight difference in the uniform, not so much that it’s expensive but just tie colour or something. This would help differentiate us (especially the smaller amongst us) from the Year 7 students.
Other solutions focused on status:
You could make Year 8 looked forward to by making the privileges over Year 7s larger. Responsibility is something that a lot of children would like, but usually it is kept until the sixth form. Titles like head boy of year would fulfil this request quite well but there should be more, as only one would leave a lot of people jealous.
The dilemma for high achieving schools is whether to review and change a pedagogy that is ‘delivering the goods’ in terms of the national concern about standards; hence perhaps the temptation to follow where the students lead and to concentrate solely on tinkering with the social dimensions of schooling. (ii) Interventions designed to provide academic stimulus at vulnerable moments A few schools focused their efforts not on Year 8 but on Year 9: they were all finding problems in sustaining pupils’ motivation right through to the end of Year 9. After the national tests were over and options choices had been made, pupils acknowledged that there was a temptation to slacken off, especially in those subjects they knew they were going to drop. In order to counter this generalised drop in commitment, one school introduced some work-related activity as a way of re-engaging pupils; another sharpened motivation by starting the examination work early. So strong is the dominance of tests and exams in parents’ and pupils’ minds that it is not always possible for schools to use these post-test/post-exam ‘spaces’ for additional work that broadens pupils’ curriculum experiences. One possible strategy – see later – is to use the space to look ahead to the following year and to plan an exciting induction.
98
(iii) Planning special events that pupils could look forward to with excitement One school decided that a way of signalling the importance of year 8 was to invite pupils to plan a late autumn event for their parents that showed how the work of Year 8 was developing and what was distinctive about it. Another sought to sustain engagement with learning by identifying, across the curriculum, more opportunities for discussion-based work and problem-solving approaches that pupils had said helped them to learn. Some schools introduced activities that, with the wisdom of hindsight, could have been better timed or better carried through. For instance, one school had introduced a special activities week in Year 8 ‘to make the year special’ but had scheduled it in the summer term as a ‘pick-me-up’ rather than at the start of Year 8 when the excitement it generated could be built on. Another had introduced a highly interactive Learning Styles Workshop in Year 8 which ran over two days; another launched a local history project which took students out into the community – this was something that pupils looked forward to in Year 7 but it may not have helped to sustain motivation much beyond its ending. In only one school did we find that teachers were closely monitoring pupils’ experiences of the present year and their evaluations of the strengths and weaknesses of the previous year as a basis for improvement. The focus of the work in this school, whose work we describe more fully, was Year 10.
Teachers were concerned to improve the quality of teaching and learning and set up some consultation ‘cells’ of five pupils, each with a linked teacher-facilitator (Y11 students, in their final term, were also asked for written comments and suggestions). The cells included a carefully selected cross-section of pupils in Year 10. In addition, thirty Y10 pupils agreed to keep diaries where they recorded concerns and ideas for improvements. It was emphasised that the consultations were to focus on serious analysis and ideas for constructive ways forward rather than grumblings and grievances. Teachers were particularly surprised by four sets of perceptions. First, they learned that pupils thought they were missing out in Year 10 because they had not realised how different and difficult the work would be, nor how important the year was (they had tended to see it as a year without urgency because the examinations were not until Year 11). Second, pupils said that although teachers talked a lot about independence in Year 10 and that it sounded good, they did not in fact know what this meant until they were near the end of Year 10. Third, pupils said they needed to be more convinced of the relevance of the learning, in terms of content and process. Fourth, pupils said they valued time for reflection and wanted more of it. As a consequence, the school planned a new induction programme for Year 9 pupils, consulting Year 10 pupils, in another round of consultations, about how it should be managed and what it should focus on. Some of the practical suggestions were so basic, said the teachers, that ‘it was hard to believe that we had not thought of them ourselves’ – such as ensuring that all subject teachers (continued)
99
made their expectations explicit in their Y10 course outlines and made clear what was expected during the five terms of study. The induction programme was run over a full week at the end of Year 9. A new planner was designed in response to pupil comments which included better space for charting the start and end dates for course work assignments, across subjects, and a section with questions that would prompt reflection on learning – subject departments also agreed to make the reflection sheets an integral feature of the assessment for learning process. The induction programme and the consultation strategy which preceded it were judged by pupils and teachers to have been a successful innovation – and something to be repeated.
c) Review Our data confirmed that schools give most attention and invest most resources in the exits and entrances years (the latter invariably coinciding with a key stage test or exam.). Pupils pick up messages about what matters in school and adjust their effort accordingly. One consequence is that some years or bits of years come to be seen as unimportant and dips in engagement and progress can occur. At another level, Year 9 students say that they don’t put much effort into subjects that they know they are not going to take in Years 10 and 11 ‘for the exam’. And again, in order to maintain motivation, some schools fill the spaces at the end of Year 9, after the tests are over, by starting on ‘the work for the exams’. Gradually an image can build up that learning is important because of tests and exams and that those learning experiences that are not test or exam related are less important. The data discussed in this section suggest that it is worth giving attention to two things. First, more could be done – and in exciting ways - to help pupils prepare for the year ahead so that they feel that the year is important for the development of their skills as a learner as well as for their personal and social development. Time spent on planning and organising inductions for Years 8, 9 10 and 11 might well pay off in terms of helping pupils to see secondary schooling as a coherent whole, with clear progression not only in curriculum content but also in ways of learning. Schools might also think about doing more to mark pupils’ social advancement as they move up through the years of secondary school: being a year older matters to young people and they need to feel that as they get older they are being given more responsibility not only in the social world of school but also in their learning. Summary Data across the three projects suggest that there is a need for transition to be put firmly on the agenda and for some of the energy and imagination that teachers currently put into preparing for transfer should go into preparing pupils for year on year transitions, and also helping those pupils who are disengaging to re-commit themselves to learning, especially in the earlier years of secondary school. Our data also confirmed the usefulness of consulting pupils about their experiences of transfer,
100
about their images of the transition years, and about their perceptions of the relationships between friends and academic progress. Here we summarise observations and suggestions from each of the three projects discussed above. Project 1: How friendships affect learning, at transfer and beyond * Schools are increasingly taking account of pupils’ perspectives in structuring
working groups at transfer and beyond. In the past, teachers have given less attention at transfer to the academic dimensions of friendship than the social. Friendships have been seen as socially supportive but potentially distracting in terms of concentration on academic work. As teachers become aware that even young pupils have quite a sophisticated capacity for explaining who they work well with and who they don’t work well, and why, perceptions and practices are beginning to change.
* Pupils are able to talk about the qualities that make good working partners and
explain how different friends are helpful in relation to different subjects or tasks. * Pupils differ in the extent to which they like to work with someone who is like-
minded and/or whose competence is similar to theirs; weaker or insecure pupils like to have a working partner who will help them but more confident or able pupils can find it tiresome and disabling to work with someone who is dependent. At the same time pupils see that a mark of friendship is being ready to help your mate when he or she is stuck.
* Pupils consult friends informally when they are unable or unwilling to check
things out in class with the teacher; if friends - or pupils whom you know will not laugh at you for being slow or uncertain - are not available to consult, then pupils may switch off. It may be important for teachers to legitimise peer support in the classroom.
* Most pupils become less dependent on friends as they get older but networks of
working friends out of school hours, concentrating on homework and often supported by e-mail and mobile phones, are increasingly common, among boys as well.
* Pupils who are in top sets, but who feel academically insecure, may continue to
rely on the presence of a friend for both social and academic support. Project 2: Helping pupils to re-commit themselves to learning * Anti-work identities, once established, are difficult to change and it is better to
intervene in the early stages than to try to change pupils’ identities as learners at Year 10.
* Students see it as difficult to change their image if long-standing judgements held
of them by teachers and by peers are not actively challenged. Both student and teacher need to feel, and assert, the opportunity to move on.
101
* Pupils who want to change often have difficulty in escaping the pressures of their peer group: some devise short-term strategies that allow them to focus on schoolwork without losing face.
* Moving the disruptive disengaged to another group, class or school is at best a
partial solution: disturbance to the work of peers is reduced but the target pupils’ reputations travel with them and change remains difficult.
* Mentoring schemes are often used to give short-term intensive support to students
who are on the borderline of a D/C grade at GCSE, but students who are struggling below the level which might make a real difference to the school’s ‘league table’ profile also need their support. Giving attention to these students can make them realise that learning matters.
* Schools may need to check out whether they are privileging some groups of
students over others. If the disengaged are to come back on board they also need to feel that, as individuals, the school believes that they matter and is prepared to give time to support them.
* Teachers have told us that each new year cohort can develop a different character
and bring a new raft of problems. Sources of disengagement may sometimes need to be examined in relation to the persona of the year group or its most difficult faction.
* Teachers have suggested that whatever intervention or support is given it needs to
be sustained over a period of time; one-off sessions are not enough. Project 3: How the transition from one year to another in the same school can affect learning Here we make some recommendations for things that schools might do to signal that the year ahead is important or to sustain engagement and a sense of the importance of learning during times when teachers know that pupils can lose commitment. Most are drawn from accounts of practices in Year 8 but they could be relevant to Years 9 and 10. * Monitoring the messages that the school is implicitly and explicitly giving about
the status of different years. Teachers may also want to find out what myths and anxieties exist about the year ahead or what pupils think, as the present year draws to a close, they should have known more about at the start.
* Giving a clear learning-oriented identity, and more status, to the coming year and
ensuring that there are things in it that pupils look forward to. * Planning an end of year introduction to the year ahead as a way of communicating
the importance of the coming year, what is distinctive about its learning agenda, and how it marks a new stage in pupils’ school careers.
* Making sure that the teaching in the new year provides opportunities for active
participation.
102
* Creating time for dialogue about learning so that pupils begin to understand the longer term implications of what they are doing, especially in Year 8, and also begin to develop a language for thinking about learning and about themselves as learners.
* Introducing a mentoring scheme that makes Year 8 and 9 pupils feel that their
work is important and that helps them to talk openly about problems with learning that they may not have anticipated; Year 10 and 11 pupils may also want opportunities for focused discussion of aspects of their learning.
* Ensuring that each new year is marked by enhanced opportunities for pupils to exercise
responsibility in relation to school matters, whether inside or outside the classroom.
* Strengthening the procedures and practices relating to homework or study support so that pupils become confident before they enter Year 10 about being able to work independently and can pace themselves outside the time-frame set by the length of school lessons.
* Responding to the problem of 'catching up' for pupils who have missed work,
whether through illness or choice, and who are consequently anxious about coping with the more advanced learning that lies ahead; it is important that they can face the new year with high expectations and confidence.
103
Chapter 5: Rethinking the Middle Years of Schooling:
Summary and Recommendations This research project is concerned with factors which impede and facilitate pupils’ progress through the middle years of schooling (roughly the period between the ages of 7 and 14). We start by considering the primary side of the transfer divide, move on to the period of transfer from primary to secondary school, and then explore some areas where schools might intervene when progress begins to stall during Key Stage 3. Taking the long view has enabled us to build a fuller picture of pupils’ progress and also to redress some the imbalance in earlier research which has tended to focus on transfer between schools and neglected transitions between years. Both, we believe, are important. We concluded, in our preliminary review, that schools’ arrangements for transfer were in the main working well (Galton, Gray and Rudduck, 1999) and that there were good procedures in place for minimising liaison problems and reducing pupil anxiety. However, there were still problems in sustaining pupils’ engagement with learning through Year 7 and beyond. In relation to transition arrangements (the movement of pupils to a new class at the end of each academic year within the same school, and the change from one learner identity to another) we found that little attention had hitherto been given to the implications for pupils’ progress. ‘Dips’ in attitude and engagement could occur during the period and particularly in Years 3, 7 and 8. Furthermore, such dips were also reflected in pupils’ scores on tests of attainment. A further phase of research and development, in partnership with schools and LEAs, was consequently funded by the DfES. It is to the implications of this second phase for policy and practice that we now turn. The research reported here has been based on fieldwork and data-collection in considerable numbers of LEAs and schools. The extent of the project’s involvement varied, of course, depending on the questions being addressed, but practice in more than a dozen LEAs and more than 50 schools is described and analysed in this report. More than 300 primary schools were represented in the data-bases used to track pupil progress during Key Stage 2 whilst a further 50 primary heads also contributed their views and experiences. Each of the three main sections of this report offers ideas, explanations and, in some cases, specific recommendations for schools and policy makers. Here we summarise our main findings and point to some lines along which future policy might develop. The study started in January 2000 and ended in December 2002. It combined several strands. These included: studies of pupils’ year-to-year progress from Key Stage 1 to Key Stage 2 to explore in greater detail the extent and magnitude of suspected ‘dips’ in attainment; a transfer strand in which LEAs and their schools developed strategies designed to overcome various weaknesses identified from previous research; and a transition strand which explored, post-transfer, three ways in which pupils’ commitment to learning, at transfer and beyond, could be strengthened.
104
The Primary side of the transfer divide Headteachers’ Views Fifty primary headteachers were interviewed about transition issues in the years prior to pupil transfer. The sample was drawn at random from heads who had administered QCA’s ‘optional’ tests to their pupils for at least the last three years. Interviews were conducted over the phone using a semi-structured approach and lasted between half an hour and an hour. All the interviews were transcribed for analysis. Most schools discussed individual pupil progress at staff meetings and looked for ‘departures from the expected’. In some schools such enquiries were more focused and involved tracking year groups as well as individual pupils. However, few heads used the data as the basis for framing sustained action and very few had built up a detailed picture of the kind developed in this report. Some used the results from the optional tests to refocus their attention onto Years 3 and 4. Specific year on year targets (say of two-thirds of a level per year) were sometimes adopted. In setting these expectations heads drew upon a ‘linear’ model in which pupils took equal-sized steps from one year to the next and where ‘action’ was initiated if they did not. The most common interventions concerned the performances of boys (relative to girls), the performance of SEN pupils and the presence of ‘dips’ at particular time-points. The main points of reference were the national norms for the year group or for a particular sub-group. Many heads stated that the main factors influencing pupils’ progress were largely beyond their control. Differences between boys’ and girls’ progress were often said to be culturally determined while the transition from Year 2 to Year 3, the change in assumptions accompanying this transition and changes in the curriculum were listed as contributory factors. Some heads also voiced concerns about the confidence that could be placed in the levels of Key Stage 1 performance reached by the pupils they were taking in. Heads acknowledged the existence of a ‘push’ during the run-up to the Key Stage 2 assessments in Year 6. Two thirds also claimed to have been implementing some measures during Years 3, 4 and/or 5 although activities here seemed more limited. Two strategies dominated heads’ approaches to Year 6: regular use of ‘practice tests’ (reported by 82%) and the provision of so-called ‘booster’ classes (74%). A majority concentrated their more experienced teaching staff in the Year 6 classes, reduced the scope of the curriculum taught during Year 6 and focused the efforts of any support staff available on this age-range (around 60% in each case). Most heads expressed concerns about possible ‘narrowing’ of the Year 6 curriculum and the emergence of a two-part year (before and after the tests were administered). Only one of the heads in the sample claimed to have resisted this trend and to offer a broad and balanced curriculum throughout Year 6. Other heads argued that all schools operated on a competitive basis and the degree of accountability they faced meant every school was forced to “teach for the tests”. Around three-quarters of the heads interviewed made use of booster classes but were divided about their usefulness. Some said the opportunities for smaller groupings they provided improved pupils’ confidence and allowed teaching to be tailored more closely to pupils’ needs; booster classes were also used for setting to create more
105
manageable group sizes in Year 6. Other heads contested this, arguing that their impact on pupil performance was more mixed. Most wanted the available funding to be re-directed towards sustained ways of tackling under-achievement. Two thirds of heads employed some form of ‘intervention’ in Years 3, 4 or 5 or, more occasionally, in all three. These mainly consisted of extending ‘booster’ type activities or, in some cases, introducing forms of setting. Heads’ overall responses were rated in terms of their general attitudes to testing and the degree to which they had been ‘proactive’ in responding to recent initiatives. 76% of heads expressed negative views about testing but were nonetheless proactive in their responses; only 14% adopted a positive and proactive stance. The latter were more likely to extend interventions into KS1, employ setting, make regular use of practice tests, locate more experienced teachers in Year 6 and deploy support staff to boost KS2 results. Tracking pupils’ progress from Key Stage 1 to Key Stage 2 The analysis of pupil progress in reading and maths between Key Stages 1 and 2 took advantage of data collected by the NFER as part of the QCA’s evaluation of ‘optional’ tests. In this way it proved possible, for the first time, to track individual pupils’ measured progress by combining evidence from Key Stage 1 to Year 3, from Year 3 to Year 4, from Year 4 to Year 5 and, finally, from Year 5 to Key Stage 2. This created a unique data-set with complete data on well over 3,000 pupils. The first stage in the analysis was to group pupils’ progress across Key Stage 2 into one of four progress ‘routes’ for both reading and maths. The largest of these groupings was made up of pupils who made roughly ‘equal-sized’ steps from year to year. Around four out of ten pupils progressed in this manner in reading and a slightly higher proportion in maths. The next most common grouping had no clearly identifiable trajectory; around a quarter of the pupils in reading and a third in maths made ‘variable’ progress. Limited numbers of pupils were also found to be on routes involving ‘increasingly’ large steps and ‘decreasingly’ small ones. Whilst it was true that some pupils ‘dipped’ in terms of performance between Key Stage 1 and Year 3, in reality some pupils ‘dipped’ every year subsequently as well, with the possible exception of Year 6. The second stage of the analysis explored whether the ‘route’ taken appeared to affect pupils’ performance. There was some evidence that it did. In reading it was pupils who were on the ‘equal-sized’ steps route who made the most progress. However, their advantage in comparison with those who made the least progress was rather modest – at most about three months’ more progress than pupils on the ‘decreasing’ steps route. In maths, by contrast, the differences were more substantial. Here it was pupils who were on the ‘decreasing’ steps route (a fast start followed by smaller steps or ‘consolidation’ in subsequent years) who made the expected two levels of progress whilst those on the ‘increasing’ steps route lagged further and further behind, eventually by around half a level. Looking across the two subjects and combining the evidence, there seems to be some support for the desirability of pupils following an ‘equal-sized’ steps approach which neither compensates for a ‘slow’ start nor relies on a ‘spurt’ in the finishing straight.
106
The research confirmed earlier evidence that the primary school a pupil attends makes a worthwhile difference to progress between Key Stage 1 and Key Stage 2. Pupils attending ‘more effective’ primary schools throughout Key Stage 2 made as much as half a level more progress (roughly a year of nominal progress) when compared to their counterparts at ‘less effective’ ones. We found evidence that pupils attending particular primary schools could be characterised as being more likely to follow some ‘routes’ rather than others. However, when we explored the extent to which these various categories of ‘routes’ were related to overall pupil progress between the two Key Stages, we found little evidence of differences. Schools where the pupils tended to make ‘even-sized’ steps over the four years made no greater progress, on average, than those where there was a late ‘spurt’ or ‘push’. Implications for policy on the primary side We believe these findings have a number of implications for the development of policy on the primary side of the transfer divide. Here, however, we focus on just three. Greater emphasis should be placed on targets which reward schools for all levels of pupil progress and not just in relation to the Level 4 hurdle. Such measures, in combination with the wider use of value-added approaches for judging performance, would send out the message that all levels of pupil progress matter, not just the higher ones. Such changes are in the process of being introduced into primary schools. Schools should be encouraged to redistribute their efforts (and any marginal resources that come their way) towards Years 3 and 4. They need to understand more about the various patterns of progress their pupils’ experience and to match their ‘interventions’ accordingly. Encouraging schools to be less reliant on Year 6 ‘push’ strategies could benefit both pupils and teachers and might help to reduce the widespread scepticism encountered amongst secondary schools about the levels reached by their newly-arrived charges. Schools should be encouraged to develop and expand the menu of evaluated ‘interventions’ they employ in pursuit of their teaching and learning objectives in ways that are comparable to those developed by some secondary schools in this study. These might be deployed in some years but not others and, possibly, with some groups of pupils but not others. Taking stock of the current situation at transfer It is clear, from the evidence collected during the lifetime of this project, that schools are now paying increased attention to transfer issues. The majority of recent transfer initiatives now concern either curriculum or pedagogic continuity. This contrasts with the situation pertaining during our preliminary review undertaken more than three years ago when almost all schools concentrated on administrative matters or easing the social passage of pupils from primary to secondary school. As a result of the increasing number of visits between Year 6 and Year 7 staff, secondary teachers are now better informed about the KS2 programmes of study and possess greater understanding of the ways in which primary teachers assess their pupils’ progress. However, for various reasons to do with the timing of these visits, and the unfocussed nature of some of the classroom observation taking place during
107
these exchanges, many secondary teachers still retain an over-optimistic view of current primary practice. The reality is that for many pupils much of Year 6, in the run up to the National Tests, consists largely of revision with an emphasis on whole class direct instruction. It is only in the final half of the summer term that more exciting and demanding curriculum activities are introduced. This squeeze on the curriculum and the restricted range of pedagogy employed in Year 6 therefore has implications for teaching at the lower end of the secondary school. While continuity is important to reduce the level of anxiety at transfer, a degree of discontinuity is also essential since it provides an external indicator of pupils’ newly acquired status as secondary pupils. This present study suggests that secondary teachers should now pay more attention to aspects of discontinuity Measurement of pupils’ attitudes immediately before transfer and in the November and July following the move to secondary school suggested that the present Y7 curriculum is still not sufficiently different nor challenging from that undertaken in Year 6. Pupils were enjoying their final year in primary school to a lesser extent than five years ago and by the end of their first year after transfer they found school an even less enjoyable experience. The decline in attitudes to mathematics and science was more pronounced but in English attitudes improved slightly after transfer. Despite the dip in enjoyment motivation remained relatively high. Pupils said they continued to work hard because they needed to succeed at school to get a good job rather than because the subject matter was interesting There was little common agreement during Key Stage 3 about the use of specific tests for banding and target setting. As a result, teachers were asked to convert pupils’ attainment in English and mathematics, however measured, to National Curriculum levels. In both mathematics, and more especially in science, it appeared that pupils who made most progress after transfer did not express very positive attitudes to these subjects. Only in English was attitude and attainment positively correlated. Pupils stated that in Year 7 there was more variety in English and that it was more interesting. In contrast, many pupils said that mathematics involved doing similar things (albeit more complex) in Year 7 as they had done in Years 5 and 6. There was less class discussion, pupils were expected to work more quickly and lessons were less enjoyable as a consequence. In Y7 science pupils spent much of their time copying out details of experiments or writing out instructions under the teacher’s guidance. Able pupils, in particular, said they were easily bored by these lessons. However, more pupils in mathematics gained at least one National Curriculum level after transfer compared to English. Many Y7 teachers echoed the views of Y6 colleagues in claiming that the methods currently advocated for raising achievement levels appeared incompatible with those they felt were more appropriate for improving intrinsic motivation and inculcating positive attitudes towards their subject. The effectiveness of some recent transfer initiatives Nine schools were the subject of case studies. They were chosen because Y7 pupils made significantly high positive attitude gains after transfer compared to the remaining schools in the sample. These case study schools shared certain characteristics. Most used some form of Bridging Unit, had extended induction programmes and provided some form of summer programme for both gifted pupils and those who needed to catch up in literacy and numeracy. Several had instituted a series of exchange visits between Y6 teachers and Y7 subject specialists. Some

108
schools were exploring the use of the Internet for linking Y6 and Y7 pupils in ‘buddying’ schemes Bridging Units were usually started in the last few weeks in the primary school and continued for several weeks after transfer to secondary school, and were designed to assist continuity. This they did to a limited extent but their main value was in promoting dialogue between primary and secondary colleagues on issues of pedagogy and assessment. This occurred more often when schools constructed their own units rather than using pre-packaged materials. When using the latter, in particular, schools need to assess carefully whether their costs, in combination with the time and effort involved in the planning and delivery of the units, result in observable gains in the quality of teaching and learning in comparison with other initiatives. One alternative consisted of visits by Y6 and Y7 teachers to each other’s classrooms. Here it is important that visits take place throughout the school year and not just in the final weeks of the summer term when primary colleagues are attempting to make up for the narrowing of the curriculum during the run up to the Y6 tests. It is also vital for any observation to be focused on specific aspects of classroom practice.
A number of secondary schools were beginning to experiment with post induction programmes in an attempt to develop pupils as professional learners. These programmes typically involve the development of study skills, an introduction to problem solving strategies and the identification of preferred learning styles. Pupils were generally very enthusiastic about these programmes. It gave them confidence to cope with their new environment, helped them to meet new staff in a more relaxed atmosphere than in subject classes and taught them how to plan and organise their work. Post-transfer induction programmes have considerable potential but need much greater investment of staff time, both for training and for implementation. They also need to have more impact on the core subjects otherwise transfer of learning does not take place Implications for schools and LEAs in relation to transfer Schools need to continue to pursue initiatives that place increased emphasis on the academic rather than the social aspects of transfer. In particular, they need to seek further opportunities, beyond the Foundation Subjects Strand of the KS3 strategy, to provide new and exciting challenges in the work, thereby introducing a greater degree of novelty – or discontinuity - between the experiences of pupils in Y6 and Y7. More attention also needs to be paid to specific pedagogic strategies that are known from research to improve both pupil attainment and intrinsic motivation. These include: training pupils to work together cooperatively, teaching them appropriate questioning techniques and developing the capacity of pupils to evaluate their own learning. Schools need to look beyond assessment data when making professional judgements about pupils’ progress. Particular attention should be paid to boys who achieve their targets but who are not sufficiently challenged. Schools need to identify and monitor such pupils more carefully. Finally, too many current transfer initiatives take place either within a single subject department or under the auspices of the PSHE programme. Successful transfer requires a degree of coherence across the different subject departments so teachers can plan for the continuities and discontinuities in (and between) the different disciplines.
109
Very few transfer initiatives are properly evaluated. LEAs can play a crucial part in this process and need to allocate specific periods of inspector/adviser’s time to activities related to transfer. Unless advisers take on part of the evaluator’s role, then (on past experience) many of the current transfer initiatives are likely to be superficial and largely ineffective. The evaluator’s role requires different skills from those used in inspection. Many of the present LEA advisory staff have been trained in inspection skills. LEAs may therefore need to seek advice and support from the research community to help their advisory staff acquire the necessary new skills. Managing institutional and personal transitions In this strand of the project we focused on three different transition experiences:
∗ the relationship between friendships, independence and learning as pupils move from school to school and year to year;
∗ the personal transition from one learner identity to another (eg from ‘dosser’ or ‘shirker’ to ‘worker’); and
∗ year to year transition (especially from Year 7 to Year 8) within the same school.
1. How friendships affect learning, at transfer and beyond There is a body of research on the nature and dynamic of friendships but relatively little attention has been given to pupils’ own perspectives on friendship and performance. Our starting point was evidence that at transfer friendships were widely seen (especially by parents) as a means of social support while their potential for academic support tended to be overshadowed by anxiety about the dangers of distraction. The allocation of pupils to particular seats or to membership of working groups tended not to take account of pupils’ own views of whom they work well with. In the exploratory phase we conducted interviews with teachers and pupils in nine secondary and three primary schools. Three sets of issues emerged. The first was about friendships and gender where we noted the different ways in which friendships affect learning: boys’ friendships groups are often larger and more loosely constructed and conflicts are quickly over whereas when girls’ intense relationships with one or two friends go wrong there can be sustained emotional distress which can get in the way of their school work. The second was about changing patterns of social and academic dependence on friends as pupils became older; and the third was about which friends pupils do and do not work well with. In the development phase we concentrated on the second and third, supporting five schools in designing and pursuing their own enquiries into aspects of friendship and performance. It became clear from the interviews that, for pupils, being at school is a social occasion as much as an opportunity for academic learning, and that friends are an important part of the social world of school. Some key observations and implications for schools The data showed that good working partnerships can be strengthened if partners are friends, but that friendships in themselves do not guarantee effective working relations. We found that that pupils are discerning about friends whom they work well with and friends whom they do not work well with. They make use of friends in different ways, sometimes valuing complementary skills and sometimes different skills, depending on the nature of particular tasks or the demands of particular
110
subjects. They are also reflective about the qualities of a good working partner. Teachers are often unaware of pupils’ views and are therefore unable to use them in support of their learning. The data suggest that, at transfer and beyond, pupils might be given a greater say in the construction of seating patterns and working groups. The data confirmed that pupils often consult friends informally when they are unable or unwilling to check things out in class with the teacher; if friends - or other pupils whom they know will not laugh at them for being slow or muddled - are not available to consult, then pupils may switch off. It may be important for teachers to recognise the value of peer support in the classroom and to find ways of legitimising it. Although pupils become more independent as they move up through secondary school some who are in top sets but who feel academically insecure continue to rely on the presence of a friend for both social and academic support. A change in pedagogy – to a less competitive and pressured learning style, where it is acceptable to admit to not understanding something, could help reduce levels of anxiety, especially in ‘top sets’. 2. Helping pupils to re-commit themselves to learning In this study we interpreted ‘transition’ in terms of changing one’s image as a learner. We were interested in how tensions and pressures can lead pupils to adopt particular attitudes and persona in school and classroom and the difficulties they have in dropping them. We worked with teachers in seven schools on strategies that would help pupils who have turned away from learning get back on track. The pupils who were ‘at risk’ included both the individually disengaged, whose disruptive behaviours had led their peers to reject them, and the ‘collaboratively disengaged’ who are expert in maintain a noisy and extrovert disdain for schoolwork. While pupils mostly see themselves as being to blame for their lack of academic progress, there are often things within the regimes of schooling that make the pupils avoid work and that can be remedied once teachers understand what they are. In one-to-one discussions, some pupils said that they desperately wanted to change but didn’t know how to. Pupils talked about their reasons for disengaging: some became bored if the work was not seen as relevant; some disengaged because they had fallen behind and it was easier to give up than to catch up; others talked about the lack of responsibility and initiative in school compared with their lives outside school; and many felt they were not valued compared to their ‘high flying’ peers. They acknowledged that change was difficult: some described themselves as ‘addicted’ to ‘messing about’; some found it difficult to escape the norms of their anti-work peer group and others felt that their reputations were so indelibly inscribed in teachers’ minds that a fresh start was not possible. Some key observations and implications for schools Triggers for change are different for different pupils. For some, being able to talk about their problems helps to reduce the feeling that ‘they don’t listen to us’. For others, re-assurance about their own capability is what triggers change. Other triggers include being asked to take on a special role or responsibility, or by being able to use,

111
in the classroom, skills and talents developed outside school. The process of disengagement can be reversed if pupils feel that significant others in the school are able to see and acknowledge some of their strengths.
Pupils who want to change often have difficulty in escaping the pressures of their peer group: some devise short-term strategies that allow them to focus on schoolwork without losing face. Anti-work identities, once established, are difficult to change and it is better to intervene in the early stages than to try to change pupils’ identities as learners at Year 10. Whatever support is given, it needs to be sustained over a period of time; one-off sessions are not enough. Moving pupils who are disengaged and disruptive to another group, class or school is at best a partial solution: disturbance to the work of peers is reduced but the target pupils’ reputations travel with them and the opportunity to change their identity as learner is therefore limited. Again, pupils see it as difficult to change their image if long-standing judgements held of them by teachers and by peers are not open to review. The idea of ‘the fresh start’ is important and both pupils and teachers need to respect, and assert, the possibility that pupils can change. Things that are important for young people who find learning a struggle include more time in school to talk about difficulties with sympathetic adults or with trained peer mentors; targets that they can identify themselves, that are relatively short term, and that they feel they might be able to achieve; and recognition of effort (positive letters home are highly valued). 3. How the transition from one year to another in the same school can affect learning From the adult perspective the path of learning is relatively straightforward: pupils move through the different years of schooling, building up a resource of knowledge, understanding and skills which provide a foundation for tackling the next, more advanced stage of work. From the pupils’ perspective the route through school is much more uneven and more difficult to negotiate and sustain. The project started by re-viewing the factors behind the well-documented dip in motivation and progress at Year 8. Our data confirmed the picture painted by earlier studies. Schools give more attention and resources to the exits and entrances years than to the in-between years, and pupils pick up messages that what matters in school is years with a test or exam. Year 8 is widely seen as unimportant and unexciting and pupils adjust their effort accordingly. Year 8 needed rescuing from itself in ways that give it status and significance. Other issues surfaced in the interviews. Particularly important is the need to meet pupils’ expectations of greater respect and responsibility as they move up through the years of secondary schooling: being a year older matters to young people and they want their increased social maturity to be marked: social progression, for them, is as important as curriculum progression is for teachers and policy makers. A third issue was the absence of any tradition of organising induction events that would help pupils look forward with excitement and confidence to the year ahead and
112
would help them to understand what advances in learning and in opportunities to exercise greater responsibility would look like. We set out to identify secondary schools that were beginning to give attention to these issues and we gathered information from thirteen. Some key observations and implications for schools What is missing for many pupils between the two high points of engagement in years 7 and 11 is a clear understanding of how later learning builds on earlier learning, not only in terms of content but also in terms of ways of working. This is not surprising given that each year of secondary schooling is fenced-off and made relatively self-contained. It can be useful for schools to monitor the messages that they are giving about the status of different years and to check out what pupils’ views of the year ahead are and what, retrospectively, they felt they needed more help with; such information can help schools to structure appropriate induction events. Year 8 seems to be a pivotal year when pupils need to be helped to think and act strategically in relation to their learning and to understand how a commitment to learning now can enhance life chances. Schools need to ensure that they are sustaining the view, in all they say and do, that Year 8 matters – and following this through into lifting the excitement of teaching and learning. They might also create opportunities for all pupils to be more autonomous in their learning and to feel that they can make a contribution as valued members of the school community. Data from the three projects outlined in this section suggest that there is a need for transition to be put firmly on the agenda and for some of the energy and imagination that teachers currently put into preparing for transfer to go into preparing pupils for year on year transitions. The data also confirm the usefulness of consulting pupils about their experiences of transfer and about their images of the transition years. Revisiting some key issues There are some important over-arching concepts that need to be re-interpreted in the light of our data and reviewed by teachers and schools and by those concerned with local and national policy. Because they are all familiar ideas they carry with them the baggage of past assumptions; the task of looking at them afresh is therefore harder. These are the three over-arching concepts that we want to discuss: Balancing continuities and discontinuities Progression Pressures towards achievement Continuities and discontinuities The competing images of earlier policy and research on transfer have been ‘the seamless web’ and ‘the fresh start’. Neither, we think, is sufficient as a guide to planning transfer. More recently, the dominant assumption has been that continuities in pupils’ learning need to be enhanced. Of course, Year 6 pupils are likely to learn better when the schools to which they transfer are familiar with their previous achievements and experiences, their special talents and the things they find difficult in

113
learning. But when we tuned in to what Year 6 and Year 7 pupils were saying it became clear that while continuity matters for some aspects of transfer, discontinuity is also important – especially for pupils. Continuity has been mainly thought about in terms of the curriculum and is currently supported by ‘Bridging Units’. However, if there is a project that pupils started in Year 6 and have to complete in Year 7, some are likely to dismiss it as mere ‘primary school stuff’; they want something different which presents some new challenges. Of course there is always a minority of pupils who find learning a struggle and prefer repetition to challenge because they ‘know they can do it’; for these pupils, progression is the problem. Bridging Units can also create problems if the transfer school receives pupils from a large number of feeder schools where the units have been handled in different ways. Ironically, while policy makers and schools have given attention to curriculum continuity they have thought less about continuity in ways of learning. Pupils who have developed a language for talking about learning in their primary schools – the beginnings of a meta-cognitive capability – can find that this is not asked about or built on in the secondary school. This, in our view, is a significant loss. Social continuity is provided mainly by friends from the primary school who transfer at the same time. However, we need to be aware that while pupils want the social support of having good friends at hand, they can be quite sophisticated about distinguishing between the friends they work well with and other friends who can be a source of distraction. Our position is that schools need to review the balance of continuities and discontinuities around the transfer experience, bearing in mind that, for pupils, discontinuity marks a new and important stage in their school careers. In particular a shift of focus is needed towards strategies that sustain the ‘excitement’ of learning (and the commitment to learning that such excitement can generate) beyond the initial stages of transfer. In order to allow sufficient time for this to develop, some ‘liaison initiatives’ may need to be cut back in scope. What we have said in the body of the report is that, for good historical reasons, partly reflecting the findings of an earlier swathe of research, schools have invested a lot of energy and resources in easing the social disorientations of transfer and given less attention to the academic dimensions of transfer. However, many schools do now have a range of academic support activities in place for new pupils - both before and after transfer. Besides induction days there are special interviews for pupils identified as being ‘at risk’, summer catch-up classes for low-achieving pupils and ‘arts-based’ summer schools for pupils who are gifted. Many schools also have ‘learning mentors’ for pupils who find learning a struggle. The importance of balancing the academic and the social needs to be more widely recognised. Additionally, our data suggest that we need to match the attention given to the exits and entrances years with more thoughtful inductions for the in-between years so that pupils look forward with excitement and confidence to what lies ahead; in this way disengagement during the middle years of secondary schooling may be reduced. Pupils might also be helped to see the five years of secondary schooling more
114
holistically, rather than as a series of discrete experiences whose significance relates directly to the existence of tests and exams. Progression Progression is mainly thought about in terms of pupils’ passage through the curriculum where ‘levels’ now provide staging posts and markers of achievement. But it can also be thought about in terms of planned advances in pedagogy and acknowledgement of pupils’ social maturity as well as their developing understanding of the processes of learning and of themselves as learners. We think that more sustained attention needs to be given to these concerns. Progression in teaching and learning: The Literacy and Numeracy strategies, now extended into Key Stage 3, have put the emphasis on curriculum planning as a means of ensuring continuity and progression across key stages. Most schools and subject departments now have extensive development plans covering learning objectives, lesson plans, targets and so on. While secondary teachers are therefore becoming increasingly knowledgeable about the content of lessons in Key Stage 2, they are less familiar with the range of teaching and learning strategies employed by their primary colleagues. Without such an understanding it is not possible for secondary schools to build upon primary pedagogy. The increased use of peer observation is one means of establishing improved understanding but it may also be necessary for primary and secondary schools to establish some more common frameworks for advances in pedagogy by progressively developing pupils’ experiences of (and abilities to respond to) learning in different ways. Progression in terms of pupils’ social maturity: For young people, being a year older matters enormously. Moving from one key stage to another is important, but when you add in the move from one phase of education to another and the move from one school to another there is a fourfold significance! Post-transfer, as they move up through the years of secondary school, pupils want - and expect – to be treated more like adults and to have more autonomy and trust. They are often disappointed. Most of our attention is given to progression through the curriculum and its key stages and we neglect to mark young people’s social maturity and to plan for a yearly enhancement of opportunities and responsibilities. ‘Being treated like little children’, as pupils see it, can lead some to disengage. Progression in terms of pupils’ developing a sense of themselves as learners: It is important that young people are helped to build and sustain, throughout the years of secondary schooling, a positive image of themselves as learners. However, we need to be alert to the moments when their self-image and social and academic confidence become vulnerable. Grouping and testing are the two practices, in both primary and secondary schools, that can send powerfully negative messages to young people about their academic worth. Some respond by dissociating themselves from the school’s dividing practices – and its learning purposes. Schools need to create a more coherent framework for learning in which progression can be seen in terms of advances in ways of learning and in the monitoring and management of one’s own learning profile. One way forward is for departments in secondary schools to give priority to extended conversations about coherence and
115
progression across the years of secondary school, leading to joint planning and shared initiatives. Pressures towards Achievement The intended and unintended influences of Key Stage assessments: The dominance of the Key Stage assessments in structuring schools’ approaches to teaching and learning was clearly evident in our research. The ‘backwash’ on transfer initiatives is powerful and not easily resisted. Over a period of years schools have come to construct a series of expectations about how pupils will develop. In our earlier report we commented on the tendency to give particular prominence to the ‘exit and entrance’ years. In the current system the years which can appear to ‘really matter’ are those which lead up to the Key Stage assessments (Years 2, 6, 9 and 11). A climate now needs to be encouraged which gives greater emphasis to the development of learning over time, rather than one where learning comes to be seen as a series of extended (but nonetheless comparatively short) test or exam-led bursts - or ‘quick fixes’. Our data on pupils’ academic progress through the primary years show that only a minority of pupils take ‘equal-sized’ steps in reading and maths. In due course some redeployment of effort from the later years of the primary school to Years 3 and 4, where many of the problems of pupils who are ‘lagging behind’ can first be identified, will help. The Year 6 ‘push’, with its increased pressure on pupils to ‘achieve’ during their final year of primary schooling, needs to be countered. Giving schools more options about how they allocate any additional resources for raising achievement could help to facilitate this shift of focus, provided they build up clearer pictures of how their pupils are progressing over time; the current ‘snapshot’ approach is rather crude. However, the temptation to take short-term initiatives to ‘boost’ pupil performance at the margins (and, in the process, to accept that there will probably be some ‘loss of learning’ over the ensuing months) is understandably difficult for teachers to resist. Innovation overload as a barrier to change: Many of the teachers we encountered during the course of our research seemed willing to contemplate further developments in relation to transfer. However, in practice, the pressures on an ‘overloaded’ curriculum, the various requirements associated with the new reforms, and the demands and consequences of the statutory assessments mean that secondary schools are likely to afford transfer and transition initiatives less priority, particularly if GCSE results show a healthy upward trend. Primary schools certainly showed interest in both transitions and transfer; again, however, such interest was tempered by other priorities. Only by helping schools to decide what they will give up (alongside what they will introduce) is progress on these topics likely to be made. In both sectors greater attention needs to be focused on how schools attempt to innovate. There is a recurring tendency to load (and often to overload) the change agenda. In the area of transfer and transitions many schools will need help in deciding which potentially promising initiatives to develop and which existing practices to cut back on. Strategies which place a premium on understanding the processes from the pupils’ perspectives and on creating greater coherence could offer a fruitful way forward.

116
Overall recommendations In summary, our report acknowledges the very real progress that schools have made in ensuring that transfer is a relatively anxiety-free experience for pupils and their families. Our research suggests that a large number of schools (and probably the majority) could now usefully direct their attention to the issues listed below. By the same token, LEAs and government policy-makers need to ensure that teachers have the time and space to adapt our recommendations to their own contexts and determine the particular priorities for action. Our collaboration with schools suggests that the following are key issues for review:
* the academic (as opposed to social) dimensions of transfer and the specific strategies which help to sustain pupils’ progress; this is a concern for both primary and secondary schools.
* the coherence of the interventions primary schools have in place to sustain
pupils’ progress during the middle years of primary schooling as opposed to investing most of their energy in ‘catch-up’ strategies, especially during Year 6; this is mostly an issue for primary schools.
* the balance of pre and post-transfer activities; in particular, the time and
resources invested in post-transfer activities designed to sustain the excitement of learning and to help pupils develop a language for thinking and talking about their learning; this is mainly a concern for secondary schools.
* the social and the academic dimensions of within-school transitions including:
ways of marking pupils’ social maturity by increased responsibility and induction events for the in-between years that give pupils a positive orientation to the next year and a more confident understanding of what its academic demands will be. These concerns are relevant to both sectors.
To make time for these activities, both primary and secondary schools will need to consider which aspects of their current liaison activities are supporting the learning of their pupils, which activities need to be modified and which might usefully be reduced.

117
References Adey, P. and Shayer, M. (1994) Really Raising Standards: cognitive intervention and academic achievement, London: Routledge. Anderman, E. M., Maehr, M. L., and Martin, L. (1994), Motivation and schooling in the middle grades, Review of Educational Research, 64, 287-309 Anderson, L.W., Jacobs, J., Schramm, S. and Splittgerber, F. (2000) School Transitions: beginning of the end or a new beginning? International Journal of Educational Research, 33, (1) 325-339. Arnold, R. (2002) Gleams from the Beacon: Good Practice in Transition in Education: The Beacon Council Scheme 2002-03, Slough: NFER. Barnes, A., Venkatakrishnan, H. and Brown, M. (2003) Strategy or Strait-Jacket? Teachers’ views on the English and mathematics strands of the Key Stage 3 National Strategy, Final Report, London: Association of Teachers and Lecturers (ATL). Berndt, T. J. and Keefe, K. (1995) Friends’ influence on adolescents’ adjustment to school, Child Development, 66, 1312-1329. Beynon, J. (1985) Initial Encounters in the Secondary School, Lewes: Falmer Press Black, P., Harrison, C., Lee, C., Marshall, B. & Wiliam, D. (2002), Working Inside the Black Box: Assessment forLearning in the Classroom, Department of Education and Professional Studies, King’s College, London. Blatchford, P. (1998). Social Life in School: Pupils’ Experience of Breaktime and Recess, London: Falmer Press. Boaler, J., Wiliam, D. and Brown, M. (2000) Students’ experiences of ability grouping – diasaffection, polarisation and the construction of failure, British Educational Research Journal, 26, 5, 631-648. Chaplain, R, (1996) Making a strategic withdrawal: disengagement and self-worth protection in male pupils in Rudduck, J., Chaplain, R. and Wallace, G. (eds) School Improvement -What Can Pupils Tell Us?, London: David Fulton Publishers, pp.101-115. Charles, M., Minnis, M., Schagen, I., Hammond, P. and Morrison, J. (2000) Data Collection Years 3, 4 and 5 Optional Tests 2000, Technical Report for QCA, Slough: NFER Doddington, C., Flutter, J., Bearne, E. and Demetriou, H. (2001) Sustaining Pupils’ Progress at Year 3: Research Report, Cambridge: University of Cambridge Faculty of Education.
118
English, E., Hargreaves, L. and Hislam, J. (2002) ‘Pedagogical Dilemmas in the National Literacy Strategy: primary teachers’ reflections, perceptions and classroom behaviour,’ Cambridge Journal of Education, 32, (1) 9-26. Filer, A. and Pollard, A. (2000) The Social World of Pupil Assessment: Processes and Contexts of Primary Schooling, London: Continuum. Galton, M. (1989) Teaching in the Primary School, London: David Fulton. Galton, M. and Fogelman, K. (1998) ‘The Use of Discretionary Time in the Primary Classroom’, Research Papers in Education, (13) 119-139. Galton, M., Gray, J. and Rudduck, J (1999) The Impact of School Transitions and Transfers on Pupil Progress and Attainment, Research Report RR131, Nottingham, DfEE Publications. Galton, M., Hargreaves, L., Comber, C., and Wall, D. (2000) Inside the Primary Classroom: 20 Years On, London: Routledge Galton, M.and MacBeath, J. (2002) A Life in Teaching? The Impact of Change on Primary Teachers’ Worklives, A Report for the National Union of Teachers (NUT), Faculty of Education, University of Cambridge. Galton, M., Simon, B. and Croll, P. (1980) Inside the Primary Classroom, London: Routledge & Kegan Paul. Galton, M. and Willcocks, J. (1983) (eds.) Moving from the Primary School, London: Routledge and Kegan Paul. Hardman, F., Smith, F. and Wall, K. (2001) An Investigation into the Impact of the National Literacy Strategy on the Learning of Pupils with Special Educational Needs in Mainstream Primary Schools, A Report to the Nuffield Foundation, University of Newcastle Upon Tyne. Hargreaves, L. and Galton, M. (2002) Moving from the Primary Classroom: 20 Years On, London: Routledge. Hartup, W.W. (1996). Cooperation, close relationships, and cognitive development. In W.M. Bukowski, A.F. Newcomb, & W. W. Hartup (eds.), The Company They Keep: Friendships in Childhood and Adolescence, Cambridge: Cambridge University Press. Ladd, G.W. (1990). Having friends, keeping friends, making friends, and being liked by peers in the classroom: Predictors of children’s early school adjustment? Child Development, 61, 1081-1100. Lahelma, E., and Gordon, T. (1997) First day in secondary school: learning to be a ‘professional pupil’, Educational Research and Evaluation, 3, 2, 119-139.
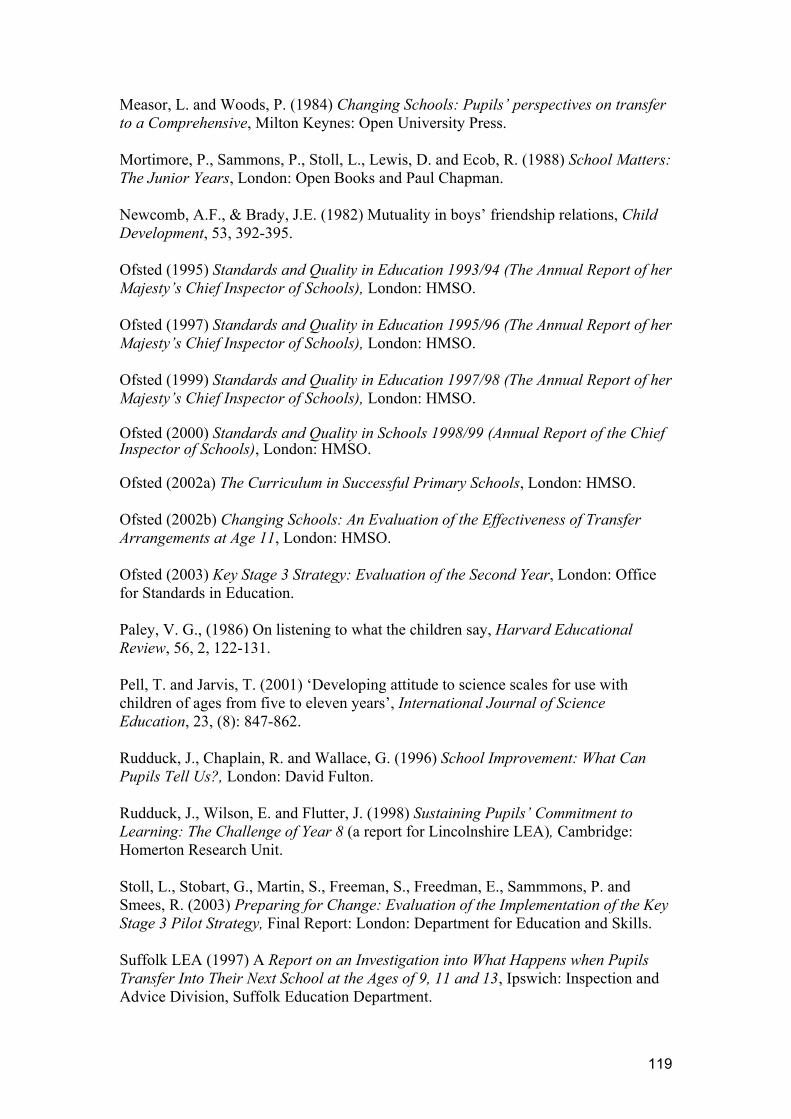
119
Measor, L. and Woods, P. (1984) Changing Schools: Pupils’ perspectives on transfer to a Comprehensive, Milton Keynes: Open University Press. Mortimore, P., Sammons, P., Stoll, L., Lewis, D. and Ecob, R. (1988) School Matters: The Junior Years, London: Open Books and Paul Chapman. Newcomb, A.F., & Brady, J.E. (1982) Mutuality in boys’ friendship relations, Child Development, 53, 392-395. Ofsted (1995) Standards and Quality in Education 1993/94 (The Annual Report of her Majesty’s Chief Inspector of Schools), London: HMSO. Ofsted (1997) Standards and Quality in Education 1995/96 (The Annual Report of her Majesty’s Chief Inspector of Schools), London: HMSO. Ofsted (1999) Standards and Quality in Education 1997/98 (The Annual Report of her Majesty’s Chief Inspector of Schools), London: HMSO. Ofsted (2000) Standards and Quality in Schools 1998/99 (Annual Report of the Chief Inspector of Schools), London: HMSO. Ofsted (2002a) The Curriculum in Successful Primary Schools, London: HMSO. Ofsted (2002b) Changing Schools: An Evaluation of the Effectiveness of Transfer Arrangements at Age 11, London: HMSO. Ofsted (2003) Key Stage 3 Strategy: Evaluation of the Second Year, London: Office for Standards in Education. Paley, V. G., (1986) On listening to what the children say, Harvard Educational Review, 56, 2, 122-131. Pell, T. and Jarvis, T. (2001) ‘Developing attitude to science scales for use with children of ages from five to eleven years’, International Journal of Science Education, 23, (8): 847-862. Rudduck, J., Chaplain, R. and Wallace, G. (1996) School Improvement: What Can Pupils Tell Us?, London: David Fulton. Rudduck, J., Wilson, E. and Flutter, J. (1998) Sustaining Pupils’ Commitment to Learning: The Challenge of Year 8 (a report for Lincolnshire LEA), Cambridge: Homerton Research Unit. Stoll, L., Stobart, G., Martin, S., Freeman, S., Freedman, E., Sammmons, P. and Smees, R. (2003) Preparing for Change: Evaluation of the Implementation of the Key Stage 3 Pilot Strategy, Final Report: London: Department for Education and Skills. Suffolk LEA (1997) A Report on an Investigation into What Happens when Pupils Transfer Into Their Next School at the Ages of 9, 11 and 13, Ipswich: Inspection and Advice Division, Suffolk Education Department.

120
Suffolk LEA (2002) Transfer Review 2001, (available on http://www.slamnet.org.uk/transfer) Ipswich: Inspection and Advice Division, Suffolk Education Department. Taverner, S., Baumfield, V., Clark, J., Fisher, P.,Hall, I., Mei Lin., Smith, P. and Todd, L. (2001) Transition between Key Stages in Schools, Final Report for the Department of Local Government, Transport and the Regions (DLTR), Department of Education, University of Newcastle upon Tyne. Teddlie, C., Reynolds, D. and Sammons, P. (2000) The methodology and scientific properties of school effectiveness research, in Teddlie, C. and Reynolds, D. (eds) The International Handbook of School Effectiveness Research, London: Falmer Press. Wentzel, K.R. & Caldwell, K. (1997). Friendships, peer acceptance and group membership: Relations to academic achievement in middle school, Child Development, 68, 1198-1209. Wiliam, D. (2001) Level Best? Levels of Attainment in National Curriculum Assessment, London: Association of Teachers and Lecturers (ATL). Youngman, L and Lunzer, E. (1977) Adjustment to Secondary Schooling, Nottingham: School of Education, University of Nottingham.

Copies of this publication can be obtained from:
DfES PublicationsP.O. Box 5050Sherwood ParkAnnesleyNottinghamNG15 0DJ
Tel: 0845 60 222 60Fax: 0845 60 333 60Minicom: 0845 60 555 60
© Queen’s Printer 2003
Produced by the Department for Education and Skills
ISBN: 1 84478 024 4Ref No: RR443
www.dfes.go.uk/research