transdifferentiation as a mechanism of treatment...
TRANSCRIPT

Transdifferentiation as a mechanism of treatment resistance in a mouse model of
castration-resistant prostate cancer
Min Zou et al.
Summary of Supplementary Materials
Supplementary Figures
Figure S1: Additional analyses of NP and NPp53 GEM models
Figure S2: Tolerance and efficacy of abiraterone in mouse prostate
Figure S3: Additional analyses of tumor volumes in GEM models before and after treatment
Figure S4: Analyses of abiraterone treatment of cell lines from NP and NPp53 tumors
Figure S5: Examples of alternative histopathologies of NPp53 CRPC
Figure S6: Additional cross-species computational analyses
Figure S7: Additional analyses of expression of SOX11 and other NE genes
Supplementary Tables
Table S1: Description of human datasets used in this study
Table S2: Summary of preclinical phenotypic analyses
Table S3: Summary of histopathology of individual mouse tumors
Table S4: List of master regulators
Table S5: Quantitation of synaptophysin-positive cells in mouse CRPC
Table S6: List of antibodies used in this study
Table S7: List of primers and shRNA used in this study
Detailed experimental procedures
References
Dataset 1: Differentially expressed genes from the NP and NPp53 CRPC (uploaded separately)

Zou et al.
2
Figure S1
Legend: Additional analyses of NP and NPp53 GEM models
(A) Levels of steroid hormones, as determined by mass spectrometry, in serum or dorsolateral
prostate from intact or castrated NP or NPp53 mice, as indicated. p-values represent comparisons
between bracketed groups and were calculated using a t-test. Boxes without error bars were at
or below level of detection. The number of samples analyzed were: 1) Serum samples: NP intact
n=10, NP castrated n=10, NPp53 intact n=7, and NPp53 castrated n=10; 2) Prostate tissue
samples: NP intact n=16, NP castrated n=13, NPp53 intact n=7, NPp53 castrated n=10. These
analyses were done in the Biomarkers Core Laboratory at Columbia University Medical Center.
Note that although the NP and NPp53 intact mice have differing levels of androgens, which may
be due to differing levels of androgen synthesis enzymes as reported previously (1), following
castration, the levels of androgens in the NP and NPp53 were reduced to similar levels. (B) Cross-

Zou et al.
3
species gene set enrichment analyses (GSEA). Comparison of a reference mouse MR signature
from NPp53 CRPC versus NP CRPC with a query human MR signature comparing primary
tumors having low PTEN/low TP53 versus low PTEN/high TP53 based on the TCGA dataset (low
versus high TP53 (TCGA)). “NES” stands for normalized enrichment score; GSEA p-values were
calculated using 1000 gene permutations.
Zou et al.
4
Figure S2

Zou et al.
5
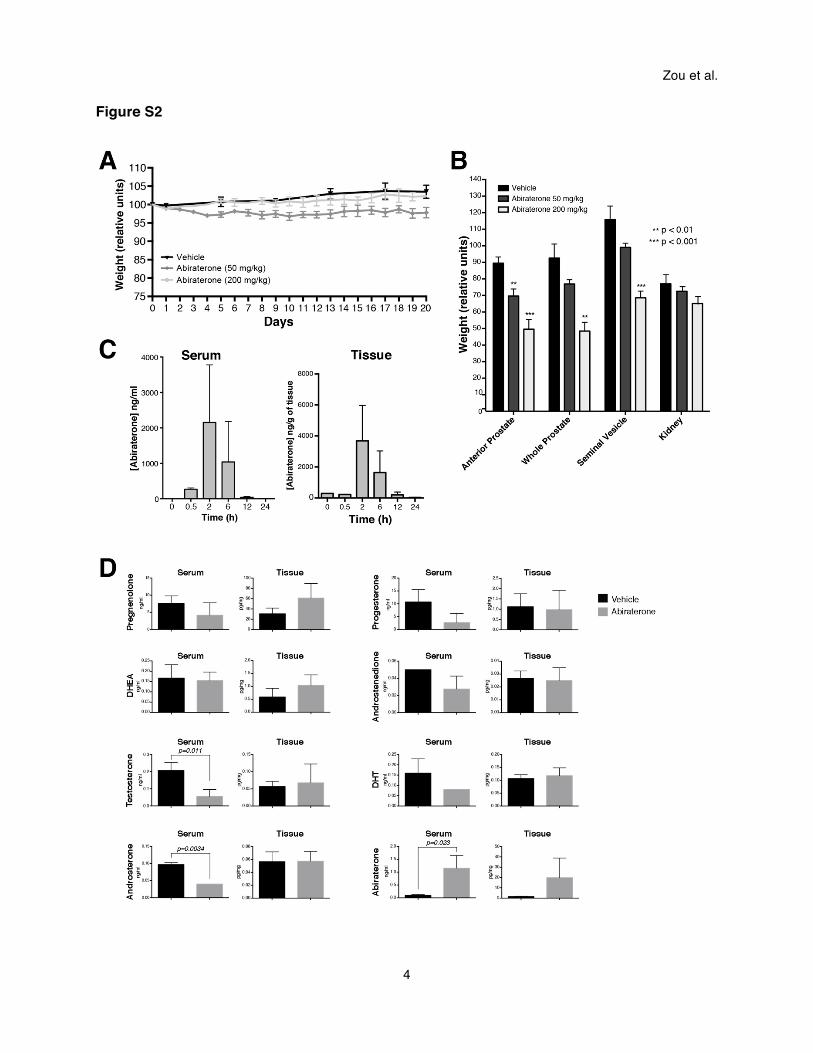
Legend: Tolerance and efficacy of abiraterone in mouse prostate
(A-C) Optimization of dose and scheduling for abiraterone-acetate treatment performed using
non-tumor bearing strain-matched littermates; abiraterone-acetate was delivered by oral gavage.
(A) Tolerance for abiraterone-acetate as a function of body weight over a period of 20 days. Mice
(n=5/group) were treated once daily for 20 days at the indicated concentration. Note that
treatments resulted in no appreciable loss of total body weight over the 20-day study period. (B)
Efficacy of abiraterone-acetate after 20 days of treatment (as in A) as assessed by measurement
of the wet weight of androgen-dependent (i.e., prostate and the seminal vesicle) and androgen-
independent (i.e., kidney) tissues. p-values represent comparisons between treatment and
vehicle groups (n = 5/group), and were calculated using a t-test. Note that the levels of
abiraterone-acetate used are similar to published studies in other mouse strains, including studies
that have evaluated human xenografts (2,3). (C) To confirm uptake of abiraterone-acetate in the
mouse prostate and its metabolism to the active form, as well as to determine the temporal
kinetics, mice (n = 3/group) were given a single dose of abiraterone-acetate (200 mg/kg) at time
zero and sacrificed at the indicated time-points. Levels of abiraterone were measured in serum
and prostate tissue using mass spectrometry.
(D) Levels of steroid hormones in serum and prostate tumors following treatment of NPp53 CRPC
with abiraterone-acetate (200 mg/kg) for 1 month. Serum and prostate tumors were collected
within 24 hours of the last treatment and snap-frozen until processed for mass spectrometry
analysis, which was performed in the Steroid Analysis Core of the Fred Hutchinson Cancer
Research Center. Shown are the levels of abiraterone and metabolites of steroid biosynthesis,
some of which are below the level of detection for the mass spectrometry assay. These data
confirm uptake and processing of abiraterone-acetate in mouse CRPC, in addition to the non-
tumor bearing mice evaluated in A-C, and show that steroids downstream of abiraterone-acetate,

Zou et al.
6
namely testosterone and androsterone, are significantly affected by the treatment. However, the
current mass spectrometry assay has not yet been optimized for new derivatives identified
recently by Li et al. (4,5). The number of samples analyzed were: 1) Serum samples: vehicle
treated n=3, abiraterone treated n=4; 2) Tissue samples: vehicle treated n=3, abiraterone treated
n=4. p-values represent comparison between abiraterone-and vehicle-treated group and were
calculated by a t-test. Boxes without error bars were at or below level of detection.

Zou et al.
7
Figure S3

Zou et al.
8
Legend: Additional analyses of tumor volumes in GEM models before and after treatment
(A) Images with anterior views from a 3-dimensional volumetric analysis of NP or NPp53 CRPC
following treatment with abiraterone. Shown are images collected immediately prior to treatment
(pre-treatment) and directly after the last treatment (post-treatment) with vehicle or abiraterone,
as indicated. Shown are the positions of the tumor, as well as the bladder and kidneys as a
reference.
(B) Growth curve showing the relative tumor volume for individual NPp53 mice after castration
and subsequent treatment with abiraterone or vehicle, as indicated.
(C) Comparison of tumor volume for individual NPp53 CRPC cases prior to or immediately
following treatment with vehicle or abiraterone, as indicated. Mice were randomly assigned to the
vehicle or abiraterone treatment groups. Note that there was no significant difference in the tumor
volumes of between these groups at the time of enrollment.

Zou et al.
9
Figure S4
Legend: Analyses of preclinical treatment of cell lines from NP and NPp53 tumors
Epithelial cell lines from treatment-naïve independent NPp53 or NP tumors (n=2 lines each) were
generated as described previously (6). (A) Western blot analysis using total cell extracts (10 µg)
to detect the indicated proteins. (B) Cell culture assays. To measure the consequences of
abiraterone for cell growth, NP or NPp53 cell lines, as indicated, were grown in charcoal-stripped
serum in the absence or presence of DHT (20 nM) followed by treatment with abiraterone (10 µM)
or vehicle for 0 to 72 hours. Samples, in triplicate, were analyzed by MTT assays. p-values
represent comparisons between bracketed groups and were calculated by a t-test. The conditions
used here for these mouse cell lines were similar to those reported previously in human cell lines

Zou et al.
10
(4). Note that inhibition of cell growth by abiraterone in the NP cell lines occurs in the absence of
DHT, suggestive of anti-AR mechanism as has been reported for human cells (4).
(C, D) In vivo tumor growth. NP or NPp53 cells (1 X 10⁶ cells) were implanted into the flank of
nude mice, and tumor growth was monitored by caliper measurement until they reached a size of
100-300mm3. The mice were then randomly enrolled for treatment with abiraterone (200
mg/kg/day) or vehicle 5 times per week for 4 weeks. The number of samples analyzed were: 1)
NP allografts: vehicle n=6, abiraterone n=4; 2) NPp53 allografts: vehicle n=6, abiraterone n=4.
(C) Tumor growth measurements. * and ** indicate p-values < 0.05 or 0.01, respectively,
calculated by a t-test. (D) Tumor weight at the conclusion of the study. p-values represent
comparisons between bracketed groups and were calculated by a t-test.

Zou et al.
11
Figure S5
Legend: Examples of alternative histopathologies of NPp53 CRPC
Representative H&E images of alternative histopathologies of NPp53 CRPC as indicated.

Zou et al.
12
Figure S6
Legend: Additional cross-species computational analyses
(A) Principal component analysis (PCA) of gene expression profiles from NP CRPC that were
treated with vehicle (veh) or abiraterone (abi), as indicated. (B) Cross-species GSEA. The
reference signature, a human MR signature from Best et al. comparing treatment-naïve androgen-
independent versus androgen-dependent prostate tumors, was compared with three independent
mouse MR query signatures comparing abiraterone- versus vehicle-treated samples from the
“responder”, “non-responder”, or “exceptional non-responder” groups. “NES” and p-value were
calculated using 1000 gene permutations.

Zou et al.
13
Figure S7

Zou et al.
14
Legend: Additional analysis of expression of SOX11 and other NE genes.
(A) Quantitative real-time PCR showing relative expression levels of Sox11, Rb1, and Sox2 in
individual mouse CRPC tumors treated with vehicle or abiraterone as indicated. The individual
mouse ID numbers correspond to the cases shown in Table S3. Gapdh was used as a reference;
p values were calculated using a t-test to compare the indicated groups (shown as bracketed)
consisting of multiple cases. Data show the mean ± S.D. for triplicates done for each individual
tumor. (B) Quantitative real-time PCR showing relative expression levels of Sox2 and Sox7, using
Gapdh as a reference, in the mouse NPp53 cell line 1 (see Fig. S4).

Zou et al.
15
Table S1: Description of human datasets used in this study
Name Description and uses n* Platform Geo/Ref TCGA Description:
• Surgical resection biospecimens from prostate adenocarcinoma without prior treatment
Use: • To demonstrate genomic alterations of PTEN and
TP53 in localized prostate cancer • To generate MR signatures from primary tumors
having low PTEN/low TP53 versus low PTEN/high TP53
333
Illumina HiSeq 2000
TCGA Data Portal (7)
SU2C Description: • Bone or soft tissue tumor biopsies from metastatic
castration-resistant prostate cancer (CRPC) Uses: • To demonstrate genomic alterations of PTEN and
TP53 in CRPC • To generate MR signatures from CRPC having
low PTEN/low TP53 versus low PTEN/high TP53
150
Illumina HiSeq 2500
dbGap: phs000915.v1.p1 (8)
Best et al. Description: • Treatment naïve androgen-independent primary
tumors from biopsies • Treatment naïve androgen-dependent primary
tumors from prostatectomies Use: • To generate MR signatures of treatment naïve
androgen-independent versus androgen-dependent primary disease
• For single-sample GSEA analysis
10 10
Affymetrix Human Genome U133A Array
Geo: GSE2443 (9)
Grasso et al. Description: • Rapid autopsy specimens from metastatic CRPC • Prostatectomy specimens from localized prostate
cancer • Rapid autopsy specimens from matched benign
prostate tissues Use: • To generate MR signatures of metastatic CRPC
versus primary tumors
35 59 28
Agilent Human Genome 44K Array
Geo: GSE35988 (10)
Balk et al. Description: • Bone metastases from CRPC obtained from bone
marrow biopsies • Hormone treatment naïve prostate tumors
isolated from frozen biopsies Use: • To generate MR signatures of metastatic CRPC
bone metastasis versus primary tumors
29 22
Affymetrix Human Genome U133A Array
Geo: GSE32269 (11)
Beltran et al. Description: • Adenocarcinoma CRPC • Neuroendocrine CRPC Use: • To generate MR signatures of CRPC-NE versus
CRPC-Adeno
34 15
Illumina HiSeq 2500
dbGap: phs000909.v.p1 (12)

Zou et al.
16
Sboner et al. Description: • Transurethral specimens of patients from the
Swedish waiting–watchful cohort • One of the few datasets that has extensive
clinical follow-up data for a 20-year period including the outcome of death due to prostate cancer.
Use: • For clinical validation, relative to disease-specific
survival
281
Human 6K Transcription-Informative Panel for DASL
Geo: GSE16560 (13)
*n = number of cases in the cohort

a) 7/13 of the vehicle-treated mice cases were increased in size (>10% increase); 6/13 were unchanged (< 10%). b) 12/16 of the abiraterone-treated mice cases were increased in size (>10% increase); 3/16 were unchanged (< 10% change);
1/16 decreased (>10% decrease).
Table S2: Summary of preclinical studies of GEM models
GEM Treatment Total Group N
Weight (grams)
MRI (mm3) Frequency and % area non-
Adenocarcimoma
% Ki67+ cells Mets
N Pre-treat
Post- treat
N %Adeno % Other
NP Intact w/ vehicle
9
0.62 ± 0.31
4 1120.05±691.73
1285.97±772.45
11.11% of cases and 0.4% of area
N.D. N.D. N.D. 0/9
Intact w/ abiraterone
11 0.56 ± 0.31 4 1098.38±639.80
1116.18±870.38
0% of cases and 0% of area
N.D. N.D. N.D. 0/11
CRPC w/ vehicle
15 0.87 ± 0.80
8 1248.98±948.76
1564.10±1537.28
6.67 % of cases and 0.5% of area
3 29.80 ± 3.76
N.D. 0/15
CRPC w/ abiraterone
21 0.66 ± 0.26
12 1270.53±705.00
1082.19±555.54
14.29 % of cases and 0.9% of area
3 10.18 ± 1.55
N.D. 0/21
NPp53 Intact w/ vehicle
11 0.83 ± 0.39
5 853.90± 306.60
925.56±294.22
18.18% of cases and 1.7% of area
N.D. N.D. N.D. 0/11
Intact w/ abiraterone
10 1.33 ± 1.42
4 870.38± 293.01
1638.77±1736.67
50% of cases and 36.6% of area
N.D. N.D. N.D. 0/10
CRPC w/ vehicle
21 0.52 ± 0.35
13a 706.98± 266.18
806.95± 413.63
42.86% of cases and 13.5% of area
10 17.57 ± 4.49
48.24 ± 8.04
0/21
CRPC w/ abiraterone
28 0.92 ± 1.07
16b 709.78± 711.97
1284.83±1692.94
39.29% of cases and 18.9% of area
6 25.35 ± 3.80
50.68 ± 9.43
4/28

Zou et al.
18
Table S3: Detailed analyses of alternative histopathology in individual experimental mice
NP intact (vehicle) Frequency and percentage of alternative histopathologies
Mouse ID Squamous Sarcomatoid Other 51 0% 0% 0% 52 0% 0% 0%
125 0% 0% 0% 176 0% 0% 0% 652 0% 0% 0% 653 0% 0% 0%
1763 0% 0% 0% 2753 0% 4% 0% 2927 0% 0% 0%
Totals: # of cases 1/9
0/9
1/9
0/9
% area affected 0.4 0% 0.4% 0%
NP intact (abiraterone)
Mouse ID Squamous Sarcomatoid Other 35 0% 0% 0% 38 0% 0% 0%
133 0% 0% 0% 137 0% 0% 0% 654 0% 0% 0%
1755 0% 0% 0% 1756 0% 0% 0% 1757 0% 0% 0% 1764 0% 0% 0% 2750 0% 0% 0% 9816 0% 0% 0%
Total # of cases 0/11
0/11
0/11
0/11
% affected area 0 0% 0% 0%
NP CRPC (vehicle) Mouse ID Squamous Sarcomatoid Other
0308 0% 0% 0% 128 0% 0% 0%

Zou et al.
19
163 0% 0% 0% 164 0% 0% 0% 165 0% 0% 0% 166 0% 0% 0% 167 0% 0% 0% 306 0% 0% 0% 308 7% 0% 0% 401 0% 0% 0% 423 0% 0% 0%
2141 0% 0% 0% 6028 0% 0% 0% 7594 0% 0% 0% 7605 0% 0% 0%
Total # of cases 1/15
1/15
0/15
0/15
% affected area 0.5 0.5% 0% 0%
NP CRPC (abiraterone)
Mouse ID Squamous Sarcomatoid Other 72 0% 0% 0% 73 0% 0% 0% 74 0% 0% 0%
205 0% 0% 0% 206 0% 0% 0% 321 0% 0% 0% 405 0% 0% 0% 451 5% 0% 0% 452 0% 0% 0% 453 0% 0% 0% 735 0% 0% 0% 742 0% 0% 0% 965 0% 0% 0%
1008 0% 0% 0% 1012 0% 0% 0% 1028 0% 0% 0% 1029 10% 0% 0% 2144 4% 0% 0% 2155 0% 0% 0%

Zou et al.
20
7592 0% 0% 0% 7746 0% 0% 0%
Total # of cases 3/21
3/21
0/21
0/21
% affected area 0.9 0.9% 0% 0%
NPp53 intact (vehicle)
Mouse ID Squamous Sarcomatoid Other
2503 0% 0% 0% 2504 0% 0% 0% 2505 0% 0% 0% 2537 0% 0% 0% 2539 0% 0% 0% 4304 0% 0% 0% 4305 18% 0% 0% 4306 0% 0% 0% 4307 0% 0% 0% 5528 1% 0% 0% 5529 0% 0% 0%
Total # of cases 2/11
2/11
0/11
0/11
% affected area 1.7 1.7% 0% 0%
NPp53 intact (abiraterone)
Mouse ID Squamous Sarcomatoid Other 2365 0% 0% 0% 2547 0% 6% 75%HGC 2548 0% 0% 0% 2549 0% 0% 92%NEPC 2550 0% 0% 0% 4309 0% 0% 0% 4310 0% 0% 0% 5530 5% 0% 0% 5531 0% 88% 0% 5532 2% 98% 0%
Total # of cases 5/10
2/10
3/10
2/10
% affected area 36.6 0.7% 19.2% 16.7%

Zou et al.
21
NPp53 CRPC (vehicle) Mouse ID Squamous Sarcomatoid Other
1760 0% 0% 0% 1762 0% 0% 0% 2332 0% 15% 0% 2333 66% 0% 0% 2340 20% 0% 0% 2392 0% 12% 0% 2393 0% 26% 0% 4353 10% 0% 0% 5523 0% 0% 0% 5524 12% 0% 0% 5525 0% 0% 0% 7366 0% 0% 0% 7390 0% 0% 0% 7391 0% 0% 0% 7392 0% 0% 0% 9045 0% 0% 100%NEPC 9313 0% 0% 0% 9314 0% 0% 0% 9315 0% 0% 0% R660 22% 0% 0% R662 0% 0% 0%
Total # of cases 9/21
5/21
3/21
1/21
% affected area 13.5 6.2% 2.5% 4.8%
NPp53 CRPC (abiraterone)
Mouse ID Squamous Sarcomatoid Other 1767 0% 0% 0% 1768 0% 23% 0% 2341 0% 26% 0%
2381 0% 0% 0%
2384 0% 0% 0% 2385 0% 0% 0% 2386 0% 0% 0%

Zou et al.
22
2389 0% 94% 0% 3044 8% 0% 0% 3046 0% 0% 0% 4148 6% 29% 65%HGC 4315 0% 0% 0% 5519 0% 0% 0% 5521 0% 0% 0% 5522 0% 0% 0% 5527 0% 0% 0% 7386 0% 0% 0% 7387 16% 0% 0% 7559 8% 0% 0% 7805 0% 0% 0% 7831 0% 0% 0% 9043 0% 95% 0% 9044 0% 0% 0% 9309 0% 0% 0% 9310 5% 0% 0% R650 0% 0% 0% R652 0% 98%NE 0% R661 0% 0% 57%HGC
Total # of cases 11/28
5/28
6/28
2/28
% affected area 18.9 1.5% 13% 4.4%
HGC – High grade invasive carcinoma; NE- sarcomatoid cells express synaptophysin in 78% of cells; NEPC – Neuroendocrine prostate cancer

Zou et al.
23
Table S4: Human master regulators from NEPC versus CPRC from Beltran et al.
MR NES p-val FOXM1 7.318345946 2.51E-13 MYBL2 7.189080611 6.52E-13 UHRF1 5.595421566 2.20E-08 ZNF367 5.331317288 9.75E-08 BRCA2 5.183969152 2.17E-07 BRCA1 4.97232119 6.62E-07 MLF1IP 4.801564361 1.57E-06 MTA1 4.679705686 2.87E-06 TRIP13 4.401653731 1.07E-05 ZNF165 4.398927458 1.09E-05 E2F1 4.351791211 1.35E-05 ASF1B 4.331682031 1.48E-05 TIMELESS 3.991349187 6.57E-05 PSRC1 3.97684828 6.98E-05 CENPF 3.931479516 8.44E-05 E2F8 3.875318107 0.000106485 CENPK 3.81679967 0.000135194 DNMT3B 3.71263622 0.000205112 MLL4 3.575059897 0.000350148 PTTG1 3.560119071 0.000370687 NFKBIL2 3.474195458 0.000512388 SIN3B 3.472627672 0.00051539 CCNA2 3.464375179 0.000531465 ZBTB45 3.381379717 0.000721228 MLXIPL 3.298133977 0.000973297 E2F7 3.241800461 0.001187772 PTGES2 3.23037085 0.001236297 SOLH 3.224118386 0.001263611 SNAPC4 3.195306194 0.001396826 MLLT1 3.165304222 0.001549209 RBCK1 3.122117578 0.001795552 C11orf9 3.08294859 0.002049606 PRDM16 3.020764192 0.002521376 HDAC10 3.014238968 0.002576248 CNOT3 3.013407756 0.002583316 ZFR2 3.012340636 0.002592415

Zou et al.
24
TNFRSF4 2.949087991 0.003187132 HOXC13 2.856822035 0.004279057 MYT1L 2.853334959 0.004326299 SOX11 2.847739809 0.004403091 PAX7 2.839029163 0.004525102 HOXB9 2.824785039 0.004731235 SIRT6 2.822783368 0.004760873 RNF6 -2.80841587 0.004978589 NCOA2 -2.821131134 0.004785464 RB1CC1 -2.833570303 0.004603118 HOXB13 -2.841482892 0.004490426 BZW1 -2.881063205 0.003963362 AFF4 -2.88589843 0.003902981 MORF4L1 -2.89361875 0.003808303 USP16 -2.898083993 0.0037545 ZNF24 -2.89823236 0.003752724 MORC3 -2.921654216 0.003481779 TFEC -2.95698836 0.003106598 ATF6 -2.959583519 0.003080552 AFF1 -2.965705989 0.00301989 IKZF5 -2.970206558 0.002975996 ZNF260 -2.972444473 0.002954386 SATB1 -2.979590586 0.002886339 AKNA -3.003722366 0.002666986 NCOA7 -3.006349583 0.002644048 TLR2 -3.01313391 0.002585648 C19orf2 -3.020512341 0.002523474 ZNF615 -3.050720798 0.002282928 ELP2 -3.057464441 0.002232181 CAMKK2 -3.067774548 0.002156593 ZDHHC21 -3.103434394 0.001912886 ICAM1 -3.118721714 0.001816374 NR4A1 -3.145901931 0.001655755 CNOT6 -3.157822463 0.001589523 HMG20B -3.193815893 0.001404056 GLRX2 -3.193901343 0.001403641 CCNC -3.195695131 0.001394944 ZFYVE16 -3.208045807 0.001336402

Zou et al.
25
MNDA -3.241808275 0.001187739 FOXA1 -3.322669334 0.000891605 TRIP11 -3.33384343 0.000856549 AFF3 -3.374304221 0.000740025 ATP8B1 -3.440477844 0.000580688 MAPK1 -3.476555589 0.000507899 CREB3L4 -3.501666922 0.000462357 RLIM -3.524858716 0.000423709 VAV1 -3.535492099 0.000407016 LASS4 -3.644568758 0.000267841 MORF4L2 -3.681088608 0.00023224 MSC -3.695551373 0.00021941 ZDHHC6 -3.73693619 0.000186276 ATF1 -3.747491872 0.000178612 ZCCHC6 -3.764456401 0.000166912 ZEB2 -3.806606297 0.000140887 ELL2 -3.82485005 0.000130852 SETD7 -3.827607621 0.000129395 NLRP3 -3.980194141 6.89E-05 UBE2N -3.988476688 6.65E-05 SP140 -4.008178605 6.12E-05 BMI1 -4.009145158 6.09E-05 RUNX3 -4.13464316 3.56E-05 ZDHHC20 -4.231557456 2.32E-05 RIPK2 -4.234225018 2.29E-05 UBA3 -4.236066009 2.27E-05 ETS1 -4.37246377 1.23E-05 SLC30A9 -4.393337137 1.12E-05 IRF4 -4.627804077 3.70E-06 XBP1 -4.644131717 3.42E-06 SPDEF -4.732856475 2.21E-06 IKZF3 -4.757419536 1.96E-06 PRDM1 -4.76830259 1.86E-06 RAB18 -4.773868799 1.81E-06 IRF8 -4.907108083 9.24E-07 IL16 -4.982979651 6.26E-07 SKAP1 -5.036583959 4.74E-07 ZNF532 -5.058969121 4.22E-07

Zou et al.
26
IFI16 -5.066475319 4.05E-07 CD80 -5.184664174 2.16E-07 CIITA -5.670076527 1.43E-08 RHOH -5.706616738 1.15E-08 FLI1 -6.015645114 1.79E-09 STAT4 -6.114788049 9.67E-10 CD86 -6.216251278 5.09E-10 PARP15 -6.955954049 3.50E-12 HCLS1 -7.123012789 1.06E-12

Zou et al.
27
Table S5. Quantitation of Synaptophysin-positive cells Table S5A: Percentage of Synaptophysin-positive tumor cells.
NP intact (vehicle) % Synaptophysin+ tumor cells Mouse ID Syn+ Syn- Percentage
51 0 4414 0.00% 52 0 2997 0.00%
125 2 1445 0.14% Mean ± SD 0.05 ± 0.08
NP Intact (abiraterone) % Synaptophysin+ tumor cells
Mouse ID Syn+ Syn— Percentage 35 0 2495 0.00% 38 0 1824 0.00%
133 3 1430 0.21% Mean ± SD 0.07 ± 0.12
NP castrated (vehicle) % Synaptophysin+ tumor cells
Mouse ID Syn+ Syn— Percentage 128 0 1805 0.00% 308 0 1693 0.00% 401 0 1204 0.00%
2141 53 1915 2.69% 7594 0 417 0.00% 7605 23 1905 1.19%
Mean ± SD 0.65 ± 1.11
NP castrated (abiraterone) % Synaptophysin+ tumor cells Mouse ID Syn+ Syn— Percentage
405 8 1389 0.57% 735 2 2570 0.08%
1012 7 2139 0.33% 2144 72 2107 3.30% 2155 14 1293 1.07% 7592 13 1264 1.02% 7746 8 1570 0.51%
Mean ± SD 0.98 ± 1.08

Zou et al.
28
NPp53 intact (vehicle) % Synaptophysin+ tumor cells Mouse ID Syn+ Syn— Percentage
2503 1 2650 0.04% 2504 8 1255 0.63% 2505 2 1825 0.11% 2537 12 1855 0.64% 2539 8 1691 0.47% 4306 7 4294 0.16% 4307 13 4036 0.32%
Mean ± SD 0.34 ± 0.25
NPp53 Intact (abiraterone) % Synaptophysin+ tumor cells Mouse ID Syn+ Syn— Percentage
4310 29 3492 0.82% 2550 32 3429 0.92% 2365 1 1362 0.07% 2547 3 1592 0.19% 2548 0 961 0.00%
Mean ± SD 0.4 ± 0.44
NPp53 castrated (vehicle) % Synaptophysin+ tumor cells Mouse ID Syn+ Syn— Percentage
2332 25 1908 1.29% 2333 118 2194 5.10% 2340 32 1699 1.85% 2393 28 2103 1.31% 4353 47 2931 1.58% 7366 87 2624 3.21% 7391 77 2631 2.84% 7392 118 2568 4.39% 9314 29 1811 1.58% 1760 57 2301 2.42% 1762 55 2300 2.33%
Mean ± SD 2.54 ± 1.26 9045 (Overt CRPC-NE) 2988 5 99.83%

Zou et al.
29
NPp53 castrated (abiraterone) % Synaptophysin+ tumor cells
Mouse ID Syn+ Syn— Percentage 2381 39 1581 2.41% 2384 88 1886 4.46% 2385 39 1598 2.38% 2386 209 1774 10.54% 3044 83 3477 2.33% 3046 68 2972 2.24% 7386 62 1896 3.17% 7559 112 3402 3.19% 9309 32 1875 1.68% 9044 123 2527 4.64% 1767 161 2557 5.92% 1768 152 2596 5.53%
Mean ± SD 4.03 ± 2.47 R652 (Overt CRPC-NE) 2191 629 77.69%

Zou et al.
30
Table S5B. Percentage of Synaptophysin-positive cells co-expressing GFP or Ki67
NPp53 castrated (vehicle) % Synaptophysin+GFP+ cells Mouse ID Syn+GFP+ Syn+GFP– Total
7366 116 0 116/116 7391 130 6 130/136 7392 121 16 121/137 Total 367/389
9045 (Overt CRPC-NE) 1472 9 1472/1481
NPp53 castrated (abiraterone) % Synaptophysin+GFP+ cells
Mouse ID Syn+GFP+ Syn+GFP– Total 2384 102 1 102/103 2385 125 0 125/125 2386 119 0 119/119 Total 346/347
R652 (Overt CRPC-NE) 519 2 519/521
NPp53 castrated (vehicle) % Synaptophysin+Ki67+ cells Mouse ID Syn+Ki67+ Syn+Ki67- Total
7366 0 89 0/89 7391 0 115 0/115 7392 0 108 0/108 9314 0 45 0/45 Total 0/357
9045 (Overt CRPC-NE) 1094 830 1094/1924
NPp53 castrated (abiraterone) % Synaptophysin+Ki67+ cells Mouse ID Syn+Ki67+ Syn+Ki67– Total
2384 0 106 0/106 2386 0 125 0/125 3046 0 113 0/113 7559 0 216 0/216 Total 0/560
R652 (Overt CRPC-NE) 461 577 461/1038

Zou et al.
31
Table S6: List of antibodies used in this study
Antigen Company Catalog # Type Use and dilution
IF/IHC Western β-actin Cell Signaling 4970 Rabbit mAb 1:2000
AR Sigma-Aldrich A9853 Rabbit pAb 1:2000
AR Abcam ab133273 Rabbit mAb 1:100 1:1000
Chromogranin A Abcam ab15160 Rabbit 1:500
Cytokeratin 5 Covance SIG-3475 Chicken pAb 1:500
Covance PRB-160P Rabbit pAb 1:500 1:1000
Cytokeratin 8 Covance MMS-162P Mouse mAb 1:1000
DSHB TROMA-1 Rat mAb 1:100
Foxa2 Abnova H00003170-M12 Mouse mAb 1:50
GFP Abcam ab13970 Chicken pAb 1:1000
Ki67 eBiosciences 14-5698-82 Rat IGa2 1:500
Pan-Cytokeratin Dako Z0622 Rabbit pAb 1:500
Phospho-Akt (Ser473) Cell Signaling
4060
Rabbit mAb 1:1000
Phospho-Rb
Santa Cruz
sc-16670-R
Rabbit pAb
1:200
Phospho-S6 (Ser235/236) Cell Signaling 2211 Rabbit pAb 1:1000
Synaptophysin BD Biosc. 611880 Mouse mAb 1:500
Synaptophysin Zymed 18-0130 Rabbit pAb 1:250
Secondary antibodies used:
Antibody Fluorochrome Company Catalog # Dilution
Goat anti-rabbit IgG Alexa Fluor® 488 Life Technologies A11008 1/1000
Goat anti-rabbit IgG Alexa Fluor® 555 Invitrogen A21428 1/1000
Goat anti-mouse IgG Alexa Fluor® 488 Life Technologies A11001 1/1000
Goat anti-mouse IgG Alexa Fluor® 555 Life Technologies A21424 1/1000
Goat anti-mouse IgG Alexa Fluor® 594 Invitrogen A11032 1/500
Goat anti-chicken IgG Alexa Fluor® 488 Invitrogen A11039 1/1000
Goat anti-rat IgG Alexa Fluor® 594 Invitrogen A11007 1/500
Biotinylated anti-mouse IgG Biotinylated anti-rabbit IgG Biotinylated anti-rat IgG
None None None
Vector Laboratories Vector Laboratories BD Biosciences
BA-9200 BA-1000 559286
1/1000 1/300 1/300

Zou et al.
32
Supplementary Table S7: Description of primers and shRNA used in this study
Real Time qPCR
Forward Reverse
Mouse genes
Sox2 TTTGTCCGAGACCGAGAAGC CTCCGGGAAGCGTGTACTTA
Sox7 GTGGGCCAAGGATGAGAG CCATGACTTTCCCAGCATC
Sox11 CGACGACCTCATGTTCGACC GACAGGGATAGGTTCCCCG
NSE AGGTGGATCTCTATACTGCCAAA GTCCCCATCCCTTAGTTCCAG
Synaptophysin CATTCAGGCTGCACCAAGTG TGGTAGTGCCCCCTTTAACG
Rb1 TGCATCTTTATCGCAGCAGTT GTTCACACGTCCGTTCTAATTTG
GAPDH AGGTCGGTGTGAACGGATTTG TGTAGACCATGTAGTTGAGGTCA
shRNA Clone ID Oligo Seq
shSox11 #1 TRCN0000012102 CCGGGTTCGACCTGAGCTTGAATTTCTCGAGAAATTCAAGCTCAGGTCGAACTTTTT
shSox11 #2 TRCN0000012099 CCGGGCTGTACTACAGCTTCAAGAACTCGAGTTCTTGAAGCTGTAGTACAGCTTTTT

Zou et al.
33
Detailed experimental procedures
Genetically engineered mouse (GEM) models
All experiments using animals were conducted according to protocols approved by the
Institutional Animal Care and Use Committee (IACUC) at Columbia University Medical Center.
The Nkx3.1CreERT2/+ allele (N mice) contains a tamoxifen-inducible Cre under the control of the
Nkx3.1 promoter, resulting in heterozygous deletion of Nkx3.1 in the germline and, following
delivery of tamoxifen, conditional gene recombination specifically in prostate luminal epithelial
cells (14,15). The Nkx3.1CreERT2/+ allele was crossed with a conditional Pten allele to generate the
Nkx3.1CreERT2/+; Ptenflox/flox mice (NP mice) as described in (16), and a conditional Trp53 allele (17)
to generate the Nkx3.1CreERT2/+; Ptenflox/flox; Trp53flox/flox mice (NPp53 mice) described herein. For
lineage tracing, NP and NPp53 mice were crossed with a Rosa-CAG-LSL-EYFP-WPRE reporter
allele, which contains a conditionally-activatable enhanced YFP (EYFP) under the control of the
Rosa locus (18). Mouse alleles were obtained from the NCI Mouse Models of Human Cancer
Consortium Repository (http://mouse.ncifcrf.gov/) or the Jackson Laboratory (https://www.jax.org)
and maintained in a mixed C57BL/6/129S strain background. Cre activity was induced in mice at
3 months of age by oral delivery of tamoxifen (Sigma; 100 mg/kg/day in corn oil) for 4 consecutive
days as described previously (6,16). Notably, in published studies using this Nkx3.1CreERT2 driver,
we have controlled for potential transient effects of tamoxifen (which is an estrogen analog) on
the prostate phenotype (see (14)). Where indicated, mice were androgen-ablated by surgical
castration as in (16). Tumor-bearing mice were monitored daily to assess body condition as
described in (19), and were euthanized if their Body Condition Score was <1.5, as per IACUC
guidelines.

Zou et al.
34
Preclinical and phenotypic analysis of NP and NPp53 mice
Abiraterone-acetate was provided by Johnson & Johnson. Optimal dosage,
pharmacokinetic profile, and optimal scheduling were determined using non-tumor bearing
littermates to control for strain background, based on published studies in other mouse strain
backgrounds (2,3). To determine dosage tolerance, abiraterone-acetate was diluted to the desired
concentration in corn oil, and administrated by oral gavage at a dose of 50 or 200 mg/kg once
daily for 3 weeks. Body weight and animal condition were recorded daily throughout the dosing
period and compared to the vehicle control group. At the conclusion of the study, androgen-
dependent tissues from the urogenital system (e.g., prostate and seminal vesicle) and androgen-
independent ones (e.g., kidney) were isolated and their wet weights were determined. To
determine the pharmacokinetic profile, mice were administered a single dose of abiraterone-
acetate (200 mg/kg) at time 0, and then sacrificed at individual time points up to 24 hours following
drug delivery. At the time of sacrifice, prostate tissues and serum were collected and levels of
abiraterone, the active form of abiraterone-acetate, were determined by mass spectrometry.
Based on these studies and published work (2,3), preclinical studies were performed by
administration of abiraterone-acetate once daily on a Monday to Friday schedule by oral gavage
at a dose of 200 mg/kg/day for a period of four weeks. Cohorts of NP and NPp53 mice were
induced with tamoxifen at 3 months of age; after tumor induction, the mice underwent castration
(or mock surgery) at 10 or 7 months, respectively. Mice were randomly enrolled in the vehicle or
abiraterone treatment groups, which was initiated two months following castration. Treatment was
continued for four weeks, except in cases where the mouse had to be euthanized early due to
poor body condition score (as above). During the last week of treatment, mice were treated for 7
consecutive days and dissected within 24 hours of the last treatment.
Zou et al.
35
Tumor volume was monitored by Magnetic Resonance Imaging (MRI) using a Bruker
Biospec 9.4T Tesla Small Animal MR Imager located within the mouse barrier in the Herbert Irving
Cancer Center Small Animal Imaging facility. In some cases, MRI imaging was done using a
Bruker ICON 1 Tesla desktop MRI scanner, which was also located within the mouse barrier. For
determination of the change in tumor volume as a consequence of treatment, MRI was done
immediately prior to initiation of treatment and then immediately following the last drug treatment.
Images were generated using ParaVision 6 software for preclinical MRI (Bruker) and reviewed by
an MRI physicist (YS). Volumetric analysis was done using Analyze software (AnalyzeDirect); 3-
D model reconstruction was done using 3DSlicer software (http://www.slicer.org).
At the time of sacrifice, full necropsy was performed on each experimental mouse. Mice
were also inspected for signs of overt metastasis, guided by visual inspection of YFP expression
from the reporter allele, as described in (6). Prostate tissues were collected, photographed, and
weights determined. Individual prostatic lobes (anterior, dorsolateral, and ventral) were fixed in
10% formalin and paraffin-embedded, cyropreserved in Optimal Cutting Temperature (OCT)
compound, or snap-frozen in liquid nitrogen; serum was collected and stored in -80°C. Tissues
with visible metastases were fixed in 10% formalin and paraffin-embedded for histopathological
validation. Pathological grading was done on hematoxylin-eosin (H&E) stained slides; cases were
reviewed blinded by the pathologist (MR). For each individual experimental mouse analyzed, a
minimum of 2 and up to 12 H&E sections through the tumor mass were examined to determine
the presence of adenocarcinoma and alternate histopathologies. The percentage area of these
phenotypes in each experimental animal was determined using ImageJ 1.50i (NIH). These data
are summarized in Table S3.
Immunohistochemical and immunofluorescence staining were done on 3 μm paraffin
sections as previously described (15). Briefly, sections were deparaffinized in xylene, followed by

Zou et al.
36
antigen retrieval in antigen unmasking solution (Vector Labs). Slides were blocked in 10% normal
goat serum, then incubated with primary antibodies overnight at 4°C, followed by incubation with
secondary antibodies for 1 hour. All antibodies used in this study are described in Table S6. For
immunohistochemical staining, the signal was enhanced using the Vectastain ABC system and
visualized with NovaRed Substrate Kit (Vector Labs). The slides for immunohistochemistry were
counterstained with Hematoxylin and mounted with Clearmount (American Master*Tech
Scientific). Immunofluorescence staining was mounted with Vectashield mounting medium for
fluorescence with DAPI (Vector Labs). Immunohistochemical images were captured using an
Olympus VS120 whole-slide scanning microscope, and immunofluorescence was captured on a
Leica TCS5 spectral confocal microscope. For quantification of immunohistochemical and
immunofluorescence staining, histographs from at least 5 sections per mouse and from at least 3
independent mice were counted as described previously (15). These data are summarized in
Table S5. Western blot analyses were done using total protein lysates (10 μg per lane) from
dorsolateral prostate or prostate tumors using antibodies as described in Table S6.
Levels of steroids and abiraterone were determined in serum and prostate tissues that
were snap-frozen in liquid nitrogen at the time of sacrifice. Metabolite levels were determined by
mass spectrometry as previously reported (20,21). Briefly, frozen tissues were weighed and
added to 60°C water containing deuterated internal standards, heated to 60°C for 10 minutes,
and homogenized using a tissue homogenizer (Precellys; Bertin, Rockville, MD); supernatant was
extracted twice with hexane (ethyl acetate [80:20 v/v]), and the organic layer was dried
(SpeedVac; Thermo Scientific,Waltham, MA), derivatized with 0.025 M hydroxylamine
hydrochloride for 24 hours at room temperature to form oximes, and quantified using liquid
chromatography electrospray-ionization tandem mass spectrometry. The lower limit of detection
for steroids was 0.49 pg/sample for progesterone, androstenedione, testosterone and DHT; 0.98

Zou et al.
37
pg/sample for DHEA and androsterone, and 1.96 pg/sample for pregnenolone. The lower limit of
detection for abiraterone was 0.06 ng/sample in serum and 1.2 ng/sample for tissue. Limits of
quantification in serum were 0.02 ng/ml for progesterone, androstenedione, testosterone and
DHT; 0.04 ng/ml for DHEA and androsterone, 0.08ng/ml for pregnenolone, and 0.005 ng/dL for
abiraterone. Limits of quantification in tissue were 0.02 pg/mg for progesterone, androstenedione,
DHT, and testosterone, 0.05 ng/ml for DHEA and androsterone, 0.11 pg/mg for pregnenolone,
and 0.06 pg/gm for abiraterone.
Generation and analyses of cell lines from NP and NPp53 mice
Cell lines were generated from NP or NPp53 prostate tumors in our laboratory in the Fall
of 2013 as described (22). Two independent cell lines were obtained from two independent tumors
each from NP and NPp53 mice; to avoid clonal variation, we used a pooled cell population for
these studies. Each cell line was confirmed to be negative for a multi-species mycoplasma test
(Mycoplasma Detection Kit, Cat# MP70114, Fisher), which was performed in early 2014. The cell
lines were confirmed to have the correct genotypes using a commercial source (TransnetYX, Inc).
Further characterization of the cell lines included analyses of growth rate using MTT assays, and
expression of relevant markers by Western blot analyses. Cell line stocks were established at
passage 5, and have been used for experimental assays within 3 passages following
thawing. Once established, cells were maintained in RPMI-1640 with 10% FBS.
For in vitro analysis of drug treatment, cells were seeded into 96-well plates at 5000
cells/well in growth medium supplemented with 10% charcoal-stripped serum in the presence or
absence of 20nM dihydrotestosterone. At 24 hours following plating, abiraterone (50 mM in
ethanol or ethanol alone) was added to a final concentration of 10 µM and incubated for 24 to 78
hours. Relative viability was determined using the Cell Proliferation Kit I (MTT, Sigma). Data was
analyzed using GraphPad Prism software version 6.0f (Graphpad Software, Inc.). For in vivo

Zou et al.
38
analysis of drug treatment, 1 X 10⁶ cells were mixed with Matrigel (1:1 vol/vol) and injected into
the flank of immunodeficient NCr nude mice (Taconic). Tumors were monitored 3 times weekly
for approximately 4 weeks by caliper measurement and abiraterone treatment was initiated when
the tumor size reached 100-300mm3. At the time of euthanasia, subcutaneous tumors were
harvested and weighed.
For shRNA-mediated silencing, we used the PLKO.1 lentiviral vector with short hairpin
RNA (Sigma-Aldrich) targeting two independent sequences in the coding region of mouse Sox11
gene (2 independent shRNA). As a control, we used the PLKO.1 lenti viral vector with shRNA
targeting the luciferase gene (SHC007, Sigma-Aldrich). Lentiviral particles were made using the
2nd generation packaging vectors, psPAX2 and pMD2.G (Addgene) in HEK-293T cells (ATCC),
and concentrated using the Lenti-X Concentrator reagent (Clonetech), as described previously
(6). Mouse cell lines were infected with the lentiviruses and selected for 5 days using 6 µg/ml of
puromycin. For quantitative real-time PCR (qPCR) analyses, total RNA was isolated using a
MagMAX-96 Total RNA Isolation Kit (Life Technologies, Grand Island, NY). cDNA was prepared
using SuperScript III First-Strand Synthesis SuperMix for qRT-PCR kit from Thermo Fisher
Scientific according to manufacturer’s instructions. Real-time PCR were performed using
QuantiTect SYBR Green PCR Kit from Qiagen and Gapdh was used as an internal control.
Relative expression levels were calculated using the 2-ΔΔCT method as described (6). Table S7
provides a list of all primers and shRNA sequences used in this study.
Gene expression profiling and computational analyses
For analyses of SOX11 expression levels in human datasets, mRNA expression (z-
scores) classified by Clinical Gleason category in TCGA (7) or Cancer Type Detailed in Beltran
et al. (12) was exported through cBioPortal (23,24), and plotted using GraphPad Prism software
(Version 6.0). For gene expression profiling of mouse tumors, total RNA was isolated from

Zou et al.
39
prostate tissues/tumors using a MagMAX-96 Total RNA Isolation Kit (Life Technologies, Grand
Island, NY). RNA sequencing was performed at the JP Sulzberger Columbia Genome Center at
Columbia University Medical Center. A TruSeq RNA Sample Prep Kit v2 (Illumina) was used for
library preparation followed by sequencing (30 million single-end reads) on an Illumina HiSeq
2500. RNAseq data raw counts were normalized and the variance was stabilized using DESeq2
package (Bioconductor) in R-studio 0.99.902, R v3.3.0 (The R Foundation for Statistical
Computing, ISBN 3-900051-07-0). The raw and normalized data files are deposited in Gene
Expression Omnibus (GEO) GSE92721. Differentially expressed genes are listed in Dataset 1.
To align RNA-Seq reads to human genome (hg19) in the SU2C and Beltran et al. datasets , we
used STAR aligner v2.5.2a and then counted mapped reads using HTSeq v0.6.1.
Differential gene expression signatures were defined as a list of genes ranked by their
differential expression between any two phenotypes of interest (e.g., abiraterone treated vs.
vehicle treated; castration-resistant vs. intact etc.), using 2-tailed Welch t-test. For comparison of
mouse gene signatures with human gene signatures, mouse genes were mapped to their
corresponding human orthologs based on the homoloGene database (NCBI); all analyses
comparing mouse and human genes were done using mouse “humanized” signatures. For single
sample GSEA (ssGSEA), individual abiraterone-treated samples were compared to the pooled
group of vehicle-treated samples, such that the fold-change value for each gene was estimated
as the gene’s expression in a single treated sample over the average of the gene’s expression
levels in the vehicle-treated samples. If fold change (FC) fell below 1, the resulting fold change
was defined as -1/FC. Single-sample signatures were then defined by a list of genes ranked by
their fold-change between a single treated sample and a pooled group of vehicle-treated samples.
Each single-sample signature was compared to the human Best et al. signature (9) using Gene
set enrichment analyses (GSEA).

Zou et al.
40
Master regulator analysis was performed using the MAster Regulator INference algorithm
(MARINa) (25) by interrogating a human prostate cancer interactome (26) with “humanized”
mouse signatures or with human signatures. Gene set enrichment analyses (GSEA) was done
using “humanized” mouse signatures or “humanized” mouse master regulator signatures as
described (27) or using human gene or human MR signatures, where appropriate.
For analyses of clinical outcomes, we used the Sboner et al. dataset (13), in which cancer-
specific survival data (i.e., death due to prostate cancer) is available. Corresponding survival
analysis was estimated using the transcriptional activity levels of MRs, which were estimated as
enrichment of MR transcriptional targets (from the human prostate cancer interactome) in each
data sample from the Sboner et al. dataset. For Kaplan-Meier survival analysis, k-means
clustering was done on the activity levels of the MRs to cluster patients into two groups: one group
having similarity in overall activity to the adverse response MRs and one group having no
similarity. Kaplan-Meier analysis was done using the “surv” and “coxph” functions from the
survcomp package in R-studio 0.99.902, R v3.3.0; the p-value was estimated using log-rank test.
Statistical analyses
Statistical analyses were performed using a two-tailed Welch t-test, one-way ANOVA, X2
test, and Fisherʼs Exact test as appropriate. GraphPad Prism software (Version 6.0) and R-studio
0.99.902, R v3.3.0, were used for statistical calculations and data visualization. Kaplan-Meier
survival analysis was done with the surv and coxph functions from survcomp package
(Bioconductor). Gene set enrichment analysis (GSEA) was performed as described (27).
Accession numbers
Raw and normalized RNA sequencing data are publically available through Gene
Expression Omnibus (GEO) database (GSE92721).

Zou et al.
41
References
1. Lunardi A, Ala U, Epping MT, Salmena L, Clohessy JG, Webster KA, et al. A co-clinical approach identifies mechanisms and potential therapies for androgen deprivation resistance in prostate cancer. Nat Genet 2013;45(7):747-55 doi 10.1038/ng.2650.
2. Lam HM, McMullin R, Nguyen HM, Coleman I, Gormley M, Gulati R, et al. Characterization of an Abiraterone Ultraresponsive Phenotype in Castration-Resistant Prostate Cancer Patient-Derived Xenografts. Clin Cancer Res 2016 doi 10.1158/1078-0432.CCR-16-2054.
3. Mostaghel EA, Marck BT, Plymate SR, Vessella RL, Balk S, Matsumoto AM, et al. Resistance to CYP17A1 inhibition with abiraterone in castration-resistant prostate cancer: induction of steroidogenesis and androgen receptor splice variants. Clin Cancer Res 2011;17(18):5913-25 doi 10.1158/1078-0432.CCR-11-0728.
4. Li Z, Alyamani M, Li J, Rogacki K, Abazeed M, Upadhyay SK, et al. Redirecting abiraterone metabolism to fine-tune prostate cancer anti-androgen therapy. Nature 2016;533(7604):547-51 doi 10.1038/nature17954.
5. Li Z, Bishop AC, Alyamani M, Garcia JA, Dreicer R, Bunch D, et al. Conversion of abiraterone to D4A drives anti-tumour activity in prostate cancer. Nature 2015;523(7560):347-51 doi 10.1038/nature14406.
6. Aytes A, Mitrofanova A, Kinkade CW, Lefebvre C, Lei M, Phelan V, et al. ETV4 promotes metastasis in response to activation of PI3-kinase and Ras signaling in a mouse model of advanced prostate cancer. Proc Natl Acad Sci U S A 2013;110(37):E3506-15 doi 10.1073/pnas.1303558110.
7. Network CGAR. The Molecular Taxonomy of Primary Prostate Cancer. Cell 2015;163(4):1011-25 doi 10.1016/j.cell.2015.10.025.
8. Robinson D, Van Allen EM, Wu YM, Schultz N, Lonigro RJ, Mosquera JM, et al. Integrative clinical genomics of advanced prostate cancer. Cell 2015;161(5):1215-28 doi 10.1016/j.cell.2015.05.001.
9. Best CJ, Gillespie JW, Yi Y, Chandramouli GV, Perlmutter MA, Gathright Y, et al. Molecular alterations in primary prostate cancer after androgen ablation therapy. Clin Cancer Res 2005;11(19 Pt 1):6823-34 doi 10.1158/1078-0432.CCR-05-0585.
10. Grasso CS, Wu YM, Robinson DR, Cao X, Dhanasekaran SM, Khan AP, et al. The mutational landscape of lethal castration-resistant prostate cancer. Nature 2012;487(7406):239-43 doi 10.1038/nature11125.
11. Stanbrough M, Bubley GJ, Ross K, Golub TR, Rubin MA, Penning TM, et al. Increased expression of genes converting adrenal androgens to testosterone in androgen-independent prostate cancer. Cancer Res 2006;66(5):2815-25 doi 10.1158/0008-5472.CAN-05-4000.
12. Beltran H, Prandi D, Mosquera JM, Benelli M, Puca L, Cyrta J, et al. Divergent clonal evolution of castration-resistant neuroendocrine prostate cancer. Nat Med 2016;22(3):298-305 doi 10.1038/nm.4045.

Zou et al.
42
13. Sboner A, Demichelis F, Calza S, Pawitan Y, Setlur SR, Hoshida Y, et al. Molecular sampling of prostate cancer: a dilemma for predicting disease progression. BMC Med Genomics 2010;3:8 doi 1755-8794-3-8 [pii] 10.1186/1755-8794-3-8.
14. Wang X, Kruithof-de Julio M, Economides KD, Walker D, Yu H, Halili MV, et al. A luminal epithelial stem cell that is a cell of origin for prostate cancer. Nature 2009;461(7263):495-500 doi 10.1038/nature08361.
15. Toivanen R, Mohan A, Shen MM. Basal Progenitors Contribute to Repair of the Prostate Epithelium Following Induced Luminal Anoikis. Stem Cell Reports 2016;6(5):660-7 doi 10.1016/j.stemcr.2016.03.007.
16. Floc'h N, Kinkade CW, Kobayashi T, Aytes A, Lefebvre C, Mitrofanova A, et al. Dual targeting of the Akt/mTOR signaling pathway inhibits castration-resistant prostate cancer in a genetically engineered mouse model. Cancer Res 2012;72(17):4483-93 doi 10.1158/0008-5472.CAN-12-0283.
17. Jonkers J, Meuwissen R, van der Gulden H, Peterse H, van der Valk M, Berns A. Synergistic tumor suppressor activity of BRCA2 and p53 in a conditional mouse model for breast cancer. Nat Genet 2001;29(4):418-25 doi 10.1038/ng747.
18. Madisen L, Zwingman TA, Sunkin SM, Oh SW, Zariwala HA, Gu H, et al. A robust and high-throughput Cre reporting and characterization system for the whole mouse brain. Nat Neurosci 2010;13(1):133-40 doi 10.1038/nn.2467.
19. Easterly ME, Foltz CJ, Paulus MJ. Body condition scoring: comparing newly trained scorers and micro-computed tomography imaging. Lab Anim (NY) 2001;30(3):46-9.
20. Taplin ME, Montgomery B, Logothetis CJ, Bubley GJ, Richie JP, Dalkin BL, et al. Intense androgen-deprivation therapy with abiraterone acetate plus leuprolide acetate in patients with localized high-risk prostate cancer: results of a randomized phase II neoadjuvant study. J Clin Oncol 2014;32(33):3705-15 doi 10.1200/JCO.2013.53.4578.
21. Cho E, Mostaghel EA, Russell KJ, Liao JJ, Konodi MA, Kurland BF, et al. External beam radiation therapy and abiraterone in men with localized prostate cancer: safety and effect on tissue androgens. Int J Radiat Oncol Biol Phys 2015;92(2):236-43 doi 10.1016/j.ijrobp.2015.01.020.
22. Speirs V, Green AR, Walton DS, Kerin MJ, Fox JN, Carleton PJ, et al. Short-term primary culture of epithelial cells derived from human breast tumours. Br J Cancer 1998;78(11):1421-9.
23. Cerami E, Gao J, Dogrusoz U, Gross BE, Sumer SO, Aksoy BA, et al. The cBio cancer genomics portal: an open platform for exploring multidimensional cancer genomics data. Cancer Discov 2012;2(5):401-4 doi 10.1158/2159-8290.CD-12-0095.
24. Gao J, Aksoy BA, Dogrusoz U, Dresdner G, Gross B, Sumer SO, et al. Integrative analysis of complex cancer genomics and clinical profiles using the cBioPortal. Sci Signal 2013;6(269):pl1 doi 10.1126/scisignal.2004088.

Zou et al.
43
25. Lefebvre C, Rajbhandari P, Alvarez MJ, Bandaru P, Lim WK, Sato M, et al. A human B-cell interactome identifies MYB and FOXM1 as master regulators of proliferation in germinal centers. Mol Syst Biol 2010;6:377 doi msb201031 [pii] 10.1038/msb.2010.31.
26. Aytes A, Mitrofanova A, Lefebvre C, Alvarez MJ, Castillo-Martin M, Zheng T, et al. Cross-species regulatory network analysis identifies a synergistic interaction between FOXM1 and CENPF that drives prostate cancer malignancy. Cancer Cell 2014;25(5):638-51 doi 10.1016/j.ccr.2014.03.017.
27. Subramanian A, Tamayo P, Mootha VK, Mukherjee S, Ebert BL, Gillette MA, et al. Gene set enrichment analysis: a knowledge-based approach for interpreting genome-wide expression profiles. Proc Natl Acad Sci U S A 2005;102(43):15545-50 doi 0506580102 [pii] 10.1073/pnas.0506580102.