transcriptomics notes 2
DESCRIPTION
Document contains detail on EST clustering and Assembly and lists some of the tools for the same.Level: BeginnerTRANSCRIPT

Chapter 2 EST CLUSTERING AND ASSEMBLY
Edited by- Priya J.A . Densi V.B.,Pooja P.S, Rohit G. S.
Published by- Anand M. B. Page 1
Table of contents 1. Introduction, 1 2. EST Clustering, 2 2.1 Algorithms used for similarity measurement, 2 2.2 Types of clustering, 3 2.3 EST clustering databases, 4 3. EST assembling , 4 3.1 EST assembling software, 5 3.2 Cluster joining, 5 3.3 Drawbacks of EST assembling,6 4. Tools, 6 5. References,12
1. Introduction:
ESTs (Expressed Sequence Tags) represent partial sequences of cDNA clones (average _ 360
bp).
Single-pass reads from the 5’ and/or 3’ ends of cDNA clones.
Individual clones are picked from the library, and one sequence is generated from each end
of the cDNA insert.
Thus, each clone normally has a 5_ and 3_ EST associated with it.
The sequences average ~360 bases in length.
Because the ESTs are short, they generally represent only fragments of genes, not complete
coding sequences.
Many sequencing centers have automated the process of EST generation, producing ESTs at
a rapid rate.
ESTs are submitted to all three international sequence databases (GenBank, EMBL,and
DDBJ)

Chapter 2 EST CLUSTERING AND ASSEMBLY
Edited by- Priya J.A . Densi V.B.,Pooja P.S, Rohit G. S.
Published by- Anand M. B. Page 2
2. EST clustering:
The goal of the clustering process is to incorporate overlapping ESTs which tag the same
transcript of the same gene in a single cluster.
For clustering, we measure the similarity (distance) between any 2 sequences.
The distance is then reduced to a simple binary value: accept or reject two sequences in
the same cluster.
As of mid-2000, GenBank contained just under 1.9 million human EST records.
For example, dbEST contains more than 200 ESTs for human alpha-fetoprotein alone.
2.1 Algorithms used for similarity measurement:
Pairwise alignment algorithms:
1) Smith-Waterman
It is the most sensitive, but time consuming (ex. cross-match)
2) Heuristic algorithms,
As BLAST and FASTA, trade some sensitivity for speed.

Chapter 2 EST CLUSTERING AND ASSEMBLY
Edited by- Priya J.A . Densi V.B.,Pooja P.S, Rohit G. S.
Published by- Anand M. B. Page 3
Non-alignment based scoring methods:
1) d2 cluster algorithm:
It is based on word comparison and composition (word identity
and multiplicity)
Pre-indexing methods.
Purpose-built alignments based clustering methods.
2.2 Types of clustering:
CLUSTERING TYPES
STRINGENT CLUSTERING: LOOSE CLUSTERING:
1) Greater initial fidelity; 1) Lower initial fidelity;
2) One pass; 2) Multi-pass;
3) Lower coverage of expressed gene data; 3) Greater coverage of expressed gene
data;
4) Lower cluster inclusion of 4) Greater cluster inclusion of alternate
expressed gene forms; expressed forms.
5) Shorter consensi. 5) Longer consensi;
6) Risk to include paralogs in the
same gene index.
Chapter 2 EST CLUSTERING AND ASSEMBLY
Edited by- Priya J.A . Densi V.B.,Pooja P.S, Rohit G. S.
Published by- Anand M. B. Page 4
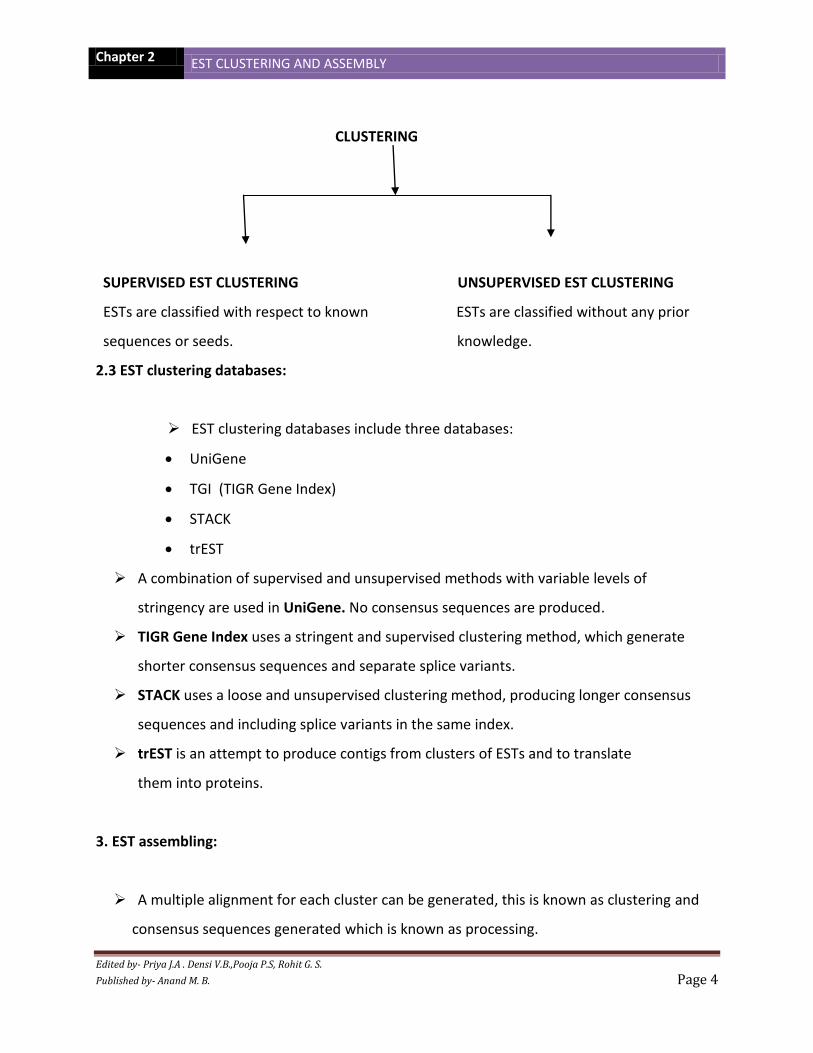
CLUSTERING
SUPERVISED EST CLUSTERING UNSUPERVISED EST CLUSTERING
ESTs are classified with respect to known ESTs are classified without any prior
sequences or seeds. knowledge.
2.3 EST clustering databases:
EST clustering databases include three databases:
UniGene
TGI (TIGR Gene Index)
STACK
trEST
A combination of supervised and unsupervised methods with variable levels of
stringency are used in UniGene. No consensus sequences are produced.
TIGR Gene Index uses a stringent and supervised clustering method, which generate
shorter consensus sequences and separate splice variants.
STACK uses a loose and unsupervised clustering method, producing longer consensus
sequences and including splice variants in the same index.
trEST is an attempt to produce contigs from clusters of ESTs and to translate
them into proteins.
3. EST assembling:
A multiple alignment for each cluster can be generated, this is known as clustering and
consensus sequences generated which is known as processing.
Chapter 2 EST CLUSTERING AND ASSEMBLY
Edited by- Priya J.A . Densi V.B.,Pooja P.S, Rohit G. S.
Published by- Anand M. B. Page 5
Assembly and processing result in the production of consensus sequences and
Singletons.
Since ESTs represent gene transcripts, they will not contain repeats.
EST assembly is complicated by features like (cis-)
alternative splicing,
trans-splicing,
single-nucleotide polymorphism,
recoding,
Post-transcriptional modification.
These differences make the new generation assemblers less applicable to EST assembly.
3.1 EST assembling software:
PHRAP VIEW
It provides a ‘‘global’ view of the assembly, complementing the individual base and
trace view provided by consed.
GAP4
Gap4 is an interactive program used for working on data from sequencing projects.
3.2 Cluster joining:
All ESTs generated from the same cDNA clone correspond to a single gene.
Generally the original cDNA clone information is available (_ 90%).
Using the cDNA clone information and the 5’ and 3’ reads information, clusters
can be joined.

Chapter 2 EST CLUSTERING AND ASSEMBLY
Edited by- Priya J.A . Densi V.B.,Pooja P.S, Rohit G. S.
Published by- Anand M. B. Page 6
3.3 Drawbacks of EST assembly:
The main drawback of EST assembly is that it does not usually permit the determination of
a complete cDNA sequence, because most genes are too large to be covered by end-
sequencing.
In addition, sequence quality drops towards the end of the sequence reads, which can
prevent assembly programs from joining overlapping sequences into a single contig.
Even when full-length contigs are generated, they are likely to contain errors, especially in
regions where only low-quality data are available.
4. Tools:
4.1 EST clustering tools:
1> WCD:
In order to decide whether two ESTs have a sufficiently large approximate overlap, we
have to decide:
o how long the overlap should be;
o how we measure similarity or difference and
Chapter 2 EST CLUSTERING AND ASSEMBLY
Edited by- Priya J.A . Densi V.B.,Pooja P.S, Rohit G. S.
Published by- Anand M. B. Page 7
o what the error threshold should be.
All of these are parameters of the clustering process.
In addition, wcd provides a number of different features and ways in which the user can
control clustering. Most of these are parameterisable.
wcd provides two ways of comparing ESTs for overlap. The default distance function
used is the d2 distance function, a biologically validated distance function for EST
comparison, and is particularly insensitive to repeats and rearrangement.
wcd has an efficient, published implementation of the d2 distance function. The user
can specify word length, window size and error threshold.
A memory efficient implementation of edit distance is also provided. The user may give
the penalty matrix and threshold or use the defaults provided.
The computations of d2 and edit distance are both expensive.
wcd provides parameterisable heuristics which filter out unnecessary comparisons and
speed up the clustering. Empirical testing has shown that the default parameters of the
heuristics are very conservative:
They do not affect the quality of the results, while speeding up the clustering by an
order of magnitude.
However, more aggressive parameters can speed up the clustering significantly and
have a much smaller impact on the quality results than small changes to other
parameters. In practice, clustering often has to be performed several times as the user
explores different parameters or isolates problems in the data.
Using aggressive heuristics for this early phase is particularly useful.

Chapter 2 EST CLUSTERING AND ASSEMBLY
Edited by- Priya J.A . Densi V.B.,Pooja P.S, Rohit G. S.
Published by- Anand M. B. Page 8
2> JESAM:
A multi-stage pipeline was developed to discover all the arrangements of all pairs of
sequences where the alignment could be consistent with the sequences being cognate
and contiguous.
The algorithm's first stages reduce the total number of pairwise sequence alignments
whilst aiming to maintain overlap sensitivity and alignment accuracy.
To ensure that the published alignments were both biologically useful and
mathematically optimal, it was thought necessary to use a dynamic programming
algorithm with a sophisticated gap penalty scheme.
However, computation time makes it impractical to compare all sequences against each
other for large EST datasets with workstation implementations of derivatives of the
Smith-Waterman algorithm.
Specialized hardware was an unacceptable solution due to perceived problems of cost,
availability, portability, and ease of algorithm development.
The JESAM alignment algorithm therefore uses dynamic programming only for the final
alignments relying on the gross overall overlap being easy to find because the goal was
only to discover potentially overlapping subsequences, not distant homologues mutated
apart though millennia
3> TGICL:
TGICL uses stringent pairwise comparisons between input sequences to group those
sharing significant regions of near identity. Individual assembly of each cluster has the
advantage of producing larger, more complete consensus sequences while eliminating
potentially misclustered sequences. In its simplest application, TGICL takes a single
parameter:
Chapter 2 EST CLUSTERING AND ASSEMBLY
Edited by- Priya J.A . Densi V.B.,Pooja P.S, Rohit G. S.
Published by- Anand M. B. Page 9
An input multi-FASTA file. TGICL’s final output is one or more ACE files containing CAP3
assembliesand a list of singletons. Prior to running TGICL, the input dataset should be
cleaned to remove contaminating sequences, including vector, adapter, and bacterial
sequences, which can lead to misclustering and misassembly.
This can be done using either a stringent program such as Lucy or a sequence trimming
script such as SeqClean with filtering databases such as NCBI’s UniVec.
Known repeats should also be masked using RepeatMasker with the lower-case masking
option; TGICL excludes masked regions during its initial word-hashing phase.
4.2 EST assembly tools:
1> Phrapview:
Phrapview is distributed along with the phrap assembly engine and is a graphical viewer
for phrap assemblies.
It is intended to provide a ‘‘global’ view of the assembly, complementing the individual
base and trace view provided by consed.
This global view focuses on information pertaining to possible incorrectness,
incompleteness, or nonuniqueness of the phrap-generated assembly.
Phrapview displays depth of coverage; forward-reverse read pairs, significant pairwise
matches involving reads in different locations in the assembly, and chimeric reads.
The input to phrapview is a .view file, which is produced by running phrap with the
View option. (Note that phrapview does not perform any of the analyses itself; rather, it
provides a way of displaying a file that contains an already completed analysis of the
project)
. A screen dump for a typical phrapview display of a 40-kb cosmid sequencing project is
shown in Figure.

Chapter 2 EST CLUSTERING AND ASSEMBLY
Edited by- Priya J.A . Densi V.B.,Pooja P.S, Rohit G. S.
Published by- Anand M. B. Page 10
2> GAP4:
Gap4 is an interactive program used for working on data from sequencing projects. It
contains a comprehensive set of functions, many of which present their results
graphically.

Chapter 2 EST CLUSTERING AND ASSEMBLY
Edited by- Priya J.A . Densi V.B.,Pooja P.S, Rohit G. S.
Published by- Anand M. B. Page 11
Others, such as the Experiment Suggestion functions, produce textual output ready for
parsing by external programs.
One of its important components, used by many of the other functions, is the consensus
algorithm. The gap4 database does not store the consensus sequence; rather, it is
calculated whenever it is needed. When appropriate, it can be calculated separately for
each strand, and, in the Contig Editor and Contig Joining Editor, it is instantly updated
for each edit made.
When phred-style confidence values are available, the algorithm uses them with strand
and chemistry data to calculate a confidence value for each base in the consensus.
At the end of a project, the algorithm can produce a FASTA-format file or an Experiment
file containing the consensus and its confidence values.
Preprocessing programs used by pregap4 and routines within gap4 can add annotations
to readings (for example, the position of an Alu segment or a custom primer).
Throughout the text, these annotations are referred to as ‘‘tags.’’
3> PHRAP:
phrap is a program for assembling shotgun DNA sequence data. Among other features,
it allowsuse of the entire read and not just the trimmed high quality part,
It uses a combination of user-supplied and internally computed data quality information
to improve assembly accuracy in the presence of repeats
It constructs the contig sequence as a mosaic of the highest quality read segments
rather than a consensus, it provides extensive assembly information to assist in trouble-
shooting assembly problems, and it handles large datasets.
4> CAP3:
The CAP3 program includes a number of improvements and new features.
A capability to clip 58 and 38 lowquality regions of reads is included in the CAP3
program. Base quality values produced by PHREDare used in computation of overlaps
Chapter 2 EST CLUSTERING AND ASSEMBLY
Edited by- Priya J.A . Densi V.B.,Pooja P.S, Rohit G. S.
Published by- Anand M. B. Page 12
between reads, construction of multiple sequence alignments of reads, and generation
of consensus sequences.
Efficient algorithms are employed to identify and compute overlaps between reads.
Forward–reverse constraints are used to correct assembly errors and link contigs.
Results of CAP3 on four BAC data sets are presented. The performance of CAP3 was
compared with that of PHRAP on a number of BAC data sets.
5 References:
(a) From headings 1 to 3 (By Priya J.A, Densi V.B):
1. Webliography
1> http://www.ch.embnet.org/CoursEMBnet/Pages02/slides/est_clustering.pdf
2> http://www.pubmedcentral.nih.gov/articlerender.fcgi?artid=1874618
2. Bibliography
1> Bioinformatics- a practical guide to the analysis of genes and proteins. (2nd edition)
By -Andreas D. Baxevanis, B.F. Francis Ouellett, Page nos. - 284, 288, 308 & 311
(b) Heading 4th (By Pooja P.S, Rohit G.S):
1. Webliography
1> http://www.genome.org/cgi/content/full/9/9/868#References
2> http://www.phrap.org/phredphrapconsed.html#block_phrap
3> http://genome.wustl.edu/est/esthmpg.html
2. Bibliography
1> Bioinformatics- a practical guide to the analysis of genes and proteins. (2nd edition)
By -Andreas D. Baxevanis, B.F. Francis Ouellett, Page nos. - 288, 309 & 311