transcriptional analysis of reciprocal tumor
TRANSCRIPT

Washington University in St. LouisWashington University Open Scholarship
All Theses and Dissertations (ETDs)
Spring 1-6-2014
Transcriptional Analysis of Reciprocal Tumor-Microenvironment Interactions in GlioblastomaMichael BrooksWashington University in St. Louis
Follow this and additional works at: https://openscholarship.wustl.edu/etd
This Dissertation is brought to you for free and open access by Washington University Open Scholarship. It has been accepted for inclusion in AllTheses and Dissertations (ETDs) by an authorized administrator of Washington University Open Scholarship. For more information, please [email protected].
Recommended CitationBrooks, Michael, "Transcriptional Analysis of Reciprocal Tumor-Microenvironment Interactions in Glioblastoma" (2014). All Thesesand Dissertations (ETDs). 1222.https://openscholarship.wustl.edu/etd/1222

i
WASHINGTON UNIVERSITY IN ST. LOUIS
Division of Biology and Biomedical Sciences
Molecular Genetics and Genomics
Dissertation Examination Committee:
Robi Mitra, Chair
Joshua Rubin, Co-Chair
Patrick Jay
Albert Kim
Elaine Mardis
Gary Stormo
Transcriptional Analysis of Reciprocal Tumor-Microenvironment Interactions in Glioblastoma
By
Michael Dale Brooks
A dissertation presented to the
Graduate School of Arts and Sciences
of Washington University in
partial fulfillment of the
requirements for the degree
of Doctor of Philosophy
May 2014
St. Louis, Missouri

ii
© 2014
Michael Brooks
All Rights Reserved

ii
Table of contents
List of Figures and Tables iii
Acknowledgements iv
Abstract vi
Chapter 1: Introduction 1
Chapter 1 References 18
Chapter 2: Hitting Them Where They Live:
Targeting the Glioblastoma Perivascular Stem Cell Niche 24
Chapter 2 References 42
Chapter 3: Methods of Transcriptional Analysis 50
Chapter 3 References 67
Chapter 4: Discovery of PDE7B as a novel effector of GBM growth
by computational deconvolution of an in vitro physical 71
coculture system.
Chapter 4 References 99
Chapter 5: Conclusions and Future Directions 104
Chapter 5 References 110

iii
List of Figures and Tables
Title: Page:
Figure 2-1 Cellular components of the GBM PVN 39
Table 2-1 Clinical trials of Cilengitide for high grade gliomas 41
Table 3-1 Gene expression changes in Gata6 cKO mouse adrenal cells 61
Table 3-2 Sex differences in tumor formation in GBM molecular subtypes 63
Figure 3-1 Heatmap of male-female gene expression differences in astrocytes 65
Figure 4-1 U87-HBMEC Coculture Sample prep and signal deconvolution 76
Table 4-1 Differentially expressed genes during U87-HBMEC coculture 77
Figure 4-2 qRT-PCR validation of 3 differentially expressed genes 78
Figure 4-3 PDE7B qRT-PCR validation 79
Figure 4-4 PDE7B relevance in patient samples 81
Figure 4-5 Effects of PDE7B overexpression in vivo 83
Figure 4-6 PDE7B tumor xenograft staining 84
Table 4-S1 Tumor microarray PDE7B IHC staining results 95
Figure 4-S1 Analysis of low grade vs high grade PDE7B staining in TMA 96
Figure 4-S2 Validation of PDE7B(WT) and PDE7B(H217Q) overexpression 97
Figure 4-S3 Extreme limiting dilution assay (ELDA) of PDE7B overexpression 98

iv
Acknowledgements
Throughout the years of my Ph.D. I have received support and encouragement from a great
number of individuals. I first would like to sincerely thank my first mentor and principle
investigator, Robi Mitra. From the time of joining his lab he was always there to lend advice and
help with issues while also giving me the freedom to chart my own course along the way. He
also helped to foster a great appreciation of technology development and genomics, which I hope
to always be a part of my research going forward. I would also like to thank my second PI and
mentor, Joshua Rubin. When my project had come to a complete stop, he was gracious enough
to let me join his lab and helped to rebuild the project with an emphasis on cancer biology, and it
was during that time that I truly found a love for cancer biology and studying the tumor
microenvironment. He has taught me so much about approaching science with the perfect
amount of critical thinking and attention to detail. I will always be grateful for both of their
continued support over the years.
I also would like to thank my thesis committee; Elaine Mardis, Patrick Jay, Gary Stormo and
Albert Kim. Elaine is one of the world’s leading experts on applying genomic methods to cancer
biology and it has been amazing to have that knowledge to fall back on if I needed help. Patrick
was my committee chair for the past few years and really helped in discussions about how to be
as productive as possible. Gary was the one committee member who I could count on to sit
through a thesis update and then at the end have one amazing comment that would put
everything into perspective for everyone, and I always appreciated that. I would like to thank
Jim Skeath, Tim Schedl and the rest of the administration of the Molecular Genetics and
Genomics program for their continued support and patience through the years.
Finally I would like to thank all of my collaborators for their invaluable help with these projects
including Erin Smith, David Piwnica-Worms, Nicole Warrington, Tao Sun, Sara Taylor, Jeff
Leonard, Raj Sengupta, Diane Mao, Albert Kim, and Dave Wilson and the many people on the
Gata6 paper. I’d also like to thank everyone else from both the Rubin and Mitra labs. There
have been countless hours of discussion, both about my project and other projects, that have
contributed greatly to this work and my general knowledge.
Support for this work was provide by RO1CA118389 (JBR), 5R01NS07699302 (RDM), and the
Taylor Rozier’s Hope for a Cure Brain Tumor Foundation (JBR), and The Josie Foundation
(JBR).

v
Dedication
This thesis is dedicated to my grandmother, Pauline Mounce, who bought me my
first computer when I went off to undergrad, setting in motion my love of
computers and who recently started her own battle with cancer, thereby reminding
us all of why we do what we do.
vi
ABSTRACT OF THE DISSERTATION
Transcriptional Analysis of Reciprocal Tumor:Microenvironment Interactions in Glioblastoma
by
Michael Dale Brooks
Doctor of Philosophy in Molecular Genetics and Genomics
Washington University in St. Louis, 2014
Professor Robi Mitra, Chair
Professor Joshua Rubin, Co-chair
In the last twenty years both computational biology and cancer biology have made great strides
and in the last 5 years the merger of the two has helped to revolutionize our knowledge of
personalized targeted therapy and the diversity of cancer. In cancer, cell-to-cell interactions
between tumor cells and their microenvironment are critical determinants of tumor tissue biology
and therapeutic responses. Interactions between glioblastoma (GBM) cells and endothelial cells
(ECs) establish a purported stem cell niche. We hypothesized that genes that mediate these
interactions would be important, particularly as therapeutic targets. Using a novel computational
approach to deconvoluting expression data from mixed physical coculture of GBM cells and
ECs, we identified a previously undescribed upregulation of the cAMP specific
phosphodiesterase PDE7B in GBM cells in response to ECs. We further found that elevated
PDE7B expression occurs in most GBM cases and has a negative effect on survival. PDE7B
overexpression resulted in the expansion of a stem-like cell subpopulation, increased tumor
aggressiveness, and increased growth in an intracranial GBM model. This deconvolution
algorithm provides a new tool for cancer biology, particularly when looking at cell-to-cell
interactions, and these results identify PDE7B as a therapeutic target in GBM.

- 1 -
Chapter 1: Introduction – Research at the interface of
computational biology and cancer biology

- 2 -
History of Cancer
To best understand where the field of cancer biology is currently, it is important to know where
the field started. Cancer, though not called that at the time, has been known since the time of the
ancient Egyptians. Studies on mummies have found evidence of a number of tumors (1) and the
Edwin Smith papyrus appears to be the first document describing cancer (2). It wasn’t until one
thousand years later when Hippocrates (c. 460 BC – c. 370 BC), arguably the founding father of
modern medicine, gave it the name “carcinoma” after the Greek word for crab because of the
finger like projections from the main tumor. This was later translated to Latin as “cancer” (3).
Throughout history, the explanation for the cause of cancer has changed drastically. Original
theories were archaic by today’s standards and revolved around the theory that the body had 4
humors, or liquids required for life, and that cancer was caused by an excess of the “black bile”
humor (4). As time passed, future theories maintained the idea of a fluid as the cause of cancer,
but were at least based on some understanding of human anatomy. Under this hypothesis, lymph
fluid in the body was a waste product excreted from the blood, and as this collected and grew, it
formed tumors (4). It wasn’t until 1838 that Johannes Muller (1801-1858) finally proposed that
cancer was, in fact, made up of cells (5,6). It was during this time that Muller, along with Rudolf
Virchow (1821-1902), the father of modern pathology who used microscopy to start correlating
cellular tumor patterns with prognosis (7) (8), ushered in the cellular age of cancer biology.
Even with the knowledge that cancer was a disease of cells, the mechanism of cancer formation
eluded scientists into the beginning of the twentieth century. It was Theodor Boveri (1862-1915)
who, while experimenting on chromosomes in sea urchins, proposed that cancer was a result of
- 3 -
scrambled chromosomes causing a single cell to grow into a tumor (9). Around the same time,
Peyton Rous (1879-1970) discovered that cancer could be transmitted from chicken to chicken
through the application of a cell-free filtrate (10). This was later shown to be caused by a virus,
now known as the Rous sarcoma virus (RSV). Interestingly, it would be more than 60 years
before Harold Varmus and J. Michael Bishop discovered the human origin of the viral proto-
oncogene c-Src (11) which is related to v-Src in RSV. These were both critical developments
toward the idea that cancer was a cell intrinsic disease, driven by somatic mutations conferring a
proliferation advantage.
Cancer as a cell instrinsic disease of somatic mutations
Perhaps themost important hypothesis concerning somatically driven cancer is the two-hit
hypothesis first put forth by Carl Nordling in 1953 (12) and further refined by Peter Armitage
and Richard Doll in 1954 (13) and 1957 (14) and formalized by Alfred Knudson in 1971 (15).
During the 1950s there was a lot of work on mathematical modeling of cancer progression as a
function of age (16,17), but Carl Nordling made the most significant contributions. His model,
based on cancer prevalence as a function of age, predicted, with amazing accuracy, that there
would be approximately 6 mutations required for any particular cell to become cancerous.
Nordling studied a number of tumor types to come to this conclusion, but noted that the math did
not apply to pediatric cancers, which while rare, still occurred far more often than his 6th
power
law relationship would predict (12). Doll and Armitage would expand upon the higher power
law model in their 1954 paper but in 1957 would propose a simplier two-stage theory. Their
main conclusion was that only two hits were required for carcinogenesis. An early hit which

- 4 -
would be induced by exposure to a carcinogen then followed by a long linear latent period of
further mutations, finally resulting in tumorigenesis (14). It wouldn’t be until 1971, when Alfred
Knudson used the familial predisposition syndrome of retinoblastoma to rigorously define the
two-hit hypothesis (15). These studies firmly cemented the idea that cancer was primarily the
result of somatic mutations driving a proliferation advantage, but what genes these mutations
were in, or what effect they were having, was only just beginning to be discovered in 1971.
The idea of dividing cancer’s causative mutations up into two classes, now called oncogenes and
tumor suppressors, far outdated anyone having any idea what they actually were. In fact the
original idea probably dates as far back as Theodor Boveri’s 1902 paper showing that abberant
chromosomes could cause tumorigenesis (9). In that paper he introduces the terms “hemming-
seinrichtungen”, “teilungshemmende chromosomen”, and “teilungsforedernde chromosomen”,
roughly “Cell cycle checkpoints”, “Tumor suppressor genes”, and “Oncogenes” respectively (18)
(9). The idea that activating mutations, oncogenes, were responsible for tumorigenesis began
with the discovery of the Rous Sarcoma Virus (10) and further studies of other viruses
responsible for causing tumors only strengthened the case (19) (20). Examples of tumor
suppressors, on the other hand, were hard to come by. Though in 1971, Henry Harris published
results of a study that made the case for the importance of tumor suppressors. Harris showed
that, using the recently described technique of cell fusion, normal mouse cells were dominant to
malignant mouse cells (21). This argues against an activated oncogene being the primary cause
of malignancy and argues for the required loss of both copies of some sort of tumor suppressing
gene in the malignant cells for which function was restored once the normal cell fused with the
cancerous one. A formal model for loss of both copies of tumor suppressor genes was officially

- 5 -
proposed in 1973 by David Comings (22), but it was Cavenee et al in 1983 who not only mapped
the retinoblastoma (RB) gene to chromosome 13 but showed that both the familial and sporadic
mutations mapped to the same location and caused homozygous loss of the gene (23). A large
number of independent groups worked towards refining the map and cloning of the RB gene
over the next few years (24) (25) (26) leading to the final complementation experiment where a
clone of RB was used to rescue retinoblastoma cells (27). Of course, the other side of the tumor
suppressor story is p53, which has now been shown to be mutated in a very large percentage of
cancers (28). Originally though, it was thought that p53 was an oncogene. Most of the evidence
for this came from mistakenly using a mutant cDNA (now shown to be a dominant negative form
of the protein) for the overexpression experiments instead of a wild type version (29) (30). This
was corrected only a few years later, in 1989, when Bert Vogelstein’s group showed,
conclusively, that p53 was a tumor suppressor mutated in a large percentage of colorectal
cancers (31).
Moving past cell intrinsic cancer research into cancer as a tissue disease
While the work done with the idea of cancer mainly being a cell intrinsic proliferation disease
allowed for huge leaps in advancing the field, and is still important for targeted therapies (32)
(33), cancer research has slowly started to change its approach, where it is now appreciated that
cancer is a disease of tissues, where complex interactions between tumor cells with growth
advantages and the local tumor microenvironment synergize to produce highly malignant tumors.

- 6 -
However, this change didn’t occur overnight. In 1975 an elegant experiment showed that
mutation alone could not drive tumorigenesis. Beatrice Mintz and Karl Illmensee demonstrated
this by taking malignant teratocarcinoma (a germ cell tumor) and injecting them into normal
blastocysts of mice. They saw incorporation of the tumor cells into the developing mice,
including a gene for a particular coat color, Steel, that was not present beforehand. This coat
color could even be passed down to progeny (34). Later work would show that not all
tumorigenic lines behave in this way (35) (36), but it was a landmark study showing how
important the microenvironment could be and that proper cell:cell interactions could block tumor
growth.
However it was the work of Mina Bissell that really showed just how important disorganization
(i.e. inflammation) in the local microenvironment could be in driving tumorigenesis and
propelled the idea to the forefront of cancer research. Work by Peyton Rous (10) had shown that
cancer could be caused and propagated by a virus gathered from sarcomas in chickens and then
injected into other chickens. In 1984, Mina Bissell and David Dolberg showed, in experiments
that paralleled the work of Mintz and Illmensee, that introducing the virus into chicken embryos
caused no tumorigenesis in the developed chickens, even though the virus was spread
throughout, and active v-src was found in almost all cells. Furthermore they noted that while the
adult chickens showed no signs of tumorigenesis, as soon as cells were removed and cultured
without the proper cell:cell interactions they quickly showed signs of transformation (37). The
question became how did a virus that could cause near universal tumorigenesis lose its power
when introduced early? It turns out that the key difference was that the previous adult RSV
experiments had been done by introducing the virus by subcutaneous or intramuscular injection,
- 7 -
which caused local wounding. In a follow up study in 1985, Bissell and colleagues showed that
it was this local wounding that was required for tumorigenesis. In fact once the virus was
established, secondary wounding in other locations would cause tumor formation (38). A few
years later Bissell and colleagues would show the mechanism of this phenomenon was through
transforming growth factor beta 1 (TGF-β) signaling, and that physical wounding was not
required and adding recombinant TGF-β was sufficient to induce tumorigenesis (39). This was a
remarkable set of experiments showing that a cell intrinsic proliferation advantage was not
sufficient for tumorigenesis and that the microenvironment was playing a much larger role than
previously appreciated.
Cancer stem cells (CSCs) are a relatively new, and controversial, addition to the study of the
tumor microenvironment. The current definition of CSCs are cells which constitute a small
subpopulation of the total cells in a tumor, have an increased tumorigenic capacity compared to
the rest of the tumor cells, are able to self renew, and can reconstitute the various cell types
found in the original tumor. Part of the controversy about CSCs comes not only from trying to
find a consensus on what defines their function, but also of semantics as far as what to call them.
Some authors prefer cancer stem cells while some prefer tumor initiating cells to further distance
them from normal stem cells. Even with the controversies, the literature keeps pouring in to
support the idea that there is certainly a subpopulation of tumor cells with increased
tumorigenicity (reviewed in (40) (41) (42)) and understanding them is an extremely important
step going forward towards improving cancer treatments.

- 8 -
The field of cancer stem cells started, for the most part, with an acute myeloid leukemia (AML)
paper from 1997 (43), though there was other evidence of cells with increased tumorigenicity
going back as far as 1937 (44). The AML paper by Dominique Bonnet and John Dick showed
that taking AML cells and cell sorting them to purify the CD34+CD38
- population could produce
a subpopulation of cells which were both more tumorigenic and could recapitulate the limited
proliferative leukemic blast cell populations. While the paper itself did not use the term cancer
stem cell, their direct comparison to the normal stem cell of the hematopoietic lineage that is also
CD34+CD38
- and their hypothesis that it was direct somatic event in the normal population of
hematopoietic stem cells which lead to the hypothesis that they were cancerous stem cells.
While work continued on cancer stem cells in blood cancers, it took another 6 years before
evidence of cancer stem cells were found in solid tumors. In 2003, cancer stem cells were found
in breast cancer (45), followed shortly by identifying them in brain tumors (46). Different sets of
cell surface markers are used for different tumors, though there is some overlap. While leukemic
CSCs are traditionally isolated with CD34+CD38
-, for breast cancer Al-Hajj et al isolated
CD44+CD24
- populations (45) and Singh et al isolated CD133
+ brain tumor cells for their CSCs
(46). The choice of these cell surface antigens is important because while traditionally they have
just been seen solely as a marker to identify a subpopulation of cells, recently these proteins have
been shown to have important functions, particularly in the microenvironment. For example,
CD44 is a cell surface glycoprotein which functions as the receptor for hyaluronic acid (47) (an
important component of the extracellular matrix) and has been implicated in breast cancer
invasion (48)and functions to help mesenchymal stem cells (MSCs) transition to tumor
associated fibroblasts (49). CD133 has recently been shown to induce tumorigenic properties in

- 9 -
HEK293 cells (50), increase drug resistance in glioma cells (51), increase proliferation of glioma
cells through ERK pathway activation (52), and even increase epithelial-mesenchymal transition
(EMT) rates in head and neck cancers (53).
Not only is the field of cancer stem cells extremely complicated with many unanswered
questions, but cancer stem cells are only the tip of the iceberg as far as the tumor
microenvironment goes. The cellular constituents of the tumor microenvironment can vary
greatly depending on the tumor type but in glioblastoma include: pericytes (54) (55), endothelial
cells (56), microglia (57), astrocytes (58) (59), cancer stem cells (45), and tumor cells. The
specialized glioblastoma tumor microenvironment known as the perivascular niche is extensively
reviewed in Chapter 1, but the importance here is to note how complex a tumor
microenvironment can be, and how, with the era of computational biology and bioinformatics
upon us, these tools can be applied to the tumor microenvironment in a high-throughput fashion
to expedite our understanding of the functions of a microenvironment to develop improved
cancer treatments.
History of genomics and bioinformatics
While genomics refers to the specific study of genomes, bioinformatics refers to the storage and
manipulation of biological sequencing data. Both fields are relatively new, having only been
around for the past 30 years or so. It was 1977 when the first complete genome, the
bacteriophage ΦX174, was published (60). The term genomics wasn’t coined until 1986 by Tom
Roderick (61) and while the term bioinformatics actually predates genomics (62), during these

- 10 -
earlier days it wasn’t particularly applied to DNA based sequencing data since there was not
enough data being generated to require heavy computational analysis tools.
The early focus of the field of genomics was on improving the technology of generating
sequence data. In fact, while the sequence of ΦX174 was generated with the “plus and minus”
method worked out by Fredrick Sanger, he quickly published an improved method of sequencing
with dideoxy-terminating nucleotides that same year (63). This work would later win Sanger,
along with Paul Berg and Walter Gilbert, the Nobel Prize in Chemistry in 1980. Sanger’s
dideoxy sequencing would be quickly become the gold standard, and is still used today for some
applications, but at the time was still a laborious process. After running the sequencing
reactions, they would be loaded onto a polyacrylamide gel, ran out for a very long time (~14
hours), and then annotated by hand to determine the sequence (63). As more genes and genomes
were sequenced, and as scientists looked ahead towards sequencing larger genomes, it became
clear that running every reaction out on a gel and hand annotating the sequence would be
impossible. The next big leap in technology, and perhaps the most critical of all for the genomic
revolution, came in 1986 when Leroy Hood and collaborators at Applied Biosystems developed
and commercialized the automated DNA sequencing machine. Hood improved Sanger’s method
by using dye-labeled, instead of radioactively, dideoxynucleotides and instead of running out the
reactions in a large polyacrylamide gel, eventually ran the reactions in capillary tubes filled with
a denaturing polymer. This allowed each passing fluorescent band to be detected by laser and
automatically recorded and greatly improved the throughput of sequencing projects enabling the
ambitious Human Genome Project (HGP) to be feasible.

- 11 -
The human genome project was officially launched in 1990 with funding from the US
Department of Energy (DOE) and the National Institutes of Health (NIH) along with number of
international collaborators. Projected to be a 15 year project costing 3 billion US dollars, it came
in slightly under budget and nearly two years early, with a draft being released in 2001 (64) and
the project being declared finished in 2003 (65) (66), though there have been continual smaller
updates since then. The HGP was designed as a hierarchical shotgun project, with the original 3
billion basepair genome being broken up into 150-200,000 bp bacterial artificial chromosomes
(BACs). It took about 20,000 BACs to adequately cover the whole genome. These BACs were
then subdivided into subclones, each containing about 2000bp. These were fully sequenced with
Sanger sequencing, reassembled into the full length BACs and finally into full chromosomes
(64).
It was during The Human Genome Project that the power of bioinformatics became an important
cog in the machine of sequence generation. A given sequencing center could be generating
millions of basepairs per day and this data needed to be stored and analyzed. Programs such as
phred, which took the raw Sanger sequencing traces and turned them into sequence data and
quality scores (67) (68), and phrap, which assembled the sequences into contigs, were important
tools used in the data analysis pipeline. It’s important to note though, that while bioinformatics
was becoming more important, it was not the rate limiting step, which was still sequence
generation (69).

- 12 -
There are two main ways that the HGP had a profound impact on science; direct research on the
information gathered and using the sequence as a scaffold to build the next step in sequencing
technology development. A number of very important projects grew out of this data, including
1,000 Genomes (70) and HapMap (71) (72), but the ENCODE (Encyclopedia of DNA Elements)
project was the largest of these collaborative efforts. This project produced a vast array of data
spread out over a number of different journals (73) (74) (75) (76) (77) and continues to this day.
While the lasting impact and legacy of the ENCODE project is yet to be determined, the
importance of using the reference genome as a scaffold to build next technologies off of is
already firmed established. De novo sequencing of the human genome required the long reads
provided by Sanger sequencing to have any chance of assembling the data back into
progressively larger pieces. Once the entire genome was complete though, it made way for a
wave of new technologies that sacrificed read length for massive increases in throughput (78).
This era of “next-generation” (next-gen) sequencing started around 2005 when the 454
Sequencing company released their GS20 sequencer. Their technology aimed to greatly increase
the throughput of sequencing compared to Sanger sequencing by running reactions in a highly
multiplexed microtiter plate and recording the introduction of specific nucleotides by the release
of pyrophosphate (79). This 454 sequencing still had read numbers on the low end (compared to
other soon to come technologies) but did have read lengths comparable to traditional Sanger
sequencing. This allowed the technology to specialize in high throughput bacterial sequencing
where assembling the genome back together de novo without a scaffold was still required.

- 13 -
Another important technological milestone of next-gen sequencing was Polony Sequencing, a
technology developed by Robi Mitra, Jay Shendure, and George Church (80). The original
technology, published in 2003, focused on forming colonies of clonal DNA by PCR which were
immobilized in polyacrylamide on a microscope slide. Once created, the Polony could be
sequenced by synthesis with fluorescent nucleotides. While not as high-throughput as some of
the other technologies, Polony Sequencing had the advantage of having a lower cost of entry,
since a lab could use an existing fluorescent microscope for imaging. The technology was
further developed and improved by Jay Shendure to fully sequence a bacterial genome (81), and
eventually licensed to Dover Systems to produce a self-contained Polony Sequencing machine
called the Polonator that would serve as a low-cost entry-level sequencing system.
In 2006, Solexa (later purchased by Illumina and generally refered to as “Illumina Sequencing”)
released their first next-gen sequencing machine the Genome Analyzer. This technology shares
some similarities to Polony Sequencing, in that PCR is used to form distinct areas of clonal
molecules. While the colonies in Polony Sequencing were supported in a polyacrylamide gel,
Illumina uses a solid surface as the base for a reaction called Bridge PCR, where the primers for
amplification are attached directly to glass flow cells, and the reagents to run the PCR can be
flowed directly into the chamber. This allowed very high densities of spots of clonal DNA,
called “clusters” (82). Through the years this technology has constantly improved with the
introduction of various new machines with improvements to the cameras, flow cells, and
reagents leading to continued increases in data generation, pushing the cost of sequencing lower
and lower towards the goal of a $1,000 genome.

- 14 -
Cancer sequencing projects
As the cost of sequencing became cheaper, scientists were constantly searching out new ways to
use the technology. Applying next-gen sequencing to cancer biology was one of early favorites.
It was already known how important specific mutations could be in driving cancer, but it was
also clear that a great deal was unknown about the distribution of mutations in cancer as a whole,
and that by sequencing enough individual patient’s tumor and matched normal DNA it would
start to paint a picture of what stayed constant between different patients and what was different.
In 2008 the first whole genome cancer sequencing paper was published by Ley and Mardis et al
(83). There they took a single acute myeloid leukemia (AML) patient showing a cytogenetically
normal karyotype and thoroughly sequenced both the tumor and matched normal DNA.
Analysis of the sequencing results showed that the tumor DNA contained an overwhelming ~2.6
million single nucleotide varients (SNVs), but by subtracted out those that were also in common
with the matched normal DNA (and therefore unlikely to be causative), and limiting the analysis
to only SNVs in coding regions of known genes, the final results showed 10 mutations that were
potentially causative, 8 novel mutations in a variety of genes, and two previously known
mutations. This paper was critical in providing a foundation for the methodology in future
cancer sequencing projects. It showed the critical importance of sequencing matched normal
DNA and gave a starting point for other groups to start sequencing more AML patients, and
other tumor types.

- 15 -
Since 2008, there have been hundreds of papers publishing cancer genomes from groups across
the world. A small list of the published cancer types include: AML (84), ALL (85), breast (86),
prostate (87), liver, brain (88) (89), lung (90), pancreatic (91), colon (92), melanoma (93), and
the list could go on. The first few papers in 2008 focused on one or two patients but as
sequencing became cheaper, it became possible, and necessary, to include more and more
samples to get a better idea of what the mutational landscape looked like across patients. To
prevent redundancy and facilitate the sharing of data an organizational system was needed. To
accomplish this, a number of consortiums, which either previously existed or were created, were
used to keep the various research groups on the same page. These included the International
Cancer Genome Consortium (ICGC) (94), The Cancer Genome Atlas (TCGA) (95), and the
Cancer Genome Project (96). These projects have been instrumental in organizing the joint
effort of multiple research groups and providing databases to deposit data and make it available
to other researchers.
Heterogeneity has always been an important concern in cancer sequencing projects and while
they have revealed the huge degree of heterogeneity in some tumors (97) (98), they have also
struggled with how to deal with that heterogeneity from a technical standpoint. There are two
types of heterogeneity in tumor sequencing. The first is heterogeneity in the cancer cells
themselves caused by evolution of the tumor as it grows. The initial causative mutations are
always present, but as the tumor grows, further mutations are gathered, and these various
subclones go on to populate different percentages of the final tumor. The second source of
heterogeneity is particularly relevant in solid tumors where normal non-tumorous cells can
account for a large percentage of the local tumor microenvironment.

- 16 -
At first, to simplify the experiment and analysis, both types of heterogeneity were minimized as
much as possible. The initial Ley and Mardis et al paper was concerned with contamination of
normal DNA in their tumor DNA and therefore used the fact that an initial bone marrow sample
contained nearly 100% myeloblasts to help select their patient. Their analysis also showed a
pretty low level of intratumoral heterogeneity. Of the mutations discovered, all eight were in
almost all of the cells sequenced, both at initial presentation and relapse (83). On the other hand,
recently some studies have started to embraced having mixed populations of tumors cells
(though still treating normal cells as contamination and avoiding them) to look at intratumoral
heterogeneity and evolution. These studies have developed new computational tools (99) as well
as designing experiments to detect the heterogeneity (100) (101). Unfortunately, heterogeneity
of the tumor microenvironment has still not been addressed to the same level. There is a lack of
knowledge about how tumors cells change as a function of their interaction with the
microenvironment and what mediates that interaction.
Can whole genome transcriptional analysis be applied to tumor:microenvironment interactions?
Therefore the question of my thesis revolves around whether computational tools could be
applied to tumor:microenvironment interactions. Using glioblastoma as a model system, we
wondered whether two cell types from the local microenvironment, endothelial cells and tumors
cells, could be grown together to ask what reciprocal interactions are induced in each cell type,
and whether any of these differentially expressed genes would make good targets for future
therapeutically targets.

- 17 -
Summary of contribution of thesis to the field
Cancer biology is in progress of a transition from looking at cancer as mostly a disease of
somatic mutations leading to proliferation advantages to a whole tissue disease with many
different cell types contributing to tumorigenesis. Not only are new tools required for looking at
complex cellular interactions, but these tools need to provide biologically relevant results. This
thesis looks to not only provide a method to look at the global expression profile of the
reciprocal interactions between two cell types, but takes the example of glioblastoma cells
interacting with endothelial cells and follows up on a top candidate gene, PDE7B, and begins to
elucidate its importance in the GBM perivascular niche.
Contribution to co-authored work presented in this thesis
In accordance with university policies, any co-authored work presented is to be accompanied by
an explanation of the contribution by the thesis author, Michael Brooks, to those co-authored
works. Chapter one of this thesis is a review on the glioblastoma perivascular niche previously
published in Current Pathobiology Reports under the title “Hitting Them Where They Live:
Targeting the Glioblastoma Perivascular Stem Cell Niche”. I was first author on this review and,
along with Dr. Rubin, we decided on the topics to be covered. I also wrote the sections on cell
adhesion signaling, created the figure, and performed final edits of the paper before submission.
Chapter three of this thesis is a primary research paper on the functions of PDE7B in the
glioblastoma perivascular niche currently in submission. I conceived and designed the
- 18 -
experiments along with Dr. Mitra and Dr. Rubin. I performed all of the experiments except the
tissue microarray. I also analyzed the data and constructed all figures. I wrote the manuscript
with edits and revisions from Dr. Mitra and Dr. Rubin.
References:
1. Strouhal, E. (1976) Tumors in the remains of ancient Egyptians. American journal of physical anthropology, 45, 613-620.
2. Breasted, J.H. and New York, h.s. (1930) The Edwin Smith surgical papyrus. The University of Chicago press, Chicago, Ill.,.
3. Olson, J.S. (1989) The history of cancer : an annotated bibliography. Greenwood Press, New York.
4. Papavramidou, N., Papavramidis, T. and Demetriou, T. (2010) Ancient Greek and Greco-Roman methods in modern surgical treatment of cancer. Annals of surgical oncology, 17, 665-667.
5. Elements of physiology. Lea and Blanchard, Philadelphia,. 6. Haggard, H.W. and Smith, G.M. (1938) Johannes Muller and the Modern Conception of Cancer.
The Yale journal of biology and medicine, 10, 419 b411-436. 7. Virchow, R. (1881) An Address on the Value of Pathological Experiments. British medical journal,
2, 198-203. 8. Virchow, R. (1975) Cellular pathology: Lecture VIII. Blood and lymph. CA: a cancer journal for
clinicians, 25, 93-97. 9. Boveri, T. (2008) Concerning the origin of malignant tumours by Theodor Boveri. Translated and
annotated by Henry Harris. Journal of cell science, 121 Suppl 1, 1-84. 10. Rous, P. (1911) A Sarcoma of the Fowl Transmissible by an Agent Separable from the Tumor
Cells. The Journal of experimental medicine, 13, 397-411. 11. Stehelin, D., Varmus, H.E., Bishop, J.M. and Vogt, P.K. (1976) DNA related to the transforming
gene(s) of avian sarcoma viruses is present in normal avian DNA. Nature, 260, 170-173. 12. Nordling, C.O. (1953) A new theory on cancer-inducing mechanism. British journal of cancer, 7,
68-72. 13. Armitage, P. and Doll, R. (1954) The age distribution of cancer and a multi-stage theory of
carcinogenesis. British journal of cancer, 8, 1-12. 14. Armitage, P. and Doll, R. (1957) A two-stage theory of carcinogenesis in relation to the age
distribution of human cancer. British journal of cancer, 11, 161-169. 15. Knudson, A.G., Jr. (1971) Mutation and cancer: statistical study of retinoblastoma. Proceedings
of the National Academy of Sciences of the United States of America, 68, 820-823. 16. Fix, E. and Neyman, J. (1951) A simple stochastic model of recovery, relapse, death and loss of
patients. Human biology, 23, 205-241. 17. Pascua, M. (1956) Trends of female mortality from cancer of the breast and cancer of the genital
organs. Bulletin of the World Health Organization, 15, 5-41. 18. Marte, B. (2006) Lack of Principles. Nature Reviews Cancer, 6, S08-S09.

- 19 -
19. Shope, R.E. and Hurst, E.W. (1933) Infectious Papillomatosis of Rabbits : With a Note on the Histopathology. The Journal of experimental medicine, 58, 607-624.
20. Eddy, B.E., Borman, G.S., Berkeley, W.H. and Young, R.D. (1961) Tumors induced in hamsters by injection of rhesus monkey kidney cell extracts. Proceedings of the Society for Experimental Biology and Medicine. Society for Experimental Biology and Medicine, 107, 191-197.
21. Harris, H. (1971) Cell fusion and the analysis of malignancy. Proceedings of the Royal Society of London. Series B, Containing papers of a Biological character. Royal Society, 179, 1-20.
22. Comings, D.E. (1973) A general theory of carcinogenesis. Proceedings of the National Academy of Sciences of the United States of America, 70, 3324-3328.
23. Cavenee, W.K., Dryja, T.P., Phillips, R.A., Benedict, W.F., Godbout, R., Gallie, B.L., Murphree, A.L., Strong, L.C. and White, R.L. (1983) Expression of recessive alleles by chromosomal mechanisms in retinoblastoma. Nature, 305, 779-784.
24. Friend, S.H., Bernards, R., Rogelj, S., Weinberg, R.A., Rapaport, J.M., Albert, D.M. and Dryja, T.P. (1986) A human DNA segment with properties of the gene that predisposes to retinoblastoma and osteosarcoma. Nature, 323, 643-646.
25. Lee, W.H., Bookstein, R., Hong, F., Young, L.J., Shew, J.Y. and Lee, E.Y. (1987) Human retinoblastoma susceptibility gene: cloning, identification, and sequence. Science, 235, 1394-1399.
26. Fung, Y.K., Murphree, A.L., T'Ang, A., Qian, J., Hinrichs, S.H. and Benedict, W.F. (1987) Structural evidence for the authenticity of the human retinoblastoma gene. Science, 236, 1657-1661.
27. Huang, H.J., Yee, J.K., Shew, J.Y., Chen, P.L., Bookstein, R., Friedmann, T., Lee, E.Y. and Lee, W.H. (1988) Suppression of the neoplastic phenotype by replacement of the RB gene in human cancer cells. Science, 242, 1563-1566.
28. Olivier, M., Hollstein, M. and Hainaut, P. (2010) TP53 mutations in human cancers: origins, consequences, and clinical use. Cold Spring Harbor perspectives in biology, 2, a001008.
29. Eliyahu, D., Raz, A., Gruss, P., Givol, D. and Oren, M. (1984) Participation of p53 cellular tumour antigen in transformation of normal embryonic cells. Nature, 312, 646-649.
30. Eliyahu, D., Michalovitz, D. and Oren, M. (1985) Overproduction of p53 antigen makes established cells highly tumorigenic. Nature, 316, 158-160.
31. Baker, S.J., Fearon, E.R., Nigro, J.M., Hamilton, S.R., Preisinger, A.C., Jessup, J.M., vanTuinen, P., Ledbetter, D.H., Barker, D.F., Nakamura, Y. et al. (1989) Chromosome 17 deletions and p53 gene mutations in colorectal carcinomas. Science, 244, 217-221.
32. Druker, B.J., Talpaz, M., Resta, D.J., Peng, B., Buchdunger, E., Ford, J.M., Lydon, N.B., Kantarjian, H., Capdeville, R., Ohno-Jones, S. et al. (2001) Efficacy and safety of a specific inhibitor of the BCR-ABL tyrosine kinase in chronic myeloid leukemia. The New England journal of medicine, 344, 1031-1037.
33. Lynch, T.J., Bell, D.W., Sordella, R., Gurubhagavatula, S., Okimoto, R.A., Brannigan, B.W., Harris, P.L., Haserlat, S.M., Supko, J.G., Haluska, F.G. et al. (2004) Activating mutations in the epidermal growth factor receptor underlying responsiveness of non-small-cell lung cancer to gefitinib. The New England journal of medicine, 350, 2129-2139.
34. Mintz, B. and Illmensee, K. (1975) Normal genetically mosaic mice produced from malignant teratocarcinoma cells. Proceedings of the National Academy of Sciences of the United States of America, 72, 3585-3589.
35. Stewart, T.A. and Mintz, B. (1981) Successive generations of mice produced from an established culture line of euploid teratocarcinoma cells. Proceedings of the National Academy of Sciences of the United States of America, 78, 6314-6318.

- 20 -
36. Rossant, J. and McBurney, M.W. (1982) The developmental potential of a euploid male teratocarcinoma cell line after blastocyst injection. Journal of embryology and experimental morphology, 70, 99-112.
37. Dolberg, D.S. and Bissell, M.J. (1984) Inability of Rous sarcoma virus to cause sarcomas in the avian embryo. Nature, 309, 552-556.
38. Dolberg, D.S., Hollingsworth, R., Hertle, M. and Bissell, M.J. (1985) Wounding and its role in RSV-mediated tumor formation. Science, 230, 676-678.
39. Sieweke, M.H., Thompson, N.L., Sporn, M.B. and Bissell, M.J. (1990) Mediation of wound-related Rous sarcoma virus tumorigenesis by TGF-beta. Science, 248, 1656-1660.
40. Reya, T., Morrison, S.J., Clarke, M.F. and Weissman, I.L. (2001) Stem cells, cancer, and cancer stem cells. Nature, 414, 105-111.
41. Nguyen, L.V., Vanner, R., Dirks, P. and Eaves, C.J. (2012) Cancer stem cells: an evolving concept. Nature reviews. Cancer, 12, 133-143.
42. Beck, B. and Blanpain, C. (2013) Unravelling cancer stem cell potential. Nature reviews. Cancer, 13, 727-738.
43. Bonnet, D. and Dick, J.E. (1997) Human acute myeloid leukemia is organized as a hierarchy that originates from a primitive hematopoietic cell. Nature medicine, 3, 730-737.
44. Furth, J., Kahn, M.C. and Breedis, C. (1937) The Transmission of Leukemia of Mice with a Single Cell. The American Journal of Cancer, 31, 276-282.
45. Al-Hajj, M., Wicha, M.S., Benito-Hernandez, A., Morrison, S.J. and Clarke, M.F. (2003) Prospective identification of tumorigenic breast cancer cells. Proceedings of the National Academy of Sciences of the United States of America, 100, 3983-3988.
46. Singh, S.K., Clarke, I.D., Terasaki, M., Bonn, V.E., Hawkins, C., Squire, J. and Dirks, P.B. (2003) Identification of a cancer stem cell in human brain tumors. Cancer research, 63, 5821-5828.
47. Ahrens, T., Assmann, V., Fieber, C., Termeer, C., Herrlich, P., Hofmann, M. and Simon, J.C. (2001) CD44 is the principal mediator of hyaluronic-acid-induced melanoma cell proliferation. The Journal of investigative dermatology, 116, 93-101.
48. Bourguignon, L.Y., Singleton, P.A., Diedrich, F., Stern, R. and Gilad, E. (2004) CD44 interaction with Na+-H+ exchanger (NHE1) creates acidic microenvironments leading to hyaluronidase-2 and cathepsin B activation and breast tumor cell invasion. The Journal of biological chemistry, 279, 26991-27007.
49. Spaeth, E.L., Labaff, A.M., Toole, B.P., Klopp, A., Andreeff, M. and Marini, F.C. (2013) Mesenchymal CD44 expression contributes to the acquisition of an activated fibroblast phenotype via TWIST activation in the tumor microenvironment. Cancer research, 73, 5347-5359.
50. Canis, M., Lechner, A., Mack, B., Zengel, P., Laubender, R.P., Koehler, U., Heissmeyer, V. and Gires, O. (2013) CD133 induces tumour-initiating properties in HEK293 cells. Tumour biology : the journal of the International Society for Oncodevelopmental Biology and Medicine, 34, 437-443.
51. Angelastro, J.M. and Lame, M.W. (2010) Overexpression of CD133 promotes drug resistance in C6 glioma cells. Molecular cancer research : MCR, 8, 1105-1115.
52. Dong, L., Qi, N., Ge, R.M., Cao, C.L., Lan, F. and Shen, L. (2010) Overexpression of CD133 promotes the phosphorylation of Erk in U87MG human glioblastoma cells. Neuroscience letters, 484, 210-214.
53. Chen, Y.S., Wu, M.J., Huang, C.Y., Lin, S.C., Chuang, T.H., Yu, C.C. and Lo, J.F. (2011) CD133/Src axis mediates tumor initiating property and epithelial-mesenchymal transition of head and neck cancer. PloS one, 6, e28053.

- 21 -
54. Simonavicius, N., Robertson, D., Bax, D.A., Jones, C., Huijbers, I.J. and Isacke, C.M. (2008) Endosialin (CD248) is a marker of tumor-associated pericytes in high-grade glioma. Modern pathology : an official journal of the United States and Canadian Academy of Pathology, Inc, 21, 308-315.
55. Cheng, L., Huang, Z., Zhou, W., Wu, Q., Donnola, S., Liu, J.K., Fang, X., Sloan, A.E., Mao, Y., Lathia, J.D. et al. (2013) Glioblastoma stem cells generate vascular pericytes to support vessel function and tumor growth. Cell, 153, 139-152.
56. Calabrese, C., Poppleton, H., Kocak, M., Hogg, T.L., Fuller, C., Hamner, B., Oh, E.Y., Gaber, M.W., Finklestein, D., Allen, M. et al. (2007) A perivascular niche for brain tumor stem cells. Cancer cell, 11, 69-82.
57. Zhai, H., Heppner, F.L. and Tsirka, S.E. (2011) Microglia/macrophages promote glioma progression. Glia, 59, 472-485.
58. Becher, O.J., Hambardzumyan, D., Fomchenko, E.I., Momota, H., Mainwaring, L., Bleau, A.M., Katz, A.M., Edgar, M., Kenney, A.M., Cordon-Cardo, C. et al. (2008) Gli activity correlates with tumor grade in platelet-derived growth factor-induced gliomas. Cancer research, 68, 2241-2249.
59. Le, D.M., Besson, A., Fogg, D.K., Choi, K.S., Waisman, D.M., Goodyer, C.G., Rewcastle, B. and Yong, V.W. (2003) Exploitation of astrocytes by glioma cells to facilitate invasiveness: a mechanism involving matrix metalloproteinase-2 and the urokinase-type plasminogen activator-plasmin cascade. The Journal of neuroscience : the official journal of the Society for Neuroscience, 23, 4034-4043.
60. Sanger, F., Air, G.M., Barrell, B.G., Brown, N.L., Coulson, A.R., Fiddes, C.A., Hutchison, C.A., Slocombe, P.M. and Smith, M. (1977) Nucleotide sequence of bacteriophage phi X174 DNA. Nature, 265, 687-695.
61. Yadav, S.P. (2007) The wholeness in suffix -omics, -omes, and the word om. Journal of biomolecular techniques : JBT, 18, 277.
62. Hogeweg, P. (2011) The roots of bioinformatics in theoretical biology. PLoS computational biology, 7, e1002021.
63. Sanger, F., Nicklen, S. and Coulson, A.R. (1977) DNA sequencing with chain-terminating inhibitors. Proceedings of the National Academy of Sciences of the United States of America, 74, 5463-5467.
64. Lander, E.S., Linton, L.M., Birren, B., Nusbaum, C., Zody, M.C., Baldwin, J., Devon, K., Dewar, K., Doyle, M., FitzHugh, W. et al. (2001) Initial sequencing and analysis of the human genome. Nature, 409, 860-921.
65. Hillier, L.W., Fulton, R.S., Fulton, L.A., Graves, T.A., Pepin, K.H., Wagner-McPherson, C., Layman, D., Maas, J., Jaeger, S., Walker, R. et al. (2003) The DNA sequence of human chromosome 7. Nature, 424, 157-164.
66. Skaletsky, H., Kuroda-Kawaguchi, T., Minx, P.J., Cordum, H.S., Hillier, L., Brown, L.G., Repping, S., Pyntikova, T., Ali, J., Bieri, T. et al. (2003) The male-specific region of the human Y chromosome is a mosaic of discrete sequence classes. Nature, 423, 825-837.
67. Ewing, B., Hillier, L., Wendl, M.C. and Green, P. (1998) Base-calling of automated sequencer traces using phred. I. Accuracy assessment. Genome research, 8, 175-185.
68. Ewing, B. and Green, P. (1998) Base-calling of automated sequencer traces using phred. II. Error probabilities. Genome research, 8, 186-194.
69. Mardis, E.R. (2011) A decade's perspective on DNA sequencing technology. Nature, 470, 198-203.
70. International HapMap, C., Altshuler, D.M., Gibbs, R.A., Peltonen, L., Altshuler, D.M., Gibbs, R.A., Peltonen, L., Dermitzakis, E., Schaffner, S.F., Yu, F. et al. (2010) Integrating common and rare genetic variation in diverse human populations. Nature, 467, 52-58.

- 22 -
71. International HapMap, C. (2003) The International HapMap Project. Nature, 426, 789-796. 72. International HapMap, C. (2005) A haplotype map of the human genome. Nature, 437, 1299-
1320. 73. Consortium, E.P., Bernstein, B.E., Birney, E., Dunham, I., Green, E.D., Gunter, C. and Snyder, M.
(2012) An integrated encyclopedia of DNA elements in the human genome. Nature, 489, 57-74. 74. Thurman, R.E., Rynes, E., Humbert, R., Vierstra, J., Maurano, M.T., Haugen, E., Sheffield, N.C.,
Stergachis, A.B., Wang, H., Vernot, B. et al. (2012) The accessible chromatin landscape of the human genome. Nature, 489, 75-82.
75. Djebali, S., Davis, C.A., Merkel, A., Dobin, A., Lassmann, T., Mortazavi, A., Tanzer, A., Lagarde, J., Lin, W., Schlesinger, F. et al. (2012) Landscape of transcription in human cells. Nature, 489, 101-108.
76. Boyle, A.P., Hong, E.L., Hariharan, M., Cheng, Y., Schaub, M.A., Kasowski, M., Karczewski, K.J., Park, J., Hitz, B.C., Weng, S. et al. (2012) Annotation of functional variation in personal genomes using RegulomeDB. Genome research, 22, 1790-1797.
77. Harrow, J., Frankish, A., Gonzalez, J.M., Tapanari, E., Diekhans, M., Kokocinski, F., Aken, B.L., Barrell, D., Zadissa, A., Searle, S. et al. (2012) GENCODE: the reference human genome annotation for The ENCODE Project. Genome research, 22, 1760-1774.
78. Mardis, E.R. (2008) Next-generation DNA sequencing methods. Annual review of genomics and human genetics, 9, 387-402.
79. Ronaghi, M., Uhlen, M. and Nyren, P. (1998) A sequencing method based on real-time pyrophosphate. Science, 281, 363, 365.
80. Mitra, R.D., Shendure, J., Olejnik, J., Edyta Krzymanska, O. and Church, G.M. (2003) Fluorescent in situ sequencing on polymerase colonies. Analytical biochemistry, 320, 55-65.
81. Shendure, J., Porreca, G.J., Reppas, N.B., Lin, X., McCutcheon, J.P., Rosenbaum, A.M., Wang, M.D., Zhang, K., Mitra, R.D. and Church, G.M. (2005) Accurate multiplex polony sequencing of an evolved bacterial genome. Science, 309, 1728-1732.
82. Documentation, I.T. (2010), Vol. 2013. 83. Ley, T.J., Mardis, E.R., Ding, L., Fulton, B., McLellan, M.D., Chen, K., Dooling, D., Dunford-Shore,
B.H., McGrath, S., Hickenbotham, M. et al. (2008) DNA sequencing of a cytogenetically normal acute myeloid leukaemia genome. Nature, 456, 66-72.
84. Cancer Genome Atlas Research, N. (2013) Genomic and epigenomic landscapes of adult de novo acute myeloid leukemia. The New England journal of medicine, 368, 2059-2074.
85. Holmfeldt, L., Wei, L., Diaz-Flores, E., Walsh, M., Zhang, J., Ding, L., Payne-Turner, D., Churchman, M., Andersson, A., Chen, S.C. et al. (2013) The genomic landscape of hypodiploid acute lymphoblastic leukemia. Nature genetics, 45, 242-252.
86. Shah, S.P., Morin, R.D., Khattra, J., Prentice, L., Pugh, T., Burleigh, A., Delaney, A., Gelmon, K., Guliany, R., Senz, J. et al. (2009) Mutational evolution in a lobular breast tumour profiled at single nucleotide resolution. Nature, 461, 809-813.
87. Berger, M.F., Lawrence, M.S., Demichelis, F., Drier, Y., Cibulskis, K., Sivachenko, A.Y., Sboner, A., Esgueva, R., Pflueger, D., Sougnez, C. et al. (2011) The genomic complexity of primary human prostate cancer. Nature, 470, 214-220.
88. Brennan, C.W., Verhaak, R.G., McKenna, A., Campos, B., Noushmehr, H., Salama, S.R., Zheng, S., Chakravarty, D., Sanborn, J.Z., Berman, S.H. et al. (2013) The somatic genomic landscape of glioblastoma. Cell, 155, 462-477.
89. Zhang, J., Wu, G., Miller, C.P., Tatevossian, R.G., Dalton, J.D., Tang, B., Orisme, W., Punchihewa, C., Parker, M., Qaddoumi, I. et al. (2013) Whole-genome sequencing identifies genetic alterations in pediatric low-grade gliomas. Nature genetics, 45, 602-612.

- 23 -
90. Pleasance, E.D., Stephens, P.J., O'Meara, S., McBride, D.J., Meynert, A., Jones, D., Lin, M.L., Beare, D., Lau, K.W., Greenman, C. et al. (2010) A small-cell lung cancer genome with complex signatures of tobacco exposure. Nature, 463, 184-190.
91. Liang, W.S., Craig, D.W., Carpten, J., Borad, M.J., Demeure, M.J., Weiss, G.J., Izatt, T., Sinari, S., Christoforides, A., Aldrich, J. et al. (2012) Genome-wide characterization of pancreatic adenocarcinoma patients using next generation sequencing. PloS one, 7, e43192.
92. Bass, A.J., Lawrence, M.S., Brace, L.E., Ramos, A.H., Drier, Y., Cibulskis, K., Sougnez, C., Voet, D., Saksena, G., Sivachenko, A. et al. (2011) Genomic sequencing of colorectal adenocarcinomas identifies a recurrent VTI1A-TCF7L2 fusion. Nature genetics, 43, 964-968.
93. Gartner, J.J., Parker, S.C., Prickett, T.D., Dutton-Regester, K., Stitzel, M.L., Lin, J.C., Davis, S., Simhadri, V.L., Jha, S., Katagiri, N. et al. (2013) Whole-genome sequencing identifies a recurrent functional synonymous mutation in melanoma. Proceedings of the National Academy of Sciences of the United States of America, 110, 13481-13486.
94. International Cancer Genome, C., Hudson, T.J., Anderson, W., Artez, A., Barker, A.D., Bell, C., Bernabe, R.R., Bhan, M.K., Calvo, F., Eerola, I. et al. (2010) International network of cancer genome projects. Nature, 464, 993-998.
95. Cancer Genome Atlas Research, N. (2008) Comprehensive genomic characterization defines human glioblastoma genes and core pathways. Nature, 455, 1061-1068.
96. , Vol. 2013. 97. Gerlinger, M., Rowan, A.J., Horswell, S., Larkin, J., Endesfelder, D., Gronroos, E., Martinez, P.,
Matthews, N., Stewart, A., Tarpey, P. et al. (2012) Intratumor heterogeneity and branched evolution revealed by multiregion sequencing. The New England journal of medicine, 366, 883-892.
98. Russnes Hg Fau - Navin, N., Navin N Fau - Hicks, J., Hicks J Fau - Borresen-Dale, A.-L. and Borresen-Dale, A.L. Insight into the heterogeneity of breast cancer through next-generation sequencing.
99. Oesper, L., Mahmoody, A. and Raphael, B.J. (2013) THetA: inferring intra-tumor heterogeneity from high-throughput DNA sequencing data. Genome biology, 14, R80.
100. Navin, N., Kendall, J., Troge, J., Andrews, P., Rodgers, L., McIndoo, J., Cook, K., Stepansky, A., Levy, D., Esposito, D. et al. (2011) Tumour evolution inferred by single-cell sequencing. Nature, 472, 90-94.
101. Xu, X., Hou, Y., Yin, X., Bao, L., Tang, A., Song, L., Li, F., Tsang, S., Wu, K., Wu, H. et al. (2012) Single-cell exome sequencing reveals single-nucleotide mutation characteristics of a kidney tumor. Cell, 148, 886-895.

- 24 -
Chapter 2: Hitting Them Where They Live: Targeting the
Glioblastoma Perivascular Stem Cell Niche
This review was published in Current Pathobiology Reports 2013 Jun 1;1(2):101-110.
Authors:
Michael D. Brooks, Rajarshi Sengupta, Steven C. Snyder, & Joshua B. Rubin
Department of Pediatrics, Washington University School of Medicine, 660 South Euclid Ave. St
Louis, MO 63110

- 25 -
Abstract
Glioblastoma growth potential and resistance to therapy is currently largely attributed to a subset
of tumor cells with stem-like properties. If correct, this means that cure will not be possible
without eradication of the stem cell fraction and abrogation of those mechanisms through which
stem cell activity is induced and maintained. Glioblastoma stem cell functions appear to be non-
cell autonomous and the consequence of tumor cell residence within specialized domains such as
the perivascular stem cell niche. In this review we consider the multiple cellular constituents of
the perivascular niche, the molecular mechanisms that support niche structure and function and
the implications of the perivascular localization of stem cells for anti-angiogenic approaches to
cure.
Introduction
As initially conceived by Judah Folkman, tumor growth is indeed “angiogenesis dependent” (1).
While visionary, this revolutionary statement was limited by knowledge current in 1971 to a
declaration regarding the necessity of a blood supply for nutrients and oxygen. Dr. Folkman and
his contemporaries could not have imagined that angiogenesis was also a process that creates a
specialized domain for the support, expansion and spread of a subpopulation of tumor cells with
stem cell like properties (cancer stem cells (CSCs)). This specialized space, the perivascular
domain or niche (PVN) is an exquisite collaboration between tumor cells, endothelial cells,
pericytes and tissue specific components, for the maintenance of the tumor stem cell population.

- 26 -
In light of this greater appreciation for the importance of angiogenesis to tumor persistence and
progression, targeting angiogenesis for cancer therapy would seem to have even greater potential
than originally conceived. Not only can it disrupt blood supply and oxygen delivery, it can
abrogate the formation of niche space and thereby terminate the potential for tumor growth.
However, clinical experience with anti-angiogenic therapy that targets the single most potent
angiogenic factor, vascular endothelial cell growth factor (VEGF), or its receptors has taught us
that there are multiple mechanisms by which tumors stimulate angiogenesis and resist anti-
VEGF therapies. These mechanisms are diverse and involve additional soluble angiogenic
factors, changes in the cellular constituents of the vascular unit, and even transdifferentiation of
tumor cells into endothelial cells. This experience suggests that targeting the structure of the
niche by simply trying to block its formation may not be practical. Instead, alternatively targeting
niche function may have superior therapeutic effect without stimulating resistance mechanisms.
In order to succeed in this endeavor it is imperative to understand the functions of the niche and
the mechanisms that serve those functions. In this review we will examine the cellular
components of the brain tumor stem cell niche and core modes of intercellular communication
that support its coordinated activities.
Functions of the Perivascular Niche
Experience with culturing brain tumor stem cells suggests that the stem cell state is an unstable
one and that in the absence of appropriate signals these cells will undergo spontaneous
differentiation. Thus we can conclude that the functions of the niche include blocking
differentiation in order to maintain the stem cell phenotype. Consistent with this, when brain

- 27 -
tumor stem cells are grown in vitro in the presence of endothelial cells, there is a measureable
increase in self-renewal capacity and quaternary tumor sphere formation (2-5). Moreover,
treatment of xenograft brain tumor models with anti-angiogenic agents alone or in combination
with cytoxic chemotherapy results in decreases in the population of self-renewing CD133+,
Nestin+ cancer stem cells (3,6).
In addition to maintaining the cancer stem cell population, the PVN also promotes tumor cell
proliferation (2,3). Primary glioblastoma multiforme (GBM) cells grown in the presence of
human brain microvascular endothelial cells (HBMECs) exhibit increased growth in vivo and in
vitro compared to GBM cells alone, and like the normal neural stem cell niche this is due at least
in part to the actions of endothelial cell-derived CXCL12 (7,8). In addition, GBM-associated
endothelial cells express sonic hedgehog (SHH, (9)), which can also stimulate tumor cell
proliferation (10).
Importantly, the PVN can provide sanctuary and protect GBM from the actions of both radiation
and chemotherapy. The backbone of malignant brain tumor treatment is DNA damaging agents
like radiation therapy and alkylator chemotherapy. The efficacy of these regimens is highly
dependent upon mitotic activity in target cells and a fraction of the tumor stem cells are found in
a slow-cycling or quiescent state, which would render them resistant to DNA damaging agents
(11,12). In addition, the efficacy of DNA damaging agents is sensitive to changes in DNA repair
capacity. Within the PVN there is a measureable increase in DNA repair capacity, possibly
through the actions of microenvironment-derived TGF- (13). This would also mitigate against
the impact of DNA damaging agents (14,15). Moreover, tumor stem cells exhibit increased

- 28 -
expression of multidrug resistance transporters (such as ABC and MDR transporters), which are
responsible for the efflux of chemotherapeutics out of cells and thus limit the exposure of tumor
cells within the PVN to DNA damaging agents (16,17). This property has been used to identify
GBM stem cells as the Hoechst stain negative side-population of tumor cells on FACS analysis
(18). Finally, GBM stem cells avoid immune detection and suppress immune activity through
diminished expression of MHC (19) and secretion of immunosuppressive cytokines that block T
cell proliferation and activation (20), an effect that is augmented by hypoxia (21).
The peri-endothelial space also provides an important conduit for infiltrative spread of GBM
throughout the brain. In 1938, Scherer described the movement of GBM cells away from the
primary tumor mass along the perivascular space (22), and dispersal of GBM along through this
space may be a critical component of tumor recurrence after gross total resections and tumor bed
irradiation. The basis for this pattern of GBM cell movement may be due to chemotactic effects
of high levels of CXCL12 found within the PVN (7,23) and CXCL12’s effects on expression of
cathepsins and matrix metalloproteinases (MMP) (24).
Origins of the Perivascular brain Tumor Stem Cell Niche
Multiple mechanisms have been proposed through which brain tumor cells might forge stem cell
supportive interactions with endothelial cells, including: co-opting existing blood vessels and
stimulating angiogenesis. Surprisingly, however, in three recent papers (25) (26) (27) it was
shown that GBM stem cells themselves can transdifferentiate into endothelial cells. Up to 60%
of the tumor-associated endothelial cells shared genetic background with tumor cells, and a
subset of the CD133 positive brain tumor stem cell fraction were also positive for vascular
- 29 -
endothelial-cadherin (CD144). Similar transdifferentiation of normal neural stem cells into
endothelial cells has also been described (28) and may represent a broadly important
phenomenon. The frequency of GBM-derived endothelial cells in patient specimens remains to
be fully determined and the potential for these GBM-derived endothelial cells to provide
structural niche space and regulatory control of niche function remains to be defined.
Components of the brain tumor stem cell niche
Development of the tumor PVN involves recruitment of a multiple cell types to the niche. We
are only starting to understand the complex cellular architecture of the niche and the significance
of each cell type to the functions of this microdomain. The brain tumor PVN is comprised of
vascular endothelial cells, pericytes and astrocytes as well as macrophages/microglia.
Understanding the molecular mechanisms by which each of these cell types interact with each
other and with the CSCs will help us therapeutically target those interactions within the PVN and
block tumor progression.
Endothelial cells – In adult neurogenic niche, CSCs are often localized along the tumor
vasculature (29). Glioma stem cells, which are frequently identified by their expression of
surface markers such as CD133 (30), constitute a small fraction of the total tumor population.
They appear to preferentially align themselves in the peri-endothelial space, compared to their
non-stem cell counterparts, and their fractional abundance within total tumor cell numbers is
strongly and positively correlated with tumor grade (31,32). A repertoire of soluble and cell-

- 30 -
surface molecules have been identified, which through paracrine and/or autocrine mechanisms
mediate reciprocal cross talk between the endothelium and tumor cells in GBM. We recently
reported that brain endothelial cell derived CXCL12 chemoattracts and supports proliferation of
primary human GBM cells (7). Signaling pathways such as Notch, sonic hedgehog (SHH),
VEGF, hepatocyte growth factor (HGF), pigment epithelium-derived factor (PEDF) and nitric
oxide (NO), many of which are also important for neural stem cell proliferation, have been
implicated in the inter-cellular communication between endothelial and tumor stem cells within
the PVN (2,4,15,33-37). It is interesting to note that a major distinction between tumor cells and
normal neural cells, is that the tumor stem cell population can be replenished from the non-stem
cell fraction, a phenomenon that is not observed for normal neural cells (38). Based on the
frequent localization of tumor stem cells to the PVN, as well as the observation that pathways
critical for stem cell survival are active within this niche, the PVN may function to chemoattract
tumor cells, promote their transition to a “stem” like phenotype and support their maintenance
and proliferation.
Pericytes – Pericytes are mesenchymal cells that are usually embedded in the vascular basement
membrane where they surround and stabilize the newly formed vasculature. Several reports have
indicated that pericytes are an integral part of the tumor PVN and regulate proliferation, invasion
and angiogenesis through their interactions with endothelial cells. Studies in a variety of cancers
including melanomas, pancreatic cancer, lung adenocarcinoma and GBM have identified
different signaling pathways such as platelet-derived growth factor-) (PDGF-), epidermal
growth factor (EGF), hypoxia-inducible factor- 1 (HIF-1) and CXCL12 that are involved in
the recruitment of pericytes to the tumor vessels (39). Reciprocal signaling between endothelial

- 31 -
cells and adjacent pericytes through soluble, as well as membrane bound, factors such as PDGF,
angiopoetin-Tie2, and angiotensin can actively regulate angiogenesis (40). In contrast to normal
pericytes, tumor pericytes are loosely associated with the endothelial cells leading to leaky
vasculature suggesting that normalization of the tumor vessels may have therapeutic relevance.
The limited success of anti-VEGF therapy in GBM and other tumors has led to the proposal that
double targeting of pericytes and endothelial cells might be productive of greater therapeutic
effect (41). However, the failure of endothelial targeting in the absence of pericytes in certain
tumor models suggests that the role of pericytes in the PVN needs further investigation (42).
Astrocytes - In the normal brain, astrocytes provide structural support to the brain vasculature
and maintain blood brain barrier (BBB) integrity through end processes that interact with the
vascular endothelial cells (43). In the normal adult neurogenic niche, astrocytes induce stem cell
proliferation through the activation of purinegic receptors on stem cells while negatively
regulating neurogenesis through the Notch pathway (29,44). Gliomas induce changes in proteins
expressed in astrocytic endfeet leading to a loss of astrocytic regulation of endothelial functions
and dysregulation of the BBB (45). Gliomas often contain pathology-associated or reactive
astrocytes, which may mediate tumor cell invasion via activation of MMPs. Astrocyte elevated
gene (AEG-1), initially isolated in fetal astrocytes is often implicated in metastatic progression
and invasion of gliomas (40). In a PDGF-induced glioma model, SHH expressing reactive
astrocytes were identified in close association with nestin expressing tumor cells (9). Glioma
stem cells have been shown to express the SHH receptor patched (PTC) and inhibition of the
pathway leads to the disruption of stem-like and tumorigenic properties suggesting that SHH
producing microenvironment may act as a stem cell niche.

- 32 -
Macrophage/microglia – Tumor associated macrophages/microglia (TAM/Ms) may constitute
up to 5-30% of the tumor cell population. They are frequently localized adjacent to tumor stem
cells in the PVN (46). Chemokines such as macrophage chemotactic protein (MCP)-1 and 3 as
well as cytokines including colony stimulating factor (CSF)-1, granulocyte colony stimulating
factor (G-CSF), and HGF have been implicated in the chemo-attraction of the macrophages to
the PVN and CSCs (40). Reciprocal interactions between the glioma cells and macrophages
facilitate an immune suppressive but tumor supportive phenotype for macrophages that promote
tumor growth and invasion through activation of MMPs. Glioma CSCs have been shown to
inhibit macrophage/microglia phagocytosis, induce secretion of immune-suppressive cytokines
such as IL-10 and transforming growth factor (TGF)-1 and enhance macrophage/microglia
induced T-cell proliferation via STAT-3 pathway (47,48). Recent studies have demonstrated that
TAM/Ms can enhance angiogenesis, as well as the proliferation and invasiveness of glioma
CSCs via release of TGF-1, which induces expression of MMP-9 by glioma CSCs (49).
Extra-cellular matrix – In addition to the cellular milieu cancer stem cells like neural stem cells
also interact with the extracellular matrix components within the PVN (50), especially laminin
(51). The composition of laminins has been correlated with tumor grade and patient survival in
gliomas (52). Furthermore, the laminin receptor integrin α6 β1 has been shown to promote
endothelial cell growth in GBM, which may indirectly modulate tumor stem cell survival (53).
The role of other ECM components in modulating CSCs and tumorigenesis needs further
investigation.

- 33 -
Ependymal Cells – While the tumor PVN and normal neural stem cell niche share many
features, there are also distinct differences on both the cellular and molecular levels. For
example, ependymal cells are a critical component of the SVZ stem cell niche, and their cell
number within the neurogenic zone correlates with stem cell number and neurogenesis (54) (55)
(56). Among the identified mechanisms by which ependymal cells regulate stem cell function is
the negative regulation of BMP signaling through expression of LRP2 (55). Recently, molecular
profiles of the cellular constituents of the niche have been published and provide several
additional intriguing candidate mediators of ependymal effects on stem cell function (56).
Whether ependymal cells are similarly involved in the brain tumor PVN is unknown at this time,
though the deeper parenchymal location of most GBM associated niches would suggest that
ependymal cell involvement is unlikely. This raises the interesting question of what, if any,
impact this has on the regulation of stem cell activity within the tumor PVN.
Cell adhesion signaling in the PVN
Many important pathways serve the functions of the niche, and most of these have been expertly
reviewed elsewhere. Therefore, we will focus on a less frequently discussed aspect of the PVN
for which potential therapeutics exist, cellular adhesion signaling including: integrins and
cadherins, and how these molecules influence both cell to cell and cell to ECM interactions
within the PVN.

- 34 -
Integrins in the niche
Integrins are essential transmembrane proteins that both anchor cells to the extracellular matrix
and transmit extracellular signals across the cell membrane in response to ligation by
extracellular matrix components like laminin, fibronectin vitronectin, collagen, thrombospondin
and osteopotin as well as other factors such as FGF. There are currently 24 known heterodimeric
integrins, comprised of one of 18 alpha subunits and 8 beta subunits. While integrins lack
intrinsic kinase activity they transmit signals by forming multimeric complexes called focal
adhesions with other signaling proteins such as focal adhesion kinase (FAK) (57) and adaptor
proteins like p130CAS (58). Unbound integrins can transmit pro-apoptotic signals (59) while
complexed integrins activate core growth and migratory pathways such as the MAPK, PI3K, NF-
kB and Src pathways (60). These activities regulate cell:cell interactions between tumor cells and
endothelial cells as well as between non-tumor stromal elements of the PVN such as perictytes
and endothelial cells. In this fashion, integrins regulate the three-dimensional structure and
function of the stem cell niche.
Importantly, the only gene in common between expression profiling analyses of multiple stem
and progenitor cell populations is the laminin receptor integrin 6 (61-63). Integrin α6 is also
highly expressed by GBM stem cells where it appears to be required for self-renewal activity
(64). Consistent with the importance of laminin and laminin receptors to the functions of the
neural stem cell niche, expression of integrin β1, one of two dimerization partners for integrin 6,
exhibits restricted expression to proliferative cells within the normal subepenbdymal neural stem
- 35 -
cell niche (65). Moreover, surface localization of integrin β1 is enhanced by Galectin 1 (66), an
adhesion molecule that is expressed in normal neural stem cells where it is known to regulate
proliferation (67) (68), as well as in GBM where it additionally promotes invasion (69).
Integrin β1 can function in a signaling axis together with the chemokine receptor CXCR4 (70).
As both Integrin β1 and CXCR4 are highly expressed within the PVN, their crosstalk might
regulate GBM stem cell functions. The impact of integrins on stem cell biology may relate to
their modulation of key stem cell pathways like the Wnt (71), SHH (10) and Notch (72)
pathways.
Malignant transformation is associated with changes in integrin expression in a tumor specific
fashion. Increased αvβ3 and αvβ5 is found in glioblastoma and associated with increased invasion,
especially at the margins of the tumor (73). Interestingly, αvβ8 is also expressed in GBM and
levels of αvβ8 expression correlate with two important growth phenotypes of GBM: angiogenic
and infiltrative. GBM cells with high levels of αvβ8 expression exhibit correspondingly high
levels of TGF- pathway activation and an invasive pattern of growth (74). In contrast, GBM
cells with low levels of αvβ8 expression exhibit correspondingly low levels of TGF- pathway
activation and an angiogenic pattern of growth. This is relevant to the present discussion, as a
shift from an angiogenic to infiltrative pattern of growth has been observed in GBM treated with
anti-angiogenic therapies, which alter PVN structure and function (75-77).
While the molecular basis for changes in integrin expression remains to be fully defined,
components of the PVN including TGF-β and CXCL12/CXCR4 regulate integrin expression in

- 36 -
various tumor types. In GBM, both TGF-β1 and TGF-β2 can increase expression of αvβ3 in
tumor cells and increase their migratory activity (78). The chemokine CXCL12 and its receptor
CXCR4 are important components of the PVN where they recruit brain tumor cells and stimulate
brain tumor cell proliferation (7). Recently it was shown that CXCL12 signaling in prostate
cancer affects the expression of two different integrins; αvβ3 (79) and α5β3 (80) both of which are
correlated with tumor progression (73).
Cadherins in the niche
Cadherins are calcium-dependent cell adhesion molecules that mediate cell:cell interactions
critical for the maintenance of normal tissue structure including the neural stem cell niche (81).
The cadherin superfamily contains multiple members within several subfamiles in which
individual members mediate primarily homotypic interactions to form adherens junctions that
serve to segregate different cells into homogeneous populations or functional units within
tissues. A number of regulators of fate and function are concentrated in adherens junctions in the
central nervous system including: -catenin (82), protein kinase C (83), cdc42 (84) and Numb
(85). Consequently, dynamic regulation of cadherin expression or cadherin-switching controls
cell migration, fate and function during normal development and oncogenesis. In the normal
neural stem cell niche, N-cadherin expression is required to maintain the progenitor state while
loss leads to delamination and differentiation of newly generated neurons (86). Much attention
has been focused on the regulation of cadherin expression in cancer as dramatic changes in
cadherins accompany Epithelial-Mesenchymal Transition (EMT), a critical step in malignant
progression.

- 37 -
Alterations in GBM cadherin expression are also documented to accompany alterations in
growth. The switch from angiogenic to infiltrative pattern of growth seen with VEGF pathway
antagonism is accompanied not only by changes in integrin expression but also by a T to N
cadherin switch (87). Similarly, Cadherin 11, a marker of mesenchymal subtype of GBM,
enhances GBM cell migration and appears to be required for tumor growth in vivo (88). Possibly
most exciting with regard to cadherins and GBM stem cell activity and the PVN is the
observation that expression of E-Cadherin in GBM patient specimens is associated with poor
prognosis (89) and that a subset of E-cadherin expressing CD133 positive GBM stem cells
appears to have the capacity for transdifferentiation into endothelial cells (25,27).
Cadherin expression is regulated by several transcription factors including FoxP2 and 4 (86),
Twist (90) and Snail (91). In cancer, it appears that cadherin expression is also regulated by
cytokines like IL-8 (92). Increased IL-8 expression is associated with EMT in breast cancer (93)
and positively correlated with astrocytoma grade (94). Importantly, IL8 is expressed at high
levels by tumor associated endothelial cells (95) and thus is likely to be active within the PVN.
Finally, interactions between cadherins and integrins have been recently observed in GBM stem
cells (96). These interactions appear to regulate intracellular signaling and migration. Moreover,
co-regulation of N-cadherin and integrin 1 by the receptor tyrosine kinase Tie2 is required for
the adhesion of GBM cells to the endothelium as occurs within the PVN (97).

- 38 -
Targeting the Niche
The identification of brain tumor stem cells and their perivascular niche has energized efforts to
develop stem cell directed therapies. Targeting stem cell activity can theoretically be achieved
by: 1) targeting the stem cells themselves, 2) by targeting PVN formation or, 3) by targeting
PVN function.
Abrogation of PVN formation through anti-angiogenic therapy is a potentially powerful
approach to stopping tumor progression. VEGF antagonism is well tolerated and has efficacy but
alone, or in combination with irinotecan, it does not have a lasting effect on survival. Multiple
mechanisms can drive tumor progression in the setting of VEGF antagonism (98). The
mechanisms of resistance to VEGF antagonism are diverse and instructive when considering
how to block PVN formation. In response to bevacizumab there are increases in expression of
pro-angiogenic factors like FGFs 1 and 2 and CXCL12 (99,100), as well as increased

- 39 -

- 40 -
recruitment of pro-angiogenic bone-marrow-derived cells (101-103). In addition,
transdifferentiation of glioma stem cells into endothelial-like cells may also contribute to VEGF-
independent angiogenesis (26,104,105). Finally, avastin therapy may produce a shift in the
growth pattern of GBM from angiogenic to infiltrative in which new niche formation may be
induced in co-opted existing blood vessels (75-77). Thus resistance to VEGF antagonism
involves a complex mix of responses that suggests it may be difficult to completely block the
formation of new GBM stem cell niches.
While the logic of targeting stem cells themselves is robust, recent work has demonstrated that
the stem cell population is heterogeneous and may not be a discrete subpopulation. Instead, stem
cells may exist as a component of a dynamic steady state involving a number of tumor cell
phenotypes in which transitions occur between stem cell and non-tumor cell states, including into
endothelial cells (38,106). Therefore targeting the stem cell state may also prove to have
limitations with regard to abrogating stem cell activity.
Thus it may be more important to target the mechanisms that favor transitions to the stem cell
state and thereby prevent the replenishment of tumor-initiating capacity from non-tumor stem
cells. This may also have the added advantage of targeting functions of non-neoplastic cells
within the niche, i.e., astrocytes, endothelial cells, pericytes, which may have more limited
capacity for resistance.
As described above, homeostasis within the stem cell niche is maintained through the
choreographed activities of a small network of cell types (Figure 1). While the cellular diversity

- 41 -
and molecular mechanisms that serve the niche provides many opportunities for targeted
approaches to GBM therapy, targeting adhesion molecules may have the potential advantage of
blocking the ability of the component cell types to band together and perform their coordinated
functions. Over the past several years a number agents that target cadherins and integrins have
been evaluated in cancer clinical trials including for GBM (107,108). In general these have been
well tolerated. In fact, in several cases maximal tolerated doses were not defined. In addition
there are early indications of efficacy that have been attributed to anti-angiogenic effects as well
as to direct anti-tumor cell effects. Not fully evaluated is whether a component of the anti-tumor
effects are the result of reduced stem cell activity, and whether a more complete appreciation for
this potential target of adhesion molecule therapeutics might support refined efforts to abrogate
stem cell niche function. Particularly important might be the combination of adhesion molecule
directed therapies with cytotoxic agents and anti-angiogenics. The efficacy of these approaches
is currently being evaluated for GBM.
- 42 -
While Cilengitide, an integrin V antagonist has progressed furthest in clinical trial for GBM
(Table 1), the N cadherin targeting agent ADH-1 or drugs with the potential to target integrin 1
(PF-04605412, M200) may deserve special attention for their potential to disrupt the GBM stem
cell niche.
Conclusions
The complexity of the cancer stem cell niche creates many potential obstacles to the successful
inhibition of stem cell activity. Understanding the mechanisms that support niche formation and
function may expose the Achilles heel(s) of the PVN and the key to GBM cure. Particularly
important will be considerations of treatment regimens that can both target niche formation and
the mechanisms of stem cell induction and maintenance. In this regard, therapies that target
adhesion molecules may have the advantage of dual function, with the potential to block both
niche structure and function.
References
1. Folkman, J. (1971) Tumor angiogenesis: therapeutic implications. N Engl J Med, 285, 1182-1186. 2. Zhu, T.S., Costello, M.A., Talsma, C.E., Flack, C.G., Crowley, J.G., Hamm, L.L., He, X., Hervey-
Jumper, S.L., Heth, J.A., Muraszko, K.M. et al. (2011) Endothelial cells create a stem cell niche in glioblastoma by providing NOTCH ligands that nurture self-renewal of cancer stem-like cells. Cancer research, 71, 6061-6072.
3. Calabrese, C., Poppleton, H., Kocak, M., Hogg, T.L., Fuller, C., Hamner, B., Oh, E.Y., Gaber, M.W., Finklestein, D., Allen, M. et al. (2007) A perivascular niche for brain tumor stem cells. Cancer Cell, 11, 69-82.
4. Charles, N., Ozawa, T., Squatrito, M., Bleau, A.M., Brennan, C.W., Hambardzumyan, D. and Holland, E.C. (2010) Perivascular nitric oxide activates notch signaling and promotes stem-like character in PDGF-induced glioma cells. Cell Stem Cell, 6, 141-152.

- 43 -
5. Galan-Moya, E.M., Le Guelte, A., Lima Fernandes, E., Thirant, C., Dwyer, J., Bidere, N., Couraud, P.O., Scott, M.G., Junier, M.P., Chneiweiss, H. et al. (2011) Secreted factors from brain endothelial cells maintain glioblastoma stem-like cell expansion through the mTOR pathway. EMBO Rep, 12, 470-476.
6. Folkins, C., Man, S., Xu, P., Shaked, Y., Hicklin, D.J. and Kerbel, R.S. (2007) Anticancer therapies combining antiangiogenic and tumor cell cytotoxic effects reduce the tumor stem-like cell fraction in glioma xenograft tumors. Cancer Res, 67, 3560-3564.
7. Rao, S., Sengupta, R., Choe, E.J., Woerner, B.M., Jackson, E., Sun, T., Leonard, J., Piwnica-Worms, D. and Rubin, J.B. (2012) CXCL12 mediates trophic interactions between endothelial and tumor cells in glioblastoma. PloS one, 7, e33005.
8. Wu, Y., Peng, H., Cui, M., Whitney, N.P., Huang, Y. and Zheng, J.C. (2009) CXCL12 increases human neural progenitor cell proliferation through Akt-1/FOXO3a signaling pathway. J Neurochem, 109, 1157-1167.
9. Becher, O.J., Hambardzumyan, D., Fomchenko, E.I., Momota, H., Mainwaring, L., Bleau, A.M., Katz, A.M., Edgar, M., Kenney, A.M., Cordon-Cardo, C. et al. (2008) Gli activity correlates with tumor grade in platelet-derived growth factor-induced gliomas. Cancer Res, 68, 2241-2249.
10. Clement, V., Sanchez, P., de Tribolet, N., Radovanovic, I. and Ruiz i Altaba, A. (2007) HEDGEHOG-GLI1 signaling regulates human glioma growth, cancer stem cell self-renewal, and tumorigenicity. Current biology : CB, 17, 165-172.
11. Kusumbe, A.P. and Bapat, S.A. (2009) Cancer stem cells and aneuploid populations within developing tumors are the major determinants of tumor dormancy. Cancer Res, 69, 9245-9253.
12. Quesnel, B. (2008) Tumor dormancy and immunoescape. APMIS, 116, 685-694. 13. Hardee, M.E., Marciscano, A.E., Medina-Ramirez, C.M., Zagzag, D., Narayana, A., Lonning, S.M.
and Barcellos-Hoff, M.H. (2012) Resistance of glioblastoma-initiating cells to radiation mediated by the tumor microenvironment can be abolished by inhibiting transforming growth factor-beta. Cancer Res, 72, 4119-4129.
14. Liu, G., Yuan, X., Zeng, Z., Tunici, P., Ng, H., Abdulkadir, I.R., Lu, L., Irvin, D., Black, K.L. and Yu, J.S. (2006) Analysis of gene expression and chemoresistance of CD133+ cancer stem cells in glioblastoma. Mol Cancer, 5, 67.
15. Bao, S., Wu, Q., McLendon, R.E., Hao, Y., Shi, Q., Hjelmeland, A.B., Dewhirst, M.W., Bigner, D.D. and Rich, J.N. (2006) Glioma stem cells promote radioresistance by preferential activation of the DNA damage response. Nature, 444, 756-760.
16. Nakai, E., Park, K., Yawata, T., Chihara, T., Kumazawa, A., Nakabayashi, H. and Shimizu, K. (2009) Enhanced MDR1 expression and chemoresistance of cancer stem cells derived from glioblastoma. Cancer Invest, 27, 901-908.
17. Dean, M., Fojo, T. and Bates, S. (2005) Tumour stem cells and drug resistance. Nat Rev Cancer, 5, 275-284.
18. Bleau, A.M., Huse, J.T. and Holland, E.C. (2009) The ABCG2 resistance network of glioblastoma. Cell Cycle, 8, 2936-2944.
19. Wu, A., Wiesner, S., Xiao, J., Ericson, K., Chen, W., Hall, W.A., Low, W.C. and Ohlfest, J.R. (2007) Expression of MHC I and NK ligands on human CD133+ glioma cells: possible targets of immunotherapy. J Neurooncol, 83, 121-131.
20. Wei, J., Barr, J., Kong, L.Y., Wang, Y., Wu, A., Sharma, A.K., Gumin, J., Henry, V., Colman, H., Priebe, W. et al. (2010) Glioblastoma cancer-initiating cells inhibit T-cell proliferation and effector responses by the signal transducers and activators of transcription 3 pathway. Mol Cancer Ther, 9, 67-78.
21. Wei, J., Wu, A., Kong, L.Y., Wang, Y., Fuller, G., Fokt, I., Melillo, G., Priebe, W. and Heimberger, A.B. (2012) Hypoxia potentiates glioma-mediated immunosuppression. PLoS One, 6, e16195.

- 44 -
22. Scherer, H.J. (1938) Structural development in gliomas. American Journal of Cancer, 34, 333-351. 23. Zagzag, D., Esencay, M., Mendez, O., Yee, H., Smirnova, I., Huang, Y., Chiriboga, L., Lukyanov, E.,
Liu, M. and Newcomb, E.W. (2008) Hypoxia- and vascular endothelial growth factor-induced stromal cell-derived factor-1alpha/CXCR4 expression in glioblastomas: one plausible explanation of Scherer's structures. Am J Pathol, 173, 545-560.
24. Kenig, S., Alonso, M.B., Mueller, M.M. and Lah, T.T. (2010) Glioblastoma and endothelial cells cross-talk, mediated by SDF-1, enhances tumour invasion and endothelial proliferation by increasing expression of cathepsins B, S, and MMP-9. Cancer Lett, 289, 53-61.
25. Wang, R., Chadalavada, K., Wilshire, J., Kowalik, U., Hovinga, K.E., Geber, A., Fligelman, B., Leversha, M., Brennan, C. and Tabar, V. (2010) Glioblastoma stem-like cells give rise to tumour endothelium. Nature, 468, 829-833.
26. Ricci-Vitiani, L., Pallini, R., Biffoni, M., Todaro, M., Invernici, G., Cenci, T., Maira, G., Parati, E.A., Stassi, G., Larocca, L.M. et al. (2010) Tumour vascularization via endothelial differentiation of glioblastoma stem-like cells. Nature, 468, 824-828.
27. Soda, Y., Marumoto, T., Friedmann-Morvinski, D., Soda, M., Liu, F., Michiue, H., Pastorino, S., Yang, M., Hoffman, R.M., Kesari, S. et al. (2011) Transdifferentiation of glioblastoma cells into vascular endothelial cells. Proceedings of the National Academy of Sciences of the United States of America, 108, 4274-4280.
28. Wurmser, A.E., Nakashima, K., Summers, R.G., Toni, N., D'Amour, K.A., Lie, D.C. and Gage, F.H. (2004) Cell fusion-independent differentiation of neural stem cells to the endothelial lineage. Nature, 430, 350-356.
29. Goldman, S.A. and Chen, Z. (2011) Perivascular instruction of cell genesis and fate in the adult brain. Nat Neurosci, 14, 1382-1389.
30. Singh, S. and Dirks, P.B. (2007) Brain tumor stem cells: identification and concepts. Neurosurg Clin N Am, 18, 31-38, viii.
31. Kappadakunnel, M., Eskin, A., Dong, J., Nelson, S.F., Mischel, P.S., Liau, L.M., Ngheimphu, P., Lai, A., Cloughesy, T.F., Goldin, J. et al. (2010) Stem cell associated gene expression in glioblastoma multiforme: relationship to survival and the subventricular zone. J Neurooncol, 96, 359-367.
32. Yan, X., Ma, L., Yi, D., Yoon, J.G., Diercks, A., Foltz, G., Price, N.D., Hood, L.E. and Tian, Q. (2011) A CD133-related gene expression signature identifies an aggressive glioblastoma subtype with excessive mutations. Proc Natl Acad Sci U S A, 108, 1591-1596.
33. Bao, S., Wu, Q., Sathornsumetee, S., Hao, Y., Li, Z., Hjelmeland, A.B., Shi, Q., McLendon, R.E., Bigner, D.D. and Rich, J.N. (2006) Stem cell-like glioma cells promote tumor angiogenesis through vascular endothelial growth factor. Cancer Res, 66, 7843-7848.
34. Ikushima, H. and Miyazono, K. (2010) TGFbeta signalling: a complex web in cancer progression. Nature reviews. Cancer, 10, 415-424.
35. Li, Q., Ford, M.C., Lavik, E.B. and Madri, J.A. (2006) Modeling the neurovascular niche: VEGF- and BDNF-mediated cross-talk between neural stem cells and endothelial cells: an in vitro study. J Neurosci Res, 84, 1656-1668.
36. Pumiglia, K. and Temple, S. (2006) PEDF: bridging neurovascular interactions in the stem cell niche. Nat Neurosci, 9, 299-300.
37. Straussman, R., Morikawa, T., Shee, K., Barzily-Rokni, M., Qian, Z.R., Du, J., Davis, A., Mongare, M.M., Gould, J., Frederick, D.T. et al. (2012) Tumour micro-environment elicits innate resistance to RAF inhibitors through HGF secretion. Nature, 487, 500-504.
38. Gupta, P.B., Fillmore, C.M., Jiang, G., Shapira, S.D., Tao, K., Kuperwasser, C. and Lander, E.S. (2011) Stochastic state transitions give rise to phenotypic equilibrium in populations of cancer cells. Cell, 146, 633-644.
- 45 -
39. Armulik, A., Genove, G. and Betsholtz, C. (2011) Pericytes: developmental, physiological, and pathological perspectives, problems, and promises. Dev Cell, 21, 193-215.
40. Charles, N.A., Holland, E.C., Gilbertson, R., Glass, R. and Kettenmann, H. (2011) The brain tumor microenvironment. Glia, 59, 1169-1180.
41. Raza, A., Franklin, M.J. and Dudek, A.Z. (2010) Pericytes and vessel maturation during tumor angiogenesis and metastasis. Am J Hematol, 85, 593-598.
42. Nisancioglu, M.H., Betsholtz, C. and Genove, G. (2010) The absence of pericytes does not increase the sensitivity of tumor vasculature to vascular endothelial growth factor-A blockade. Cancer Res, 70, 5109-5115.
43. Campbell, R.A., Overmyer, K.A., Selzman, C.H., Sheridan, B.C. and Wolberg, A.S. (2009) Contributions of extravascular and intravascular cells to fibrin network formation, structure, and stability. Blood, 114, 4886-4896.
44. Wilhelmsson, U., Faiz, M., de Pablo, Y., Sjoqvist, M., Andersson, D., Widestrand, A., Potokar, M., Stenovec, M., Smith, P.L., Shinjyo, N. et al. (2012) Astrocytes negatively regulate neurogenesis through the Jagged1-mediated notch pathway. Stem Cells, 30, 2320-2329.
45. Lee, J., Borboa, A.K., Chun, H.B., Baird, A. and Eliceiri, B.P. (2010) Conditional deletion of the focal adhesion kinase FAK alters remodeling of the blood-brain barrier in glioma. Cancer Res, 70, 10131-10140.
46. Yi, L., Xiao, H., Xu, M., Ye, X., Hu, J., Li, F., Li, M., Luo, C., Yu, S., Bian, X. et al. (2011) Glioma-initiating cells: a predominant role in microglia/macrophages tropism to glioma. J Neuroimmunol, 232, 75-82.
47. Wu, A., Wei, J., Kong, L.Y., Wang, Y., Priebe, W., Qiao, W., Sawaya, R. and Heimberger, A.B. (2010) Glioma cancer stem cells induce immunosuppressive macrophages/microglia. Neuro Oncol, 12, 1113-1125.
48. Ye, X.Z., Xu, S.L., Xin, Y.H., Yu, S.C., Ping, Y.F., Chen, L., Xiao, H.L., Wang, B., Yi, L., Wang, Q.L. et al. (2012) Tumor-associated microglia/macrophages enhance the invasion of glioma stem-like cells via TGF-beta1 signaling pathway. J Immunol, 189, 444-453.
49. Watters, J.J., Schartner, J.M. and Badie, B. (2005) Microglia function in brain tumors. J Neurosci Res, 81, 447-455.
50. Lathia, J.D., Patton, B., Eckley, D.M., Magnus, T., Mughal, M.R., Sasaki, T., Caldwell, M.A., Rao, M.S., Mattson, M.P. and ffrench-Constant, C. (2007) Patterns of laminins and integrins in the embryonic ventricular zone of the CNS. J Comp Neurol, 505, 630-643.
51. Kawataki, T., Yamane, T., Naganuma, H., Rousselle, P., Anduren, I., Tryggvason, K. and Patarroyo, M. (2007) Laminin isoforms and their integrin receptors in glioma cell migration and invasiveness: Evidence for a role of alpha5-laminin(s) and alpha3beta1 integrin. Exp Cell Res, 313, 3819-3831.
52. Ljubimova, J.Y., Fugita, M., Khazenzon, N.M., Das, A., Pikul, B.B., Newman, D., Sekiguchi, K., Sorokin, L.M., Sasaki, T. and Black, K.L. (2004) Association between laminin-8 and glial tumor grade, recurrence, and patient survival. Cancer, 101, 604-612.
53. Huang, P., Rani, M.R., Ahluwalia, M.S., Bae, E., Prayson, R.A., Weil, R.J., Nowacki, A.S., Hedayat, H., Sloan, A.E., Lathia, J.D. et al. (2012) Endothelial expression of TNF receptor-1 generates a proapoptotic signal inhibited by integrin alpha6beta1 in glioblastoma. Cancer Res, 72, 1428-1437.
54. Kazanis, I. and Ffrench-Constant, C. (2012) The number of stem cells in the subependymal zone of the adult rodent brain is correlated with the number of ependymal cells and not with the volume of the niche. Stem cells and development, 21, 1090-1096.

- 46 -
55. Gajera, C.R., Emich, H., Lioubinski, O., Christ, A., Beckervordersandforth-Bonk, R., Yoshikawa, K., Bachmann, S., Christensen, E.I., Gotz, M., Kempermann, G. et al. (2010) LRP2 in ependymal cells regulates BMP signaling in the adult neurogenic niche. Journal of cell science, 123, 1922-1930.
56. Lee, C., Hu, J., Ralls, S., Kitamura, T., Loh, Y.P., Yang, Y., Mukouyama, Y.S. and Ahn, S. (2012) The molecular profiles of neural stem cell niche in the adult subventricular zone. PloS one, 7, e50501.
57. Gilmore, A.P. and Romer, L.H. (1996) Inhibition of Focal Adhesion Kinase (FAK) Signaling in Focal Adhesions Decreases Cell Motility and Proliferation. Molecular Biology of the Cell, 7, 1209-1224.
58. Cary, L.A., Han, D.C., Polte, T.R., Hanks, S.K. and Guan, J.-L. (1998) Identification of p130CAS as a Mediator of Focal Adhesion Kinase-promoted Cell Migration. The Journal of Cell Biology, 140, 211-221.
59. Stupack, D.G., Puente, X.S., Boutsaboualoy, S., Storgard, C.M. and Cheresh, D.A. (2001) Apoptosis of adherent cells by recruitment of caspase-8 to unligated integrins. J Cell Biol, 155, 459-470.
60. Hu, P. and Luo, B.H. (2013) Integrin bi-directional signaling across the plasma membrane. J Cell Physiol, 228, 306-312.
61. Fortunel, N.O., Otu, H.H., Ng, H.H., Chen, J., Mu, X., Chevassut, T., Li, X., Joseph, M., Bailey, C., Hatzfeld, J.A. et al. (2003) Comment on " 'Stemness': transcriptional profiling of embryonic and adult stem cells" and "a stem cell molecular signature". Science, 302, 393; author reply 393.
62. Ivanova, N.B., Dimos, J.T., Schaniel, C., Hackney, J.A., Moore, K.A. and Lemischka, I.R. (2002) A stem cell molecular signature. Science, 298, 601-604.
63. Ramalho-Santos, M., Yoon, S., Matsuzaki, Y., Mulligan, R.C. and Melton, D.A. (2002) "Stemness": transcriptional profiling of embryonic and adult stem cells. Science, 298, 597-600.
64. Lathia, J.D., Gallagher, J., Heddleston, J.M., Wang, J., Eyler, C.E., Macswords, J., Wu, Q., Vasanji, A., McLendon, R.E., Hjelmeland, A.B. et al. (2010) Integrin alpha 6 regulates glioblastoma stem cells. Cell Stem Cell, 6, 421-432.
65. Kazanis, I., Lathia, J.D., Vadakkan, T.J., Raborn, E., Wan, R., Mughal, M.R., Eckley, D.M., Sasaki, T., Patton, B., Mattson, M.P. et al. (2010) Quiescence and activation of stem and precursor cell populations in the subependymal zone of the mammalian brain are associated with distinct cellular and extracellular matrix signals. J Neurosci, 30, 9771-9781.
66. Fortin, S., Le Mercier, M., Camby, I., Spiegl-Kreinecker, S., Berger, W., Lefranc, F. and Kiss, R. (2010) Galectin-1 is implicated in the protein kinase C epsilon/vimentin-controlled trafficking of integrin-beta1 in glioblastoma cells. Brain pathology, 20, 39-49.
67. Sakaguchi, M., Shingo, T., Shimazaki, T., Okano, H.J., Shiwa, M., Ishibashi, S., Oguro, H., Ninomiya, M., Kadoya, T., Horie, H. et al. (2006) A carbohydrate-binding protein, Galectin-1, promotes proliferation of adult neural stem cells. Proceedings of the National Academy of Sciences of the United States of America, 103, 7112-7117.
68. Imaizumi, Y., Sakaguchi, M., Morishita, T., Ito, M., Poirier, F., Sawamoto, K. and Okano, H. (2011) Galectin-1 is expressed in early-type neural progenitor cells and down-regulates neurogenesis in the adult hippocampus. Molecular brain, 4, 7.
69. Toussaint, L.G., 3rd, Nilson, A.E., Goble, J.M., Ballman, K.V., James, C.D., Lefranc, F., Kiss, R. and Uhm, J.H. (2012) Galectin-1, a gene preferentially expressed at the tumor margin, promotes glioblastoma cell invasion. Molecular cancer, 11, 32.
70. Miura, K., Uniyal, S., Leabu, M., Oravecz, T., Chakrabarti, S., Morris, V.L. and Chan, B.M. (2005) Chemokine receptor CXCR4-beta1 integrin axis mediates tumorigenesis of osteosarcoma HOS cells. Biochem Cell Biol, 83, 36-48.
71. Fodde, R. and Brabletz, T. (2007) Wnt/beta-catenin signaling in cancer stemness and malignant behavior. Current opinion in cell biology, 19, 150-158.

- 47 -
72. Bolós, V., Blanco, M., Medina, V., Aparicio, G., Díaz-Prado, S. and Grande, E. (2009) Notch signalling in cancer stem cells. Clinical and Translational Oncology, 11, 11-19.
73. Bello, L., Francolini, M., Marthyn, P., Zhang, J., Carroll, R.S., Nikas, D.C., Strasser, J.F., Villani, R., Cheresh, D.A. and Black, P.M. (2001) Alpha(v)beta3 and alpha(v)beta5 integrin expression in glioma periphery. Neurosurgery, 49, 380-389; discussion 390.
74. Tchaicha, J.H., Reyes, S.B., Shin, J., Hossain, M.G., Lang, F.F. and McCarty, J.H. (2011) Glioblastoma angiogenesis and tumor cell invasiveness are differentially regulated by beta8 integrin. Cancer Res, 71, 6371-6381.
75. de Groot, J.F., Fuller, G., Kumar, A.J., Piao, Y., Eterovic, K., Ji, Y. and Conrad, C.A. (2010) Tumor invasion after treatment of glioblastoma with bevacizumab: radiographic and pathologic correlation in humans and mice. Neuro Oncol, 12, 233-242.
76. Keunen, O., Johansson, M., Oudin, A., Sanzey, M., Rahim, S.A., Fack, F., Thorsen, F., Taxt, T., Bartos, M., Jirik, R. et al. (2011) Anti-VEGF treatment reduces blood supply and increases tumor cell invasion in glioblastoma. Proc Natl Acad Sci U S A, 108, 3749-3754.
77. Paez-Ribes, M., Allen, E., Hudock, J., Takeda, T., Okuyama, H., Vinals, F., Inoue, M., Bergers, G., Hanahan, D. and Casanovas, O. (2009) Antiangiogenic therapy elicits malignant progression of tumors to increased local invasion and distant metastasis. Cancer Cell, 15, 220-231.
78. Wick, W., Platten, M. and Weller, M. (2001) Glioma Cell Invasion: Regulation of Metalloproteinase Activity by TGF-β Journal of neuro-oncology, 53, 177-185.
79. Sun, Y.X., Fang, M., Wang, J., Cooper, C.R., Pienta, K.J. and Taichman, R.S. (2007) Expression and activation of alpha v beta 3 integrins by SDF-1/CXC12 increases the aggressiveness of prostate cancer cells. The Prostate, 67, 61-73.
80. Engl, T., Relja, B., Marian, D., Blumenberg, C., Muller, I., Beecken, W.D., Jones, J., Ringel, E.M., Bereiter-Hahn, J., Jonas, D. et al. (2006) CXCR4 chemokine receptor mediates prostate tumor cell adhesion through alpha5 and beta3 integrins. Neoplasia, 8, 290-301.
81. Karpowicz, P., Willaime-Morawek, S., Balenci, L., DeVeale, B., Inoue, T. and van der Kooy, D. (2009) E-Cadherin regulates neural stem cell self-renewal. The Journal of neuroscience : the official journal of the Society for Neuroscience, 29, 3885-3896.
82. Hulsken, J., Birchmeier, W. and Behrens, J. (1994) E-cadherin and APC compete for the interaction with beta-catenin and the cytoskeleton. J Cell Biol, 127, 2061-2069.
83. Lewis, J.E., Jensen, P.J., Johnson, K.R. and Wheelock, M.J. (1994) E-cadherin mediates adherens junction organization through protein kinase C. Journal of cell science, 107 ( Pt 12), 3615-3621.
84. Broman, M.T., Kouklis, P., Gao, X., Ramchandran, R., Neamu, R.F., Minshall, R.D. and Malik, A.B. (2006) Cdc42 regulates adherens junction stability and endothelial permeability by inducing alpha-catenin interaction with the vascular endothelial cadherin complex. Circulation research, 98, 73-80.
85. Rasin, M.R., Gazula, V.R., Breunig, J.J., Kwan, K.Y., Johnson, M.B., Liu-Chen, S., Li, H.S., Jan, L.Y., Jan, Y.N., Rakic, P. et al. (2007) Numb and Numbl are required for maintenance of cadherin-based adhesion and polarity of neural progenitors. Nature neuroscience, 10, 819-827.
86. Rousso, D.L., Pearson, C.A., Gaber, Z.B., Miquelajauregui, A., Li, S., Portera-Cailliau, C., Morrisey, E.E. and Novitch, B.G. (2012) Foxp-mediated suppression of N-cadherin regulates neuroepithelial character and progenitor maintenance in the CNS. Neuron, 74, 314-330.
87. Lu, K.V., Chang, J.P., Parachoniak, C.A., Pandika, M.M., Aghi, M.K., Meyronet, D., Isachenko, N., Fouse, S.D., Phillips, J.J., Cheresh, D.A. et al. (2012) VEGF inhibits tumor cell invasion and mesenchymal transition through a MET/VEGFR2 complex. Cancer Cell, 22, 21-35.
88. Kaur, H., Phillips-Mason, P.J., Burden-Gulley, S.M., Kerstetter-Fogle, A.E., Basilion, J.P., Sloan, A.E. and Brady-Kalnay, S.M. (2012) Cadherin-11, a marker of the mesenchymal phenotype, regulates glioblastoma cell migration and survival in vivo. Mol Cancer Res, 10, 293-304.

- 48 -
89. Lewis-Tuffin, L.J., Rodriguez, F., Giannini, C., Scheithauer, B., Necela, B.M., Sarkaria, J.N. and Anastasiadis, P.Z. (2010) Misregulated E-cadherin expression associated with an aggressive brain tumor phenotype. PLoS One, 5, e13665.
90. Vesuna, F., van Diest, P., Chen, J.H. and Raman, V. (2008) Twist is a transcriptional repressor of E-cadherin gene expression in breast cancer. Biochemical and biophysical research communications, 367, 235-241.
91. Batlle, E., Sancho, E., Franci, C., Dominguez, D., Monfar, M., Baulida, J. and Garcia De Herreros, A. (2000) The transcription factor snail is a repressor of E-cadherin gene expression in epithelial tumour cells. Nature cell biology, 2, 84-89.
92. Ju, D., Sun, D., Xiu, L., Meng, X., Zhang, C. and Wei, P. (2011) Interleukin-8 is associated with adhesion, migration and invasion in human gastric cancer SCG-7901 cells. Med Oncol, 29, 91-99.
93. Fernando, R.I., Castillo, M.D., Litzinger, M., Hamilton, D.H. and Palena, C. (2011) IL-8 signaling plays a critical role in the epithelial-mesenchymal transition of human carcinoma cells. Cancer research, 71, 5296-5306.
94. Samaras, V., Piperi, C., Levidou, G., Zisakis, A., Kavantzas, N., Themistocleous, M.S., Boviatsis, E.I., Barbatis, C., Lea, R.W., Kalofoutis, A. et al. (2009) Analysis of interleukin (IL)-8 expression in human astrocytomas: associations with IL-6, cyclooxygenase-2, vascular endothelial growth factor, and microvessel morphometry. Human immunology, 70, 391-397.
95. Charalambous, C., Pen, L.B., Su, Y.S., Milan, J., Chen, T.C. and Hofman, F.M. (2005) Interleukin-8 differentially regulates migration of tumor-associated and normal human brain endothelial cells. Cancer research, 65, 10347-10354.
96. Velpula, K.K., Rehman, A.A., Chelluboina, B., Dasari, V.R., Gondi, C.S., Rao, J.S. and Veeravalli, K.K. (2012) Glioma stem cell invasion through regulation of the interconnected ERK, integrin alpha6 and N-cadherin signaling pathway. Cell Signal, 24, 2076-2084.
97. Liu, D., Martin, V., Fueyo, J., Lee, O.H., Xu, J., Cortes-Santiago, N., Alonso, M.M., Aldape, K., Colman, H. and Gomez-Manzano, C. (2010) Tie2/TEK modulates the interaction of glioma and brain tumor stem cells with endothelial cells and promotes an invasive phenotype. Oncotarget, 1, 700-709.
98. Bergers, G. and Hanahan, D. (2008) Modes of resistance to anti-angiogenic therapy. Nat Rev Cancer, 8, 592-603.
99. Casanovas, O., Hicklin, D.J., Bergers, G. and Hanahan, D. (2005) Drug resistance by evasion of antiangiogenic targeting of VEGF signaling in late-stage pancreatic islet tumors. Cancer Cell, 8, 299-309.
100. Batchelor, T.T., Sorensen, A.G., di Tomaso, E., Zhang, W.T., Duda, D.G., Cohen, K.S., Kozak, K.R., Cahill, D.P., Chen, P.J., Zhu, M. et al. (2007) AZD2171, a pan-VEGF receptor tyrosine kinase inhibitor, normalizes tumor vasculature and alleviates edema in glioblastoma patients. Cancer Cell, 11, 83-95.
101. Du, R., Lu, K.V., Petritsch, C., Liu, P., Ganss, R., Passegue, E., Song, H., Vandenberg, S., Johnson, R.S., Werb, Z. et al. (2008) HIF1alpha induces the recruitment of bone marrow-derived vascular modulatory cells to regulate tumor angiogenesis and invasion. Cancer Cell, 13, 206-220.
102. Jin, D.K., Shido, K., Kopp, H.G., Petit, I., Shmelkov, S.V., Young, L.M., Hooper, A.T., Amano, H., Avecilla, S.T., Heissig, B. et al. (2006) Cytokine-mediated deployment of SDF-1 induces revascularization through recruitment of CXCR4+ hemangiocytes. Nat Med, 12, 557-567.
103. Shaked, Y., Tang, T., Woloszynek, J., Daenen, L.G., Man, S., Xu, P., Cai, S.R., Arbeit, J.M., Voest, E.E., Chaplin, D.J. et al. (2009) Contribution of granulocyte colony-stimulating factor to the acute mobilization of endothelial precursor cells by vascular disrupting agents. Cancer Res, 69, 7524-7528.

- 49 -
104. Dong, J., Zhao, Y., Huang, Q., Fei, X., Diao, Y., Shen, Y., Xiao, H., Zhang, T., Lan, Q. and Gu, X. (2011) Glioma stem/progenitor cells contribute to neovascularization via transdifferentiation. Stem Cell Rev, 7, 141-152.
105. Scully, S., Francescone, R., Faibish, M., Bentley, B., Taylor, S.L., Oh, D., Schapiro, R., Moral, L., Yan, W. and Shao, R. (2012) Transdifferentiation of glioblastoma stem-like cells into mural cells drives vasculogenic mimicry in glioblastomas. J Neurosci, 32, 12950-12960.
106. Chen, R., Nishimura, M.C., Bumbaca, S.M., Kharbanda, S., Forrest, W.F., Kasman, I.M., Greve, J.M., Soriano, R.H., Gilmour, L.L., Rivers, C.S. et al. (2010) A hierarchy of self-renewing tumor-initiating cell types in glioblastoma. Cancer Cell, 17, 362-375.
107. Goodman, S.L. and Picard, M. (2012) Integrins as therapeutic targets. Trends Pharmacol Sci, 33, 405-412.
108. Blaschuk, O.W. and Devemy, E. (2009) Cadherins as novel targets for anti-cancer therapy. Eur J Pharmacol, 625, 195-198.

- 50 -
Chapter 3 – Methods of Transcriptional Analysis
Portions of this chapter were previously published or will be published shortly. The sections containing
this data are noted in the text.

- 51 -
The Importance of Studying Transcription
The central dogma of biology is that DNA is transcribed into RNA which is turned into proteins
(1,2). The ultimate goal of a cell wanting to change one of its properties is a change in protein
level, but monitoring protein level changes is sometimes difficult, especially when looking at
global changes across all proteins. Changes in RNA levels can also occur on a much shorter
timescale than changes in protein levels. Therefore, looking at transcription levels is a popular
option for determining which pathways are being altered in a cell upon some sort of stimulus or
perturbation.
Tools for Studying Transcription
The Northern blot was one of the earliest forms of transcriptional analysis. It was described in
1977 (3), a few years after the Southern blot for analyzing DNA was pioneered (4). A Northern
blot is a low-throughput technique where RNA from a sample is traditionally ran on an agarose
gel with formaldehyde to denature secondary structure. Once the RNA has been completely run
out on the gel, it is transferred to a nitrocellulose membrane where any particular gene of interest
can be detected and quantified by using either a radioactively or fluorescently labeled anti-sense
probe. While Northern blots are not used a great deal anymore, they do have the advantage of
being able to detect relatively small changes because the large number of cell’s worth of RNA
which is loaded onto a single blot. One of the major disadvantages is that there are a lot of
processing steps that go into setting up a Northern blot, and that provides numerous opportunities
to introduce contaminating RNases which can degrade RNA (5).
- 52 -
Another technique for transcriptional analysis is quantitative reverse transcription PCR (qRT-
PCR). In this technique, a PCR reaction is set up with primers designed to amplify a small
region of a gene of interest. During the PCR step, amount of the PCR product is detected by a
number of different techniques including intercalating dyes, TaqMan probes (6), Scorpion probes
(7), molecular beacons (8), and others, but intercalating dyes and TaqMan probes remain the
most commonly used.
For all of these methods, the first step is to reverse transcribe the RNA into cDNA. This
stabilizes the signal by turning it into the more stable cDNA and makes it easier to perform PCR.
The specific details of how this cDNA is quantified in the PCR reaction are where the various
methods start to differ. One of the most common methods involves addition of a general
intercalating dye that will increase in fluorescence as the amount of double stranded DNA
increases. Ethidium bromide was originally used (9) but today Sybr Green I (10) has become the
standard, though there are a number of other different dyes, with different properties, available
(11). This method requires a simple reaction mix, requiring just the intercalating dye, primers
for the gene of interest, and PCR reaction mix. Each cycle creates more PCR products and at the
end of each of these cycles the detector on the specialized thermocycler detects and records the
amount of fluorescence from the intercalating dye. Intercalating dyes also allow for a final step
called a melt curve. One downside of a general intercalating dye is that there is little specificity,
so primer dimers and non-specific mispriming products will produce just as much signal as true
products, and melt curves are a good way to distinguish true signal from false signal. At the end
of the PCR reaction, a starting temperature is picked which is lower than any of the likely
products formed, approximately 50 degrees C. This temperature is slowly increased, usually in
- 53 -
0.1 degree increments, and after each increase, the fluorescence is recorded. Each product in the
reaction, primer dimer, real product, etc, will have a specific melting temperature based on their
length and base composition. When the temperature is increased to that point, the product will
melt and the fluorescence will rapidly decrease as the amount of double stranded DNA to
intercalate into melts. Therefore if time/temperature is plotted against change in fluorescence,
each product will produce a specific peak in the melt curve that can reliably be seen from
reaction to reaction. Therefore ideally at the end of a run, a melt curve will have only one peak
that corresponds to the desired PCR product, and if other peaks are present, it can indicate
contamination or high levels of primer dimer.
Another very common method called Taqman (6) provides a higher degree of specificity but is
more complicated and expensive. This method involves two normal PCR primers, similar to the
previous method, but incorporates a third primer, which binds internally to the forward and
reverse primers. This method has no intercalating dye but this internal primer is labeled with one
of any number of fluorophores. To prevent constant fluorescence it is also labeled with one or
more quencher molecules which prevent the fluorophore from actively producing light.
However, during the PCR cycles, this internal primer will anneal to its complementary region in
the middle of the PCR product and as the polymerase comes along, it degrades this internal
primer, releasing the nucleotide with the fluorophore into solution, preventing it from being
quenched, and thereby producing more and more fluorescence each round, which is again
detected and recorded at the end of every PCR cycle. While there is no corresponding melt
curve to determine the sensitivity of the reaction, the internal primer provides an extra level of

- 54 -
specificity since neither primer dimers nor mispriming products will contain the sequence
complementary to the internal primer.
Overall, qRT-PCR has a number of advantages over Northern blots. It contains a high dynamic
range, has high sensitivity, can be easily multiplexed, and requires less manipulation of the RNA
and therefore provides less opportunity for RNA degradation (12).
With the advent of next-generation sequencing, another option for transcriptional analysis has
been developed called RNA-sequencing (RNA-Seq). In this method, RNA is once again turned
into cDNA, but instead of assessing gene expression with PCR for a specific gene, this cDNA is
turned into a next-gen library and the number of reads that map back to a particular gene are used
as a proxy for expression from that gene. This allows for detection of gene expression globally
and without any a priori knowledge of gene sequence or expression. The first publication
utilizing this approach was from Barbara Wold’s group (13) in 2008. RNA-Seq provides a large
number of advantages over other techniques. Foremost, not only does it provide quantification
of gene expression, but it can also provide quantification and analysis of many other forms of
transcription such as alternative splice forms, allelic expression, RNA editing, and SNPs present
in coding sequences. It also has, in theory at least, infinite dynamic range. For example,
microarrays, which have a large but not infinite dynamic range, will be unable to detect genes
with very low levels of transcription without having high transcription genes saturated. RNA-
Seq has the ability to detect genes with a single copy per cell up to genes with hundreds of
thousands of copies per cell. Though this requires sequencing to a very high depth to detect the
very, very lowly expressed genes, but most of the time the reads will be from those very highly
- 55 -
expressed genes, therefore wasting computational time and money. One of the disadvantages of
the original RNA-Seq was the requirement of starting with a large amount (25ug) or RNA. The
main reason for this high starting amount was that the protocol required polyA selection of
mRNA to avoid sequencing of ribosomal RNA that makes up a very large percentage of total
RNA but would be relatively uninformative. This did have the side effect of making detection
of non-polyadenylated RNA species difficult. Through continued technology development these
disadvantages have been overcome for the most part. Currently there are commercial kits and
special library preparation methods which allow RNA-Seq all the way down to single cells (14)
(15) (16) and there are library preparation and analysis methods to detect many of the various
kinds of RNA present in a variety of organisms (17) (18).
Methods of Microarray Analysis
Another major category of transcriptional analysis tool is a microarray. While the term
microarray refers to any array of probes put down onto a solid surface where each probe
represents a different gene or protein which can then all be assayed all at the same time, the
pertinent to this discussion is the expression microarray, designed to assess the levels of mRNA
genome-wide. One of the first expression arrays was a set of 4,096 randomly cloned human
colon cancer cDNAs cloned into E. coli, spotted onto nitrocellulose and probed with radiolabeled
RNA from other colon cancer related samples (19). Since then there has been a great deal of
technology development, and two main commercial products have come to dominate the field,
Affymetrix Genechips and Illumina BeadArrays. While being based on different technologies,
both provide the same function, providing quantification of almost all the genes currently known
for a variety of model organisms including human, mouse and rat.

- 56 -
Once the microarray has been performed and the data generated, the first step of microarray
analysis is to take the raw data output and background subtract and normalize it. In the early
days of cDNA microarrays this would quantifying negative control background spots and
subtracting that from all of the other spots. These days each commercial product has separate
procedures for performing the background subtraction. For example, Illumina uses a set of
around 1,000 beads which contain randomized sequences which should have no targets in their
designed transcriptome to serve as background beads. They also have a local background
subtraction step (20). Conveniently these steps are able to be performed automatically by the
Illumina software upon initial data generation, though commonly available plug ins are also
available for R to reanalyze the data completely from raw data (21) (22).
The next step in microarray analysis is normalization. The goal of normalizing microarray data
is to remove as much of the systematic variation as possible while leaving biologic variation.
This is critical when trying to analyze data that was generated on different chips, at different
times, or by different research groups. Normalization makes 3 main assumptions; 1) the majority
of genes are not differentially expressed, 2) any systematic bias that is present is evenly
distributed across the chip or beads, and 3) the normalization will only remove the systematic
bias without affecting biological variance (23). There are many different algorithms to
normalize data and, while each has their own slight advantages and disadvantages, there are a
few main ones used more often (24).

- 57 -
Another step in microarray data analysis is transformation. The most common form of data
transformation is a log2 transformation. This has two main benefits. First, it reduces the
variance of large values. This is important because microarray data can sometimes have a large
difference between the highest and lowest expressed genes on the array, and these highly
expressed genes will just naturally have a much larger variance than the smaller ones. By taking
the log2 of all of the data, it helps to make comparisons between high and low expressed genes
easier. Secondly it helps to facilitate treating up and down regulated genes similarly. Meaning
that if you calculate a fold change for un-transformed data, by dividing condition #1 by condition
#2, the genes that were higher expressed in condition #1 will all now have a value above 1 for
their fold change, but genes with a higher value in condition #2 will have a value between 0 and
1, which would then further need to have the negative reciprocal taken to have comparable fold
changes. On the other hand, if the data is already log2 transformed, calculating the fold change
only requires subtracting condition #2 from condition #1, and the fold change is already correct
for both situations.
Once the data is background subtracted, normalized, and transformed, the question becomes how
to tell which genes are differentially expressed between the various samples or conditions. In the
early days of microarrays, analysis could consist of as little as determining the fold change for
each gene between samples or conditions, and considering anything over a two-fold change as
differentially expressed (19). Of course this sort of analysis had no real statistical basis and
created many false positives so researchers moved towards something with more statistical rigor.
These days there are two main statistical tests done for microarrays. The easiest is the Student’s

- 58 -
t-test. For each gene, an individual t-test is run for each comparison of interest. This creates an
independent p-value for each gene and each comparison.
If microarrays are done on multiple samples, and it is important to test whether there is a
difference between any of those samples without performing all possible pairwise comparisons
(and therefore having many more tests to correct against), then the second main statistical test is
performed instead; the analysis of variance, or ANOVA test. This will determine if the gene is
differentially expressed across any of the samples.
No matter the statistical test chosen, for an average microarray, the analysis would have
consisted of many thousands of statistical tests. A normal p-value cutoff would be 0.05, and that
would set the limit that 5% of the results are false positives. The problem then becomes that if
there were 40,000 genes, and therefore that many statistical tests, there will be 2,000 false
positives. This creates quite a problem, and therefore needs to be accounted for by what is called
multiple hypothesis (MH) correction. There are a number of different methods for this including
Bonferroni correction (25) or Benjamini-Hochberg (26). The Bonferroni correction is one of the
simplest but most stringent MH corrections. It aims to completely reduce type I errors (false
positives) but in doing so also has a high rate of type II errors (false negatives). It is
implemented by multiplying each p-value by the number of tests performed and then asking if
these new corrected p-values still fall below some cutoff, traditionally 0.05. One of the other
less stringent MH corrections is Benjamini-Hochberg. In this correction, type I errors are not
completely reduced, they are kept at some threshold level, for example 5%, but this also prevents
many of the type II errors that a more stringent correction would make (26). Benjamini-

- 59 -
Hochberg also has a more complicated implementation. The results are ranked by p-value from
lowest to highest (lowest being rank = 1), and each p-value is multiplied by the total number of
genes in the list divided by its rank in the list of p-values.
Once the statistical tests have been run, and multiple hypothesis correction applied, the end result
is a list of genes which are differentially expressed, but going through a list and just picking
random genes and testing them further is a long and expensive process. Therefore, researchers
have found ways to determine if there are patterns in these genes and make educated guesses
about which ones to test first. The technique is called pathway analysis and there are a number
of programs and algorithms designed for it including GO Onotology from the original
consortium (27), KEGG pathway analysis (28), and DAVID analysis tools (29). The overall idea
is that given a short list of differentially expressed genes, these programs take the background list
of all of the possible genes which could have been differentially expressed, and a list of
associations that each gene has to one or more biological processes, and performs a Fisher’s
exact test to determine if there is an enrichment of any of these biological processes in the short
differentially expressed gene list compared to the background gene list (30). This test will output
p-values and multiple hypothesis corrected p-values, for each association. These lists of
enriched biological processes can then be compared to the experimental design for validation of
the system, and prioritization of the genes found to be differentially expressed for further
experimentation.
- 60 -
Example Studies
Having developed an expertise in microarray analysis, I have used these skills to assist in a
number of other collaborations to analyze microarray data in a variety of systems. The following
is a description of those systems, and the analysis performed.
“Conditional Mutagenesis of Gata6 in SF1-Positive Cells Causes Gonadal-Like Differentiation in the Adrenal
Cortex of Mice” by Pihlajoki M, Gretzinger E, Cochran R, Kyronlahti A, Schrade A, Hiller T, Sullivan L, Shoykhet
M, Schoeller EL, Brooks MD, Heikinheimo M, Wilson DB.
Endocrinology. 2013 May;154(5):1754-67.
This study (31) focused on the effect of Gata6 in the adrenal cortex of mice. Gata6 is a known
transcription factor in adrenocortical development (32). Since complete knockout of Gata6 is
embryonic lethal (33), a conditional knockout (cKO) of Gata6 was created using Cre-LoxP
recombination being driven by SF1-cre. SF1 is another transcription factor important in adrenal
steroidogenesis and is highly expressed in fetal and adult adrenal cortex (34). Therefore Gata6 is
specifically knocked out in adrenocortical cells in the mouse brain.
Gata6 cKO mice, while viable and fertile, have a number of defects, all of which are thoroughly
described in the paper. Briefly though, these mice showed smaller adrenal cortex sizes compared
to wild type mice and an upregulation of gonadal-like markers. Also, the x-zone, a transient area
of cells which disappears in pubescent male mice and during pregnancy in female mice, was
shown to be significantly reduced in Gata6 cKO mice.
To determine which genes were dysregulated by the cKO of Gata6, a series of microarrays were
performed on RNA isolated from whole adrenal glands of 2 month old virgin females cKO mice
(n=3) and control (n=3) mice. Illumina Mouse6v2 were performed by the Washington

- 61 -
University in St. Louis’s Genome Technology Access Core (GTAC) according to standard
protocols. Background subtracted data was quantile normalized and imported into Excel for
further analysis. Once into Excel, the probes with no expression (as determined by the Illumina
generated Detection p-value > 0.05) in all 6 datasets were filtered out, taking the dataset from
45,282 down to 20,073. Next, genes with a fold change less than 2 fold between cKO and wild
type (in either direction) were filtered out, leaving only 1,985 probes. These remaining genes
then had multiple hypothesis correction applied using the Benjamini-Hochberg method. The top
twenty up and down regulated genes are shown in Table 3-1.
One of the genes found to be differentially expressed during the analysis was the downregulation
of Pik3c2g, a member of the Akt/PI3K signaling pathway, in the cKO mice. Further analysis
showed the Pik3c2g was a specific marker of the X-zone by showing that Pik3c2g was present in

- 62 -
virgin females and gonadectomized males and females, but not present in post-puberty males or
previously pregnant females. To further verify that Pik3c2g was specific to the X-zone, laser
capture microdissection was used to gather tissue from different areas of from virgin female and
control mice adrenal glands showing specific Pik3c2g expression in X-zone cells.
These microarrays helped to identify Pik3c2g as a novel marker of the X-zone in mouse adrenal
glands. While the exact function of Pik3c2g is yet unknown, it appears to specifically
phosphorylate phosphatidylinositol (PI) and PI4P, but does not phosphorylate PI(4,5)P2 (35).
The overall studies in the paper reveal Gata6 as an important mediator of the balance between
adrenal and gonadal pathways in stem/progenitor cells in the adrenal gland and that Pik3c2g is
an important downstream gene in the pathway and that further studies will shed additional
information about its functional role.
“Cell Intrinsic Sexual Dimorphism in Stem Cell Induction and Transformation Underlies Male Predominance in
Glioblastoma” by Sun T, Warrington NM, Luo J, Brooks MD, Dahiya S, Sengupta R, & Rubin J.
Currently under revision at the Journal of Clinical Investigation.
This study (currently in review at Journal of Clinical Investigation) aims to better characterize
the phenomenon of males being more susceptible to brain tumor formation than females. When
analyzed across a number of brain tumor types including glioblastoma (GBM), medulloblastoma,
oligodendroglioma, ependymoma, and pilocytic astrocytomas, males invariably showed higher
rates of tumor formation than females (36). Since glioblastoma is the most common adult
malignant primary brain tumor, and has one of the worst prognoses (37), a great deal of work has
gone in to understanding the basic tumor biology behind it. Further research on the
transcriptional signatures of GBM tumors showed four distinct molecular subtypes; classic,
proneural, neural, and mesenchymal (38). In this study, data from the TCGA database (38) and

- 63 -
additional data from recent studies containing a total of 426 GBM samples (GSE16011 (39) and
GSE13041 (40) ) were analyzed for tumor formation rate between males and females. When
broken down into these four molecular subtypes, the mesenchymal subtype had the greatest
sexual disparity (Table 3-2). It has also been shown that the mesenchymal subtype has
frequently been associated with loss of neurofibromin 1 (NF1), p53, and PTEN (38). In a mouse
model of glioblastoma, NF1+/-;p53+/- mice have an increased susceptibility of tumor formation
(41) and male mice show higher tumor formation than female mice (1.38:1) when the
chromosome containing the mutant NF1 and p53 is
maternal in origin (42) (43). Based on this data,
NF1 and p53 were prioritized for a stepwise
transformation model to determine if loss of these
two genes would reveal a cell intrinsic difference
between male and female astrocytes which could
account for difference in tumor formation rates.
For the first stage of the model, male and female
wild type astrocytes were isolated from p1/p2
mouse pups. While a number of different cells in
the brain, including astrocytes, have been shown to have the potential to be the initiating cell for
glioblastoma (44,45), astrocytes were chosen because of their abundance in the developing
mouse brain and ability to grow in vitro. For the next step of the step-wise transformation,
astrocytes were gathered from either male or female mouse pups where NF1 had been
homozygously deleted using a Cre-Lox system (46) (47). Comparisons between male and

- 64 -
female NF-/-
astrocytes from this step showed no difference in growth rates and no signs of
transformation. For the third step in transformation, the male and female NF1-/-
astrocytes were
infected with a dominant negative form of p53 (DNp53) (48). While the addition of DNp53 did
slightly increase the growth rate of the female astrocytes, it drastically increased the growth rate
of the male astrocytes allowing the male NF1-/-
;DNp53 cells to grow much faster than their
female counterparts. However, neither line had been transformed yet as they did not form
colonies in a soft agar assay. It wasn’t until a final EGF treatment, which has been shown to
inactivate the retinoblastoma (Rb) pathway, a key oncogenic event in most cancers (49) (50), that
male cells were transformed and formed colonies in soft agar yet female cells still showed no
signs of colony formation.
Further analysis of these lines showed some striking observations including male NF1-/-
;DNp53
cells having a greater in vivo tumorigenicity compared to female cells (independent of the sex of
the local microenvironment) and male cells showing higher levels of stemness in an extreme
limiting dilution assay (ELDA). However the mechanism for these changes was unknown, so
the question became; “What transcriptional changes were occurring during each of these
stepwise events?” To answer this, RNA was gathered from both male and female cells from
each of the four lines: wild type, NF1-/-
, NF1-/-
;DNp53, and NF1-/-
;DNp53+EGF. Samples were
generated in triplicate, and the RNA submitted for Illumina microarrays. The microarrays were
performed at Washington University in St. Louis’s GTAC core following standard protocols.
Quantile normalized, background subtracted data was imported into Excel and as previously
described, probes with no expression were filtered out, and only probes showing greater than two
fold up or down-regulation and a p-value less than 0.05 for any particular comparison were kept.

- 65 -
Male and female wild type astrocytes were very similar to each other, only having 13 genes with
expression differences and those included a reasonable number of genes specific to either the X
or Y chromosomes. When male NF1-/-
astrocytes were compared to female NF1-/-
astrocytes the
number of differentially expressed genes slightly increased to 18. The addition of DNp53 had
the greatest effect, increasing the number of differentially expressed genes between NF1-/-
;DNp53 males and NF1-/-
;DNp53 females to 606 while the further addition of EGF caused there
to be 527 gene changes. The top differentially expressed genes in each group were selected and
a heatmap was generated to show the stepwise progression of the transcriptional changes (Figure
3-1).

- 66 -
Further analysis and experiments on these changes detected during the stepwise transformation
of male and female astrocytes will hopefully provide valuable clues as to the molecular
mechanism behind males developing more brain tumors than females.
The Future of Transcriptional Analysis
One newly developed method for transcriptional analysis is called translating ribosome affinity
purification (TRAP) (51) (52) (53). It is designed to label a specific cell and then isolate RNA
from that cell out of a complex cell population to determine any gene expression changes. The
idea is to fuse a fluorescent protein, usually GFP, to a ribosomal translating protein and then
insert that into your cell of interest. This GFP-ribosomal protein will be incorporated into the
ribosomes of the cell, and begin translating other proteins. Then a complex mixture of cells
(including the cell with the TRAP protein) can be gathered and lysed where the polysomes
(complexes of ribosomes and mRNAs being translated) can be purified with magnetic beads
coated in antibodies against GFP. The magnetic beads are then separated and immediately put
into Trizol for RNA extraction (51). This is a great system for complex cellular systems,
assuming you can isolate and manipulate the cells and then recapitulate that system. This system
would be particularly helpful for other tumor-microenvironmental interaction studies.
While Illumina sequencing was once called next-generation sequencing because of how
advanced it was, it is now fully entrenched as a technology, and we are coming up on the next
generation of sequencing machines. While there are a number of technologies being developed,
one of the most promising is what is referred to as nanopore sequencing (54) (55) (56). Here
- 67 -
pores in a membrane have single molecules of DNA threaded through them, and electrical
conductivity is measured to determine what base is traveling through the pore at any given time.
How the DNA is threaded through, and how its speed is controlled all questions up in the air and
being worked on currently. One major advantage of this technology is that unamplified, native
molecules, including RNA and methylated DNA, will be able to be sequenced without complex
library preparation (57). Since RNA-Seq library preparation can introduce a number of biases,
being able to directly sequence RNA could be a significant improvement in transcriptional
quantification.
1. Crick, F.H. (1958) On protein synthesis. Symposia of the Society for Experimental Biology, 12, 138-163.
2. Crick, F. (1970) Central dogma of molecular biology. Nature, 227, 561-563. 3. Alwine, J.C., Kemp, D.J. and Stark, G.R. (1977) Method for detection of specific RNAs in agarose
gels by transfer to diazobenzyloxymethyl-paper and hybridization with DNA probes. Proceedings of the National Academy of Sciences of the United States of America, 74, 5350-5354.
4. Southern, E.M. (1975) Detection of specific sequences among DNA fragments separated by gel electrophoresis. Journal of molecular biology, 98, 503-517.
5. Trayhurn, P. (1996) Northern blotting. The Proceedings of the Nutrition Society, 55, 583-589. 6. Heid, C.A., Stevens, J., Livak, K.J. and Williams, P.M. (1996) Real time quantitative PCR. Genome
research, 6, 986-994. 7. Whitcombe, D., Theaker, J., Guy, S.P., Brown, T. and Little, S. (1999) Detection of PCR products
using self-probing amplicons and fluorescence. Nature biotechnology, 17, 804-807. 8. Kostrikis, L.G., Tyagi, S., Mhlanga, M.M., Ho, D.D. and Kramer, F.R. (1998) Spectral genotyping of
human alleles. Science, 279, 1228-1229. 9. Higuchi, R., Fockler, C., Dollinger, G. and Watson, R. (1993) Kinetic PCR analysis: real-time
monitoring of DNA amplification reactions. Bio/technology, 11, 1026-1030. 10. Wittwer, C.T., Herrmann, M.G., Moss, A.A. and Rasmussen, R.P. (1997) Continuous fluorescence
monitoring of rapid cycle DNA amplification. BioTechniques, 22, 130-131, 134-138. 11. Gudnason, H., Dufva, M., Bang, D.D. and Wolff, A. (2007) Comparison of multiple DNA dyes for
real-time PCR: effects of dye concentration and sequence composition on DNA amplification and melting temperature. Nucleic acids research, 35, e127.
12. Wong, M.L. and Medrano, J.F. (2005) Real-time PCR for mRNA quantitation. BioTechniques, 39, 75-85.
13. Mortazavi, A., Williams, B.A., McCue, K., Schaeffer, L. and Wold, B. (2008) Mapping and quantifying mammalian transcriptomes by RNA-Seq. Nature methods, 5, 621-628.

- 68 -
14. Islam, S., Kjallquist, U., Moliner, A., Zajac, P., Fan, J.B., Lonnerberg, P. and Linnarsson, S. (2011) Characterization of the single-cell transcriptional landscape by highly multiplex RNA-seq. Genome research, 21, 1160-1167.
15. Islam, S., Kjallquist, U., Moliner, A., Zajac, P., Fan, J.B., Lonnerberg, P. and Linnarsson, S. (2012) Highly multiplexed and strand-specific single-cell RNA 5' end sequencing. Nature protocols, 7, 813-828.
16. Tang, F., Barbacioru, C., Nordman, E., Li, B., Xu, N., Bashkirov, V.I., Lao, K. and Surani, M.A. (2010) RNA-Seq analysis to capture the transcriptome landscape of a single cell. Nature protocols, 5, 516-535.
17. Sun, K., Chen, X., Jiang, P., Song, X., Wang, H. and Sun, H. (2013) iSeeRNA: identification of long intergenic non-coding RNA transcripts from transcriptome sequencing data. BMC genomics, 14 Suppl 2, S7.
18. Eminaga, S., Christodoulou, D.C., Vigneault, F., Church, G.M. and Seidman, J.G. (2013) Quantification of microRNA expression with next-generation sequencing. Current protocols in molecular biology / edited by Frederick M. Ausubel ... [et al.], Chapter 4, Unit 4 17.
19. Augenlicht, L.H., Wahrman, M.Z., Halsey, H., Anderson, L., Taylor, J. and Lipkin, M. (1987) Expression of cloned sequences in biopsies of human colonic tissue and in colonic carcinoma cells induced to differentiate in vitro. Cancer research, 47, 6017-6021.
20. Xie, Y., Wang, X. and Story, M. (2009) Statistical methods of background correction for Illumina BeadArray data. Bioinformatics, 25, 751-757.
21. Du, P., Kibbe, W.A. and Lin, S.M. (2008) lumi: a pipeline for processing Illumina microarray. Bioinformatics, 24, 1547-1548.
22. Lin, S.M., Du, P., Huber, W. and Kibbe, W.A. (2008) Model-based variance-stabilizing transformation for Illumina microarray data. Nucleic acids research, 36.
23. Support", I.T. (2011). 24. Ding, Y. and Wilkins, D. (2004) The effect of normalization on microarray data analysis. DNA and
cell biology, 23, 635-642. 25. Dunn, O.J. (1961) Multiple Comparisons among Means. Journal of the American Statistical
Association, 56, 52-64. 26. Benjamini, Y. and Hochberg, Y. (1995) Controlling the False Discovery Rate - a Practical and
Powerful Approach to Multiple Testing. J Roy Stat Soc B Met, 57, 289-300. 27. Ashburner, M., Ball, C.A., Blake, J.A., Botstein, D., Butler, H., Cherry, J.M., Davis, A.P., Dolinski, K.,
Dwight, S.S., Eppig, J.T. et al. (2000) Gene ontology: tool for the unification of biology. The Gene Ontology Consortium. Nature genetics, 25, 25-29.
28. Kanehisa, M. (2000) Post-genome informatics. Oxford University Press, Oxford ; New York. 29. Huang da, W., Sherman, B.T. and Lempicki, R.A. (2009) Systematic and integrative analysis of
large gene lists using DAVID bioinformatics resources. Nature protocols, 4, 44-57. 30. Bluthgen, N., Brand, K., Cajavec, B., Swat, M., Herzel, H. and Beule, D. (2005) Biological profiling
of gene groups utilizing Gene Ontology. Genome informatics. International Conference on Genome Informatics, 16, 106-115.
31. Pihlajoki, M., Gretzinger, E., Cochran, R., Kyronlahti, A., Schrade, A., Hiller, T., Sullivan, L., Shoykhet, M., Schoeller, E.L., Brooks, M.D. et al. (2013) Conditional mutagenesis of Gata6 in SF1-positive cells causes gonadal-like differentiation in the adrenal cortex of mice. Endocrinology, 154, 1754-1767.
32. Viger, R.S., Guittot, S.M., Anttonen, M., Wilson, D.B. and Heikinheimo, M. (2008) Role of the GATA family of transcription factors in endocrine development, function, and disease. Molecular endocrinology, 22, 781-798.

- 69 -
33. Koutsourakis, M., Langeveld, A., Patient, R., Beddington, R. and Grosveld, F. (1999) The transcription factor GATA6 is essential for early extraembryonic development. Development, 126, 723-732.
34. Jimenez, P., Saner, K., Mayhew, B. and Rainey, W.E. (2003) GATA-6 is expressed in the human adrenal and regulates transcription of genes required for adrenal androgen biosynthesis. Endocrinology, 144, 4285-4288.
35. Misawa, H., Ohtsubo, M., Copeland, N.G., Gilbert, D.J., Jenkins, N.A. and Yoshimura, A. (1998) Cloning and characterization of a novel class II phosphoinositide 3-kinase containing C2 domain. Biochemical and biophysical research communications, 244, 531-539.
36. Sun, T., Warrington, N.M. and Rubin, J.B. (2012) Why does Jack, and not Jill, break his crown? Sex disparity in brain tumors. Biology of sex differences, 3, 3.
37. Chamberlain, M.C. and Kormanik, P.A. (1998) Practical guidelines for the treatment of malignant gliomas. The Western journal of medicine, 168, 114-120.
38. Verhaak, R.G., Hoadley, K.A., Purdom, E., Wang, V., Qi, Y., Wilkerson, M.D., Miller, C.R., Ding, L., Golub, T., Mesirov, J.P. et al. (2010) Integrated genomic analysis identifies clinically relevant subtypes of glioblastoma characterized by abnormalities in PDGFRA, IDH1, EGFR, and NF1. Cancer cell, 17, 98-110.
39. Gravendeel, L.A., Kouwenhoven, M.C., Gevaert, O., de Rooi, J.J., Stubbs, A.P., Duijm, J.E., Daemen, A., Bleeker, F.E., Bralten, L.B., Kloosterhof, N.K. et al. (2009) Intrinsic gene expression profiles of gliomas are a better predictor of survival than histology. Cancer research, 69, 9065-9072.
40. Phillips, H.S., Kharbanda, S., Chen, R., Forrest, W.F., Soriano, R.H., Wu, T.D., Misra, A., Nigro, J.M., Colman, H., Soroceanu, L. et al. (2006) Molecular subclasses of high-grade glioma predict prognosis, delineate a pattern of disease progression, and resemble stages in neurogenesis. Cancer cell, 9, 157-173.
41. Reilly, K.M., Loisel, D.A., Bronson, R.T., McLaughlin, M.E. and Jacks, T. (2000) Nf1;Trp53 mutant mice develop glioblastoma with evidence of strain-specific effects. Nature genetics, 26, 109-113.
42. Reilly, K.M. (2009) The Nf1–/+; Trp53–/+cis Mouse Model of Anaplastic Astrocytoma and Secondary Glioblastoma: Dissecting Genetic Susceptibility to Brain Cancer.
43. Walrath, J.C., Fox, K., Truffer, E., Gregory Alvord, W., Quinones, O.A. and Reilly, K.M. (2009) Chr 19(A/J) modifies tumor resistance in a sex- and parent-of-origin-specific manner. Mammalian genome : official journal of the International Mammalian Genome Society, 20, 214-223.
44. Marumoto, T., Tashiro, A., Friedmann-Morvinski, D., Scadeng, M., Soda, Y., Gage, F.H. and Verma, I.M. (2009) Development of a novel mouse glioma model using lentiviral vectors. Nature medicine, 15, 110-116.
45. Friedmann-Morvinski, D., Bushong, E.A., Ke, E., Soda, Y., Marumoto, T., Singer, O., Ellisman, M.H. and Verma, I.M. (2012) Dedifferentiation of neurons and astrocytes by oncogenes can induce gliomas in mice. Science, 338, 1080-1084.
46. Bajenaru, M.L., Zhu, Y., Hedrick, N.M., Donahoe, J., Parada, L.F. and Gutmann, D.H. (2002) Astrocyte-specific inactivation of the neurofibromatosis 1 gene (NF1) is insufficient for astrocytoma formation. Molecular and cellular biology, 22, 5100-5113.
47. Warrington, N.M., Woerner, B.M., Daginakatte, G.C., Dasgupta, B., Perry, A., Gutmann, D.H. and Rubin, J.B. (2007) Spatiotemporal differences in CXCL12 expression and cyclic AMP underlie the unique pattern of optic glioma growth in neurofibromatosis type 1. Cancer research, 67, 8588-8595.
48. Tu, H.C., Ren, D., Wang, G.X., Chen, D.Y., Westergard, T.D., Kim, H., Sasagawa, S., Hsieh, J.J. and Cheng, E.H. (2009) The p53-cathepsin axis cooperates with ROS to activate programmed

- 70 -
necrotic death upon DNA damage. Proceedings of the National Academy of Sciences of the United States of America, 106, 1093-1098.
49. Bogler, O., Nagane, M., Gillis, J., Huang, H.J. and Cavenee, W.K. (1999) Malignant transformation of p53-deficient astrocytes is modulated by environmental cues in vitro. Cell growth & differentiation : the molecular biology journal of the American Association for Cancer Research, 10, 73-86.
50. Guo, J., Sheng, G. and Warner, B.W. (2005) Epidermal growth factor-induced rapid retinoblastoma phosphorylation at Ser780 and Ser795 is mediated by ERK1/2 in small intestine epithelial cells. The Journal of biological chemistry, 280, 35992-35998.
51. Heiman, M., Schaefer, A., Gong, S., Peterson, J.D., Day, M., Ramsey, K.E., Suarez-Farinas, M., Schwarz, C., Stephan, D.A., Surmeier, D.J. et al. (2008) A translational profiling approach for the molecular characterization of CNS cell types. Cell, 135, 738-748.
52. Doyle, J.P., Dougherty, J.D., Heiman, M., Schmidt, E.F., Stevens, T.R., Ma, G., Bupp, S., Shrestha, P., Shah, R.D., Doughty, M.L. et al. (2008) Application of a translational profiling approach for the comparative analysis of CNS cell types. Cell, 135, 749-762.
53. Tryon, R.C., Pisat, N., Johnson, S.L. and Dougherty, J.D. (2013) Development of translating ribosome affinity purification for zebrafish. Genesis, 51, 187-192.
54. Kasianowicz, J.J., Brandin, E., Branton, D. and Deamer, D.W. (1996) Characterization of individual polynucleotide molecules using a membrane channel. Proceedings of the National Academy of Sciences of the United States of America, 93, 13770-13773.
55. Clarke, J., Wu, H.C., Jayasinghe, L., Patel, A., Reid, S. and Bayley, H. (2009) Continuous base identification for single-molecule nanopore DNA sequencing. Nature nanotechnology, 4, 265-270.
56. Manrao, E.A., Derrington, I.M., Pavlenok, M., Niederweis, M. and Gundlach, J.H. (2011) Nucleotide discrimination with DNA immobilized in the MspA nanopore. PloS one, 6, e25723.
57. Ayub, M. and Bayley, H. (2012) Single Molecule RNA Base Identification with a Biological Nanopore. Biophys J, 102, 429a-429a.

- 71 -
Chapter 4 : Discovery of PDE7B as a novel effector of GBM growth by
computational deconvolution of an in vitro physical coculture system.
This chapter is currently being revised and will be published shortly.
Authors:
Michael D Brooks1,7
, Erin Jackson2,3
, Nicole M Warrington1, Sara Taylor
4, Diane D Mao
4, Jeffrey R
Leonard4, Albert H Kim
4, David Piwnica-Worms
2,3,5,6, Robi D Mitra*
7 & Joshua B Rubin*
1,8
*These authors contributed equally to this work 1Department of Pediatrics, Washington University School of Medicine, St. Louis, Missouri
2BRIGHT Institute, Washington University School of Medicine, St. Louis, Missouri
3Molecular Imaging Center, Mallinckrodt Institute of Radiology, Washington University School of
Medicine, St. Louis, Missouri 4Department of Neurosurgery, Washington University School of Medicine, St. Louis
5Department of Cell Biology & Physiology, Washington University School of Medicine, St. Louis,
Missouri 6Department of Cancer Systems Imaging, University of Texas MD Anderson Cancer Center, Houston, TX
7Department of Genetics and Center for Genome Sciences and Systems Biology, Washington University
School of Medicine in St. Louis & 8Department of Anatomy and Neurobiology, Washington University School of Medicine, St. Louis,
Missouri, United States of America

- 72 -
Statement of Translational Relevance
Targeting the tumor promoting interactions that occur between tumors cells and stromal elements within
the perivascular space is gaining traction for glioblastoma. The scope of molecular targets and pathways
is continually being updated. In this manuscript we identify phosphodiesterase 7B (PDE7B) as a mediator
of glioblastoma growth whose expression is induced in GBM through functional interactions that occur
between GBM and endothelial cells. PDE7B was discovered using a novel method for studying reciprocal
interactions between glioblastoma and endothelial cells that involves computational deconvolution of
their coincident transcriptional profiles. The translational relevance of PDE7B was evident in analyses of
RNA and protein expression in primary glioblastoma specimens, survival analysis of clinical data, and the
effect of PDE7B overexpression on the intracranial growth of U87 xenografts. These new findings
indicate that PDE7B should be further evaluated as a prognostic marker and as a molecular target in
glioblastoma.
Abstract
Cell-to-cell interactions between tumor cells and their microenvironment are critical determinants of
tumor tissue biology and therapeutic responses. Interactions between glioblastoma (GBM) cells and
endothelial cells (ECs) establish a purported stem cell niche. We hypothesized that genes that mediate
these interactions would be important, particularly as therapeutic targets. Using a novel computational
approach to deconvoluting expression data from mixed physical coculture of GBM cells and ECs, we
identified a previously undescribed upregulation of the cAMP specific phosphodiesterase PDE7B in
GBM cells in response to ECs. We further found that elevated PDE7B expression occurs in most GBM
cases and has a negative effect on survival. PDE7B overexpression resulted in the expansion of a stem-
like cell subpopulation, increased tumor aggressiveness, and increased growth in an intracranial GBM

- 73 -
model. This deconvolution algorithm provides a new tool for cancer biology, and these results identify
PDE7B as a therapeutic target in GBM.
Introduction
Frequently, studies of tumor biology have focused on the intrinsic properties of cancer cells, such as their
growth rate, signaling cascades, or DNA repair capacity, without fully accounting for how the
microenvironment can influence these functions. Tumor progression however, is a consequence of
collaboration between the genomic lesions present in the tumors cells and alterations in the tumor
microenvironment (1). The tumor microenvironment is highly heterogeneous (2) with varying cellular
constituents within multiple tumor microdomains such as the leading edge of invasion and the peri-
necrotic spaces as well as the perivascular space. Within each of these microdomains, genetically
identical tumor cells may exhibit different patterns of gene and protein expression resulting in regions of
distinct cellular phenotypes being simultaneously present within the same tumor. This intratumor
heterogeneity creates an experimental challenge in studying cancer biology (3).
Several cancers are reported to display significant intratumor heterogeneity including glioblastoma
multiforme (GBM), the most common malignant primary brain tumor in adults. While the study of peri-
necrotic and invasive edge biology in GBM has generated insights into the metabolism of cancer cells in
hypoxia (4), Notch signaling (5), and the importance of matrix metalloproteinases (MMPs) (6), it is the
focus on the biology of the perivascular niche (PVN) that has yielded the greatest body of information.
The PVN is home to a subpopulation of tumor cells with stem cell-like properties. The GBM PVN
contains GBM cancer stem cells (CSCs), endothelial cells, pericytes (7), astrocytes (8), and microglia (9).
While multiple pathways have been identified as essential for the specialized function of the PVN (10,11)
how this specialized domain is established remains largely unknown. It is clear that endothelial cells

- 74 -
within the GBM PVN are distinct from endothelial cells in the normal brain and that tumor cells within
the perivascular space are distinct from bulk tumor cells (12). Identifying the reciprocal interactions that
induce these changes in the component cell types of the PVN will be essential for understanding and
effectively targeting its function.
Previously, we reported an in vitro model of the GBM PVN comprised of primary cultures of human
brain microvascular endothelial cells (HBMECs) in Matrigel and either an established GBM cell line
(U87-MG) or primary GBM cells (13). Functional studies using this system revealed that expression of
the chemokine CXCL12 by HBMECs promoted localization of GBM cells to the peri-endothelial cell
space and triggered their expansion. These studies demonstrated the utility of an in vitro co-culture
system for modeling GBM-PVM interactions. Here we sought to use this system to identify the pathways
that are modulated by interactions between endothelial and GBM cells.
Prior efforts to identify the targets in cell:cell interactions have frequently relied on conditioned media
experiments (14,15) in which a target cell type of interest (e.g. U87-MG) is grown in media conditioned
by “controller/inducer” cells (e.g. HBMECs). One drawback to this approach is that changes induced by
physical cell:cell interactions or reciprocally induced interactions (feedback loops) cannot be detected. In
an alternative approach, two cell types have been labeled with two different fluorescent proteins, so that
they can be grown together, separated by Fluorescent Activated Cell Sorting (FACS), and then analyzed
independently (16). In principle, this method has the potential to capture the effects of both secreted and
direct interactions between cell types; however, in practice, separating cells from matrix containing three-
dimensional cocultures quickly and efficiently without disrupting the very signal that is being interrogated
is difficult, especially when analyzing changes in mRNA abundance.

- 75 -
Thus, for global gene expression analysis, the ideal system would allow for the immediate isolation of
RNA during the experiment, without the need for extra processing of cells. However, the immediate
purification of RNA mixes the RNA species from both cell types, making the measurement of gene
expression changes within each cell type a challenging task. Therefore, we developed a unique
computational approach to deconvolve the combined transcriptional signal and accurately measure gene
expression changes that occur when endothelial cells and GBM cells interact. Using this method, we
identified a small number of key target pathways involved in PVN function and discovered a new role for
the cAMP-specific phosphodiesterase (PDE), PDE7B, which is induced in GBM cells by a contact-
mediated interaction with endothelial cells. PDE7B is overexpressed in primary GBM specimens, has
prognostic significance in human disease and when overexpressed in GBM cell lines, results in increases
in the stem-like cell population in vitro, and drives tumorigenicity in vivo. Together these studies validate
this new approach for discovery of pathways that mediate the critical phenotypic variation that occurs
when tumor cells interact with stromal elements within tumor microdomains.
Results
Global expression profiling identifies genes regulated by GBM cell:endothelial cell interactions
We previously demonstrated that the physical co-culture of primary human brain microvascular
endothelial cells (HBMECs) and either primary human GBM cells or the U87 GBM cell line resulted in
endothelial cell-dependent growth of the GBM cells (13). To elucidate how a cooperative interaction
between tumor cells and their microenvironment might drive GBM growth, we performed gene
expression profiling with Illumina BeadArray microarrays using RNA isolated from the mixed cell
population after 48 hours of culture and RNA isolated from parallel monocultures of HBMECs and U87

- 76 -
cells (Figure 4-1A). Because the isolated RNA was derived
from a mixed population of cells, changes in gene
expression that were detected could be attributed to either
changes in the relative numbers of HBMECs and U87 cells
over the 48-hour co-culture time period, or to gene
expression changes caused by functional interactions
between the two cell types. As we were interested only in
the latter, it became essential to develop computational
methods to distinguish between these sources of changes in
expression levels.
Thus we developed an approach that uses gene expression
data to precisely determine the ratio of HBMEC and U87
cells within a mixed culture. Our strategy exploits the fact
that the expression levels of most genes in either cell type
are likely to be unchanged upon co-culture, and only a small
percentage of genes altered by their interaction. Using
expression profiling data obtained separately from HBMEC
and U87 monocultures, we computed the expected gene
expression profiles for every possible mixture of the two
cell types, from a ratio of 0.1% HBMEC/99.9% U87 to a
ratio of 99.9% HBMEC/0.1%U87. We then used these
computed profiles to determine the ratio of GBM and
HBMECs in the actual co-culture experiment. To do so, we

- 77 -
calculated the Pearson correlation between the experimentally measured co-culture expression data and
the full series of computational generated expression profiles. The synthetic profile with the highest
correlation provided the closest approximation to the actual ratio of U87 cells and HBMECs in the co-
culture (Figure 4-1B). Once this ratio was determined, we normalized the microarray data to account for
changes in the amount of each cell type. This calculation was performed for three independent sets of co-
culture data. From these combined gene expression data sets, we could then further identify statistically
significant outliers, which represented candidate genes whose expression was either increased or
decreased as a consequence of functional interactions between HBMECs and U87 cells.
In this manner, 45 genes were
identified as significantly (after
Benjamini-Hochberg multiple
hypothesis correction)
upregulated or downregulated by
greater than a 2-fold as the result
of functional interactions
between HBMECs and U87 cells
(Table 4-1). Consistent with
known effects of GBM cells on
endothelial cells, this list of
genes contained several
regulators of angiogenesis such
as Thrombospondin-1 (17), ICAM1 (18), and CXCL1 (19). Also notable is the upregulation of WNT
signaling genes CTHRC1 (20) and Frizzled-9 (21). WNT signaling is known to be involved in
maintaining stemness and cell proliferation (22).

- 78 -
Expression profiling of the mixed co-culture directly identified genes whose expression changed as a
result of cell:cell interactions, but did not identify in which cells these changes were occurring or whether
the changes were in response to the actions of secreted factors or cell-cell contact. To establish
requirements for contact and to identify the target cell for expression changes, we performed monoculture
experiments in which endothelial cells and U87 cells were treated with either basal media, media
conditioned by U87 or endothelial cell monocultures, or by U87-endothelial cell co-cultures. We
validated the approach with three differentially expressed genes: CXCL6, CXCL1, and THBS1. For all
four genes, conditioned media treatments recapitulated the gene expression changes predicted from the
microarray results indicating that their regulation was through the actions of secreted factors (Figure 4-2).
CXCL6, IL8, and CXCL1 all were upregulated in HBMECs in response to factors secreted by U87 cells.
In contrast, THBS1 was strongly downregulated in U87 cells by media conditioned by HBMECs. These
results provided validation for our computational and experimental approach and indicated that
conditioned media experiments in combination with qRT-PCRs could distinguish the regulator and target
cell type for most gene expression changes that occurred through secreted GBM and endothelial cell
interactions.

- 79 -
GBM PDE7B expression is regulated by physical contact with HBMECs
Among the genes upregulated through interactions
between HBMECs and U87 cells was the cAMP specific
phosphodiesterase PDE7B (23). This transcript was of
interest as we previously demonstrated that another
cAMP-specific phosphodiesterase PDE4A1 had potent
pro-tumorigenic effects in both low and high-grade
glioma models (24) (25). Thus we hypothesized that if
PDE7B were upregulated in GBM cells, it would also
stimulate GBM growth. We first sought to determine
whether PDE7B regulation occurred through the actions
of secreted factors or whether it required physical contact
between HBEMCs and U87 cells. When we performed
the conditioned media screen for secreted factor effects
on expression we saw very low levels of PDE7B that
were unaffected by the conditioned media (Figure 4-3A).
Therefore we suspected that PDE7B was being regulated
by cell:cell contact. To directly test this hypothesis,
HBMECs were grown to ~80% confluence, then
methanol fixed and washed. These fixed cells, and their associated matrix, maintain relevant epitopes for
cell:cell and cell:matrix interactions but are devoid of secreted factors and RNA (26). U87 cells were
then cultured on the fixed HBMECs for 48 hours prior to RNA extraction and qRT-PCR analysis for

- 80 -
PDE7B. Under these conditions, PDE7B was specifically upregulated in the U87 cells, indicating that
U87 cells were the target cell for gene expression changes detected in the co-culture expression profiling
and, in contrast to the regulators of angiogenesis previously evaluated, changes in PDE7B occur only
through physical cell:cell contact with HBMEC cells (Figure 4-3B). To verify that HBMEC-induced
changes in PDE7B were not confined to U87 cells and to increase the relevance of these findings to
GBM, we performed an identical evaluation with a primary low passage GBM cell line B18. Consistent
with the results obtained with U87 cells, PDE7B was upregulated in B18 cells, but only through direct
physical contact (Figure 4-3C and 4-3D).
PDE7B is frequently upregulated in GBM and has prognostic significance
If endothelial cell induction is an important mechanism for the regulation of PDE7B expression in GBM,
then this should be apparent at the mRNA and protein level in primary GBM specimens. We obtained
RNA from 22 primary GBM specimens from the Siteman Cancer Center Tissue Procurement Core,
generated cDNA, performed qRT-PCR for PDE7B on these samples, and compared the expression level
to that in normal human astrocytes. We saw a strong upregulation of PDE7B in 18 of the 22 samples
(Figure 4-4A), indicating that upregulation of PDE7B mRNA commonly occurs in GBM. Next, we
analyzed protein expression by performing immunohistochemical (IHC) staining for PDE7B on a tissue
microarray containing duplicate cores of 35 different astrocytomas. These astrocytomas ranged from
grade 1 to grade 4. PDE7B was expressed in the majority of tumor specimens, variably involving
endothelial cells, perivascular cells, and non-perivascular tumor cells (Figure 4-4C, Supplemental Table
4-S1). When low grade tumors (Grades 1 and 2) were compared to high grade tumors (Grades 3 and 4),
high grade tumors had significantly more staining than low grade (high grade average = 2.25, low grade
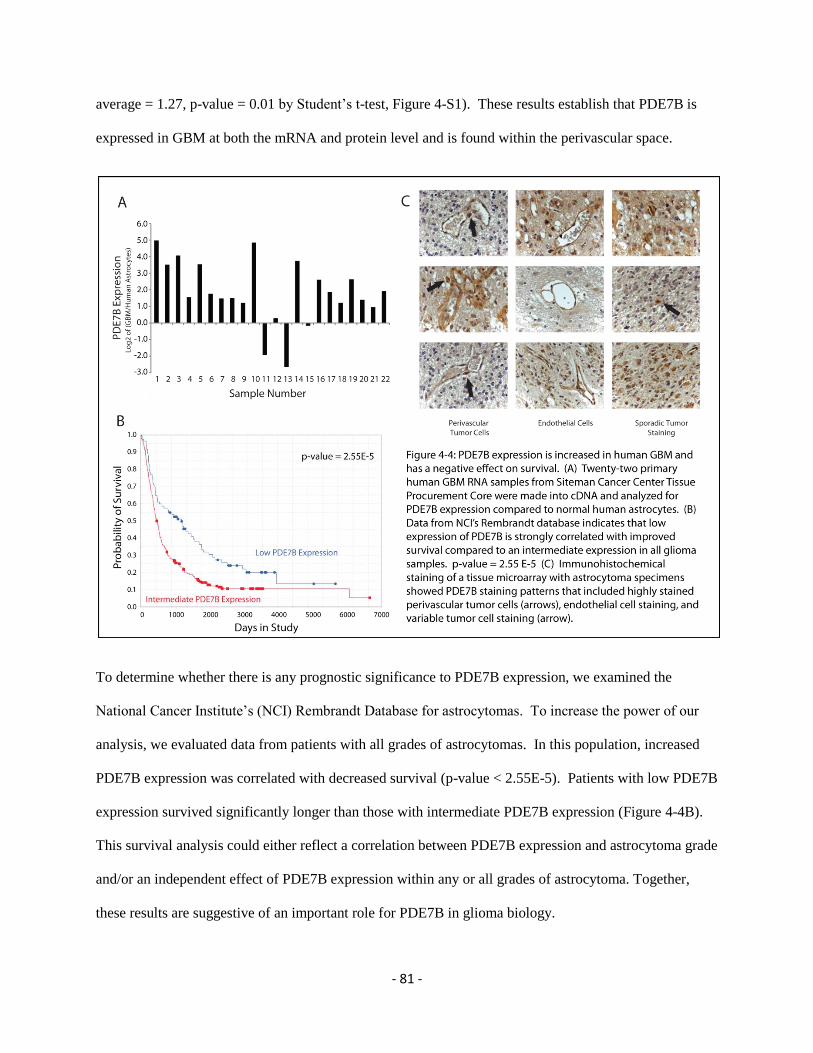
- 81 -
average = 1.27, p-value = 0.01 by Student’s t-test, Figure 4-S1). These results establish that PDE7B is
expressed in GBM at both the mRNA and protein level and is found within the perivascular space.
To determine whether there is any prognostic significance to PDE7B expression, we examined the
National Cancer Institute’s (NCI) Rembrandt Database for astrocytomas. To increase the power of our
analysis, we evaluated data from patients with all grades of astrocytomas. In this population, increased
PDE7B expression was correlated with decreased survival (p-value < 2.55E-5). Patients with low PDE7B
expression survived significantly longer than those with intermediate PDE7B expression (Figure 4-4B).
This survival analysis could either reflect a correlation between PDE7B expression and astrocytoma grade
and/or an independent effect of PDE7B expression within any or all grades of astrocytoma. Together,
these results are suggestive of an important role for PDE7B in glioma biology.
- 82 -
Overexpression of PDE7B stimulates in vitro stemness and in vivo GBM growth and tumorigenicity
To directly test whether the level of PDE7B expression affects GBM biology, we cloned and
overexpressed PDE7B in U87-GL cells. We desired to have a catalytically inactive form of PDE7B as a
control. Catalytically inactive forms of other cAMP specific phosphodiesterases have been generated by
mutating an essential amino acid in the catalytic site (24,27). Using comparative genomics we aligned the
sequences of these phosphodiesterases with PDE7B, identified the same essential histidine and generated
an analogous catalytically inactive histidine to glutamine (H217Q) mutant. Both the wild type and mutant
forms of PDE7B were stably introduced into U87-GL cells using PiggyBac transposase and hygromycin
selection. Verification of the overexpression was determined by qRT-PCR (Supplemental Figure 4-S2A),
and Western blot analysis (Supplemental Figure 4-S2C). The activity of wild type and mutant PDE7B on
cAMP levels was verified by cAMP ELISA. Overexpression of wild type PDE7B, but not catalytically
inactive PDE7B, resulted in significantly lower levels of cAMP (Supplemental Figure 4-S2B).
Since we had previously found that the overexpression of another phosphodiesterase, PDE4A1,
suppressed intracellular cAMP levels and stimulated growth in multiple brain tumor cell lines (25) (24),
we hypothesized that the overexpression of PDE7B might have similar effects. Interactions between
endothelial cells and GBM cells are known to regulate tumor growth through maintenance of the GBM
stem-like cell population. To determine whether the induction of PDE7B in GBM cells through an
interaction with endothelial cells might influence stem-like cell behavior, we first measured the fraction
of U87 cells with stem-like cell function in extreme limiting dilution assays (ELDAs). Briefly, replicate
cultures were established with a series of extremely low cell numbers in sphere formation media, and
allowed to grow for 3 weeks. Under these conditions, only cultures that contain a stem-like cell are

- 83 -
capable of forming a colony. The fraction of wells with colonies as a function of cells plated provides a
measure of the frequency of cells with stem-like properties (Supplemental Figure 4-S3A). When
analyzed, the U87-
GL+PDE7B(WT)
cell line had a
significant increase
in the percentage of
stem-like cells
compared to the
catalytically inactive
control line (p-value
= 0.03, 11.1% vs
7.0% respectively,
Supplemental
Figure 4-S3B).
In vitro expansion of the stem-like cell population by overexpression of PDE7B, together with the
negative prognostic effect of PDE7B expression in human disease suggested that overexpression of
PDE7B might have a pro-tumorigenic effect in vivo. To investigate this possibility, we generated
intracranial xenografts in NCR nude mice with 50,000 U87-GL+PDE7B(WT) or U87-
GL+PDE7B(H217Q) cells engineered to also express firefly luciferase (24). Tumors were generated in
three separate cohorts of mice with 5 mice per group in each cohort. Tumor growth was quantified with
weekly bioluminescence imaging (BLI) and survival was measured. Tumors expressing wild type PDE7B

- 84 -
exhibited a
significantly
greater rate of
growth than those
expressing
mutant PDE7B
(Figure 4-5A)
and two-way
ANOVA showed
a statistically
significant
difference with a
p-value of 0.002.
The greater rate
of growth
resulted in
significantly
decreased
survival as
determined by
log-rank testing
of Kaplan-Meier
survival (Figure
4-5B).

- 85 -
Consistent with the BLI and survival data, histological analysis revealed that tumor size was consistently
greater in the PDE7B WT tumor group (Figure 6A) than the PDE7B H217Q tumor group (Figure 6B).
Strikingly, PDE7B WT tumors exhibited a more aggressive tumor phenotype than is normally seen with
U87 xenografts (28). This was most evident in the extensive infiltration and neovascularization (Figure
6C) as compared to the PDE7B H217Q tumors (Figure 6D). Proliferation was evaluated by
phosphorylated Histone H3 staining. Overall cell density was higher in the tumors overexpressing
PDE7B WT compared to those overexpressing PDE7B H217Q, and phosphorylated Histone H3 staining
correlated with cell density (Figure 6E & F).
Discussion
The complexity of the tumor microenvironment presents obstacles to progress in both understanding
molecular oncology and in developing therapeutics to effectively target contextualized tumor biology.
Advancement may depend upon new model systems in which the multi-faceted microenvironment can be
deconvoluted in order to assess the contributions that specific subsets of cells, matrix, and three-
dimensional structures make to tumor tissue biology. Model systems like these should support discovery
of genes and pathways that mediate the important reciprocal interactions that occur between tumor cells
and their microenvironment. We were interested in understanding the interactions between GBM and
endothelial cells as these are purported to be essential for tumorigenesis (10), tumor progression (29) and
recurrence after standard treatment (30). Direct global expression profiling of co-cultured GBM and
endothelial cells, enabled by our computational deconvolution algorithm, revealed a number of pathways
that were induced or suppressed by the interaction of these cells. Among them was upregulation of the
cAMP-specific phosphodiesterase, PDE7B, in GBM cells.

- 86 -
A major advantage of this computational approach is the ability to capture changes in gene expression
that occur as a consequence of the actions of secreted factors and/or physical cell:cell contact. Neither
conditioned media swap nor trans-well experiments can detect changes mediated by cell:cell contact.
Moreover, these commonly applied techniques cannot measure changes in gene expression that occur
through reciprocal interactions between cells. These types of interactions have been shown to be critical
in the tumor microenvironment (31). Therefore, the inability to detect them is a significant limitation to
the use of conditioned media swap and trans-well experiments alone for assessing paracrine effects in
tumor biology. Computational deconvolution supports the immediate isolation of RNA from the co-
cultures, which prevents the degradation of the signal that can result when additional processing time is
required for cell sorting.
This computational approach has its own limitations. First, the detected gene expression changes are a
mixture of the signal from both of the constituent cell types. Therefore, for each gene, further studies are
required to determine in which of the cell types the change occurred, and whether this change was a
function of secreted factors or cell:cell contact. Furthermore, reciprocal gene induction and suppression
could theoretically result in no apparent change in signal and a diminution of the model’s sensitivity. We
suspect that processes like these contribute to the marginally weaker significance we detected for changes
in gene expression as compared to many other global expression studies. However, we were able to
identify 45 genes whose expression was significantly altered. After multiple hypothesis correction,
validation by qRT-PCR and in vivo experiments we did not uncover any false positives, reassuring us that
the analysis provided a high quality list of changes in gene expression as a consequence of functional
interactions between GBM and endothelial cells. Currently, the system serves as a proof of principle and
evaluates a single set of interactions between two cell types from the tumor microenvironment. Further

- 87 -
work will be necessary to systematically add other tumor microenvironmental cells types and determine
the additional effects on gene expression.
Of the genes discovered by our assay, PDE7B was chosen for further studies. This focus was supported
by our previous work demonstrating that PDE4A1 and cAMP suppression can contribute to tumorigenesis
(24) and drive intracranial brain tumor xenograft growth (32) (25). Low levels of cAMP have been
correlated with malignant brain tumors for many years (33), but the mechanisms that control these
abnormal cAMP levels and their cancer relevant targets are often undefined or remain poorly understood.
The cyclic AMP pathway is integral to the regulation of numerous cellular processes including growth
and differentiation (34,35). While the bulk of cAMP signaling is transmitted by just two mediators,
protein kinase A (PKA) and exchange protein activated by cAMP (EPAC), exquisite specificity in cAMP
signaling is achieved through subcellular localization and activation (36). A critical component of this
specification is the establishment of defined intracellular pools of differing cAMP levels as a result of
highly localized and regulated cAMP degradation through PDEs.
Humans have 11 families of PDEs, three of which are cAMP specific (PDE4, PDE7, PDE8), and each of
these families can have multiple gene homologs throughout the genome, and each of these genes can have
multiple splicing isoforms (36,37). The canonical PDE structure includes a common catalytic domain, an
amino terminal subcellular localization motif and regulatory kinase sites and protein-protein interacting
domains. Consequently, PDE expression and activation result in the generation of highly specific
gradients of intracellular cAMP (38) and the formation of multiprotein signaling complexes that carry out
localized functions (39,40). This process has been most extensively illustrated for the PDE4 family of
cAMP-specific PDEs (41,42).
- 88 -
While we have yet to define how PDE7B promotes GBM tumorigenecity, there are some likely
mechanisms. Cyclic AMP is a recently established regulator of neural stem cell proliferation,
differentiation, and survival (43) and it is known that endothelial cells in the PVN support GBM CSCs
and therefore the induction of PDE7B expression in tumor cells localized to the perivascular space may
function to promote CSC function. The detection of a modest, but significant, increase in stemness, as
measured by our in vitro limiting dilution assay, in U87 cells overexpressing wild type PDE7B is
consistent with this hypothesis. This would also be in line with our observation that PDE7B WT
intracranial tumors showed signs of increased invasion and aggressiveness compared to the PDE7B
H217Q tumors. The increase in blood vessel density in wild type tumors also suggests that tumor cell
PDE7B might function as part of a positive feedback loop for promoting angiogenesis.
Finally, the effect of PDE7B on outcome in GBM and its ability to drive intracranial tumor growth in the
U87 model suggests that inhibition of PDE7B should be evaluated as a novel therapeutic for GBM. We
previously demonstrated that targeted inhibition of an alternate cAMP-specific phosphodiesterase PDE4
had significant anti-brain tumor activity, when tested in a spontaneous model of low-grade glioma and in
intracranial xenograft models of GBM and medulloblastoma (24) (25). Together with the current findings,
these results provide a strong rationale for cAMP elevation in the treatment of brain tumors. While there
have not been any studies of specific PDE7B inhibitors in the context of cancer treatment, there has been
work done evaluating PDE7B inhibition for the treatment of autoimmune disorders (44,45). Therefore
future work should focus on taking specific inhibitors of PDE7B from the autoimmune studies and
determining their efficacy in blocking glioma growth in vitro and in vivo with the hope of translating
these findings to the clinic as quickly as possible.

- 89 -
Materials and Methods
All animals were used in accordance with an established Animal Studies Protocol approved by Animal
Studies Committees of the Washington University School of Medicine.
Cell culture and reagents:
U87MG cells (Catalog #HTB-14) authenticated by STR were obtained from ATCC, grown in MEM
alpha (Life Technologies Cat# 12561-049) with 10% fetal bovine serum (Sigma-Aldrich Cat# F4135-
500ML), and used within 4 months of passage zero. Cells were then infected with a lentivirus expressing
a fusion protein of eGFP and Firefly Luciferase (GL) to allow the cells to be visualized by fluorescence
and quantified by bioluminescent imaging (24). HBMECs were obtained from ScienCell (Catalog
#1000), grown in complete endothelial media EGM-2MV (Lonza Cat# CC-3202), and all experiments
were performed between passage 6 and 10. B18 GBM line was created following an IRB-approved
protocol as previously described (46). Briefly, primary GBM tumor tissue was cleaned manually of
RBCs, mechanically dissociated with forceps and scalpel, and dissociated with Accutase (Sigma Cat#
A6964-100ML). Cells were then spun down, triturated gently, and plated on PLO (Sigma Cat# P4957)
and Laminin (Sigma Cat# L2020) coated Primaria plates (BD Biosciences Cat# 353824). Cells were used
for experiments after the fifth passage. Media is RHB-A with EGF and FGF.
Fixed cell cocultures:
Cells were grown to 80% confluence in 6-well plates. The media was then removed and replaced with ice
cold 100% methanol, placed at -20C for 20 minutes, and then washed three times with PBS before
150,000 glioblastoma cells were placed on top in their respective media.

- 90 -
In vitro coculture:
150,000 HBMECs were plated on Matrigel (BD Biosciences Cat# 354234) using the thin gel protocol and
in EGM-2MV in 6-well plates and allowed to form tubules for 24 hours. 150,000 U87-GL cells were
plated on top of the HBMEC tubules, grown together for another 48 hours, and then RNA was harvested
with Trizol (Invitrogen #15596-026).
Microarray analysis
Starting with the quartile normalized Illumina Beadarray data from the standard Illumina analysis, a perl
script loaded the data for three biological replicates of U87 monoculture, HBMEC monoculture, and U87
plus HBMEC coculture. Data was filtered for genes that had expression p-values > 0.05 (as deteremined
by the Illumina software). For each test computational dataset to be created (0.1% U87/99.9% HBMEC
for example), and for each gene in the dataset, the value for biological replicate 1 of the U87 data was
multiplied by 0.001 (for example) and added to the value for biological replicate 1 of the HBMEC data
after it was multiplied by 0.999. This was repeated for the other two biological replicates to give 3 new
computationally derived replicates and then repeated for all of the genes. After each of these
computational datasets was complete, a Pearson correlation was calculated between of all the genes for
biological replicate 1 of the coculture dataset versus all the genes of the computationally derived
biological replicate 1. This was repeated for all three replicates, and then these three Pearson correlations
were averaged, and then recorded. Figure 1B is a plot of all the different computationally derived
datasets versus the corresponding average Pearson correlations.
Once the computational dataset was created, genes without any expression (average of the three
biological replicates < 30) in any of the samples, were removed from the analysis leaving 14,712 genes.
- 91 -
Next, a Student’s t-test was performed between the 3 computational replicates and the three coculture
replicates. Further filtering was performed to leave only those genes which had a fold change greater than
2 fold (up or down) between the computational dataset and the coculture dataset. Benjamini-Hochberg
multiple hypothesis correction was then performed, or which 45 genes remained statistically significant.
qRT-PCR:
qRT-PCR primers were designed in Primer 3 using previously described settings (47). Primers were:
GAPDH(F-TGTAGTTGAGGTCAATGAAGGG, R-ACATCGCTCAGACACCATG), CXCL1(F-
GCACTGCTGCTCCTGCTCCTGGTAG, R- CGCCCATTCTTGAGTGTGGCTATGA), IL8(F-
GACCACACTGCGCCAACACAGAAAT, R- CCAGTTTTCCTTGGGGTCCAGACAG), THBS1(F-
CTGAGTTGGACGTCCCCATCCAAAG, R- CCACGTTGTTGTCAAGGGTGAGGAG), CXCL6(F-
TGCACTTGTTTACGCGTTACGCTGAG, R- TTCCGGGTCCAGACAAACTTGCTTC), and
PDE7B(F-CTGTTAAGTAGGCGGAAGTCAA, R-CGATCAGAATGCCAAATGTGTT). Thermo-
Fisher qRT-PCR master mix (Thermo-Fisher Cat # AB-1166/B) was used according to manufacturer’s
directions. Data was acquired on a BioRad CFX96 qPCR machine (Cat # 184-5096) and analysis was
done in Microsoft Excel using the ∆∆C method.
Tissue sections and staining:
Immunohistochemistry was done as previously described (24). Antibodies used: phosphorylated Histone
H3 1:500 (Cell Signaling #9701), Endoglin 1:250 (R&D Systems #AF1320), cleaved caspase 3 1:200
(Cell Signaling #9664).

- 92 -
Creation of overexpression cell lines:
Wild Type PDE7B or a catalytically inactive version were cloned into a vector with CMV driving cassette
expression, hygomycin as a selectable marker, and flanked with PiggyBac Transposase LTRs. These
plasmids were cotransfected into an existing U87-GL line with a plasmid transiently expressing PiggyBac
Transposase to create stable lines as described previously (48).
Site directed mutagenesis:
The catalytically inactive version of PDE7B was created by starting with the already cloned wild type
version of PDE7B and using a site directed mutagenesis kit (Agilent Cat # 200521), as directed, with
primers (F- GCTGGTTCACCCCTGGCTGGTCCACATCGTGTGC) and (R-
GCACACGATGTGGACCAGCCAGGGGTGAACCAGC).
Tissue microarray:
A tissue microarray for astrocytomas was purchased from US Biomax (Cat # BS17016a). Citric acid
antigen retrieval was performed on the slide then blocked with 2% BSA/10% donkey serum in PBST for
two hours. PDE7B primary antibody from ThermoScientific (Cat# PA5-32976), or a no primary control,
was used at 1:50 overnight at room temperature, followed by Biotin labeled anti-Swine secondary (1
hour) and Streptavidin-HRP tertiary (1 hour). Slides were developed in DAB and counterstained with
hematoxylin.
Extreme limiting dilution assays:

- 93 -
Extreme limiting dilution assays were performed as described previously (49). Briefly, for each of 5
biological replicates U87-GL+PDE7B(WT) or U87-GL+PDE7B(H217Q) cells were plated at 81, 27, 9, 3,
or 1 cells per well (in 12 technical replicate wells each) in tumorsphere media in 96 well plates, grown for
3 weeks, and then counted.
Generation of intracranial xenografts:
Intracranial xenografts were generated as described previously (32). Briefly, homozygous NCR nude
through a 27 gauge needle over 1 min at 3 mm below the dura mater.
Bioluminescence imaging:
NCR nude mice bearing intracranial xenografts of U87-GL overexpressing Wild Type PDE7B or
catalytically inactive control PDE7B-H217Q were injected with D-luciferin (150 µg/g; Biosynth) as
previously described (24). After anesthesia using 2.5% isoflurane, mice were imaged with a charge-
coupled device camera-based bioluminescence imaging system (IVIS 50; Caliper Perkin-Elmer). Images
were processed using Living Image and IgorPro Software (Version 2.50) as described. Raw data were
expressed as total photon flux (photons/s).

- 94 -
cAMP measurement
cAMP was measured by competitive immunoassay using a Correlated Enzyme Immunoassay Kit
(Assay Designs) according to the manufacturer's instructions and as previously described (50).
cAMP values were normalized to protein for each sample individually.
Acknowledgements:
We would like to thank Mike Heinz and the microarray services at the Genome Technology Access
Center at Washington University in Saint Louis for their help with generation of the microarray data. We
thank the Alvin J. Siteman Cancer Center at Washington University School of Medicine and Barnes-
Jewish Hospital in St. Louis, Mo., for the use of the Tissue Procurement Core, which provided RNA
samples from primary GBMs. The Siteman Cancer Center is supported in part by an NCI Cancer Center
Support Grant #P30 CA91842. Bioluminescence imaging studies were supported by The Molecular
Imaging Center at Washington University School of Medicine and NIH P50 CA94056. This work was
also supported by RO1CA118389 (JBR), 5R01NS07699302 (RDM), and the Taylor Rozier’s Hope for a
Cure Brain Tumor Foundation (JBR), and The Josie Foundation (JBR).
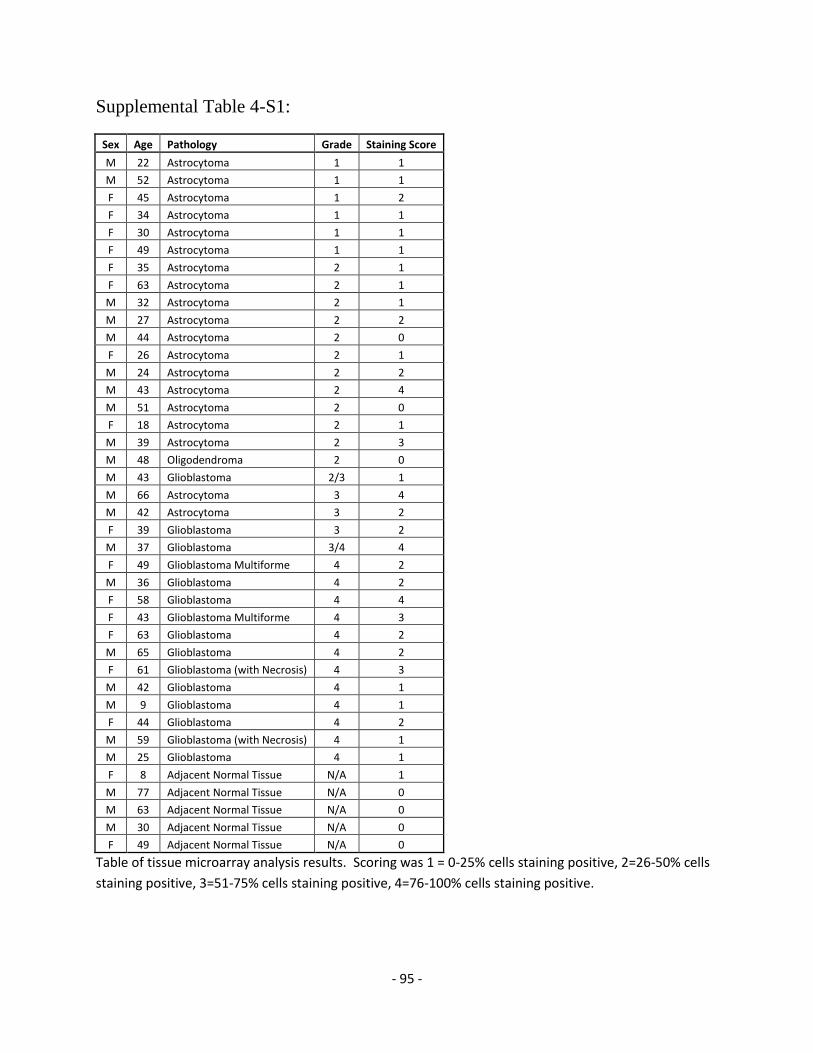
- 95 -
Supplemental Table 4-S1:
Sex Age Pathology Grade Staining Score
M 22 Astrocytoma 1 1
M 52 Astrocytoma 1 1
F 45 Astrocytoma 1 2
F 34 Astrocytoma 1 1
F 30 Astrocytoma 1 1
F 49 Astrocytoma 1 1
F 35 Astrocytoma 2 1
F 63 Astrocytoma 2 1
M 32 Astrocytoma 2 1
M 27 Astrocytoma 2 2
M 44 Astrocytoma 2 0
F 26 Astrocytoma 2 1
M 24 Astrocytoma 2 2
M 43 Astrocytoma 2 4
M 51 Astrocytoma 2 0
F 18 Astrocytoma 2 1
M 39 Astrocytoma 2 3
M 48 Oligodendroma 2 0
M 43 Glioblastoma 2/3 1
M 66 Astrocytoma 3 4
M 42 Astrocytoma 3 2
F 39 Glioblastoma 3 2
M 37 Glioblastoma 3/4 4
F 49 Glioblastoma Multiforme 4 2
M 36 Glioblastoma 4 2
F 58 Glioblastoma 4 4
F 43 Glioblastoma Multiforme 4 3
F 63 Glioblastoma 4 2
M 65 Glioblastoma 4 2
F 61 Glioblastoma (with Necrosis) 4 3
M 42 Glioblastoma 4 1
M 9 Glioblastoma 4 1
F 44 Glioblastoma 4 2
M 59 Glioblastoma (with Necrosis) 4 1
M 25 Glioblastoma 4 1
F 8 Adjacent Normal Tissue N/A 1
M 77 Adjacent Normal Tissue N/A 0
M 63 Adjacent Normal Tissue N/A 0
M 30 Adjacent Normal Tissue N/A 0
F 49 Adjacent Normal Tissue N/A 0
Table of tissue microarray analysis results. Scoring was 1 = 0-25% cells staining positive, 2=26-50% cells
staining positive, 3=51-75% cells staining positive, 4=76-100% cells staining positive.

- 96 -
Supplemental Figure 4-S1
Average of scoring for low grade (1 & 2) versus high grade (3 & 4) tumors. p-v u = 0 0 b Stu t’s t-
test. N= 18 for low grade (Male, Age 43 Grade 2/3 was excluded), N=16 for high grade. Error bars are
Standard Error of the Mean.
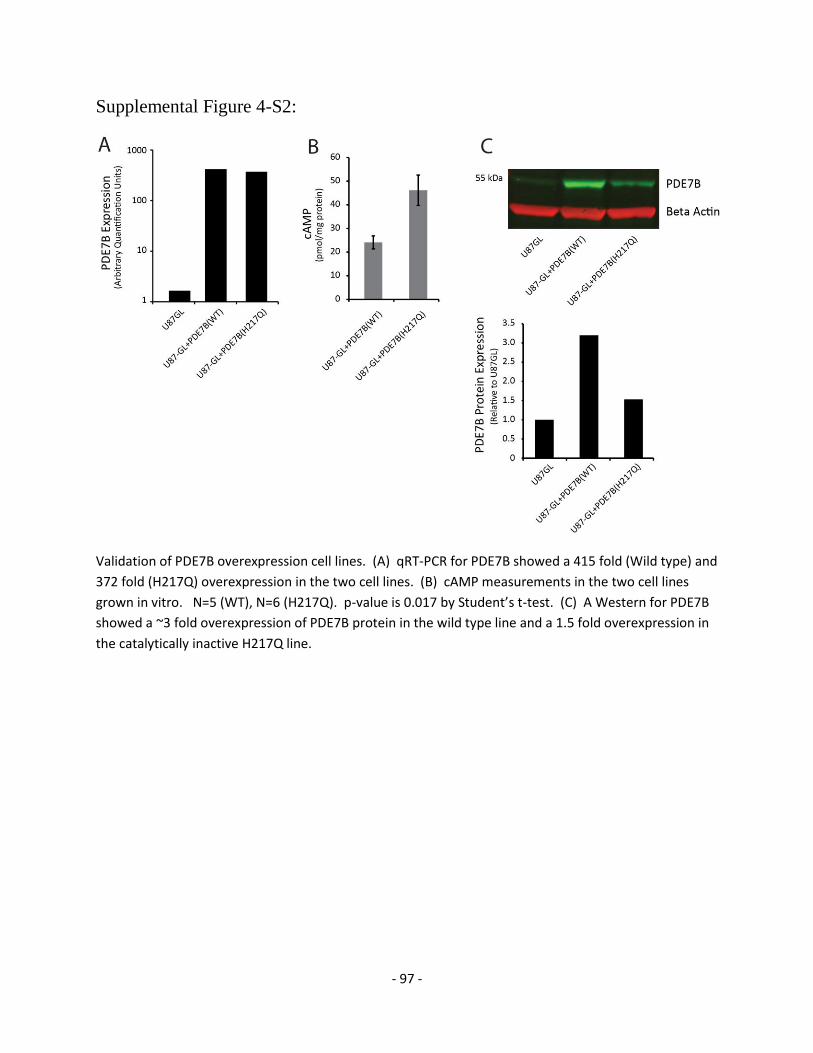
- 97 -
Supplemental Figure 4-S2:
Validation of PDE7B overexpression cell lines. (A) qRT-PCR for PDE7B showed a 415 fold (Wild type) and
372 fold (H217Q) overexpression in the two cell lines. (B) cAMP measurements in the two cell lines
grown in vitro. N=5 (WT), N=6 (H217Q). p-v u is 0 0 7 b Stu t’s t-test. (C) A Western for PDE7B
showed a ~3 fold overexpression of PDE7B protein in the wild type line and a 1.5 fold overexpression in
the catalytically inactive H217Q line.

- 98 -
Supplemental Figure 4-S3:
PDE7B overexpression increases glioma stem-like percentage in vitro. (A) Representative curve from
one biological replicate of an Extreme Limiting Dilution Analysis (ELDA) to determine the percentage of
cancer stem cells in a U87 line with overexpression of wild type PDE7B compared to overexpression of a
catalytically inactive H217Q mutation. (B) Quantification of the stem like cells in shows that
overexpression of wild type PDE7B results in significantly more stem-like cells than the catalytically
inactive H217Q line. N=5, *p-value = 0.03

- 99 -
Chapter 4 References:
1. Kocher, B. and Piwnica-Worms, D. (2013) Illuminating cancer systems with genetically
engineered mouse models and coupled luciferase reporters in vivo. Cancer discovery, 3, 616-629.
2. Sottoriva, A., Spiteri, I., Piccirillo, S.G., Touloumis, A., Collins, V.P., Marioni, J.C., Curtis, C.,
Watts, C. and Tavare, S. (2013) Intratumor heterogeneity in human glioblastoma reflects cancer
evolutionary dynamics. Proceedings of the National Academy of Sciences of the United States of
America, 110, 4009-4014.
3. Denysenko, T., Gennero, L., Roos, M.A., Melcarne, A., Juenemann, C., Faccani, G., Morra, I.,
Cavallo, G., Reguzzi, S., Pescarmona, G. et al. (2010) Glioblastoma cancer stem cells:
heterogeneity, microenvironment and related therapeutic strategies. Cell biochemistry and
function, 28, 343-351.
4. Gorin, F., Harley, W., Schnier, J., Lyeth, B. and Jue, T. (2004) Perinecrotic glioma proliferation
and metabolic profile within an intracerebral tumor xenograft. Acta neuropathologica, 107, 235-
244.
5. Wang, J., Sullenger, B.A. and Rich, J.N. (2012) Notch signaling in cancer stem cells. Advances in
experimental medicine and biology, 727, 174-185.
6. Guo, P., Imanishi, Y., Cackowski, F.C., Jarzynka, M.J., Tao, H.Q., Nishikawa, R., Hirose, T., Hu,
B. and Cheng, S.Y. (2005) Up-regulation of angiopoietin-2, matrix metalloprotease-2, membrane
type 1 metalloprotease, and laminin 5 gamma 2 correlates with the invasiveness of human
glioma. The American journal of pathology, 166, 877-890.
7. Chekenya, M., Enger, P.O., Thorsen, F., Tysnes, B.B., Al-Sarraj, S., Read, T.A., Furmanek, T.,
Mahesparan, R., Levine, J.M., Butt, A.M. et al. (2002) The glial precursor proteoglycan, NG2, is
expressed on tumour neovasculature by vascular pericytes in human malignant brain tumours.
Neuropathology and applied neurobiology, 28, 367-380.
8. Rath, B.H., Fair, J.M., Jamal, M., Camphausen, K. and Tofilon, P.J. (2013) Astrocytes enhance
the invasion potential of glioblastoma stem-like cells. PloS one, 8, e54752.
9. Hussain, S.F., Yang, D., Suki, D., Aldape, K., Grimm, E. and Heimberger, A.B. (2006) The role of
human glioma-infiltrating microglia/macrophages in mediating antitumor immune responses.
Neuro-oncology, 8, 261-279.
10. Calabrese, C., Poppleton, H., Kocak, M., Hogg, T.L., Fuller, C., Hamner, B., Oh, E.Y., Gaber,
M.W., Finklestein, D., Allen, M. et al. (2007) A perivascular niche for brain tumor stem cells.
Cancer cell, 11, 69-82.
- 100 -
11. Eyler, C.E., Wu, Q., Yan, K., MacSwords, J.M., Chandler-Militello, D., Misuraca, K.L., Lathia,
J.D., Forrester, M.T., Lee, J., Stamler, J.S. et al. (2011) Glioma stem cell proliferation and tumor
growth are promoted by nitric oxide synthase-2. Cell, 146, 53-66.
12. Charalambous, C., Hofman, F.M. and Chen, T.C. (2005) Functional and phenotypic differences
between glioblastoma multiforme-derived and normal human brain endothelial cells. Journal of
neurosurgery, 102, 699-705.
13. Rao, S., Sengupta, R., Choe, E.J., Woerner, B.M., Jackson, E., Sun, T., Leonard, J., Piwnica-
Worms, D. and Rubin, J.B. (2012) CXCL12 mediates trophic interactions between endothelial
and tumor cells in glioblastoma. PloS one, 7, e33005.
14. Xu, C.P., Zhang, H.R., Chen, F.L., Yao, X.H., Liang, Z.Q., Zhang, R., Cui, Y., Qian, C. and Bian,
X.W. (2010) Human malignant glioma cells expressing functional formylpeptide receptor recruit
endothelial progenitor cells for neovascularization. International immunopharmacology, 10,
1602-1607.
15. Bao, S., Wu, Q., Sathornsumetee, S., Hao, Y., Li, Z., Hjelmeland, A.B., Shi, Q., McLendon, R.E.,
Bigner, D.D. and Rich, J.N. (2006) Stem cell-like glioma cells promote tumor angiogenesis
through vascular endothelial growth factor. Cancer research, 66, 7843-7848.
16. Vadala, G., Studer, R.K., Sowa, G., Spiezia, F., Iucu, C., Denaro, V., Gilbertson, L.G. and Kang,
J.D. (2008) Coculture of bone marrow mesenchymal stem cells and nucleus pulposus cells
modulate gene expression profile without cell fusion. Spine, 33, 870-876.
17. Lawler, J. (2002) Thrombospondin-1 as an endogenous inhibitor of angiogenesis and tumor
growth. Journal of cellular and molecular medicine, 6, 1-12.
18. Wu, T.C. (2007) The role of vascular cell adhesion molecule-1 in tumor immune evasion. Cancer
research, 67, 6003-6006.
19. Tang, K.H., Ma, S., Lee, T.K., Chan, Y.P., Kwan, P.S., Tong, C.M., Ng, I.O., Man, K., To, K.F.,
Lai, P.B. et al. (2012) CD133(+) liver tumor-initiating cells promote tumor angiogenesis,
growth, and self-renewal through neurotensin/interleukin-8/CXCL1 signaling. Hepatology, 55,
807-820.
20. Yamamoto, S., Nishimura, O., Misaki, K., Nishita, M., Minami, Y., Yonemura, S., Tarui, H. and
Sasaki, H. (2008) Cthrc1 selectively activates the planar cell polarity pathway of Wnt signaling
by stabilizing the Wnt-receptor complex. Developmental cell, 15, 23-36.
21. Zhang, Z., Schittenhelm, J., Guo, K., Buhring, H.J., Trautmann, K., Meyermann, R. and
Schluesener, H.J. (2006) Upregulation of frizzled 9 in astrocytomas. Neuropathology and applied
neurobiology, 32, 615-624.
22. Fodde, R. and Brabletz, T. (2007) Wnt/beta-catenin signaling in cancer stemness and malignant
behavior. Current opinion in cell biology, 19, 150-158.

- 101 -
23. Hetman, J.M., Soderling, S.H., Glavas, N.A. and Beavo, J.A. (2000) Cloning and characterization
of PDE7B, a cAMP-specific phosphodiesterase. Proceedings of the National Academy of
Sciences of the United States of America, 97, 472-476.
24. Warrington, N.M., Gianino, S.M., Jackson, E., Goldhoff, P., Garbow, J.R., Piwnica-Worms, D.,
Gutmann, D.H. and Rubin, J.B. (2010) Cyclic AMP suppression is sufficient to induce
gliomagenesis in a mouse model of neurofibromatosis-1. Cancer research, 70, 5717-5727.
25. Goldhoff, P., Warrington, N.M., Limbrick, D.D., Jr., Hope, A., Woerner, B.M., Jackson, E.,
Perry, A., Piwnica-Worms, D. and Rubin, J.B. (2008) Targeted inhibition of cyclic AMP
phosphodiesterase-4 promotes brain tumor regression. Clinical cancer research : an official
journal of the American Association for Cancer Research, 14, 7717-7725.
26. Yue, X.S., Fujishiro, M., Nishioka, C., Arai, T., Takahashi, E., Gong, J.S., Akaike, T. and Ito, Y.
(2012) Feeder cells support the culture of induced pluripotent stem cells even after chemical
fixation. PloS one, 7, e32707.
27. Baillie, G.S., Sood, A., McPhee, I., Gall, I., Perry, S.J., Lefkowitz, R.J. and Houslay, M.D. (2003)
beta-Arrestin-mediated PDE4 cAMP phosphodiesterase recruitment regulates beta-adrenoceptor
switching from Gs to Gi. Proceedings of the National Academy of Sciences of the United States of
America, 100, 940-945.
28. Zhao, Y., Xiao, A., diPierro, C.G., Carpenter, J.E., Abdel-Fattah, R., Redpath, G.T., Lopes, M.B.
and Hussaini, I.M. (2010) An extensive invasive intracranial human glioblastoma xenograft
model: role of high level matrix metalloproteinase 9. The American journal of pathology, 176,
3032-3049.
29. Zhu, T.S., Costello, M.A., Talsma, C.E., Flack, C.G., Crowley, J.G., Hamm, L.L., He, X., Hervey-
Jumper, S.L., Heth, J.A., Muraszko, K.M. et al. (2011) Endothelial cells create a stem cell niche
in glioblastoma by providing NOTCH ligands that nurture self-renewal of cancer stem-like cells.
Cancer research, 71, 6061-6072.
30. Keunen, O., Johansson, M., Oudin, A., Sanzey, M., Rahim, S.A., Fack, F., Thorsen, F., Taxt, T.,
Bartos, M., Jirik, R. et al. (2011) Anti-VEGF treatment reduces blood supply and increases tumor
cell invasion in glioblastoma. Proceedings of the National Academy of Sciences of the United
States of America, 108, 3749-3754.
31. Delort, L., Lequeux, C., Dubois, V., Dubouloz, A., Billard, H., Mojallal, A., Damour, O., Vasson,
M.P. and Caldefie-Chezet, F. (2013) Reciprocal interactions between breast tumor and its
adipose microenvironment based on a 3D adipose equivalent model. PloS one, 8, e66284.
32. Yang, L., Jackson, E., Woerner, B.M., Perry, A., Piwnica-Worms, D. and Rubin, J.B. (2007)
Blocking CXCR4-mediated cyclic AMP suppression inhibits brain tumor growth in vivo. Cancer
research, 67, 651-658.
33. Furman, M.A. and Shulman, K. (1977) Cyclic AMP and adenyl cyclase in brain tumors. Journal
of neurosurgery, 46, 477-483.
- 102 -
34. Stork, P.J. and Schmitt, J.M. (2002) Crosstalk between cAMP and MAP kinase signaling in the
regulation of cell proliferation. Trends in cell biology, 12, 258-266.
35. Prasad, K.N. and Kumar, S. (1975) Role of cyclic AMP in differentiation of human
neuroblastoma cells in culture. Cancer, 36, 1338-1343.
36. Houslay, M.D. (2010) Underpinning compartmentalised cAMP signalling through targeted
cAMP breakdown. Trends in biochemical sciences, 35, 91-100.
37. Conti, M. and Beavo, J. (2007) Biochemistry and physiology of cyclic nucleotide
phosphodiesterases: essential components in cyclic nucleotide signaling. Annual review of
biochemistry, 76, 481-511.
38. Ponsioen, B., Zhao, J., Riedl, J., Zwartkruis, F., van der Krogt, G., Zaccolo, M., Moolenaar,
W.H., Bos, J.L. and Jalink, K. (2004) Detecting cAMP-induced Epac activation by fluorescence
resonance energy transfer: Epac as a novel cAMP indicator. EMBO reports, 5, 1176-1180.
39. Bolger, G.B., Baillie, G.S., Li, X., Lynch, M.J., Herzyk, P., Mohamed, A., Mitchell, L.H.,
McCahill, A., Hundsrucker, C., Klussmann, E. et al. (2006) Scanning peptide array analyses
identify overlapping binding sites for the signalling scaffold proteins, beta-arrestin and RACK1,
in cAMP-specific phosphodiesterase PDE4D5. The Biochemical journal, 398, 23-36.
40. Perry, S.J., Baillie, G.S., Kohout, T.A., McPhee, I., Magiera, M.M., Ang, K.L., Miller, W.E.,
McLean, A.J., Conti, M., Houslay, M.D. et al. (2002) Targeting of cyclic AMP degradation to
beta 2-adrenergic receptors by beta-arrestins. Science, 298, 834-836.
41. Shakur, Y., Pryde, J.G. and Houslay, M.D. (1993) Engineered deletion of the unique N-terminal
domain of the cyclic AMP-specific phosphodiesterase RD1 prevents plasma membrane
association and the attainment of enhanced thermostability without altering its sensitivity to
inhibition by rolipram. The Biochemical journal, 292 ( Pt 3), 677-686.
42. Yarwood, S.J., Steele, M.R., Scotland, G., Houslay, M.D. and Bolger, G.B. (1999) The RACK1
signaling scaffold protein selectively interacts with the cAMP-specific phosphodiesterase
PDE4D5 isoform. The Journal of biological chemistry, 274, 14909-14917.
43. Mantamadiotis, T., Papalexis, N. and Dworkin, S. (2012) CREB signalling in neural
stem/progenitor cells: recent developments and the implications for brain tumour biology.
BioEssays : news and reviews in molecular, cellular and developmental biology, 34, 293-300.
44. Gonzalez-Garcia, C., Bravo, B., Ballester, A., Gomez-Perez, R., Eguiluz, C., Redondo, M.,
Martinez, A., Gil, C. and Ballester, S. (2013) Comparative assessment of phosphodiesterase 4
and 7 inhibitors as therapeutic agents in Experimental Autoimmune Encephalomyelitis. British
journal of pharmacology.
45. Safavi, M., Baeeri, M. and Abdollahi, M. (2013) New methods for the discovery and synthesis of
PDE7 inhibitors as new drugs for neurological and inflammatory disorders. Expert opinion on
drug discovery, 8, 733-751.

- 103 -
46. Pollard, S.M., Yoshikawa, K., Clarke, I.D., Danovi, D., Stricker, S., Russell, R., Bayani, J., Head,
R., Lee, M., Bernstein, M. et al. (2009) Glioma stem cell lines expanded in adherent culture have
tumor-specific phenotypes and are suitable for chemical and genetic screens. Cell stem cell, 4,
568-580.
47. Mitra, R.D., Butty, V.L., Shendure, J., Williams, B.R., Housman, D.E. and Church, G.M. (2003)
Digital genotyping and haplotyping with polymerase colonies. Proceedings of the National
Academy of Sciences of the United States of America, 100, 5926-5931.
48. Ding, S., Wu, X., Li, G., Han, M., Zhuang, Y. and Xu, T. (2005) Efficient transposition of the
piggyBac (PB) transposon in mammalian cells and mice. Cell, 122, 473-483.
49. Hu, Y. and Smyth, G.K. (2009) ELDA: extreme limiting dilution analysis for comparing depleted
and enriched populations in stem cell and other assays. Journal of immunological methods, 347,
70-78.
50. Warrington, N.M., Woerner, B.M., Daginakatte, G.C., Dasgupta, B., Perry, A., Gutmann, D.H.
and Rubin, J.B. (2007) Spatiotemporal differences in CXCL12 expression and cyclic AMP
underlie the unique pattern of optic glioma growth in neurofibromatosis type 1. Cancer research,
67, 8588-8595.

- 104 -
Chapter 5: Conclusions and Future Directions

- 105 -
The amount of research done at the interface between cancer biology and computational biology
is only going to increase in the foreseeable future. Certainly cancer research shows no signs of
slowing down. Since the war on cancer began in the 1970s, we’ve made good progress in
treating certain types of cancer while other types have had no significant advances (1). So there
is certainly plenty of work left to do. At the same time, computers are getting faster and faster,
with Moore’s law (2), the theory that computer speed (i.e. the number of transitors per CPU)
doubles approximately every 2 years having been true since it was published in 1965, and
showing no signs of slowing down. This combined with the fact that next-gen sequencing data is
becoming so popular that its rate of generation is outpacing Moore’s law, therefore making the
bottle neck in analyzing the data the computational power available (3) (4).
The amazing power that next-generation sequencing will bring to cancer biology will
revolutionize cancer to an extent which would have been hard to imagine even just a few years
ago. In the not-too-distant future there will be thousands of matched cancer-normal genomes
sequenced for all of the most common cancer types. This will give unprecedented power to
researchers. Knowledge of the spectrum of mutations and transcriptional profiles present will
allow refinement of the molecular subtypes of cancers. Many of which were once thought to be
the same disease, or at best distinguished only by pathology, and now known to be distinct types.
This process has already been done for some cancers such as glioblastoma (5) and
medulloblastoma (6). In the meantime, pharmaceutical and biotech companies will develop a
new generation of drugs and therapies for specific driver mutations. Patients, upon initial
diagnosis, will have a platform of sequencing done including whole genome, exome, and

- 106 -
transcriptional analysis to better determine which cocktail of drugs will best treat those
mutations.
Next-gen sequencing will also have implications for basic cancer biology research. Studying the
epigenetics of cancer biology, including changes to methylation, histone modification,
transcription etc, is a huge field. The manipulation of cancer cells and determination of the
changes to these biological processes is a fundamental part of cancer research and as sequencing
becomes cheaper, it will become common to switch out qRT-PCR, methylation specifc PCR, and
other low throughput assays in favor of RNA-Seq, Chip-Seq, RBBS, and other high-throughput
techniques to get as much information as possible.
Our assay sought to apply computational methods to the fundamental question of, “What are the
reciprocal interactions between glioblastoma cancer cells and endothelial cells?”. Since we were
primarily interested in quantifying changes in transcriptional levels, RNA-Seq was unnecessary,
and microarrays were an ideal alternative. As mentioned earlier, not only is the glioblastoma
tumor microenvironment a complex mixture of many different cell types, but each other tumor
type has a unique combination of cells present. So our assay serves as a prototype system for
looking at other combinations of cell types in coculture, both in glioblastoma and other cancers.
However, there are a number of minor improvements which could be made to improve the
system. Future experiments could increase the number of cell types from 2 to 3 or 4. Each
progressive cell type addition would complicate the analysis and diminish the power to detect
changes, so the limit to the number of cell types would need to be determined empirically, but

- 107 -
each progressive addition of a cell type would make the system more and more suitable as a
model for their in vivo counterparts. Another improvement would be switching to RNA-Seq
instead of using microarrays. This would allow detection of not only the quantification of each
transcript in general, but also changes in alternative splicing, allelic expression, and expression
of rare gene-fusion products. The deconvolution used on the microarrays could just as easily be
applied to RNA-Seq data, though each library might need to be sequenced to a higher depth than
a traditional RNA-Seq library to allow for as many genes as possible to show expression above
background and therefore be used in determination of the computationally mixed dataset.
Finally, another option that was considered, but ultimately passed up in favor of using
computational deconvolution, would be using a coculture of mouse and human cell types. RNA-
Seq would be required to analyze this dataset, since there are no hybrid human-mouse
microarrays, but RNA-Seq analysis can determine the difference between a read from a human
transcript versus a mouse transcript when there are SNPs which differ between the two species
(7,8). Again, larger than normal datasets would be needed since reads that contained no human-
mouse SNPs would be ambiguous and therefore wouldn’t really provide significantly to the
analysis, but this technique would have the advantage of not needing further experimentation to
determine which cell type any gene expression changes had occurred in. The analysis would
automatically differentiate between human derived changes and mouse derived changes.
Our analysis discovered a number of differentially expressed pathways, including those which
we expected like proliferation and angiogenesis, and those which were relatively unexpected
such as PDE7B, which we chose to focus on for further experiments. PDE7B is a
phosphodiesterase which specifically cleaves cyclic adenosine monophosphate (cAMP) into a

- 108 -
non-active, non-cyclic form. cAMP is a ubiquitous intracellular signaling molecule, found all
the way down to bacteria and can affect a large number of cellular processes including cell
proliferation and stemness (9). cAMP has been well established as an important mediator of
brain tumor biology (10) (11,12). Protein Kinase A (PKA) is the main downstream signaling
molecular through which cAMP can affect gene expression, and EPAC1 is another important
signaling molecule directly influenced by levels of cAMP. One of the main ways in which
cAMP is regulated is through very specific subcellular concentration gradients. cAMP is
synthesized at the plasma membrane by g-coupled protein receptors which activate adenyl
cyclases, which convert AMP into cAMP (13). This cAMP then diffuses throughout the
cytoplasm. Its degradation, on the other hand, is mediated by phosphodiesterases, such as
PDE7B, which have very specific subcellular localizations. These PDEs can cause local levels
of cAMP to drop dramatically and can overcome the rate of cAMP diffusion to create strong
gradients (14).
So while the specific mechanism of PDE7B is yet to be uncovered, it is easy to create a model
where surface contact by a glioblastoma cell with an endothelial cell causes the glioblastoma cell
to change a number of pathways, including the upregulation of PDE7B. This leads to even lower
levels of cAMP in some critical subcellular compartment, leading to less PKA activation and
changes in some downstream signaling cascade resulting in increased growth and tumorigenesis.
There are a number of future experiments to help elucidate the full function of PDE7B. Given a
large amount of time I would start on the outside of the glioblastoma cell and work in. Meaning,
- 109 -
I would first try to figure out what is on the endothelial cell that mediates PDE7B upregulation.
There are some obvious candidate molecules I would focus on, such as integrins associated with
tumor:endothelial interactions like αVβ3 (15) . Integrin αVβ3 binds to vitronectin (16) which has
been shown to be important in glioma cell migration (17). Another possible integrin is α4β1
which has been shown to interact with vascular cell adhesion molecular 1 (VCAM1), an
important cell adhesion molecular on endothelial cells (18). By knocking these factors out
individually it should be possible to see which one, if any, is required for the upregulation of
PDE7B in glioma cells. Depending on ligand is important on the surface of the glioma cell, it
might be possible to make an educated guess about the downstream pathway, but perhaps more
importantly would be skipping ahead to looking at the specific subcellular localization of
PDE7B. This could easily be done with immunofluorescent microscopy using labeled antibodies
to PDE7B. Once determined, the importance of that subcellular localization could be ascertained
by first knocking down, or out, PDE7B, and then introducing various PDE7B constructs with
mislocalization domains which would cause PDE7B to be localized to the plasma membrane,
golgi apparatus, or a number of other locations. Similar experiments have already been done
with PDE4 to determine the important of its subcellular localization (19) (20). The various
constructs could then be assayed for in vitro growth, in vivo growth, tumorigenesis, cancer stem
cells frequency, angiogenic potential, etc to determine the effect of different subcellular
localizations on PDE7B function. Another interesting set of experiments might be to look at any
synergistic effects between PDE7B and another phosphodiesterase called PDE4A1. It has been
previously shown that in the background of the tumor predisposition syndrome
neurofibromatosis type 1 (NF1), that overexpression of PDE4A1 is sufficient to drive
tumorigenesis (12). By overexpressing and knocking down both PDE7B and PDE4A1 in various

- 110 -
combinations it would be possible to tell if they work in concert to lower levels of cAMP and
drive tumorigenesis.
While there seem to be no current inhibitors of PDE7B that are only specific for it, there are a
number of inhibitors that have strong inhibition of PDE7B with only minor inhibition of other
PDEs (21). We believe that PDE7B is a prime candidate for future studies, in both basic cancer
biology and translational medicine. Hopefully inhibition of PDE7B can slow tumorigenesis and
provide yet another weapon in the fight against glioblastoma.
References
1. Misawa, H., Ohtsubo, M., Copeland, N.G., Gilbert, D.J., Jenkins, N.A. and Yoshimura, A. (1998) Cloning and characterization of a novel class II phosphoinositide 3-kinase containing C2 domain. Biochemical and biophysical research communications, 244, 531-539.
2. Moore, G.E. (1998) Cramming more components onto integrated circuits (Reprinted from Electronics, pg 114-117, April 19, 1965). P Ieee, 86, 82-85.
3. KA, W. 4. Mardis, E.R. (2010) The $1,000 genome, the $100,000 analysis? Genome medicine, 2, 84. 5. Verhaak, R.G., Hoadley, K.A., Purdom, E., Wang, V., Qi, Y., Wilkerson, M.D., Miller, C.R., Ding, L.,
Golub, T., Mesirov, J.P. et al. (2010) Integrated genomic analysis identifies clinically relevant subtypes of glioblastoma characterized by abnormalities in PDGFRA, IDH1, EGFR, and NF1. Cancer cell, 17, 98-110.
6. Northcott, P.A., Korshunov, A., Witt, H., Hielscher, T., Eberhart, C.G., Mack, S., Bouffet, E., Clifford, S.C., Hawkins, C.E., French, P. et al. (2011) Medulloblastoma comprises four distinct molecular variants. Journal of clinical oncology : official journal of the American Society of Clinical Oncology, 29, 1408-1414.
7. Koutsourakis, M., Langeveld, A., Patient, R., Beddington, R. and Grosveld, F. (1999) The transcription factor GATA6 is essential for early extraembryonic development. Development, 126, 723-732.
8. Koutsourakis, M., Langeveld, A., Patient, R., Beddington, R. and Grosveld, F. (1999) The transcription factor GATA6 is essential for early extraembryonic development. Development, 126, 723-732.
9. Meinkoth, J.L., Alberts, A.S., Went, W., Fantozzi, D., Taylor, S.S., Hagiwara, M., Montminy, M. and Feramisco, J.R. (1993) Signal transduction through the cAMP-dependent protein kinase. Molecular and cellular biochemistry, 127-128, 179-186.

- 111 -
10. Furman, M.A. and Shulman, K. (1977) Cyclic AMP and adenyl cyclase in brain tumors. Journal of neurosurgery, 46, 477-483.
11. Warrington, N.M., Woerner, B.M., Daginakatte, G.C., Dasgupta, B., Perry, A., Gutmann, D.H. and Rubin, J.B. (2007) Spatiotemporal differences in CXCL12 expression and cyclic AMP underlie the unique pattern of optic glioma growth in neurofibromatosis type 1. Cancer research, 67, 8588-8595.
12. Goldhoff, P., Warrington, N.M., Limbrick, D.D., Jr., Hope, A., Woerner, B.M., Jackson, E., Perry, A., Piwnica-Worms, D. and Rubin, J.B. (2008) Targeted inhibition of cyclic AMP phosphodiesterase-4 promotes brain tumor regression. Clinical cancer research : an official journal of the American Association for Cancer Research, 14, 7717-7725.
13. Tresguerres, M., Levin, L.R. and Buck, J. (2011) Intracellular cAMP signaling by soluble adenylyl cyclase. Kidney international, 79, 1277-1288.
14. Houslay, M.D. (2010) Underpinning compartmentalised cAMP signalling through targeted cAMP breakdown. Trends in biochemical sciences, 35, 91-100.
15. Koutsioumpa, M., Polytarchou, C., Courty, J., Zhang, Y., Kieffer, N., Mikelis, C., Skandalis, S.S., Hellman, U., Iliopoulos, D. and Papadimitriou, E. (2013) Interplay between alphavbeta3 integrin and nucleolin regulates human endothelial and glioma cell migration. The Journal of biological chemistry, 288, 343-354.
16. Charo, I.F., Nannizzi, L., Smith, J.W. and Cheresh, D.A. (1990) The vitronectin receptor alpha v beta 3 binds fibronectin and acts in concert with alpha 5 beta 1 in promoting cellular attachment and spreading on fibronectin. The Journal of cell biology, 111, 2795-2800.
17. Crick, F.H. (1958) On protein synthesis. Symposia of the Society for Experimental Biology, 12, 138-163.
18. Masumoto, A. and Hemler, M.E. (1993) Mutation of putative divalent cation sites in the alpha 4 subunit of the integrin VLA-4: distinct effects on adhesion to CS1/fibronectin, VCAM-1, and invasin. The Journal of cell biology, 123, 245-253.
19. Crick, F. (1970) Central dogma of molecular biology. Nature, 227, 561-563. 20. Alwine, J.C., Kemp, D.J. and Stark, G.R. (1977) Method for detection of specific RNAs in agarose
gels by transfer to diazobenzyloxymethyl-paper and hybridization with DNA probes. Proceedings of the National Academy of Sciences of the United States of America, 74, 5350-5354.
21. Safavi, M., Baeeri, M. and Abdollahi, M. (2013) New methods for the discovery and synthesis of PDE7 inhibitors as new drugs for neurological and inflammatory disorders. Expert opinion on drug discovery, 8, 733-751.