transboundary haze study e wg3 waste to resources
TRANSCRIPT
E TRANSBOUNDARY HAZE STUDY: WG3 WASTE TO RESOURCES
12 May 2016

Working Group Members
• Co-chair – Dr Ahmad Hazri Bin Abdul Rashid, SIRIM • Co-chair – PM Dr Haslenda Hashim, UTM • Members
– Dr. Lim Jeng Shiun, UTM – Dr. Tan Sie Ting, UTM – Dr. Ho Wai Shin, UTM – Prof Roda Jean Marc, UPM – Puvaneswari Ramasamy, MyBiomass – Dr. Laili Nordin, Independent Consultant – Ong Chu Lee @Candice, UPM – Brenna Chen, UPM

Content
• Introduction
• Biomass/Waste to Resources
• Case studies –Power and Ethanol
• Challenges and Policy Recommendations

INTRODUCTION • Objective of WG3
• Overall study outlook
• Biomass potential
• Biomass characteristic
WG3: Waste to Resources: Energy or Materials

Type of biomass
• Forest biomass
• Oil palm biomass
• Peat land biomass
Biomass conversion Pathway
• Thermal
• Biological
Technology Selection
• Biomass to Bioethanol
• Biomass to power
Case study Economic Assessment
• Financial feasibility for bioethanol & power generation from biomass
Address the Issue and Challenges
• Economic
• Policy
• Research
Objective : Propose conversion of forest and agricultural wastes into energy or materials to overcome the issue of transboundary haze
Objective and Study Outline

6
Value of Biomass
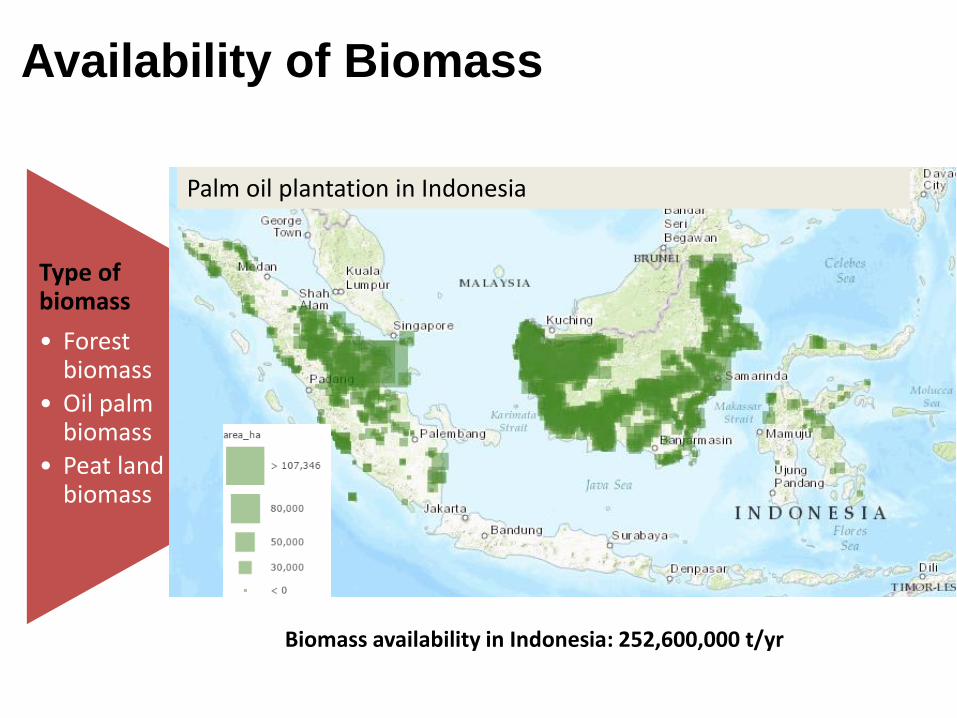
Availability of Biomass
Type of biomass
• Forest biomass
• Oil palm biomass
• Peat land biomass
Palm oil plantation in Indonesia
Biomass availability in Indonesia: 252,600,000 t/yr

Forest
biomass a
Oil Palm Plantation Biomass Empty Fruit Branch
(EFB) c, f Oil Palm Trunk b, c Oil Palm Frond d, e
Proximate analysis (wt% dry basis)
Moisture content n.a 8.34 16.00 4.68
Volatile matter n.a 79.82 83.50 76.85
Fixed carbon n.a 13.31 15.20 5.19
Ash 1.70 6.87 1.30 18.07
Ultimate analysis (wt% dry basis)
C 48.10 40.64 44.58 46.36
H 5.99 5.09 4.53 6.44
O 45.72 53.12 48.80 38.91
N n.a 2.15 0.71 2.18
S n.a n.a 0.07 0.92
Lignocellulosic content (wt% dry basis)
Cellulose 45.80 45.90 50.33 57.80
Hemicellulose 24.40 25.30 23.18 21.20
Lignin 28.00 18.10 21.7 22.80
HHV (MJ/kg) 15.00 17.27 17.28 20.54
Properties of Biomass
High cellulose contain Ethanol production

Forest
biomass a
Oil Palm Plantation Biomass Empty Fruit Branch
(EFB) c, f Oil Palm Trunk b, c Oil Palm Frond d, e
Proximate analysis (wt% dry basis)
Moisture content n.a 8.34 16.00 4.68
Volatile matter n.a 79.82 83.50 76.85
Fixed carbon n.a 13.31 15.20 5.19
Ash 1.70 6.87 1.30 18.07
Ultimate analysis (wt% dry basis)
C 48.10 40.64 44.58 46.36
H 5.99 5.09 4.53 6.44
O 45.72 53.12 48.80 38.91
N n.a 2.15 0.71 2.18
S n.a n.a 0.07 0.92
Lignocellulosic content (wt% dry basis)
Cellulose 45.80 45.90 50.33 57.80
Hemicellulose 24.40 25.30 23.18 21.20
Lignin 28.00 18.10 21.7 22.80
HHV (MJ/kg) 15.00 17.27 17.28 20.54
High HHV Power Production
Properties of Biomass

BIOMASS-TO-RESOURCES • Overall biomass conversion pathway
• Biomass-to-power technologies
• Biomass-to-ethanol technologies
WG3: Waste to Resources: Energy or Materials

Biomass-to-Resource Potential
Roadmap

Comparison of Biomass-to-Power
Conversion Technologies Technology Direct Combustion Gasification
Technical Aspect
Mature technology High commercial availability Larger capacity (300 – 1,000MW) High thermal efficiency: 60 – 85%
More recent; vulnerable to explosion Lower commercial availability Lower capacity (< 100MW) Lower thermal efficiency
2-stage combustion Need thermal input
Financial Aspect
Lower CAPEX USD 1 million/ MWe
Higher CAPEX USD 1.5 – 1.75 million/ MWe
*Direct Combustion is more favourable
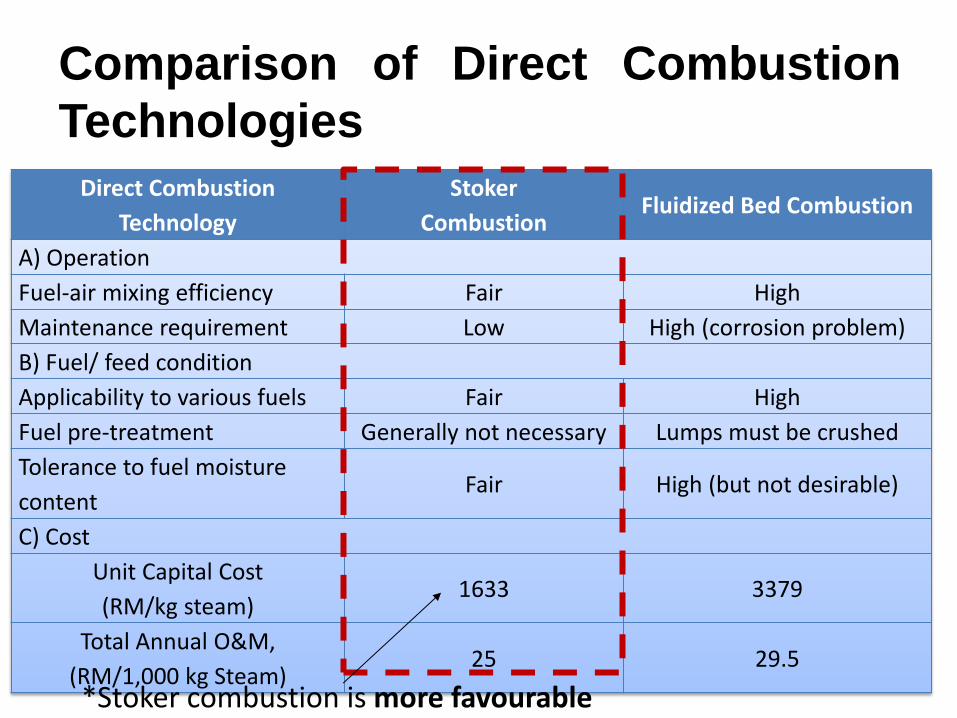
Comparison of Direct Combustion
Technologies
Direct Combustion
Technology
Stoker
Combustion Fluidized Bed Combustion
A) Operation
Fuel-air mixing efficiency Fair High
Maintenance requirement Low High (corrosion problem)
B) Fuel/ feed condition
Applicability to various fuels Fair High
Fuel pre-treatment Generally not necessary Lumps must be crushed
Tolerance to fuel moisture
content Fair High (but not desirable)
C) Cost
Unit Capital Cost
(RM/kg steam) 1633 3379
Total Annual O&M,
(RM/1,000 kg Steam) 25 29.5
*Stoker combustion is more favourable

Pre-Treatment: Break down Cellulose to Smaller Fiber
Physical
Chemical
Physicochemical
Biological
Oil Palm Frond
Forest Residue
Hydrolysis: Conversion of Biomass to
Ethanol
Enzymatic Reaction
Acidic Reaction
Separate Hydrolysis and Fermentation (SHF)
or Simultenuous Saccharification
Fermentation (SSF)
Continuous Distillation Column
Milling, Radiation, Electric Pulse, Pyrolysis
Alkaline hydrolysis, Acid, Organosolv, Ionic Liquid, Oxidation
Steam explosion, Ammonia Fiber Explosion, Supercritical CO2, Liquid Hot Water, Microwave, Ultrasound
Fungi, Actinomycetes
Biomass
Comparison of Biomass-to-Ethanol
Conversion Technologies

CASE STUDIES Financial Analysis of
• Biomass-to-Power
• Biomass-to-Ethanol
WG3: Waste to Resources: Energy or Materials

• Technology • direct combustion with 76% efficiency
• Feedstock • Biomass - calorific value of 15.82MJ/kg and 16% moisture content (dry
basis)
Input
Electricity
Heat
Biomass 2000t/d
236,520,000 kWh/y @ 27 MW
3,524,129 ton/y
Case study 1: Biomass-to-Power

• Costing information: • Mensilin
incineration plant
• Financing information • NRLE report
Parameters Unit Value Total Value
Process Information
Plant life 30 y
Efficiency 76%
Feedstock 2000 ton/d 730000 ton/y
Electricity Production 236,520,000 kwh/y
heat production 3,524,129 ton/y
Costing Information
Feedstock cost
Transportation costs 10 $/ton $ 7,300,000
Harvesting and collection cost 10 $/ton $ 7,300,000
Pre-processing cost 5 $/ton $ 3650000
Investment cost of boiler 900 $/kW $ 24,300,000
Investment cost turbine 1050 $/kW $ 28,350,000
Fixed capital 3000 $/kW $ 81,000,000.00
Variable cost $ 1,111,644.00
Operation cost 150 $/kW $ 4,050,000.00
Electricity price 0.07 $/kWh $ 16,556,400.00
Heat price (by-product) 12.65 $/ton $ 44,575,375
Case study 1: Biomass-to-Power

Parameters Unit Value Total Value
Financing information
Discount rate 4.1%
Plant depreciation DB 150%
Plant recovery period 20 y
Corporate tax rate 25%
Loan - terms loan APR 5.0%
Loan period 10 y
Construction period 3 y
Start-up time 3 month
Revenues during start-up 50%
Variable costs incurred
during start-up
75%
Fixed costs incurred
during start-up
100%
BNM Government
Securities Yield
4.0%
Case study 1: Biomass-to-Power

- Minimum electricity price: $ 0.23/kWh to $ 0.19/kWh
- Current FIT: $ 0.07/kWh.
Case study 1: Biomass-to-Power Breakeven Electricity Selling Price
0.05
0.07
0.09
0.11
0.13
0.15
0.17
0.19
0.21
0.23
0.25
5 10 20 30 40 50 60 70 80 90 100
Min
imu
m E
lect
rici
ty S
elli
ng
Pri
ce (
US$
/kW
h)
Equity Financing (%)
Breakeven Electricity Selling Price (US$/kWh)
1000t/d
2000t/dFIT: US$ 0.10/kW

Interest rate
Debt:Equity ratio 8% 5% 3%
70:30 0.32 0.22 0.16*
60:40 0.30 0.21 0.16 *
50:50 0.29 0.21 0.17 *
40:60 0.27 0.21 0.17 *
Case study 1: Biomass-to-Power
Production cost
* Modigliani and Miller’s with-tax model: As debt becomes even cheaper (due to the tax relief on interest payments), cost of debt falls significantly from Rd to Rd(1-Tc).

• Technology • Fermentation and hydrolysis
• Feedstock • Biomass with cellulose: 70%, C5 and C6 sugars: 95%
Input Bioethanol
Biomass 2000t/d
17,430,442 l/yr
Case study 2: Biomass-to-Ethanol

- Minimum ethanol price: $ 0.71 /l to $ 0.50/l
- Current market price : $ 0.58/l
Case study 2: Biomass-to-Ethanol Breakeven Ethanol Selling Price

• Compared local and US scenario
• Localised scenario has lower ethanol cost
Case study 2: Biomass-to-Ethanol Comparison between U.S and local scenario

Debt:Equity ratio Interest Rate
8% 5% 3%
95:5 0.77 0.61 0.52
70:30 0.73 0.60 0.53
60:40 0.71 (0.57a) 0.60 0.53
50:50 0.69 0.60 0.54
40:60 0.67 0.59 (0.52ᵇ) 0.54
Case study 2: Biomass-to-Ethanol
Production cost
ᵃUS NREL (2011) ᵇAdapted from US NREL analysis ***The retail market price: USD 0.58/litre
Ethanol Production Cost Reduction by Improving Debt: Equity (D:E) Ratio or Interest Rate (iR) (USD/Litre)

Ethanol (E-85) retailed at USD 2.39/gallon=
USD 0.58/litre [http://www.ethanolretailer.com/images/uploads/whitepaper_retailersurvey.pdf]
12 May 2016 26

CHALLENGES AND RECOMMENDATION • Current challenges in biomass-to-resources utilisation
• Policy recommendation
WG3: Waste to Resources: Energy or Materials

28
Investment Technology
Transportation network and
collection Social / cultural
Challenges for biomass-to-resources
utilisation

Securing Biomass
Supporting BioTech
Marketing BioProducts
Policy to ensure sustainable biomass can be obtained
• Identifying the type, location and amount of available biomass, fixed a stable pricing of biomass
Effort to improve bio technology (increase efficiency, reducing cost)
• Providing Fund for Bio-Tech improvement (R&D), provide tax exemption
Marketing biomass products • Identify suitable and marketable bio-
products
Policy Recommendation Government is recommended to take the economic approach for the settlers to slash not to burn but to earn additional income via promoting investment in biomass conversion technology

Key Success Factors
• Proposed economic approach is attractive to investors
• Creation of public-private partnership
• Sustainability of materials
• Cost of logistics not prohibitive
• Availability of the best technology
• Favourable regulatory environment

THANK YOU
WG3: Waste to Resources: Energy or Materials