transboundary air pollution by main pollutants (s, n, … data note 1/2005 date: august 2005...
TRANSCRIPT

MSC-W Data Note 1/2005Date: August 2005
METEOROLOGISK INSTITUTTNorwegian Meteorological Institute
Transboundary air pollution by mainpollutants (S, N, O3) and PM
The Russian Federation
EMEP/MSC-W: Heiko Klein, Peter Wind, Maarten van Loon
Data Note 2005
ISSN 0804-2446

2

Contents
1 Introduction 5
2 Definitions, statistics used 8
3 Emissions 10
4 Trends 11
5 Transboundary Fluxes in 2003 125.1 Oxidised sulphur deposition . . . . . . . . . . . . . . . . . . . . . . 125.2 Oxidised nitrogen deposition . . . . . . . . . . . . . . . . . . . . . . 135.3 Reduced nitrogen deposition . . . . . . . . . . . . . . . . . . . . . . 14
6 Transboundary ozone concentrations 156.1 AOT403m
f . . . . . . . . . . . . . . . . . . . . . . . . . . . . . . . . 156.2 SOMO35 – Risk of ozone damages in human health . . . . . . . . . . 16
7 Transboundary concentrations of particulate matter 17
8 Comparison with Observations 19
9 Risks from Ozone and PM in the Russian Federation in 2003 229.1 Ecosystem-specific AOT40 values . . . . . . . . . . . . . . . . . . . 229.2 Health impacts from Ozone and PM . . . . . . . . . . . . . . . . . . 229.3 Regional PM10 values . . . . . . . . . . . . . . . . . . . . . . . . . . 23
3

4

1 Introduction
This note is one of a series of country-specific reports, complementary to the EMEPStatus Report 1/2005. It presents overview information on transboundary pollution ofmain pollutants, ground level ozone and PM relevant for the Russian Federation.
The transboundary contributions are based on source-receptor calculations usingmeteorological and emission data for the year 2003. These source-receptor calcula-tions are based on the same version of the EMEP Unified Model as presented in themain report (rv 2.0.10).
Emissions The emissions for 2003 have been derived from the 2005 data submis-sions. The gridded distributions of 2003 emissions have been derived by scaling withrespect to gridded data distributions in year 2000 (Base 2000 V5). The gridded emis-sion data for 2003 will be available on http://webdab.emep.int in autumn2005.
Trends The deposition data used for trends derive from different model versions.
• 1980 - 2000: Model rv 1.6.11. Data used in 2003 for the EMEP AssessmentReport: http://www.emep.int/index_assessment.html
• 2001, 2002: Model rv 2.0beta. Data used for Country reports in 2004.
• 2003: Model rv 2.0.10. Data used throughout this report.
The emission data used for trends varies depending on the above mentioned modelversions.
Transboundary data The data for the maps, pie and bar charts is generated bysource-receptor calculations, where emissions for each emitter of one or more pre-cursors are reduced by 15%. For oxidised sulphur, oxidised nitrogen and reducednitrogen, the results have been scaled to present data corresponding to all emissionsfrom a emitter. Due to non-linear effects, this is not possible for the other components.
The pie charts for depositions and PM give a picture of the relative contributionsof the countries or regions to depositions over the Russian Federation.
For the O3 related indicators bar charts are used because in some cases the effect ofa reduction of emissions from a country can either increase or decrease O3 levels else-where. The values in the bar charts for ozone indicators show the six most importantcontributors to AOT40 and SOMO35 in the Russian Federation. Since the contribu-tions can be both positive or negative, the relative importance of the contributors hasbeen determined by comparing the absolute value of the contributions.
BIC as used here includes anyway compounds which have undergone importantchanges due to man-made emissions, such as NOx, CH4 and CO. When reducing SOx
”emissions” from BIC, the values of the boundary and initial conditions of both SO2
and SO4 are reduced. Similarly, for reducing NOx ”emissions” all compounds con-taining nitrogen oxidized are reduced and for reducing NH3 ”emissions” particulateammonium is reduced, since boundary and initial conditions for NH3 itself are zero.For NMVOC simply all boundary and initial conditions for the NMVOC species in the
5

model are reduced. Ozone is excluded from BIC for these runs because of its specialimportance and known high contribution to indices such as AOT40 and SOMO35.
To give more intuitive pictures on the effect of pollution from a given country, weuse positive scales for pollution reductions throughout this note.
Comparison with Observation The map of monitoring stations shows all stationsof the Russian Federation in the EMEP measurement network. Not all stations havemeasured data in 2003. The frequency analysis plot compare 2003 observation resultswith the model results. The measurement data is available from CCC: http://www.nilu.no/projects/ccc/emepdata.html.
Risks from Ozone and PM The maps with ozone and PM values correspond to re-gional background levels and they are not representative of local point measurements,where these values can be much higher (i.e. in cities).
6

Country Codes
Many tables and graphs in this report make use of codes to denote countries and regionsin the EMEP area. Table 1 provides an overview of these codes and lists the countriesand regions included in the present 2003 source-receptor calculations.
Code Country/Region Code Country/RegionAL Albania HR CroatiaAM Armenia HU HungaryASI Remaining Asian areas IE IrelandAT Austria IS IcelandATL Remaining N.E. Atlantic Ocean IT ItalyAZ Azerbaijan KZ KazakhstanBA Bosnia and Herzegovina LT LithuaniaBAS Baltic Sea LU LuxembourgBE Belgium LV LatviaBG Bulgaria MD Republic of MoldovaBIC Boundary and Initial Conditions MED Mediterranean SeaBLS Black Sea MK The FYR of MacedoniaBY Belarus MT MaltaCH Switzerland NAT Natural marine emissionsCS Serbia and Montenegro NL NetherlandsCY Cyprus NO NorwayCZ Czech Republic NOA North AfricaDE Germany NOS North SeaDK Denmark PL PolandEE Estonia PT PortugalEMC Land Areas RO RomaniaES Spain RU Russian FederationEU European Community SE SwedenFI Finland SI SloveniaFR France SK SlovakiaGB United Kingdom TR TurkeyGE Georgia UA UkraineGL Greenland VOL Volcanic emissionsGR Greece
Table 1: Country/Region codes used in the source-receptor calculations
Russian Federation means the part of the Russian Federation inside the EMEP domain of cal-culations. The same applies to the Remaining N.E. Atlantic region and natural marine emissionarea. North Africa and Asia refer to parts of them within the model domain. For North Africathis concerns parts of Morocco, Algeria, Tunisia, Libya and Egypt. With respect to Asia it in-cludes Syria, Lebanon, Israel, parts of Uzbekistan, Turkmenistan, Iran, Iraq and Jordan. TheEuropean Union includes Austria, Belgium, Denmark, Finland, France, Germany, Greece, Ire-land, Italy, Luxembourg, The Netherlands, Portugal, Spain, Sweden, United Kingdom, Cyprus,Czech Republic, Estonia, Hungary, Latvia, Lithuania, Malta, Poland, Slovakia and Slovenia.BIC is boundary and initial, excluding ozone.
7

2 Definitions, statistics used
The following definitions and acronyms are used throughout this note:
SIA denotes secondary inorganic aerosol and is defined as the sum of sulphate (SO2−4
),nitrate (NO−
3) and ammonium (NH+
4). In the Unified EMEP model SIA is cal-
culated as the sum: SIA= SO2−4
+ NO−
3(fine) + NO−
3(coarse) + NH+
4
PPM denotes primary particulate matter, originating directly from anthropogenic emis-sions. It is usually distinguished between fine primary particulate matter, PPM2.5
with aerosol diameters below 2.5 µm and coarse primary particulate matter,PPMco with aerosol diameters between 2.5µm and 10µm.
PM2.5 denotes fine particulate matter, defined as the integrated mass of aerosol withdiameter up to 2.5 µm. In the Unified EMEP model PM2.5 is calculated as thesum: PM2.5 = SO2−
4+ NO−
3(fine) + NH+
4+ PPM2.5
PM10 denotes particulate matter, defined as the integrated mass of aerosol with diam-eter up to 10 µm. In the Unified EMEP model PM10 is calculated as the sum:PM10 = PM2.5 + NO−
3(coarse) + PPMco
SOMO35 - The Sum of Ozone Means Over 35 ppb is the new indicator for health impactassessment recommended by WHO. It is defined as the yearly sum of the dailymaximum of 8-hour running average over 35 ppb. For each day the maximumof the running 8-hours average for O3 is selected and the values over 35 ppb aresummed over the whole year.
If we let Ad8 denote the maximum 8-hourly average ozone on day d, during a
year with Ny days (Ny = 365 or 366), then SOMO35 can be defined as:
SOMO35 =∑d=Ny
d=1max
(
Ad8 − 35 ppb, 0.0
)
where the max function ensures that only Ad8 values exceeding 35 ppb are in-
cluded. The corresponding unit is ppb·days (abbreviated also as ppb·d).
AOT40 - the accumulated amount of ozone over the threshold value of 40 ppb, i.e..
AOT40 =∫
max(O3 − 40 ppb, 0.0) dt
where the max function ensures that only ozone values exceeding 40 ppb areincluded. The integral is taken over time, namely the relevant growing seasonfor the vegetation concerned, and for daytime only. The corresponding unit areppb·hours (abbreviated to ppb·h).
Although the EMEP model now generates a number of AOT-related outputs,these country reports present results for three “practical” definitions:
8

AOT403mf - AOT40 calculated over April-September from O3 concentrations
at 3 m height. This AOT40 is close to that derived from measurements.(Technically, the 3 m is above the displacement height, and so close to thetop of a forest canopy, but well above a crop canopy).
AOT40ucf - AOT40 calculated for forests using estimates of O3 at forest-top
(uc: upper-canopy). This AOT40 is that defined for forests by the UNECEMapping Manual, but using a default growing season of April-September.
AOT40ucc - AOT40 calculated for agricultural crops using estimates of O3 at the
top of the crop. This AOT40 is close to that defined for agricultural cropsby the UNECE Mapping Manual, but using a default growing season ofMay-July, and a default crop-height of 1 m.
9

3 Emissions
Figure 1: Spatial distribution of emissions from the Russian Federation in 2003.
10

4 Trends1980 1985 1990 1995 1996 1997 1998 1999 2000 2001 2002 2003
SOx 7324 6351 4671 2969 2774 2524 2275 2062 1997 2031 2130 2130NOx 1734 1903 3600 2570 2467 2379 2488 2494 2357 2462 2566 2566NH3 1189 1239 1191 824 749 730 675 657 650 625 600 600NMVOC 2843 2496 3668 2857 2622 2386 2376 2451 2450 2614 2777 2777CO 13385 13981 13196 9846 9307 10229 10279 10804 10811 11164 11517 11517PM2.5 876 876 876 876 876
Table 2: Emissions from the Russian Federation for different years. Units: Gg.
1980 1985 1990 1995 1996 1997 1998 1999 2000 2001 2002 2003
S dep. 4018 3649 3479 1922 1613 1650 1613 1418 1331 1345 1372 1347oxN dep. 720 775 1161 759 647 719 740 713 688 652 675 695redN dep. 1047 1124 1203 836 704 807 769 724 768 607 570 576
Table 3: Estimated deposition of Sulphur(S) and Nitrogen(N) in the Russian Federation in2003. Units: Gg(S) or Gg(N).
Figure 2: Trends in emissions and depositions of oxidised sulphur and the sum of oxidised andreduced nitrogen. Units: Gg(S) or Gg (N).
Figure 3: Trends in emissions of photo-oxidant pollution precursors. Units: Gg (note then thatNOx is here as NO2). 11

5 Transboundary Fluxes in 2003
5.1 Oxidised sulphur deposition
Figure 4: Contribution of emissions from the Russian Federation to oxidised sulphurdeposition in the EMEP domain. Units: mg(S)/m2. The pie chart shows the six mainreceptor areas of oxidised sulphur deposition from the Russian Federation. Units: (%).
Figure 5: Oxidised sulphur deposition in the Russian Federation from: all countries(top left figure). Units: mg(S)/m2. The pie chart shows the six main contributors tooxidised sulphur deposition in the Russian Federation. Units: (%). Fraction of sulphurdeposition from indigenous deposition (lower left); and from others, transboundarycontribution (lower right). Units: (%)
12

5.2 Oxidised nitrogen deposition
Figure 6: Contribution of emissions from the Russian Federation to oxidised nitrogendeposition in the EMEP domain. Units: mg(N)/m2. The pie chart shows the six mainreceptor areas of oxidised nitrogen deposition from the Russian Federation. Units:(%).
Figure 7: Oxidised nitrogen deposition in the Russian Federation from: all countries(top left figure). Units: mg(N)/m2. The pie chart shows the six main contributorsto oxidised nitrogen deposition in the Russian Federation. Units: (%). Fraction ofoxidised nitrogen deposition from indigenous deposition (lower left); and from others,transboundary contribution (lower right). Units: (%)
13

5.3 Reduced nitrogen deposition
Figure 8: Contribution of emissions from the Russian Federation to reduced nitrogendeposition in the EMEP domain. Units: mg(N)/m2. The pie chart shows the six mainreceptor areas of reduced nitrogen deposition from the Russian Federation. Units: (%).
Figure 9: Reduced nitrogen deposition in the Russian Federation from: all countries(top left figure). Units: mg(N)/m2. The pie chart shows the six main contributorsto reduced nitrogen deposition in the Russian Federation. Units: (%). Fraction ofreduced nitrogen deposition from indigenous deposition (lower left); and from others,transboundary contribution (lower right). Units: (%)
14

6 Transboundary ozone concentrations
6.1 AOT403mf
Figure 10: Change in AOT403mf due to 15% change in NOx(left) and NMVOC (right)
emission reductions from the Russian Federation. Units: ppb·h
Figure 11: Six most important contributors to AOT403mf in the Russian Federation by
NOx(left) and NMVOC (right) emission changes (15% reduction). Units: (%)
Figure 12: Change in AOT403mf due to 15% change in NOx (left) and NMVOC emis-
sion reductions (right) from others, transboundary contribution. Units: ppb·h
15

6.2 SOMO35 – Risk of ozone damages in human health
Figure 13: Change in SOMO35 due to 15% change in NOx(left) and NMVOC (right)emission reductions from the Russian Federation. Units: ppb·day
Figure 14: Six most important contributors to SOMO35 in the Russian Federation byNOx(left) and NMVOC (right) emissions (15% reduction)
Figure 15: Change in SOMO35 due to 15% change in NOx (left) and NMVOC emis-sion reductions (right) from others, transboundary contribution. Units: ppb·day
16

7 Transboundary concentrations of particulate matter
Figure 16: Changes in SIA and PPM2.5 concentrations due to 15% emission reductionfrom the Russian Federation. Units: µg/m3
Figure 17: Main contributors to SIA (left) and PPM2.5 (right) concentrations in theRussian Federation. Units: (%)
Figure 18: Changes in SIA and PPM2.5 concentrations in the Russian Federation dueto 15% emission reductions from other countries, transboundary contribution. Units:(%)
17
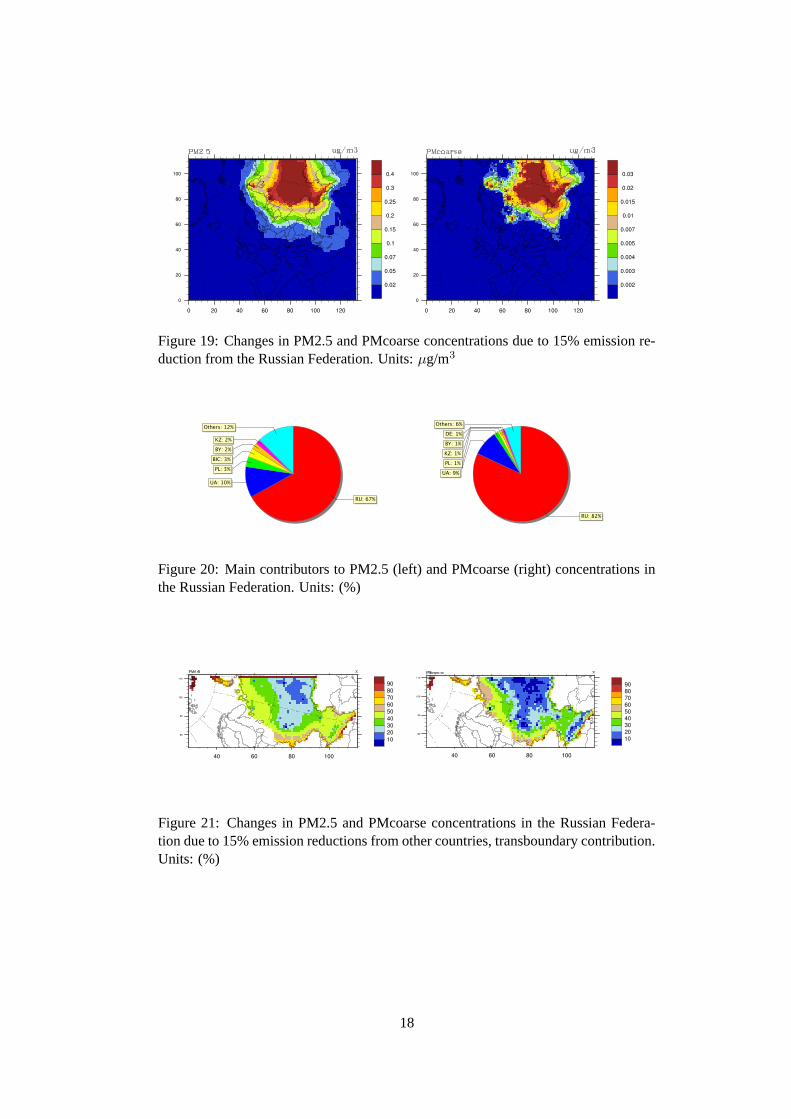
Figure 19: Changes in PM2.5 and PMcoarse concentrations due to 15% emission re-duction from the Russian Federation. Units: µg/m3
Figure 20: Main contributors to PM2.5 (left) and PMcoarse (right) concentrations inthe Russian Federation. Units: (%)
Figure 21: Changes in PM2.5 and PMcoarse concentrations in the Russian Federa-tion due to 15% emission reductions from other countries, transboundary contribution.Units: (%)
18

8 Comparison with Observations
Figure 22: Location of stations in the Russian Federation
Figure 23: Frequency analysis of ozone in the Russian Federation at the stations thatreported O3 in 2003 (Model, Observations)
19

Figure 24: Frequency analysis of depositions in precipitation in the Russian Federation(Model, Observations)
20

Figure 25: Frequency analysis of air concentrations in the Russian Federation (Model,Observations)
21
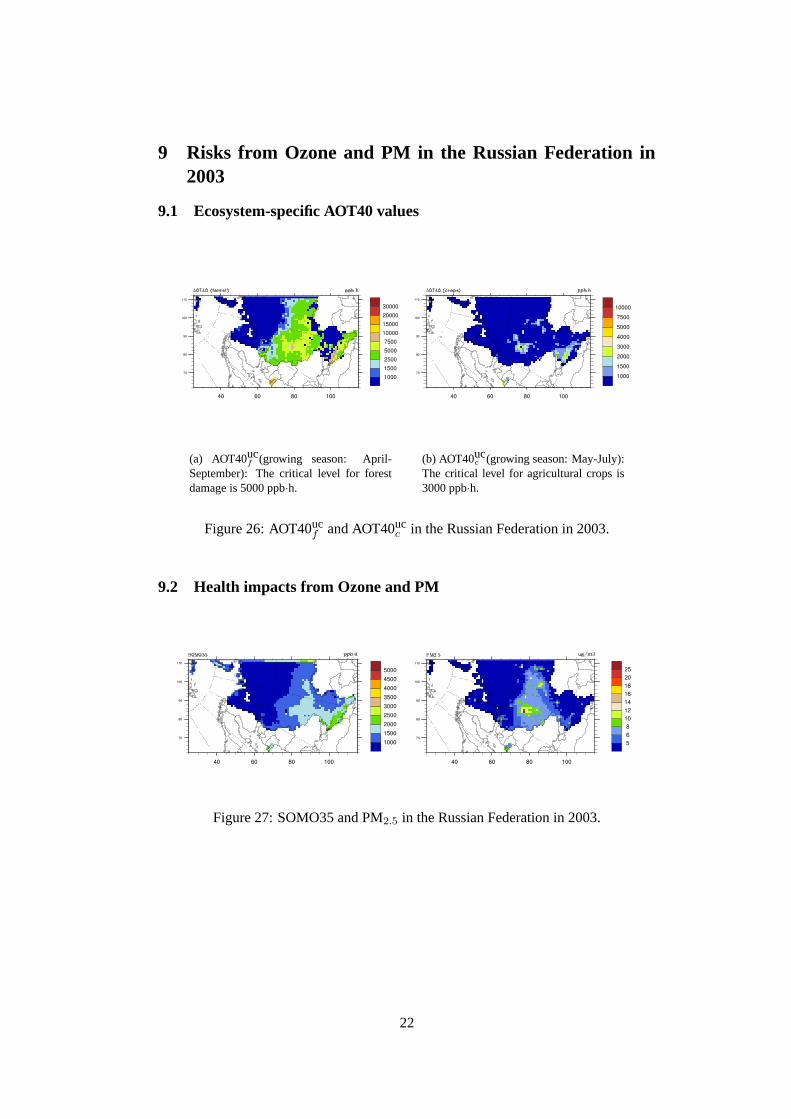
9 Risks from Ozone and PM in the Russian Federation in2003
9.1 Ecosystem-specific AOT40 values
(a) AOT40ucf (growing season: April-
September): The critical level for forestdamage is 5000 ppb·h.
(b) AOT40ucc (growing season: May-July):
The critical level for agricultural crops is3000 ppb·h.
Figure 26: AOT40ucf and AOT40uc
c in the Russian Federation in 2003.
9.2 Health impacts from Ozone and PM
Figure 27: SOMO35 and PM2.5 in the Russian Federation in 2003.
22

9.3 Regional PM10 values
(a) Daily mean of PM10: The EU limit leveis 40µg/m3.
(b) Days with PM10 > 50µg/m3. The EUlimit number is 35 days.
Figure 28: PM10 in the Russian Federation in 2003
23