trajectory oriented and fault tolerant based intelligent ... · trajectory oriented and fault...
TRANSCRIPT
February 2004 • NREL/SR-520-35146
L. Simpson ITN Energy Systems, Inc. Littleton, Colorado
Trajectory Oriented and Fault Tolerant Based Intelligent Process Control for Flexible CIGS PV Module Manufacturing Phase 1 Final Technical Report March 2003
National Renewable Energy Laboratory 1617 Cole Boulevard Golden, Colorado 80401-3393 NREL is a U.S. Department of Energy Laboratory Operated by Midwest Research Institute • Battelle
Contract No. DE-AC36-99-GO10337
February 2004 • NREL/SR-520-35146
Trajectory Oriented and Fault Tolerant Based Intelligent Process Control for Flexible CIGS PV Module Manufacturing Phase 1 Final Technical Report March 2003
L. Simpson ITN Energy Systems, Inc. Littleton, Colorado
NREL Technical Monitor: R. L. Mitchell Prepared under Subcontract No. ZDO-2-30628-07
National Renewable Energy Laboratory 1617 Cole Boulevard Golden, Colorado 80401-3393 NREL is a U.S. Department of Energy Laboratory Operated by Midwest Research Institute • Battelle
Contract No. DE-AC36-99-GO10337

This publication was reproduced from the best available copy
Submitted by the subcontractor and received no editorial review at NREL NOTICE This report was prepared as an account of work sponsored by an agency of the United States government. Neither the United States government nor any agency thereof, nor any of their employees, makes any warranty, express or implied, or assumes any legal liability or responsibility for the accuracy, completeness, or usefulness of any information, apparatus, product, or process disclosed, or represents that its use would not infringe privately owned rights. Reference herein to any specific commercial product, process, or service by trade name, trademark, manufacturer, or otherwise does not necessarily constitute or imply its endorsement, recommendation, or favoring by the United States government or any agency thereof. The views and opinions of authors expressed herein do not necessarily state or reflect those of the United States government or any agency thereof.
Available electronically at http://www.osti.gov/bridge
Available for a processing fee to U.S. Department of Energy and its contractors, in paper, from:
U.S. Department of Energy Office of Scientific and Technical Information P.O. Box 62 Oak Ridge, TN 37831-0062 phone: 865.576.8401 fax: 865.576.5728 email: [email protected]
Available for sale to the public, in paper, from:
U.S. Department of Commerce National Technical Information Service 5285 Port Royal Road Springfield, VA 22161 phone: 800.553.6847 fax: 703.605.6900 email: [email protected] online ordering: http://www.ntis.gov/ordering.htm
Printed on paper containing at least 50% wastepaper, including 20% postconsumer waste
iii
Table of Contents Executive Summary........................................................................................................................................ 1
1. INTRODUCTION/BACKGROUND ..................................................................................................... 2
1.1. OVERVIEW OF CIGS MANUFACTURING ............................................................................... 2
2. Model Development ............................................................................................................................... 4
2.1. Physics-Based Model Development ............................................................................................... 4
2.1.1. CIGS ....................................................................................................................................... 4
2.1.2. Mo Modeling .......................................................................................................................... 6
2.2. Empirical Models............................................................................................................................ 6
2.3. Model-Based Process Control......................................................................................................... 7
3. Control Platform ..................................................................................................................................... 8
3.1. Data Input/Output ........................................................................................................................... 8
3.1.1. Data Collection ....................................................................................................................... 9
3.1.2. Protocols in Use .................................................................................................................... 10
3.1.3. Sensors .................................................................................................................................. 11
3.2. Models and Controllers................................................................................................................. 11
3.2.1. Model/Controller Architecture.............................................................................................. 12
3.3. Graphical User Interface ............................................................................................................... 12
3.3.1. Server Overview ................................................................................................................... 13
3.3.2. Client overview..................................................................................................................... 14
3.3.3. Controls................................................................................................................................. 14
4. Reliability: Fault Prevention and Fault Tolerance ................................................................................ 15
4.1. Background................................................................................................................................... 15
4.2. Systems and Implementation ........................................................................................................ 16
4.3. Maintenance Schedule .................................................................................................................. 18
5. Sensors.................................................................................................................................................. 19
5.1. Molybdenum................................................................................................................................. 19
5.2. CIGS ............................................................................................................................................. 21
5.2.1. Emissometer.......................................................................................................................... 21
5.2.2. Pyrometry.............................................................................................................................. 24
5.2.3. Atomic Absorption Spectroscopy Flux Monitors ................................................................. 25
5.2.4. NaF QCM ............................................................................................................................. 27
5.2.5. Se Flux .................................................................................................................................. 28
5.2.6. Film Properties...................................................................................................................... 28
5.2.7. Alternate Source Delivery Closed Loop Control .................................................................. 31
5.3. ITO................................................................................................................................................ 31
5.4. CdS ............................................................................................................................................... 32

1
Executive Summary ITN Energy Systems, Inc., and Global Solar Energy, Inc., with the assistance of NREL’s PV Manufacturing R&D program have continued the advancement of CIGS production technology through the development of trajectory oriented predictive/control models, fault tolerance control, control platform development, in-situ sensors, and process improvements. Modeling activities to date include the development of physics-based and empirical models for CIGS and physics-based Mo deposition processing; implementation of model-based control for CIGS processing, and application of predictive models to the construction of new evaporation sources. Model-based control is enabled through implementation of reduced or empirical models into a control platform. Reliability improvement activities include systematic development of fault prevention procedures (e.g. preventative maintenance schedules) and detection/reconfiguration of sensor and other hardware failures for the full range of CIGS PV production deposition processes. In-situ sensor development activities have resulted in improved control and indicate the potential for enhanced process status monitoring and control of all deposition processes. In spite of the short time since the program was initiated, substantial process improvements have been made, including significant improvement in CIGS uniformity, thickness control (e.g., 71% reduction in Cu variability), yield, and throughput.
2
1. INTRODUCTION/BACKGROUND Interest in thin film photovoltaics (PV) has expanded dramatically, but wide-scale commercial use remains limited by performance and cost. These factors are often interrelated and negatively impacted by the lack of reliable and accurate process control. ITN Energy Systems, Inc. (ITN) and Global Solar Energy, Inc. (GSE) are using a comprehensive and systematic program to integrate intelligent process control into the manufacture of flexible, lightweight copper indium gallium diselenide (CIGS) based PV modules. Process control has been a priority since the outset of this endeavor, enabling the development of a fully integrated CIGS module manufacturing facility in only four years. The PV Manufacturing R&D program aims to enable GSE/ITN to complete a fully integrated process control development program with models, control platform, and diagnostic tools (sensors) for intelligent processing of PV modules, with the ultimate goal of improving CIGS module performance, process throughput, and yield.
To capitalize on the potential cost reductions that thin film processing methods can provide for polycrystalline PV modules, every manufacturing step must be controlled at a level where quality and yield are maximized. Depending on the complexity and extent of fundamental scientific understanding of each process, the transition to large-scale manufacturing can be more difficult and costly than anticipated. A critical requirement is the development and implementation of diagnostic tools and associated predictive models that can quantitatively assess the relationship of processing conditions to product properties.
In general, diagnostic capabilities for manufacturing thin films are rudimentary, and manufacturers can only assess their product after module completion. Inadequate diagnostics and predictive models result in sub-optimal control and correspondingly lower quality and yield. For system failures, the most common strategy consists of sophisticated interlocking and alarm mechanisms to stop the process when a fault is detected. Process models are required for unanticipated process upsets, reactor variability/drift, and operation in unstable processing regimes where repeatability can be achieved only through dynamic feedback/feed-forward control. Similarly, in-situ, real-time process diagnostics development, (sensors) is also required since their use has been determined to improve process yield/quality and reduce module costs.
The essence of our PV Manufacturing R&D effort is to develop trajectory oriented and fault tolerance based intelligent process control using predictive physics-based process models and strategic process/film property sensors to significantly improve yield, throughput, and performance of flexible CIGS PV modules. Implementation of trajectory-oriented control consists of four tasks, specifically, development of mathematical relationships (models) between control variables and final product properties (system identification), reduction of models into computationally efficient form(s), establishment of optimum trajectories for film properties during deposition and implementation into a control platform. Fault tolerance activities include detection, location, and isolation of faults, and implementation of appropriate corrective actions that minimize faults from becoming critical failures. Diagnostic tool activities involve integration of existing and alternative sensors to increase reliability and/or provide process information. All effective model/sensor features will be incorporated into a robust control platform that will enable autonomous and continuous manufacturing with automatic data storage and presentation for operator monitoring.
1.1. OVERVIEW OF CIGS MANUFACTURING GSE’s production facility is fully equipped for manufacturing flexible, lightweight CIGS PV products. Key equipment includes: molybdenum back contact, large-area CIGS absorber layer, cadmium sulfide, and transparent conductive oxide deposition systems; fully automated laser scribing; module lamination, and PV product finishing equipment. Each production deposition system is capable of processing 12-in. wide 1000-ft. long polymer or stainless steel in an automated fashion. GSE’s present annual manufacturing capacity is 5 MW, with 2003 production anticipated to exceed 1 MW.
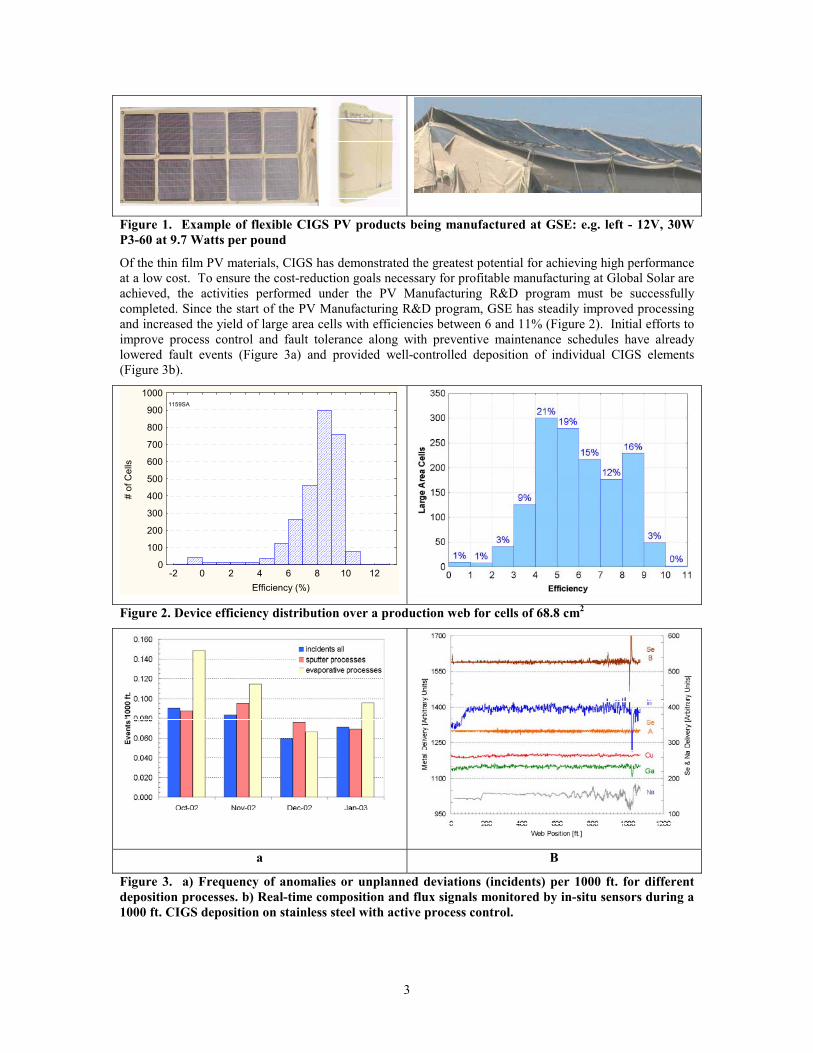
CIGS based PV is being sold to commercial and military customers who require flexible, lightweight, and high performance products. GSE’s Portable Power Packs (P3s) are examples of true foldable and rugged, portable, lightweight self-sustaining power sources (Figure 1). Standard P3s are available in a number of configurations for 12 and 24 V loads up to 56W at exceptional power/weight ratios of up to 12.1 W/lb. In addition, GSE’s intelligent product concept allows products to be made to customer specifications.
3
Figure 1. Example of flexible CIGS PV products being manufactured at GSE: e.g. left - 12V, 30W P3-60 at 9.7 Watts per pound
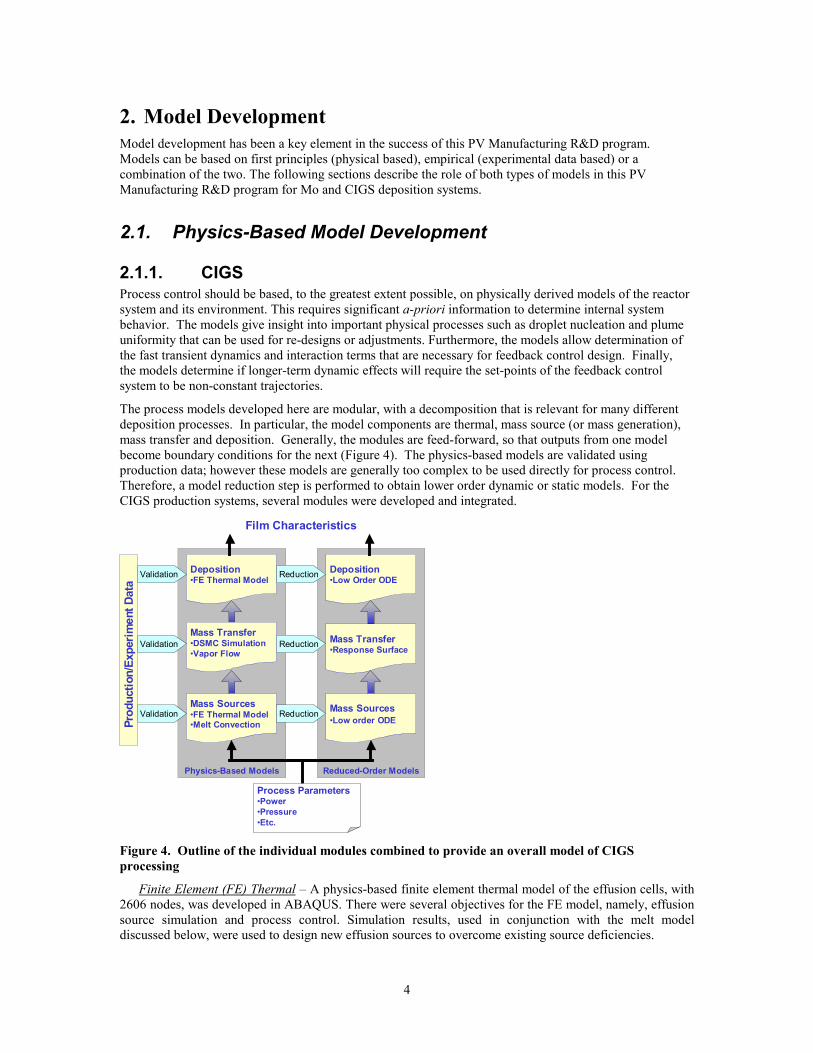
Of the thin film PV materials, CIGS has demonstrated the greatest potential for achieving high performance at a low cost. To ensure the cost-reduction goals necessary for profitable manufacturing at Global Solar are achieved, the activities performed under the PV Manufacturing R&D program must be successfully completed. Since the start of the PV Manufacturing R&D program, GSE has steadily improved processing and increased the yield of large area cells with efficiencies between 6 and 11% (Figure 2). Initial efforts to improve process control and fault tolerance along with preventive maintenance schedules have already lowered fault events (Figure 3a) and provided well-controlled deposition of individual CIGS elements (Figure 3b).
-2 0 2 4 6 8 10 12Efficiency (%)
0
100
200
300
400
500
600
700
800
900
1000
# of
Cel
ls
1159SA
Figure 2. Device efficiency distribution over a production web for cells of 68.8 cm2
a B
Figure 3. a) Frequency of anomalies or unplanned deviations (incidents) per 1000 ft. for different deposition processes. b) Real-time composition and flux signals monitored by in-situ sensors during a 1000 ft. CIGS deposition on stainless steel with active process control.
4
2. Model Development Model development has been a key element in the success of this PV Manufacturing R&D program. Models can be based on first principles (physical based), empirical (experimental data based) or a combination of the two. The following sections describe the role of both types of models in this PV Manufacturing R&D program for Mo and CIGS deposition systems.
2.1. Physics-Based Model Development
2.1.1. CIGS Process control should be based, to the greatest extent possible, on physically derived models of the reactor system and its environment. This requires significant a-priori information to determine internal system behavior. The models give insight into important physical processes such as droplet nucleation and plume uniformity that can be used for re-designs or adjustments. Furthermore, the models allow determination of the fast transient dynamics and interaction terms that are necessary for feedback control design. Finally, the models determine if longer-term dynamic effects will require the set-points of the feedback control system to be non-constant trajectories.
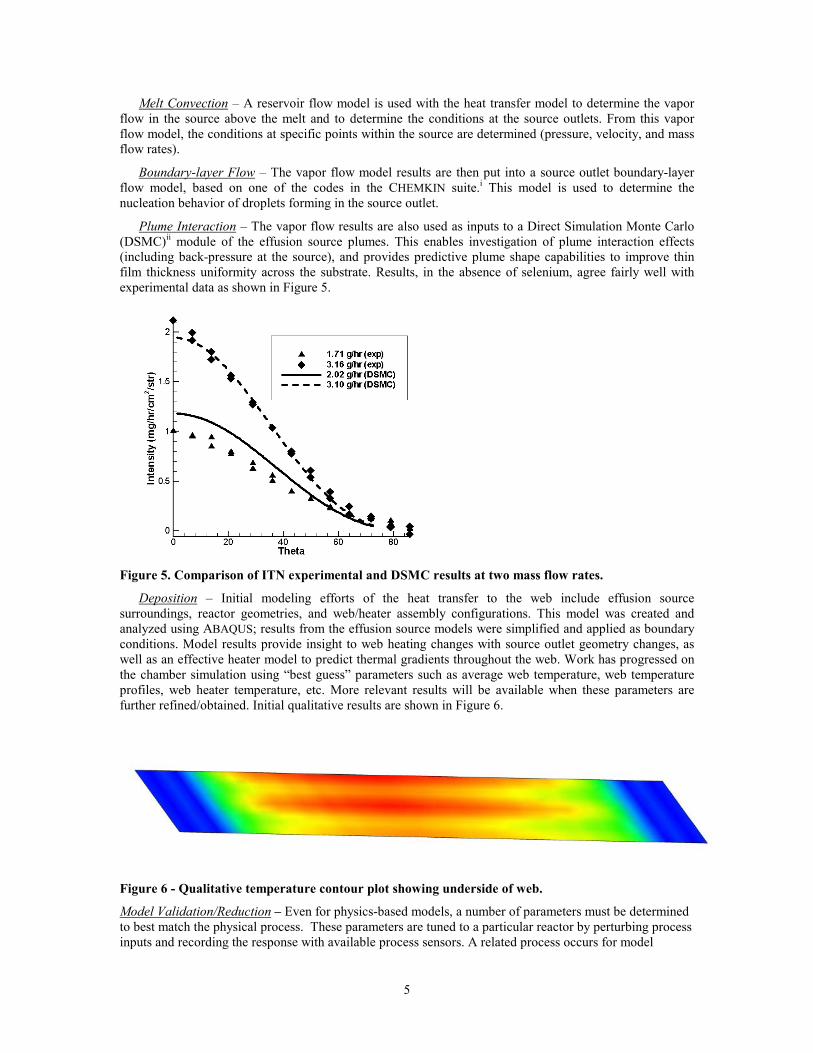
The process models developed here are modular, with a decomposition that is relevant for many different deposition processes. In particular, the model components are thermal, mass source (or mass generation), mass transfer and deposition. Generally, the modules are feed-forward, so that outputs from one model become boundary conditions for the next (Figure 4). The physics-based models are validated using production data; however these models are generally too complex to be used directly for process control. Therefore, a model reduction step is performed to obtain lower order dynamic or static models. For the CIGS production systems, several modules were developed and integrated.
Reduced-Order ModelsPhysics-Based Models
Mass Sources•FE Thermal Model•Melt Convection
Deposition•FE Thermal Model
Deposition•Low Order ODE
Mass Transfer•Response Surface
Mass Sources•Low order ODE
ReductionMass Transfer•DSMC Simulation•Vapor Flow
Reduction
ReductionValidation
Validation
Validation
Prod
uctio
n/Ex
perim
ent D
ata
Process Parameters•Power•Pressure•Etc.
Film Characteristics
Figure 4. Outline of the individual modules combined to provide an overall model of CIGS processing
Finite Element (FE) Thermal – A physics-based finite element thermal model of the effusion cells, with 2606 nodes, was developed in ABAQUS. There were several objectives for the FE model, namely, effusion source simulation and process control. Simulation results, used in conjunction with the melt model discussed below, were used to design new effusion sources to overcome existing source deficiencies.
5
Melt Convection – A reservoir flow model is used with the heat transfer model to determine the vapor flow in the source above the melt and to determine the conditions at the source outlets. From this vapor flow model, the conditions at specific points within the source are determined (pressure, velocity, and mass flow rates).
Boundary-layer Flow – The vapor flow model results are then put into a source outlet boundary-layer flow model, based on one of the codes in the CHEMKIN suite.i This model is used to determine the nucleation behavior of droplets forming in the source outlet.
Plume Interaction – The vapor flow results are also used as inputs to a Direct Simulation Monte Carlo (DSMC)ii module of the effusion source plumes. This enables investigation of plume interaction effects (including back-pressure at the source), and provides predictive plume shape capabilities to improve thin film thickness uniformity across the substrate. Results, in the absence of selenium, agree fairly well with experimental data as shown in Figure 5.
Figure 5. Comparison of ITN experimental and DSMC results at two mass flow rates.
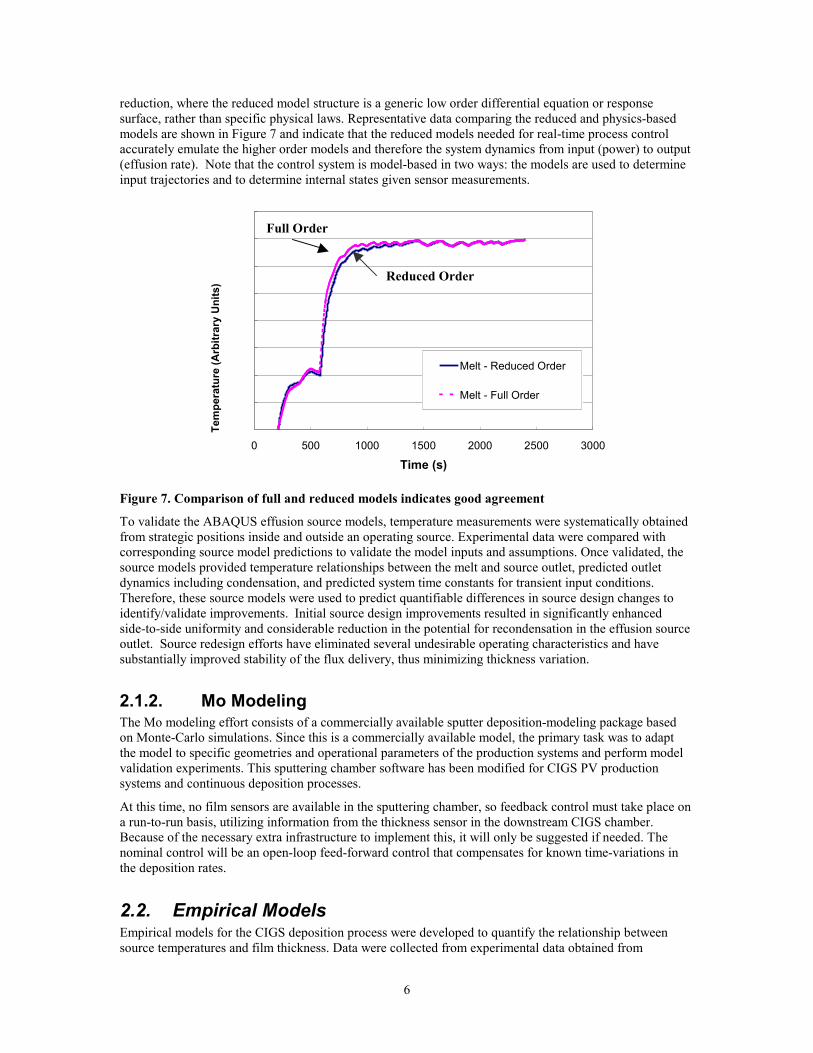
Deposition – Initial modeling efforts of the heat transfer to the web include effusion source surroundings, reactor geometries, and web/heater assembly configurations. This model was created and analyzed using ABAQUS; results from the effusion source models were simplified and applied as boundary conditions. Model results provide insight to web heating changes with source outlet geometry changes, as well as an effective heater model to predict thermal gradients throughout the web. Work has progressed on the chamber simulation using “best guess” parameters such as average web temperature, web temperature profiles, web heater temperature, etc. More relevant results will be available when these parameters are further refined/obtained. Initial qualitative results are shown in Figure 6.
Figure 6 - Qualitative temperature contour plot showing underside of web.
Model Validation/Reduction – Even for physics-based models, a number of parameters must be determined to best match the physical process. These parameters are tuned to a particular reactor by perturbing process inputs and recording the response with available process sensors. A related process occurs for model
6
reduction, where the reduced model structure is a generic low order differential equation or response surface, rather than specific physical laws. Representative data comparing the reduced and physics-based models are shown in Figure 7 and indicate that the reduced models needed for real-time process control accurately emulate the higher order models and therefore the system dynamics from input (power) to output (effusion rate). Note that the control system is model-based in two ways: the models are used to determine input trajectories and to determine internal states given sensor measurements.
800
900
1000
1100
1200
1300
1400
1500
1600
0 500 1000 1500 2000 2500 3000
Time (s)
Tem
pera
ture
(Cel
sius
)
Melt - Reduced Order
Melt - Full Order
Tem
pera
ture
(Arb
itrar
y U
nits
)
Figure 7. Comparison of full and reduced models indicates good agreement
To validate the ABAQUS effusion source models, temperature measurements were systematically obtained from strategic positions inside and outside an operating source. Experimental data were compared with corresponding source model predictions to validate the model inputs and assumptions. Once validated, the source models provided temperature relationships between the melt and source outlet, predicted outlet dynamics including condensation, and predicted system time constants for transient input conditions. Therefore, these source models were used to predict quantifiable differences in source design changes to identify/validate improvements. Initial source design improvements resulted in significantly enhanced side-to-side uniformity and considerable reduction in the potential for recondensation in the effusion source outlet. Source redesign efforts have eliminated several undesirable operating characteristics and have substantially improved stability of the flux delivery, thus minimizing thickness variation.
2.1.2. Mo Modeling The Mo modeling effort consists of a commercially available sputter deposition-modeling package based on Monte-Carlo simulations. Since this is a commercially available model, the primary task was to adapt the model to specific geometries and operational parameters of the production systems and perform model validation experiments. This sputtering chamber software has been modified for CIGS PV production systems and continuous deposition processes.
At this time, no film sensors are available in the sputtering chamber, so feedback control must take place on a run-to-run basis, utilizing information from the thickness sensor in the downstream CIGS chamber. Because of the necessary extra infrastructure to implement this, it will only be suggested if needed. The nominal control will be an open-loop feed-forward control that compensates for known time-variations in the deposition rates.
2.2. Empirical Models Empirical models for the CIGS deposition process were developed to quantify the relationship between source temperatures and film thickness. Data were collected from experimental data obtained from
Reduced Order
Full Order
7
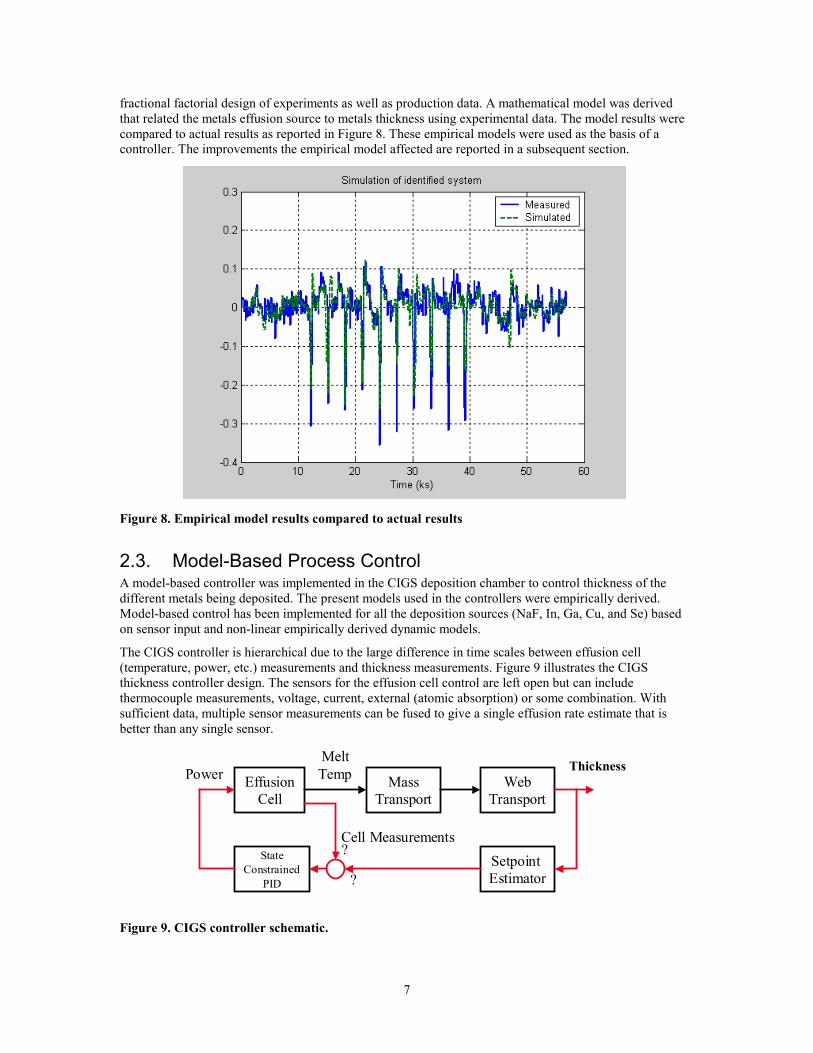
fractional factorial design of experiments as well as production data. A mathematical model was derived that related the metals effusion source to metals thickness using experimental data. The model results were compared to actual results as reported in Figure 8. These empirical models were used as the basis of a controller. The improvements the empirical model affected are reported in a subsequent section.
Figure 8. Empirical model results compared to actual results
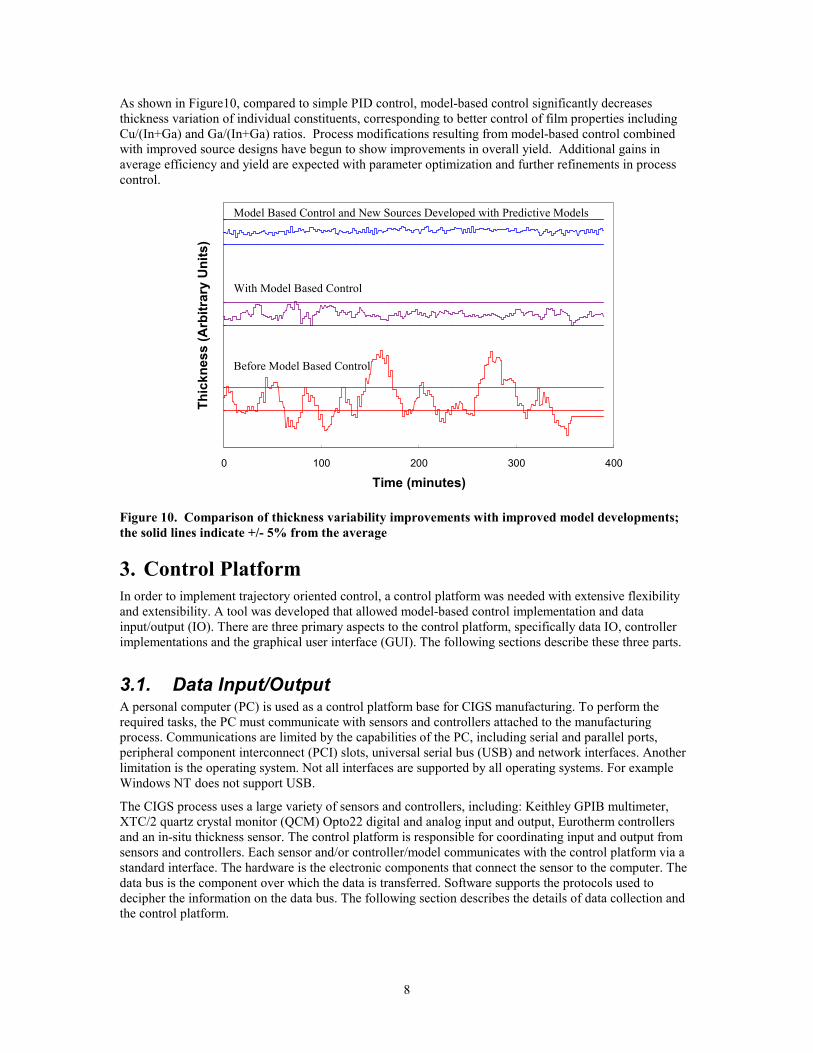
2.3. Model-Based Process Control A model-based controller was implemented in the CIGS deposition chamber to control thickness of the different metals being deposited. The present models used in the controllers were empirically derived. Model-based control has been implemented for all the deposition sources (NaF, In, Ga, Cu, and Se) based on sensor input and non-linear empirically derived dynamic models.
The CIGS controller is hierarchical due to the large difference in time scales between effusion cell (temperature, power, etc.) measurements and thickness measurements. Figure 9 illustrates the CIGS thickness controller design. The sensors for the effusion cell control are left open but can include thermocouple measurements, voltage, current, external (atomic absorption) or some combination. With sufficient data, multiple sensor measurements can be fused to give a single effusion rate estimate that is better than any single sensor.
EffusionCell
MassTransport
WebTransport
XRFMeltTempPower
Cell MeasurementsState
Constrained PID
SetpointEstimator
?
?
Thickness
Figure 9. CIGS controller schematic.
8
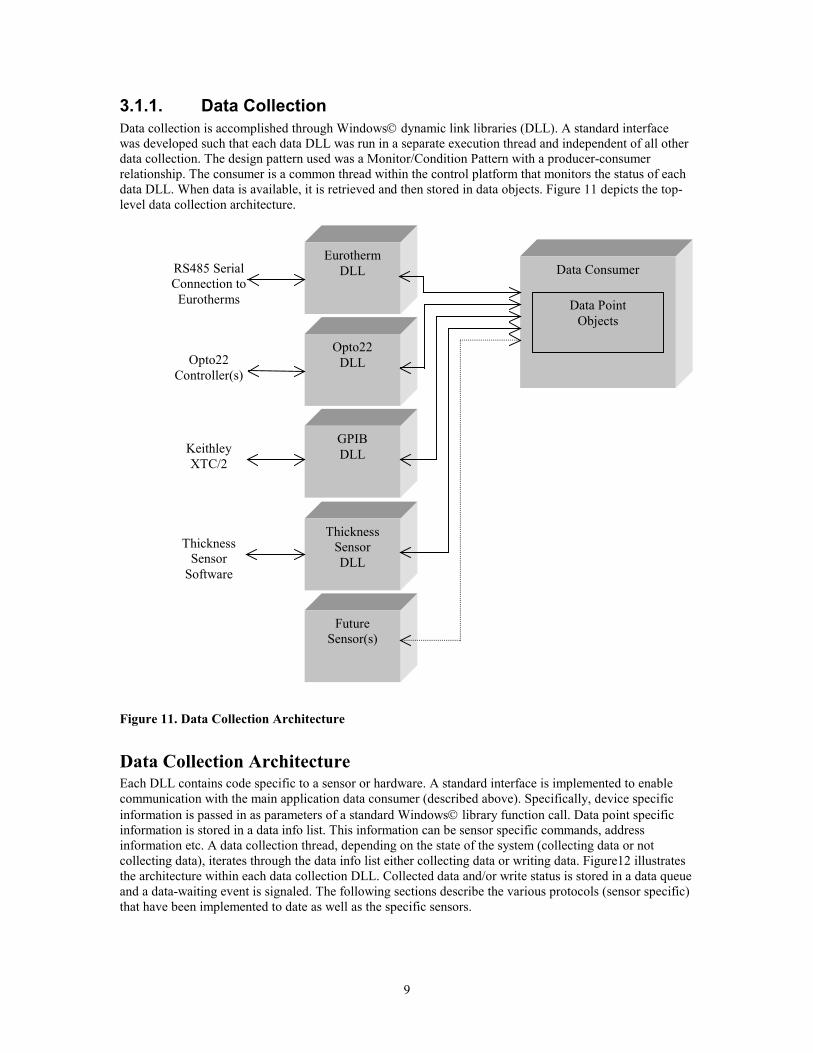
As shown in Figure10, compared to simple PID control, model-based control significantly decreases thickness variation of individual constituents, corresponding to better control of film properties including Cu/(In+Ga) and Ga/(In+Ga) ratios. Process modifications resulting from model-based control combined with improved source designs have begun to show improvements in overall yield. Additional gains in average efficiency and yield are expected with parameter optimization and further refinements in process control.
0 100 200 300 400
Time (minutes)
Thic
knes
s (A
rbitr
ary
Uni
ts)
Before Model Based Control
With Model Based Control
Model Based Control and New Sources Developed with Predictive Models
Figure 10. Comparison of thickness variability improvements with improved model developments; the solid lines indicate +/- 5% from the average
3. Control Platform In order to implement trajectory oriented control, a control platform was needed with extensive flexibility and extensibility. A tool was developed that allowed model-based control implementation and data input/output (IO). There are three primary aspects to the control platform, specifically data IO, controller implementations and the graphical user interface (GUI). The following sections describe these three parts.
3.1. Data Input/Output A personal computer (PC) is used as a control platform base for CIGS manufacturing. To perform the required tasks, the PC must communicate with sensors and controllers attached to the manufacturing process. Communications are limited by the capabilities of the PC, including serial and parallel ports, peripheral component interconnect (PCI) slots, universal serial bus (USB) and network interfaces. Another limitation is the operating system. Not all interfaces are supported by all operating systems. For example Windows NT does not support USB.
The CIGS process uses a large variety of sensors and controllers, including: Keithley GPIB multimeter, XTC/2 quartz crystal monitor (QCM) Opto22 digital and analog input and output, Eurotherm controllers and an in-situ thickness sensor. The control platform is responsible for coordinating input and output from sensors and controllers. Each sensor and/or controller/model communicates with the control platform via a standard interface. The hardware is the electronic components that connect the sensor to the computer. The data bus is the component over which the data is transferred. Software supports the protocols used to decipher the information on the data bus. The following section describes the details of data collection and the control platform.
9
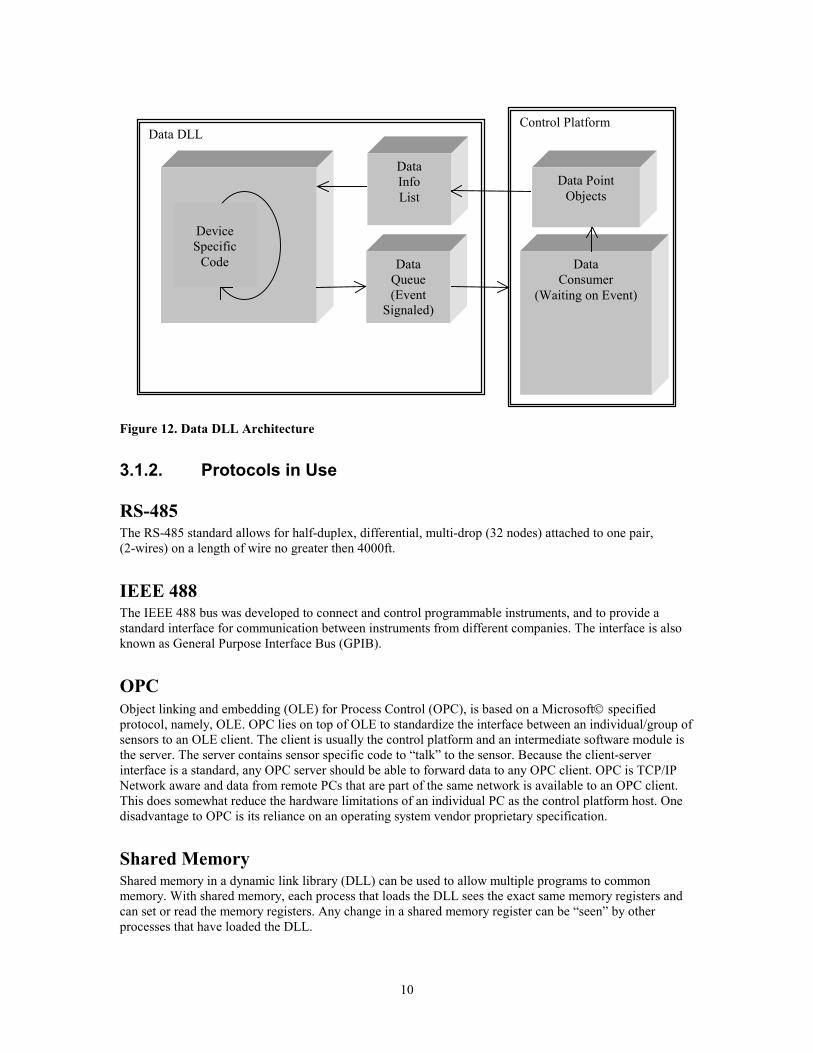
3.1.1. Data Collection Data collection is accomplished through Windows dynamic link libraries (DLL). A standard interface was developed such that each data DLL was run in a separate execution thread and independent of all other data collection. The design pattern used was a Monitor/Condition Pattern with a producer-consumer relationship. The consumer is a common thread within the control platform that monitors the status of each data DLL. When data is available, it is retrieved and then stored in data objects. Figure 11 depicts the top-level data collection architecture.
Data Consumer Eurotherm
DLL
Opto22 DLL
GPIB DLL
Thickness Sensor DLL
Future Sensor(s)
RS485 Serial Connection to Eurotherms
Opto22 Controller(s)
Keithley XTC/2
Thickness Sensor
Software
Data Point Objects
Figure 11. Data Collection Architecture
Data Collection Architecture Each DLL contains code specific to a sensor or hardware. A standard interface is implemented to enable communication with the main application data consumer (described above). Specifically, device specific information is passed in as parameters of a standard Windows library function call. Data point specific information is stored in a data info list. This information can be sensor specific commands, address information etc. A data collection thread, depending on the state of the system (collecting data or not collecting data), iterates through the data info list either collecting data or writing data. Figure12 illustrates the architecture within each data collection DLL. Collected data and/or write status is stored in a data queue and a data-waiting event is signaled. The following sections describe the various protocols (sensor specific) that have been implemented to date as well as the specific sensors.
10
Control Platform
Data DLL
Device Specific
Code Data Queue (Event
Signaled)
Data Consumer
(Waiting on Event)
Data Point Objects
Data Info List
Figure 12. Data DLL Architecture
3.1.2. Protocols in Use
RS-485 The RS-485 standard allows for half-duplex, differential, multi-drop (32 nodes) attached to one pair, (2-wires) on a length of wire no greater then 4000ft.
IEEE 488 The IEEE 488 bus was developed to connect and control programmable instruments, and to provide a standard interface for communication between instruments from different companies. The interface is also known as General Purpose Interface Bus (GPIB).
OPC Object linking and embedding (OLE) for Process Control (OPC), is based on a Microsoft specified protocol, namely, OLE. OPC lies on top of OLE to standardize the interface between an individual/group of sensors to an OLE client. The client is usually the control platform and an intermediate software module is the server. The server contains sensor specific code to “talk” to the sensor. Because the client-server interface is a standard, any OPC server should be able to forward data to any OPC client. OPC is TCP/IP Network aware and data from remote PCs that are part of the same network is available to an OPC client. This does somewhat reduce the hardware limitations of an individual PC as the control platform host. One disadvantage to OPC is its reliance on an operating system vendor proprietary specification.
Shared Memory Shared memory in a dynamic link library (DLL) can be used to allow multiple programs to common memory. With shared memory, each process that loads the DLL sees the exact same memory registers and can set or read the memory registers. Any change in a shared memory register can be “seen” by other processes that have loaded the DLL.
11
3.1.3. Sensors
PID Controllers Programmable process controllers are presently used for CIGS manufacturing. These controllers provide setpoint programming, PID and value position control. The controllers are connected to the control platform via RS-485.
Multimeter A digit multimeter is used for CIGS manufacturing to measure the electrical properties of the photovoltaic material during the production process. This multimeter connects to the control platform via IEEE 488.
Digital and Analog I/O Currently CIGS manufacturing uses SNAP Controllers. The control platform communicates with the Controller via Ethernet. The SNAP Controller communicates to distributed I/O via RS-485 serial link. Desired data are downloaded from the SNAP Controller.
Quartz Crystal Monitor (QCM) The Thin Film Deposition Controller uses a QCM to measure the deposition rate. The QCM is connected to the control platform via IEEE488.
In-situ Composition Sensor The in-situ composition sensor measures the composition of material deposited in the manufacturing environment. Presently, the in-situ composition sensor communicates with the control platform via DLL shared memory.
Future Growth The ability to add new sensors to the control platform is somewhat hardware limited by the amount of open space on the PC data bus. It is important to move towards a hardware and software solution to meet this need. RS-485 and IEEE-488 both allow for daisy chaining. Also network-enabled sensors diminish the individual PC hardware limitations. Equally important is to add a second layer to allow existing and future products to communicate with these devices. OPC is an option, as a default hardware communication standard.
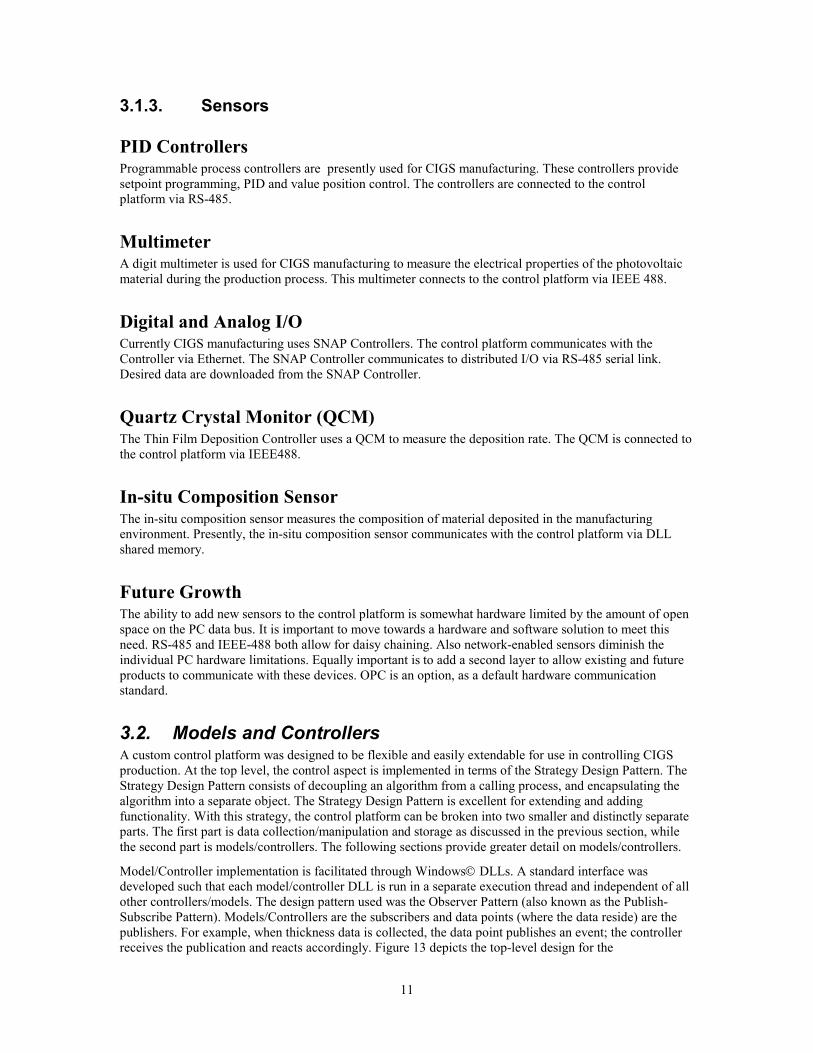
3.2. Models and Controllers A custom control platform was designed to be flexible and easily extendable for use in controlling CIGS production. At the top level, the control aspect is implemented in terms of the Strategy Design Pattern. The Strategy Design Pattern consists of decoupling an algorithm from a calling process, and encapsulating the algorithm into a separate object. The Strategy Design Pattern is excellent for extending and adding functionality. With this strategy, the control platform can be broken into two smaller and distinctly separate parts. The first part is data collection/manipulation and storage as discussed in the previous section, while the second part is models/controllers. The following sections provide greater detail on models/controllers.
Model/Controller implementation is facilitated through Windows DLLs. A standard interface was developed such that each model/controller DLL is run in a separate execution thread and independent of all other controllers/models. The design pattern used was the Observer Pattern (also known as the Publish-Subscribe Pattern). Models/Controllers are the subscribers and data points (where the data reside) are the publishers. For example, when thickness data is collected, the data point publishes an event; the controller receives the publication and reacts accordingly. Figure 13 depicts the top-level design for the
12
model/controller implementation. The following section describes details of implementing models/controllers.
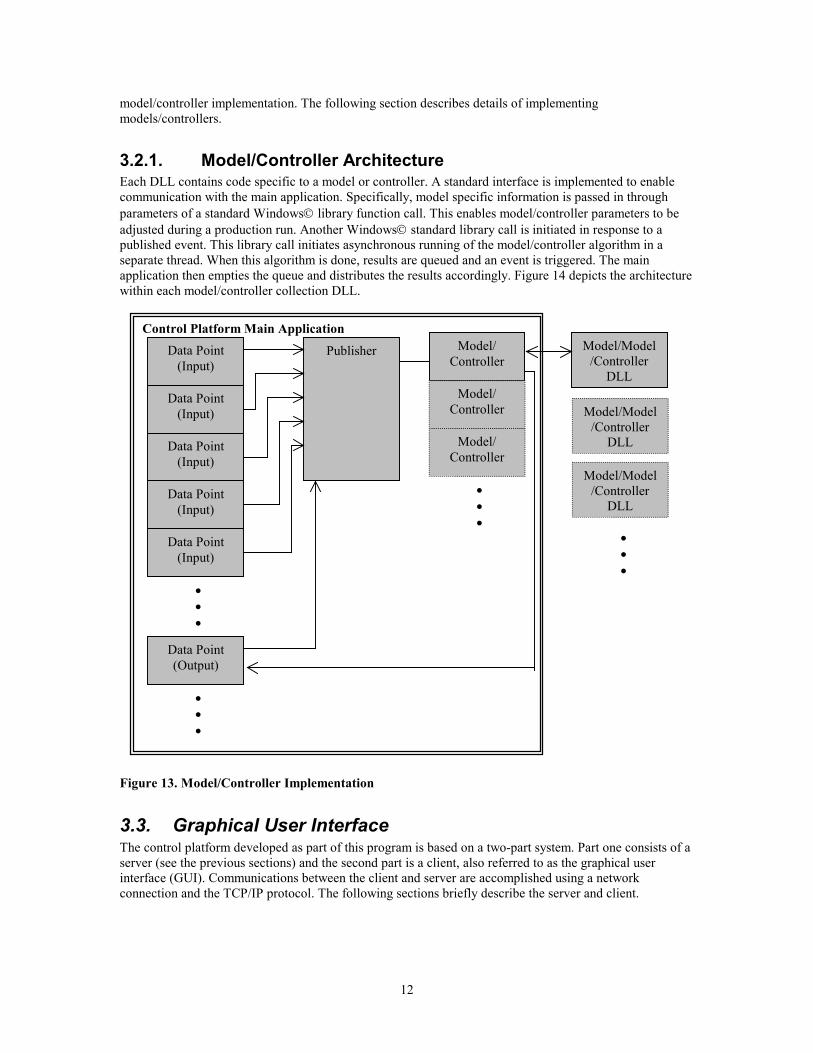
3.2.1. Model/Controller Architecture Each DLL contains code specific to a model or controller. A standard interface is implemented to enable communication with the main application. Specifically, model specific information is passed in through parameters of a standard Windows library function call. This enables model/controller parameters to be adjusted during a production run. Another Windows standard library call is initiated in response to a published event. This library call initiates asynchronous running of the model/controller algorithm in a separate thread. When this algorithm is done, results are queued and an event is triggered. The main application then empties the queue and distributes the results accordingly. Figure 14 depicts the architecture within each model/controller collection DLL.
Control Platform Main Application
• • •
• • •
• • •
• • •
Data Point (Input)
Publisher Model/ Controller
Data Point (Output)
Data Point (Input)
Data Point (Input)
Data Point (Input)
Data Point (Input)
Model/ Controller
Model/ Controller
Model/Model/Controller
DLL
Model/Model/Controller
DLL
Model/Model/Controller
DLL
Figure 13. Model/Controller Implementation
3.3. Graphical User Interface The control platform developed as part of this program is based on a two-part system. Part one consists of a server (see the previous sections) and the second part is a client, also referred to as the graphical user interface (GUI). Communications between the client and server are accomplished using a network connection and the TCP/IP protocol. The following sections briefly describe the server and client.
13
3.3.1. Server Overview The control platform server is composed of two parts and is displayed in Figure 15. The first part is the control/data collection engine. This engine is responsible for collecting data from sensors/hardware as well as running models/controllers. A full description is given in previous sections. The second part of the server consists of the communications module. This module is responsible for responding to client connection requests, providing data updates to clients and dispatching commands from the clients.
Model/Controller DLL
Model/ Controller Specific
Code
Standard Library
Call (Event
Signaled)
Control Platform Model/Controller
(Waiting on Publication)
Results Queue (Signal Event)
Control Platform Results Consumer
Data Point(s)
Figure 14. Model/Controller DLL Architecture
Control Platform Server
TCP/IP Communications
Server
Control/Data Collection Engine Client
Client
Client
Figure 15. Control Platform Server Overview
14
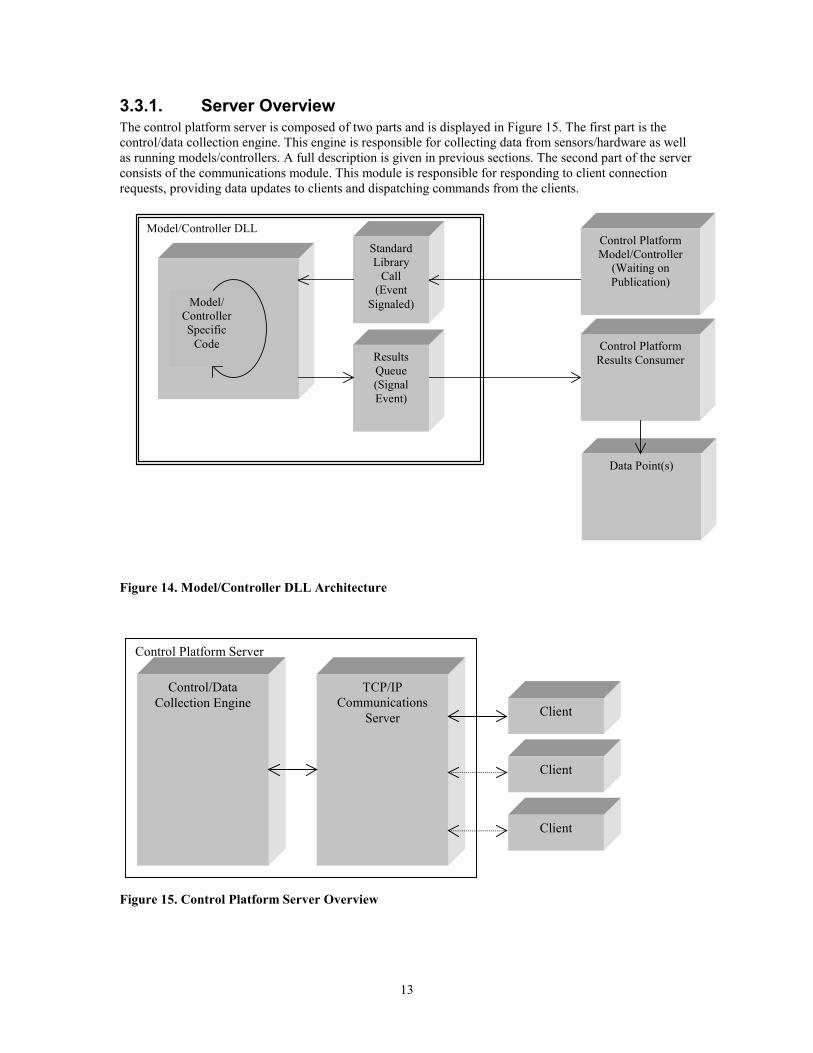
3.3.2. Client overview There are three parts to the client, specifically, TCP/IP communications, data logging and GUI. The TCP/IP communications uses WinSock 2.0 and passes information back and forth from the server (discussed above). Types of information include updated data (i.e., sensor reported values, sensor status, model/controller results and model/controller status) and user commands. The GUI is configurable. That is, the layout can be changed without changing the code base and recompiling. Control and layout information is loaded at application start time. This information dictates where controls are placed, what type of controls, and user interaction properties.
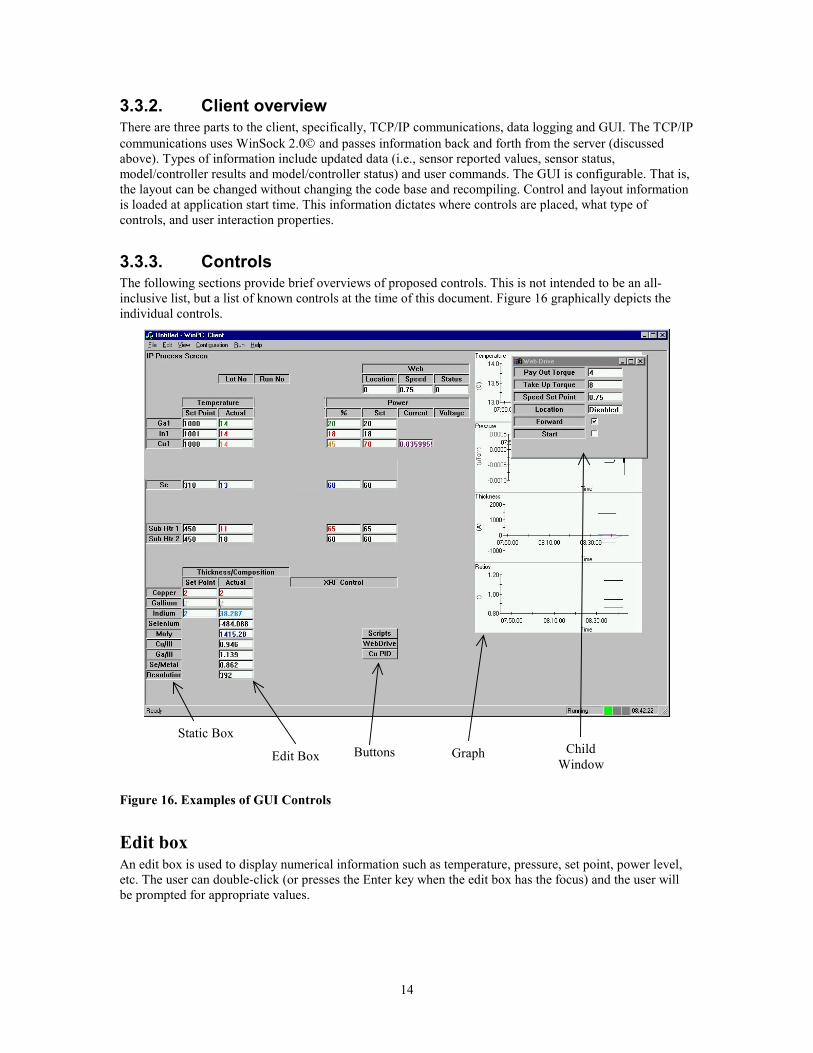
3.3.3. Controls The following sections provide brief overviews of proposed controls. This is not intended to be an all-inclusive list, but a list of known controls at the time of this document. Figure 16 graphically depicts the individual controls.
ButtonsStatic Box
Edit Box Graph ChildWindow
Figure 16. Examples of GUI Controls
Edit box An edit box is used to display numerical information such as temperature, pressure, set point, power level, etc. The user can double-click (or presses the Enter key when the edit box has the focus) and the user will be prompted for appropriate values.

15
Static Static boxes are used to display data names, sensor status and model status. No user interaction is enabled.
Button Buttons can take two forms, specifically checkboxes and push buttons. Checkboxes are used to display the enabled state of a data point or model/controller. Checkboxes also allow the user to enable and disable a data point or model/controller by clicking on or off. This results in an enable/disable command being sent to the server.
Push buttons are used exclusively for model/controllers. When pushed, a window pops up and displays configurations information such as inputs, outputs and model/controller parameters. Examples of parameters include proportional-integral-derivative values for a PID controller.
Graph Graphs are used exclusively for data points (e.g., temperatures, powers, thicknesses, etc and not models/controllers). Interactive capabilities will include, changing scales and other similar graph properties.
Bitmaps Bitmaps are static images loaded at run time. They can include items such as a chamber schematic. They are intended as a visual tool to help the user. There are no planned interactions at this time.
Child Windows Child windows are separate windows from the main display. Even though they are separate, they are still connected as children to the main window. That is, the child windows are destroyed when the main window is closed. The primary purpose of child windows is to enable quick access to less used information and/or controls. For example, a startup script can be placed in a child window and displayed initially during warm- up and then closed when it is no longer needed.
4. Reliability: Fault Prevention and Fault Tolerance A CIGS deposition system is operated continuously for long periods of time, and system components are exposed to harsh environments, thus, decreasing reliability. System reliability can be improved by fault prevention and fault tolerance. For example, operator-induced faults can be prevented through sophisticated interlocking mechanisms and hardware replaced before its mean time between failure. However, to increase reliability further, the system must be designed to provide service in the presence of faults. Fault tolerance enhances system reliability by continuing to perform specified tasks correctly in the presence of failures and errors. A typical fault tolerance technique consists of four basic steps: fault detection, fault location, reconfiguration, and recovery. The following section discusses fault detection methods and implementation of specific methods for Mo and CIGS depositions.
4.1. Background Fault detection is especially important when sensors are operating in harsh environments. Nominally, the approaches to analytic redundancy depend on the power to process information, so that it can be possible to collect and process all sensor measurements to determine if they are consistent. There are many challenges when the fault detection occurs in the context of multiple sensors. This requires the use of distributed estimation techniques.
16
Diagnosis is the process of identifying malfunctioning system components. An ideal diagnostic system should have several attributesiii. These attributes will be used to benchmark various strategies and help in designing methods that incorporate as many requirements as possible, including:
• To detect and diagnose faults as early as possible.
• To discriminate between different failures with good resolution. A diagnosis is said to be correct if all fault-free components are identified as not faulty. Otherwise a diagnosis is said to be incorrect. A diagnosis is said to be complete if all faulty components have been identified. Otherwise, it is considered to be incomplete. A correct and complete diagnosis is desirable, but an incorrect and complete diagnosis is acceptable.
• Being robust to noise and uncertainties.
• Identifying multiple faults.
• Adapting to changes in environment, such as a process change.
Depending on the form of information required and the way it is used, diagnostic techniques are broadly classified as either redundancy-based or process history-basediii. Adequacy of these methods will be evaluated for each of the subsystems/components.
Redundancy can be provided either in the form of hardware redundancy or functional redundancy. Since it may not be possible to incorporate hardware redundancy because of cost and physical constraints, model-based diagnosis, which is based on functional redundancy, has been selected. In functional redundancy, relationships exist between measured variables.
Process history based methods make use of large amounts of process data and numerous techniques, such as statistical, neural nets, rule-based, and qualitative trend analysis. Techniques that were considered under model-based include observers, parity-space, and bond graphs, while the process history techniques include statistical and quantitative trend analysis.
Model-based diagnosis consisted of interaction of observations and predictions. Observations indicate what a system is actually doing while the model of the system predicts what the system is supposed to do. Discrepancy between these two is used to detect and locate faults. The goal of model-based diagnosis is to perform correct and complete diagnosis, isolate the faults, reconfigure and restore the system to its normal operation with respect to input-output relationship by replacing the faulty components, or changing the appropriate parameters to force the system to return to the acceptable range of operation, or move the system to a safe mode of operation.
The basic assumption in model-based diagnosis is that the model is correct and all the discrepancies are due to faulty components in the system. Many times this assumption may not be true. The discrepancies may be due to error in modeling, noise, or drifts in the physical system. A mechanism is needed to correct these problems.
Discrepancies will be analyzed by the fault set generator to produce the possible fault set. This set could be used to refine the model. Continuous monitoring will help to refine the fault set till the predictions due to the fault set are consistent with the observed values. Considering the fact that qualitative and quantitative schemes have their limitations the models will use a hybrid scheme incorporating both the techniques.
The model will not only be able to describe the system behavior under fault-free and faulty conditions, but also account for dynamic behavior of the system. This will be helpful in analyzing transient faults. The model will also be able to map discrepancies onto system parameters. It is also desired to model structural changes that a system may undergo due to a fault.
4.2. Systems and Implementation Initial evaluations of reconfiguration strategies for all levels of the CIGS PV production deposition systems were performed. In addition, specific subsystems were identified where implementation of fault tolerance methodologies could be beneficial. These fault tolerance issues include:

17
• Source thermocouple accuracy and failures
• Sodium fluoride sensor reliability
• Substrate heater failures
• Line voltage regulation
• Source power and current
• Over pressure state monitoring and response,
• Sputtering source arc detection.
The following are examples of fault tolerant systems developed for this effort.
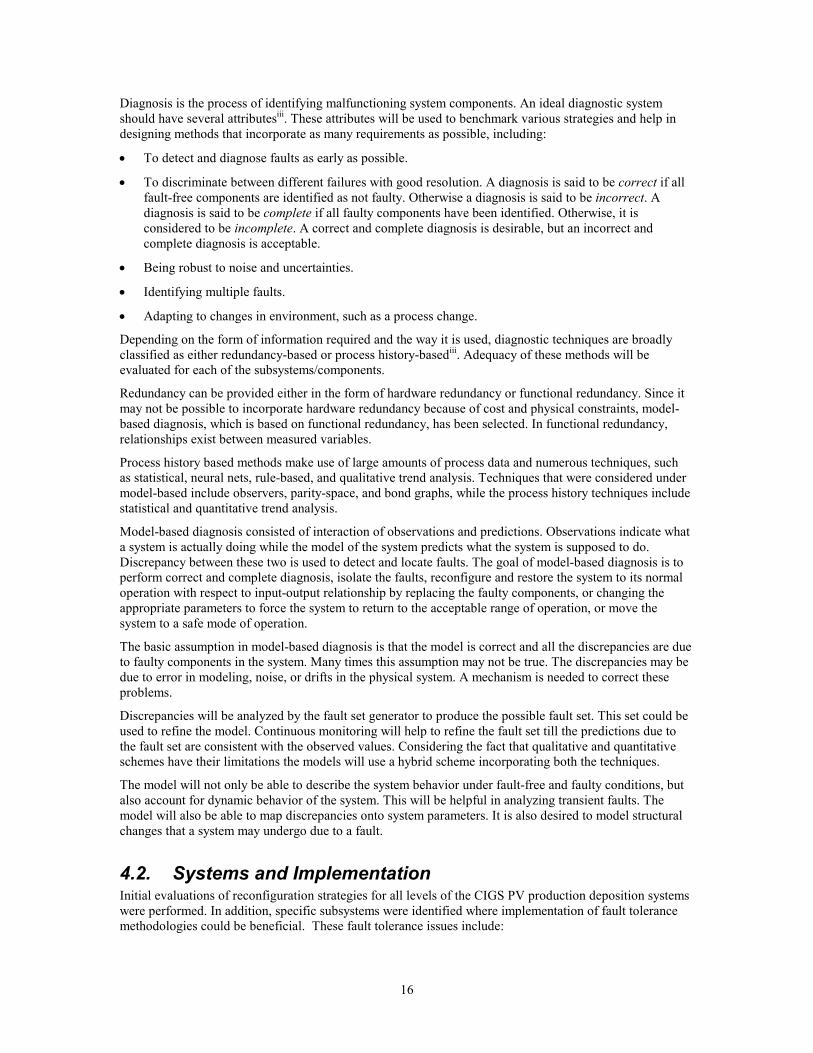
• Effusion source thermocouples, in conjunction with in-line thickness-monitoring, are used to control the thickness of each CIGS element. Fault-tolerant thickness controllers were designed due to low mean time between failures of these thermocouples. These fault-tolerant controllers made use of thermocouple redundancy to reconfigure the controller. When a faulty thermocouple is detected (see Figure 17) the reconfiguration strategy shuts down the thickness controller, supplies constant power to the effusion source, disconnects the faulty thermocouple from the feedback loop, incorporates the redundant thermocouple in the loop, and restarts the thickness controller with the new thermocouple reading. Failure of the redundant thermocouple will lead to switching to alternate control strategies or the shutdown of the system.
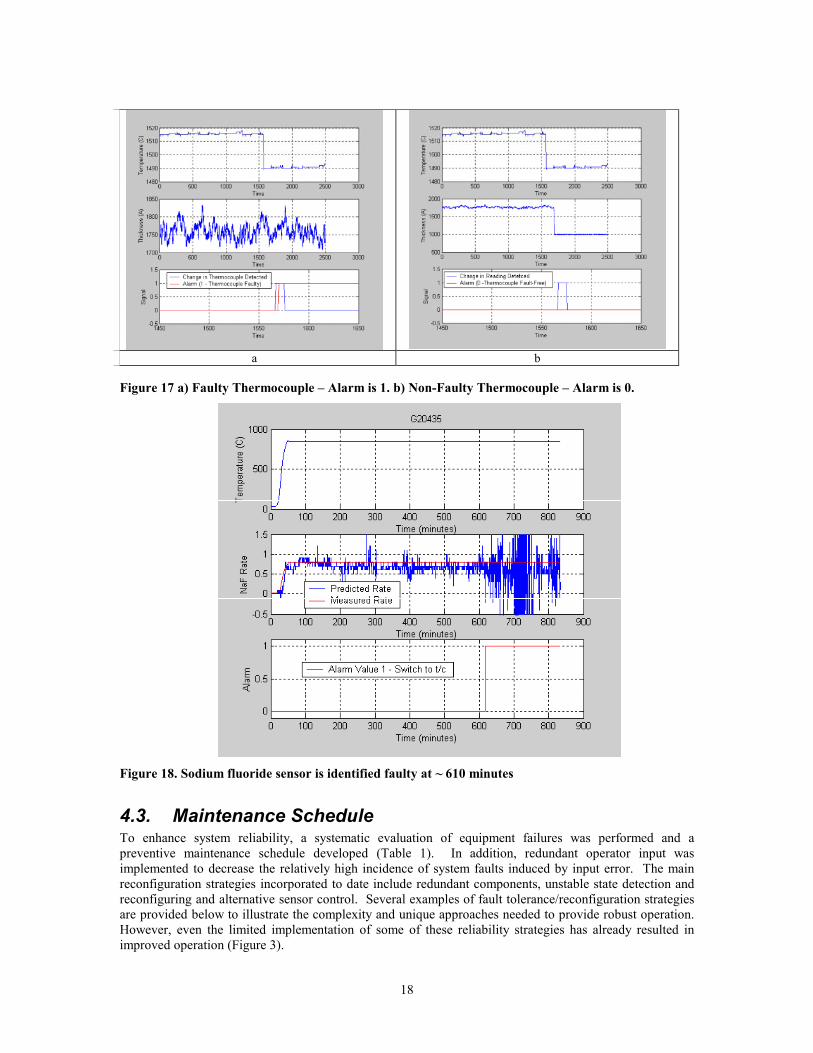
• For sodium fluoride control, a rate sensor is typically used as the primary sensor. However, due to a harsh processing environment these rate sensors have demonstrated susceptibility to frequent failures. The design of a model-based fault-detection algorithm for this sensor was developed (Figure 18). Once the sensor is identified as faulty the controller is reconfigured such that the sodium fluoride rate is held at the set point using the source thermocouple. Currently efforts are being made to identify the possibility of further reconfiguration in the event that both the rate sensor and thermocouple fails in the same run.
• A typical production molybdenum deposition system has six targets out of which four are used at any particular time during a run. The system is usually shutdown when an arc is detected leading to higher production costs. A reconfiguration strategy was designed and constructed to automatically switch off the arcing target and switch on one of the spare targets based on a cost function. The cost function consists of several parameters, including remaining target lifetime. A simple strategy to select a target will suffice for a system that has only two spare targets, but the formal treatment of a cost function will be highly valuable for other systems in the near future.
18
a b
Figure 17 a) Faulty Thermocouple – Alarm is 1. b) Non-Faulty Thermocouple – Alarm is 0.
Figure 18. Sodium fluoride sensor is identified faulty at ~ 610 minutes
4.3. Maintenance Schedule To enhance system reliability, a systematic evaluation of equipment failures was performed and a preventive maintenance schedule developed (Table 1). In addition, redundant operator input was implemented to decrease the relatively high incidence of system faults induced by input error. The main reconfiguration strategies incorporated to date include redundant components, unstable state detection and reconfiguring and alternative sensor control. Several examples of fault tolerance/reconfiguration strategies are provided below to illustrate the complexity and unique approaches needed to provide robust operation. However, even the limited implementation of some of these reliability strategies has already resulted in improved operation (Figure 3).
19
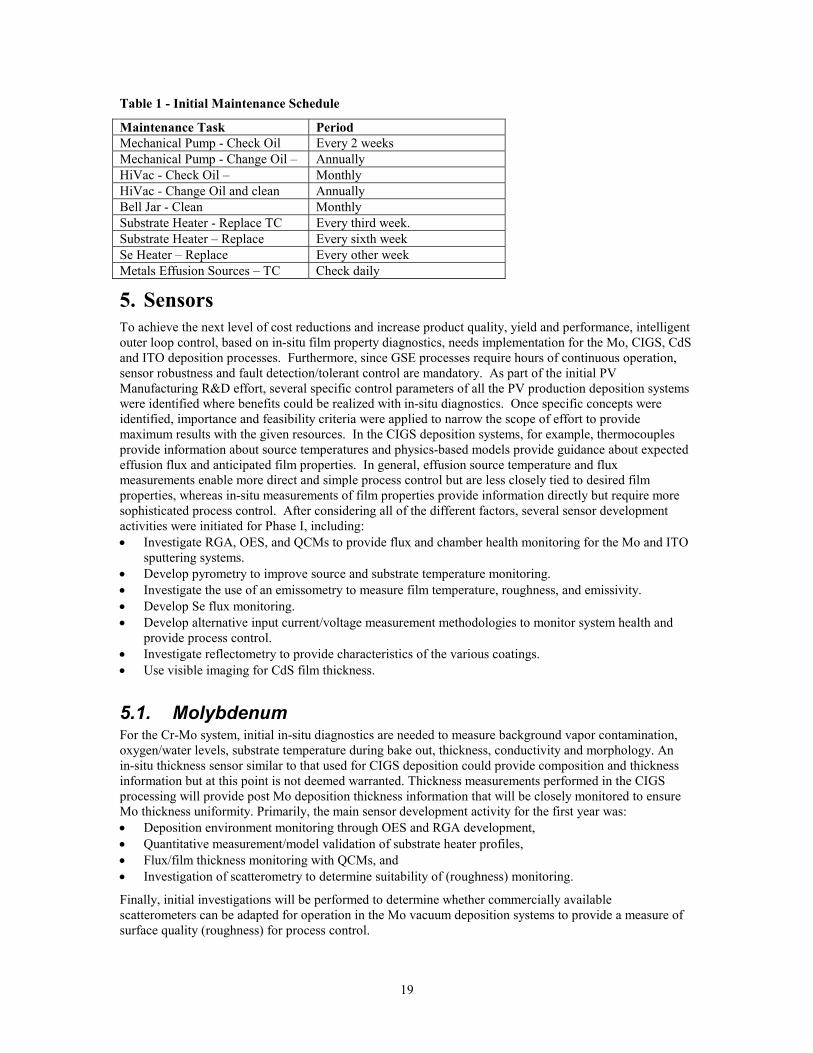
Table 1 - Initial Maintenance Schedule
Maintenance Task Period Mechanical Pump - Check Oil Every 2 weeks Mechanical Pump - Change Oil – Annually HiVac - Check Oil – Monthly HiVac - Change Oil and clean Annually Bell Jar - Clean Monthly Substrate Heater - Replace TC Every third week. Substrate Heater – Replace Every sixth week Se Heater – Replace Every other week Metals Effusion Sources – TC Check daily
5. Sensors To achieve the next level of cost reductions and increase product quality, yield and performance, intelligent outer loop control, based on in-situ film property diagnostics, needs implementation for the Mo, CIGS, CdS and ITO deposition processes. Furthermore, since GSE processes require hours of continuous operation, sensor robustness and fault detection/tolerant control are mandatory. As part of the initial PV Manufacturing R&D effort, several specific control parameters of all the PV production deposition systems were identified where benefits could be realized with in-situ diagnostics. Once specific concepts were identified, importance and feasibility criteria were applied to narrow the scope of effort to provide maximum results with the given resources. In the CIGS deposition systems, for example, thermocouples provide information about source temperatures and physics-based models provide guidance about expected effusion flux and anticipated film properties. In general, effusion source temperature and flux measurements enable more direct and simple process control but are less closely tied to desired film properties, whereas in-situ measurements of film properties provide information directly but require more sophisticated process control. After considering all of the different factors, several sensor development activities were initiated for Phase I, including: • Investigate RGA, OES, and QCMs to provide flux and chamber health monitoring for the Mo and ITO
sputtering systems. • Develop pyrometry to improve source and substrate temperature monitoring. • Investigate the use of an emissometry to measure film temperature, roughness, and emissivity. • Develop Se flux monitoring. • Develop alternative input current/voltage measurement methodologies to monitor system health and
provide process control. • Investigate reflectometry to provide characteristics of the various coatings. • Use visible imaging for CdS film thickness.
5.1. Molybdenum For the Cr-Mo system, initial in-situ diagnostics are needed to measure background vapor contamination, oxygen/water levels, substrate temperature during bake out, thickness, conductivity and morphology. An in-situ thickness sensor similar to that used for CIGS deposition could provide composition and thickness information but at this point is not deemed warranted. Thickness measurements performed in the CIGS processing will provide post Mo deposition thickness information that will be closely monitored to ensure Mo thickness uniformity. Primarily, the main sensor development activity for the first year was: • Deposition environment monitoring through OES and RGA development, • Quantitative measurement/model validation of substrate heater profiles, • Flux/film thickness monitoring with QCMs, and • Investigation of scatterometry to determine suitability of (roughness) monitoring.
Finally, initial investigations will be performed to determine whether commercially available scatterometers can be adapted for operation in the Mo vacuum deposition systems to provide a measure of surface quality (roughness) for process control.
20
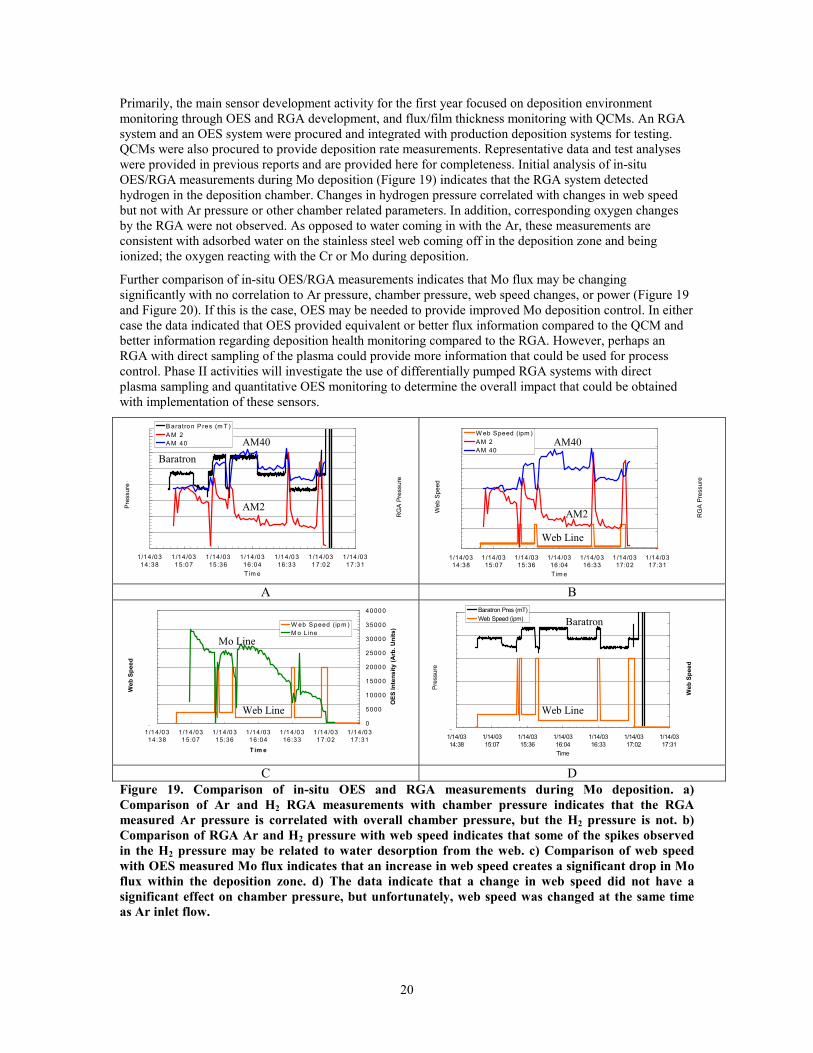
Primarily, the main sensor development activity for the first year focused on deposition environment monitoring through OES and RGA development, and flux/film thickness monitoring with QCMs. An RGA system and an OES system were procured and integrated with production deposition systems for testing. QCMs were also procured to provide deposition rate measurements. Representative data and test analyses were provided in previous reports and are provided here for completeness. Initial analysis of in-situ OES/RGA measurements during Mo deposition (Figure 19) indicates that the RGA system detected hydrogen in the deposition chamber. Changes in hydrogen pressure correlated with changes in web speed but not with Ar pressure or other chamber related parameters. In addition, corresponding oxygen changes by the RGA were not observed. As opposed to water coming in with the Ar, these measurements are consistent with adsorbed water on the stainless steel web coming off in the deposition zone and being ionized; the oxygen reacting with the Cr or Mo during deposition.
Further comparison of in-situ OES/RGA measurements indicates that Mo flux may be changing significantly with no correlation to Ar pressure, chamber pressure, web speed changes, or power (Figure 19 and Figure 20). If this is the case, OES may be needed to provide improved Mo deposition control. In either case the data indicated that OES provided equivalent or better flux information compared to the QCM and better information regarding deposition health monitoring compared to the RGA. However, perhaps an RGA with direct sampling of the plasma could provide more information that could be used for process control. Phase II activities will investigate the use of differentially pumped RGA systems with direct plasma sampling and quantitative OES monitoring to determine the overall impact that could be obtained with implementation of these sensors.
1
1.2
1.4
1.6
1.8
2
2.2
2.4
1/14/0314:38
1 /14 /0315:07
1/14/0315 :36
1/14/0316 :04
1/14/0316:33
1 /14 /0317:02
1 /14 /0317:31
T im e
Pres
sure
(mT)
0 .00E +00
2.00E -10
4.00E -10
6.00E -10
8.00E -10
1.00E -09
1.20E -09
1.40E -09
RG
A Pr
essu
re (T
orr)
B aratron P res (m T )A M 2A M 40
0
50
100
150
200
250
300
1/14/0314:38
1/14/0315:07
1/14/0315:36
1/14/0316:04
1/14/0316:33
1/14/0317:02
1/14/0317:31
Tim e
Web
Spe
ed (i
pm)
0 .00E+00
2.00E-10
4.00E-10
6.00E-10
8.00E-10
1.00E-09
1.20E-09
1.40E-09
RG
A Pr
essu
re (T
orr)
W eb Speed (ipm )AM 2AM 40
A B
0
2 0
4 0
6 0
8 0
10 0
12 0
1/1 4/0 314:38
1 /14/031 5:07
1/1 4/0 315:36
1 /14/031 6:04
1/1 4/0 316:33
1 /14 /031 7:02
1/1 4/0 317:31
T im e
Web
Spe
ed (i
pm)
0
5000
1000 0
1500 0
2000 0
2500 0
3000 0
3500 0
4000 0
OES
Inte
nsity
(Arb
. Uni
ts)W eb S peed (ip m )
M o L ine
0
0.5
1
1.5
2
2.5
1/14/0314:38
1/14/0315:07
1/14/0315:36
1/14/0316:04
1/14/0316:33
1/14/0317:02
1/14/0317:31
Time
Pre
ssur
e (m
T)
0
10
20
30
40
50
60
70
80
90
100
Web
Spe
ed (i
pm)
Baratron Pres (mT)Web Speed (ipm)
C D
Figure 19. Comparison of in-situ OES and RGA measurements during Mo deposition. a) Comparison of Ar and H2 RGA measurements with chamber pressure indicates that the RGA measured Ar pressure is correlated with overall chamber pressure, but the H2 pressure is not. b) Comparison of RGA Ar and H2 pressure with web speed indicates that some of the spikes observed in the H2 pressure may be related to water desorption from the web. c) Comparison of web speed with OES measured Mo flux indicates that an increase in web speed creates a significant drop in Mo flux within the deposition zone. d) The data indicate that a change in web speed did not have a significant effect on chamber pressure, but unfortunately, web speed was changed at the same time as Ar inlet flow.
Mo Line
Web Line Web Line
Web Line
Baratron
Baratron
AM2
AM40
AM2
AM40
21
0
200
400
600
800
1000
1200
1400
1/14/0314:38
1/14/0315:07
1/14/0315:36
1/14/0316:04
1/14/0316:33
1/14/0317:02
1/14/0317:31
Time
OE
S S
igna
l
0.00E+00
5.00E-10
1.00E-09
1.50E-09
2.00E-09
2.50E-09
3.00E-09
RG
A P
ress
ure
(Tor
r)
Argon LineMoly LineAM 2AM 40
1
1.2
1.4
1.6
1.8
2
2.2
2.4
1/14/0314:38
1/14/0315:07
1/14/0315:36
1/14/0316:04
1/14/0316:33
1/14/0317:02
1/14/0317:31
Time
Bar
atro
n Pr
essu
re (m
T)
0
200
400
600
800
1000
1200
1400
1600
OES
Sig
nal
Baratron Pres (mT) Mo Line Ar Line
A B
3000
3050
3100
3150
3200
3250
3300
3350
3400
1/14/0314:38
1/14/0315:07
1/14/0315:36
1/14/0316:04
1/14/0316:33
1/14/0317:02
1/14/0317:31
Time
Pow
er (W
)
0
200
400
600
800
1000
1200
1400
1600
OES
Sig
nal
Tgt7 Power (W)Mo Line
0
100
200
300
400
500
600
700
200 300 400 500 600 700 800 900
Wavelength (nm)
Cou
nts
(Arb
itrar
y U
nits
)
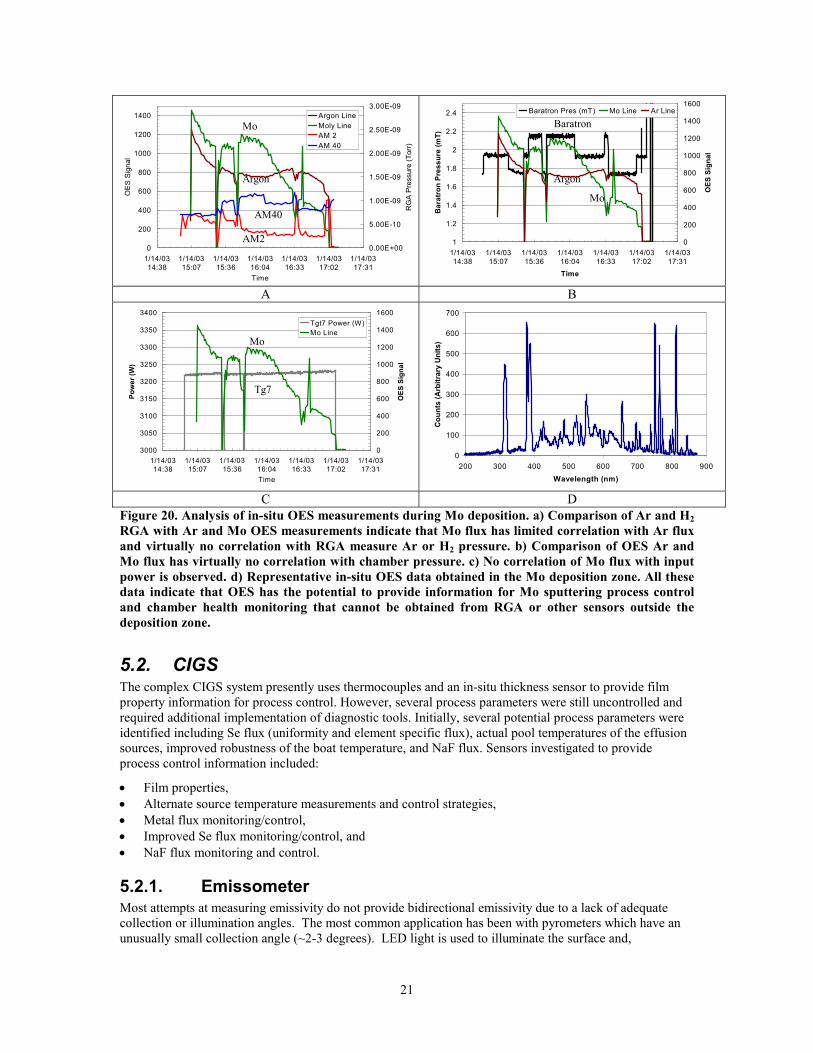
C D Figure 20. Analysis of in-situ OES measurements during Mo deposition. a) Comparison of Ar and H2 RGA with Ar and Mo OES measurements indicate that Mo flux has limited correlation with Ar flux and virtually no correlation with RGA measure Ar or H2 pressure. b) Comparison of OES Ar and Mo flux has virtually no correlation with chamber pressure. c) No correlation of Mo flux with input power is observed. d) Representative in-situ OES data obtained in the Mo deposition zone. All these data indicate that OES has the potential to provide information for Mo sputtering process control and chamber health monitoring that cannot be obtained from RGA or other sensors outside the deposition zone.
5.2. CIGS The complex CIGS system presently uses thermocouples and an in-situ thickness sensor to provide film property information for process control. However, several process parameters were still uncontrolled and required additional implementation of diagnostic tools. Initially, several potential process parameters were identified including Se flux (uniformity and element specific flux), actual pool temperatures of the effusion sources, improved robustness of the boat temperature, and NaF flux. Sensors investigated to provide process control information included:
• Film properties, • Alternate source temperature measurements and control strategies, • Metal flux monitoring/control, • Improved Se flux monitoring/control, and • NaF flux monitoring and control.
5.2.1. Emissometer Most attempts at measuring emissivity do not provide bidirectional emissivity due to a lack of adequate collection or illumination angles. The most common application has been with pyrometers which have an unusually small collection angle (~2-3 degrees). LED light is used to illuminate the surface and,
Mo
Mo
Tg7
AM2
AM40
Argon
Mo
Argon
Baratron
22
frequently, the collection optics are used to illuminate the surface. In this case, it is a simple matter to misdirect the reflected light from the collection optics, either due to surface roughness or non-perpendicular orientation of the surface with respect to the incident light. The incorrect conclusions can range from a unity emissivity (zero reflection) value or value uncorrelated to the actual emissivity.
As optics is an old and well-studied field, it may be assumed that all possible combinations of optics to achieve an accurate measure of reflection have been considered. Thus, what must be new is the application-specific considerations which are only valid for a limited range of boundary conditions. This reflectometer is designed to measure reflectivity (a materials property), not reflectance (a combination of material reflectivity and surrouding cavity properties). Thus, the intent is to measure the emissivity from certain surfaces in a certain temperature regime and independent of the surrrounding cavity. To achieve this, the receiving optics of the reflectometer is designed so it will only collect light which is directly reflected into the receiving optics. Dimensional considerations for the design of the lightpipe and the lightpipe housing give us the desired operation.
The reflectometer is designed to be acceptably insenstive to the position of the end of the sensor relative to the measured surface. The term “acceptably insensitive” implies that there will be less than a 1% effect on the emissivity for the practical dimensional tolerances and stackups which can be achieved.
The design indicated above is sufficient for the measurement of emissivity of a surface where the distance to the surface and the surface roughness is known (or assumed to be in a narrow range). With some adjustments to the illuminating and receiving optics, the device can be expanded to measure surface roughness.
The calibration of the unit involves creating a matrix of currents reflecting a set of reference wafers with varying emissivities and roughnesses while changing the distance of the lightpipe from the surface. This calibration creates a series of equations for calculating roughness and emissivity for any distance setting of the probe. The operation of the unit is performed in the middle of the distance range for maximum validity of the lookup table and interpolation of emissivity and roughness values.
To evaluate the emissometer as an in-situ deposited thin film CIGS monitor to provide surface temperature, surface roughness, and emissivity information for process control, six initial CIGS samples on stainless steel substrates (Table 2) were provided for ex-situ evaluation.
Table 2. Descriptions of Samples Provided for Testing Run Number X Coordinate Y Coordinate Cu Ratio Comment 166 20 7 0.65 Cu Poor 182 10 2 0.68 Cu Poor 172 36 7 0.84 Process Zone 179 4 7 0.84 Process Zone 189 20 9 1.2 Cu Rich 186 5 7 1.2 Cu Rich
A SiC sample was set on top of the test samples in order to keep the foil samples flat. The system was checked against a Si wafer piece (ε = 0.67) and a SiC sample (ε =0.87). Table 3, Figure 21 and Figure 22 show the results of these measurements. All samples were measured in the center, and the Si and SiC references were checked between each sample to monitor drift.
Table 3. Room Temperature Emissivity Values Sample Description Emissivity Rel. Roughness
166 Cu poor 0.96 100 182 Cu poor 0.98 100 172 Process Zone 0.94 88 179 Process Zone 0.93 83 189 Cu Rich 0.88 92 186 Cu Rich 0.87 90 SiC 0.88 117
Si (polished) 0.67 61 Precision of measurement is ±0.01, Accuracy of measurement is ±0.02
23
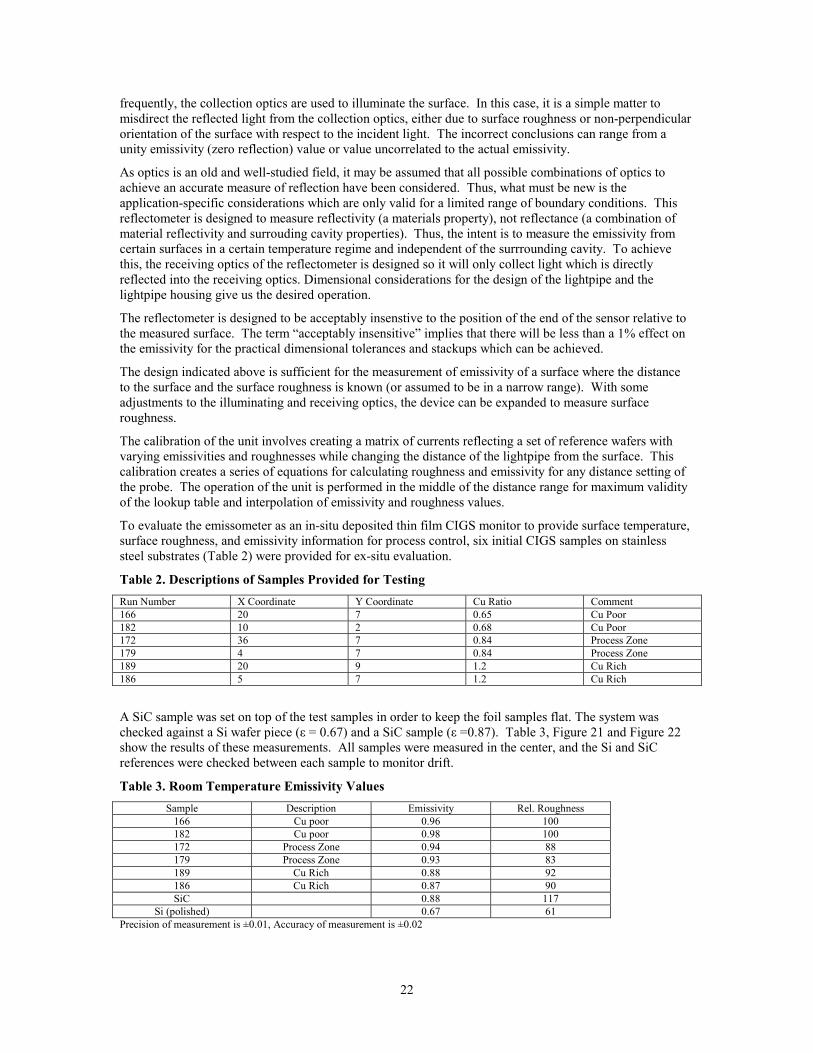
In addition to the room temperature results, the emissivity as a function of elevated temperature was investigated for the CIGS test samples and the SiC reference sample. SiC is known to exhibit very minor changes in emissivity with temperature. The emissivity of SiC also provided a reference in the range of the test samples.
Figure 21. Emissivity and temperature versus time for SiC.
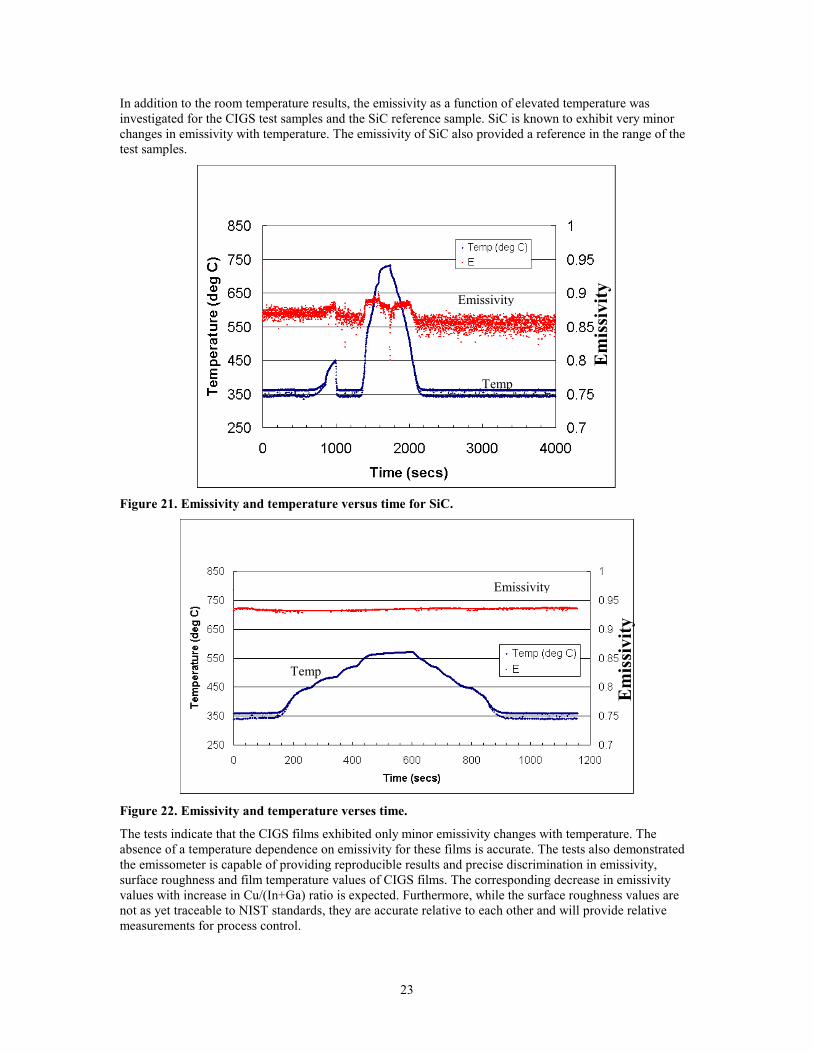
Figure 22. Emissivity and temperature verses time.
The tests indicate that the CIGS films exhibited only minor emissivity changes with temperature. The absence of a temperature dependence on emissivity for these films is accurate. The tests also demonstrated the emissometer is capable of providing reproducible results and precise discrimination in emissivity, surface roughness and film temperature values of CIGS films. The corresponding decrease in emissivity values with increase in Cu/(In+Ga) ratio is expected. Furthermore, while the surface roughness values are not as yet traceable to NIST standards, they are accurate relative to each other and will provide relative measurements for process control.
Emissivity
EmissivityE
mis
sivi
ty
Em
issi
vity
Temp
Temp
24
As discussed above, temperature measurements can be performed if the emissivity, probe-sample distance and surface roughness are known and do not significantly change over time. However, for the CIGS process, in-situ emissivity measurements must be independently performed to provide accurate temperature measurements. Furthermore, sample distance and surface roughness must be known if reflectivity measurements are used to ascertain the emissivity. A system has been developed that can simultaneously measure any two of these three parameters (surface roughness, temperature, and emissivity).
While these initial results are encouraging, additional experiments must be performed to determine if the emissometer can provide useful process control information from continuously moving CIGS thin film production inside a Se containing vacuum deposition system. The main issues yet to be determined include:
• Ability of the optical fiber based probe to accurately measure film properties from a moving stainless steel substrate with wrinkles and at high temperatures,
• Construction of an optical fiber bundle that can withstand high temperature Se environments, • Coating of optical surfaces, and • Correlation of measured values with actual film processing parameters and performance.
Ultimately, additional ex-situ systematic evaluations of CIGS films will not resolve these issues. Thus the next development step is to design and procure an optical fiber bundle that can be mounted in a CIGS vacuum deposition system and used to test the emissometer’s capabilities to perform accurate in-situ measurements.
5.2.2. Pyrometry A commercially available pyrometer was installed to provide in-situ temperature measurements as CIGS materials were deposited. The detection diode current setting on the controller provided signal strength adjustment. Since this instrument only measures IR light, emissivity values must be provided to obtain an accurate temperature measurement. For example, an emissivity of 0.13 was used for molten Cu. For the tests, an IR optical fiber was used with a feedthrough to provide light transport from inside the vacuum deposition system to the pyrometer controller. Inside the chamber, a 400 µm sapphire fiber was used to connect the IR fiber to a 2.03 mm sapphire rod. It was observed that changes in bending the fibers resulted in a measured temperature change due to the change in light throughput of the fibers. This is an issue that must be monitored, especially in terms of designing an optical fiber containment system that prevents movement and in carefully designing the fiber layout to minimize thermal expansion issues
Initial tests included placing a sapphire rod in the thermocouple well and in the pool to determine if improved temperature measurements could be obtained. Initially, a bare sapphire rod was placed in the thermocouple well. Inspection of the rod indicated that significant chemical reactions had occurred to most of the surface of the rod with the greatest etching occurring where the sapphire rod entered the well. A SiC sheath was used to limit Se exposure of the sapphire rod in the vicinity of the hot source in the hope that this would decrease corrosion. However, since the sheath was not sealed to allow for air to escape during evacuation, even limited exposure was sufficient to induce observable, albeit less damage to the sapphire rod. In addition the use of the closed end SiC sheath also meant that the pyrometer was actually reading the temperature of the sheath instead of the boat. This will most likely lead to an increased time delay and a small delta between the temperature of the boat and the sheath.
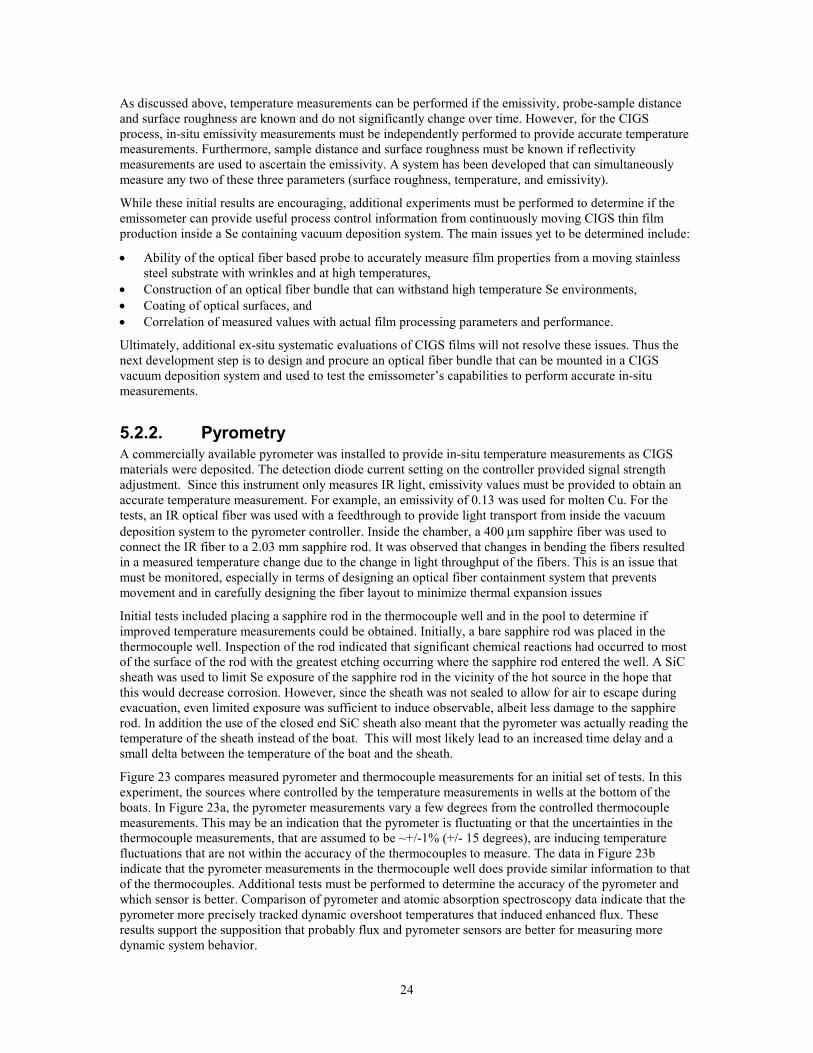
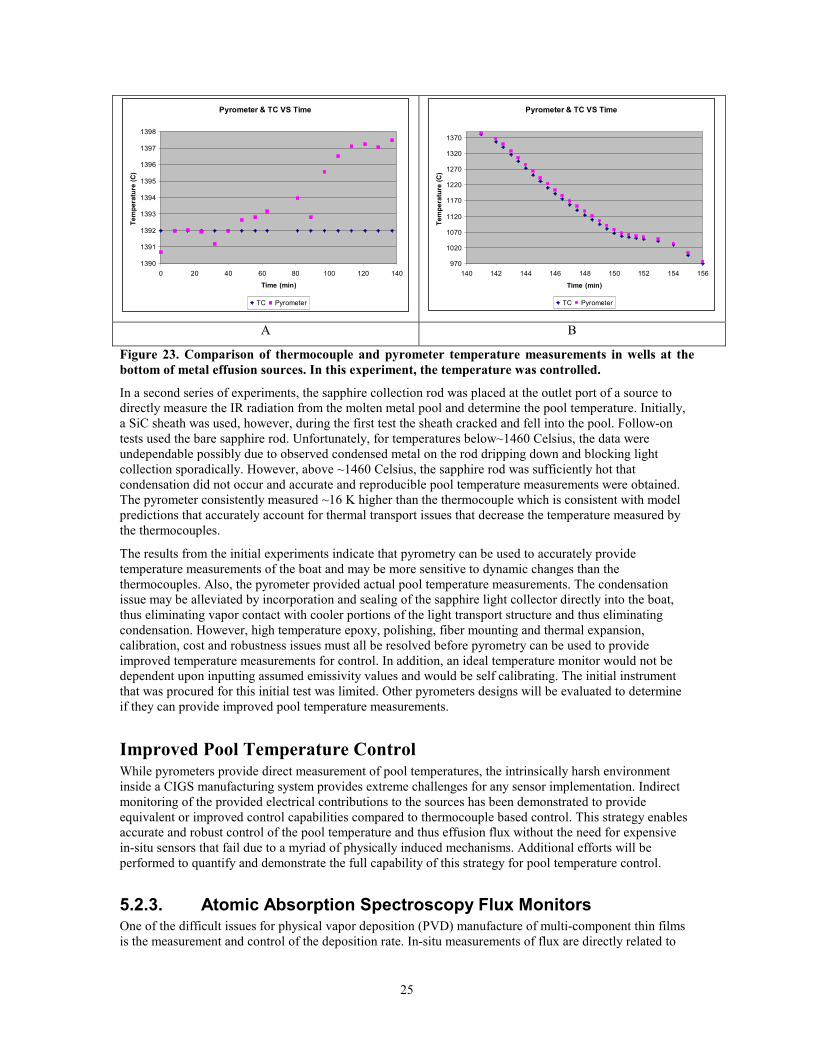
Figure 23 compares measured pyrometer and thermocouple measurements for an initial set of tests. In this experiment, the sources where controlled by the temperature measurements in wells at the bottom of the boats. In Figure 23a, the pyrometer measurements vary a few degrees from the controlled thermocouple measurements. This may be an indication that the pyrometer is fluctuating or that the uncertainties in the thermocouple measurements, that are assumed to be ~+/-1% (+/- 15 degrees), are inducing temperature fluctuations that are not within the accuracy of the thermocouples to measure. The data in Figure 23b indicate that the pyrometer measurements in the thermocouple well does provide similar information to that of the thermocouples. Additional tests must be performed to determine the accuracy of the pyrometer and which sensor is better. Comparison of pyrometer and atomic absorption spectroscopy data indicate that the pyrometer more precisely tracked dynamic overshoot temperatures that induced enhanced flux. These results support the supposition that probably flux and pyrometer sensors are better for measuring more dynamic system behavior.
25
Pyrometer & TC VS Time
1390
1391
1392
1393
1394
1395
1396
1397
1398
0 20 40 60 80 100 120 140
Time (min)
Tem
pera
ture
(C)
TC Pyrometer
Pyrometer & TC VS Time
970
1020
1070
1120
1170
1220
1270
1320
1370
140 142 144 146 148 150 152 154 156
Time (min)
Tem
pera
ture
(C)
TC Pyrometer A B
Figure 23. Comparison of thermocouple and pyrometer temperature measurements in wells at the bottom of metal effusion sources. In this experiment, the temperature was controlled.
In a second series of experiments, the sapphire collection rod was placed at the outlet port of a source to directly measure the IR radiation from the molten metal pool and determine the pool temperature. Initially, a SiC sheath was used, however, during the first test the sheath cracked and fell into the pool. Follow-on tests used the bare sapphire rod. Unfortunately, for temperatures below~1460 Celsius, the data were undependable possibly due to observed condensed metal on the rod dripping down and blocking light collection sporadically. However, above ~1460 Celsius, the sapphire rod was sufficiently hot that condensation did not occur and accurate and reproducible pool temperature measurements were obtained. The pyrometer consistently measured ~16 K higher than the thermocouple which is consistent with model predictions that accurately account for thermal transport issues that decrease the temperature measured by the thermocouples.
The results from the initial experiments indicate that pyrometry can be used to accurately provide temperature measurements of the boat and may be more sensitive to dynamic changes than the thermocouples. Also, the pyrometer provided actual pool temperature measurements. The condensation issue may be alleviated by incorporation and sealing of the sapphire light collector directly into the boat, thus eliminating vapor contact with cooler portions of the light transport structure and thus eliminating condensation. However, high temperature epoxy, polishing, fiber mounting and thermal expansion, calibration, cost and robustness issues must all be resolved before pyrometry can be used to provide improved temperature measurements for control. In addition, an ideal temperature monitor would not be dependent upon inputting assumed emissivity values and would be self calibrating. The initial instrument that was procured for this initial test was limited. Other pyrometers designs will be evaluated to determine if they can provide improved pool temperature measurements.
Improved Pool Temperature Control While pyrometers provide direct measurement of pool temperatures, the intrinsically harsh environment inside a CIGS manufacturing system provides extreme challenges for any sensor implementation. Indirect monitoring of the provided electrical contributions to the sources has been demonstrated to provide equivalent or improved control capabilities compared to thermocouple based control. This strategy enables accurate and robust control of the pool temperature and thus effusion flux without the need for expensive in-situ sensors that fail due to a myriad of physically induced mechanisms. Additional efforts will be performed to quantify and demonstrate the full capability of this strategy for pool temperature control.
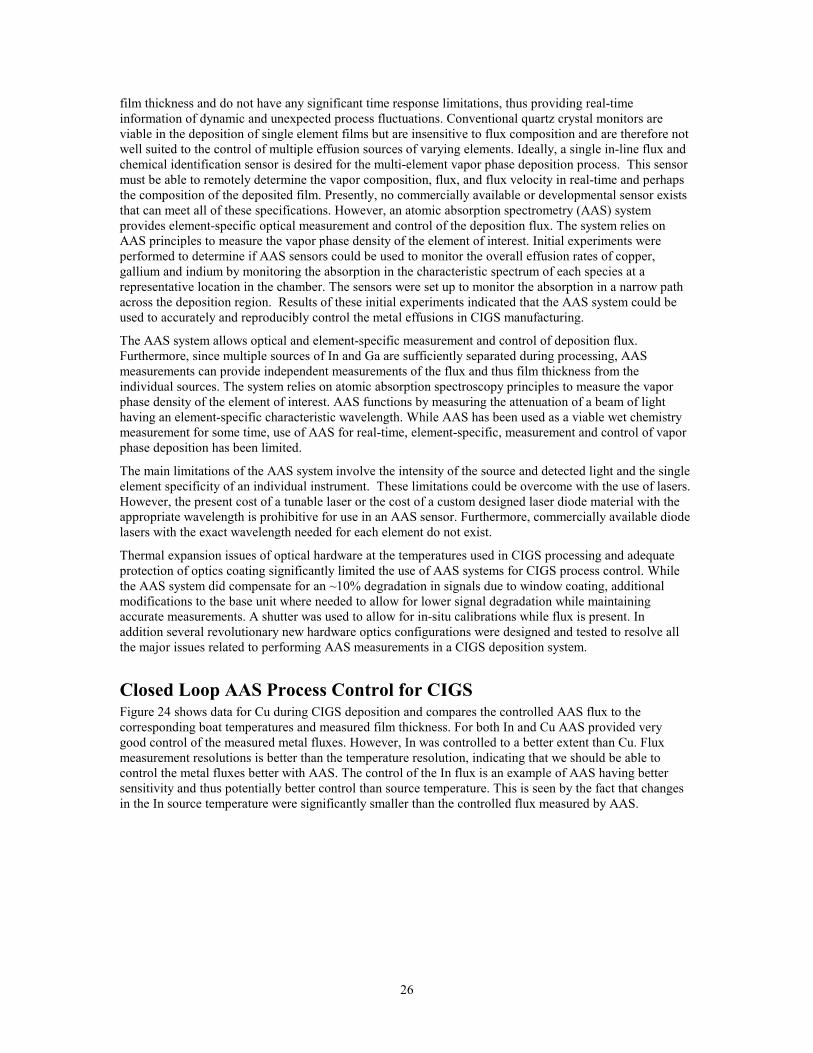
5.2.3. Atomic Absorption Spectroscopy Flux Monitors One of the difficult issues for physical vapor deposition (PVD) manufacture of multi-component thin films is the measurement and control of the deposition rate. In-situ measurements of flux are directly related to
26
film thickness and do not have any significant time response limitations, thus providing real-time information of dynamic and unexpected process fluctuations. Conventional quartz crystal monitors are viable in the deposition of single element films but are insensitive to flux composition and are therefore not well suited to the control of multiple effusion sources of varying elements. Ideally, a single in-line flux and chemical identification sensor is desired for the multi-element vapor phase deposition process. This sensor must be able to remotely determine the vapor composition, flux, and flux velocity in real-time and perhaps the composition of the deposited film. Presently, no commercially available or developmental sensor exists that can meet all of these specifications. However, an atomic absorption spectrometry (AAS) system provides element-specific optical measurement and control of the deposition flux. The system relies on AAS principles to measure the vapor phase density of the element of interest. Initial experiments were performed to determine if AAS sensors could be used to monitor the overall effusion rates of copper, gallium and indium by monitoring the absorption in the characteristic spectrum of each species at a representative location in the chamber. The sensors were set up to monitor the absorption in a narrow path across the deposition region. Results of these initial experiments indicated that the AAS system could be used to accurately and reproducibly control the metal effusions in CIGS manufacturing.
The AAS system allows optical and element-specific measurement and control of deposition flux. Furthermore, since multiple sources of In and Ga are sufficiently separated during processing, AAS measurements can provide independent measurements of the flux and thus film thickness from the individual sources. The system relies on atomic absorption spectroscopy principles to measure the vapor phase density of the element of interest. AAS functions by measuring the attenuation of a beam of light having an element-specific characteristic wavelength. While AAS has been used as a viable wet chemistry measurement for some time, use of AAS for real-time, element-specific, measurement and control of vapor phase deposition has been limited.
The main limitations of the AAS system involve the intensity of the source and detected light and the single element specificity of an individual instrument. These limitations could be overcome with the use of lasers. However, the present cost of a tunable laser or the cost of a custom designed laser diode material with the appropriate wavelength is prohibitive for use in an AAS sensor. Furthermore, commercially available diode lasers with the exact wavelength needed for each element do not exist.
Thermal expansion issues of optical hardware at the temperatures used in CIGS processing and adequate protection of optics coating significantly limited the use of AAS systems for CIGS process control. While the AAS system did compensate for an ~10% degradation in signals due to window coating, additional modifications to the base unit where needed to allow for lower signal degradation while maintaining accurate measurements. A shutter was used to allow for in-situ calibrations while flux is present. In addition several revolutionary new hardware optics configurations were designed and tested to resolve all the major issues related to performing AAS measurements in a CIGS deposition system.
Closed Loop AAS Process Control for CIGS Figure 24 shows data for Cu during CIGS deposition and compares the controlled AAS flux to the corresponding boat temperatures and measured film thickness. For both In and Cu AAS provided very good control of the measured metal fluxes. However, In was controlled to a better extent than Cu. Flux measurement resolutions is better than the temperature resolution, indicating that we should be able to control the metal fluxes better with AAS. The control of the In flux is an example of AAS having better sensitivity and thus potentially better control than source temperature. This is seen by the fact that changes in the In source temperature were significantly smaller than the controlled flux measured by AAS.
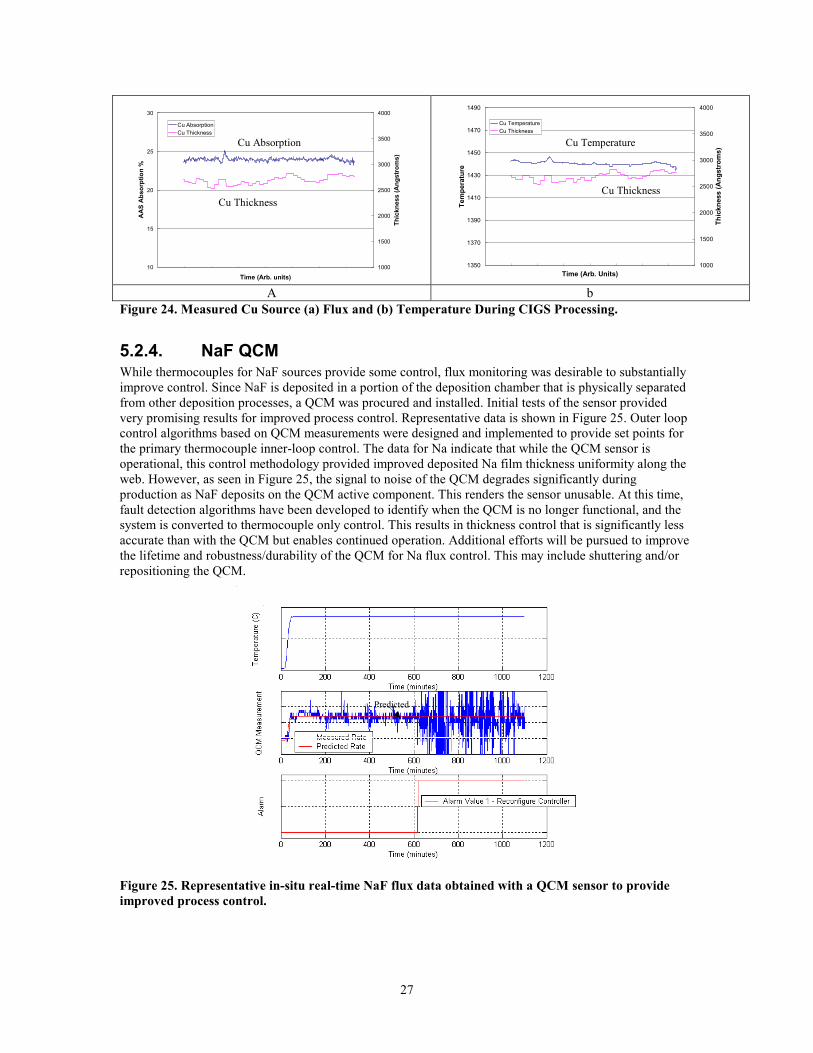
27
10
15
20
25
30
Time (Arb. units)
AA
S A
bsor
ptio
n %
1000
1500
2000
2500
3000
3500
4000
Thic
knes
s (A
ngst
rom
s)
Cu AbsorptionCu Thickness
1350
1370
1390
1410
1430
1450
1470
1490
Time (Arb. Units)
Tem
pera
ture
1000
1500
2000
2500
3000
3500
4000
Thic
knes
s (A
ngst
rom
s)
Cu TemperatureCu Thickness
A b
Figure 24. Measured Cu Source (a) Flux and (b) Temperature During CIGS Processing.
5.2.4. NaF QCM While thermocouples for NaF sources provide some control, flux monitoring was desirable to substantially improve control. Since NaF is deposited in a portion of the deposition chamber that is physically separated from other deposition processes, a QCM was procured and installed. Initial tests of the sensor provided very promising results for improved process control. Representative data is shown in Figure 25. Outer loop control algorithms based on QCM measurements were designed and implemented to provide set points for the primary thermocouple inner-loop control. The data for Na indicate that while the QCM sensor is operational, this control methodology provided improved deposited Na film thickness uniformity along the web. However, as seen in Figure 25, the signal to noise of the QCM degrades significantly during production as NaF deposits on the QCM active component. This renders the sensor unusable. At this time, fault detection algorithms have been developed to identify when the QCM is no longer functional, and the system is converted to thermocouple only control. This results in thickness control that is significantly less accurate than with the QCM but enables continued operation. Additional efforts will be pursued to improve the lifetime and robustness/durability of the QCM for Na flux control. This may include shuttering and/or repositioning the QCM.
Figure 25. Representative in-situ real-time NaF flux data obtained with a QCM sensor to provide improved process control.
Cu Absorption
Cu Thickness Cu Thickness
Cu Temperature
Predicted
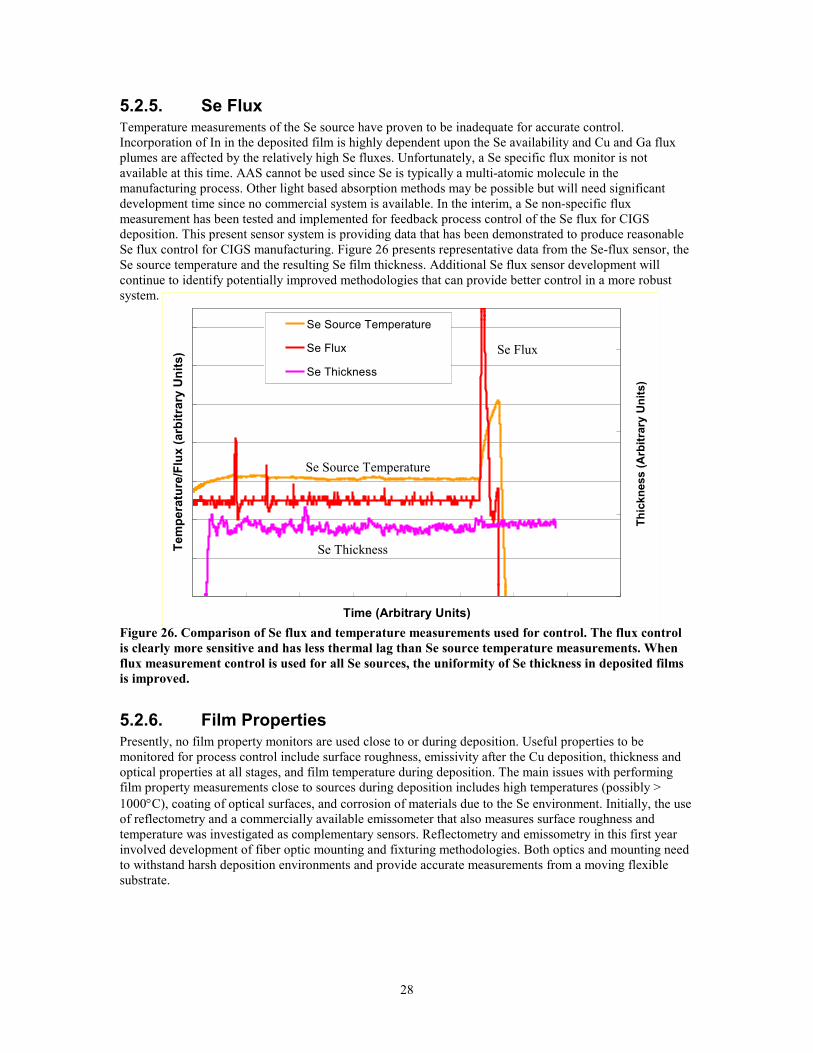
28
5.2.5. Se Flux Temperature measurements of the Se source have proven to be inadequate for accurate control. Incorporation of In in the deposited film is highly dependent upon the Se availability and Cu and Ga flux plumes are affected by the relatively high Se fluxes. Unfortunately, a Se specific flux monitor is not available at this time. AAS cannot be used since Se is typically a multi-atomic molecule in the manufacturing process. Other light based absorption methods may be possible but will need significant development time since no commercial system is available. In the interim, a Se non-specific flux measurement has been tested and implemented for feedback process control of the Se flux for CIGS deposition. This present sensor system is providing data that has been demonstrated to produce reasonable Se flux control for CIGS manufacturing. Figure 26 presents representative data from the Se-flux sensor, the Se source temperature and the resulting Se film thickness. Additional Se flux sensor development will continue to identify potentially improved methodologies that can provide better control in a more robust system.
Figure 26. Comparison of Se flux and temperature measurements used for control. The flux control is clearly more sensitive and has less thermal lag than Se source temperature measurements. When flux measurement control is used for all Se sources, the uniformity of Se thickness in deposited films is improved.
5.2.6. Film Properties Presently, no film property monitors are used close to or during deposition. Useful properties to be monitored for process control include surface roughness, emissivity after the Cu deposition, thickness and optical properties at all stages, and film temperature during deposition. The main issues with performing film property measurements close to sources during deposition includes high temperatures (possibly > 1000°C), coating of optical surfaces, and corrosion of materials due to the Se environment. Initially, the use of reflectometry and a commercially available emissometer that also measures surface roughness and temperature was investigated as complementary sensors. Reflectometry and emissometry in this first year involved development of fiber optic mounting and fixturing methodologies. Both optics and mounting need to withstand harsh deposition environments and provide accurate measurements from a moving flexible substrate.
Time (Arbitrary Units)
Tem
pera
ture
/Flu
x (a
rbitr
ary
Uni
ts)
Thic
knes
s (A
rbitr
ary
Uni
ts)
Se Source Temperature
Se Flux
Se Thickness
Se Source Temperature
Se Flux
Se Thickness
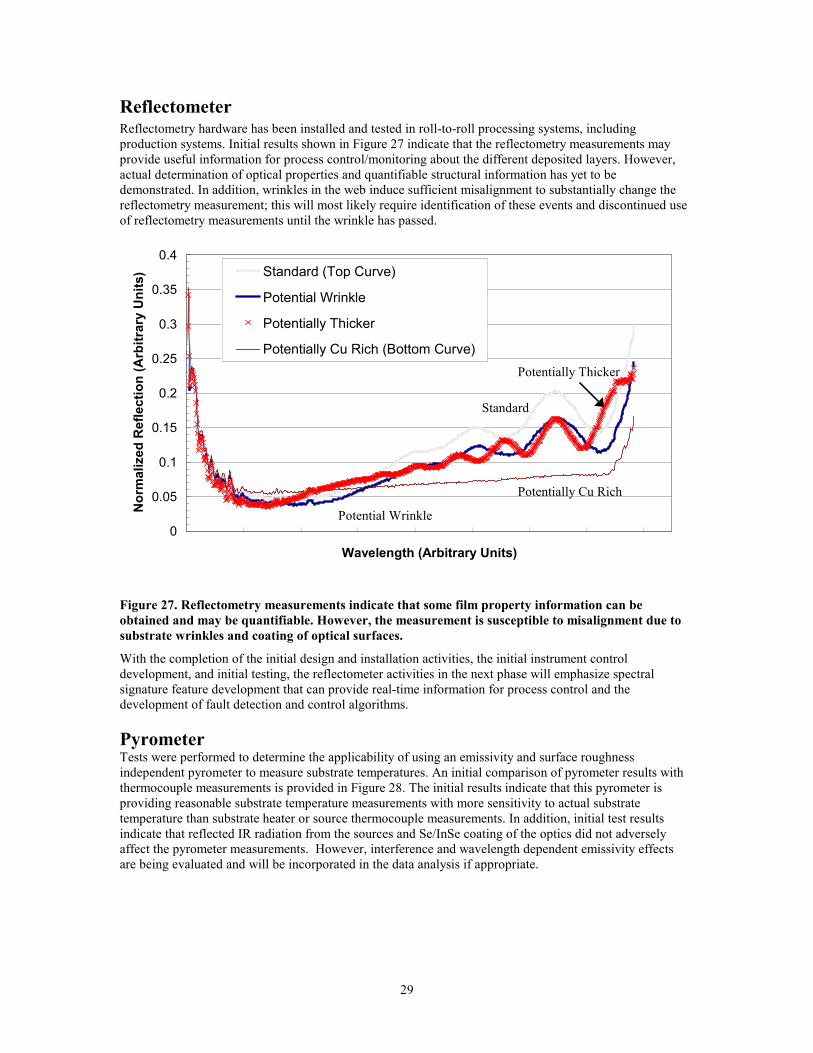
29
Reflectometer Reflectometry hardware has been installed and tested in roll-to-roll processing systems, including production systems. Initial results shown in Figure 27 indicate that the reflectometry measurements may provide useful information for process control/monitoring about the different deposited layers. However, actual determination of optical properties and quantifiable structural information has yet to be demonstrated. In addition, wrinkles in the web induce sufficient misalignment to substantially change the reflectometry measurement; this will most likely require identification of these events and discontinued use of reflectometry measurements until the wrinkle has passed.
Figure 27. Reflectometry measurements indicate that some film property information can be obtained and may be quantifiable. However, the measurement is susceptible to misalignment due to substrate wrinkles and coating of optical surfaces.
With the completion of the initial design and installation activities, the initial instrument control development, and initial testing, the reflectometer activities in the next phase will emphasize spectral signature feature development that can provide real-time information for process control and the development of fault detection and control algorithms.
Pyrometer Tests were performed to determine the applicability of using an emissivity and surface roughness independent pyrometer to measure substrate temperatures. An initial comparison of pyrometer results with thermocouple measurements is provided in Figure 28. The initial results indicate that this pyrometer is providing reasonable substrate temperature measurements with more sensitivity to actual substrate temperature than substrate heater or source thermocouple measurements. In addition, initial test results indicate that reflected IR radiation from the sources and Se/InSe coating of the optics did not adversely affect the pyrometer measurements. However, interference and wavelength dependent emissivity effects are being evaluated and will be incorporated in the data analysis if appropriate.
0
0.05
0.1
0.15
0.2
0.25
0.3
0.35
0.4
Wavelength (Arbitrary Units)
Nor
mal
ized
Ref
lect
ion
(Arb
itrar
y U
nits
) Standard (Top Curve)
Potential Wrinkle
Potentially Thicker
Potentially Cu Rich (Bottom Curve)
Standard
Potential Wrinkle
Potentially Cu Rich
Potentially Thicker
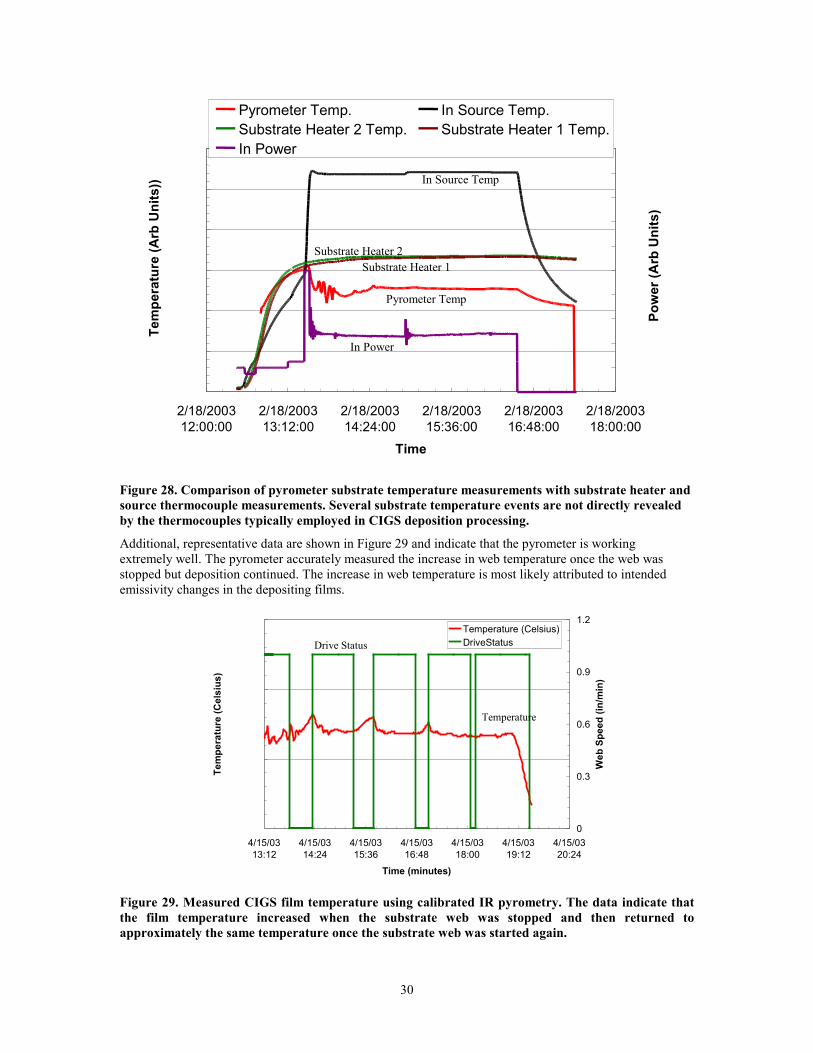
30
2/18/2003 12:00:00
2/18/2003 13:12:00
2/18/200314:24:00
2/18/200315:36:00
2/18/200316:48:00
2/18/2003 18:00:00
Time
Tem
pera
ture
(Arb
Uni
ts))
Pow
er (A
rb U
nits
)
Pyrometer Temp. In Source Temp. Substrate Heater 2 Temp. Substrate Heater 1 Temp. In Power
Figure 28. Comparison of pyrometer substrate temperature measurements with substrate heater and source thermocouple measurements. Several substrate temperature events are not directly revealed by the thermocouples typically employed in CIGS deposition processing.
Additional, representative data are shown in Figure 29 and indicate that the pyrometer is working extremely well. The pyrometer accurately measured the increase in web temperature once the web was stopped but deposition continued. The increase in web temperature is most likely attributed to intended emissivity changes in the depositing films.
300.00
400.00
500.00
600.00
4/15/0313:12
4/15/0314:24
4/15/0315:36
4/15/0316:48
4/15/0318:00
4/15/0319:12
4/15/0320:24
Time (minutes)
Tem
pera
ture
(Cel
sius
)
0
0.3
0.6
0.9
1.2
Web
Spe
ed (i
n/m
in)
Temperature (Celsius)DriveStatus
Figure 29. Measured CIGS film temperature using calibrated IR pyrometry. The data indicate that the film temperature increased when the substrate web was stopped and then returned to approximately the same temperature once the substrate web was started again.
In Source Temp
Substrate Heater 2 Substrate Heater 1
Pyrometer Temp
In Power
Temperature
Drive Status
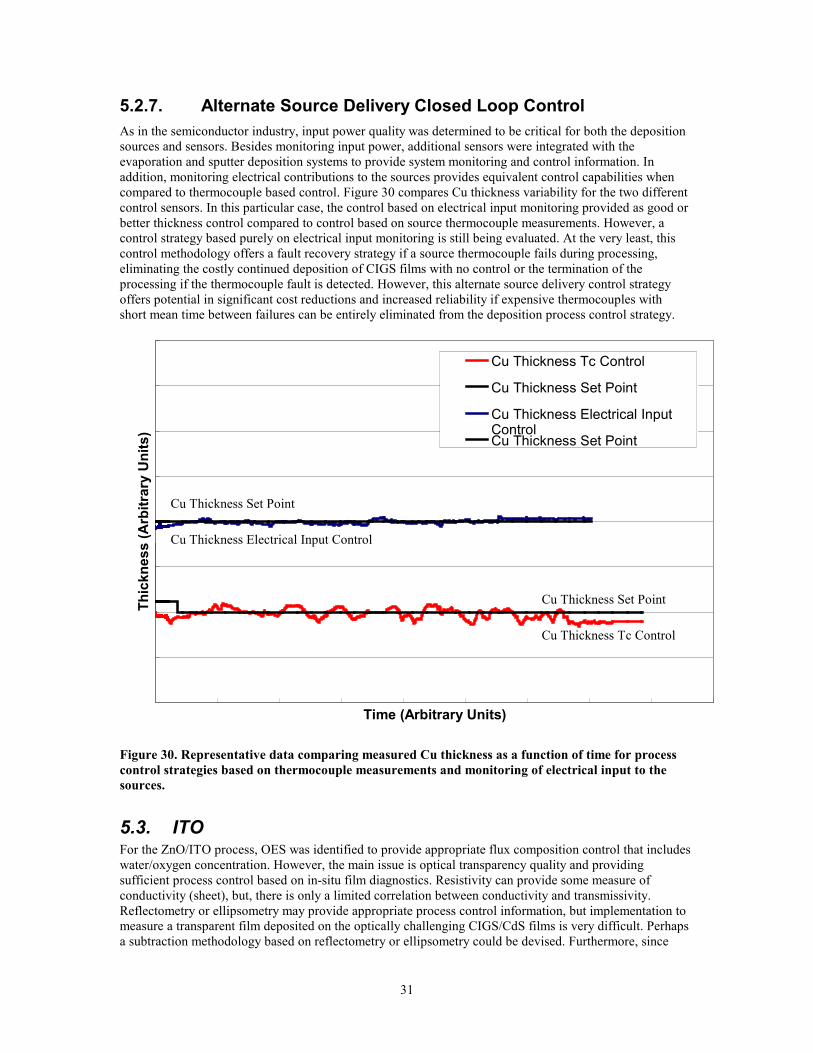
31
5.2.7. Alternate Source Delivery Closed Loop Control As in the semiconductor industry, input power quality was determined to be critical for both the deposition sources and sensors. Besides monitoring input power, additional sensors were integrated with the evaporation and sputter deposition systems to provide system monitoring and control information. In addition, monitoring electrical contributions to the sources provides equivalent control capabilities when compared to thermocouple based control. Figure 30 compares Cu thickness variability for the two different control sensors. In this particular case, the control based on electrical input monitoring provided as good or better thickness control compared to control based on source thermocouple measurements. However, a control strategy based purely on electrical input monitoring is still being evaluated. At the very least, this control methodology offers a fault recovery strategy if a source thermocouple fails during processing, eliminating the costly continued deposition of CIGS films with no control or the termination of the processing if the thermocouple fault is detected. However, this alternate source delivery control strategy offers potential in significant cost reductions and increased reliability if expensive thermocouples with short mean time between failures can be entirely eliminated from the deposition process control strategy.
Time (Arbitrary Units)
Thic
knes
s (A
rbitr
ary
Uni
ts)
Cu Thickness Tc Control
Cu Thickness Set Point
Cu Thickness Electrical InputControlCu Thickness Set Point
Figure 30. Representative data comparing measured Cu thickness as a function of time for process control strategies based on thermocouple measurements and monitoring of electrical input to the sources.
5.3. ITO For the ZnO/ITO process, OES was identified to provide appropriate flux composition control that includes water/oxygen concentration. However, the main issue is optical transparency quality and providing sufficient process control based on in-situ film diagnostics. Resistivity can provide some measure of conductivity (sheet), but, there is only a limited correlation between conductivity and transmissivity. Reflectometry or ellipsometry may provide appropriate process control information, but implementation to measure a transparent film deposited on the optically challenging CIGS/CdS films is very difficult. Perhaps a subtraction methodology based on reflectometry or ellipsometry could be devised. Furthermore, since
Cu Thickness Set Point
Cu Thickness Electrical Input Control
Cu Thickness Set Point
Cu Thickness Tc Control
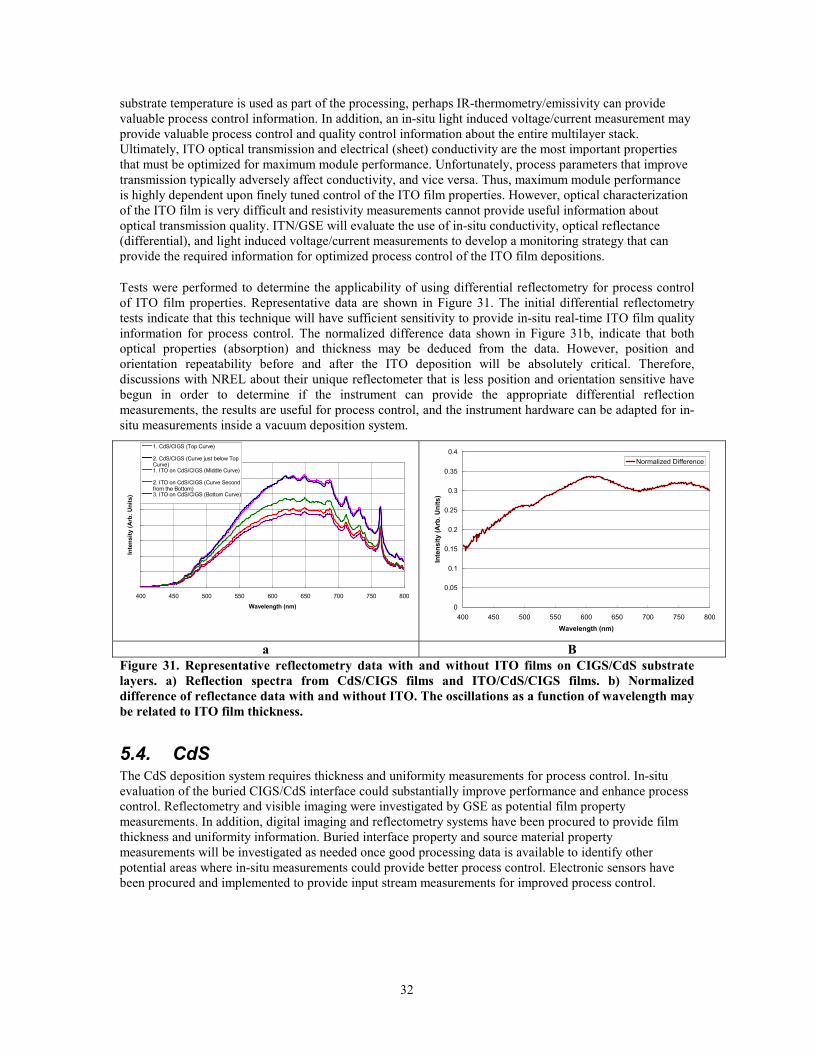
32
substrate temperature is used as part of the processing, perhaps IR-thermometry/emissivity can provide valuable process control information. In addition, an in-situ light induced voltage/current measurement may provide valuable process control and quality control information about the entire multilayer stack. Ultimately, ITO optical transmission and electrical (sheet) conductivity are the most important properties that must be optimized for maximum module performance. Unfortunately, process parameters that improve transmission typically adversely affect conductivity, and vice versa. Thus, maximum module performance is highly dependent upon finely tuned control of the ITO film properties. However, optical characterization of the ITO film is very difficult and resistivity measurements cannot provide useful information about optical transmission quality. ITN/GSE will evaluate the use of in-situ conductivity, optical reflectance (differential), and light induced voltage/current measurements to develop a monitoring strategy that can provide the required information for optimized process control of the ITO film depositions.
Tests were performed to determine the applicability of using differential reflectometry for process control of ITO film properties. Representative data are shown in Figure 31. The initial differential reflectometry tests indicate that this technique will have sufficient sensitivity to provide in-situ real-time ITO film quality information for process control. The normalized difference data shown in Figure 31b, indicate that both optical properties (absorption) and thickness may be deduced from the data. However, position and orientation repeatability before and after the ITO deposition will be absolutely critical. Therefore, discussions with NREL about their unique reflectometer that is less position and orientation sensitive have begun in order to determine if the instrument can provide the appropriate differential reflection measurements, the results are useful for process control, and the instrument hardware can be adapted for in-situ measurements inside a vacuum deposition system.
400 450 500 550 600 650 700 750 800
Wavelength (nm)
Inte
nsity
(Arb
. Uni
ts)
1. CdS/CIGS (Top Curve)
2. CdS/CIGS (Curve just below TopCurve)1. ITO on CdS/CIGS (Middle Curve)
2. ITO on CdS/CIGS (Curve Secondfrom the Bottom)3. ITO on CdS/CIGS (Bottom Curve)
0
0.05
0.1
0.15
0.2
0.25
0.3
0.35
0.4
400 450 500 550 600 650 700 750 800
Wavelength (nm)
Inte
nsity
(Arb
. Uni
ts)
Normalized Difference
a B
Figure 31. Representative reflectometry data with and without ITO films on CIGS/CdS substrate layers. a) Reflection spectra from CdS/CIGS films and ITO/CdS/CIGS films. b) Normalized difference of reflectance data with and without ITO. The oscillations as a function of wavelength may be related to ITO film thickness.
5.4. CdS The CdS deposition system requires thickness and uniformity measurements for process control. In-situ evaluation of the buried CIGS/CdS interface could substantially improve performance and enhance process control. Reflectometry and visible imaging were investigated by GSE as potential film property measurements. In addition, digital imaging and reflectometry systems have been procured to provide film thickness and uniformity information. Buried interface property and source material property measurements will be investigated as needed once good processing data is available to identify other potential areas where in-situ measurements could provide better process control. Electronic sensors have been procured and implemented to provide input stream measurements for improved process control.
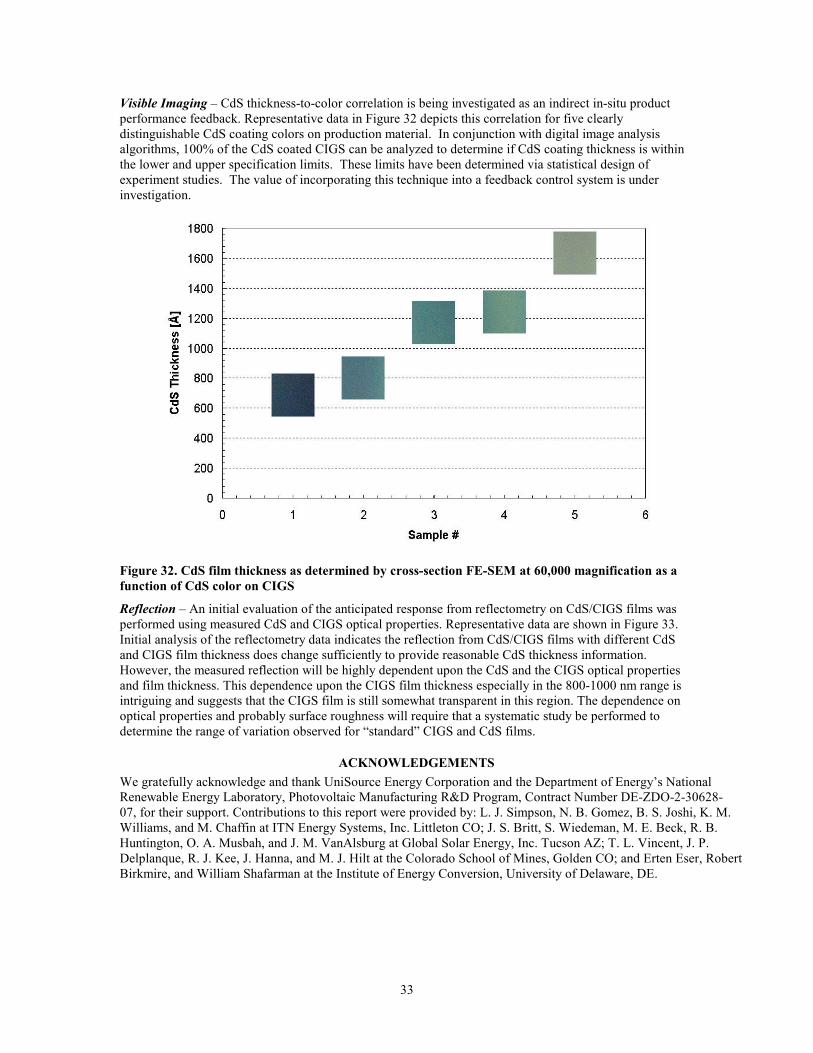
33
Visible Imaging – CdS thickness-to-color correlation is being investigated as an indirect in-situ product performance feedback. Representative data in Figure 32 depicts this correlation for five clearly distinguishable CdS coating colors on production material. In conjunction with digital image analysis algorithms, 100% of the CdS coated CIGS can be analyzed to determine if CdS coating thickness is within the lower and upper specification limits. These limits have been determined via statistical design of experiment studies. The value of incorporating this technique into a feedback control system is under investigation.
Figure 32. CdS film thickness as determined by cross-section FE-SEM at 60,000 magnification as a function of CdS color on CIGS
Reflection – An initial evaluation of the anticipated response from reflectometry on CdS/CIGS films was performed using measured CdS and CIGS optical properties. Representative data are shown in Figure 33. Initial analysis of the reflectometry data indicates the reflection from CdS/CIGS films with different CdS and CIGS film thickness does change sufficiently to provide reasonable CdS thickness information. However, the measured reflection will be highly dependent upon the CdS and the CIGS optical properties and film thickness. This dependence upon the CIGS film thickness especially in the 800-1000 nm range is intriguing and suggests that the CIGS film is still somewhat transparent in this region. The dependence on optical properties and probably surface roughness will require that a systematic study be performed to determine the range of variation observed for “standard” CIGS and CdS films.
ACKNOWLEDGEMENTS We gratefully acknowledge and thank UniSource Energy Corporation and the Department of Energy’s National Renewable Energy Laboratory, Photovoltaic Manufacturing R&D Program, Contract Number DE-ZDO-2-30628-07, for their support. Contributions to this report were provided by: L. J. Simpson, N. B. Gomez, B. S. Joshi, K. M. Williams, and M. Chaffin at ITN Energy Systems, Inc. Littleton CO; J. S. Britt, S. Wiedeman, M. E. Beck, R. B. Huntington, O. A. Musbah, and J. M. VanAlsburg at Global Solar Energy, Inc. Tucson AZ; T. L. Vincent, J. P. Delplanque, R. J. Kee, J. Hanna, and M. J. Hilt at the Colorado School of Mines, Golden CO; and Erten Eser, Robert Birkmire, and William Shafarman at the Institute of Energy Conversion, University of Delaware, DE.
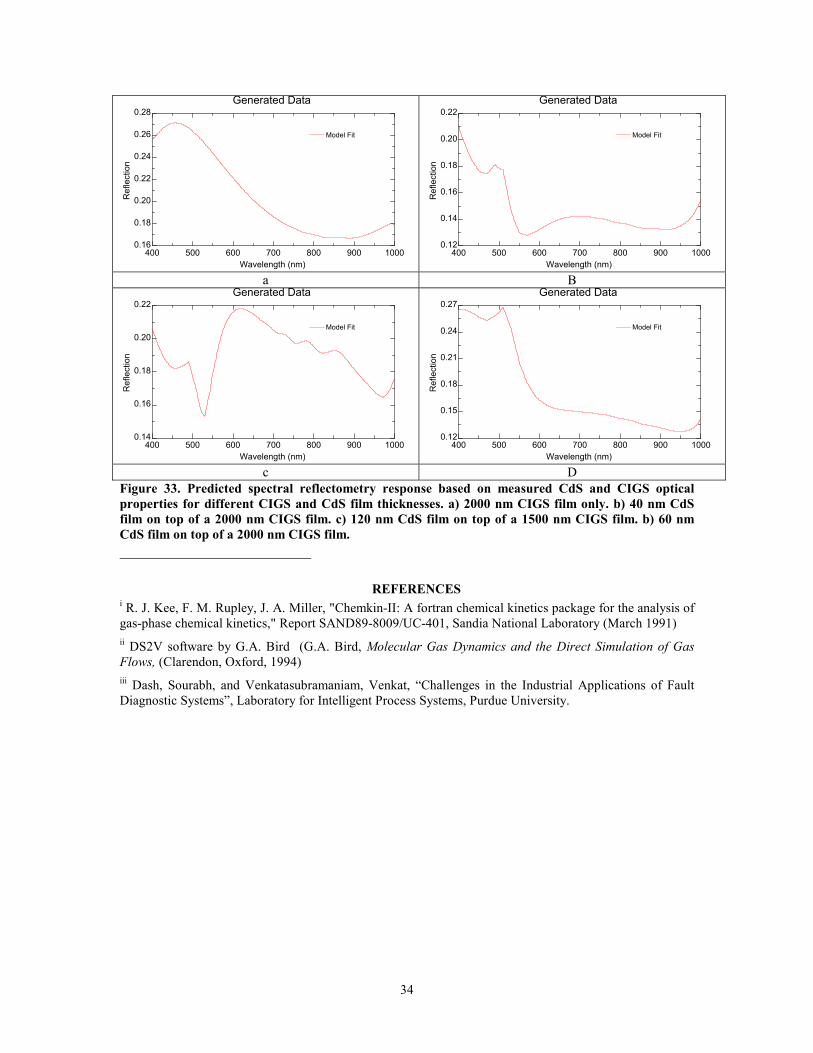
34
Generated Data
Wavelength (nm)400 500 600 700 800 900 1000
Ref
lect
ion
0.16
0.18
0.20
0.22
0.24
0.26
0.28
Model Fit
Generated Data
Wavelength (nm)400 500 600 700 800 900 1000
Ref
lect
ion
0.12
0.14
0.16
0.18
0.20
0.22
Model Fit
a B
Generated Data
Wavelength (nm)400 500 600 700 800 900 1000
Ref
lect
ion
0.14
0.16
0.18
0.20
0.22
Model Fit
Generated Data
Wavelength (nm)400 500 600 700 800 900 1000
Ref
lect
ion
0.12
0.15
0.18
0.21
0.24
0.27
Model Fit
c D
Figure 33. Predicted spectral reflectometry response based on measured CdS and CIGS optical properties for different CIGS and CdS film thicknesses. a) 2000 nm CIGS film only. b) 40 nm CdS film on top of a 2000 nm CIGS film. c) 120 nm CdS film on top of a 1500 nm CIGS film. b) 60 nm CdS film on top of a 2000 nm CIGS film.
REFERENCES i R. J. Kee, F. M. Rupley, J. A. Miller, "Chemkin-II: A fortran chemical kinetics package for the analysis of gas-phase chemical kinetics," Report SAND89-8009/UC-401, Sandia National Laboratory (March 1991) ii DS2V software by G.A. Bird (G.A. Bird, Molecular Gas Dynamics and the Direct Simulation of Gas Flows, (Clarendon, Oxford, 1994) iii Dash, Sourabh, and Venkatasubramaniam, Venkat, “Challenges in the Industrial Applications of Fault Diagnostic Systems”, Laboratory for Intelligent Process Systems, Purdue University.

REPORT DOCUMENTATION PAGE
Form Approved OMB NO. 0704-0188
Public reporting burden for this collection of information is estimated to average 1 hour per response, including the time for reviewing instructions, searching existing data sources, gathering and maintaining the data needed, and completing and reviewing the collection of information. Send comments regarding this burden estimate or any other aspect of this collection of information, including suggestions for reducing this burden, to Washington Headquarters Services, Directorate for Information Operations and Reports, 1215 Jefferson Davis Highway, Suite 1204, Arlington, VA 22202-4302, and to the Office of Management and Budget, Paperwork Reduction Project (0704-0188), Washington, DC 20503. 1. AGENCY USE ONLY (Leave blank)
2. REPORT DATE
February 2004
3. REPORT TYPE AND DATES COVERED
Phase 1 Final Technical Report March 2003
4. TITLE AND SUBTITLE Trajectory Oriented and Fault Tolerant Based Intelligent Process Control for Flexible CIGS PV Module Manufacturing: Phase 1 Final Technical Report, March 2003
6. AUTHOR(S) L. Simpson
5. FUNDING NUMBERS
PVP46101 ZDO-2-30628-07
7. PERFORMING ORGANIZATION NAME(S) AND ADDRESS(ES) ITN Energy Systems, Inc. 8130 Shaffer Parkway Littleton, Colorado 80227
8. PERFORMING ORGANIZATION
REPORT NUMBER
9. SPONSORING/MONITORING AGENCY NAME(S) AND ADDRESS(ES)
National Renewable Energy Laboratory 1617 Cole Blvd. Golden, CO 80401-3393
10. SPONSORING/MONITORING
AGENCY REPORT NUMBER NREL/SR-520-35146
11. SUPPLEMENTARY NOTES
NREL Technical Monitor: R. L. Mitchell 12a. DISTRIBUTION/AVAILABILITY STATEMENT
National Technical Information Service U.S. Department of Commerce 5285 Port Royal Road
Springfield, VA 22161
12b. DISTRIBUTION CODE
13. ABSTRACT (Maximum 200 words): With the assistance of NREL’s PV Manufacturing R&D program, ITN Energy Systems, Inc. and Global Solar Energy, Inc. continued the advancement of CIGS production technology by developing trajectory-oriented predictive/control models, fault-tolerance control, control-platform development, in-situ sensors, and process improvements. Modeling activities to date include developing physics-based and empirical models for CIGS and physics-based Mo deposition processing, implementing model-based control for CIGS processing, and applying predictive models to the construction of new evaporation sources. Model-based control is enabled by implementing reduced or empirical models into a control platform. Reliability improvement activities include systematic development of fault-prevention procedures (e.g., preventative maintenance schedules) and detection/reconfiguration of sensor and other hardware failures for the full range of CIGS PV production deposition processes. In-situ sensor development activities have resulted in improved control and indicate the potential for enhanced process status monitoring and control of all deposition processes. In spite of the short time since the program was initiated, substantial process improvements have been made, including significant improvement in CIGS uniformity, thickness control (e.g., 71% reduction in Cu variability), yield, and throughput.
15. NUMBER OF PAGES
14. SUBJECT TERMS: PV; module; fault tolerance control; control platform development; in-situ sensors; model-based control; deposition process; copper indium gallium diselenide (CIGS); trajectory-oriented control; intelligent process control; flexible manufacturing.
16. PRICE CODE
17. SECURITY CLASSIFICATION
OF REPORT Unclassified
18. SECURITY CLASSIFICATION
OF THIS PAGE Unclassified
19. SECURITY CLASSIFICATION
OF ABSTRACT Unclassified
20. LIMITATION OF ABSTRACT
UL
NSN 7540-01-280-5500 Standard Form 298 (Rev. 2-89) Prescribed by ANSI Std. Z39-18 298-102