training linux debugging for intel® x86/x64 · † debugging linux components by trace32 linux...
TRANSCRIPT

Training Linux Debugging for Intel® x86/x64
TRACE32 Online Help
TRACE32 Directory
TRACE32 Index
TRACE32 Training ............................................................................................................................
Training Intel® x86/x64 .................................................................................................................
Training Linux Debugging for Intel® x86/x64 .......................................................................... 1
Prolog ....................................................................................................................................... 4
Basic Terms on Embedded Linux .......................................................................................... 5
1.) Linux Components 5
The Kernel 5
Kernel Modules 6
Processes and Threads 6
Libraries (Shared Objects) 6
2.) The Linux Awareness 6
3.) Virtual Memory Management in Linux 8
Virtual Address Map of Linux 8
Debugger Memory Access 9
On Demand Paging 12
4.) Run-Mode vs. Stop-Mode Debugging 14
Hardware Based Debuggers 14
Software Based Debuggers 15
5.) Building the Kernel, a Kernel Module and a Simple Demo Application 17
Building The Kernel 17
Building a Kernel Module 18
Building a User Application 18
Setting up a Script for Linux-Aware Debugging .................................................................. 19
1.) Capture of Commands for a Script 19
2.) Linux Setup-Steps and -Commands 20
Debugger Reset for Linux Debugging 20
Debugger Setup 21
Set Single Step Behavior 23
Download the Kernel 27
Download the File System 29
Set up the Debugger Address Translation 29
Set up the Linux Awareness 31
Mark the Kernel Address Space 31
Boot Linux 32
Training Linux Debugging for Intel® x86/x64 1 ©1989-2019 Lauterbach GmbH

3.) Example Linux Setup-Scripts 33
Debugging the Linux Components ........................................................................................ 36
1.) Debugging Linux Components 36
1.1) The Kernel 36
Kernel Startup 36
Kernel Boot 38
Verifying Image and Symbols 40
Example: Debugging Built-in Device Drivers 41
1.2) Kernel Modules 46
1.3) Processes 49
Debugging a Process from the Start 49
Process Watch System 52
1.4) Threads 52
1.5) Libraries 53
2.) Linux specific Windows and Features 55
Display of System Resources 55
Task Related Breakpoints 56
Task Related Single Stepping 56
Task Context Display 57
Troubleshooting ...................................................................................................................... 59
Epilog ....................................................................................................................................... 60
Training Linux Debugging for Intel® x86/x64 2 ©1989-2019 Lauterbach GmbH
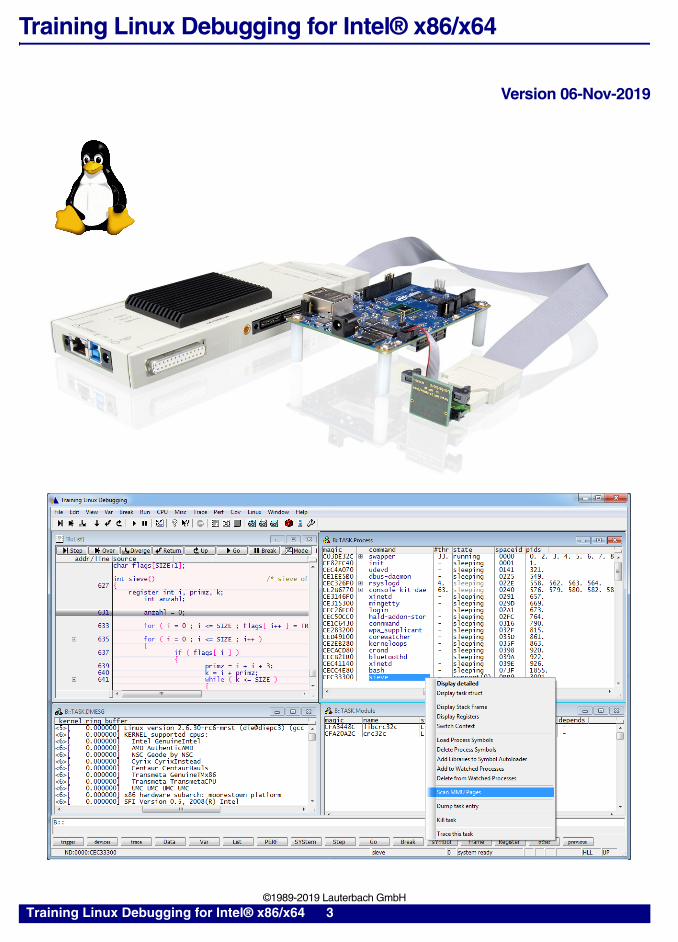
Training Linux Debugging for Intel® x86/x64
Version 06-Nov-2019
Training Linux Debugging for Intel® x86/x64 3 ©1989-2019 Lauterbach GmbH
Prolog
This training will have the main subjects:
• Basic terms on embedded Linux
• Building the kernel, a kernel module and a simple demo application
• Setting up a script for Linux-aware debugging
• Debugging Linux components by TRACE32 Linux menu
• Troubleshooting
Please note that this document does not cover all features of the Linux awareness. For a completedescription of the Linux awareness commands, refer to the “OS Awareness Manual Linux”(rtos_linux_stop.pdf).
The latest version of the training manual is available for download under:
www.lauterbach.com/training.html
Training Linux Debugging for Intel® x86/x64 4 ©1989-2019 Lauterbach GmbH

Basic Terms on Embedded Linux
This part describes essential basics and terms related to Linux and Linux-Debugging.
1. Linux Components
2. The Linux Awareness
3. Virtual Memory Management in Linux
4. Run-Mode vs. Stop-Mode Debugging
1.) Linux Components
From the point of view of a debugger, a Linux system consists of the following components:
• The Linux Kernel
• Kernel Modules
• Processes and Threads
• Libraries (Shared Objects)
Moreover, we can talk about two different spaces of executed code: kernel space with privileged rights whichincludes the kernel and kernel modules and user space with limited rights which includes processes,threads and libraries.
Please note that this training does not handle the debugging of bootloaders.
The Kernel
The Linux kernel is the most important part in a Linux system. It runs in privileged kernel space and takescare of hardware initialization, device drivers, process scheduling, interrupts, memory management... TheLinux kernel is generally contained in a statically linked executable in one of the object files supported byLinux (e.g. ELF) called “vmlinux”. You can also find the kernel in compressed binary format(zImage/uImage). You will see later in this training how to configure the Linux kernel for Linux-awaredebugging.
Kernel Threads:
It is often useful for the kernel to perform operations in the background. The kernel accomplishes this viakernel threads. Kernel threads exist solely in kernel space. The significant difference between kernel threadsand processes is that kernel threads operate in kernel space and do not have their own address space.
Training Linux Debugging for Intel® x86/x64 5 ©1989-2019 Lauterbach GmbH

Kernel Modules
Kernel modules (*.ko) are software packages that are loaded and linked dynamically to the kernel at runtime. They can be loaded and unloaded from the kernel within a user shell by the commands “insmod” and“rmmod”. Typically kernel modules contain code for device drivers, file systems, etc. Kernel modules run atkernel level with kernel privileges (supervisor).
Processes and Threads
A process is an application in the midst of execution. It also includes, additionally to executed code, a set ofresources such as open files, pending signals, a memory address space with one or more memorymappings...
Linux-Processes are encapsulated by memory protection. Each process has its own virtual memory whichcan only be accessed by this process and the kernel. Processes run in user space with limited privileges.
A process could have one or more threads of execution. Each thread includes a unique program counter,process stack and set of process registers. To the Linux kernel, there is no concept of a thread. Linuximplements all threads as standard processes. For Linux, a thread is a processes that shares certainresources with other processes.
In this training, you will also find the term “task” which denotes kernel threads, processes and threads.
Libraries (Shared Objects)
Libraries (shared objects, *.so) are commonly used software packages loaded and used by processes andlinked to them at run-time. Libraries run in the context and memory space of the process that loaded themhaving the same limited privilege as the owning process. Same as processes, also libraries are alwaysloaded and executed as a file through a file system.
2.) The Linux Awareness
Debugging an operating system like Linux requires special support from the debugger. We say that the debugger needs to be “aware” of the operating system. Since TRACE32 supports a wide range of target operating systems, this special support is not statically linked in the debugger software but can be dynamically loaded as an extension depending on which operating system is used. Additional commands, options and displays will be then available and simplify the debugging of the operating system.The set of files providing these operating system debugging capabilities is called here “awareness”.
To be able to read the task list or to allow process or module debugging, the Linux awareness accesses the kernel’s internal structures using the kernel symbols. Thus the kernel symbols must always be available otherwise Linux aware debugging will not be possible. The file vmlinux has to be compiled with debugging information enabled as will be shown later.
The Linux awareness files can be found in the TRACE32 installation directory under ~~/demo/<arch>/kernel/linux/
Training Linux Debugging for Intel® x86/x64 6 ©1989-2019 Lauterbach GmbH

You can check the version of the loaded Linux awareness in the VERSION.SOFTWARE window. This information will only be shown if the Linux awareness is already loaded. You will see later in this training how to load the Linux awareness.
Training Linux Debugging for Intel® x86/x64 7 ©1989-2019 Lauterbach GmbH

3.) Virtual Memory Management in Linux
Before actually going into the details on how to debug a Linux system with TRACE32, we need to look at the helping features of TRACE32 that make Linux debugging possible.
Virtual Address Map of Linux
We start by discussing the virtual address map used by a running Linux system. Basically the memory is split into two sections: one section is reserved for the kernel and the second one for the user applications. The kernel runs in Supervisor/Privileged mode and has full access to the whole system. Next to Supervisor/ Privileged mode there is User/Non-Privileged mode which is used for user space processes. While the CPU is in User/Non-Privileged mode, only parts of the memory are visible. Thus the kernel, which runs in Supervisor mode, has full visibility of the whole virtual address map, while the user processes have only a partial visibility. It’s the task of the kernel to maintain the virtual address map and also the virtual to physical address translations for each application/ process.
The kernel space is exclusively used by the kernel, this means that a logical/virtual address in this section can have, at a given time, one single virtual-to-physical address mapping. On the other hand, the user space is shared by all running processes. Thus a virtual address in the user space can have different mappings depending on the process to which this address belongs.
Training Linux Debugging for Intel® x86/x64 8 ©1989-2019 Lauterbach GmbH

The kernel space includes the kernel logical address range which is mapped to a continuous block in the physical memory. The kernel logical addresses and their associated physical addresses differ only by a constant offset. We denote this kernel logical to physical address translation as “kernel default translation”. The rest of the kernel space includes the kernel virtual addresses which do not have necessarily the linear one-to-one mapping to physical addresses. This includes for instance memory allocated with vmalloc.
For a 32 bit Linux, the logical start address of the kernel is fixed by the kernel CONFIG_PAGE_OFFSET macro which is per default 0xC0000000 and the end address is the value of the high_memory variable minus one.
Example: kernel logical range from 0xC0000000 to 0xCFFFFFFF mapped to the physical memory block starting at 0x00000000.
For a 64 bit Linux the kernel logical range lays from 0xFFFF880000000000 to 0xFFFFC7FFFFFFFFFF where you have a direct mapping of all physical memory. Moreover, 512MB of physical memory starting at 0x0 are also mapped to the logical range 0xFFFFFFFF80000000--0xFFFFFFFF9FFFFFFF (kernel text mapping). The memory mapping for the 64 bit kernel is described in details in the kernel documentation under Documentation/x86/x86_64_mm.txt.
Kernel modules also run in the kernel space and are located for x86/x64 above the kernel logical range.
Debugger Memory Access
With disabled debugger address translation, the debugger accesses the memory virtually (through the core). This way, it is only possible to access memory pages which are currently mapped in the TLBs.
Alternatively, you can set up the debugger to access the memory physically. This way, the debugger will have access to all the existing physical memory. However, Linux operates completely in virtual memory space: all functions, variables, pointers etc. work with virtual addresses. Also, the symbols are bound to virtual addresses. Hence, if the user tries to read the value of a variable, the debugger has to find the virtual to physical address translation for this variable and access it using its physical address.
Training Linux Debugging for Intel® x86/x64 9 ©1989-2019 Lauterbach GmbH

The debugger holds a local translation list. Translations can be added to this list manually using the TRANSlation.Create command. This local translation list can be viewed using the TRANSlation.List command. If no translation is found in this local list and if the translation “table walk” is enabled then the debugger will read the target MMU page table(s) to find the virtual to physical address translation. We call this process “debugger table walk”.
Please note that the debugger local translation list has the highest priority in the debugger translation process.
In contrast to the CPU address translation, if the virtual to physical address mapping is not found in the page table when performing a debugger table walk, no page fault is generated. It is then not possible for the debugger to access this address. A debugger memory access doesn’t modify the MMU page tables.
Without further settings, the debugger can only access the current page table pointed by the CR3 CPU register. However, each process as well as the kernel, has its own page table. Hence, by walking only through the current page table, it is not possible to find the virtual to physical address mapping of a process which is not the current executing one and as follows it is not possible to access the memory of such a process.
But since the Linux kernel manages the switching of the MMU for all processes, kernel structures hold the pointers for the translation pages tables for every process. The debugger just needs to get this information from the kernel data structures to be able to access the memory for any running task in the system. It is the task of the Linux awareness to get the page table descriptors for all running tasks on the system. You can display these descriptors by execution the TRACE32 commands TRANSlation.ScanID and TRANSlation.ListID.
Space IDs
Under Linux, different processes may use identical virtual address. To distinguish between those addresses,the debugger uses an additional identifier, the so-called space ID (memory space identifier). It specifieswhich virtual memory space an address refers to. The space ID is zero for all tasks using the kernel address
The debugger translation and the debugger table walk are per default enabled in TRACE32 for x86/x64
To be able to access the kernel logical range at any time, the debugger needs to know the kernel logical to physical address translation.
Training Linux Debugging for Intel® x86/x64 10 ©1989-2019 Lauterbach GmbH

space (kernel threads). For processes using their own address space, the space ID equals the lower 16bitsof the process ID. Threads of a particular process use the memory space of the invoking parent process.Consequently threads have the same space ID as the parent process (main thread).
The following command enables the use of space IDs in TRACE32:
After this command, a virtual address looks like “001E:10001244”, which means virtual address0x10001244 with space ID 0x1E (pid = 30.).
You can now access the complete memory:
Symbols are always bound to a specific space ID. When loading the symbols, you need to specify, to whichspace ID they should belong. If you load the symbols without specifying the space ID, they will be bound tospace ID zero (i.e. the kernel’s space ID). See chapter “Debugging the Linux Components”, page 36 fordetails.
If you enter commands with a virtual address without the TRACE32 space ID, the debugger will access the virtual address space of the current running task.
SYStem.Option MMUSPACES ON
SYStem.Option MMUSPACES ON doesn’t switch on the processor MMU. It justextends the addresses with space IDs.
Data.dump 0x10002480 ; Will show the memory at virtual address; 0x10002480 of the current running task
List 0x2F:0x10003000 ; Will show a code window at the address; 0x10003000 of the process having the space; id 0x2F
Data.dump A:0x10002000 ; Will show the memory at physical address; 0x10002000
Training Linux Debugging for Intel® x86/x64 11 ©1989-2019 Lauterbach GmbH

Because the symbols already contain the information of the space ID, you don’t have to specify it manually.
If the Linux awareness is enabled, the debugger tries to get the space ID of the current process by accessing the kernel’s internal data structures. If this fails e.g. because of wrong symbol information, an access error, or because the kernel’s data structures have not been yet initialized (in case you stop the target early in the kernel boot process), the debugger sets the current space ID to 0xFFFF and shows the message “task error” in the status line.
You can ignore the “task error” message as long as the kernel has not yet booted.
On Demand Paging
Linux is designed for heavy MMU usage with demand paging. Demand paging means that code and datapages of processes (and libraries) are loaded when they are first accessed. If the process tries to access amemory page that is not yet loaded, it creates a page fault. The page fault handler then loads theappropriate page. Only the actually used pages are really loaded.
However, this demand paging disturbs the debugger a lot. As a workaround, two patches are available to avoid demand paging while debugging. One is placed in the ELF loader, the other one is placed in the process handler. Please see “OS Awareness Manual Linux” (rtos_linux_stop.pdf) for details.
Data.dump myVariable ; Will show the memory at the virtual; address of “myVariable” with the space ID; of the process holding this variable
virtual address of current process 0x141 virtual address of specified process 0xBB9
Symbol “flags” with process 0xBB9access to physical address A:0x8048FDD
Training Linux Debugging for Intel® x86/x64 12 ©1989-2019 Lauterbach GmbH

The following screen shots show an example of “on demand paging”. The instruction pointer is near the 4KB page boundary at the address 0x40EFFB. The next memory page beginning at 0x40F000 cannot be accessed by the debugger since it wasn’t yet accessed by the core and thus doesn’t have a mapping in the MMU page table of the current process.
We set an on-chip breakpoint somewhere in the next memory page and resume the execution. A page faultthen occurs and the memory page is loaded and gets a mapping in the current page table.
Training Linux Debugging for Intel® x86/x64 13 ©1989-2019 Lauterbach GmbH

4.) Run-Mode vs. Stop-Mode Debugging
There are two main alternatives for debugging a Linux target: hardware based (stop mode) and softwarebased (run mode). This chapter gives a small introduction regarding the differences between stop and runmode debugging which are both supported by TRACE32.
Hardware Based Debuggers
A hardware-based debugger uses special hardware to access target, processor and memory (e.g. by usingthe JTAG interface). No software components are required on the target for debugging. This allowsdebugging of bootstraps (right from the reset vector), interrupts, and any other software. Even if the targetapplication runs into a complete system crash, you are still able to access the memory contents (postmortem debugging).
A breakpoint is handled by hardware, too. If it is reached, the whole target system (i.e. the processor) isstopped. Neither the kernel, nor other processes will continue. When resuming the target, it continues at theexact state, as it was halted at the breakpoint. This is very handy to debug interrupts or communications.However, keep in mind that also “keep alive” routines may be stopped (e.g. watchdog handlers).
The debugger is able to access the memory physically over the complete address range, without anyrestrictions. All software parts residing in physically memory are visible, even if they are not currentlymapped by the TLBs. If the debugger knows the address translation of all processes, you gain access to anyprocess data at any time.
The “on demand paging” mechanism used by Linux implies that pages of the application may be physicallynot present in the memory. The debugger cannot access such pages (including software breakpoints), aslong as they are not loaded.
Advantages:
• bootstrap, interrupt or post mortem debugging is possible
• no software restrictions (like memory protection, ...) apply to the debugger
• the full MMU table and code of all processes alive can be made visible
• only JTAG is required, no special communication interface as RS232 or Ethernet is needed
Training Linux Debugging for Intel® x86/x64 14 ©1989-2019 Lauterbach GmbH

Disadvantages:
• halts the complete CPU, not only the desired process
• synchronization and communications to peripherals usually get lost
• debug HW and a debug interface on the target are needed
Software Based Debuggers
Software based debuggers, e.g. GDB, usually use a standard interface to the target, e.g. serial line orEthernet. There is a small program code on the target (called “stub” or “agent”) that waits for debuggingrequests on the desired interface line and executes the appropriate actions. Of course, this part of thesoftware must run, in order for the debugger to work correctly. This implies that the target must be up andrunning, and the driver for the interface line must be working. Hence, no bootstrap, interrupt or post mortemdebugging is possible.
When using such a debugger to debug a process, a breakpoint halts only the desired process. The kernel and all other processes in the target continue to run. This may be helpful, if e.g. protocol stacks need to continue while debugging, but hinders the debugging of inter-process communication.
Because the debugging execution engine is part of the target program, all software restrictions apply to thedebugger, too. In the case of a gdbserver for example, which is a user application, the debugger can onlyaccess the resources of the currently debugged processes. In this case, it is not possible to access thekernel or other processes.
Advantages:
• halts only the desired process
• synchronization and communications to peripherals usually continue
• no debugger hardware and no JTAG interface are needed
Disadvantages:
• no bootstrap, interrupt or post mortem debugging is possible
• all software restrictions apply to the debugger too (memory protection, ...)
• only the current MMU and code of this scheduled process is visible
• actions from GDB change the state of the target (e.g page faults are triggered)
• one RS232 or Ethernet interface of the target is blocked
Training Linux Debugging for Intel® x86/x64 15 ©1989-2019 Lauterbach GmbH

Run mode debugging is not covered by this training, for more information please refer to “Run Mode Debugging Manual Linux” (rtos_linux_run.pdf) and “TRACE32 as GDB Front-End” (frontend_gdb.pdf).
Software based debugging is less robust and has many limitations in comparison to hardware based debugging. Thus, it is recommended to use JTAG based debugging if possible.
Training Linux Debugging for Intel® x86/x64 16 ©1989-2019 Lauterbach GmbH

5.) Building the Kernel, a Kernel Module and a Simple Demo Application
Before going forward with writing Linux TRACE32 scripts and debugging the different Linux components, wewill show the important steps when building the kernel, kernel modules and user applications.
Building The Kernel
Compile The kernel With Debug Info
To be able to do Linux aware debugging, the vmlinux file must be compiled with debug info enabled. Thus, you need to ensure that CONFIG_DEBUG_INFO is enabled in the kernel configuration. Please also make sure that CONFIG_DEBUG_INFO_REDUCED is not set (Reduce debugging information).
Moreover the option “Produce split debug info in .dwo files” (CONFIG_DEBUG_INFO_SPLIT) has to be disabled.
Disable Randomization
For some architectures, the Linux kernel offers a security features which allows to randomize the virtual address at which the kernel image is loaded (CONFIG_RANDOMIZE_BASE). This option has to be disabled in the kernel configuration, otherwise the debug symbol addresses loaded from the vmlinux file do not match anymore the kernel code/data. As an alternative to disabling this option, you can add “nokaslr” to the kernel boot parameters.
CONFIG_DEBUG_INFO=y# CONFIG_DEBUG_INFO_REDUCED is not set# CONFIG_DEBUG_INFO_SPLIT is not set
Training Linux Debugging for Intel® x86/x64 17 ©1989-2019 Lauterbach GmbH

Disable KPTI a.k.a. KAISER (Arm 64 bit only)
If the option CONFIG_UNMAP_KERNEL_AT_EL0 is enabled, the kernel is unmapped when running in user space and mapped back in on exception entry via a trampoline page in the vector table. Thus, when the execution is stopped in user space, the debugger won’t have access to the kernel data. Please disapble this option in the kernel configuration if possible. Otherwise, you can add “pti=0” to the kernel boot parameters or set the variable __kpti_forced to a negative value e.g.
Disable Lockup and Hang Detection
The Linux kernel provides the possibility to detect soft lockups and hung tasks by acting as a watchdog. This can be enabled under “kernel hacking” > “Debug Lockups and Hangs”. The corresponding kernel configuration options are CONFIG_SOFTLOCKUP_DETECTOR and CONFIG_DETECT_HUNG_TASK. It is additionally possible to make the kernel reboot when a soft lockup or hung task is detected.
If the program execution is stopped for a certain period of time, the soft lockup and hang detection could trigger a kernel panic. It is thus recommended to disable this detection in the kernel configuration.
CPU Power Management
The Linux kernel CPU power management could cause for some processor architectures that single cores are not accessible by the debugger when in power saving state. CPU power management can be disabled in the Linux kernel configuration by disabling the options CONFIG_CPU_IDLE and CONFIG_CPU_FREQ.
Building a Kernel Module
The kernel contains all section information if it has been configured with CONFIG_KALLSYMS=y. Whenconfiguring the kernel, set the option “General Setup”-> “Configure standard kernel features” -> “Loadall symbols” to yes. Without KALLSYMS, no section information is available and debugging kernel modulesis not possible.
Building a User Application
When compiling an application, you need to use the “-g” compiler option to enable debug information:
IF sYmbol.EXIST(__kpti_forced) Var.set __kpti_forced = -1
$ gcc -g -o hello hello.c
Training Linux Debugging for Intel® x86/x64 18 ©1989-2019 Lauterbach GmbH

Setting up a Script for Linux-Aware Debugging
This chapter will tell about the typical steps how to prepare a Linux target and the TRACE32 debugger forconvenient Linux-Debugging.
The following pages will show the setup by now step by step:
1. Capture of commands for a script
2. Linux Setup-Steps and -Commands
3. Example Linux Setup-Script file
1.) Capture of Commands for a Script
It can be an advantage to record the commands and wanted settings used inside the TRACE32 graphical user interface (GUI) right from the start. So you should open first a LOG-file:
This log file contains all of the TRACE32 actions, including the menu selection and mouse-clicks. Whereas the ClipSTOre and STOre <file> commands save only specific actions like system settings (e.g STOre SYStem).
The HISTory command only samples the commands from the command line. But it offers a quick access to the commands used already. Use the cursor key “UP” or mouse to select commands form the HISTory list.
LOG.OPEN <file> Create and open a file for the commands to be logged. The default extension for LOG-files is (.log)
LOG.CLOSE Close the LOG-file
STOre <file> SYStem Create a batch to restore the SYStem settings
ClipSTOre SYStem Provide the commands to restore the SYStem settings in the cliptext
HISTory.type Display the command history
Training Linux Debugging for Intel® x86/x64 19 ©1989-2019 Lauterbach GmbH

2.) Linux Setup-Steps and -Commands
To be able to do Linux aware debugging, some configuration needs to be done in TRACE32. The minimalsetup includes the following steps:
• Connect to the target platform
• Load the Linux kernel symbols
• Set up the debugger address translation
• Load the Linux awareness and the Linux menu
These are the only needed configuration steps if you want to attach to a running Linux kernel. In case you want to debug the kernel boot, then you additionally need to make sure to stop the execution before the kernel start.
Moreover, it is possible to download the kernel image to the RAM using the debugger. We will discuss in this chapter which setup is needed in this case.
You can find Linux demo scripts in the TRACE32 installation directory under ~~/demo/x86/kernel/linux/board and ~~/demo/x64/kernel/linux/board.
Debugger Reset for Linux Debugging
Especially if you restart debugging during a debug session you are not sure about the state the debugger was in. So use command RESet for a complete restart or the specific resets for each debugger function. .
Moreover, it is also good to clear all debugger windows before connecting to the target using the WinCLEAR command.
RESet ; reset debugger completely
The RESet command doesn’t reset the target but only the debugger environment.
WinCLEAR ; clear all debugger windows
Training Linux Debugging for Intel® x86/x64 20 ©1989-2019 Lauterbach GmbH

Debugger Setup
First you need to set up the debugger to be able to connect to the target platform. This includes e.g.selecting the appropriated CPU, setting the JTAG clock and selecting target-specific debugger options.Moreover, some additional options related to Linux debugging have to be enabled like address extension.Finally, you need to connect to the target using SYStem.Up or SYStem.Mode Attach.
CPU Selection
You need to select a CPU to debug your target. We select for example the ATOMZ5XX for the Crown Beach target:
You can use the search field in the SYStem.CPU window to find your CPU name. Alternatively, you can use the command line to write the CPU name partially to be completed by pressing the tabulator key on the keyboard. This way also the amount of displayed CPUs is reduced temporarily.
JTAG Clock
Using the command SYStem.JtagClock you can select an appropriated JTAG clock for you target. This could be necessary if the default clock set by the debugger is too high. You can see the selected JTAG clock in the SYStem window.
SYStem.CPU ATOMZ5XX ; ATOMZ5XX target to be debugged
SYStem.JtagClock 20MHz
Training Linux Debugging for Intel® x86/x64 21 ©1989-2019 Lauterbach GmbH

Address Extension
Switch on the debugger’s virtual address extension to use space IDs (needed to differ e.g. several “main”functions of different processes). The addresses in the List and Data.dump windows will be extended with aspace ID (e.g 0000:FFFFFFF81472C9A).
Remark: Older documentation and TRACE32 software uses “SYStem.Option MMU ON” instead of“SYStem.Option MMUSPACES ON”. Please use only the new naming.
Connect to the Target
The command SYStem.Up reset the target (if supported by the JTAG interface) and enters debug mode.
The command SYStem.Mode Attach attaches to the target without resetting the cores.
At this stage the Linux awareness has not yet been loaded, so if a problem occurs then it is related to thedebugger settings or to a problem on the target. Please check in this case the AREA window for errors andwarnings.
SYStem.Option MMUSPACES ON ; enable space IDs to virtual addresses
The “SYStem.Option MMUSPACES” should be enabled at the beginning of the script before loading any debug symbols.
SYStem.Up ; activates the JTAG communication
SYStem.Mode Attach ; attach to the cores
AREA.view [<area>]
Training Linux Debugging for Intel® x86/x64 22 ©1989-2019 Lauterbach GmbH

Please refer to “Intel® x86/x64 Debugger” (debugger_x86.pdf) for architecture specific setup and options.
Set Single Step Behavior
While single stepping, external interrupts may occur. On some architectures, this leads with the next singlestep into the interrupt handler. This effect normally disturbs during debugging. The following sequencemasks external interrupts while executing assembler single steps. Keep interrupts enabled during HLL singlesteps to allow paging while stepping through source code.
Open a Terminal Window
You can open a serial terminal window in TRACE32 using the TERM command:
SETUP.IMASKASM ONSETUP.IMASKHLL OFF
; suppress interrupts during assembler stepping; allow interrupts while HLL single stepping
If an assembler single step causes a page fault, the single step will jump intothe page fault handler, regardless of the above setting. The debugger will restorethe interrupt mask to the value before the single step. So it might be wrong at thisstate and cause an unpredictable behavior of the target.
TERM.RESet ; reset old and set new definitionsTERM.METHOD COM com1 115200. 8 NONE 1STOP NONE ; for com10 use \\.\com10TERM.SIZE 80 1000 ; define capacity of the TERM windowTERM.SCROLL ON ; scrolling follows to the TERM cursorTERM.Mode VT100 ; or ASCII (default), STRING, HEX ...WINPOS 50% 0% 50% 100% term_win ; define next window position and sizeTERM.view ; open the TERM windowSCREEN.ALways ; TERM window always updated
Training Linux Debugging for Intel® x86/x64 23 ©1989-2019 Lauterbach GmbH

You can also use the term.cmm script available in the TRACE32 installation under ~~/demo/etc/terminal/serial which takes two arguments: the COM port and the baud rate e.g.
Load the Kernel Symbols
You can load the kernel symbols using the Data.LOAD.Elf command. Without any further options, thiscommand loads the symbols and download the code to the target. In order to only load the kernel symbolsinto the debugger without downloading the code, you need to use the /NOCODE option.
For some older GNU compilers, you also need to use the /GNU option:
Displaying the Source Code
If you are not running TRACE32 on the host where you compiled your kernel, the debugger, which uses perdefault the compile path to find the source files, will not find these files. Thus, the debugger needs to be setup to be able to find the source code. Two options are available in the Data.LOAD command for thispurpose: /STRIPPART and /SourcePATH. With the option /STRIPPART you can remove parts of the pathstored in the object file. With the option /SourcePATH you can specify a basis directory for the source files.The debugger will take the rest of the compile path (without the stripped part) and will append it to thespecified source path. The source path can also be set using the command sYmbol.SourcePATH.
For example, if you have compiled your kernel on a Linux machine in the directory/home/atom230/linux-3.13.1 and you are running TRACE32 on a Windows machine where youhave the kernel source files tree under C:\Linux\training\sources\linux-3.13.1, you can forexample load the kernel symbols with
or
DO ~~/demo/etc/terminal/serial/term.cmm COM1 115200.
Data.LOAD.Elf vmlinux /NOCODE
Data.LOAD.Elf vmlinux /NOCODE /GNU
Data.LOAD.Elf vmlinux /NoCODE /STRIPPART "atom230" /SOURCEPATH C:\Linux\training\sources
Data.LOAD.Elf vmlinux /NoCODE /STRIPPART 3. /SOURCEPATH C:\Linux\training\sources
Training Linux Debugging for Intel® x86/x64 24 ©1989-2019 Lauterbach GmbH
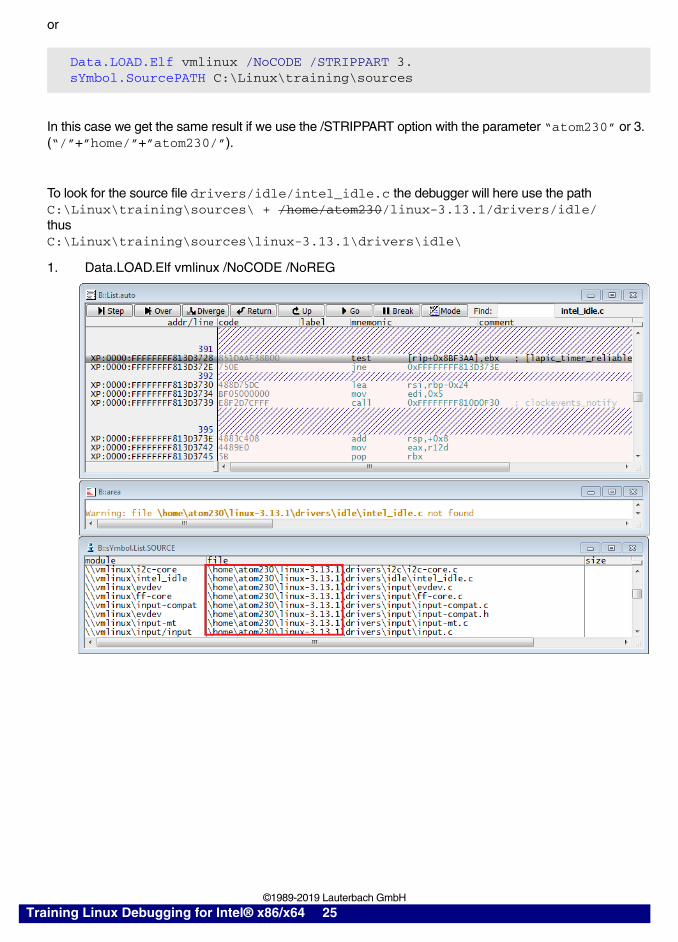
or
In this case we get the same result if we use the /STRIPPART option with the parameter “atom230” or 3. (“/”+”home/”+”atom230/”).
To look for the source file drivers/idle/intel_idle.c the debugger will here use the path C:\Linux\training\sources\ + /home/atom230/linux-3.13.1/drivers/idle/ thus C:\Linux\training\sources\linux-3.13.1\drivers\idle\
1. Data.LOAD.Elf vmlinux /NoCODE /NoREG
Data.LOAD.Elf vmlinux /NoCODE /STRIPPART 3. sYmbol.SourcePATH C:\Linux\training\sources
Training Linux Debugging for Intel® x86/x64 25 ©1989-2019 Lauterbach GmbH

2. Data.LOAD.Elf vmlinux /NoCODE /NoREG /STRIPPART 3.
3. sYmbol.SourcePATH C:\Linux\training\sources
If you don’t specify the source path, the debugger will append the rest of the stripped path to the path of the loaded vmlinux file.
Training Linux Debugging for Intel® x86/x64 26 ©1989-2019 Lauterbach GmbH

You can also instead of using /STRIPPART and /SourcePATH to specify the path to the source file, use the command sYmbol.SourcePATH.Translate to translate a “compile” source path to a “host” source path. The command would be in our case:
Download the Kernel
It is normally the task of the bootloader to load the kernel e.g. from the hard drive to the RAM. However, you can also use the debugger to download the kernel to the target memory over JTAG. In this case you just need to omit the /NoCODE option in the Data.LOAD.Elf command. We use here the memory class “A:” (absolute addressing) to download the code on the physical memory:
This command will load the kernel symbols and download the kernel at the physical address 0x0.
To be able to start the kernel, you can either set up the registers and the kernel boot parameters with the debugger or download the kernel when the instruction pointer is at the kernel entry point (at this time, everything has already been set up by the bootloader).
Downloading the Kernel Code at the Kernel Entry
You can set an on-chip breakpoint at the kernel entry point which is usually at the address 0x01000000and let the system run. When you stop at the breakpoint, you can then download the kernel to the targetmemory. In this case, no further settings are needed since everything has been prepared by the bootloader:
sYmbol.SourcePATH.Translate "\home\atom230\" "C:\Linux\training\sources\"
Data.LOAD.Elf vmlinux A:0
Go 0x01000000 /OnchipWAIT !STATE.RUN()
Data.LOAD.Elf vmlinux A:0
Training Linux Debugging for Intel® x86/x64 27 ©1989-2019 Lauterbach GmbH

Then you can simply continue the execution:
Downloading the Kernel after the Bootloader Target Initialization
You can stop the bootloader just after the target initialization and download the kernel. This way, you need toset the values of several registers and to set up the kernel boot parameters manually. Moreover, you need toenable the protected mode and the 64bit mode for the 64bit kernel.
Setting the CPU Registers
The instruction pointer should be set to value defined by CONFIG_PHYSICAL_START and the stack pointer to a valid address e.g. 0x00010000.
Setting the Kernel Boot Parameters
The kernel boot parameters are located in a structure of type (struct boot_params) pointed by the register ESI. You can access this structure after the kernel has booted using the boot_params symbol.
Go ; let the kernel boot
Register.RESetRegister.Set ESP 0x00010000Register.Set EIP 0x01000000
; reset all registers; initialize stack pointer; set IP to start of vmlinux
Training Linux Debugging for Intel® x86/x64 28 ©1989-2019 Lauterbach GmbH

In the following example, we first set the boot_params area to zero and then set the parameters alt_mem_k, hrd.type_pf_loader, hdr.ramdisk_image and hdr.ramdisk_size (since we use a ramdisk as a file system) as well as the boot command line ptr hdr.cmd_line_ptr. The offsets of the structure elements are hard coded.
Set up the Protected Mode
The Linux kernel runs in protected mode. If you stop the bootloader before the protected mode has been enabled then you need to prepare the registers and descriptor tables manually for the protected mode. You can use for this the setup_protected_mode.cmm script available in the TRACE32 demo directory.
Set up the 64 Bit Mode
In case you are using a 64 bit kernel, you also need to set the CPU in 64 bit mode. A script is also available for this purpose in the TRACE32 demo directory under ~~/demo/x64/kernel/linux/board/setup_64bit_mode.cmm
Download the File System
In case you are using a ramdisk image as file system, you can download this image to the target memoryusing the Data.LOAD.Binary command:
You need to use the /NoClear option here, otherwise the already loaded kernel symbols will be cleared. We also use here the “A:” memory class to force downloading the data to the physical memory. We use the 0x02000000 address since this is what has been specified in the kernel boot parameters (“initrd=0x02000000”).
Set up the Debugger Address Translation
The debugger needs to have some information about the format of the MMU tables used by the kernel andthe kernel address translation. This is configured using the command MMU.FORMAT.
&bpb=0x20000 ; base address of boot parametersRegister.Set ESI &bpb ; set ESI to point to struct boot_paramsData.Set (&bpb+0x0000)++0x0fff 0x0 ; empty boot params areaData.Set &bpb+0x01e0 %Long 0x3fc00 ; alt_mem_k=(256-1)*1024kB=256-1MBData.Set &bpb+0x0210 %Byte 0x80 ; hdr.tpye_of_loader = U-Boot Data.Set &bpb+0x0218 %Long 0x02000000 ; hdr.ramdisk_imageData.Set &bpb+0x021c %Long 0x00800000 ; hdr.ramdisk_sizeData.Set &bpb+0x0228 %Long &bpb+0x1000 ; cmd_line_ptrData.Set &bpb+0x1000 "console=ttyS1,115200 console=ttyUSB0 "Data.Set , "initrd=0x02000000,0x800000 root=/dev/ram "Data.Set , "mem=240M slram=appdisk,0x0F000000,+0x1000000 "Data.Set , 0
Data.LOAD.Binary ramdisk.image.gz A:0x02000000 /NoClear
Training Linux Debugging for Intel® x86/x64 29 ©1989-2019 Lauterbach GmbH

The first argument of this command is the format of the MMU tables. Please check “OS Awareness ManualLinux” (rtos_linux_stop.pdf) for actual format specifier. The second argument is a kernel symbol pointing tothe start of the kernel page table and is usually called swapper_pg_dir for a 32bit kernel andinit_level4_pgt or init_top_pgt for a 64bit kernel. The third parameter is the logical to physicalkernel address mapping.
For x64, you additionally need to create static translations for the direct mapping (0xffff880000000000-- 0xffffc7ffffffffff = 64 TB) and the kernel text mapping (0xffffffff80000000 --0xffffffffa0000000 = 512MB). Please refer to Documentation/x86/x86_64/mm.txt for moreinfo.
Moreover, you need to set the common address range with the command TRANSlation.COMMON. This is actually the common address range for all processes and is everything above the process address range:
Finally you need to enable the MMU table walk with TRANSlation.TableWalk ON and enable the debugger address translation with the command TRANSlation.ON.
If the table walk is enabled, when accessing a virtual address which has no mapping in the debugger localaddress translation list (TRANSlation.List), the debugger tries to access the MMU page tables to get thecorresponding physical address and then access the memory physically.
; Example setup for x86MMU.FORMAT STD swapper_pg_dir 0xc0000000--0xcfffffff 0x0
; Example setup for x64LOCAL &base_addrIF sYmbol.EXIST(init_level4_pgt) &base_addr="init_level4_pgt"ELSE &base_addr="init_top_pgt"MMU.FORMAT LINUX64 &base_addr 0xffffffff80000000--0xffffffff9fffffff 0x0
If you get the error message “invalid combination” after the MMU.FORMAT command, check if you have enabled the MMUSPACES.
TRANSlation.Create 0xffff880000000000--0xffffc7ffffffffff 0x0TRANSlation.Create 0xffffffff80000000--0xffffffff9fffffff 0x0
TRANSlation.COMMON 0xc0000000--0xffffffff
TRANSlation.TableWalk ONTRANSlation.ON
Training Linux Debugging for Intel® x86/x64 30 ©1989-2019 Lauterbach GmbH

Set up the Linux Awareness
We need to load now the Linux awareness and Linux menu in TRACE32. For kernel versions 2.x, the Linux awareness is based on the file linux.t32 located under “~~/demo/<arch>/kernel/linux/linux-2.x/” where <arch> is “x86” for a 32 bit kernel and “x64” for a 64 bit kernel. The Linux awareness for kernel versions 3.x is based on the file linux3.t32 located under “~~/demo/<arch>/kernel/linux/linux-3.x/“.
The Linux menu file includes many useful menu items developed for the TRACE32-GUI to ease LinuxDebugging.
The Linux awareness and Linux menu uses scripts also available under ~~/demo/<arch>/kernel/linux/<linux_version>. You should always load the awareness from the TRACE32 installation directory to avoid compatibility problems between the Linux awareness and the mentioned scripts. If you load the Linux awareness outside the TRACE32 installation, you will get the warning “please use awareness files from TRACE32 installation directory”
Mark the Kernel Address Space
For better visibility, you can mark the kernel address space to be displayed with a red bar.!
; load the awareness for Linux-3.x on x64TASK.CONFIG ~~/demo/x64/kernel/linux/linux-3.x/linux3.t32; load Linux menu:MENU.ReProgram ~~/demo/x64/kernel/linux/linux-3.x/linux.men
GROUP.Create "kernel" 0xC0000000--0xFFFFFFFF /RED ; 32 bit kernel
GROUP.Create "kernel" 0xffffffff80000000--0xffffffffffffffff /RED ; 64 bit kernel
Training Linux Debugging for Intel® x86/x64 31 ©1989-2019 Lauterbach GmbH

Boot Linux
Everything is set up now. If the kernel is not already running and if you are not interested in debugging the kernel boot, you can let Linux run as long as it needs to boot completely (e.g. 10 seconds).
GoWAIT 10.sBreak
Training Linux Debugging for Intel® x86/x64 32 ©1989-2019 Lauterbach GmbH

3.) Example Linux Setup-Scripts
You can find demo startup scripts for different target boards in the TRACE32 installation directory under ~~/demo/x86/kernel/linux/board and ~~/demo/x64/kernel/linux/board. You can also search for the newest scripts in the Lauterbach home page under the following link:
http://www.lauterbach.com/frames.html?scripts.html
The first example script set up Linux aware debugging for a 32 bit kernel running on the Intel Galileo board. In this example the kernel is already running on the target.
REsetWinCLEAR
SYStem.CPU QUARKSYStem.Option MMUSPACES ON ; enable space IDs to virtual addressesSYStem.AttachSETUP.IMASKASM ON ; lock interrupts while single stepping
; Open a serial terminal windowDO ~~/demo/etc/terminal/serial/term.cmm COM1 115200.
; Open a Code Window -- we like to see somethingWINPOS 0. 0. 75. 20.ListSCREEN
; Load the Linux kernel symbolsData.LOAD.Elf vmlinux /NOCODE
MMU.FORMAT PAE swapper_pg_dir 0xC0000000--0xCFFFFFFF 0x0TRANSLATION.COMMON 0xC0000000--0xFFFFFFFFTRANSLATION.TableWalk ONTRANSlation.ON
; Initialize Linux Awareness PRINT "initializing multi task support..."; loads Linux awareness:TASK.CONFIG ~~/demo/x86/kernel/linux/linux-3.x/linux3.t32 ; loads Linux menu:MENU.ReProgram ~~/demo/x86/kernel/linux/linux-3.x/linux.men ; Group kernel area to be displayed with red barGROUP.Create "kernel" 0xC0000000--0xFFFFFFFF /RED
ENDDO
Training Linux Debugging for Intel® x86/x64 33 ©1989-2019 Lauterbach GmbH

The second example script set up Linux aware debugging for a 64 bit kernel running on the Crown Beach Board. We connect to the target using the SYStem.Up command which reset the cores. We let then bootloader initialize the target hardware. The bootloader is stopped before the Linux kernel is loaded. We continue then the setup using the debugger.The kernel as well as the ramdisk image are downloaded to the target memory over JTAG. The script also set the initial values for the CPU registers and the kernel boot parameters.
continued on next page.
RESet ; setup of ICDPRINT "initializing..."SYStem.CPU ATOMZ5XXSYStem.JtagClock 20MHzSYStem.Option MMUSPACES ON ; enable space IDs to virtual addressesSYStem.Up ; Open a serial terminal windowDO ~~/demo/etc/terminal/serial/term.cmm COM1 115200.
SETUP.IMASKASM ON ; lock interrupts while single stepping
; Let the boot monitor set up the board Go PRINT "target setup..." WAIT 10.s Break
; Load the Linux kernel code and symbolsData.LOAD.Elf vmlinux A:0 /GNU ; Loading RAM diskData.LOAD.Binary ramdisk.image.gz A:0x02000000 /NoClear /NoSymbol
; Initialize CPU protected mode. 0x10000 is the GDT base addressDO setup_protected_mode.cmm 0x10000
; Set PC on physical start address of the kernelRegister.Set EIP 0x01000000; Initialize stack pointerRegister.Set ESP 0x00010000
; Setup boot_params in a separate script (please refer to 4.b)DO setup_boot_params.cmm
; Open a Code Window -- we like to see somethingWINPOS 0. 0. 75. 20.ListSCREEN
Training Linux Debugging for Intel® x86/x64 34 ©1989-2019 Lauterbach GmbH
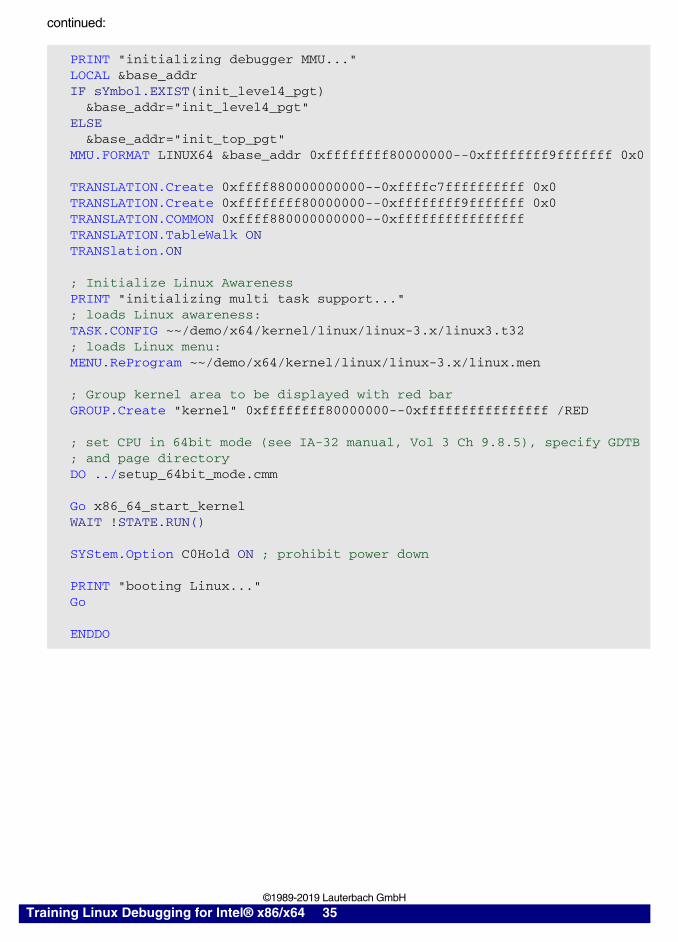
continued:
PRINT "initializing debugger MMU..."LOCAL &base_addrIF sYmbol.EXIST(init_level4_pgt) &base_addr="init_level4_pgt"ELSE &base_addr="init_top_pgt"MMU.FORMAT LINUX64 &base_addr 0xffffffff80000000--0xffffffff9fffffff 0x0
TRANSLATION.Create 0xffff880000000000--0xffffc7ffffffffff 0x0TRANSLATION.Create 0xffffffff80000000--0xffffffff9fffffff 0x0TRANSLATION.COMMON 0xffff880000000000--0xffffffffffffffffTRANSLATION.TableWalk ONTRANSlation.ON
; Initialize Linux Awareness PRINT "initializing multi task support..."; loads Linux awareness:TASK.CONFIG ~~/demo/x64/kernel/linux/linux-3.x/linux3.t32 ; loads Linux menu:MENU.ReProgram ~~/demo/x64/kernel/linux/linux-3.x/linux.men ; Group kernel area to be displayed with red barGROUP.Create "kernel" 0xffffffff80000000--0xffffffffffffffff /RED
; set CPU in 64bit mode (see IA-32 manual, Vol 3 Ch 9.8.5), specify GDTB ; and page directoryDO ../setup_64bit_mode.cmm
Go x86_64_start_kernelWAIT !STATE.RUN() SYStem.Option C0Hold ON ; prohibit power down
PRINT "booting Linux..." Go
ENDDO
Training Linux Debugging for Intel® x86/x64 35 ©1989-2019 Lauterbach GmbH

Debugging the Linux Components
This chapter will show how to debug the different Linux components explained in the previous chapters. Firstyou will see the easy handling by the special included Linux menu.
1. Debugging Linux Components
2. Linux specific Windows and Features
1.) Debugging Linux Components
Each of the components used to build a Linux system needs a different handling for debugging. This chapterdescribes in detail, how to set up the debugger for the individual components. If you want to debug differentcomponents at once, you have to aggregate the commands for the components.
When using several symbol files at once (e.g. kernel, processes and libraries), it is convenient to use theGROUP command to mark each component with a dedicated color. Find some example settings below.
The “OS Awareness Manual Linux” (rtos_linux_stop.pdf) manual gives additional detailed instructions.
1.1) The Kernel
Kernel Startup
With kernel startup we refer here to the kernel boot code executed before the enabling of the target MMU.The bootloader jumps into the kernel startup routine (phys_startup_32 / phys_startup_64)generally located at the address 0x01000000. It starts at physical address space, does some initializationand set up the MMU. Finally the kernel startup switches into logical address space.
Training Linux Debugging for Intel® x86/x64 36 ©1989-2019 Lauterbach GmbH

To be able to see the debug symbols for the kernel startup, the kernel should be loaded with an offset. The offset is needed here since the kernel runs on physical addresses. The kernel symbols are however linked to logical addresses.
Please note that a single minus sign “-” is used here which means that we subtract the logical start address from the physical start address.
For a 64 bit Linux, this should be:
Specifying an offset is only needed to debug the kernel startup in HLL. As soon as the kernel jumps to logical addresses after enabling the target MMU, the kernel symbols should be loaded without any offset.
As long as the target MMU is not enabled, logical addresses cannot be accessed by the debugger. Thus, if you want to set a breakpoint on a logical address (for instance start_kernel), you should use on-chip breakpoints:
Data.LOAD.Elf vmlinux <phys._start_addr>-<logical_start_addr> /NoCODE
Data.LOAD.Elf vmlinux 0x0-0xFFFFFFFF80000000 /NoCODE /NOREG
Loading the kernel symbols with an offset is only needed if you want to debug the kernel startup code which runs with disabled MMU.
Break.Set start_kernel /Onchip
Training Linux Debugging for Intel® x86/x64 37 ©1989-2019 Lauterbach GmbH
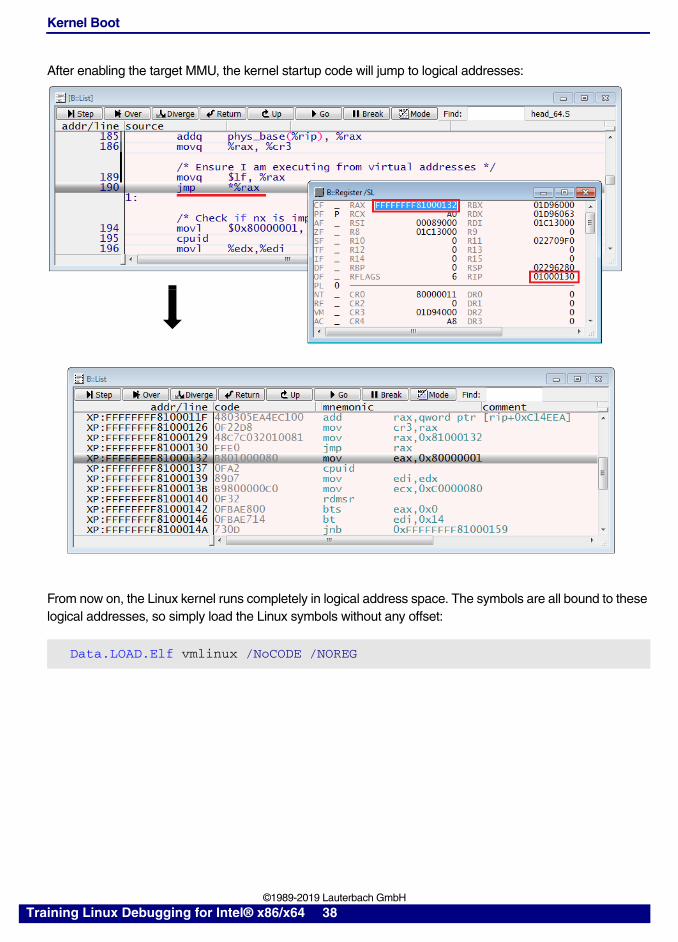
Kernel Boot
After enabling the target MMU, the kernel startup code will jump to logical addresses:
From now on, the Linux kernel runs completely in logical address space. The symbols are all bound to these logical addresses, so simply load the Linux symbols without any offset:
Data.LOAD.Elf vmlinux /NoCODE /NOREG
Training Linux Debugging for Intel® x86/x64 38 ©1989-2019 Lauterbach GmbH

Now you need to set up the debugger address translation and load the Linux awareness as described in the previous chapter.
You can use now software breakpoints in the kernel range since all the kernel code is accessible.
Training Linux Debugging for Intel® x86/x64 39 ©1989-2019 Lauterbach GmbH

If the kernel doesn’t boot correctly, you can use the TASK.DMESG command to display the kernel boot log. This is especially helpful, if you don’t have a serial console or if the kernel crashes in an early boot phase.
Verifying Image and Symbols
It is very important that the kernel running on the target is from the very same build as the symbol fileloaded into the debugger. A typical error is that the loaded vmlinux file doesn’t match the executed kernel onthe target. This can lead to different errors.
You can check if the kernel code matches the loaded symbols using the TASK.CHECK command. First let the kernel boot, stop the target and then execute TASK.CHECK. When the symbols does not match the kernel code, you will get an error message in this window:
Training Linux Debugging for Intel® x86/x64 40 ©1989-2019 Lauterbach GmbH

Example: Debugging Built-in Device Drivers
Most of the built-in device drivers are registered in the initcall table. You can search for the “__initcall_start“ label (in newer Linux kernel versions ”__initcall0_start”, “__initcall1_start”,...) in the sYmbol.Browse window and view it as a fixed table:
Training Linux Debugging for Intel® x86/x64 41 ©1989-2019 Lauterbach GmbH

You will get a table with the start addresses of the device drivers init functions you can display the names of the functions by checking the “sYmbol” item in the “pointer” category:
.
Training Linux Debugging for Intel® x86/x64 42 ©1989-2019 Lauterbach GmbH

By selecting Display Memory and then Indirect List from the popup menu, you can display the source code of a specific function in the list:
Please note that the kernel overwrites this table after booting.
Training Linux Debugging for Intel® x86/x64 43 ©1989-2019 Lauterbach GmbH

Example: Trapping Segmentation Violation
Segmentation violation happens if the code tries to access a memory location that cannot be mapped in an appropriate way. E.g. if a process tries to write to a read-only area or if the kernel tries to read from an non existent address. A segmentation violation is detected inside the kernel routine “__do_page_fault”.
In the case of a segmentation violation, the kernel jumps to the function “bad_area”. To trap the segmentation violation, we set a software breakpoint at this label. When the breakpoint is hit, we take a look to the “regs” structure which contains the complete register set at the location where the fault occurred. The Frame window will show then the call stack.
The “ip” parameter of the “regs” structure contains the value of the instruction pointer where the segmentation violation occurred. If we display the assembly code at this address, we see that the code accesses the memory pointed by the register rax. We can see from the “regs” structure that this register has the value 0x2E00000000 which is an invalid memory address. The pointer “ptr” has been actually here accessed without being initialized and has a random value.
Training Linux Debugging for Intel® x86/x64 44 ©1989-2019 Lauterbach GmbH

Training Linux Debugging for Intel® x86/x64 45 ©1989-2019 Lauterbach GmbH
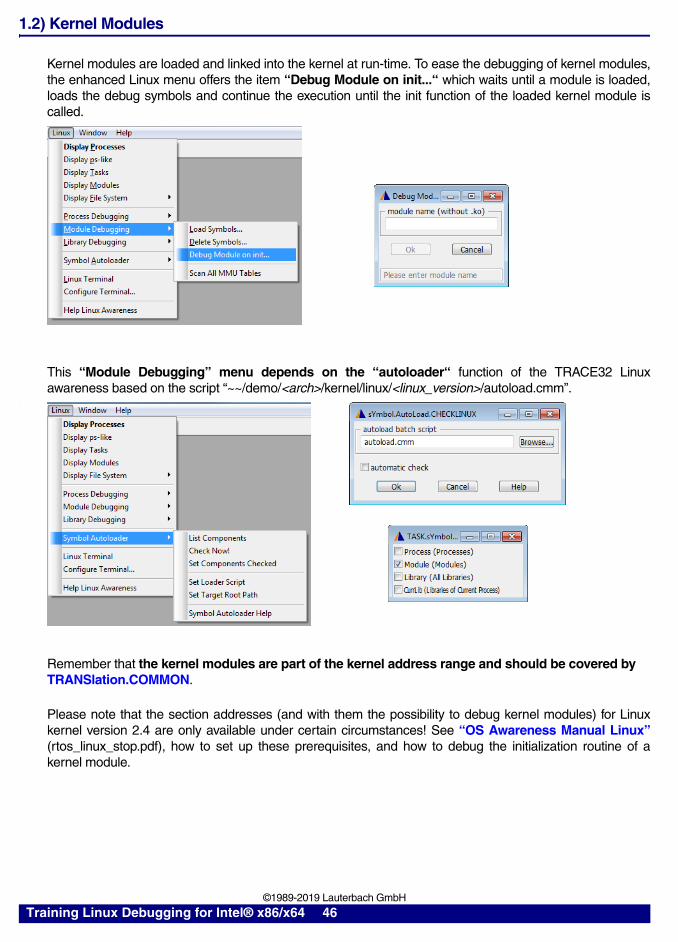
1.2) Kernel Modules
Kernel modules are loaded and linked into the kernel at run-time. To ease the debugging of kernel modules,the enhanced Linux menu offers the item “Debug Module on init...“ which waits until a module is loaded,loads the debug symbols and continue the execution until the init function of the loaded kernel module iscalled.
This “Module Debugging” menu depends on the “autoloader“ function of the TRACE32 Linuxawareness based on the script “~~/demo/<arch>/kernel/linux/<linux_version>/autoload.cmm”.
.
Remember that the kernel modules are part of the kernel address range and should be covered by TRANSlation.COMMON.
Please note that the section addresses (and with them the possibility to debug kernel modules) for Linuxkernel version 2.4 are only available under certain circumstances! See “OS Awareness Manual Linux”(rtos_linux_stop.pdf), how to set up these prerequisites, and how to debug the initialization routine of akernel module.
Training Linux Debugging for Intel® x86/x64 46 ©1989-2019 Lauterbach GmbH

We load here for example the crc32.ko kernel module by calling the command “insmod crc32.ko”. Thedebugger will then stop the execution at the init function of this kernel module (crc32_mod_init).
The demo directory contains a script file called “mod_debug.cmm” which has the same functionality as themenu item “Debug Module on init...“ e.g:
It is also possible to load the debug symbols for an already running kernel module using the command TASK.sYmbol.LOADMOD
DO ~~/demo/x64/kernel/linux/awareness/mod_debug.cmm crc32
TASK.sYmbol.LOADMOD "crc32" ; load module symbols
Training Linux Debugging for Intel® x86/x64 47 ©1989-2019 Lauterbach GmbH

You can also load the kernel module symbols by selection the TRACE32 Linux menu “Module Debugging“ then “Load Module Symbols...” or by doing a right mouse click in the TASK.MODule window then “Load Module Symbols”
If you remove a kernel module (with “rmmod”), you should remove the symbols of the module from thedebugger.
TASK.sYmbol.DELeteMod "crc32" ; erase obsolete module symbols
Training Linux Debugging for Intel® x86/x64 48 ©1989-2019 Lauterbach GmbH

1.3) Processes
Debugging a Process from the Start
You can configure the debugger to debug a process from its main function. The Linux menu provides acomfortable way to debug processes from its start. The process will be stopped right after the instruction atmain is executed. (Due to the page fault handling the needed page could not be available until the CPUwants to execute the instruction at main.)
You can also use the script app_debug.cmm available under ~~/demo/<arch>/kernel/linux/awareness/ todebug processes on main e.g.
Now after this preparation you can wait till the application reaches the main function of the given process.Internally a conditional software breakpoint is set on a specific kernel function. When this breakpoint is hit,TRACE32 checks if the specified process is the current one. If so the debugger extracts the space ID andloads the symbols. At this stage, the code of the process has not yet been loaded so we can’t set softwarebreakpoints on the process’ code. We use instead here an on-chip breakpoint to the first instruction HLL lineafter main().
DO ~~/demo/x86/kernel/linux/awareness/app_debug.cmm sieve
Enter the name of the process (without parameters).By checking the “send command to TERM window”, the process will be started from the TERM window.
Training Linux Debugging for Intel® x86/x64 49 ©1989-2019 Lauterbach GmbH

As soon as the process is started, the code will be loaded and executed and the breakpoint will be hit.
Training Linux Debugging for Intel® x86/x64 50 ©1989-2019 Lauterbach GmbH

Debugging a Process Started Already
You can also load the debug symbols of an already running process using the TRACE32 command TASK.sYmbol.LOAD
The process symbols can also be loaded from the TRACE32 Linux menu “Process Debugging” -> “LoadSymbols...” or per mouse click in the TASK.DTask or TASK.Process window.
Symbol Cleanup after Process Termination
After the process “sieve” exits its symbols are no more valid:
You should delete the symbols with the following command:
TASK.sYmbol.LOAD "sieve" ; load process symbols
sYmbol.Delete \\sieve ; get rid of invalid symbols
Training Linux Debugging for Intel® x86/x64 51 ©1989-2019 Lauterbach GmbH

Process Watch System
There is a “process watch system” available that watches for the creation and termination of specifiedprocesses. This watch system then loads and deletes symbols automatically and keeps the MMU in sync.See TASK.Watch in “OS Awareness Manual Linux” (rtos_linux_stop.pdf) for details.
Further exiting features of the TRACE32 Linux awareness are shown in chapter “Linux specificWindows and Features”.
1.4) Threads
Threads are Linux tasks that share the same virtual memory space. The Linux awareness assignes thespace ID of the creating process to all threads of this process. Because symbols are bound to a specificspace ID, they are automatically valid for all threads of the same process. There is no special handling forthreads. See chapter “Processes” how to load and handle these symbols.
Use the watch system and the menu to add and remove processes to be observed and synchronized to.It will significantly ease your work.
Training Linux Debugging for Intel® x86/x64 52 ©1989-2019 Lauterbach GmbH

1.5) Libraries
Libraries are loaded and linked dynamically to processes. Thus, they run in the virtual address space of the process and have dynamic addresses. To debug libraries, you can use the menu “Library Debugging”:
You can also display first the task list using the command TASK.DTask and then continue with double or right-clicks:
In case you want to load or delete the symbols of the library from the debugger command line or a PRACTICE script, you can use the following commands:
TASK.sYmbol.LOADLib "sieve" "libc-2.19.so" ; load library symbols
TASK.sYmbol.DELeteLib "\\libc-2.19" ; erase library symbols
Training Linux Debugging for Intel® x86/x64 53 ©1989-2019 Lauterbach GmbH

Please remember to configure the “autoloader” for libraries!
Training Linux Debugging for Intel® x86/x64 54 ©1989-2019 Lauterbach GmbH

2.) Linux specific Windows and Features
Display of System Resources
You can display different Linux resources (list of running tasks, kernel modules...) using special TRACE32 commands. Several windows are available to display e.g. the process list. TASK.PS displays the process table similar to the output of the “ps” shell command. TASK.DTask give you more detailed information. TASK.Process displays the processes with their threads. You can open all there window from the Linux menu or from the command line.
Training Linux Debugging for Intel® x86/x64 55 ©1989-2019 Lauterbach GmbH

Task Related Breakpoints
You can set conditional breakpoints on shared code halting only if hit by a specified task
When the breakpoint is hit, the debugger will check if the current task is the specified one. If it is not the case,the execution will be resumed.
Task Related Single Stepping
If you debug shared code with HLL single step, which is based on breakpoints, a different task could hit thestep-breakpoint. You can avoid this by using the following command:
Conditional breakpoints on the current task will be then used for step into / step over and you will not “leave” the task that you want to debug.
Break.Set myfunction /TASK "mytask"
SETUP.StepWithinTask ON
Training Linux Debugging for Intel® x86/x64 56 ©1989-2019 Lauterbach GmbH

Task Context Display
You can display the memory or the registers of a task which is not currently executing. Moreover, you can display the stack frame of any running task on the system.
List /TASK "mytask"Register /TASK "mytask"Frame /TASK "mytask"
Training Linux Debugging for Intel® x86/x64 57 ©1989-2019 Lauterbach GmbH

You can additionally “virtually” switch the context also from the TASK.DTask window by popup menu-item “Switch Context”:
Training Linux Debugging for Intel® x86/x64 58 ©1989-2019 Lauterbach GmbH

Troubleshooting
Most of the errors in Linux aware debugging are due to a wrong symbol information or to an incorrect setup of the debugger address translation.
The loaded vmlinux file must match the kernel binary executed on the target. To verify if this is the case, you can perform the following steps:
• Load the vmlinux file to the debugger virtual memory (VM:) using the following command.
• Display the Linux banner string from the debugger VM or print it to the area window:
• Compare the Linux banner string with the output of the Linux command “cat /proc/version”. Both strings must be identical including the timestamps.
Moreover, you need to make sure that the kernel was configured with CONFIG_DEBUG_INFO enabled and with CONFIG_DEBUG_INFO_REDUCED not set.
The next point to check in case you are having trouble is if the debugger address translation is correctly set. Problems due to an incorrect setup of the debugger address translation especially show up when debugging kernel modules or debugging in the user-space. You need to check the following:
• Is the MMU Format set with the MMU.FORMAT command correct?
• Is the kernel logical address translation correct? To check this translation, you can use the command MMU.List.PageTable address with the kernel logical start address as parameter when the kernel has already booted e.g.
If you are still having trouble, please select the TRAC32 menu “Help” -> “Support” -> “Systeminfo...”, store your system information to a file and send this file together with your setup scripts as well as the content of the TASK.TEST window to [email protected]
Data.LOAD.Elf vmlinux AVM:0
Data AVM:linux_bannerPRINT Data.STRING(AVM:linux_banner)
MMU.List PageTable 0xC0000000
Training Linux Debugging for Intel® x86/x64 59 ©1989-2019 Lauterbach GmbH

Epilog
Thank you for reading and working through this training manual. You should now be able to debug Linux targets. This tutorial was written with as much care as possible for accuracy and comprehensibility.
However, Linux is a very complex system with different and changing internal structures. Please forgive any unclear or even incorrect content. If you find any mistakes, or if you have any comments/ideas to improve this document, feel free to mail your proposals to the Linux support team at Lauterbach. Your feedback as user of our tools is the most valuable input for us.
The LAUTERBACH Team ([email protected]).
Training Linux Debugging for Intel® x86/x64 60 ©1989-2019 Lauterbach GmbH