traffic signals safety and efficiency project – stage two implementation
TRANSCRIPT
Traffic Signals
Safety and
Efficiency Project
– Stage Two
ImplementationNational AITPM Conference,
WA Presentations
20 August 2015

2
The study looked at the Main Roads WA signal refinement processes by
examining two subject sites to identify:
• What signal treatments are currently utilised
• What signal improvements could be achieved
• Measures and methodology for signal timing refinement and
performance
• Main Roads WA signal refinement policy, management, and resources
Testing the use of an alternative method for optimising traffic signals to
squeeze more from existing infrastructure, this method being modelling with
integrated SCATS signal control.
Project Introduction
3
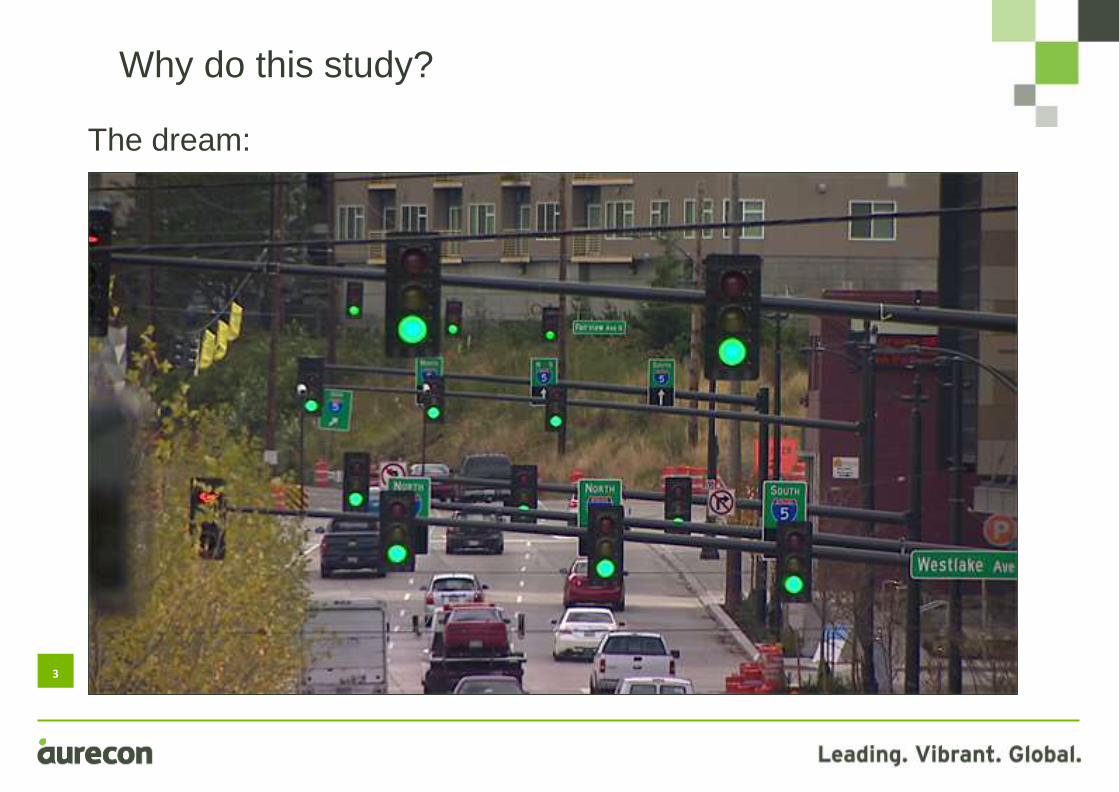
Why do this study?
The dream:

4
Why do this study?
The reality:

5
What is SCATS?
Sydney Coordinated Adaptive Traffic System
• SCATS monitors traffic volumes in real-time and coordinates traffic signals.
• It adjusts the coordination and green time of signals depending on the
traffic volumes detected on each approach.
• Approximately 900 signalised SCATS intersections in WA
(VicRoads Traffic Management Centre. Photograph courtesy of VicRoads.)

6
What is SCATS?
(Image courtesy of Google Street View.)

7
Stage One:
• Information from the Main Roads WA workshops and other sources
• Review of the SCATS settings
• Micro-simulation models built with SCATS signal control
• Morning, Midday, Evening, and Off peak periods tested
Stage Two:
• On-site implementation of recommended SCATS settings
• Assessment and evaluation of AM and PM periods
Many subject sites were considered but two were selected for testing:
• Orrong Road Corridor
• Tonkin Highway/ Kelvin Road intersection
Project Methodology

8
Tonkin Highway/ Kelvin Road Site Description

9
Orrong Road Site Description

10
Orrong Road Model
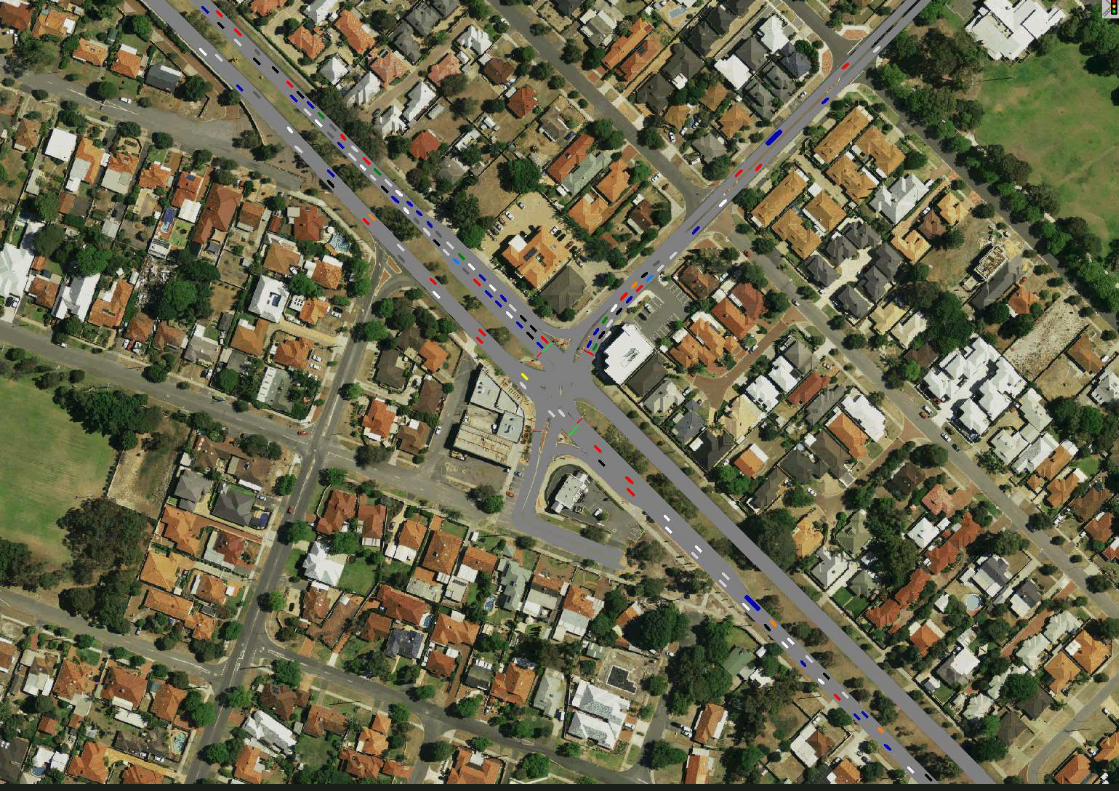
Orrong Road Model

12
Option Testing Plan
Orrong Road Quantitative Analysis
Option Option Details
Option 1Determine the optimal cycle time and refine SCATS data which will include
operating incremental split selection
Option 2 Stagger the pedestrian crossing on Wright and Oat Streets
Option 3
On the south approach of Francisco Place implement a left turn only with a u-
turn bay on Orrong Road. At Archer Street and Wright Street implement a lag
right turn. SCATS data refined.
Option 4 Testing of Oats Street under a double diamond overlap operation
Option 5Ultimate test, as per Option 1 with further refinement to SCATS data and
coordination

13
Percentage Change in Total Corridor Delay:
Orrong Road Quantitative Analysis
AM Midday PM Off-Peak Total
Option 1 -17.6% 25.8% 2.2% -7.0% -4.0%
Option 2 -2.4% 0.3% -7.8% 2.1% -3.7%
Option 3 -15.9% 2.4% 8.5% -7.8% -4.6%
Option 4 15.5% 8.0% 33.3% -2.5% 20.0%
Option 5 -16.8% 18.4% -13.2% -6.7% -10.0%
Equating this to annual delay cost to occupants, Option 5 would save
approximately $760,000 per year in lost time cost.
Carbon Emissions (grams):
AM Midday PM Off-Peak Total
Base 28,866 20,013 26,590 6,418 81,886
Option 1 26,786 20,953 27,641 6,038 81,419
Option 2 28,943 19,913 26,501 6,418 81,775
Option 3 27,273 19,776 28,161 6,044 81,255
Option 4 32,101 20,153 28,086 6,375 86,716
Option 5 27,546 20,484 26,614 6,092 80,736

14
Orrong Road Quantitative Analysis
00:00
01:00
02:00
03:00
04:00
05:00
06:00
07:00
08:00
09:00
10:00
0 500 1000 1500 2000 2500 3000 3500
Trav
el T
ime
Se
con
ds
Distance (m)
Westbound Journey Times - AM Peak
Base
Option 1
Option 2
Option 3
Option 4
Option 5
00:00
01:00
02:00
03:00
04:00
05:00
06:00
07:00
0 500 1000 1500 2000 2500 3000 3500
Trav
el T
ime
Se
con
ds
Distance (m)
Eastbound Journey Times - PM Peak
Base
Option 1
Option 2
Option 3
Option 4
Option 5

15
Orrong Road Base Model at Francisco Street

16
Orrong Road Option 5 Model at Francisco Street
17
• Option 5, widespread incremental split selection and optimal cycle time
with refinement, has the largest improvement in terms of delay and
average speed
• Option 1, 2, and 3 are considered to have performed slightly better
than the base model overall
• While improvement can be found through changes to the SCATS signal
settings, the current phasing setup can not be further improved.
Orrong Road Options Results Summary
18
• Pre-implementation assessment
• Recalibration and testing/ refinement of the option
• Trial Implementation
• On-site refinement
• Post-implementation assessment
• Evaluation Reporting
Stage Two: Orrong Road Implementation and
Evaluation

19
Orrong Road Option 5 Implementation Process
20
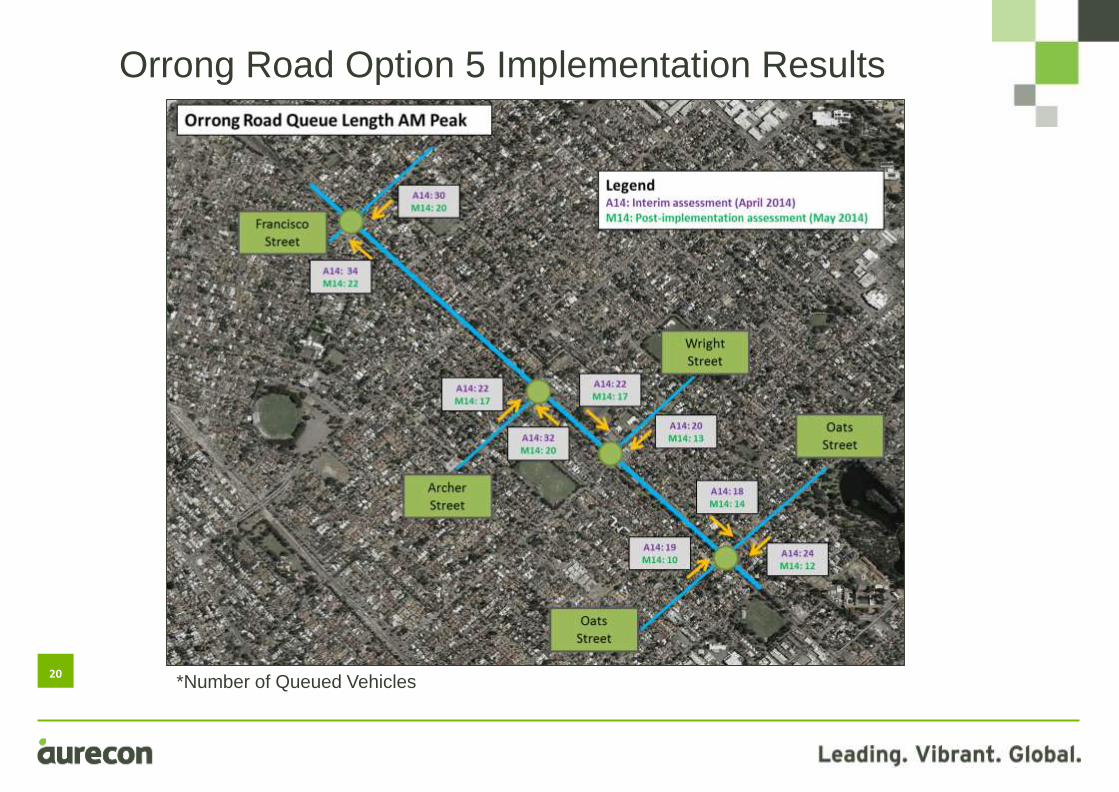
Orrong Road Option 5 Implementation Results
*Number of Queued Vehicles

21
Orrong Road Option 5 Implementation Results
*Number of Queued Vehicles

22
Orrong Road Option 5 Implementation Results
*Peak hour volumes

23
Orrong Road Option 5 Implementation Results
*Peak hour volumes

24
Orrong Road Option 5 Implementation Results
25
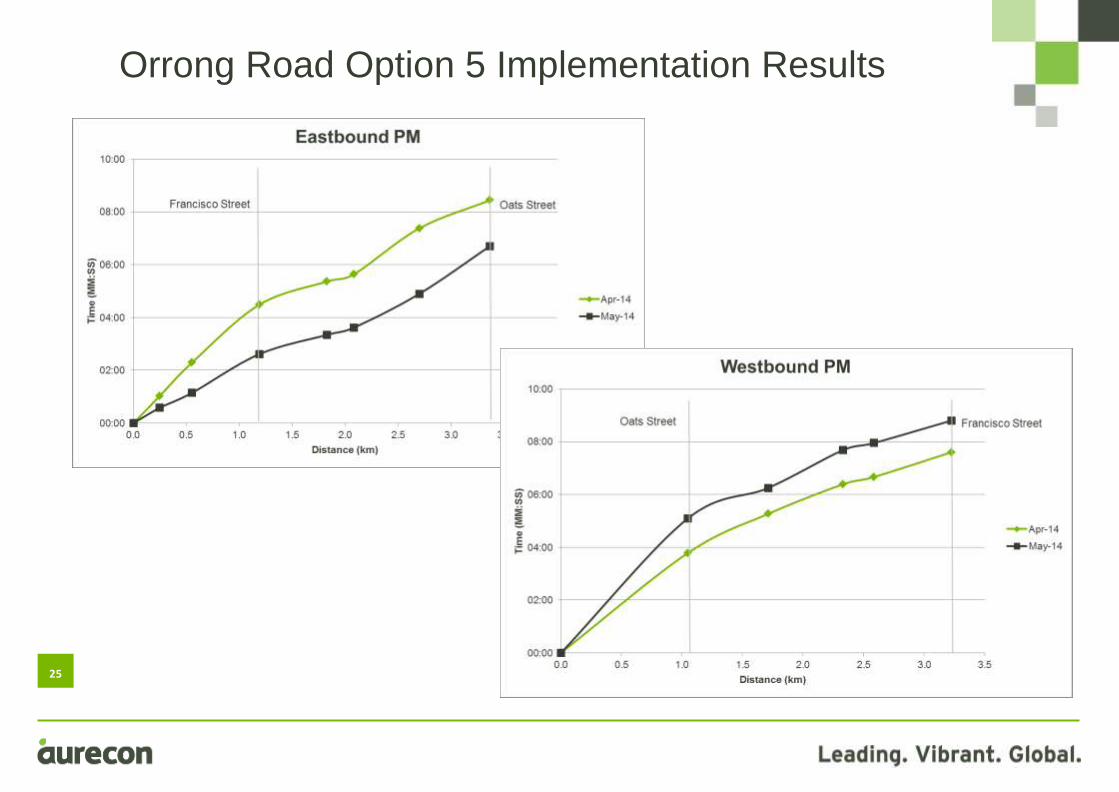
Orrong Road Option 5 Implementation Results

26
Stage Two Analysis Summary
• Vehicle throughput:
• up to 10% increase westbound, towards the Perth CBD, in the AM
period
• up to 3% increase eastbound, towards the Perth Hills, in the PM period
• Mixed travel time results:
• AM travel times remained relatively similar for both directions of travel
• PM period had a 20% decrease in travel times eastbound but a 16%
increase westbound.
• Overall mid-block and side roads queue lengths:
• 30% decrease in the AM period
• 34% decrease in the PM period

27
Overall Study Summary
• The use of ISS can improve the performance of several Orrong Road
intersections (ISS allows for more dynamic behaviour of the SCATS signal
phase splits)
• The reduction in cycle lengths provide a more balanced outcome for delays
• The use of micro-simulation modelling allowed multiple options to be tested
with the best performing option selected to provide an improvement once
implemented on-site.
• Future studies regarding the performance of signalised intersections should
have clearer communication links and protocols in place regarding signal
changes

28
Other Study Comments
• It is difficult to accurately allocate corridor benefits to individual SCATS settings.
• Higher cycle times allow increased periods of green time which can assist
slower vehicle types but these higher cycle times can lead to:
• Longer queue lengths, particularly on the side roads and in turn bays
• Increased delay for pedestrians.
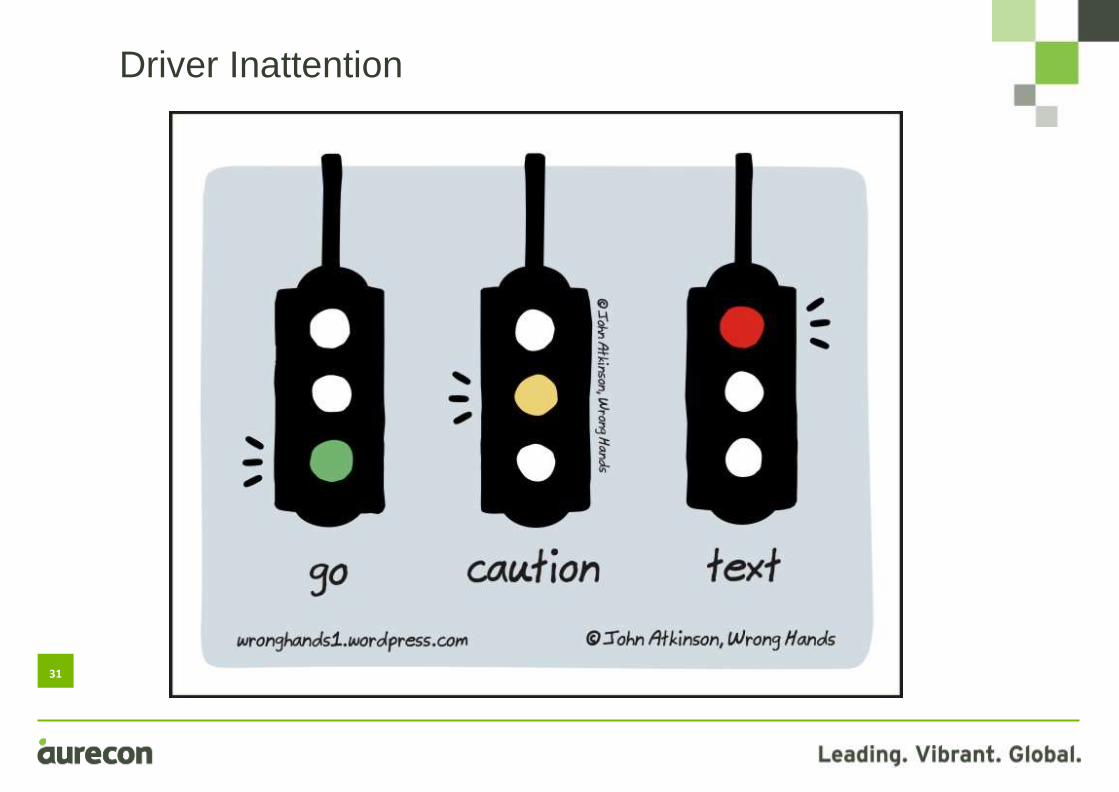
• Increased driver inattention resulting in poor reaction times
• More red light running to avoid waiting for the next signal cycle
• SCATS setting changes should be assessed on a site by site basis depending
on the traffic patterns and the coordination with surrounding intersections.
29
Modelling Comparison
• Shorter queue lengths observed for both the modelled and on-street scenarios.
• Some variation between the predicted model journey times and the on-street
journey times. Due to:
• The impact of the signal changes on pedestrian phase calls
• The impacts of minor private driveways
• On-street variability in the performance of heavy haul vehicles
• On-street traffic pattern variability
• Looking at the overall model predictions, the model predicted the improvement
in the corridor performance.

30
SCATS Signals Optimisation
It is not just the signals fault!
31
Driver Inattention

32
The WA Space-Time Continuum
(Image Courtesy of Google Earth)
33
Acknowledgements
RAC WA Policy and Research Team
- Anne Still, Senior Manager
- Una Mehta, Senior Traffic Engineer
- Sarah Macaulay, Transport Planning Manager
ATS – Bill Sissons
Main Roads WA TOC and Road Network Operations team
Aurecon – Steve Cotton, Peer Reviewer
Peter Kartsidimas - Initiation Team

34
Thank You
(Image Courtesy of Wikipedia)