traffic quality assessment at signalized intersections
TRANSCRIPT

1
Traffic Quality Assessment at Signalized Intersections – Procedures in the New German Highway Capacity Manual (HBS 2015)
Ning WU1
1 Institute for Traffic Engineering and Management, Ruhr-University, University St.
150, 44780 Bochum, Germany, PH +49 (234) 3226557; FAX +49 (234) 3214151; E-Mail: [email protected]
ABSTRACT
The first version of German Highway Capacity Manual was published in 2001. Now, a new version is published in 2015 (HBS 2015). For the new German Highway Capacity Manual, most major chapters are revised and some of them are totally rewritten.
The chapter for signalized intersections is one of the most important chapters in a highway capacity manual. In the new German Highway Capacity Manual, this chapter is totally rewritten in accordance with forthcoming developments in the past 10 years.
In this paper, an overview of the chapter for signalized intersections in the new German Highway Capacity Manual is presented. Procedures dealing with capacity and delay analyses are introduced. Differences between the former version and the new version of the German Highway Capacity Manual are indicated and discussed.
Keyword: German Highway Capacity Manual, Signalized Intersection, Traffic Quality Assessment INTRODUCTION
Germany has been involved in traffic engineering research since many decades. Initially, more popular calculation procedures were mainly based on deterministic considerations. Publication of the Highway Capacity Manual (HCM) in the 1950s spurred interest in the use of stochastic elements combined with empirical research in traffic engineering. Until 2001, different calculation procedures used in German traffic engineering applications have never been concentrated into one guideline such as the HCM. Instead, these applications were incorporated in different highway design guidelines. A new era in the development of traffic engineering guidelines for German conditions began when the Federal Department of Transportation (DOT) commissioned the Ruhr-University in 1989 to develop a prototype for a German Highway Capacity Manual (HBS). The first draft for this manual was finished in 1993 and was published a year later by Brilon, et al. (1994).
The first edition of the German Highway Capacity manual (Handbuch fuer die Bemessung von Strassenverkehrsanlagen, HBS 2001) was published in 2001 (FGSV, 2001). It was introduced by the German federal DOT as a methodological

2
basis for capacity calculations and quality assessments. Similar to the US Highway Capacity Manual (HCM 2010; TRB, 2010), HBS 2001 is based on the concept of Level of Service. An overview of the current version of HBS 2001 was given by Brilon (1998).
After its publication, HBS 2001 has found wide applications. Because of the importance for professionals in the practice, the German Road and Transportation Research Association (FGSV) decided to up-date this manual. Goals of the updating work are to revise the existing chapters and to complete the contents as good as possible. In comparison to HBS 2001, the methodologies for assessment should be given in more details in the new edition.
The Institute for Traffic Engineering at Ruhr-University has provided significant contributions to the development of the new German Highway Capacity Manual (HBS 2015). A short introduction to HBS 2015 is already given by Wu (2009).
The chapter for signalized intersection in HBS 2015 is totally revised, because some fundamental parameters and calculation procedures are not more up to date. For example, the base saturation flow rate is recalibrated and the delay formula is substituted by a new one which considers also the coordination and peak-hour effect. In HBS 2015, the chapter for signalized intersection is also improved by avoiding overlapping with the German Guidelines for Traffic Signals (RiLSA; FGSV, 2010).
In this paper, the major modifications of the chapter for signalized intersections in HBS2015 are presented and discussed.
GENERAL CONSIDERATIONS
As a basic concept, the new HBS 2015 (FGSV, 2015) focuses only on the assessment of traffic performance at signalized intersections given a predefined signal timing plan. The procedure for traffic signal design is referred to RiLSA (FGSV, 2010). That is, in HBS 2015, the green time g and the cycle time C are given as input parameters which should be estimated beforehand according to RiLSA. In contrast to the previous HBS 2001, an effective green time ge is used for further calculation instead of the length of green time g. The effective green is defined as the green time g plus 1 second. That is,
1 gge (1)
with g = green time, s
ge = effective green, s The base saturation flow rate So is 2,000 pc/h/ln. That is, a base saturation
headway tH,0 = 1.8 s is used for the base condition. For taking account external conditions, the base saturation headway is than adjusted as following.
0,21 HHVH tffft
with tH = adjusted saturation headway, s
f1 = max (fb, fR, fs), -
3
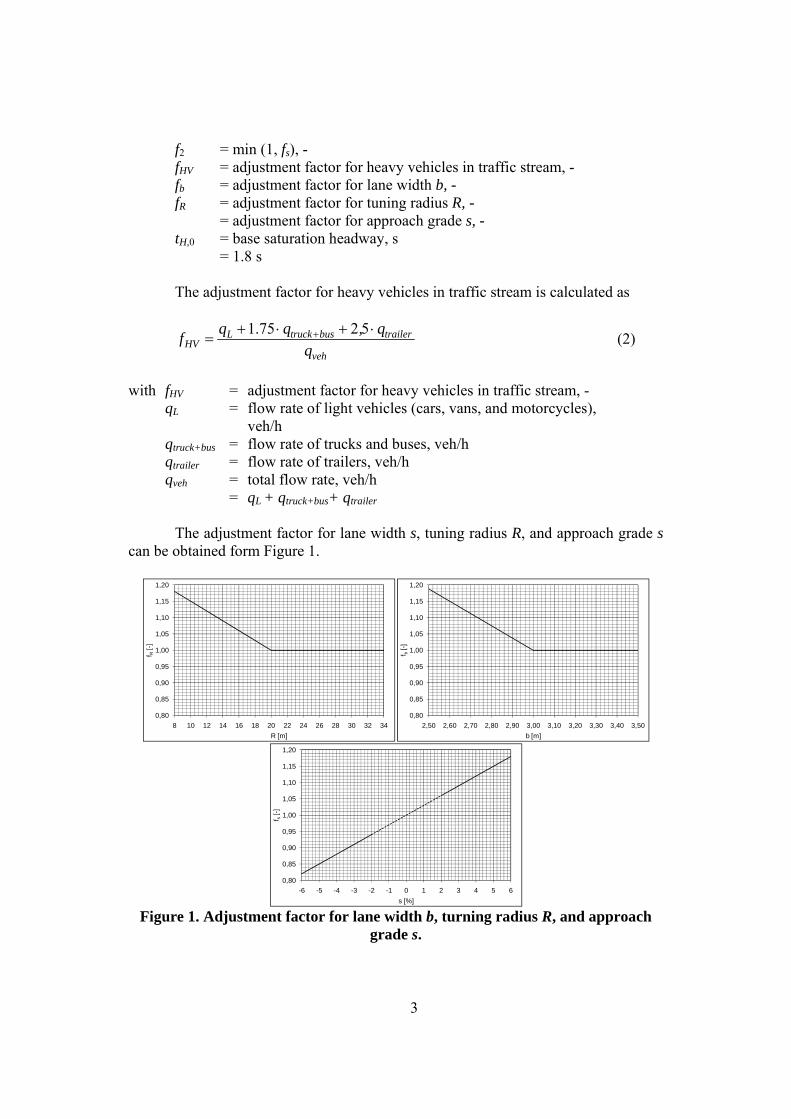
f2 = min (1, fs), - fHV = adjustment factor for heavy vehicles in traffic stream, - fb = adjustment factor for lane width b, - fR = adjustment factor for tuning radius R, - = adjustment factor for approach grade s, - tH,0 = base saturation headway, s
= 1.8 s The adjustment factor for heavy vehicles in traffic stream is calculated as
veh
trailerbustruckLHV q
q,qqf
5275.1
(2)
with fHV = adjustment factor for heavy vehicles in traffic stream, - qL = flow rate of light vehicles (cars, vans, and motorcycles),
veh/h qtruck+bus = flow rate of trucks and buses, veh/h qtrailer = flow rate of trailers, veh/h qveh = total flow rate, veh/h = qL + qtruck+bus+ qtrailer
The adjustment factor for lane width s, tuning radius R, and approach grade s
can be obtained form Figure 1.
Figure 1. Adjustment factor for lane width b, turning radius R, and approach
grade s.
0,80
0,85
0,90
0,95
1,00
1,05
1,10
1,15
1,20
8 10 12 14 16 18 20 22 24 26 28 30 32 34
f R[-
]
R [m]
0,80
0,85
0,90
0,95
1,00
1,05
1,10
1,15
1,20
2,50 2,60 2,70 2,80 2,90 3,00 3,10 3,20 3,30 3,40 3,50
f b[-
]
b [m]
0,80
0,85
0,90
0,95
1,00
1,05
1,10
1,15
1,20
-6 -5 -4 -3 -2 -1 0 1 2 3 4 5 6
f s[-
]
s [%]

4
One can recognize that maximum only three adjustment factors are applied. The adjusted saturation flow rate S is than calculated as
HtS
3600 , veh/h/ln (3)
CAPACITY ESTIMATION
Capacities for different movements and different lane configurations (critical points, cf. Figure 2) can be calculated in HBS 2015:
1. Capacity of protected signal groups 2. Capacity of permitted or partially permitted left-turn movements 3. Capacity of permitted or partially permitted right-turn movements 4. Capacity of share lanes, and 5. Capacity of share short-lanes
Figure 2. Critical points of capacity estimation at signalized intersections.
Capacity of protected signal groups
The capacity of protected signal groups is simply the product of the saturation flow rate and departure ratio. That is,
SC
gc e , veh/h/ln (4)
Capacity of permitted or partially permitted left-turn movements
The capacity of permitted or partially permitted left-turn movements is calculated as follows.
L
ptpcpmL c
cccc
,0
min (5)
with cL = total capacity of the permitted or partially permitted left-turn
movement, veh/h/ln cpm = capacity during permitted period (modified formulation), veh/h/ln = f(qo)

5
qo = opposing flow rate, veh/h cpc = capacity as a results of sneakers during phase changing, veh/h/ln cpt = capacity during the protected period, veh/h/ln c0,L = capacity in case of totally protected control, veh/h/ln
The capacity during permitted period cpm is calculated according to the gap-acceptance theory. This capacity can be obtained using Figure 3.
Single-lane opposing stream Double-lane opposing stream Figure 3. Capacity during permitted period for left-turn movements.
Capacity of permitted or partially permitted right-turn movements
The capacity of permitted or partially permitted right-turn movements is calculated using the following formula.
,R
CR,ped
R
c
nnSC
t
c
0
0
min (6)
with cR = total capacity of the permitted or partially permitted right-turn
moment, veh/h/ln C = cycle time, s S = saturation flow rate of the right-turn lane, veh/h/ln t0,ped = residual green time without impedance by pedestrians or cyclists, s nR = number of possible waiting places between stop line and parallel
crossing pedestrians/cyclists, veh nC = number of cycles each hour of time, - = 3600 / C c0,R = capacity in case of totally protected control, veh/h/ln
The residual green time for the right-turn movement without impedance by pedestrians or cyclists is
0
max0HRadvocc
,ped
tnttgt (7)
0
100
200
300
400
500
600
700
0 100 200 300 400 500 600 700 800 900 1000
CD
[Kfz
/h]
qgegen [Kfz/h]
fdurch [-]
0
100
200
300
400
500
600
700
0 100 200 300 400 500 600 700 800 900 1000
CD
[Kfz
/h]
qgegen [Kfz/h]
fdurch [-]
qo [veh/h]qo [veh/h]
c pm [v
eh/h
]
c pm [v
eh/h
]
(g+1)/C (g+1)/C
6
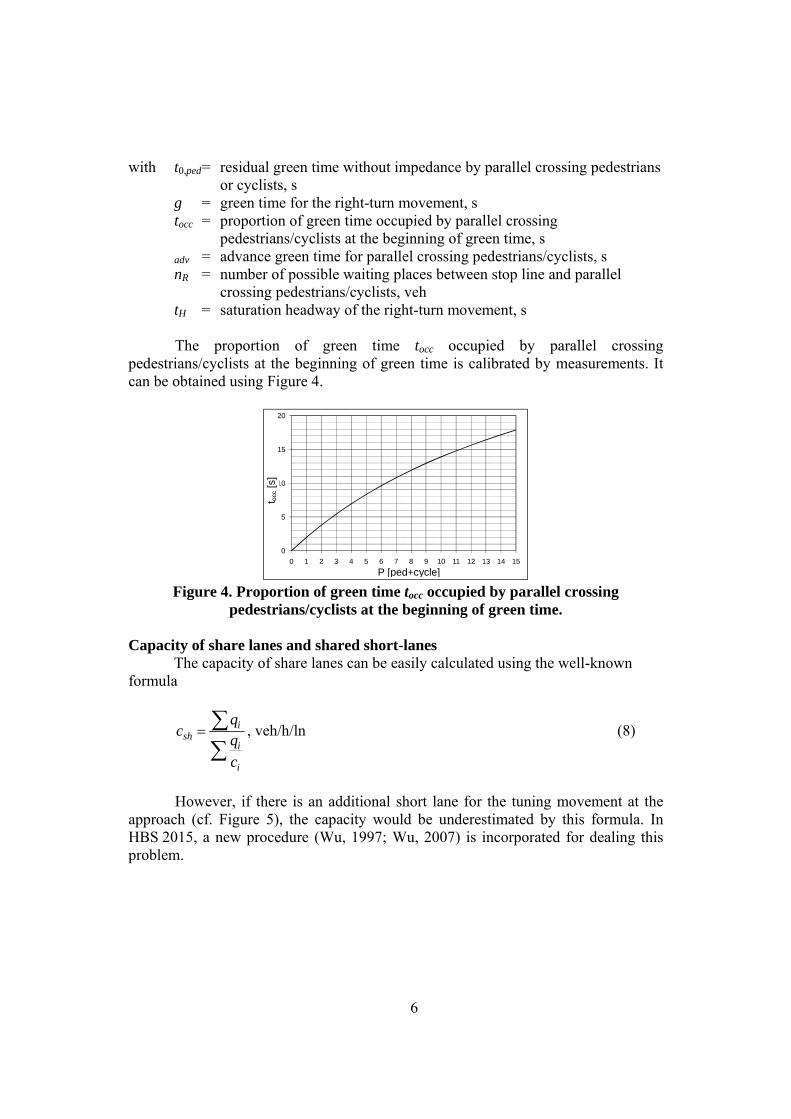
with t0,ped = residual green time without impedance by parallel crossing pedestrians
or cyclists, s g = green time for the right-turn movement, s tocc = proportion of green time occupied by parallel crossing
pedestrians/cyclists at the beginning of green time, s adv = advance green time for parallel crossing pedestrians/cyclists, s nR = number of possible waiting places between stop line and parallel
crossing pedestrians/cyclists, veh tH = saturation headway of the right-turn movement, s
The proportion of green time tocc occupied by parallel crossing pedestrians/cyclists at the beginning of green time is calibrated by measurements. It can be obtained using Figure 4.
Figure 4. Proportion of green time tocc occupied by parallel crossing
pedestrians/cyclists at the beginning of green time.
Capacity of share lanes and shared short-lanes The capacity of share lanes can be easily calculated using the well-known
formula
i
i
ish
c
c , veh/h/ln (8)
However, if there is an additional short lane for the tuning movement at the
approach (cf. Figure 5), the capacity would be underestimated by this formula. In HBS 2015, a new procedure (Wu, 1997; Wu, 2007) is incorporated for dealing this problem.
0
5
10
15
20
0 1 2 3 4 5 6 7 8 9 10 11 12 13 14 15
t BZ
[s]
P [Fg+Rad]P [ped+cycle]
t occ
[s]
7
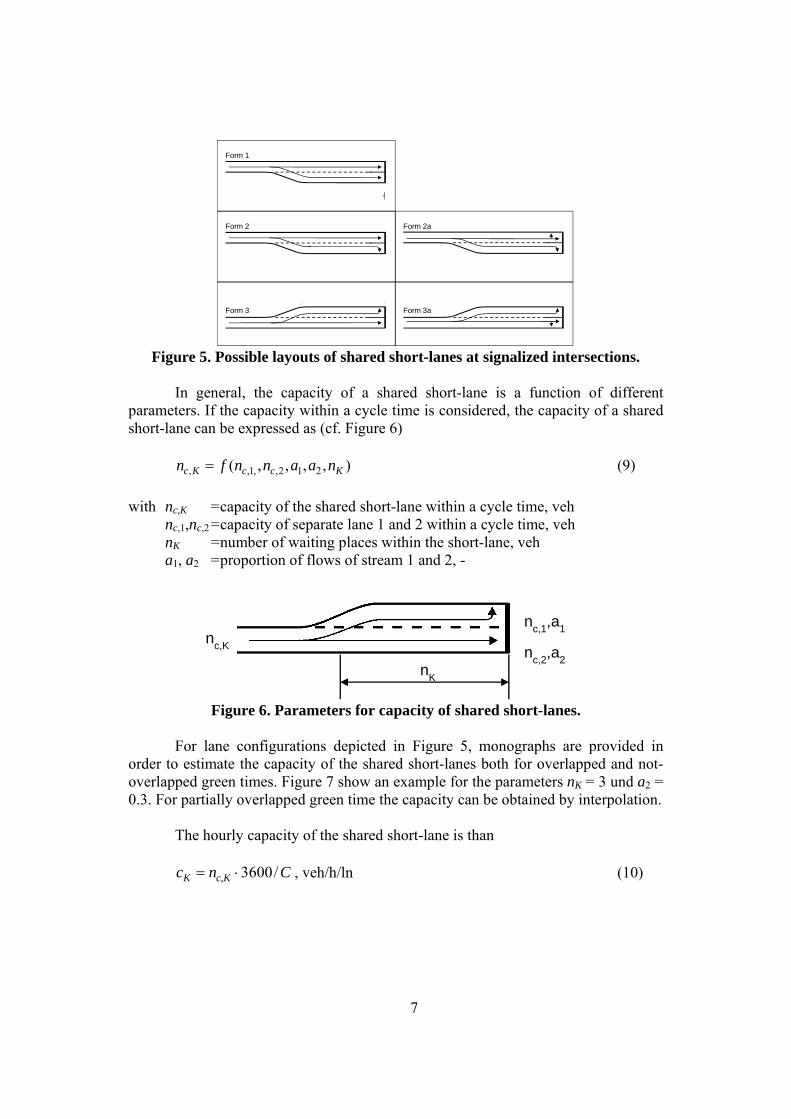
Figure 5. Possible layouts of shared short-lanes at signalized intersections.
In general, the capacity of a shared short-lane is a function of different
parameters. If the capacity within a cycle time is considered, the capacity of a shared short-lane can be expressed as (cf. Figure 6)
),,,,( 212,,1,, KccKc naannfn (9)
with nc,K = capacity of the shared short-lane within a cycle time, veh nc,1,nc,2 = capacity of separate lane 1 and 2 within a cycle time, veh nK = number of waiting places within the short-lane, veh a1, a2 = proportion of flows of stream 1 and 2, -
Figure 6. Parameters for capacity of shared short-lanes.
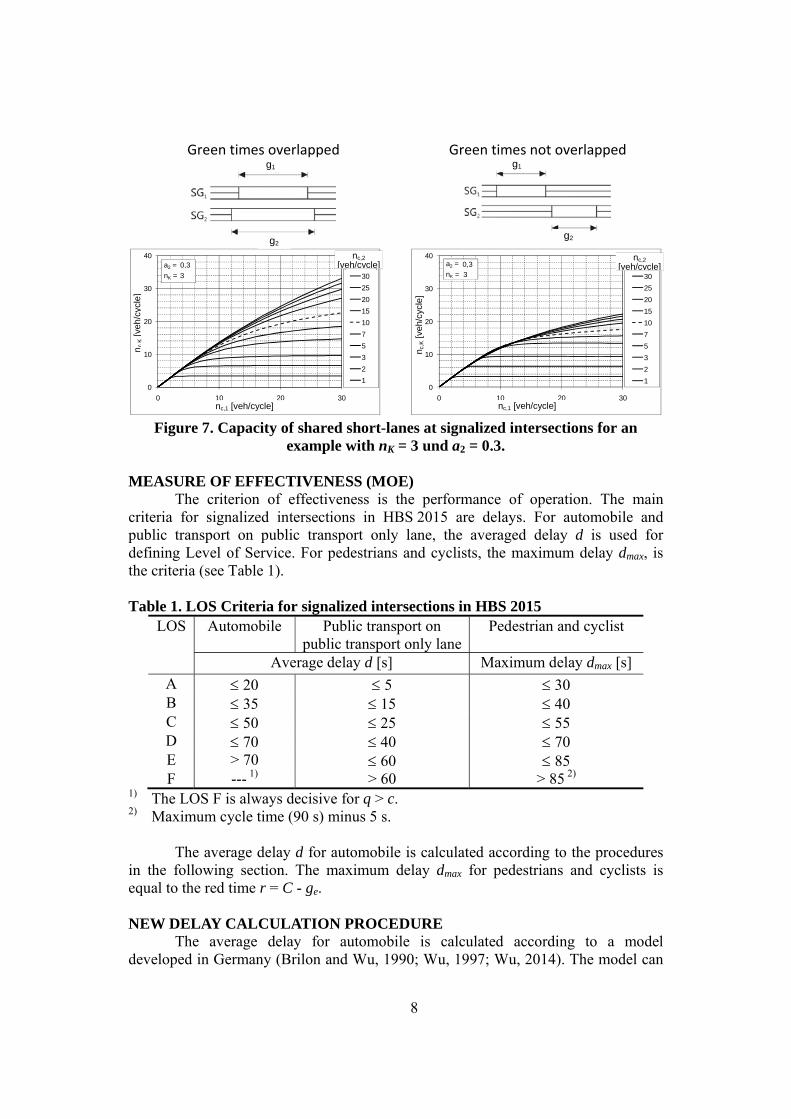
For lane configurations depicted in Figure 5, monographs are provided in
order to estimate the capacity of the shared short-lanes both for overlapped and not-overlapped green times. Figure 7 show an example for the parameters nK = 3 und a2 = 0.3. For partially overlapped green time the capacity can be obtained by interpolation.
The hourly capacity of the shared short-lane is than
Cnc c,KK /3600 , veh/h/ln (10)
LK = nK · LKfz
Form 1
LK = nK · LKfz
Form 2
LK = nK · LKfz
Form 3
LK = nK · LKfz
Form 3a
LK = nK · LKfz
Form 2a
nc,1
,a1
nc,2
,a2
nK
nc,K
8
Green times overlapped Green times not overlapped
Figure 7. Capacity of shared short-lanes at signalized intersections for an example with nK = 3 und a2 = 0.3.
MEASURE OF EFFECTIVENESS (MOE)
The criterion of effectiveness is the performance of operation. The main criteria for signalized intersections in HBS 2015 are delays. For automobile and public transport on public transport only lane, the averaged delay d is used for defining Level of Service. For pedestrians and cyclists, the maximum delay dmax, is the criteria (see Table 1). Table 1. LOS Criteria for signalized intersections in HBS 2015
LOS Automobile Public transport on public transport only lane
Pedestrian and cyclist
Average delay d [s] Maximum delay dmax [s] A 20 5 30 B 35 15 40 C 50 25 55 D 70 40 70 E > 70 60 85 F --- 1) > 60 > 85 2)
1) The LOS F is always decisive for q > c. 2) Maximum cycle time (90 s) minus 5 s.
The average delay d for automobile is calculated according to the procedures
in the following section. The maximum delay dmax for pedestrians and cyclists is equal to the red time r = C - ge.
NEW DELAY CALCULATION PROCEDURE
The average delay for automobile is calculated according to a model developed in Germany (Brilon and Wu, 1990; Wu, 1997; Wu, 2014). The model can
0,3
3
0
10
20
30
40
0 10 20 30
n c,g
F[K
fz/U
mla
uf]
nc,1 [Kfz/Umlauf]
30
25
20
15
10
7
5
3
2
1
nc,2[Kfz/Umlauf]a2 =
nK =
0,3
3
0
10
20
30
40
0 10 20 30
n c,n
gF
[Kfz
/Um
lauf
]nc,1 [Kfz/Umlauf]
30
25
20
15
10
7
5
3
2
1
nc,2[Kfz/Umlauf]a2 =
nK =
nc,1 [veh/cycle]
nc,
K [v
eh/c
ycle
]
nc,2[veh/cycle]
g1
g2 g2
g1
nc,1 [veh/cycle] n c
,K [v
eh/c
ycle
]
nc,2 [veh/cycle]

9
take into account the instationarity in the peak-hour using an instationarity factor fin. The instationarity factor fin is calculated according to the flow pattern in the peak-hour. In HBS 2015, a more realistic approximation (cf. flow pattern HBS 2015 in Figure 8, left) is used. This approximation can better take into account the peak-hour effect compared to the approximation in HBS 2001 (cf. flow pattern HBS 2001 in Figure 8, left). The resulting difference in the delay calculation is depicted in Figure 8, right. For fin > 1, the delay values from HBS 2015 are normally higher than the delay values rom HBS 2001 in the area between x = 0.8 and 1.0 because of the peak-hour effect.
Real pattern
HBS 2001
qin
T
qmax
q
q0
Flow rate q
time t
0.58T
HBS 2015
Figure 8. Flow patterns considering instationarity factor fin=qin/q (left) and the
effect in delay calculation (HBS 2001 vs HBS 2015). The effect of signal coordination is also considered using a progression
adjustment factor fk1 and an upstream filtering adjustment factor fk2 (cf. also HCM 2010; TRB, 2010). The progression adjustment factor fk1 is a function of the proportion of platoon Ppl and the arrival time of platoon ta (see Figure 9). The upstream filtering adjustment factor fk2 is a function of the upstream degree of saturation xu. The effect of the actuated signal control is neglected in the delay calculation in HBS 2015.
Figure 9. Proportion of platoon Ppl and arrival time of platoon ta.
The average delay at signalized intersections is calculated by the following
formula.
Ppl (platoon)
Flow rate
q2
q1
time
ta D
C-ge ge
d(2015) d(2001)
Ave
rage
del
ay d
[s]
g =30s C =60s T =1h S =2000 veh/h/ln fin =1.1
0 0.2 0.4 0.6 0.8 1 1.2
Degree of saturation x [-])

10
c
Ndfd GE
k3600
11
(11)
with d = average delay, s d1 = uniform delay, s
=
Cgx
CgC
e
e
/;1 min12
/1 2
fk1 = Progression adjustment factor (0 ≤ fk1 ≤ 2), -
= Cg
P
e /1
1
P = proportion of vehicles arriving on green, -
= 1
/min
CgR eP
Rp = platoon ratio (see Figure 9, can be obtained from Figure 10), - = f(ta, Ppl)
0.0R: At the beginning of red interval (= at the end of green interval) 0.5R: In the middle of red interval 1.0G: At the beginning of green interval (= at the end of red interval) 0.5G: In the middle of green interval 1.0G: At the end of green interval (= at the beginning of red interval), corresponds to 0.0R
Figure 10. Platoon ratio Rp as a function of the proportion of vehicles in platoon, Ppl, and the arriving time of the platoon, ta
ta = arrival time of the platoon as relative positon within the cycle time, - Ppl = proportion of vehicles in platoon, - c = capacity of the signal group, veh/h/ln x = degree of saturation, - = q/c NGE = average queue length at end of green time, veh

11
=
0
220
0
220
4)1()1(
4
58.0
4)1()1(
4
58.0
max
cT
xfxx
cT
cT
xffxfxf
cT
k
kininin
(12)
T = length of peak-hour (normally T = 1 h), h in = instationarity factor (comparable to peak-hour factor, see Figure 8)
5.1
1/41 6015
q
qin
fk2 = upstream filtering adjustment factor (0 ≤ fk2 ≤ 1)
=
68291.00.1
09.0max ,
ux
xu = weighted degree of saturation for all upstream movements contributing to the volume in the subject movement group (cf. HCM 2010), -
q15 = maximum 15-min flow rate, veh/15min/ln q60 = hourly flow rate, veh/h/ln SUMMARIES
This paper presents the major revisions of the chapter for signalized intersections in the new German Highway Capacity Manual (HBS 2015) which wil be published in 2015 (later 2015). The procedures for signalized intersections in HBS 2015 are comparable with the HCM 2010 in many aspects.
Compared to the previous version of German Highway Capacity Manual (HBS 2001), the new version (HBS 2015) is modified in the following aspects:
- No signal design procedure included, signal design is carried out using RiLSA 2010 (FGSV, 2010)
- All procedures are developed for traffic performance assessments - A effective green time ge = g + 1 is used - More accurate adjustment factors for saturation flow rate - A new model for delay calculation accounting for coordination and
instationarity in peak-hour - New procedures for shared short-lanes - New values for LOS definition
It should be noted, that for intersections with same input data, the new version
of German Highway Capacity Manual (HBS 2015) will deliver different LOS values compared to the old version (HBS 2001).
The proposed paper shows the expertise of our institute in research on capacity and service quality analysis. It demonstrates the experience in developing highway capacity manuals in Germany and as a partner in the United States. Those expertise and experience can give the audience and institutes involving in research on capacity models and in developing capacity manuals useful knowledge and help them avoiding unnecessary errors and mistakes.

12
REFERENCES Brilon, W. (1998). “HBS - The future German Highway Capacity Manual.” In:
Rysgaard, R. (ed.) Proceedings of the Third Internationla Symposium on Honghway Capacity- country Reports. Copenhagen.
Brilon, W., Grossmann, M. and Blanke, H. (1994). “Verfahren fuer die Berechnung der Leistungsfaehigkeit und Qualitaet des Verkehrsablaufs auf Strassen (Methods for Capacity and Traffic Quality Estimation).” Series Strassenbau und Strassenverkehrstechnik, No. 669
Brilon, W.; Wu, N. (1990). “Delays at fixed-time traffic signal under time-dependent traffic conditions.” Traffic Engineering and Control, 12/1990. Hemming Group Ltd., London, 1990.
FGSV (2001). “Handbuch für die Bemessung von Straßenverkehrsanlagen (HBS 2001, German Highway Capacity Manual).” Forschungsgesellschaft für Straßen- und Verkehrswesen (Hrsg.), Nr. 299, FGSV Verlag GmbH.
FGSV (2010). “Richtlinien für Lichtsignalanlagen - Lichtzeichenanlagen für den Straßenverkehr (RiLSA, German Guidelines for Traffic Signals).” Forschungsgesellschaft für Straßen- und Verkehrswesen (Hrsg.), Nr. 321.
FGSV (2015). “Handbuch für die Bemessung von Straßenverkehrsanlagen (HBS 2015, German Highway Capacity Manual).” Forschungsgesellschaft für Straßen- und Verkehrswesen (Hrsg.), to be published by FGSV Verlag GmbH.
TRB (2010). “Highway Capacity Manual (HCM 2010).” TRB, National Research Council, Washington, D.C.
Wu, N. (1990). “Wartezeit und Leistungsfähigkeit von Lichtsignalanlagen unter Berücksichtigung von Instationarität und Teilgebundenheit des Verkehrs (Dissertation).” Schriftenreihe des Lehrstuhls für Verkehrswesen der Ruhr-Universität Bochum, Heft 8. Ruhr-Universität Bochum, Bochum, 1990.
Wu, N. (1997). “Capacity of Shared-short Lanes at Unsignalized Intersections.” Proceedings of the Third International Symposium on Intersections without Traffic Signals, Portland, Oregon
Wu, N. (2007). “Total Capacity of Shared-Short Lanes at Signalized Intersection – a Generalized Approach based on Simulation Study.” Implementing the Concept of Reliability for Highway Capacity Analysis. 86th TRB Annual Meeting – Compendium of Papers (07-0138, best paper of the year). Published in: Transportation Research Record 2027, pp 19-26. Transportation Research Board, Washington D.C., 2007
Wu, N. (2009). “Further Development of the German Highway Capacity Manual (HBS2011)”. ASCE Conf. Proc.(doi: http://dx.doi.org/10.1061/41064(358) 201), ICCTP 2009: Critical Issues In Transportation Systems Planning, Development, and Management. pp. 1-6. August 5-9, 2009, Harbin, China.
Wu, N. (2014). “Modifying Progression Adjustment Factor and Upstream Filtering Adjustment Factor at Signalized Intersections in HCM.” TRB 2014 Annual Meeting, Preprint No. 14-0414. TRB, National Academies, Washington, D.C., USA, 2014