traffic noise reduction in europe
TRANSCRIPT

Report Delft, August 2007 Authors: L.C. (Eelco) den Boer
A. (Arno) Schroten
Traffic noise reduction in Europe
Health effects, social costs and technical and policy options to
reduce road and rail traffic noise
������������� �����
� ��� �� ���
�� ���� ��
���� ����
Oude Delft 180
2611 HH Delft
The Netherlands
tel: +31 15 2150 150
fax: +31 15 2150 151
e-mail: [email protected]
website: www.ce.nl
KvK 27251086

Publication Data
Bibliographical data: L.C. (Eelco) den Boer, A. (Arno) Schroten Traffic noise reduction in Europe CE Delft, March 2007 Traffic / Noise / Reduction / Health / Effects / Costs / Technology / Policy / Road / Railways / Publication code: 07.4451.27 CE Delft publications are available from www.ce.nl Commissioned by: T&E Brussels For further information on this study, contact Eelco den Boer at CE. © copyright, CE, Delft
This report is printed on 100% recycled paper.
CE Delft Solutions for environment, economy and technology
CE Delft is an independent research and consultancy organisation specialised in developing structural and
innovative solutions to environmental problems. CE Delfts solutions are characterised in being politically fea-
sible, technologically sound, economically prudent and socially equitable.

Preface
Millions of people in Europe are affected by transport noise. Transport noise an-noys people, causes stress and illness and may sometimes even have a fatal impact. As a result, noise is very costly to society. There are numerous cheap and relatively easy ways to reduce transport noise significantly. First of all, noise should be taken as seriously as other forms of pol-lution, as it is similarly damaging to human health. This year, 2007, is an impor-tant one for the future of noise policy. The European Commission is presenting a proposal for tightening car tyre noise emission limits, and in June 2007 the first noise maps of large agglomerations, main roads and railways were to be submit-ted to the Commission under the terms of the Environmental noise directive. This reports describes the health effects of rail and road transport noise and pre-sents a number of recommendations as to how to address them. We would like to kindly thank the people who reviewed this report for their contri-butions. The comments of Rokho Kim of the WHO and Tor Kihlman of the Chalmers Institute of Technology were especially helpful in improving the overall quality of the report. We also thank Nigel Harle for his careful editing of the Eng-lish. Eelco den Boer Arno Schroten


Contents
Summary 1
1 Introduction 3
2 The health effects of traffic noise 5 2.1 WHO Community Noise Guidelines 5 2.2 The relation between noise and human health 6 2.3 Review of health effects 7
2.3.1 Annoyance 7 2.3.2 Sleep disturbance 8 2.3.3 Impaired cognitive functioning 9 2.3.4 Cardiovascular disease 10 2.3.5 Mental illness 11
2.4 Traffic noise especially harmful to vulnerable groups 11 2.5 Over 210 million in EU25 exposed to harmful traffic noise 12 2.6 Health of millions of Europeans affected by traffic noise 13 2.7 Effects on animals and ecosystems 19
3 The social costs of traffic noise 21 3.1 Valuing the health effects of traffic noise 21 3.2 Social cost of traffic noise in EU22 over � 40 billion a year 21 3.3 Passenger cars and lorries responsible for bulk of costs 23 3.4 Benefits of noise reduction 23
4 Noise reduction options 25 4.1 At-source versus end-of pipe measures 25 4.2 Transport noise regulation: the legal framework 28 4.3 Vehicle noise regulation failed 29 4.4 Tyre noise limits too high to be effective 32 4.5 Low-noise road pavements 35 4.6 Speed reduction and traffic management 36 4.7 Anti-propagation measures (noise barriers, insulation) 37 4.8 Rail transport noise 38 4.9 Two-wheeled vehicle noise 40
5 Recommendations for action 43
Literature 45
A Exposure to traffic noise 57
B Social costs for traffic noise 61
C Vehicle noise emission trends 63


4.451.1/Traffic noise reduction in Europe August 2007
1
Summary
The main conclusions of this report are as follows: Health effects and social costs • Traffic noise has a variety of adverse impacts on human health. Community
noise, including traffic noise, is already recognised as a serious public health problem by the World Health Organization, WHO.
• Of all the adverse effects of traffic noise the most widespread is simply an-noyance.
• There is also substantial evidence for traffic noise disturbing sleep patterns, affecting cognitive functioning (especially in children) and contributing to cer-tain cardiovascular diseases. For raised blood pressure, the evidence is in-creasing. For mental illness, however, the evidence is still only limited.
• The health effects of noise are not distributed uniformly across society, with vulnerable groups like children, the elderly, the sick and the poor suffering most.
• In 2000, more than 44% of the EU251 population (about 210 million people) were regularly exposed to over 55 dB of road traffic noise, a level potentially dangerous to health. In addition, 35 million people in the EU25 (about 7%) are exposed to rail traffic noise above 55 dB. Millions of people indeed ex-perience health effects due to traffic noise. For example, about 57 million people are annoyed by road traffic noise, 42% of them seriously.
• A preliminary analysis shows that each year over 245,000 people in the EU25 are affected by cardiovascular diseases that can be traced to traffic noise. About 20% of these people (almost 50,000) suffer a lethal heart attack, thereby dying prematurely.
• The annual health loss due to traffic noise increased between 1980 and 2000 and is expected to increase up to 2020. In contrast, traffic safety has im-proved, following implementation of a variety of policy measures.
• At a conservative estimate, the social costs of traffic noise in the EU222 amount to at least � 40 billion per year (0.4% of total GDP). The bulk of these costs (about 90%) are caused by passenger cars and lorries.
Noise reduction options • If noise-related problems are to be alleviated, they must be the subject of
greater political focus. Vehicle noise emission limits have not been technol-ogy-forcing since their introduction and were last tightened in 1995. This means these limits have not been updated for twelve years, in stark contrast to vehicle air pollution emission standards, which have been tightened three times over the same period.
• Consequently, there has been no reduction in community exposure to noise. This is due to the lax limits in the EU Motor vehicle sound emission directive
1 EU25 refers to EU27 except Cyprus and Malta. 2 EU22 refers to EU27 except Cyprus, Estonia, Latvia, Lithuania and Malta.

4.451.1/Traffic noise reduction in Europe August 2007 2
and the Tyre/road directive, the fact that changes in test conditions have in practice led to even weaker limits, and increased traffic volumes.
• There is plenty of scope for reducing ambient noise levels by at least 3-4 dB(A) in the short term using currently available technology. Beyond 2012, year-on-year improvement targets (x dB(A) every y years) should be intro-duced, outlined well in advance to give industry time to adapt.
• In the case of both road and rail traffic, there are already vehicles/rolling stock available that are well within current noise standards. Besides the vehicles themselves, examples of silent tyres/wheels and road pavements/tracks show also room for noise reduction. At noise ‘hotspots’ additional, local measures can be implemented.
• The most cost-effective measures are those addressing the noise at-source. This includes noise from the engine, exhaust, mechanical systems and con-tact between tyres and road, or wheels and track. The associated costs are generally limited, for vehicles and tyres at least. There are signs that use of composite brake blocks on rail wagons also comes at a modest cost.
• Although an optimal noise control regime will always be a mix of local and at-source measures, the Commission should take responsibility for ensuring that the noise emissions of cars, tyres and railways are reduced significantly. These are the most cost-effective measures and their impact will be felt across Europe.
• When it comes to tightening noise standards and improving test procedures, prolonged discussions and political procedures are costing Europe dearly. If the EU does not come up with better policies soon, local measures will need to be taken, which are considerably more expensive than measures taken across the EU.

4.451.1/Traffic noise reduction in Europe August 2007
3
1 Introduction
Noise pollution consistently ranks high on the list of citizens’ concerns. It is esti-mated that over half of Europe’s population is exposed to unacceptable noise lev-els. Noise from road transport is the major source, followed by aircraft and rail-way noise. In its 6th Environmental Action Programme (2002-2012) the EU has set itself the objective of substantially reducing the number of people regularly affected by long-term average levels of noise. The aim of reducing noise expo-sure to acceptable levels has been repeated in the renewed Sustainable Devel-opment Strategy as well as in the transport White paper and its mid-term review. Despite all efforts in this direction, however, EU policy does not seem to recog-nise that noise is first and foremost a major environmental health issue. Vehicle noise regulation is important, especially in light of growing traffic volumes and the proximity between transport infrastructure and residential and living ar-eas. Every doubling of transport intensity increases noise levels by 3 dB(A). Ve-hicle noise regulation goes back to the 1970s, with tyre/road noise regulation added in 2001 and thereafter. In their present form, however, both sets of legisla-tion are too liberal to have had any significant effect and the number of people exposed to ambient noise has consequently increased rather than declined. This report highlights the scale and scope of the traffic noise problem, which af-fects a very substantial proportion of the European populace. It serves as a background report to a T&E brochure and is based on a thorough literature re-view. The report covers health effects and social costs, and reviews noise reduc-tion policies and measures to reduce noise exposure. In conclusion, a number of recommendations for action are given. The report focuses on road and rail trans-port.

4.451.1/Traffic noise reduction in Europe August 2007 4
4.451.1/Traffic noise reduction in Europe August 2007
5
2 The health effects of traffic noise
In this chapter we first discuss the health impact of traffic noise, describing the various effects signalled and discussing the scientific evidence for each. We then report on the number of people exposed to traffic noise and the number likely to be affected by the respective health effects. Finally, we briefly review the evi-dence for traffic noise having an impact on animals and ecosystems.
2.1 WHO Community Noise Guidelines
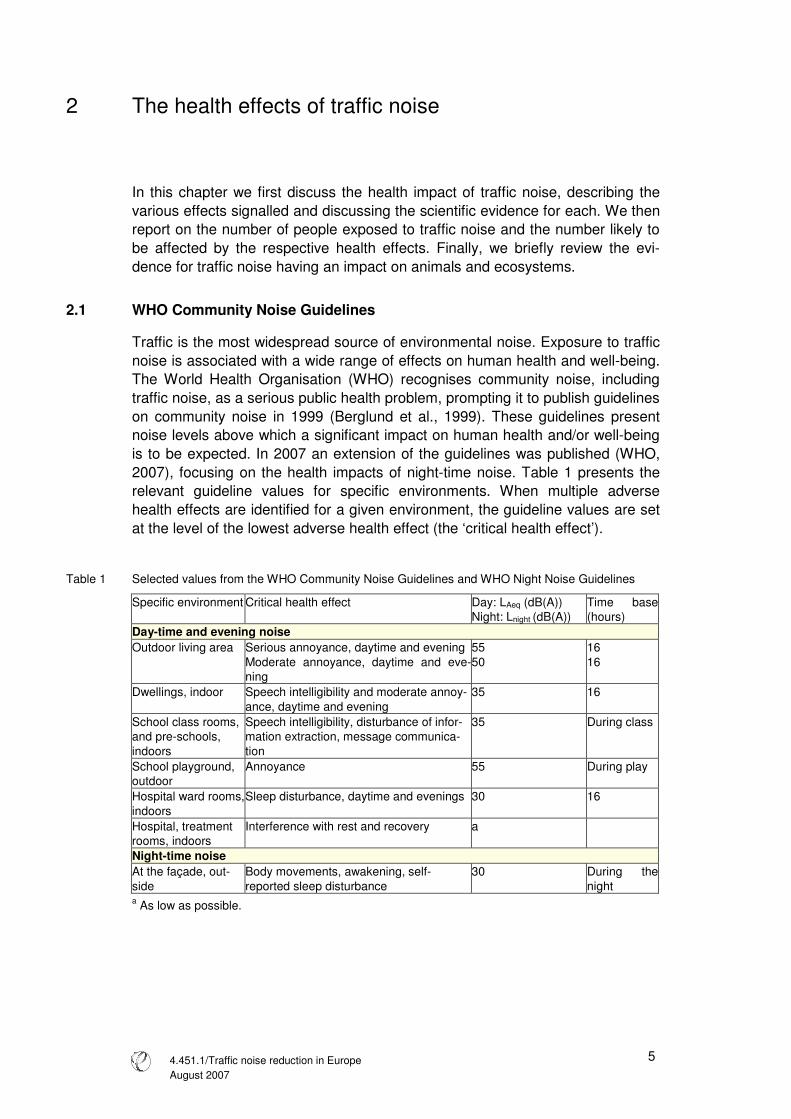
Traffic is the most widespread source of environmental noise. Exposure to traffic noise is associated with a wide range of effects on human health and well-being. The World Health Organisation (WHO) recognises community noise, including traffic noise, as a serious public health problem, prompting it to publish guidelines on community noise in 1999 (Berglund et al., 1999). These guidelines present noise levels above which a significant impact on human health and/or well-being is to be expected. In 2007 an extension of the guidelines was published (WHO, 2007), focusing on the health impacts of night-time noise. Table 1 presents the relevant guideline values for specific environments. When multiple adverse health effects are identified for a given environment, the guideline values are set at the level of the lowest adverse health effect (the ‘critical health effect’).
Table 1 Selected values from the WHO Community Noise Guidelines and WHO Night Noise Guidelines
Specific environment Critical health effect Day: LAeq (dB(A)) Night: Lnight (dB(A))
Time base (hours)
Day-time and evening noise Outdoor living area Serious annoyance, daytime and evening
Moderate annoyance, daytime and eve-ning
55 50
16 16
Dwellings, indoor Speech intelligibility and moderate annoy-ance, daytime and evening
35 16
School class rooms, and pre-schools, indoors
Speech intelligibility, disturbance of infor-mation extraction, message communica-tion
35 During class
School playground, outdoor
Annoyance 55 During play
Hospital ward rooms, indoors
Sleep disturbance, daytime and evenings 30 16
Hospital, treatment rooms, indoors
Interference with rest and recovery a
Night-time noise At the façade, out-side
Body movements, awakening, self-reported sleep disturbance
30 During the night
a As low as possible.

4.451.1/Traffic noise reduction in Europe August 2007 6
2.2 The relation between noise and human health
Traffic noise frequently exceeds the guideline values published by the WHO and those exposed to traffic noise consequently suffer an array of adverse health ef-fects. These include socio-psychological responses like annoyance and sleep disturbance, and physiological effects such as cardiovascular diseases (heart and circulatory problems) and impacts on mental health (RIVM, 2004). In addi-tion, traffic noise may also affect children’s learning progress. Finally, prolonged, cumulative exposure to noise levels above 70 dB(A), common along major roads, may lead to irreversible loss of hearing (Rosenhall et al., 1990). Figure 1 summarises the potential mechanisms of noise-induced health effects and their interactions. In the first place, noise exposure can lead to disturbance of sleep and daily activities, to annoyance and to stress. This stress can in turn trig-ger the production of certain hormones (e.g. cortisol, noradrenalin and adrena-line), which may lead to a variety of intermediate effects, including increased blood pressure. Over a prolonged period of exposure these effects may in their turn increase the risk of cardiovascular disease and psychiatric disorders. The degree to which noise leads to disturbance, annoyance and stress depends partly on individual characteristics, in particular a person’s attitude and sensitivity to noise. Finally, the relation between noise and personal health and well-being is also influenced by external factors like physical and social environment and life-style.
Figure 1 The mechanisms of noise-induced health effects
Source: HCN (Health Council of the Netherlands), 1999.
Exposure to sound
Other determi-nants of: • Physical
environment • Social
environment • Lifestyle
Processing by the organism
Genetic and acquired characteristics (atti-
tude, sensitivity, cop-ing style, etc.)
Disturbance of sleep, activities, performance,
concentration.
Annoyance and stress
Biological risk factors (blood dynamics, hormones)
Cardiovascular diseases, psychiatric disorders
Appraisal as noise
Vegetative response
Environment Health effects

4.451.1/Traffic noise reduction in Europe August 2007
7
2.3 Review of health effects
From Figure 1 and the discussion thus far we can identify the following potential health effects due to exposure to traffic noise: • Annoyance. • Sleep disturbance. • Disturbed cognitive functioning (learning and understanding). • Cardiovascular disease. • Adverse effects on mental health.
2.3.1 Annoyance
The most widespread problem created by noise is quite simply annoyance. An-noyance can be defined as a general feeling of displeasure or adverse reaction triggered by the noise. Among the ways it can express itself are fear, uncertainty and mild anger (Stansfeld & Matheson, 2003; RIVM, 2005). In the human envi-ronment (which also includes neighbours, industry, etc.) traffic is the single most important source of noise annoyance (Niemann & Maschke, 2004; RIVM, 2004). As Figure 2 shows, aircraft noise is perceived as more annoying than road and rail traffic noise at the same volume. At a noise level of 55 dB(A), the guideline limit set by the WHO, approximately 30% of those exposed are annoyed by air-craft noise, about 20% by road traffic noise and about 10% by rail traffic noise. Some people begin to experience annoyance at traffic noise from noise levels of 40 dB(A) upwards.
Figure 2 Percentage of people annoyed as a function of noise exposure of dwellings (Lden in dB(A))
Source: Miedema & Oudshoorn (2001). The degree of annoyance triggered by traffic noise is determined first of all by the noise level. The higher the level, the more people are annoyed and the greater the severity of perceived annoyance (Ellebjerg Larsen et al., 2002; RIVM, 2005).
0
10
20
30
40
50
60
70
80
40 45 50 55 60 65 70 75
Lden
% a
nn
oye
d
road
rail
aviation
WHO guideline
4.451.1/Traffic noise reduction in Europe August 2007 8
The degree of annoyance depends on other noise characteristics, too (London Health Commission, 2003). The higher the pitch of the noise, the greater the an-noyance. Duration and intermittency also influence the degree of annoyance. However, traffic noise-induced annoyance is governed by more than just acoustic factors, with personal and situational factors also coming into play, as well as a person’s relationship to the source of the noise. In a familiar illustration, a mos-quito may not make much of a noise, but during the night it can cause consider-able annoyance. Feelings of annoyance depend in the first place on an individ-ual’s sensitivity to noise (Ouis, 2001; RIVM, 2004). The fact that noise is a form of harm that can be avoided contributes to people’s perception of noise as annoy-ance (London Health Commission, 2003). Another important determinant of per-ceived annoyance is fear of the noise’s source (RIVM, 2004). People who feel they have no control over the situation, or believe authorities are failing to control it, are likely to experience a greater level of annoyance. Annoyance at noise de-pends also on how the noise interferes with everyday life (London Health Com-mission, 2003; Stansfeld & Matheson, 2003). People will be more annoyed when noise affects activities that involve talking and listening, such as conversations, listening to music, watching television and so on. Finally, noise in situations where it is expected is less annoying than noise in circumstances anticipated to be quiet. For this reason noise at night-time (the buzzing of a mosquito, as cited, but also traffic noise) is more annoying than during the day. To some extent, people frequently exposed to traffic noise develop strategies of adapting and coping with the problem (London Health Commission, 2003). The problem still remains, however: subconscious physical reactions, such as raised blood pressure, and levels of annoyance due to chronic noise will not diminish over time unless the noise itself is abated.
2.3.2 Sleep disturbance
Traffic noise is the main cause of sleep disturbance (Niemann & Maschke, 2004). This effect of noise on sleep has important health effects, since uninterrupted sleep is known to be a prerequisite for proper physiological and mental function-ing in healthy people (WHO, 2007). Three types of effects of noise on sleep can be distinguished: effects on sleeping behaviour (primary effects), effects on per-formance and mood through the following day (secondary effects) and long-term effects on well-being and health: • Sleeping behaviour. Night-time noise can increase the arousal of the human
body, i.e. lead to activation of the nervous system, which may result in a per-son awakening or prevent them from falling asleep (Ising et al., 2004; TNO In-ro, 2002; WHO, 2007). However, this arousal response to noise is often more subtle than mere awakening and may involve a change from a deeper to lighter sleep, an increase in body movements, a temporary increase in heart rate and changes in (stress) hormone levels (RVIM, 2003; HCN, 2004; WHO, 2007). Finally, there is also some evidence that blood pressure is affected by traffic noise during sleep (WHO, 2007).

4.451.1/Traffic noise reduction in Europe August 2007
9
• Effects on performance and mood through the following day. The secondary effects of sleep disturbance include reduced perceived sleep quality and in-creased drowsiness, tiredness and irritability (HCN, 2004). While there are al-so indications of other effects such as depressed mood and decreased per-formance (Ouis, 2001), the available evidence is still inconclusive (HCN, 2004; WHO, 2007).
• Long-term effects on well-being. In the long-term, night-time noise can lead to insomnia and increased medication use (HCN, 2004; WHO, 2007). It may also result in chronic annoyance (Berglund et al., 1999; RIVM, 2004). Fur-thermore, an increased risk of cardiovascular disease due to night-time noise is plausible, although there is only limited evidence for this effect (TNO Inro, 2002; WHO, 2007). Finally, there are certain indications that night-time noise can contribute to mental illness (WHO, 2007)
The effects of night-time traffic noise on sleep disturbance begin at fairly low vol-umes and become more likely as the intensity of the noise increases. Changes between sleep stages, increased body movements and heart-rate acceleration start at noise levels around 32-42 dB(A) (WHO, 2007). In addition, reported sleep quality is likely to be affected at noise levels above 40 dB(A) (RIVM, 2004; Ising et al., 2004; WHO, 2007). Night-time awakenings also start at levels above 40 dB(A) (WHO, 2007). However, sleep disturbance is influenced by other noise characteristics, too. People are far more sensitive to intermittent noise than con-tinuous noise (Prasher, 2003). For example, an accelerating car will disturb a person’s sleep more than a continuous traffic flow. In addition, the alarm function of the sense of hearing may lead to awakening if the noise contains information perceived to be of relevance, even if the noise level is low. This means that un-familiar noises are far more likely to disturb sleep than familiar, regular patterns of noise. Finally, personal characteristics like noise sensitivity influence the relation between night-time noise and sleep disturbances (Ouis, 2001). People are good at adapting to nocturnal noise. However, there is never com-plete habituation, particularly with respect to heart-rate acceleration (Stansfeld & Matheson, 2003; WHO, 2007).
2.3.3 Impaired cognitive functioning
Exposure to traffic noise can impair an adult’s cognitive functioning (information processing, understanding and learning) (Stansfeld & Matheson, 2003). To have this effect, though, noise levels must be high, or the task complex or cognitively demanding (Prasher, 2003). Repetitive and simple tasks are unaffected by (traf-fic) noise. The influence of noise on cognitive functioning depends on a person’s perceived control of the noise and its predictability. In the literature there is a prominent focus on the influence of traffic noise on the cognitive functioning of children. Although most of the studies are concerned with the impact of aircraft noise in this respect, some of them consider road and rail traffic noise, too. According to Bistrup et al. (2001), the adverse effects of road traffic noise exceed those of rail traffic noise.

4.451.1/Traffic noise reduction in Europe August 2007 10
In general, the following effects have been found for children exposed to high levels of traffic noise (Bistrup et al., 2001; Clark et al., 2005; RIVM, 2005): • Difficulty sustaining attention. • Difficulty concentrating. • Poorer discrimination between sounds and poorer perception of speech. • Difficulty remembering, especially complex issues. • Poorer reading ability and school performance. A hypothesis frequently stated to explain the impact of chronic exposure to noise on the cognitive development of children is that noise affects the intelligibility of speech communication (Bistrup et al., 2001; RIVM, 2005). Ambient noise leads to a loss in the content of a teacher’s instruction, and consequently children may have problems with speech perception and language acquisition. This, in turn, can lead to impairment of children’s reading skills and vocabulary, and eventually to difficulties with other, higher-level processes, such as long-term memory for complex issues. Closely related to this process is the so-called ‘tuning out’ re-sponse: to adapt to noise interferences during activities, children filter out the unwanted noise stimuli (RIVM, 2005). However, researchers suggest that chil-dren generalise this strategy to other situations where noise is not present, with adverse effects on their understanding and learning performance. Although there has been little research into the impact of noise reduction in this context, there is evidence that reduced noise levels can relieve cognitive prob-lems within about a year (London Health Commission, 2003).
2.3.4 Cardiovascular disease
Exposure to traffic noise is associated with changes in blood pressure and in-creased risk of various types of heart disease (e.g. ischemic heart diseases, an-gina pectoris, myocardial infraction). Noise-induced cardiovascular diseases are considered to be the consequence of stress (Babisch, 2006; Ising et al., 2004; Prasher, 2003; RIVM, 2004). Exposure to noise triggers the production of (stress) hormones like cortisol, noradrenaline and adrenaline. It does so both directly and indirectly, through disturbance of activities. These hormones may cause changes in the values of a number of biological risk factors, such as hypertension (high blood pressure), blood lipids (e.g. cholesterol) and blood glucose. These risk fac-tors can increase the risk of cardiovascular disease (Babisch, 2006; Ising et al., 2004). Persistent exposure to environmental noise could therefore result in per-manent changes to the vascular system, with elevated blood pressure and heart diseases as potential outcomes. The magnitude of these effects will be partly de-termined by individual characteristics, lifestyle behaviours and environmental conditions (Berglund et al., 1999). Sufficient evidence can be found in the literature for the relation between traffic noise and heart diseases like myocardial infarction and ischemic heart diseases (Babisch, 2006; Babisch et al., 2005; Ising et al., 2004; Prasher, 2003). Higher risks of heart disease are found for those living in streets with average noise lev-els above 65-70 dB(A). For these people the risk of heart disease is approxi-mately 20% higher than for those living in quieter areas (Babisch, 2006). This risk

4.451.1/Traffic noise reduction in Europe August 2007
11
increases with noise level. Again, the risk is also influenced by personal charac-teristics. For example, Babisch et al. (2005) found that only men are at higher risk of heart attack due to traffic noise. This risk is also dependent on the number of years of exposure to the traffic noise, moreover. The longer people are exposed to a high level of traffic noise, the greater the likelihood of it having an impact and increasing the risk of a heart attack. There is a growing body of evidence for a higher risk of hypertension in people exposed to high levels of traffic noise (Babisch, 2006). For example, a recent study by Bluhm et al. (2006) suggests the existence of a relation between resi-dential exposure to road traffic noise and hypertension. However, earlier studies (e.g. Babisch, 1998; RIVM, 2005) show less evidence for this relationship, and according to Babisch (2006) these studies cannot be neglected in the overall judgement process. Hence more research into the relation between traffic noise and hypertension is needed. There has been hardly any research into the impact of night-time noise exposure on cardiovascular health outcomes (Babisch, 2006). One exception is UBA (2003), who showed that night-time noise exposure was more strongly associ-ated with medical treatment for hypertension than day-time noise exposure. In contrast to the subjective perception of noise, which adapts within a few days through habituation (see paragraph 2.3.1), none of the cardiovascular diseases show habituation to noise after prolonged exposure (WHO, 2007).
2.3.5 Mental illness
A small number of studies have presented limited evidence for a link between traffic noise and mental illness (Prasher, 2003; Stansfeld & Matheson, 2003; WHO, 2007). The clear association between noise and annoyance does not nec-essarily translate into a more serious relationship with mental health (London Health Commission, 2003). However, noise may well accelerate and intensify the development of latent mental disorder. Even so, people already suffering mental problems are likely to be more sensitive to being annoyed or disturbed by traffic noise than the general population.
2.4 Traffic noise especially harmful to vulnerable groups
The health effects of road and rail traffic noise are not distributed uniformly across society, with vulnerable groups like children, the elderly and the sick af-fected most. In addition, poorer people are more likely to suffer the health effects of transport noise than the better off. This might be explained by lower quality housing with poor noise insulation and the proximity of housing for lower income groups to noisy transport infrastructure. Children are likely to be a group that is particularly vulnerable to the health ef-fects of noise. They have less cognitive capacity to understand and anticipate it and lack well-developed coping strategies (Stansfeld & Matheson, 2003). As

4.451.1/Traffic noise reduction in Europe August 2007 12
children are still developing both physically and cognitively, moreover, in this group there is a potential risk of chronic noise having irreversible negative con-sequences. The impact of traffic noise on children’s cognitive development has already been briefly discussed. Noise may also possibly affect foetal develop-ment, by way of (stress) effects on expectant mothers (EPA, 1978). However, a more recent study questions this impact on foetal development, although such effects are not completely ruled out (Bistrup et al., 2001). Additionally, children do not appear to be at particular risk with respect to cardiovascular disease, espe-cially through high blood pressure (Babisch, 2006). At the same time, though, traffic noise exposure from an early age may have cumulative health effects in later life, which once more include cardiovascular disease. This also holds for the negative effects of sleep disturbance. In the short term, however, children are less severely affected by sleep disturbance than adults (RIVM, 2004), as evi-denced by fewer awakenings and changes between sleep stages. With respect to annoyance due to traffic noise, finally, children do not differ from adults. The elderly and the sick are two other groups that may be especially vulnerable to the effects of traffic noise. There has not been much research into this area, however. One of the rare findings is that both the elderly and those already ill are more affected by sleep disturbance - especially awakenings - than the general population (HCN, 2004; Ouis, 2001). Also, those already suffering from sleep dis-turbance are more severely affected by traffic noise. With regard to cardiovascu-lar disease, Babisch (2006) shows that people with prevalent chronic diseases have a slightly higher probability of contracting certain heart diseases as a result of traffic noise than those without. For the elderly, there is no consistent evidence that the effect of traffic noise on cardiovascular diseases is greater than for younger people. Finally, traffic noise may aggravate the psychological problems of people with existing health problems (London Health Commission, 2003). The price of houses exposed to high levels of traffic noise will be lower than that of similar houses in quieter areas (Soguel, 1994; Theebe, 2004). Those living on lower household incomes are therefore more likely to be exposed to traffic noise than those with higher incomes, and will hence have more noise-related health problems. For the Dutch region ‘Rijnmond’ this relationship between household income and exposure to noise was confirmed by RIVM (2004).
2.5 Over 210 million in EU25 exposed to harmful traffic noise
In the year 2000 about 44% of the population of the EU253 (over 210 million peo-ple) were exposed to road traffic noise levels above 55 dB(A). This is the WHO guideline value for outdoor noise levels and the threshold for ‘serious annoy-ance’. More than 54 million people were exposed to road traffic noise levels over 65 dB(A), which is ten times louder than the WHO guideline value. Rail traffic noise is a burden to fewer people. Nonetheless, 35 million people in the EU25 (about 7%) were exposed to rail traffic noise above 55 dB in 2000, with 7 million of them exposed to noise over 65 dB from this source. 3 EU27 except Cyprus and Malta.

4.451.1/Traffic noise reduction in Europe August 2007
13
In most European countries the number of people exposed to noise levels below 55 dB are not reported on. As already discussed, though, noise below 55 dB may still trigger adverse effects like annoyance, sleep disturbance and reduced cogni-tive ability. The actual number of people exposed to levels of traffic noise that are potentially dangerous to their health will thus be higher than the figures presented in Figure 3. The data in this figure are for the year 2000. Given traffic growth and the fact that legislation and standards have hardly changed in the meantime, these exposure figures probably underestimate the true extent of the problem.
Figure 3 Number of people exposed to road and rail traffic noise in 25 EU countries in 2000
0
40
80
120
160
200
55-65 dB 65-70 dB > 70 dB
mill
ions
of p
eopl
e ex
pose
d
road
rail
Note: This figure covers the EU27 except Cyprus and Malta. Source: INFRAS/IWW (2004), OECD/INFRAS/Herry (2002), calculations by CE Delft (for
Estionia, Latvia, Lithuania). These figures for the number of people exposed to traffic noise are based mainly on data from INFRAS/IWW (2004) (West European countries) and OECD/INFRAS/Herry (2002) (East European countries). Link (2000) also pre-sents estimates for the number of people exposed to traffic noise in certain West European countries. Although in some cases the results for individual countries (including the Netherlands) differ considerably between the first and last of these studies, the aggregate numbers are comparable, with a difference of only about 3% between the two. Since INFRAS/IWW (2004) covers more countries and uses more up-to-date data, we chose to present these figures here. The reliability of these data sets is discussed in appendix A.
2.6 Health of millions of Europeans affected by traffic noise
Although not all people exposed to road or rail noise will experience health ef-fects (see also appendix A), a significant fraction will. Beyond investigations of the absolute number of people suffering from various health effects due to traffic noise, however, not much research has been undertaken in this area. In this sec-

4.451.1/Traffic noise reduction in Europe August 2007 14
tion, therefore, we cannot do much more than provide an estimate of the number of people affected by cardiovascular disease. In addition, figures on the number of people experiencing annoyance at traffic noise in Europe are presented. Fi-nally, the health impact of traffic noise is compared to the health impact of two other social problems: air pollution and traffic accidents. Fatal heart attack and ischemic heart diseases The annual count of people suffering a (fatal) heart attack due to traffic noise is known for three countries only (see Table 2). For two of these, Denmark and Germany, the annual count for ischemic heart diseases (IHD) is also known.
Table 2 Number of people affected by heart diseases and the probability of heart diseases due to traffic noise in three European countries
Country Annual count of people suffering a lethal heart attack
Annual count of people affected by
IHD
Probability of a lethal heart attack
for people exposed to > 60 dB
Probability of IHD for people exposed
to > 60 dB
Denmark 200 - 500 800 - 2200 0.00026 - 0.00065 0.001 - 0.003 Germany 4,289 27,366 0.00017 0.001 Netherlands 300 - 1000 - 0.00016 - 0.00053 - Sources: Babish, 2006; Danish, 2003; RIVM, 2005; probabilities calculated by CE Delft. Based on these figures and the number of people exposed to noise levels above 60 dB(A) in the relevant countries, we estimated the probability of a fatal heart attack or ischemic heart disease and used these probabilities to estimate the number of people likely to be affected by these diseases in the EU25 annually. To this end, for each country we multiplied the number of people exposed to noise levels over 60 dB(A) by the respective probabilities of the heart diseases. The aggregate results of this estimation procedure are shown in Figure 4.

4.451.1/Traffic noise reduction in Europe August 2007
15
Figure 4 Indication of number of people affected by an ischemic heart disease or suffering a lethal heart attack due to traffic noise in the EU25 (2000)
0
50100150200
250300350400
road rail# of
peo
ple
affe
cted
per
yea
r (x
10
00)
lethal heart attack ischemic heart disease
Note: This figure covers the EU27 except Cyprus and Malta. To estimate the number of people affected by heart diseases the average of the probabili-ties from Table 2 were used, with the upper and lower bounds of the band width estimated using the highest and lowest probability, respectively.
We can conclude that over 245,000 people in the EU25 are affected by an ischemic heart disease due to traffic noise annually, of whom 94% (approx. 231,000) due to road traffic noise. About 20% (almost 50,000) of these people suffer fatal heart attacks. Road and rail traffic noise are thus responsible for around 50,000 premature deaths per year in Europe. Annoyance To estimate the number of people experiencing annoyance at traffic noise, we used exposure-response relationships. Miedema & Oudshoorn (2001) have esti-mated the percentage of people annoyed as a function of both road and rail traf-fic. Their exposure-response functions have already been presented in para-graph 2.3.1. These researchers derived exposure-response functions for both severe annoyance and annoyance and these curves have been recommended for use in EU legislation on noise (EC, 2001). Figure 5 shows the number of peo-ple experiencing (severe) annoyance at road and rail traffic noise in the EU25.

4.451.1/Traffic noise reduction in Europe August 2007 16
Figure 5 Number of people affected by (severe) annoyance due to road and rail traffic noise in the EU25 in 2000
0
10
20
30
40
50
60
70
road rail
mill
ions
of p
eopl
e af
fect
ed
severe annoyance annoyance
Note: This figure covers the EU27 except Cyprus and Malta. To estimate the number of people affected by (severe) annoyance, the exposure data
from paragraph 2.5 were used. These exposure data are related to LAeq noise levels, while
the exposure-response functions of Miedema & Oudshoorn are defined for Lden noise lev-els. For this reason the exposure data were translated using a rule of thumb: noise levels expressed in Lden are approximately 2 dB(A) lower than those expressed in LAeq. To ex-press the uncertainty in the estimates a band width for the results is shown. The upper and lower bound of this band width were estimated by varying the exposure figures by 2 dB(A).
Around 57 million people in the EU25 are annoyed by road traffic noise, 42% of whom (approximately 24 million) are severely annoyed. This means that about 12% of the European population suffers annoyance due to road traffic noise. Rail traffic noise causes annoyance to about 5.5 million Europeans (about 1% of the total European population), of whom about 2 million are severely annoyed. Comparison with health impact of other environmental problems Disability-adjusted life years (DALY) is a measure used to quantify the overall ‘burden of disease’ on a population. It does so by combining the impact of prema-ture death (mortality; life years lost) and disability (morbidity; life years lived with disability or disease) into a single, comparable measure. DALYs represent the total number of years of life lost due to premature death and of years lived with a reduced level of health, weighted by the seriousness of the health impairment suffered (SAEFL, 2003). Below, we use DALYs to summarise the health impact of an external environmental influence, traffic noise. By using this concept it is possible to compare the total impact of several health effects of traffic noise and, moreover, to compare the magnitude of these effects with that of other problems affecting society, such as air pollution and traffic accidents. The WHO is currently working on an estimate of DALYs for traffic noise for Europe. To date, however, there is only country for which such an estimate is publicly available: the Netherlands. For this country, RIVM (2005) present DALYs for several environmental vectors of disease: see Figure 6. The DALYs for traffic
4.451.1/Traffic noise reduction in Europe August 2007
17
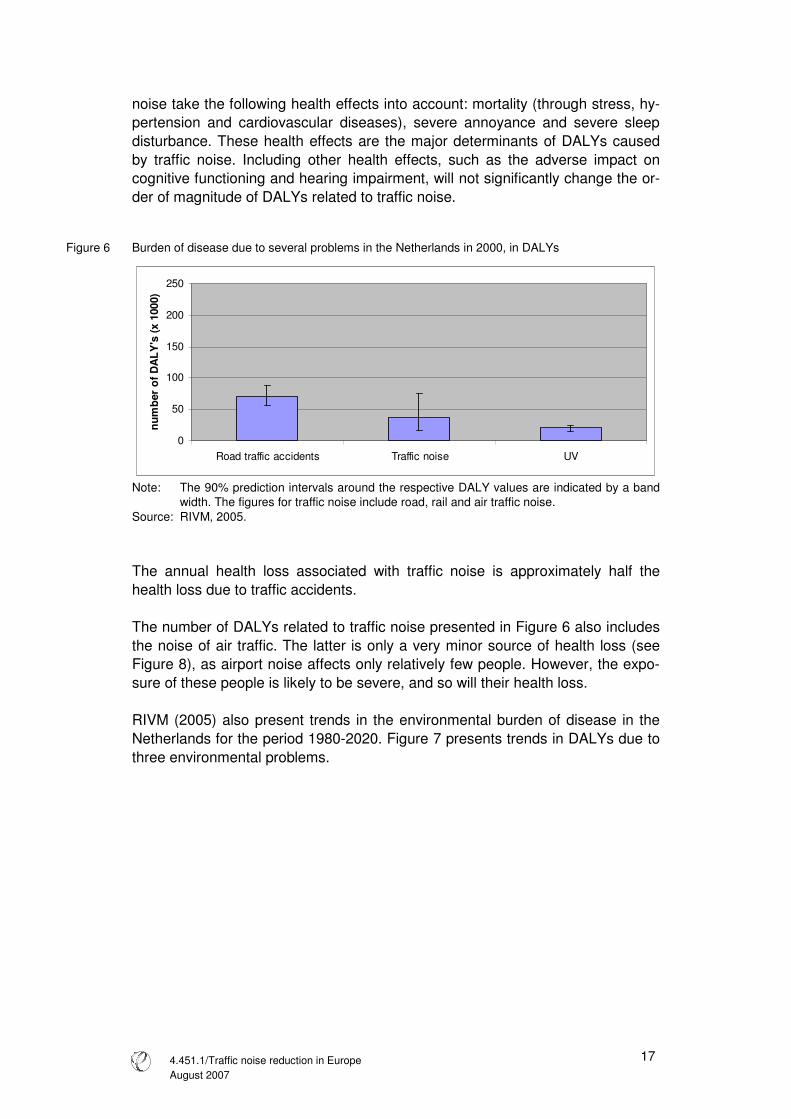
noise take the following health effects into account: mortality (through stress, hy-pertension and cardiovascular diseases), severe annoyance and severe sleep disturbance. These health effects are the major determinants of DALYs caused by traffic noise. Including other health effects, such as the adverse impact on cognitive functioning and hearing impairment, will not significantly change the or-der of magnitude of DALYs related to traffic noise.
Figure 6 Burden of disease due to several problems in the Netherlands in 2000, in DALYs
0
50
100
150
200
250
Road traffic accidents Traffic noise UV
num
ber
of D
ALY
's (x
100
0)
Note: The 90% prediction intervals around the respective DALY values are indicated by a band
width. The figures for traffic noise include road, rail and air traffic noise. Source: RIVM, 2005. The annual health loss associated with traffic noise is approximately half the health loss due to traffic accidents. The number of DALYs related to traffic noise presented in Figure 6 also includes the noise of air traffic. The latter is only a very minor source of health loss (see Figure 8), as airport noise affects only relatively few people. However, the expo-sure of these people is likely to be severe, and so will their health loss. RIVM (2005) also present trends in the environmental burden of disease in the Netherlands for the period 1980-2020. Figure 7 presents trends in DALYs due to three environmental problems.

4.451.1/Traffic noise reduction in Europe August 2007 18
Figure 7 Trends in DALYs per million people in the Netherlands for the period 1980-2020
Source: RIVM, 2005. In contrast to problems like traffic accidents, the number of DALYs due to traffic noise rose between 1980 and 2000. With policy as it stands today, this disease burden will continue to grow in the coming years, while that of traffic accidents will continue to fall. RIVM (2005) also report on the potential decrease in disease burden if noise levels are reduced by around 5 dB(A) for every source by 2020. Such a reduction could almost halve the number of annoyance and sleep distur-bance-related DALYs (see Figure 8).
Figure 8 DALYs per million caused by severe annoyance and severe sleep disturbance due to raod, train and air traffic noise, for 1980, 2000 and 2020, including an alternative scenario for 2020 (with 5 dB(A) noise exposure reduction for road and rail traffic)
Source: RIVM (2005). In Chapter 4 we demonstrate that a 3-4 dB(A) reduction of road and railway noise is easily feasible in the short term using currently available technologies.

4.451.1/Traffic noise reduction in Europe August 2007
19
2.7 Effects on animals and ecosystems
It is not only humans but also animals that are affected by traffic noise. When ex-posed to man-made noise they may suffer both physiological and behavioural effects (Kaseloo and Tyson, 2004). With regard to the former, an animal’s re-sponse may range from mild annoyance to panic and escape behaviour. These responses are manifestations of stress, which may harm an animal’s health, growth and reproductive fitness. For example, energy losses due to escape and panic responses could result in impaired growth and health. For some animals, traffic noise also interferes with communication (Kaseloo, 2005). Bats, for exam-ple, a species group totally reliant on echo location, are unable to find food if noise levels are too high. In terms of behaviour, animals may avoid places with high levels of traffic noise. In the case of birds it has been found that sound levels above 40 - 45 dB(A) in-fluence species distribution; as the noise level at a given spot increases, fewer birds will visit the spot (Kaseloo, 2005; RIVM, 2002). For animals like the moun-tain goat and white-tailed deer, too, evidence has been found for the avoidance of noisy areas around busy roads (Kaseloo & Tyson, 2004). The effects of traffic noise on animals vary markedly among as well as within species, owing to a variety of factors (such as age, sex, prior exposure, etc.). It is therefore hard to draw any general conclusions about the effects of traffic noise on animals. Further research on this topic is certainly needed. Nevertheless, from the evidence presented here it is reasonable to say that traffic noise interferes with animals’ feeding, hunting and breeding behaviour and performance.

4.451.1/Traffic noise reduction in Europe August 2007 20

4.451.1/Traffic noise reduction in Europe August 2007
21
3 The social costs of traffic noise
3.1 Valuing the health effects of traffic noise
The loss of well-being due to exposure to traffic noise can be expressed in mone-tary terms. The amount of money people are willing to pay to avoid traffic noise provides a good estimate of the loss of well-being people experience. In some instances the market will provide reliable estimates of people’s willingness to pay (WTP). For example, the price of sleeping pills provides an estimate of the WTP to fall asleep and avoid night-time awakenings. For many of the health effects of noise, however, there are no such market prices. To estimate the WTP to avoid these effects various methods are avail-able. Generally speaking, there are two relevant valuation methods: hedonic pric-ing and contingent valuation. The hedonic pricing method examines variations in housing prices due to traffic noise. These differences can be seen as the WTP to avoid the adverse effects (especially annoyance) of noise. The contingent valua-tion method, on the other hand, involves asking people directly in a survey how much they would be willing to pay to avoid certain health effects associated with noise. Both methods are used for placing a value on the effects of traffic noise. To value mortality due to traffic noise means assigning a monetary value to a human life. In the field of environmental valuation this has always been a contro-versial topic, for the WTP to avoid the loss of one’s life is infinite, is it not? None-theless, in their everyday lives people make plenty of choices that influence their risk of mortality. For example, we may choose to drive a motorcycle despite being aware that this involves a greater risk of lethal accident than driving a car. With the aid of this kind of information on risk behaviour a value can be determined for a statistical human life. Additional information on attributing a monetary value to traffic noise is provided in appendix B.
3.2 Social cost of traffic noise in EU22 over � 40 billion a year
The social cost of road traffic noise in the EU224 is estimated to be at least �38
(30 - 46) billion per year, which is approximately 0.4% of total GDP in the EU22. For rail, estimates of social costs due to noise are about � 2.4 (2.3 - 2.5) billion per year (about 0.02% of total EU22 GDP). It should be noted that this takes into account only effects related to noise levels above 55 dB(A), while people may also be adversely affected by noise below this level. Hence, the social cost esti-mates presented here probably underestimate the actual costs. The social costs of road traffic noise in the EU22 are almost one-third of those associated with road traffic accidents; see Figure 9. In the case of rail traffic,
4 EU27 except Cyprus, Estonia, Latvia, Lithuania and Malta.

4.451.1/Traffic noise reduction in Europe August 2007 22
though, the social costs of noise are approximately seven times those of acci-dents.
Figure 9 Social costs of traffic noise in the EU22 compared to those of traffic accidents (2006 price level)
Road Rail
0
50
100
150
200
250
noise traffic accidents
billi
on e
uro
0
1
2
3
noise traffic accidents
billi
on e
uro
Note : This figure covers the EU27 except Cyprus, Estonia, Latvia, Lithuania and Malta and
hence covers 98.4% of the EU27’s population. Sources: INFRAS/IWW (2004), OECD/INFRAS/Herry (2002), Link (2000). These social cost estimates are based on valuation studies by INFRAS/IWW (2004), OECD/INFRAS/Herry (2002) and Link (2000). INFRAS/IWW and Link provide cost estimates for West European countries, while cost estimates for East European countries are provided by OECD/INFRAS/Herry. INFRAS/IWW and Link cover partly the same countries, with the two studies presenting some-what different estimates for some of them. A brief explanation for these differ-ences is given in appendix B. As it is not clear which of the studies presents the most reliable estimates, in calculating total social noise costs in the EU22 the av-erage of the two has been used for the relevant countries. For these countries minimum and maximum estimates were also determined, which were used to es-timate band width. Note that the band width for the estimated social costs of traf-fic noise in the EU22 is based on minimum and maximum estimates for just 9 countries. For the other 13 countries, only a single estimate was available. Another way to estimate the social costs of traffic noise is by valuating the asso-ciated DALYs (see previous chapter). As mentioned, the WHO is currently work-ing on an estimate of DALYs due to traffic noise in Europe and certain prelimi-nary results of this study have already been presented in the EU’s Noise Steering Group5. These tentative results show that the total number of DALYs depends heavily on how the DALYs due to annoyance are calculated. Differences in measuring method yield estimates differing by a factor 2. If we value the WHO’s conservative estimate of DALYs (assumption: 1 DALY equals � 78,500 (VITO, 2003)), the social costs of traffic noise are found to be comparable to the figure obtained by using the results of INFRAS/IWW, OECD/INFRAS/Herry and Link. The social cost estimates presented above would therefore appear to be robust, but conservative.
5 See: http://circa.europa.eu/Public/irc/env/noisedir/library?l=/health_effects_noise/who&vm=detailed&sb=Title

4.451.1/Traffic noise reduction in Europe August 2007
23
3.3 Passenger cars and lorries responsible for bulk of costs
Passenger cars and lorries are responsible for 90% of the total social costs of road and rail traffic noise in Europe; see Figure 10. This is due above all to the large number of vehicles and kilometres driven on European roads.
Figure 10 Distribution of social costs due to traffic noise in the EU22 over transport modes (2006 price level)
0
4
8
12
16
20
24
Passengercar
Bus Motorcycle Lorry Passengertrain
Freighttrain
billi
on E
uro
Note : This figure covers the EU27 except Cyprus, Estonia, Latvia, Lithuania and Malta. Sources: INFRAS/IWW (2004), OECD/INFRAS/Herry (2002), Link (2000). This distribution of social costs over transport modes is again based on the valuation studies by INFRAS/IWW (2004), OECD/INFRAS/Herry (2002) and Link (2000). To derive average figures for the EU22 the same methodology was used as in section 3.2.
3.4 Benefits of noise reduction
Noise abatement policies will have major economic benefits. Less people will be annoyed by traffic noise and the incidence of health problems will decline. With their sleep less disturbed, people may also be more productive at work. The latter effect may be reinforced by improved cognitive performance, moreover. Accord-ing to Navrud (2002) the perceived benefit of noise reduction is � 25 per house-hold per decibel per year. This estimate is based on a thorough review of the lit-erature on this topic. The EU working group ‘Health and Socio-Economic As-pects’ (2003) also recommends using this figure to value noise reduction. Noise abatement policies will generate cost savings for government, too. Expen-ditures on the health system will be lower due to a decline in noise-related health problems. In addition, if noise is reduced at its source (i.e. on vehicles, road sur-faces and rail tracks), then local and national authorities can reduce the funds currently spent on building and maintaining noise barriers and insulation. The Dutch government’s Noise Innovation Programme (IPG) has calculated that for every decibel of noise reduction at-source �100 million in expenditures on end-of-

4.451.1/Traffic noise reduction in Europe August 2007 24
pipe measures such as noise barriers and insulation will be saved (IPG, 2007). This calculation only takes major interurban roads and railways into account. Ac-tual savings will probably be even greater, because other regions and urban ar-eas will also benefit from such noise reduction via at-source measures. From a social perspective there is also a preference for at-source over end-of-pipe meas-ures, the latter being considerably less cost-effective (see Chapter 4).

4.451.1/Traffic noise reduction in Europe August 2007
25
4 Noise reduction options
In this chapter we set out the noise policy developments of the last decades and the measures available to reduce traffic noise. We first describe the difference between at-source measures and end-of-pipe (anti-propagation) measures and then present an in-depth analysis of the former.
4.1 At-source versus end-of pipe measures
There are essentially two routes to noise abatement. Firstly, noise emissions can be reduced at their source, through measures relating to vehicles/drivelines, tyres, road surfaces and traffic management. Secondly, noise can be abated by reducing the exposure of people by means of anti-propagation or insulation measures (by increasing the distance between source and recipient, for example, or hampering noise propagation by insulating buildings or constructing noise bar-riers). Figure 11 provides a schematic overview of the factors leading to adverse effects of noise and thus the basic routes available to achieve abatement.
Figure 11 Factors determining traffic noise emissions
Noiseemission
Noiseexposure
Effects onhumans
and faunaTechnical
characteristicsof vehicles
Technicalcharacteristics
of (rail)road
Trafficspeed
Trafficvolume
Anti-propogation
measures
Source: RIVM, 2003 adapted by CE Delft.
At-source measures that reduce overall emissions are preferable to noise expo-sure measures reducing imissions at the local level, like insulation of houses or construction of noise barriers (EC, 2004; KPMG, 2005).

4.451.1/Traffic noise reduction in Europe August 2007 26
At-source measures have the greatest potential Measures that tackle the basic sources of noise have vast potential to reduce ex-posure; see Figure 12. This figure provides a qualitative estimate based on the contribution to the potential reduction of annoyance by each of the contributing factors. Together, these measures could reduce annoyance due to road traffic by as much as 70%. To make this a reality, though, requires concerted efforts at all government levels: EU, national and local, with the EU the most important body when it comes to at-source measures. At noise hotspots (residential areas, out-side schools, hospitals, etc.) pan-European measures need to be complemented by specific local policies.
Figure 12 Reduction potential using current noise reduction technologies (expert judgement)
Source: EC, 2005. As can be seen, the greatest reduction potential comes from technical measures to reduce noise emissions from vehicles, tyres and road surfaces. The abatement impact of these various measures is presented in more detail in Table 3.
Table 3 Potential at source noise reduction measures, in dB(A)
Vehicle Speed reduction Road surface Engine Tyre Thin/dense Porous 5 year perspective 1-2 1-2 1-3 1-3 2-4 10-15 year perspec-tive
2-4 2-4 - 3-5 6-8
Effect of measure international international local local local Who pays? Industry/polluter Industry/polluter Industry/polluter Road owner/society Road owner/society
Source: TOI, 2005. At-source measures most cost effective Measures to reduce noise at-source are generally more cost-effective than those designed to hamper its propagation (Ohm, 2006; DRI, 2005). Measures relating to tyres and vehicle propulsion can achieve noise reductions at relatively low cost, because state-of the art engines and tyres are already performing signifi-

4.451.1/Traffic noise reduction in Europe August 2007
27
cantly better than current limits. Tightening of the limits will therefore cause very little additional cost to the automotive industry (KPMG, 2005). The Danish national traffic noise strategy shows that measures aimed at reduc-ing noise propagation (including noise barriers) are amongst the least cost–effective solutions for 2020 (Danish, 2003). If these are applied on a large scale in the absence of at-source measures, the costs will even outstrip the benefits. One Danish case study clearly illustrates that porous asphalt is far more cost-effective than anti-propagation measures like home insulation or noise barrier construction, which are 3-10 times more expensive (DRI, 2005). The Dutch Noise Innovation Programme (IPG) has calculated that every decibel of noise reduction at-source will save � 100 million in national expenditure on noise barriers and building insulation. In general, the benefits of at-source noise abatement measures dramatically ex-ceed their costs. This means that from a welfare point of view it is clearly advan-tageous to implement noise measures at-source. RIVM (2003) estimates that the benefits of noise reduction by way of quieter tyres, low-noise road pavements and wheel/rail optimisation are on average 2-4 times higher than their cost. Of these measures, the cost effectiveness of quieter tyres is greatest, as several studies report that tyre/road noise reduction comes at zero cost (Sandberg, 2006; RIVM, 2003). A study by FEHRL indicates that the cost effectiveness of a reduc-tion of tyre/road noise is significantly better than the figure reported above. FEHRL estimates the benefits at � 48-123 billion, while the costs are only � 1.2 billion. The main cost item for industry would be discontinuation of production of the noisiest tyres. Research costs would be very limited, as quieter tyres have already been developed and are already on sale on the European market (FEHRL, 2006). Another argument in favour of at-source measures is that the costs of noise re-duction are borne directly by the car driver, with any research and development costs being incorporated into prices. Furthermore, at-source measures - espe-cially those at vehicle level - are in line with the polluter pays principle and Article 174 of the EC Treaty, which states action at-source to be a priority principle. One disadvantage of at-source measures at the vehicle level, however, is that penetration of the vehicle fleet takes several years for tyres and almost a decade for motor vehicles. Local measures like speed reduction and low-noise road sur-faces are therefore also needed. Given the very long life spans of railway rolling stock, this is even truer of railway noise reduction measures. The optimal strategy will need to comprise a mix of local and at-source measures, including noise bar-riers at hotspots.

4.451.1/Traffic noise reduction in Europe August 2007 28
4.2 Transport noise regulation: the legal framework
Road vehicle noise is covered by two European directives. Motor vehicle noise emission has been covered by legislation since the 1970s (Directive 70/157) and tyre-road noise since 2001 (Directive 2001/43). The EU Driveline noise directive follows Regulation No. 51 of the United Nations Economic Commission for Europe (UNECE), which harmonises measurements of road vehicle sound emissions. Regulation 51 is defined at the international level by the UNECE world forum for harmonisation of vehicle regulations. Railway noise is addressed through directives on railway interoperability for high-speed rail (Directive 96/48/EC) and conventional rail (Directive 2001/16/EC), which provide a legislative framework for technical and operational harmonisation of the rail network. Under this legislation, Technical Specifications for Interopera-bility (TSIs) are established by the Commission, which include noise limits for roll-ing stock. Despite these efforts, the noise exposure of citizens has not diminished since the 1970s. In part this is due to ineffective legislation as well as increased traffic vol-umes. Additionally, though, it was deemed necessary to focus noise policy on actual noise reception. The 1996 Green Paper marked the start of this alternative approach, leading to the Environmental Noise Directive (END) of 2002 (Directive 2002/49) as a second cornerstone of noise policy. Its main objectives are: • To monitor environmental noise. • To address local issues. • To inform the public about noise issues. • To oblige local authorities to draw up noise maps and action plans for reduc-
ing noise exposure in and around major cities, roads, railway lines and air-ports (see Table 4).
At the same time, however, responsibility for setting noise exposure limits re-mains the competence of national authorities. Formally speaking, the action plans do not need to be attuned to these national exposure limits.
Table 4 Timetable for creation of noise maps and action plans
Area / Source to be mapped Strategic noise maps by Action plans by Agglomerations > 250,000 inhabitants > 100,000 inhabitants
30 June 2007 30 June 2012
18 July 2008 18 July 2008
Major roads > 6,000,000 vehicles / year > 3,000,000 vehicles / year
30 June 2007 30 June 2012
18 July 2008 18 July 2008
Major railways > 60,000 train journeys / year > 30,000 train journeys / year
30 June 2007 30 June 2012
18 July 2008 18 July 2008
Major airports > 50,000 flights / year
30 June 2007
18 July 2008

4.451.1/Traffic noise reduction in Europe August 2007
29
Traffic noise is also one of the impacts to be documented during the environ-mental impact assessment (EIA) of transport infrastructure projects. Guidelines for weighting noise as an environmental impact during the decision-making proc-ess are set out in European directives 85/337/EEC and 97/11/EC. Under the framework of the CARS 21 initiative to boost the competitiveness of the EU car industry, the Commission has announced a ‘holistic’ view with regard to the tackling of noise issues. Thus, all relevant stakeholders and systems (e.g. traffic management, driver behaviour, vehicle and tyre technology, road surfaces) should be involved in tackling noise issues so as to achieve a cost-effective pack-age of reduction measures (EC, 2007). In the past, noise has always been seen as more of a trade issue relating to har-monisation of product standards than as an environmental health issue in the EU. This is still the case today, to judge by the influence of UNECE working groups, the handling of rail noise and the leading position of DG Enterprise and Industry in determining EU noise standards for vehicles.
4.3 Vehicle noise regulation failed
Despite noise type approval limits being in force since 1970, since then there has been no tangible reduction of noise emissions under real driving conditions for passenger cars and only a 2-4 dB(A) reduction for heavy duty vehicles (HDVs) (RIVM, 2003; Blokland, 2004). This is due to: • Weak, ineffective noise emission limits. • Driving conditions during product approval tests for vehicles and tyres that do
not reflect real traffic situations. • Test conditions being changed several times, which implied a tightening of
the limits for HDVs but a weakening for passenger cars by several dB(A) (M+P, 2000; see Figure 14).
• Tyres only being assessed separately since 2001, even though tyre/road con-tact is already the dominant source of noise from passenger cars at any speed over 30-50 km/h.
Although the exterior noise of vehicles has not diminished over the last decades, interior noise has been reduced, through improved insulation methods, in re-sponse to customer demand. Directive 70/157/EEC, which has been updated several times, prescribes a test method for vehicle driveline and tyre noise and lays down noise emission limits. The test method basically comprises a noise measurement under full torque dur-ing acceleration at low speed. The underlying reasoning is that if a vehicle passes this extreme test it will also be quiet under normal circumstances. How-ever, the test method has undergone several changes over the years, the most important of which has been changes in gear and hence engine speed (rpm), the most important determinant of driveline noise emissions.
4.451.1/Traffic noise reduction in Europe August 2007 30
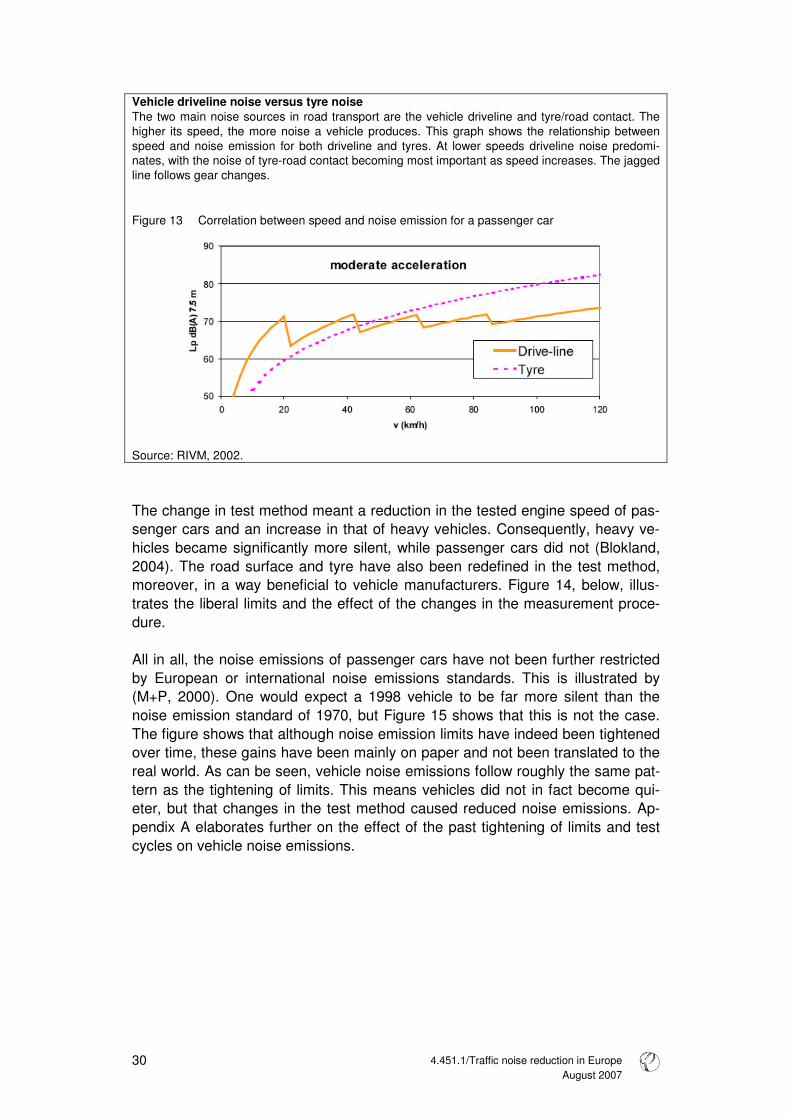
Vehicle driveline noise versus tyre noise The two main noise sources in road transport are the vehicle driveline and tyre/road contact. The higher its speed, the more noise a vehicle produces. This graph shows the relationship between speed and noise emission for both driveline and tyres. At lower speeds driveline noise predomi-nates, with the noise of tyre-road contact becoming most important as speed increases. The jagged line follows gear changes.
Figure 13 Correlation between speed and noise emission for a passenger car
Source: RIVM, 2002.
The change in test method meant a reduction in the tested engine speed of pas-senger cars and an increase in that of heavy vehicles. Consequently, heavy ve-hicles became significantly more silent, while passenger cars did not (Blokland, 2004). The road surface and tyre have also been redefined in the test method, moreover, in a way beneficial to vehicle manufacturers. Figure 14, below, illus-trates the liberal limits and the effect of the changes in the measurement proce-dure. All in all, the noise emissions of passenger cars have not been further restricted by European or international noise emissions standards. This is illustrated by (M+P, 2000). One would expect a 1998 vehicle to be far more silent than the noise emission standard of 1970, but Figure 15 shows that this is not the case. The figure shows that although noise emission limits have indeed been tightened over time, these gains have been mainly on paper and not been translated to the real world. As can be seen, vehicle noise emissions follow roughly the same pat-tern as the tightening of limits. This means vehicles did not in fact become qui-eter, but that changes in the test method caused reduced noise emissions. Ap-pendix A elaborates further on the effect of the past tightening of limits and test cycles on vehicle noise emissions.

4.451.1/Traffic noise reduction in Europe August 2007
31
Figure 14 Measured noise emissions of two passenger cars over the years as a function of the type approval
test
Source: M+P, 2000. Since 2000, lengthy discussions have been held within the UNECE working group on vehicle noise about the update of the test method and new limit values. There is a general consensus in the Working Party on Noise (GRB) that equiva-lent values must be identified between the new and old test procedures before any tightening of the limits can be discussed. A 2-year data collection period will start in June 2007. Updating the Directive will therefore take around 5 years from now before coming into force. Several experts consequently argue for a tighten-ing of the type approval limits while still retaining the current test cycle. As the new standards will apply only to new vehicles, it will be a decade before quieter cars start reducing noise exposure. With a 2-year measurement period after 2007 and around four years for new limit values to be negotiated and trans-posed in the UNECE and EU, it will be another two years before the new limit values come into force, so that quieter cars may not reach the market until about 2015. The average age of a car on the roads is around 6 years, and the overall noise abatement impact of new legislation will only have effect once quieter vehi-cles make up the bulk of the fleet. Tangible effects could therefore perhaps be expected on Europe’s roads around 2020. Recent drafts of the test procedure indicate that a more realistic driving pattern is to be adopted. It is extremely important, however, that the vehicle test remains a test of the power unit itself, where tyre/road noise is marginal. Scope for immediate improvement of at least 3 dB(A) The conclusions of a review of the technical potential for reduction of vehicle noise by TRL and RWTUV (TRL, 2003) can be summarised as follows:

4.451.1/Traffic noise reduction in Europe August 2007 32
• Engine: the variance of today’s production engines for cars is around 7 dB(A) over the whole range, with the upper half comprising engines that are still on the market but not state-of-the-art. This means there is a reduction potential of 3 dB(A) if all vehicles are equipped with these quieter, currently available engines.
• Gas flow noise: a further reduction of intake and exhaust noise can in general be achieved by using greater silencer volumes and double-walled silencers. The problem is to reserve the necessary storage capacity for the silencers and accommodate the increase in weight.
• Mechanical noise: For cars, the contribution of gearbox and drivetrain to overall noise emission is insignificant. For heavy duty vehicles the situation is different, especially since the requirements for robustness and durability are much higher than for passenger cars. Possible reduction measures are ad-vanced encapsulations and the de-coupling of the gearbox and engine (lower rpm).
A study by EC (2004) indicates that the limits for heavy duty vehicles could be lowered by 3-5 dB(A) in two steps within 10 years, based on a new measurement method. For passenger cars and light duty vehicles, the limits could be tightened by 3-6 dB(A) in two steps within the same timeframe. For passenger cars the following proposal has been presented by M+P consul-tancy (Blokland, 2004): • Decrease limit value from current 74 to 71 dB(A) (several cars are already
available with 67 dB(A)). • Remove the +1 dB(A) allowance for direct-injected diesel engines. Modern
diesel injection technology is not louder than petrol engines. • Remove the unnecessary allowance of +2 dB(A) for vans: these are mainly
‘stripped down’ passenger car models. In the case of passenger cars, acoustic design usually tends towards lower noise volumes, especially for luxury models. However, loud acoustic design is a spe-cific feature of a small minority of sports cars, which can thus nonetheless deter-mine the overall sound level of a road. The industry is not that keen to reduce noise limits, as it sets restrictions on producing cars with a ‘sporty’ sound.
4.4 Tyre noise limits too high to be effective
In 2001 Directive 2001/43/EC came into force, setting limit values for tyre/road noise. This Directive was potentially an important contribution to noise policy, be-cause above 30-50 km/h tyre/road noise becomes the most important source. Almost all the tyres that have been in service since the regulations were intro-duced are well below the current limits. The Directive is therefore essentially inef-fective and no more than symbolic (see Figure 15). Even the lowering by 1-2 dB(A) foreseen by the directive for 2007-2009 is ineffective (Sandberg, 2003). The most striking feature is that a 1dB(A) reduction and a round-down are ap-plied before the measured test values are compared with the limit values. This implies that a tyre measured at 77.9 dB(A) meets the limit value of 76 dB(A).

4.451.1/Traffic noise reduction in Europe August 2007
33
In August 2004 the Directive and emissions limits were scheduled for revision. Within the framework of the revision of the Road/tyre directive, the Commission has commissioned FEHRL to carry out a study to assess the potential for reduc-ing the limit values and the impacts of reductions on overall traffic noise, safety and economy. Based on the FEHRL study, the Commission will come up with a proposal for a Directive replacing and expanding on 2001/43/EC. This proposal will include standards for safety (wet grip, aquaplaning) and rolling resistance as well as noise. A consultation will be announced around May 2007, with a pro-posal due for the autumn. As part of the FEHRL study, a database of measurements on 300 tyres has been created. Fifty per cent of the tyres measured produced noise levels over 3dB(A) below the current limits. As a whole, the range is typically up to around 5 dB(A) below the current limit value, while best available technology is even 8dB(A) be-low that limit (FEHRL, 2006; EC, 2004).
Figure 15 Measurement data and proposed limit values for passenger car tyres
Source: FEHRL, 2006. Proposals for tightening the Road/tyre directive FEHRL and the German Federal Environment Agency (UBA) have both provided proposals for a tightening of the Road/tyre directive. Their limit values for pas-senger cars are depicted in Figure 15. The FEHRL study recommends reductions of 2.5-5.5 dB(A) for passenger car tyres and 5.5-6.5 dB(A) for commercial vehicle tyres. The German Federal Agency (UBA) has proposed reductions versus the current limit values of roughly the same order, but proposes dropping the differ-entiation on the basis of tyre width. Table 5 shows the proposed limit values.
4.451.1/Traffic noise reduction in Europe August 2007 34
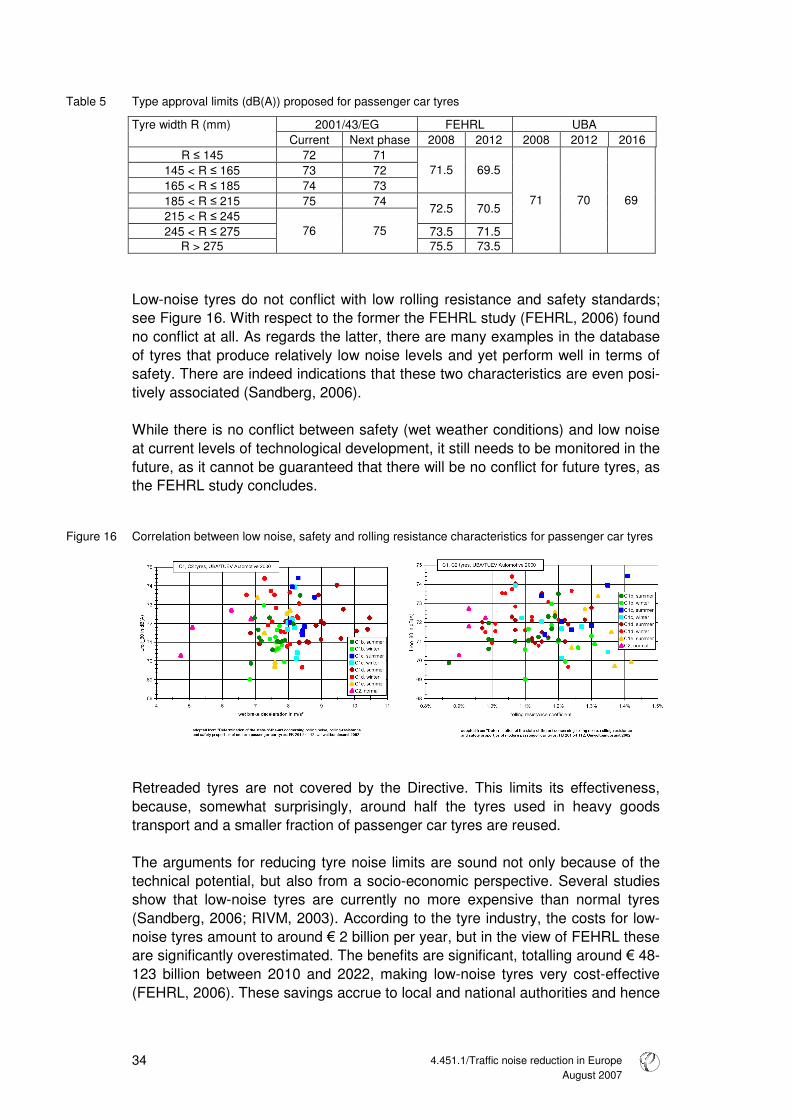
Table 5 Type approval limits (dB(A)) proposed for passenger car tyres
2001/43/EG FEHRL UBA Tyre width R (mm) Current Next phase 2008 2012 2008 2012 2016
R � 145 72 71 145 < R � 165 73 72 165 < R � 185 74 73
71.5 69.5
185 < R � 215 75 74 215 < R � 245
72.5 70.5
245 < R � 275 73.5 71.5 R > 275
76 75 75.5 73.5
71 70 69
Low-noise tyres do not conflict with low rolling resistance and safety standards; see Figure 16. With respect to the former the FEHRL study (FEHRL, 2006) found no conflict at all. As regards the latter, there are many examples in the database of tyres that produce relatively low noise levels and yet perform well in terms of safety. There are indeed indications that these two characteristics are even posi-tively associated (Sandberg, 2006). While there is no conflict between safety (wet weather conditions) and low noise at current levels of technological development, it still needs to be monitored in the future, as it cannot be guaranteed that there will be no conflict for future tyres, as the FEHRL study concludes.
Figure 16 Correlation between low noise, safety and rolling resistance characteristics for passenger car tyres
Retreaded tyres are not covered by the Directive. This limits its effectiveness, because, somewhat surprisingly, around half the tyres used in heavy goods transport and a smaller fraction of passenger car tyres are reused. The arguments for reducing tyre noise limits are sound not only because of the technical potential, but also from a socio-economic perspective. Several studies show that low-noise tyres are currently no more expensive than normal tyres (Sandberg, 2006; RIVM, 2003). According to the tyre industry, the costs for low-noise tyres amount to around � 2 billion per year, but in the view of FEHRL these are significantly overestimated. The benefits are significant, totalling around � 48-123 billion between 2010 and 2022, making low-noise tyres very cost-effective (FEHRL, 2006). These savings accrue to local and national authorities and hence

4.451.1/Traffic noise reduction in Europe August 2007
35
taxpayers, via savings on anti-propagation methods. Other benefits are lower health care costs and improved well-being. Incentives for quieter tyres To speed up the development of low-noise tyres, financial incentives may need to be introduced. One means of doing so may be to levy a tax on tyres or introduce some other type of financial incentive proportional to the assigned noise level. Another option is a system based on introduction of a noise-differentiated annual vehicle tax. To increase the use of low-noise tyres, the type approval rating needs to be marked on the tyre sidewall. This is easy to realise and should be part of the revision of Directive 2001/43/EC (Sandberg, 2006b). Optimisation of tyres from a fuel-efficiency perspective is also presently under discussion. The revision of the Tyre/road noise directive will include limits pertain-ing to fuel efficiency, safety and noise. There is currently very little information available to consumers on these tyre performance characteristics. There are therefore also arguments for developing a consumer label for tyres that covers safety, climate and noise together6.
4.5 Low-noise road pavements
Low-noise road surfaces, such as thin-layer, double-layer, porous and poro-elastic pavements, offer considerable potential to cut road noise dramatically, and are very complementary to technical measures to reduce engine, exhaust and tyre noise from cars and trucks. Such surface measures have the advantage of bringing immediate benefits, particularly for use in noise hotspots. Tyre road noise explained Tyre/road noise is a complex addition of several mechanisms of noise generation and amplification, depending on the properties of both tyres and road surface: • Noise is generated partly by impacts and shocks on the tyre, caused by road surface irregulari-
ties or irregularities on the tyre tread. These shocks make the tyre vibrate and radiate noise. Vibrations of the tyre tread spread to the sidewalls, which then radiate the noise further.
• Aerodynamic noise sources include so-called air pumping, consisting of the noisy pushing away of air on the leading edge of the contact zone between tyre and road surface and the noisy sucking in of air along the rear edge. The resonances occurring in the tyre cavity and tread pattern canals can also be considered as aerodynamic noise sources.
• One ‘micro-movement’ effect is the stick/slip tread elements’ motion relative to the road sur-face, causing the tread elements to vibrate tangentially.
• An adhesion effect is the stick/snap effect of the sudden loosening of the tyre tread from the road surface, comparable to the sudden loosening of a suction cup.
• The horn effect is a noise amplification mechanism whereby noise generated near the edge of the tyre/road surface contact area becomes amplified due to the geometry created by tyre and road surface. This is the same phenomenon intended by the conical part of a trumpet or a megaphone.
Source: EC, 2006.
6 There are indications that this labelling needs to be different in different climatic zones. This would be a
complication.

4.451.1/Traffic noise reduction in Europe August 2007 36
The degrees of noise reduction achieved by low-noise pavements are shown in Table 6.
Table 6 Noise reductions due to low-noise road pavements in urban and rural areas
Pavement Urban Rural 50 km/h 70 km/h 110 km/h Two-layer asphalt 3 dB(A) 4 dB(A) 5 dB(A) Thin layer asphalt 1.5 dB(A) 2 dB(A) 2 dB(A)
Source: Ohm, 2006. Low-noise pavements are a cost-effective option to reduce traffic noise. KPMG (2005) indicates that low-noise asphalt can reduce investments in noise abate-ment measures by up to 80% compared to noise barriers. The cost reductions are greatest for intra-urban roads, because it is here particularly that low-noise pavements can reduce the need for expensive barriers. The European Commission is planning to mandate CEN7 to develop a European standard for low-noise asphalt. In certain Member States there are several acoustical classification systems for road surfaces, but there are no international standards on such classification nor are road surfaces checked for conformity. With such a CEN standard in place, the introduction of acoustical performance in public contracts for road surfacing might be facilitated, competition in tendering increased, and the use of lower-noise road surfaces fostered as well. Importantly, the SILVIA project found that there are no significant differences be-tween porous asphalts and dense asphalts with respect to either safety, rolling resistance or fuel consumption (Elvik, 2003).
4.6 Speed reduction and traffic management
The noise of a road can also be reduced by influencing the speed or flow of the traffic it carries. Limiting traffic speed reduces its noise, especially between 50 and 80km/h. As Table 7 below shows, speed limit enforcement in urban areas has a positive effect on transport noise. Traffic management often also has an effect on the number of vehicles. The table shows the noise reduction caused by a reduced traffic volume under assumption of no changes in either speed or per-centage of heavy vehicles. Although traffic management measures have relatively limited potential com-pared to the long-term potential of other measures, they involve only limited in-vestments and have a direct effect, because of their limited implementation time. However, the costs associated with travel time losses may be significant. Compliance with new speed limits is obviously important for achieving the de-sired effects, as illustrated in the example in the textbox.
7 CEN is the European Standardisation Committee.

4.451.1/Traffic noise reduction in Europe August 2007
37
Speed reduction positive for air quality and noise In the Netherlands, the speed limit on various motorway sections close to city dwellings was re-duced in 2006 because of local non-compliance with EU air quality regulations. Compliance with the new limit, 80 instead of 100 km/h, is enforced with speed cameras that calculate average speed. This has had a positive effect on air quality, but noise emission has also been reduced by up to 1.5 dB(A), depending on local circumstances. Another effect perceived by people living close to the road sections in question is the absence of noise peaks by individual cars passing at high speed during the night. Source: Dutch Ministry of Transport, 2006. Traffic management measures have a positive impact not only on noise reduction but also on air quality and road safety. Reductions in traffic can be achieved by promoting public transport, encouraging cycling and walking, parking manage-ment, HGV bans, route designation and road bypasses. Other examples of traffic management include measures that induce the traffic flow to become more flu-ent, through smart tuning of traffic lights, for example, to avoid stop-and-go traffic as far as possible. The effects of traffic management measures is shown in Table 7 and Table 8.
Table 7 Effects of speed limit changes on noise reduction
Speed reduction (10% heavy traffic) Traffic reduction From 110 to 100 km/h 0.7 dB(A) 10 % 0.5 dB(A) From 100 to 90 km/h 0.7 dB(A) 20 % 1.0 dB(A) From 90 to 80 km/h 1.3 dB(A) 30 % 1.6 dB(A) From 80 to 70 km/h 1.7 dB(A) 40 % 2.2 dB(A) From 70 to 60 km/h 1.8 dB(A) 50 % 3.0 dB(A) From 60 to 50 km/h 2.1 dB(A) 75 % 6.0 dB(A) From 50 to 40 km/h 1.4 dB(A) From 40 to 30 km/h 0 dB(A)
Source: DRI, 2004.
Table 8 Effects of traffic management measures on noise reduction
Traffic management measure Potential noise reduction (LAeq) Traffic calming / Environmentally adapted through-roads Up to 4 dB(A) 30 km/h zone Up to 2 dB(A) Roundabouts Up to 4 dB(A) Round-top/circle-top road humps Up to 2 dB(A) Speed limits combined with signs about noise disturbance 1 - 4 dB(A) Night time restrictions on heavy vehicles Up to 7 dB(A) at night time Rumble strips of thermoplastic Up to 4 dB(A) noise increase Rumble areas of paving stones Up to 3 dB(A) noise increase Flat-top humps Up to 6 dB(A) increase Narrow speed cushions Up to 1 dB(A) increase Rumble wave devices 0 dB(A) Source: Berndtsen, 2005.
4.7 Anti-propagation measures (noise barriers, insulation)
If the desired degree of noise reduction cannot be achieved by at-source meas-ures, noise barriers and insulation of dwellings may be helpful in reducing propa-gation of the noise. On average, noise barriers reduce noise levels by 3-6 dB(A), depending on their design and height. Roadside noise barriers are only accept-

4.451.1/Traffic noise reduction in Europe August 2007 38
able for motorways and other bypass roads where there is no need for pedestri-ans to cross. On busy urban streets, which are crossed by pedestrians along their entire length, noise barriers cannot be placed directly on the kerbside. It is only in non-urban areas that they can provide a solution, therefore. If no other measures can be adopted, or if other measures are inadequate, soundproof windows and insulated walls are the only possibility remaining for fur-ther protection against noise. To be effective, though, such windows must be kept closed, and many people have trouble adjusting to this restriction on their normal behaviour (opening windows, etc.), especially during the summer. The average cost of a noise barrier is around � 300 per m2, depending on its construction and the materials used (Witteveen+Bos, 2004). This is around � 2.4 million for a barrier 4 metres high and 1 kilometre along both sides of a road.
4.8 Rail transport noise
Noise is one of the most significant environmental impacts of rail traffic. Contrary to road traffic, where European emission standards have existed since the early 1970s, such emissions standards for trains only came into force at the beginning of the present century. Moreover, EU noise emission standards apply only to rail vehicles operating in more than one Member State. European legislation addresses railway noise at-source through directives on rail-way interoperability for high-speed rail (Council Directive 96/48/EC) and conven-tional rail (Directive 2001/16/EC), which provide a legislative framework for tech-nical and operational harmonisation of the rail network. Under this legislation, Technical Specifications for Interoperability (TSIs) are established by the Com-mission, which include noise limits. Within the operability framework, emission limits regarding the noise of high speed trains (2002) and conventional trains (2005) have been set. These limits apply to new or upgraded rolling stock. A re-duction of the limit values by 2-5 dB(A) is foreseen for 2016/18. Wheel and rail roughness the cause of noise Noise from trains is basically caused mainly by the wheels rolling over the rails. This problem obviously concerns the transport of both passengers and freight, but it is far more acute in the latter case. It is the roughness of rails and wheels that causes noise. Locally higher rail roughness, caused by intensive traffic and wear and tear of wheels, may cause a rise in noise emissions of up to 5 dB(A) (EC, 2003). One of the options to reduce such emissions is therefore regular pol-ishing of the rails. One important source of wheel and rail roughness is vehicles with tread-braked wheels. The brake pads can create a roughness on the wheel, which in turn roughens the rail over time. Replacing cast iron brake blocks by composite material blocks would therefore be beneficial for all the vehicles travel-ling on the same track. Reports by the International Union of Railways (UIC) as well as other studies have stated that a reduction of 8-10 dB(A) can be achieved if all tread-braked freight wagons are retrofitted with composite brakes.

4.451.1/Traffic noise reduction in Europe August 2007
39
There are two types of brake blocks that are made of composite materials rather than iron: K-blocks and LL-blocks. K-blocks are approved by the official authori-ties for international use and are most frequently applied at the moment. Al-though LL-blocks are more similar to conventional brake systems and cheaper to fit, they are not yet certified for international use, a procedure that may take about 2 years (from 2007). In the case of new vehicles, disc brakes can also be used. Most recent information shows that use of K-blocks saves maintenance costs, while LL-blocks can be applied cost-neutrally. LL-blocks are already applied in the US, South Africa and Portugal for cost reasons. The aforementioned Dutch IPG programme is running tests with both K- and LL-blocks, estimating the life cycle costs of each, amongst other things. Composite brake blocks most cost-effective Retrofitting all the 600,000 freight wagons in use in the EU would cost around � 2-3 billion (K-blocks) according to the UIC (UIC, 2006b), but these costs may be an upper estimate, as indicated above. It is undisputed, however, that retrofit-ting the freight wagon fleet with composite brake blocks is most cost-effective. It is concluded by the UIC, among others, that use of such braking blocks is far more cost-effective than merely installing noise barriers. The STAIRRS project (Oertli, 2003) concludes that a combination of composite braking blocks, opti-mised wheels, rail absorbers, acoustic grinding and noise barriers up to 2 m high is the most effective option. Higher noise barriers should only be used if other technologies fall short (Oertli, 2003; RIVM, 2003; UIC, 2006). Without due action, half of all freight wagons currently on the rails in the EU will still be in use in 2020 (Kunst, 2006; UIC, 2006b). The EU working group on health and socio-economic aspects has therefore advised phasing out existing rolling stock (EC, 2005). This phase-out can be achieved by introducing progres-sively stringent emission standards. Track charge differentiation is promising An important instrument for noise emission control is the rail access charge. This is the fee the operator pays the infrastructure manager for using the railway sys-tem. This charge could be differentiated on the basis of the noise emission of the rolling stock. To increase its effectiveness, it could be differentiated according to population density. Track charge differentiation would put market pressure on operators to use low-noise rolling stock and on vehicle manufacturers to invest in low-noise technology development. Subsidy programmes lack such incentives. The costs of low-noise rolling stock are borne by the rail sector rather than the taxpayer, furthermore, in line with the polluter pays principle.

4.451.1/Traffic noise reduction in Europe August 2007 40
Rail noise reduction in Switzerland Since January 2002 a noise reduction bonus is encouraging infrastructure users to employ low-noise rolling stock in Switzerland. To qualify for the bonus, advanced brake technology must be used (composite blocks, disc brakes or comparable). In practice the bonus is about 5-8 per cent of the total rail access charge. The noise reduction bonus is combined with a noise reduction pro-gramme including subsidies for retrofitting all Swiss rolling stock with composite brakes (K-type). Noise barriers have furthermore been constructed under a cost-benefit constraint. The whole pro-gramme is being funded from tax increases in the road sector. Source: UIC, 2006
In the subsidy programme outlined in the box, Swiss rolling stock benefited, while foreign operators could not claim the subsidies for retrofitting. They were conse-quently charged more for their use of Swiss track. The Swiss example shows that in the single market national subsidies pose the risk of discriminatory treatment of operators. Future rail noise reduction As wheels become smoother, track grinding and other measures also become more important. Quieter railways depend not only on rolling stock, but also on track quality. Track-related measures are cost-effective. One way to enforce grinding of major tracks would be to introduce tighter noise exposure limits at night time. For the mid and long term, rolling stock needs to be developed with noise reduction in mind.
4.9 Two-wheeled vehicle noise
Only in regions where motorcycles make up a significant fraction of the overall vehicle fleet are they are a major contributor to ambient noise levels. Although it is mainly in urban settings that this noise problem is noticed and reported, their annoyance potential is also high elsewhere because of the high percentage of illegal noise-increasing mufflers fitted and often aggressive driving behaviour. A Swedish noise annoyance study identified motorcycle noise as by far the most annoying form of vehicle-related noise. Consequently, measures to address the use of such mufflers need to be given the highest priority. In addition, all the other reduction measures cited for cars and heavy-duty vehicles, such as improvement of the type approval measurement method and lowering of noise limits, should be applied to motorcycles, too. Directive 97/24/EC lays down limit values for two-wheeled road vehicles. These European limits are not particularly stringent, nor is the noise test technically de-manding, as is demonstrated by the fact that some motorcycles pass it by a sub-stantial margin of 4-6 dB(A) margin below the limit value. The problem of owners tampering with their vehicle, particularly by replacing the original exhaust silencer by a less efficient one, seems to be equally serious all over Europe. Overall, the penetration of illegal exhausts in the fleet is 35% for motorcycles and 65% for mopeds.

4.451.1/Traffic noise reduction in Europe August 2007
41
The purpose of the type approval required for each category of vehicle is to en-sure that individual vehicles meet the safety and environment requirements es-tablished by society. It is therefore patently absurd that in the case of two-wheeled vehicles many if not most of those vehicles in reality acquire quite a dif-ferent, noisier performance profile, whether immediately or soon. Measures to prevent tampering should therefore be afforded the higher priority. Only after the problem of illegal noise emissions has been resolved is further tightening of noise emissions worthwhile. There is room enough for tightening of the limits, given the current margins under the limit value as well as the emission levels already being achieved in Japan. The EffNoise study (EC, 2004) indicates that reduced use of illegal exhaust si-lencers could reduce motorcycle noise emissions by 5-15 dB(A), while subse-quent stepwise tightening of limit values could reduce them by a further 3-6 dB(A) (EC, 2004).

4.451.1/Traffic noise reduction in Europe August 2007 42

4.451.1/Traffic noise reduction in Europe August 2007
43
5 Recommendations for action
Noise exposure is a widespread and serious health problem In the European Un-ion and noise abatement measures should therefore be afforded greater priority than at present in the EU policy process. To this end we make the following rec-ommendations: • To guarantee the European population a healthier living environment, noise
exposure standards should be set and enforced for several different environ-ments (outdoor living area, dwelling interiors, schools, etc.), as is the case with current EU air quality standards. In quantifying these standards, the guidelines drawn up by the WHO could serve as a starting point. These ex-posure standards could then serve as an appropriate basis for the action plans prescribed in the EU Environmental noise directive.
• There needs to be greater political focus on noise policy. Traffic noise should be viewed primarily as a public health issue, rather than merely a trading standards topic. The lead at both the European and the international level should therefore be taken by public health and environmental experts.
• The most cost-effective measures are those at the level of vehicles. It is therefore these measures that should be afforded priority at the EU level.
• The instruments employed in noise policy have the potential to reduce noise emissions significantly, but to do so the limits they rest on must be made con-siderably more stringent. To date, though, lobbying by industry seems to have been very successful, for the limits in force have been too liberal to have had any effect. Priority should not be given merely to harmonisation, but tighten-ing of the limits placed higher on the political agenda, to reduce the ever growing noise exposure of the EU population.
• There is already scope for tightening the noise limits for vehicle drivelines by at least 3-4 dB(A), as an initial step. After 2012 year-on-year improvement targets (x dB(A) every y years) should be introduced, outlined well in advance to give industry sufficient time to adapt.
• The current test cycle for road vehicles is sub-optimal in relation to real-world vehicle noise performance. Revision of the test cycle is a lengthy process, however, and the noise emission limits should therefore first be tightened based on the current cycle, with the cycle itself being revised in time for the next tightening of limits around 2012.
• The limits in the EU Tyre/road directive need to be tightened if new technol-ogy is to be promoted. The UBA/FEHRL proposals are a good starting point. To improve consumer information, all tyres should be labelled with their noise approval rating and rolling resistance. Retreaded tyres should be included in the directive, at least for heavy vehicles, since these account for a surpris-ingly high share of about 50% of the market.
• An international standard for noise road surface classification systems should be developed, laying down terms for including acoustic performance in public contracts for road surfacing.
• As an initial step to reduce the noise emissions of rail transport, the use of composite brakes on freight wagons should be promoted. The current track

4.451.1/Traffic noise reduction in Europe August 2007 44
charge is a promising instrument for differentiating on the basis of noise emission. The advantage of this measure over a subsidised retrofitting pro-gramme is that retrofitted wagons will be used most frequently. Combining track charge differentiation with a subsidy scheme may have adverse effects on international competition.
• Type approval procedures for LL-blocks should also be hastened, as these perform just as well as K-blocks and are regarded as more cost-effective. Since LL-blocks can applied cost-neutrally, no subsidies are necessary.

4.451.1/Traffic noise reduction in Europe August 2007
45
Literature
Babisch, 2006 W. Babish Transportation Noise and Cardiovascular Risk : Review and Synthesis of Epide-miological Studies, Dose Effect Curve and Risk Estimation Berlin : UBA, 2006 Babisch et al., 2005 W. Babisch, B. Beule, M. Schust, N. Kersten, H. Ising, Traffic noise and risk of myocardial infarction, In : Epidemiology, 16(1): 33-40, 2005 Babisch, 1998 W. Babisch Epidemiological studies of the cardiovascular effects of occupational noise – a critical appraisal In : Noise & Health, 1: 24-39, 1998 Berg, 2003 M. van den Berg, et al. Valuation of noise : position paper S.l. : Working group on Health and Socio-economic aspects, 2003 Berglund et al., 1999 B. Berglund, T. Lindvall, D.H. Schwela Guidelines for Community Noise London : WHO (World Health Organisation), 1999 Bistrup et al., 2001 M.L. Bistrup, S. Hygge, L. Keiding, W. Passchier-Vermeer Health effects of noise on children and perception of the risk of noise Copenhagen : National Institute of Public Health, 2001 Blokland, 2004 Gijsjan van Blokland Type-approval as instrument for controlling road traffic noise Aalsmeer/Vugt : M+P/Müller-BBM, 2004 Bluhm et al., 2006 G.L. Bluhm, N, Berglind, E. Nordling, M. Rosenlund Road traffic noise and hypertension In: Occupational and Environmental Medicine 2007;64:122-126

4.451.1/Traffic noise reduction in Europe August 2007 46
Ellebjerg Larsen et al., 2002 L. Ellebjerg Larsen, H. Bendtsen, B. Mikkelsen Traffic noise annoyance : A survey, in: Aarhus, Odense & Randers Lyngby : Danish Transport Review Institute, 2002 Berndtsen, 2005 Traffic Management and Noise Reducing Pavements : Recommendations on Additional Noise Reducing Measures Silvia project deliverable, 2005 http://www.trl.co.uk/silvia/Silvia/pdf/Main_Outputs/SILVIA-DTF-DRI-008-11-WP5-020205.pdf CE, 2004 J.P.L Vermeulen, B.H. Boon, H.P. van Essen, L.C.den Boer, J.M.W. Dings, F.R. Bruinsma, M.J. Koetse De prijs van een reis Delft ; Amsterdam : CE ; VU, 2004 Clark et al., 2005 C. Clark, R. Martinez, E. van Kempen, A. Tamuno, J. Head, W. Hugh, M. Davies, M.M. Haines, I, Lopez Barrio, M. Matheson, S.A. Stansfeld Exposure-Effect Relations between Aircraft and Road Traffic Noise Exposure at School and Reading Comprehension In : American Journal of Epidemiology 163(1), 27-37, 2005 Danish EPA, 2003 A. Ohm, M.P. Jensen Strategi for begrænsning af vejtrafikstøj : Delrapport 3. Virkemidler og sam-fundsøkonomiske beregninger (Strategy for limiting road traffic noise : Report 2. Means of abatement and socio-economic assessment (in Danish)) Copenhagen : Danish Environmental Protection Agency, 2003 DRI, 2005 Lars Ellebjerg Larsen Cost-benefit analysis on noise-reducing pavements Copenhagen : Danish Road Institute, 2005 DRI, 2004 Traffic management and noise reducing pavements : Recommendations on addi-tional noise reducing measures Danish Road Institute Copenhagen : Ministry of transport and energy, 2004 Dutch Ministry of Transport, 2006 Evaluatie 80 km zones (Evaluation of 80-km zones (in Dutch), letter from the Min-ister of Transport to the Dutch parliament, DGP/WV/u.06.02308, 2006. http://www.vananaarbeter.nl/Images/Evaluatie%2080%20km%20zone_tcm220-171282.pdf

4.451.1/Traffic noise reduction in Europe August 2007
47
EC, 2001 EU’s Future Noise Policy, WG2 � Dose/Effect Position Paper On Dose Response Relationships BetweenTransportation Noise And Annoyance : Revised Brussels : European Commissieon, 2001 EC, 2007 A Competitive Automotive Regulatory Framework for the 21st Century : Commis-sion's response to the CARS 21 High Level Group Final Report Impact Assess-ment, Communication from the Commission to the European Parliament and the CouncilCOM(2007) 22 final, 2007 Brussels : European Commission, 2007 EC, 2006 Noise classification of road pavements :Task 1: Technical background informa-tion, Draft report COWI Brussels : European Commission - DG Environment, 2006 EC, 2005 Position paper on the effectiveness of noise measures EU Working Group Health & Socio-Economic Aspects Brussels : European Commission, 2005 EC, 2004 EffNoise : Service contract relating to the effectiveness of noise mitigation meas-ures : final Report, Volume I LÄRMKONTOR GmbH (contractor) Brussels : European Commission - DG Environment, 2004 EC, 2003 Position Paper on the European strategies and priorities for railway noise abate-ment EU Working Group Railway Noise of the European Commission Brussels : European Commission, 2003 EC, 2002 S. Navrud The state-of-the-art on economic valuation of noise Brussels : European Commission, DG Environment, 2002 Elvik, 2003 R. Elvik, P. Greibe Safety Aspects Related to Low Noise Road Surfaces, Silvia project Silvia project deliverable, 2003 http://www.trl.co.uk/silvia/Silvia/pdf/Main_Outputs/SILVIA-DTF-ATKINS-001-03-WP3-091203.pdf

4.451.1/Traffic noise reduction in Europe August 2007 48
EPA, 1978 Noise : A health problem Washington D.C. : Environmental Protection Agency, Office of Noise Abatement and Control, 1978 FEHRL, 2006 Tyre/road noise : final report Brussels : TUV Nord, BAST, TRL, VTI, 2005 Health Council of the Netherlands, 2004 The influence of nighttime noise on sleep and health The Hague : Health Council of the Netherlands, 2004 IPG, 2007 Innovatieprogramma Geluid (Noise Innovation Programme (in Dutch)), 2007 http://www.innovatieprogrammageluid.nl INFRAS/IWW, 2004 External Costs of Transport, Update Study Zürich/Karlsruhe : INFRAS/IWW, 2004 Ising et al., 2004 Exposure and effect indicators of environmental noise H. Ising, W. Babisch, R. Guski, B. Kruppa, C. Maschke Berlin : Berlin Zentrum Public Health, 2004 Kaseloo, 2005 P.A. Kaseloo Synthesis of noise effects on wildlife populations Center for Transportation and the Environment, North Carolina State University In : Proceedings of the 2005 International Conference on Ecology and Transportation / C.L. Irwin, P. Garrett, K.P. McDermott, (eds.) p. 33-35, 2005 Kaseloo et al., 2004 P.A. Kaseloo, K.O. Tyson Synthesis of noise effects on wildlife populations S.l. : Virginia State University, 2004 Kunst, 2006 Heiko Kunst European Transport and Rail Noise Policy, Railway noise in urban areas: possi-ble source noise, reduction measures, presentation Pisa : S.n., 2006 KPMG, 2005 J. Klooster Cost effectiveness of road traffic noise measures The Hague : KPMG, 2005

4.451.1/Traffic noise reduction in Europe August 2007
49
Link, 2000 H. Link, et al. The Accounts Approach UNITE (UNIfication of accounts and marginal costs for Transport Efficiency) Leeds ; S.n., 2000 London Health Commission, 2003 Noise & Health : Making the link London : London Health Commission, 2003 M+P, 2000 Noise of passenger cars 1974-1999 : The paradox of a 2 dB(A) increase in traffic noise and a 8 dB(A) decrease in type approval limits Vught, : M+P, 2000 Miedema, 2001 H.M.E. Miedema, C.G. Oudshoorn Annoyance from transportation noise: relationships with exposure metrics DNL and DENL and their confidence intervals, In: Environmental Health Perspectives, 109(4) : (2001) p. 409-416 Oertli, 2003 J. Oertli The STAIRRS project, work package 1: a cost-effectiveness analysis of railway noise reduction on a European scale, In: Journal of Sound and Vibration, Volume 267, Issue 3, p. 431-437, 2003. Niemann, 2004 H. , Niemann, C. Maschke WHO LARES Final Report : Noise effects and morbidity Berlin, : S.n., 2004 OECD/INFRAS/Herry, 2002 External costs of transport in Eastern Europe Zürich/Vienna : S.n., 2003 Ohm, 2006 Anne Ohm Acoustical classification and conformity checking of road surfaces : Costs, bene-fits and cost-effectiveness of low-noise surfaces, COWI, Stakeholder Workshop, 2006. Kongens Lyngby : COWI A/S, 2006 Ouis, 2002 D. Ouis Annoyance caused by exposure to road traffic noise: an update In : Noise Health, 4(15), 69-79, 2002

4.451.1/Traffic noise reduction in Europe August 2007 50
Prasher, 2003 D. Prasher NOPHER Noise Pollution Health Effects Reduction, Final report 2000-2003 London : University College London, 2003 RIVM, 2005 A.B. Knol, B.A.M. Staatsen Trends in the environmental burden of disease in the Netherlands 1980 - 2020 Bilthoven, RIVM, 2005 RIVM, 2005 E.E.M.M. van Kempen van, B.A.M. Staatsen, I. van Kamp Selection and evaluation of exposure-effectrelationships for health impact as-sessment in the field of noise and health Bilthoven : RIVM, 2005 RIVM, 2004 H. Kruize, A.A. Bouwman Environmental (in)equity in the Netherlands : A case study on the distribution of environmental quality in the Rijnmond region Bilthoven : RIVM, 2004 RIVM, 2003 H.A. Nijland, E.E.M.M van Kempen van, G.P. van Wee, J. Jabben Bilthoven Costs and benefits of noise abatement measures In :Transport policy 10, 131-140, 2003 RIVM., 2003 A.E.M. Franssen, J.M.I. Kwekkeboom, Effecten van geluid door wegverkeer op de slaap (The impact of road traffic noise on sleep (in Dutch)), Bilthoven : RIVM (Dutch National Institute for Public Health and the Environ-ment), 2003 RIVM, 2004 B.A.M. Staatsen, H.A. Nijland, E.E.M. van Kempen A.E.M. de Hollander A.E.M. Franssen, A.E.M., I. van Kamp Assessment of health impacts and policy options in relation to transport-related noise exposures : Topic paper on noise Bilthoven : RIVM, 2004 RIVM, 2002 H.A. Nijland, A.G.M. Dassen Verkeerslawaai in Europa (Traffic noise in Europe (in Dutch)) Bilthoven : RIVM (RijksInstituut voor Volksgezondheid en Milieuhygiëne), 2002

4.451.1/Traffic noise reduction in Europe August 2007
51
RIVM, 2001 E.E.M.M. van Kempen, C.A. Ameling, R.T. Hoogenveen, B.A.M. Staatsen, A.E.M. de Hollander De potentiële ziektelast toe te schrijven aan de geluidsbelasting in Nederland (The potential health burden attributable to noise nuisance in the Netherlands (in Dutch)) Bilthoven : RIVM, 2001 Rosenhall, 1990 U. Rosenhall, K. Pedersen, A. Svenborg Presbycusis and Noise-induced hearing loss, In: Ear & Hearing, 11(4):257-263, 1990 SAEFL, 2003 Monetisation of the health impact due to traffic noise Bern : SAEFL (Swiss Agency for the Environment, Forests and Landscape) 2003 Sandberg, 2002 Ulf Sandberg Noise Emission from Powered Two-Wheeled Vehicles : Position Paper Lingköping : VTI (Swedish National Road and Transport Research Institute), 2002 Stansfeld, 2003 S.A. Stansfeld, M.P. Matheson Noise pollution: non-auditory effects on health In: British Medical Bulletin, 68., p. 243-257, 2003 Soguel, 1994 N. Soguel Évaluation Monétaire des Atteintes à l’Environnement: une Étude Hédoniste et Contingente sur l’impact des Transports (Monetary evaluation of environmental harm : a hedonic and contingent study of the impacts of transport (in French)), Neuchâtel : University of Neuchâtel, 1994 Theebe, 2004 M.A.J. Theebe Planes, trains and automobiles : The impact of traffic noise on house prices In : The Journal of Real Estate Finance and Economics, Vol. 28, No. 2-3, 2004 TNO Inro, 2002 H.M.E. Miedema, W. Passchier-Vermeer, H. Vos Elements for a position paper on night-time transportation noise and sleep distur-bance, Delft : TNO Inro, 2002
4.451.1/Traffic noise reduction in Europe August 2007 52
TOI, 2005 Astrid H. Admundsen, Ronny Klaeboe A Nordic perspective on noise reduction at the source Oslo : TOI (Institute of Transport Economics), 2005 TRL, 2003 P.A. Morgan, P.M. Nelson, H. Steven Integrated assessment of noise reduction measures in the road transport sector TRL limed : RWT V Brussels : European Commission-DG Enterprise, 2003 http://ec.europa.eu/enterprise/automotive/projects/report_noise_reduction.pdf UBA, 2005 Data on the environment : The state of the environment in Germany, edition 2005 Berlin ; UBA, 2005 UBA, 2003 C. Maschke, U. Wolf, T. Leitmann. Epidemiologische Untersuchungen zum Einfluss von Lärmstress auf das Immun-system und die Entstehung von Arteriosklerose (Epidemiological studies on the influence of noise stress on the immune system and the development of arterio-sclerosis (in German)), Anschlussbericht des Forschungsvorhabens Berlin : UBA, 2003 UIC, 2006 Rail Freight Noise Abatement, a report on the state of the art Paris : UIC & CER, 2006 UIC, 2006b Status and options for the reduction of noise emission from the existing European rail freight wagon fleet : including a third party assessment of the UIC/UIP/CER action programme on noise UIC, CER, UNIFE, UIP, UIRR, AEA Technology Paris : UIC, 2006 Van Kempen, 2002 E.E.M.M. van Kempen, H. Kruize, H.C. Boshuizen, C.B, Ameling, B.A.M. Staatsen, A.E.M. de Hollander The association between noise exposure and blood pressure and ischemic heart disease, In :Environmental Health Perspectives, 110 (2002) p. 307-317 VITO, 2003 R. Torfs Kwantificering van gezondheidsrisico’s aan de hand van DALYs en externe ge-zondheidskosten (Quantification of health risks using DALYs and external health costs (in Dutch)) Mol : VITO (Vlaamse instelling voor technologisch onderzoek), 2003

4.451.1/Traffic noise reduction in Europe August 2007
53
VTI, 2006 Mikael Ögren Noise emissions from railway traffic Lingköping : VTI (Swedish National Road and Transport Research Institute), 2006 VTI, 2006 Ulf Sandberg Financial Incentives to Encourage the Use of Low-Noise Tyres Lingköping : VTI (Swedish National Road and Transport Research Institute ), 2006 WHO, 2007 Night Noise Guidelines for Europe Bonn : WHO, regional Office for Europe, 2007 Witteveen+Bos, 2004 Project IPG4.3 Schermpositie - fase 1: verkenning oplossingsrichtingen, fase 2: akoestische effecten en kosten (Barrier positioning - phase 1: possible solutions, phase 2: acoustic effects and costs (in Dutch)) Deventer : Witteveen+Bos, 2004

4.451.1/Traffic noise reduction in Europe August 2007 54
4.451.1/Traffic noise reduction in Europe August 2007
55
Report Delft, August 2007 Authors: L.C. (Eelco) den Boer
A. (Arno) Schroten
Traffic noise reduction in Europe
Health effects, social costs and technical and policy options to
reduce road and rail traffic noise
Annexes
������������� �����
� ��� �� ���
�� ���� ��
���� ����
Oude Delft 180
2611 HH Delft
The Netherlands
tel: +31 15 2150 150
fax: +31 15 2150 151
e-mail: [email protected]
website: www.ce.nl
KvK 27251086

4.451.1/Traffic noise reduction in Europe August 2007 56

4.451.1/Traffic noise reduction in Europe August 2007
57
A Exposure to traffic noise
A.1 Reliability of exposure figures
The figures presented in section 2.5 on the numbers of people exposed to traffic noise are of debatable reliability. As countries are not obliged to measure or re-port the number of people exposed to noise, information on this topic is relatively sparse. In addition, the data that is available is based on a range of different measuring methods and noise metrics. For these reasons it is difficult to acquire reliable data about the absolute number of people currently exposed to harmful levels of traffic noise. Two studies do report noise exposure data for various Western European coun-tries: INFRAS/IWW (2004) and Link (2000). INFRAS/IWW report on 17 countries, Link on 11. Table 9 presents the road traffic noise exposure figures for the 9 countries covered by both studies.
Table 9 Number op people exposed to road traffic noise (noise levels above 55 dB(A)) in several European countries as reported by INFRAS/IWW and Link
Country INFRAS/IWW (2004) Link (2000) Austria 4,688,000 4,950,000
Finland 900,000 840,000 Germany 40,508,000 40,260,000 Ireland 1,280,000 1,500,000 Italy 40,370,000 40,190,000 Netherlands 4,384,000 8,200,000 Portugal 5,344,000 4,240,000 Spain 16,060,000 16,060,000 Sweden 1,382,000 1,580,000
Total 118,615,000 114,121,000
Although the aggregate number of people exposed to road traffic noise in the 9 European countries in the Table 9 differ only slightly, by about 3%, for certain in-dividual countries the differences are large. For the Netherlands, Portugal and Switzerland, especially, the results from the two studies differ substantially, by over 20%. The Netherlands is known for having excellent figures on the number of people exposed to traffic noise. It is therefore instructive to compare the INFRAS/IWW and Link data for the Netherlands to reliable Dutch figures. As can be seen in Table 10, both INFRAS/IWW and Link present figures for the Netherlands which differ substantially from the (reliable) Dutch figures published by CE (2004).

4.451.1/Traffic noise reduction in Europe August 2007 58
Table 10 Number of people exposed to road traffic noise in the Netherlands as reported by different studies
55-60 dB 61-65 dB 66-70 dB 71-75 dB > 75 dB CE (2004) 3,669,000 1,484,000 352,000 46,000 9,000 INFRAS/IWW (2004)
5,100,000 2,400,000 400,000 217,000 340,000
Link (2000) 2,760,000 1,299,000 217,000 81,000 27,000
The exposure figures for Eastern European countries cited in section 2.5 are from OECD/INFRAS/Herry (2002). However, the exposure data presented in that study are not based on actual measurement of the number of people exposed to traffic noise, but were estimated with the help of some rough assumptions. It can be concluded that the figures on the numbers of people exposed to traffic noise are of questionable reliability. For this reason the results presented in sec-tion 2.5 should be interpreted and used with due caution. The quality of the statistics on population exposure to traffic noise is expected to improve soon, as the Environmental Noise Directive (END) of 2002 obliges Euro-pean countries to monitor the exposure of their citizens to environmental noise (see section 4.1).
A.2 The relation between exposure to noise and health effects
Not all of those exposed to traffic noise will experience health effects. A large proportion will be scarcely affected at all, apart from experiencing annoyance and/or a certain amount of sleep disturbance. A smaller fraction of the population will experience physiological changes with unknown effects, however, such as temporary increase in blood pressure or production of stress hormones. For some of them, these effects will lead to pathological changes, such as hyperten-sion and chronic stress. A yet smaller fraction will eventually become ill or even die. This relationship between noise exposure and (experience of) health effects is shown in Figure 17, on the next page.

4.451.1/Traffic noise reduction in Europe August 2007
59
Figure 17 Schematic representation of the distribution of noise responses in a population
Source: RIVM (2001).
Mortality
Morbidity: cardiovascular
diseases
Pathological disorders:
chronic stress, hyperten-
sion
Physiological changes of unknown significance: stress
hormones, temporary increase of blood pressure
Internal exposure: annoyance,
sleep disturbance
Proportion of population affected

4.451.1/Traffic noise reduction in Europe August 2007 60

4.451.1/Traffic noise reduction in Europe August 2007
61
B Social costs for traffic noise
B.1 Comparing INFRAS/IWW and Link
Both INFRAS/IWW (2004) and Link (2000) have estimated the social costs of noise due to road and rail traffic. However, their results vary rather widely. The main reasons for these differences are: • The number of people reported to be exposed to traffic noise differs between
the two studies because of the different data sources used. Since the total es-timated costs are the sum of the costs for all individuals exposed to noise, the estimated numbers of people exposed to traffic noise directly affects the cost estimates reported.
• Both studies use comparable Willingess to Pay (WTP) figures derived from hedonic pricing studies for noise reduction: about 0.1% of per capita income. However, INFRAS/IWW use these figures to estimate the loss of well-being due to annoyance and sleep disturbance, while Link uses the same figures to estimate the loss of well-being due to annoyance only. In the latter report the monetary value of sleep disturbance due to traffic noise is estimated sepa-rately.
• An important difference between INFRAS/IWW and Link is the way fatalities due to traffic noise are valued. INFRAS/IWW (2004) estimate the increased mortality due to health risk and value each fatality using the so-called Risk Value, based among other things on the value of a statistical life, the latter from the literature on valuing the victims of traffic accidents. This method has been criticised because victims of traffic accidents are much younger than victims of heart attacks. For this reason, Link evaluates only the ‘years of life lost’ (YOLL), using a ‘value of a life year lost’ (VLYL). This method, for its part, can be criticised for ethical reasons, because it claims that the lives of elderly people are ‘worth less’ than those of younger citizens.
• Medical costs are estimated in the two studies in entirely different ways. INFRAS/IWW provides estimates for the medical costs of cardiovascular dis-eases only, thereby assuming that 8% of all the economic costs associated with cardiovascular disease are due to traffic noise. This figure of 8% repre-sents the share of the costs of these diseases attributable to traffic noise of 65 dB(A) and upwards and it is consequently on the basis of the population exposed to this noise level that medical costs are calculated. Link, on the other hand, uses a series of exposure-response functions to estimate the number of people suffering various health effects due to traffic noise. To value the health effects in these people, Link uses monetary values from Ex-ternE. The medical costs associated with sleep disturbance are estimated in a similar way.

4.451.1/Traffic noise reduction in Europe August 2007 62

4.451.1/Traffic noise reduction in Europe August 2007
63
C Vehicle noise emission trends
Figure 18 shows the statistical distribution of type approval results for passenger cars. In each year the total number of measurements is set at 100%. The solid line represents the limit values for normal vehicles. The limit for direct-injected diesels and 4-wheel-drive cars is 1 or 2 dB(A) higher. A proportion of the meas-ured values are therefore above the limit value. Because the test cycle has been changed several times over the years, from this figure it is not possible to draw any real conclusions about the overall trend in noise emissions. What can be concluded, however, is that: • Stepwise tightening of the limit value has not significantly changed the aver-
age measured type approval results. • Over time, the distribution of the type approval results for all vehicles has nar-
rowed.
Figure 18 Statistical distribution of type approval results for passenger cars
1980 1982 1984 1986 1988 1990 1992 1994 1996 199864
66
68
70
72
74
76
78
80
82
84
86
Distribution [%]
Year of inspection
Soun
d le
vel p
ass-
by [d
B(A)
]
35-40
30-35
25-30
20-25
15-20
10-15
5-10
0-5
�
Source: M+P, 2000.
Based on Figure 18, the dashed line in Figure 19 gives an educated guess of the influence of the most significant changes in measurement procedure on the measured noise levels of a virtual “everyday tested car”. Between 1980 an 1996 this car was given an extra allowance of about 4 dB(A). The line follows the mo-dal measured value (based on Figure 18) remarkably well. This suggests that

4.451.1/Traffic noise reduction in Europe August 2007 64
most of the changes in the measured values are due to changes in the meas-urement procedure.
Figure 19 Educated guess of the influence of the most significant changes in the measurement procedure on the measured noise levels of a virtual 'everyday tested car'
1980 1982 1984 1986 1988 1990 1992 1994 1996 199870
72
74
76
78
80
Soun
d le
vel p
ass-
by [d
B(A)
]
2nd
3rd2nd + 3rd
low noise
normal
gear tested
test track surfaceand tyres
Changes inmeasuring method
�
Source: M+P, 2000.