traffic impact study for altamira family apartments · 2017-10-20 · 1 traffic impact study for...
TRANSCRIPT
Balancing Functionality and Livability since 1995w-trans.com
TRAFFIC ENGINEERINGTRANSPORTATION PLANNING
250 Qty.
June 7, 2017
Prepared for the City of Sonoma
Submitted byW-Trans
Traffic Impact Study for Altamira Family Apartments

i
Traffic Impact Study for the Altamira Family Apartments June 7, 2017
Table of Contents
Executive Summary .................................................................................................................................................................. 1
Introduction ................................................................................................................................................................................. 2
Transportation Setting ............................................................................................................................................................. 4
Capacity Analysis ....................................................................................................................................................................... 7
Alternative Modes .................................................................................................................................................................. 12
Access and Circulation .......................................................................................................................................................... 13
Conclusions and Recommendations ............................................................................................................................... 15
Study Participants and References ................................................................................................................................... 16
Figures 1. Study Area, Lane Configuration, and Traffic Volumes ................................................................................................... 3 2. Site Plan ....................................................................................................................................................................................... 10
Tables
1. Bicycle Facility Summary ......................................................................................................................................................... 5 2. Two-Way Stop-Controlled Intersection Level of Service Criteria ............................................................................... 7 3. Existing Peak Hour Intersection Levels of Service ........................................................................................................... 8 4. Future Peak Hour Intersection Levels of Service ............................................................................................................. 9 5. Trip Generation Summary ....................................................................................................................................................... 9 6. Trip Distribution Assumptions ............................................................................................................................................... 9 7. Existing and Existing plus Project Peak Hour Intersection Levels of Service ....................................................... 11 8. Future and Future plus Project Peak Hour Intersection Levels of Service ............................................................ 11
Appendices A. Collision Rate Calculations B. Intersection Level of Service Calculations C. Site Access


1
Traffic Impact Study for the Altamira Family Apartments June 7, 2017
Executive Summary
The project as proposed includes a 48-unit apartment complex to be located on a currently vacant parcel on the northwest corner of Broadway (SR 12)/Clay Street in the City of Sonoma. Access would be provided via a single driveway on Broadway. The project is expected to generate an average of 319 new daily trips, including 24 trips during the a.m. peak hour and 30 trips during the p.m. peak hour.
The intersection of Broadway/Clay Street is currently operating acceptably overall at LOS A during both the a.m. and p.m. peak hours. It is expected to operate acceptably under Future conditions, and also with project-added traffic.
Facilities for alternative modes in the vicinity of the project site are adequate for pedestrians, bicyclists, and transit users. Bicycle parking for 14 bicycles should be provided on-site.
Sight distance on Broadway at the project driveway would be adequate with the addition of 20 feet of red curb on either side of the project driveway. While a left-turn lane at the project driveway is not warranted under Existing or Future volumes, other factors, such as the excessive width of the road and ease of access to other properties in the vicinity, led to a recommendation to restripe Broadway with a two-way left-turn lane along the project frontage, filling in a missing link by connecting to the existing striping north and south of this segment.
2
Traffic Impact Study for the Altamira Family Apartments June 7, 2017
Introduction
This report presents an analysis of the potential traffic impacts that would be associated with development of a proposed 48-unit apartment project to be located at 20269 Broadway in the City of Sonoma. The traffic study was completed in accordance with criteria established by the City of Sonoma, and is consistent with standard traffic engineering techniques.
Prelude
The purpose of a traffic impact study is to provide City staff and policy makers with data that they can use to make an informed decision regarding the potential traffic impacts of a proposed project, and any associated improvements that would be required in order to mitigate these impacts to a level of insignificance as defined by the City’s General Plan or other policies. Vehicular traffic impacts are typically evaluated by determining the number of new trips that the proposed use would be expected to generate, distributing these trips to the surrounding street system based on existing travel patterns or anticipated travel patterns specific to the proposed project, then analyzing the impact the new traffic would be expected to have on critical intersections or roadway segments. Impacts relative to access for pedestrians, bicyclists, and to transit are also addressed.
Project Profile
The Sonoma Family Housing project includes 48 apartment units to be located on a currently vacant site at 20269 Broadway, as shown in Figure 1.

Broa
dway
Clay St
Leveroni Rd
Woodworth Ln
1
Project Site
Traffic Impact Study for the Altamira Family Apartments Project
son045-1.ai 6/17
Existing1
14 (
14)
513(
530)
(6)17(7)20
(9)
8(4
80)6
42
Future1
21 (
21)
573(
581)
(9)26(11)30
(14)
12
(573
)688
Project1
0 (0
)10
(5)
(0)0(0)0 (0
)0(1
0)3
1
Broadway (SR12)
Clay St
STOP
Figure 1 – Study Area, Lane Configuration, and Traffic Volumes
(xx) PM Peak Hour Volumexx AM Peak Hour Volume
SCT Bus Stop
Study IntersectionLEGEND
SCT Routes 34, 38, & 40SB Bus Stop
SCT Routes 34, 38, & 40NB Bus Stop
4
Traffic Impact Study for the Altamira Family Apartments June 7, 2017
Transportation Setting
Operational Analysis
Study Area and Periods
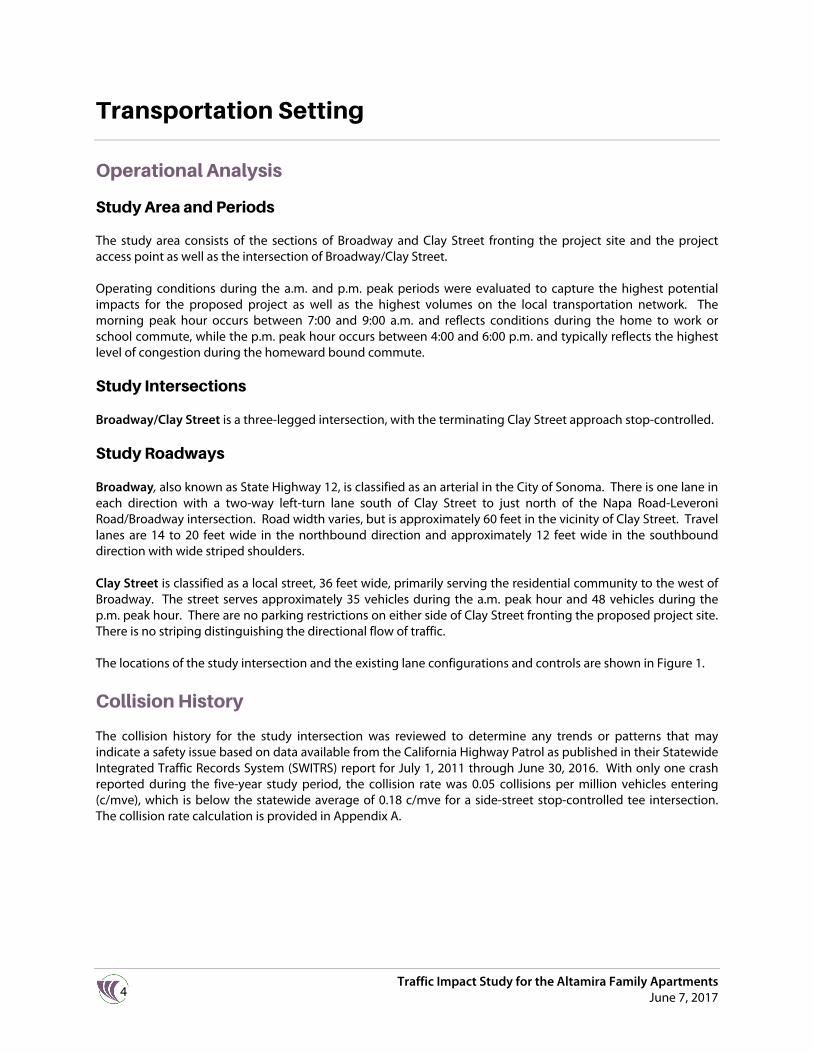
The study area consists of the sections of Broadway and Clay Street fronting the project site and the project access point as well as the intersection of Broadway/Clay Street.
Operating conditions during the a.m. and p.m. peak periods were evaluated to capture the highest potential impacts for the proposed project as well as the highest volumes on the local transportation network. The morning peak hour occurs between 7:00 and 9:00 a.m. and reflects conditions during the home to work or school commute, while the p.m. peak hour occurs between 4:00 and 6:00 p.m. and typically reflects the highest level of congestion during the homeward bound commute.
Study Intersections
Broadway/Clay Street is a three-legged intersection, with the terminating Clay Street approach stop-controlled.
Study Roadways
Broadway, also known as State Highway 12, is classified as an arterial in the City of Sonoma. There is one lane in each direction with a two-way left-turn lane south of Clay Street to just north of the Napa Road-Leveroni Road/Broadway intersection. Road width varies, but is approximately 60 feet in the vicinity of Clay Street. Travel lanes are 14 to 20 feet wide in the northbound direction and approximately 12 feet wide in the southbound direction with wide striped shoulders.
Clay Street is classified as a local street, 36 feet wide, primarily serving the residential community to the west of Broadway. The street serves approximately 35 vehicles during the a.m. peak hour and 48 vehicles during the p.m. peak hour. There are no parking restrictions on either side of Clay Street fronting the proposed project site. There is no striping distinguishing the directional flow of traffic.
The locations of the study intersection and the existing lane configurations and controls are shown in Figure 1.
Collision History
The collision history for the study intersection was reviewed to determine any trends or patterns that may indicate a safety issue based on data available from the California Highway Patrol as published in their Statewide Integrated Traffic Records System (SWITRS) report for July 1, 2011 through June 30, 2016. With only one crash reported during the five-year study period, the collision rate was 0.05 collisions per million vehicles entering (c/mve), which is below the statewide average of 0.18 c/mve for a side-street stop-controlled tee intersection. The collision rate calculation is provided in Appendix A.

5
Traffic Impact Study for the Altamira Family Apartments June 7, 2017
Alternative Modes
Pedestrian Facilities
Pedestrian facilities include sidewalks, crosswalks, pedestrian signal phases, curb ramps, curb extensions, and various streetscape amenities such as lighting, benches, etc. In general, a network of sidewalks, crosswalks, pedestrian signals, and curb ramps provide access for pedestrians in the vicinity of the proposed project site; however, sidewalk gaps, obstacles, and barriers can be found along some of the roadways connecting to the project site. Existing gaps and obstacles along the connecting roadways impact convenient and continuous access for pedestrians and present safety concerns in those locations where appropriate pedestrian infrastructure would address potential conflict points.
Broadway – While there are gaps in pedestrian facilities on the east side of Broadway, sidewalks, curb ramps, and crosswalks are complete on the west side of Broadway from West Napa Street to Leveroni Road.
Clay Street – Continuous sidewalks are provided on both sides of Clay Street in the vicinity of the project site.
Bicycle Facilities
The Highway Design Manual, Caltrans, 2012, classifies bikeways into three categories:
Class I Multi-Use Path – a completely separated right-of-way for the exclusive use of bicycles and pedestrians with cross flows of motorized traffic minimized.
Class II Bike Lane – a striped and signed lane for one-way bike travel on a street or highway. Class III Bike Route – signing only for shared use with motor vehicles within the same travel lane on a street
or highway.
There is a Class I bike path west of the project location, and Class II bike lanes and Class III sharrows are proposed adjacent to the project site on Broadway and Newcomb Street, respectively. Bicyclists ride in the roadway and/or on sidewalks along all other streets within the project study area. Table 1 summarizes the existing and planned bicycle facilities in the project vicinity, as contained in the Sonoma Bicycle and Pedestrian Master Plan.
Table 1 – Bicycle Facility Summary
Status Facility
Class Length (miles)
Begin Point End Point
Existing
Madera Park Trail I 0.64 W MacArthur St Leveroni Rd
Planned
Broadway II 1.12 Napa St Leveroni Rd-Napa Rd
Newcomb St III 0.33 Madera Park Trail Broadway
Source: Sonoma Bicycle and Pedestrian Master Plan, SCTA, 2014
Transit Facilities
Sonoma County Transit (SCT) provides fixed route bus service in Sonoma County and regionally. There are northbound and southbound stops on Broadway between Clay Street and Leveroni Road. The northbound stop is 250 feet from the project site and the southbound stop is 600 feet south of the project site, as shown in Figure 1. SCT Route 34 provides weekday service between Sonoma and Santa Rosa. The route operates once in the

6
Traffic Impact Study for the Altamira Family Apartments June 7, 2017
morning in the eastbound direction, and once in the afternoon in the westbound direction. Sonoma and San Rafael are connected by SCT Route 38. This route operates one time southbound for the morning commute and one time northbound for the evening commute Monday through Friday. Route 40 provides service between Sonoma and Petaluma during weekdays. There are two departures in each direction during the morning peak period and three departures in each direction during the peak afternoon and evening periods.
Two or three bicycles can be carried on SCT buses. Bike rack space is on a first come, first served basis. Additional bicycles are allowed on SCT buses at the discretion of the driver.
Dial-a-ride, also known as paratransit, or door-to-door service, is available for those who are unable to independently use the transit system due to a physical or mental disability. SCT Paratransit is designed to serve the needs of individuals with disabilities within Sonoma County.
7
Traffic Impact Study for the Altamira Family Apartments June 7, 2017
Capacity Analysis
Intersection Level of Service Methodologies
Level of Service (LOS) is used to rank traffic operation on various types of facilities based on traffic volumes and roadway capacity using a series of letter designations ranging from A to F. Generally, Level of Service A represents free flow conditions and Level of Service F represents forced flow or breakdown conditions. A unit of measure that indicates a level of delay generally accompanies the LOS designation.
The study intersection was analyzed using the unsignalized methodology published in the Highway Capacity Manual (HCM), Transportation Research Board, 2010. This source contains methodologies for various types of intersection control, all of which are related to a measurement of delay in average number of seconds per vehicle. The “Two-Way Stop-Controlled” intersection capacity methodology determines a level of service for each minor turning movement by estimating the level of average delay in seconds per vehicle. Results are presented for individual movements together with the weighted overall average delay for the intersection.
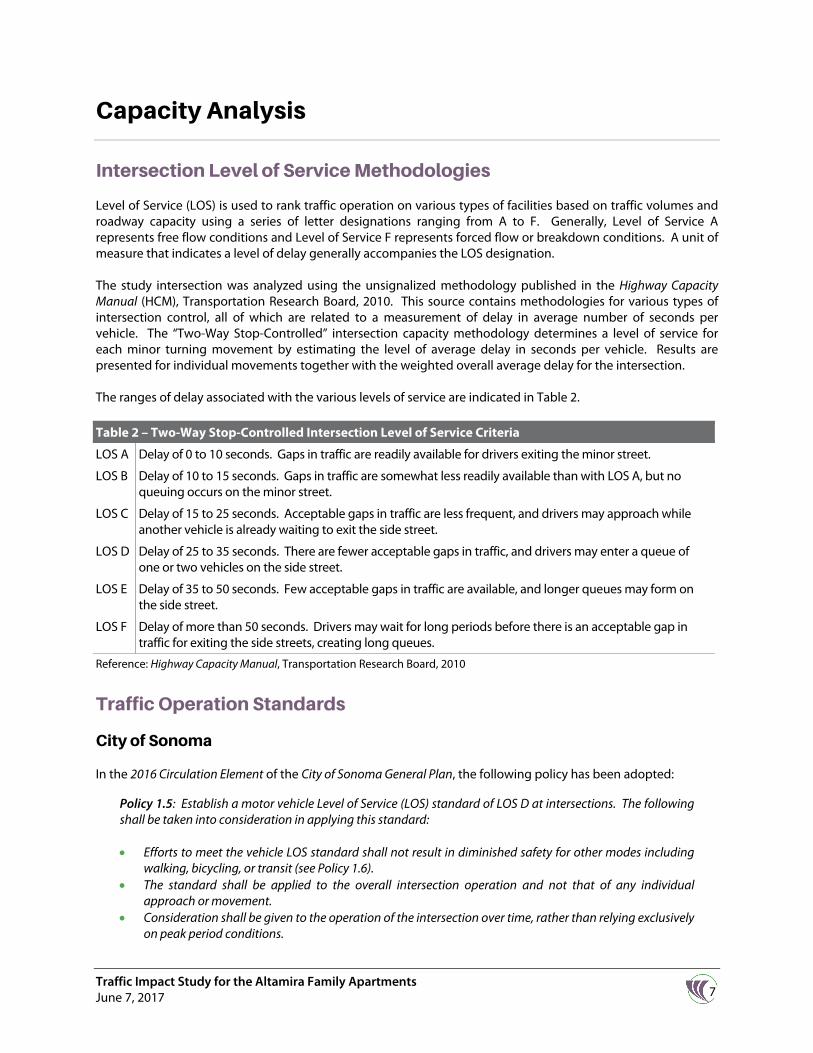
The ranges of delay associated with the various levels of service are indicated in Table 2.
Table 2 – Two-Way Stop-Controlled Intersection Level of Service Criteria
LOS A Delay of 0 to 10 seconds. Gaps in traffic are readily available for drivers exiting the minor street.
LOS B Delay of 10 to 15 seconds. Gaps in traffic are somewhat less readily available than with LOS A, but no queuing occurs on the minor street.
LOS C Delay of 15 to 25 seconds. Acceptable gaps in traffic are less frequent, and drivers may approach while another vehicle is already waiting to exit the side street.
LOS D Delay of 25 to 35 seconds. There are fewer acceptable gaps in traffic, and drivers may enter a queue of one or two vehicles on the side street.
LOS E Delay of 35 to 50 seconds. Few acceptable gaps in traffic are available, and longer queues may form on the side street.
LOS F Delay of more than 50 seconds. Drivers may wait for long periods before there is an acceptable gap in traffic for exiting the side streets, creating long queues.
Reference: Highway Capacity Manual, Transportation Research Board, 2010
Traffic Operation Standards
City of Sonoma
In the 2016 Circulation Element of the City of Sonoma General Plan, the following policy has been adopted:
Policy 1.5: Establish a motor vehicle Level of Service (LOS) standard of LOS D at intersections. The following shall be taken into consideration in applying this standard:
Efforts to meet the vehicle LOS standard shall not result in diminished safety for other modes including walking, bicycling, or transit (see Policy 1.6).
The standard shall be applied to the overall intersection operation and not that of any individual approach or movement.
Consideration shall be given to the operation of the intersection over time, rather than relying exclusively on peak period conditions.

8
Traffic Impact Study for the Altamira Family Apartments June 7, 2017
The five intersections surrounding the historic Sonoma Plaza shall be exempt from vehicle LOS standards in order to maintain the historic integrity of the Plaza and prioritize non-auto modes.
Caltrans
While the intersection lies within City of Sonoma limits, it is a part of a State Route. Caltrans indicates that they endeavor to maintain operation at the transition from LOS C to LOS D. Based on previous discussions with Caltrans staff, it is understood that the standard is to be applied to the overall average intersection delay, and not that associated with any single movement or approach. Under this approach, if one movement experiences very high delay and also has moderate to high traffic volumes, the overall delay and level of service should reflect the critical nature of the condition. However, if one movement is expected to experience high delay, but has very low traffic volumes, the overall intersection operation will likely still meet Caltrans standards.
Existing Conditions
The Existing Conditions scenario provides an evaluation of current operation based on existing traffic volumes during the a.m. and p.m. peak periods. This condition does not include project-generated traffic volumes. Volume data was collected April 14, 2017 while local schools were in session.
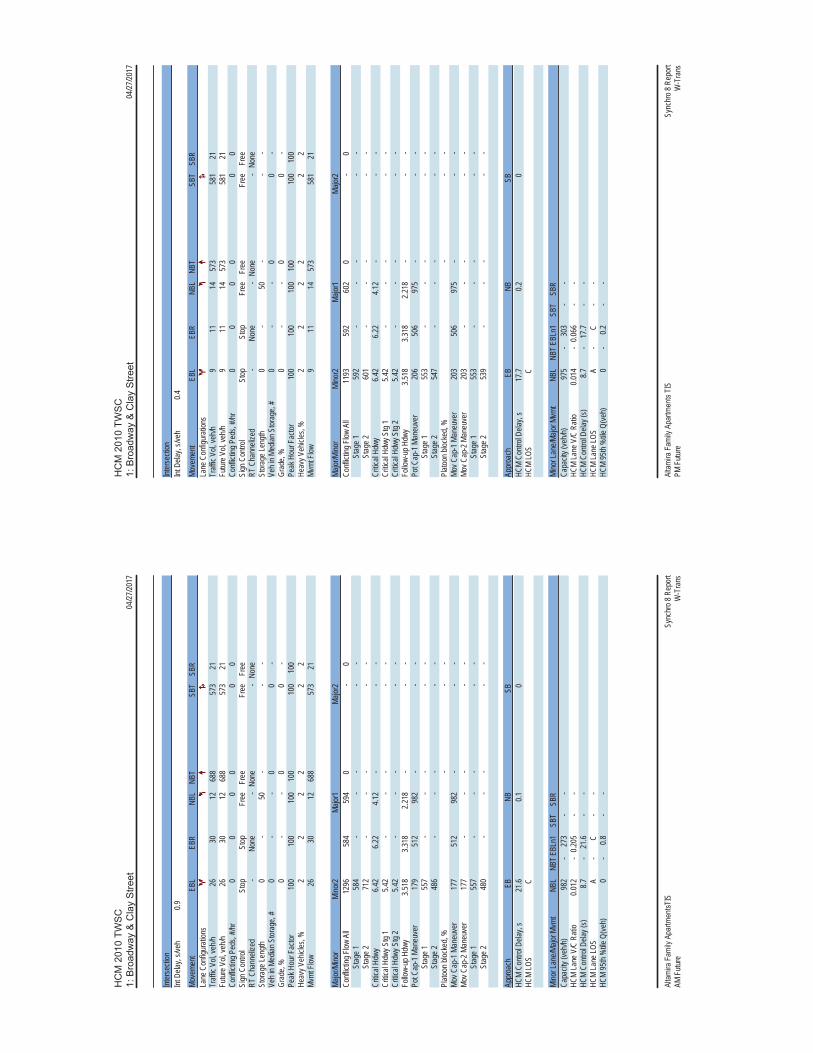
Intersection Levels of Service
Under existing conditions, the intersection operates acceptably at LOS A overall during both peak periods. The existing traffic volumes are shown in Figure 1. A summary of the intersection level of service calculations is contained in Table 3, and copies of the Level of Service calculations are provided in Appendix B.
Table 3 – Existing Peak Hour Intersection Levels of Service
Study Intersection Approach
AM Peak PM Peak
Delay LOS Delay LOS
1. Broadway/Clay St 0.7 A 0.3 A
Eastbound (Clay St) Approach 21.4 C 16.0 C
Notes: Delay is measured in average seconds per vehicle; LOS = Level of Service; Results for minor approaches to two-way stop-controlled intersections are indicated in italics
Future Conditions
Segment volumes for the horizon year of 2040 were obtained from the County’s gravity demand model and the differences between the 2010 and 2040 volumes were applied to the existing turning movement counts to arrive at Future volumes. A growth factor of 1.5 was derived from the increase indicated by the model and applied to the side street volumes.
Under the anticipated Future volumes, the study intersections are expected to operate acceptably at LOS A overall during both study periods. Future volumes are shown in Figure 1 and operating conditions are summarized in Table 4.

9
Traffic Impact Study for the Altamira Family Apartments June 7, 2017
Table 4 – Future Peak Hour Intersection Levels of Service
Study Intersection Approach
AM Peak PM Peak
Delay LOS Delay LOS
1. Broadway/Clay St 0.9 A 0.4 A
Eastbound (Clay St) Approach 21.6 C 17.7 C
Notes: Delay is measured in average seconds per vehicle; LOS = Level of Service; Results for minor approaches to two-way stop-controlled intersections are indicated in italics
Project Description
The project consists of 48 apartment units on a site that is currently vacant located at 20269 Broadway in the City of Sonoma. Access would be taken directly from Broadway. The proposed project site plan is shown in Figure 2.
Trip Generation
The anticipated trip generation for the proposed project was estimated using standard rates published by the Institute of Transportation Engineers (ITE) in Trip Generation Manual, 9th Edition, 2012 for the “Apartment” land use (ITE LU #220). As shown in Table 5, the proposed project is expected to generate an average of 319 trips per day, including 24 trips during the a.m. peak hour and 30 during the p.m. peak hour.
Table 5 – Trip Generation Summary
Land Use Units Daily AM Peak Hour PM Peak Hour
Rate Trips Rate Trips In Out Rate Trips In Out
Apartment 48 du 6.65 319 0.51 24 5 19 0.62 30 19 11
Note: du = dwelling unit
Trip Distribution
Based on the volumes at the study intersection as well as anticipated destinations for site residents, it was assumed that project trips would be distributed as shown in Table 6.
Table 6 – Trip Distribution Assumptions
Route Percent Daily Trips AM Trips PM Trips
Broadway (to/from the north) 50% 160 12 15
Broadway (to/from the south) 50% 159 12 15
TOTAL 100% 319 24 30

Traffic Impact Study for the Altamira Family Apartments Project
son045-1.ai 6/17
Figure 2 – Site Plan
R R
R
R
RR
R
R R R
R
R
R
R
R
R
R
R
R
UP
R
UP
R
UP
R
UP
R
R
R
R
UP
R
UP
R
UP
R
UP
R
UP
R
UP
EXISTINGPG&E VAULT
GAS
A3.068
9' - 9 1/2" CLR
21' - 3 1/2" 19' - 9 1/2" CLR
BUILDING 4
BUILDING 5
BUILDING 2
BUILDING 1
BUILDING 3
BUILDING 6
BUILDING 8
BUILDING 7
COMMUNITY BUILDING
TRASH AREA
24' - 6"16' - 0"
72 TOTAL PARKING SPACES
6' - 2"18' - 0"
10' - 1"
57.65'FF
57.65'FF
58.65'FF
58.65'FF
58.65'FF
57.65'FF
57.65'FF
COURTYARD #2
COURTYARD #1
57.65'FF
57.65' FF
CLAY STREET
BROADWAY
8' - 0" 9' - 0"
15' - 2"
10' - 6" CLR
PROPERTYLINE
SE
TB
AC
K
20'-9"
CLR
SE
TB
AC
K
24' - 0" CLR
72' - 7 1/2"
FIRETRUCKTURNAROUND
TYP
8' - 6"
TYP.
8' - 6"
SHEET:
DRAWN BY:
CHECKED BY:
DATE:
SCALE:
TITLE:
1611 TELEGRAPH AVE. SUITE 200OAKLAND, CA 94612
510.465.7010 p | 510.465.8575 fwww.pyatok.com
STAMP:
JOB NUMBER:
- PRELIMINARY - Not for Construction-
3/32" = 1'-0"
1522
CATB
5-10-17
SITE PLAN
A1.01 ALTAMIRA FAMILY APARTMENTS20269 Broadway, Sonoma, CA
1835 Alcatraz Avenue
Satellite Affordable HousingAssociates
Berkeley, CA 94703
3/32" = 1'-0"
1S
ITE
PLA
N - LE
VE
L 1 PROJECTNORTH
TRUENORTH
SE
CU
RE
BIC
YC
LES
TO
RA
GE
Source: Pyatok Architects, 05/2017

11
Traffic Impact Study for the Altamira Family Apartments June 7, 2017
Intersection Operation
Existing plus Project Conditions
Upon the addition of project-related traffic to the Existing volumes, the study intersections are expected to continue to operate at LOS A overall, with minimal increases in delay expected on the stop-controlled side-street approach. These results are summarized in Table 7. Project traffic volumes are shown in Figure 1.
Table 7 – Existing and Existing plus Project Peak Hour Intersection Levels of Service
Study Intersection Approach
Existing Conditions Existing plus Project
AM Peak PM Peak AM Peak PM Peak
Delay LOS Delay LOS Delay LOS Delay LOS
1. Broadway/Clay St 0.7 A 0.3 A 0.7 A 0.3 A
Eastbound (Clay St) Approach 21.4 C 16.0 C 21.8 C 16.2 C
Notes: Delay is measured in average seconds per vehicle; LOS = Level of Service; Results for minor approaches to two-way stop-controlled intersections are indicated in italics
Finding – The study intersection is expected to continue operating acceptably at the same levels of service upon the addition of project-generated traffic.
Future plus Project Conditions
Upon the addition of project-generated traffic to the anticipated Future volume, the study intersection is expected to continue operating acceptably. The Future plus Project operating conditions are summarized in Table 8.
Table 8 – Future and Future plus Project Peak Hour Intersection Levels of Service
Study Intersection Approach
Future Conditions Future plus Project
AM Peak PM Peak AM Peak PM Peak
Delay LOS Delay LOS Delay LOS Delay LOS
1. Broadway/Clay St 0.9 A 0.4 A 1.0 A 0.4 A
Eastbound (Clay St) Approach 21.6 C 17.7 C 21.9 C 17.9 C
Notes: Delay is measured in average seconds per vehicle; LOS = Level of Service; Results for minor approaches to two-way stop-controlled intersections are indicated in italics
Finding – The study intersection will continue operating acceptably with project traffic added, at the same Levels of Service as without it and imperceptible increases in average delay for stop-controlled traffic.

12
Traffic Impact Study for the Altamira Family Apartments June 7, 2017
Alternative Modes
Pedestrian Facilities
Given the proximity of commercial and residential land uses to the project site, it is reasonable to assume that some project patrons and employees will want to walk, bicycle, and/or use transit to reach the project site. There is existing sidewalk along both the project frontages of Broadway and Clay Street. There is also continuous sidewalk available along the west side of Broadway and a signalized intersection at Broadway/Newcomb Street with a marked crossing across Broadway that middle and high school students could use to walk between the project site and Adele Harrison Middle School and Sonoma Valley High School.
Project Site – Sidewalks exist along both the Broadway and Clay Street project frontages, and there is also continuous sidewalk and a marked crossing between the project site and the nearby middle and high school. A review of the site plan indicates pedestrian walkways are proposed within the project site as well.
Finding – Pedestrian facilities serving the project site are adequate.
Bicycle Facilities
Existing bicycle facilities, including shared use of minor streets, provide adequate access for bicyclists. Class II bike lanes are proposed on Broadway, including along the project frontage.
Bicycle Storage
Short-term bicycle parking is provided at the site by 14 secured bike parking spaces.
Finding – Bicycle facilities serving the project site are adequate.
Transit
Existing transit routes are adequate to accommodate project-generated transit trips. Existing stops are within acceptable walking distance of the site.
Finding – Transit facilities serving the project site are adequate.

13
Traffic Impact Study for the Altamira Family Apartments June 7, 2017
Access and Circulation
Site Access
The project site will be accessed via a driveway on Broadway on the northern edge of the property, across from an existing driveway to Broadway Plaza.
Sight Distance
Sight distance along Broadway at the project driveway was evaluated based on sight distance criteria contained in the Highway Design Manual published by Caltrans. The recommended sight distances for minor street approaches that are a driveway are based on stopping sight distance, with approach travel speeds as the basis for determining the recommended sight distance. Additionally, the stopping sight distance needed for a following driver to stop if there is a vehicle waiting to turn into a side street or driveway is evaluated based on stopping sight distance criterion and the approach speed on the major street.
Sight distance at the proposed driveway location was field measured. Based on a design speed of 35 mph, the minimum stopping sight distance needed is 250 feet. Broadway is a straight, flat road and stopping sight distance for a posted speed limit of 35 mph is adequate so long as there are no vehicles parked along the curb. The sight distance, shown in the exhibit provided in Appendix C would be adequate at the project driveway with the addition of red curb on either side of the driveway.
Finding - Sight distance is adequate, but could be impacted by parked vehicles.
Recommendation - Parking restrictions in the form of red curbs should be installed for 20 feet on either side of the project driveway. Additionally, low-lying landscaping should be installed along the project frontage on Broadway near the driveway.
Access Analysis
Left-Turn Lane Warrants
The need for a left-turn lane on Broadway at the proposed driveway was evaluated based on criteria contained in the Intersection Channelization Design Guide, National Cooperative Highway Research Program (NCHRP) Report No. 279, Transportation Research Board, 1985, as well as a more recent update of the methodology developed by the Washington State Department of Transportation. The NCHRP report references a methodology developed by M. D. Harmelink that includes equations that can be applied to expected or actual traffic volumes in order to determine the need for a left-turn pocket based on safety issues. It is understood that this methodology is similar to what Caltrans uses for this type of analysis.
The left-turn warrant study was based on Existing and Future peak hour volumes as well as safety criteria. Under plus Project conditions, a left-turn lane is not warranted on Broadway at the project driveway during either of the peak periods evaluated, or under projected Future volumes. The turn lane warrant worksheets are included in Appendix C.
Left-Turn Lane Design
While a left-turn lane is not warranted on Broadway at the project driveway based on volumes, due to the inconsistency of the lane geometrics on Broadway along the project frontage compared to the rest of Broadway between Napa Street and Leveroni Road-Napa Road, as well as the excessive width that can contribute to speeding and other undesirable driving behaviors, it is recommended that the project restripe Broadway with a
14
Traffic Impact Study for the Altamira Family Apartments June 7, 2017
two-way left-turn lane for the 770 feet between the existing two-way left-turn lane striping north and south of the missing segment. This modification would substantially improve access conditions for the project site and for other origins and destinations in the vicinity. As shown in the exhibit in Appendix C, it appears that the new striping will fit within the existing pavement width while retaining parking where it currently exists.
Potential Conflicts
Loading activity on Clay Street for the Sonoma Lodge was collected on video cameras for one week and then reviewed. Based on video footage obtained, it appears there is minimal potential for conflict with delivery trucks for the Sonoma Lodge. During the a.m. peak period trucks were observed parallel parking along the south side of Clay Street, with ample space for eastbound passenger vehicles to continue to Broadway.

15
Traffic Impact Study for the Altamira Family Apartments June 7, 2017
Conclusions and Recommendations
Conclusions
The project as proposed is expected to generate 326 new daily trips, including 25 during the a.m. peak hour and 30 during the p.m. peak hour.
The study intersection experienced a lower collision rate than the statewide average for similar facilities.
The intersection currently operates acceptably at LOS A and is expected to continue operating at LOS A under Existing plus Project, Future, and Future plus Project conditions.
Sight distance at the project driveway is adequate.
A left-turn lane is not warranted on Broadway at the project driveway based on volumes, but should be provided to improve access and safety.
Pedestrian, bike and transit facilities are adequate.
Trucks loading and unloading on the south side of Clay Street are not expected to interfere with access for vehicles traveling on Clay Street.
Recommendations
Any vegetation at the project driveway should be planted and maintained so it is low-lying. Additionally, red curb should be painted on either side of the driveway for 20 feet.
A two-way left-turn lane on Broadway designed to Caltrans specifications should be installed to connect to existing turn lane striping to the north and south.

16
Traffic Impact Study for the Altamira Family Apartments June 7, 2017
Study Participants and References
Study Participants
Principal in Charge Dalene J. Whitlock, PE, PTOE Assistant Engineer Lauren Davini, EIT Graphics Hannah Yung Editing/Formatting Corinne Rasmussen, Hannah Yung Report Review Dalene J. Whitlock, PE, PTOE
References
City of Sonoma 2020 General Plan, City of Sonoma, 2006 City of Sonoma General Plan: 2016 Circulation Element, 2016 Highway Capacity Manual, Transportation Research Board, 2010 Highway Design Manual, 6th Edition, California Department of Transportation, 2012 Intersection Channelization Design Guide, National Cooperative Highway Research Program (NCHRP) Report No.
279, Transportation Research Board, 1985 Statewide Integrated Traffic Records System (SWITRS), California Highway Patrol, 2012-2016 Sonoma Bicycle & Pedestrian Master Plan, Sonoma County Transportation Authority, 2008 (Updated 2014) Sonoma County Transit, http://sctransit.com/ Sonoma Municipal Code, Code Publishing Company, 2016 Trip Generation Manual, 9th Edition, Institute of Transportation Engineers, 2012
SON045-1

A
Traffic Impact Study for the Sonoma Family Housing Project June 2017
Appendix A
Collision Rate Calculations


Date of Count:
Number of Collisions: 1Number of Injuries: 0
Number of Fatalities: 0ADT: 10500
Start Date: End Date:
Number of Years: 5
Intersection Type: TeeControl Type: Stop & Yield Controls
Area: Urban
1 x10,500 x x 5
Study Intersection 0.05 c/mveStatewide Average* 0.18 c/mve
c/mve = collisions per million vehicles entering intersection* 2013 Collision Data on California State Highways, Caltrans
TIS for Altamira Family Apartments
Tuesday, March 28, 2017
Intersection Collision Rate Calculations
July 1, 2011June 30, 2016
Intersection # Broadway & Clay St
36.4%
ADT = average daily total vehicles entering intersection
1:
Collision Rate Injury Rate
collision rate = 365
Number of Collisions x 1 Million
0.7%
collision rate = ADT x 365 Days per Year x Number of Years
0.0%
1,000,000
Fatality Rate0.0%
Whitlock & Weinberger Transportation, Inc.5/10/2017
Page 1 of 1


B
Traffic Impact Study for the Sonoma Family Housing Project June 2017
Appendix B
Intersection Level of Service Calculations


HC
M 2
010
TW
SC
1: B
road
way
& C
lay
Str
eet
04/27
/2017
Sync
hro 8
Rep
ort
Altam
ira F
amily
Apa
rtmen
ts TI
S AM
Exis
ting
W-T
rans
Inter
secti
onInt
Dela
y, s/v
eh0.7
Move
ment
EBL
EBR
NBL
NBT
SBT
SBR
Lane
Con
figur
ation
sTr
affic
Vol, v
eh/h
1720
864
251
314
Futur
e Vol,
veh/h
1720
864
251
314
Confl
icting
Ped
s, #/h
r0
00
00
0Si
gn C
ontro
l St
opSt
opFr
eeFr
eeFr
eeFr
eeRT
Cha
nneli
zed
-No
ne-
None
-No
neSt
orag
e Len
gth0
-50
--
-Ve
h in M
edian
Stor
age,
#0
--
00
-Gr
ade,
%0
--
00
-Pe
ak H
our F
actor
8888
8888
8888
Heav
y Veh
icles
, %2
22
22
2Mv
mt F
low19
239
730
583
16
Major
/Mino
rMi
nor2
Major
1Ma
jor2
Confl
icting
Flow
All
1339
591
599
0-
0
S
tage 1
591
--
--
-
S
tage 2
748
--
--
-Cr
itical
Hdwy
6.42
6.22
4.12
--
-Cr
itical
Hdwy
Stg
15.4
2-
--
--
Critic
al Hd
wy S
tg 2
5.42
--
--
-Fo
llow-
up H
dwy
3.518
3.318
2.218
--
-Po
t Cap
-1 M
aneu
ver
168
507
978
--
-
S
tage 1
553
--
--
-
S
tage 2
468
--
--
-Pl
atoon
bloc
ked,
%-
--
Mov C
ap-1
Man
euve
r16
650
797
8-
--
Mov C
ap-2
Man
euve
r16
6-
--
--
Stag
e 155
3-
--
--
Stag
e 246
4-
--
--
Appr
oach
EBNB
SBHC
M Co
ntrol
Delay
, s21
.40.1
0HC
M LO
SC
Mino
r Lan
e/Majo
r Mvm
tNB
LNB
TEBL
n1SB
TSB
RCa
pacit
y (ve
h/h)
978
-26
1-
-HC
M La
ne V
/C R
atio
0.009
-0.1
61-
-HC
M Co
ntrol
Delay
(s)
8.7-
21.4
--
HCM
Lane
LOS
A-
C-
-HC
M 95
th %
tile Q
(veh)
0-
0.6-
-
HC
M 2
010
TW
SC
1: B
road
way
& C
lay
Str
eet
04/27
/2017
Sync
hro 8
Rep
ort
Altam
ira F
amily
Apa
rtmen
tsTIS
PM
Exis
ting
W-T
rans
Inter
secti
onInt
Dela
y, s/v
eh0.3
Move
ment
EBL
EBR
NBL
NBT
SBT
SBR
Lane
Con
figur
ation
sTr
affic
Vol, v
eh/h
67
948
053
014
Futur
e Vol,
veh/h
67
948
053
014
Confl
icting
Ped
s, #/h
r0
00
00
0Si
gn C
ontro
l St
opSt
opFr
eeFr
eeFr
eeFr
eeRT
Cha
nneli
zed
-No
ne-
None
-No
neSt
orag
e Len
gth0
-50
--
-Ve
h in M
edian
Stor
age,
#0
--
00
-Gr
ade,
%0
--
00
-Pe
ak H
our F
actor
9696
9696
9696
Heav
y Veh
icles
, %2
22
22
2Mv
mt F
low6
79
500
552
15
Major
/Mino
rMi
nor2
Major
1Ma
jor2
Confl
icting
Flow
All
1078
559
567
0-
0
S
tage 1
559
--
--
-
S
tage 2
519
--
--
-Cr
itical
Hdwy
6.42
6.22
4.12
--
-Cr
itical
Hdwy
Stg
15.4
2-
--
--
Critic
al Hd
wy S
tg 2
5.42
--
--
-Fo
llow-
up H
dwy
3.518
3.318
2.218
--
-Po
t Cap
-1 M
aneu
ver
242
529
1005
--
-
S
tage 1
572
--
--
-
S
tage 2
597
--
--
-Pl
atoon
bloc
ked,
%-
--
Mov C
ap-1
Man
euve
r24
052
910
05-
--
Mov C
ap-2
Man
euve
r24
0-
--
--
Stag
e 157
2-
--
--
Stag
e 259
2-
--
--
Appr
oach
EBNB
SBHC
M Co
ntrol
Delay
, s16
0.20
HCM
LOS
C
Mino
r Lan
e/Majo
r Mvm
tNB
LNB
TEBL
n1SB
TSB
RCa
pacit
y (ve
h/h)
1005
-34
0-
-HC
M La
ne V
/C R
atio
0.009
-0.0
4-
-HC
M Co
ntrol
Delay
(s)
8.6-
16-
-HC
M La
ne LO
SA
-C
--
HCM
95th
%tile
Q(ve
h)0
-0.1
--
HC
M 2
010
TW
SC
1: B
road
way
& C
lay
Str
eet
04/27
/2017
Sync
hro 8
Rep
ort
Altam
ira F
amily
Apa
rtmen
tsTIS
AM
Futu
reW
-Tra
ns
Inter
secti
onInt
Dela
y, s/v
eh0.9
Move
ment
EBL
EBR
NBL
NBT
SBT
SBR
Lane
Con
figur
ation
sTr
affic
Vol, v
eh/h
2630
1268
857
321
Futur
e Vol,
veh/h
2630
1268
857
321
Confl
icting
Ped
s, #/h
r0
00
00
0Si
gn C
ontro
l St
opSt
opFr
eeFr
eeFr
eeFr
eeRT
Cha
nneli
zed
-No
ne-
None
-No
neSt
orag
e Len
gth0
-50
--
-Ve
h in M
edian
Stor
age,
#0
--
00
-Gr
ade,
%0
--
00
-Pe
ak H
our F
actor
100
100
100
100
100
100
Heav
y Veh
icles
, %2
22
22
2Mv
mt F
low26
3012
688
573
21
Major
/Mino
rMi
nor2
Major
1Ma
jor2
Confl
icting
Flow
All
1296
584
594
0-
0
S
tage 1
584
--
--
-
S
tage 2
712
--
--
-Cr
itical
Hdwy
6.42
6.22
4.12
--
-Cr
itical
Hdwy
Stg
15.4
2-
--
--
Critic
al Hd
wy S
tg 2
5.42
--
--
-Fo
llow-
up H
dwy
3.518
3.318
2.218
--
-Po
t Cap
-1 M
aneu
ver
179
512
982
--
-
S
tage 1
557
--
--
-
S
tage 2
486
--
--
-Pl
atoon
bloc
ked,
%-
--
Mov C
ap-1
Man
euve
r17
751
298
2-
--
Mov C
ap-2
Man
euve
r17
7-
--
--
Stag
e 155
7-
--
--
Stag
e 248
0-
--
--
Appr
oach
EBNB
SBHC
M Co
ntrol
Delay
, s21
.60.1
0HC
M LO
SC
Mino
r Lan
e/Majo
r Mvm
tNB
LNB
TEBL
n1SB
TSB
RCa
pacit
y (ve
h/h)
982
-27
3-
-HC
M La
ne V
/C R
atio
0.012
-0.2
05-
-HC
M Co
ntrol
Delay
(s)
8.7-
21.6
--
HCM
Lane
LOS
A-
C-
-HC
M 95
th %
tile Q
(veh)
0-
0.8-
-
HC
M 2
010
TW
SC
1: B
road
way
& C
lay
Str
eet
04/27
/2017
Sync
hro 8
Rep
ort
Altam
ira F
amily
Apa
rtmen
ts TI
S PM
Futu
reW
-Tra
ns
Inter
secti
onInt
Dela
y, s/v
eh0.4
Move
ment
EBL
EBR
NBL
NBT
SBT
SBR
Lane
Con
figur
ation
sTr
affic
Vol, v
eh/h
911
1457
358
121
Futur
e Vol,
veh/h
911
1457
358
121
Confl
icting
Ped
s, #/h
r0
00
00
0Si
gn C
ontro
l St
opSt
opFr
eeFr
eeFr
eeFr
eeRT
Cha
nneli
zed
-No
ne-
None
-No
neSt
orag
e Len
gth0
-50
--
-Ve
h in M
edian
Stor
age,
#0
--
00
-Gr
ade,
%0
--
00
-Pe
ak H
our F
actor
100
100
100
100
100
100
Heav
y Veh
icles
, %2
22
22
2Mv
mt F
low9
1114
573
581
21
Major
/Mino
rMi
nor2
Major
1Ma
jor2
Confl
icting
Flow
All
1193
592
602
0-
0
S
tage 1
592
--
--
-
S
tage 2
601
--
--
-Cr
itical
Hdwy
6.42
6.22
4.12
--
-Cr
itical
Hdwy
Stg
15.4
2-
--
--
Critic
al Hd
wy S
tg 2
5.42
--
--
-Fo
llow-
up H
dwy
3.518
3.318
2.218
--
-Po
t Cap
-1 M
aneu
ver
206
506
975
--
-
S
tage 1
553
--
--
-
S
tage 2
547
--
--
-Pl
atoon
bloc
ked,
%-
--
Mov C
ap-1
Man
euve
r20
350
697
5-
--
Mov C
ap-2
Man
euve
r20
3-
--
--
Stag
e 155
3-
--
--
Stag
e 253
9-
--
--
Appr
oach
EBNB
SBHC
M Co
ntrol
Delay
, s17
.70.2
0HC
M LO
SC
Mino
r Lan
e/Majo
r Mvm
tNB
LNB
TEBL
n1SB
TSB
RCa
pacit
y (ve
h/h)
975
-30
3-
-HC
M La
ne V
/C R
atio
0.014
-0.0
66-
-HC
M Co
ntrol
Delay
(s)
8.7-
17.7
--
HCM
Lane
LOS
A-
C-
-HC
M 95
th %
tile Q
(veh)
0-
0.2-
-

HC
M 2
010
TW
SC
1: B
road
way
& C
lay
Str
eet
04/27
/2017
Sync
hro 8
Rep
ort
Altam
ira F
amily
Apa
rtmen
ts TI
S AM
Exis
ting p
lus P
rojec
tW
-Tra
ns
Inter
secti
onInt
Dela
y, s/v
eh0.7
Move
ment
EBL
EBR
NBL
NBT
SBT
SBR
Lane
Con
figur
ation
sTr
affic
Vol, v
eh/h
1720
864
552
314
Futur
e Vol,
veh/h
1720
864
552
314
Confl
icting
Ped
s, #/h
r0
00
00
0Si
gn C
ontro
l St
opSt
opFr
eeFr
eeFr
eeFr
eeRT
Cha
nneli
zed
-No
ne-
None
-No
neSt
orag
e Len
gth0
-50
--
-Ve
h in M
edian
Stor
age,
#0
--
00
-Gr
ade,
%0
--
00
-Pe
ak H
our F
actor
8888
8888
8888
Heav
y Veh
icles
, %2
22
22
2Mv
mt F
low19
239
733
594
16
Major
/Mino
rMi
nor2
Major
1Ma
jor2
Confl
icting
Flow
All
1353
602
610
0-
0
S
tage 1
602
--
--
-
S
tage 2
751
--
--
-Cr
itical
Hdwy
6.42
6.22
4.12
--
-Cr
itical
Hdwy
Stg
15.4
2-
--
--
Critic
al Hd
wy S
tg 2
5.42
--
--
-Fo
llow-
up H
dwy
3.518
3.318
2.218
--
-Po
t Cap
-1 M
aneu
ver
165
500
969
--
-
S
tage 1
547
--
--
-
S
tage 2
466
--
--
-Pl
atoon
bloc
ked,
%-
--
Mov C
ap-1
Man
euve
r16
350
096
9-
--
Mov C
ap-2
Man
euve
r16
3-
--
--
Stag
e 154
7-
--
--
Stag
e 246
2-
--
--
Appr
oach
EBNB
SBHC
M Co
ntrol
Delay
, s21
.80.1
0HC
M LO
SC
Mino
r Lan
e/Majo
r Mvm
tNB
LNB
TEBL
n1SB
TSB
RCa
pacit
y (ve
h/h)
969
-25
6-
-HC
M La
ne V
/C R
atio
0.009
-0.1
64-
-HC
M Co
ntrol
Delay
(s)
8.8-
21.8
--
HCM
Lane
LOS
A-
C-
-HC
M 95
th %
tile Q
(veh)
0-
0.6-
-
HC
M 2
010
TW
SC
1: B
road
way
& C
lay
Str
eet
04/27
/2017
Sync
hro 8
Rep
ort
Altam
ira F
amily
Apa
rtmen
ts TI
S PM
Exis
ting p
lus P
rojec
tW
-Tra
ns
Inter
secti
onInt
Dela
y, s/v
eh0.3
Move
ment
EBL
EBR
NBL
NBT
SBT
SBR
Lane
Con
figur
ation
sTr
affic
Vol, v
eh/h
67
949
053
514
Futur
e Vol,
veh/h
67
949
053
514
Confl
icting
Ped
s, #/h
r0
00
00
0Si
gn C
ontro
l St
opSt
opFr
eeFr
eeFr
eeFr
eeRT
Cha
nneli
zed
-No
ne-
None
-No
neSt
orag
e Len
gth0
-50
--
-Ve
h in M
edian
Stor
age,
#0
--
00
-Gr
ade,
%0
--
00
-Pe
ak H
our F
actor
9696
9696
9696
Heav
y Veh
icles
, %2
22
22
2Mv
mt F
low6
79
510
557
15
Major
/Mino
rMi
nor2
Major
1Ma
jor2
Confl
icting
Flow
All
1094
565
572
0-
0
S
tage 1
565
--
--
-
S
tage 2
529
--
--
-Cr
itical
Hdwy
6.42
6.22
4.12
--
-Cr
itical
Hdwy
Stg
15.4
2-
--
--
Critic
al Hd
wy S
tg 2
5.42
--
--
-Fo
llow-
up H
dwy
3.518
3.318
2.218
--
-Po
t Cap
-1 M
aneu
ver
237
524
1001
--
-
S
tage 1
569
--
--
-
S
tage 2
591
--
--
-Pl
atoon
bloc
ked,
%-
--
Mov C
ap-1
Man
euve
r23
552
410
01-
--
Mov C
ap-2
Man
euve
r23
5-
--
--
Stag
e 156
9-
--
--
Stag
e 258
6-
--
--
Appr
oach
EBNB
SBHC
M Co
ntrol
Delay
, s16
.20.2
0HC
M LO
SC
Mino
r Lan
e/Majo
r Mvm
tNB
LNB
TEBL
n1SB
TSB
RCa
pacit
y (ve
h/h)
1001
-33
4-
-HC
M La
ne V
/C R
atio
0.009
-0.0
41-
-HC
M Co
ntrol
Delay
(s)
8.6-
16.2
--
HCM
Lane
LOS
A-
C-
-HC
M 95
th %
tile Q
(veh)
0-
0.1-
-

HC
M 2
010
TW
SC
1: B
road
way
& C
lay
Str
eet
04/27
/2017
Sync
hro 8
Rep
ort
Altam
ira F
amily
Apa
rtmen
ts TI
S AM
Futu
re pl
us P
rojec
tW
-Tra
ns
Inter
secti
onInt
Dela
y, s/v
eh1
Move
ment
EBL
EBR
NBL
NBT
SBT
SBR
Lane
Con
figur
ation
sTr
affic
Vol, v
eh/h
2630
1269
158
321
Futur
e Vol,
veh/h
2630
1269
158
321
Confl
icting
Ped
s, #/h
r0
00
00
0Si
gn C
ontro
l St
opSt
opFr
eeFr
eeFr
eeFr
eeRT
Cha
nneli
zed
-No
ne-
None
-No
neSt
orag
e Len
gth0
-50
--
-Ve
h in M
edian
Stor
age,
#0
--
00
-Gr
ade,
%0
--
00
-Pe
ak H
our F
actor
100
100
100
100
100
100
Heav
y Veh
icles
, %2
22
22
2Mv
mt F
low26
3012
691
583
21
Major
/Mino
rMi
nor2
Major
1Ma
jor2
Confl
icting
Flow
All
1309
594
604
0-
0
S
tage 1
594
--
--
-
S
tage 2
715
--
--
-Cr
itical
Hdwy
6.42
6.22
4.12
--
-Cr
itical
Hdwy
Stg
15.4
2-
--
--
Critic
al Hd
wy S
tg 2
5.42
--
--
-Fo
llow-
up H
dwy
3.518
3.318
2.218
--
-Po
t Cap
-1 M
aneu
ver
176
505
974
--
-
S
tage 1
552
--
--
-
S
tage 2
485
--
--
-Pl
atoon
bloc
ked,
%-
--
Mov C
ap-1
Man
euve
r17
450
597
4-
--
Mov C
ap-2
Man
euve
r17
4-
--
--
Stag
e 155
2-
--
--
Stag
e 247
9-
--
--
Appr
oach
EBNB
SBHC
M Co
ntrol
Delay
, s21
.90.1
0HC
M LO
SC
Mino
r Lan
e/Majo
r Mvm
tNB
LNB
TEBL
n1SB
TSB
RCa
pacit
y (ve
h/h)
974
-26
8-
-HC
M La
ne V
/C R
atio
0.012
-0.2
09-
-HC
M Co
ntrol
Delay
(s)
8.7-
21.9
--
HCM
Lane
LOS
A-
C-
-HC
M 95
th %
tile Q
(veh)
0-
0.8-
-
HC
M 2
010
TW
SC
1: B
road
way
& C
lay
Str
eet
04/27
/2017
Sync
hro 8
Rep
ort
Altam
ira F
amily
Apa
rtmen
ts TI
S PM
Futu
re pl
us P
rojec
tW
-Tra
ns
Inter
secti
onInt
Dela
y, s/v
eh0.4
Move
ment
EBL
EBR
NBL
NBT
SBT
SBR
Lane
Con
figur
ation
sTr
affic
Vol, v
eh/h
911
1458
358
621
Futur
e Vol,
veh/h
911
1458
358
621
Confl
icting
Ped
s, #/h
r0
00
00
0Si
gn C
ontro
l St
opSt
opFr
eeFr
eeFr
eeFr
eeRT
Cha
nneli
zed
-No
ne-
None
-No
neSt
orag
e Len
gth0
-50
--
-Ve
h in M
edian
Stor
age,
#0
--
00
-Gr
ade,
%0
--
00
-Pe
ak H
our F
actor
100
100
100
100
100
100
Heav
y Veh
icles
, %2
22
22
2Mv
mt F
low9
1114
583
586
21
Major
/Mino
rMi
nor2
Major
1Ma
jor2
Confl
icting
Flow
All
1208
597
607
0-
0
S
tage 1
597
--
--
-
S
tage 2
611
--
--
-Cr
itical
Hdwy
6.42
6.22
4.12
--
-Cr
itical
Hdwy
Stg
15.4
2-
--
--
Critic
al Hd
wy S
tg 2
5.42
--
--
-Fo
llow-
up H
dwy
3.518
3.318
2.218
--
-Po
t Cap
-1 M
aneu
ver
202
503
971
--
-
S
tage 1
550
--
--
-
S
tage 2
542
--
--
-Pl
atoon
bloc
ked,
%-
--
Mov C
ap-1
Man
euve
r19
950
397
1-
--
Mov C
ap-2
Man
euve
r19
9-
--
--
Stag
e 155
0-
--
--
Stag
e 253
4-
--
--
Appr
oach
EBNB
SBHC
M Co
ntrol
Delay
, s17
.90.2
0HC
M LO
SC
Mino
r Lan
e/Majo
r Mvm
tNB
LNB
TEBL
n1SB
TSB
RCa
pacit
y (ve
h/h)
971
-29
8-
-HC
M La
ne V
/C R
atio
0.014
-0.0
67-
-HC
M Co
ntrol
Delay
(s)
8.8-
17.9
--
HCM
Lane
LOS
A-
C-
-HC
M 95
th %
tile Q
(veh)
0-
0.2-
-

C
Traffic Impact Study for the Sonoma Family Housing Project June 2017
Appendix C
Site Access


CLAY ST
BR
OA
DW
AY
(S
R 1
2)
20
'2
0'
15
'
6'
Altam
ira F
am
ily A
partm
ents
Sight D
istance E
xhibit
SON
045-
18
May
201
7
N.T
.S
.

(veh/hr) (veh/hr)
527 659
2 3
Southbound Speed Limit: 35 mph Northbound Speed Limit: 35 mphSouthbound Configuration: Northbound Configuration:
1. Check for right turn volume criteria %lt 0.5 %
AV 1153 veh/hr
2. Check advance volume threshold criteria for turn laneAV = 1035.1Va = 529
No
NO
Right Turn Taper Warrants
1. Check taper volume criteria
2. Check advance volume threshold criteria for taperAV = - Study Intersection
NO NO
= Through Volume
Broadway (SR 12)
Right Turn Taper Warranted: Left Turn Lane Warranted:
(evaluate if right turn lane is unwarranted)
Va = 529 mph
Right Turn Lane Warranted:
If AV<Va then warrant is metAdvancing Volume
Turn Lane Warrant Analysis - Tee Intersections
Direction of Analysis Street: Cross Street Intersects:
The left turn lane analysis is based on work conducted by M.D. Harmelink in 1967, and modified by Kikuchi and Chakroborty in 1991.
Advancing Volume Threshold
Advancing Volume Threshold
The right turn lane and taper analysis is based on work conducted by Cottrell in 1981.
-
Methodology based on Washington State Transportation Center Research Report Method For Prioritizing Intersection Improvements , January 1997.
Through Volume =
Turn lane warranted if point falls to right of warrant threshold line
Two lane roadway warrant threshold for: 35
NOT WARRANTED - Less than 20 vehicles
If AV<Va then warrant is met
Advancing Volume
Project Driveway
Percentage Left Turns
If AV<Va then warrant is met
Northbound
Advancing Volume Threshold
2 Lanes - Undivided
Southbound
Thresholds not met, continue to next step
Southbound Volumes Northbound Volumes
Right Turn Lane Warrants Left Turn Lane Warrants
Right Turn Volume = = Left Turn Volume
2 Lanes - Undivided
Southbound
Broadway (SR 12)
Study Intersection: Broadway (SR 12)/Project DrivewayStudy Scenario: AM Existing plus Project
North/South From the West
100
200
300
400
500
600
700
800
900
1000
0 200 400 600 800 1000
Op
po
sin
g V
olu
me
(V
o)
Advancing Volume (Va)
W-Trans 5/10/2017

(veh/hr) (veh/hr)
544 489
10 10
Southbound Speed Limit: 35 mph Northbound Speed Limit: 35 mphSouthbound Configuration: Northbound Configuration:
1. Check for right turn volume criteria %lt 2.0 %
AV 896 veh/hr
2. Check advance volume threshold criteria for turn laneAV = 975.1Va = 554
No
NO
Right Turn Taper Warrants
1. Check taper volume criteria
2. Check advance volume threshold criteria for taperAV = - Study Intersection
NO NO
Turn Lane Warrant Analysis - Tee IntersectionsStudy Intersection: Broadway (SR 12)/Project Driveway
Study Scenario: PM Existing plus Project
Direction of Analysis Street: North/South Cross Street Intersects: From the West
Southbound Right Turn Lane Warrants Northbound Left Turn Lane Warrants
Broadway (SR 12) Broadway (SR 12)
Southbound Volumes Northbound Volumes
Through Volume = = Through Volume
Right Turn Volume = = Left Turn Volume
2 Lanes - Undivided Project Driveway 2 Lanes - Undivided
Percentage Left Turns
Advancing Volume Threshold
Thresholds not met, continue to next step If AV<Va then warrant is met
Advancing Volume ThresholdAdvancing Volume
If AV<Va then warrant is met
Right Turn Lane Warranted:
Southbound(evaluate if right turn lane is unwarranted)
NOT WARRANTED - Less than 20 vehicles
Advancing Volume ThresholdAdvancing Volume Va = 554 Two lane roadway warrant threshold for:
The left turn lane analysis is based on work conducted by M.D. Harmelink in 1967, and modified by Kikuchi and Chakroborty in 1991.
mph
If AV<Va then warrant is met - Turn lane warranted if point falls to right of warrant threshold line
35
Right Turn Taper Warranted: Left Turn Lane Warranted:
Methodology based on Washington State Transportation Center Research Report Method For Prioritizing Intersection Improvements , January 1997. The right turn lane and taper analysis is based on work conducted by Cottrell in 1981.
100
200
300
400
500
600
700
800
900
1000
0 200 400 600 800 1000
Op
po
sin
g V
olu
me
(V
o)
Advancing Volume (Va)
W-Trans 5/10/2017

(veh/hr) (veh/hr)
607 592
10 10
Southbound Speed Limit: 35 mph Northbound Speed Limit: 35 mphSouthbound Configuration: Northbound Configuration:
1. Check for right turn volume criteria %lt 1.7 %
AV 874 veh/hr
2. Check advance volume threshold criteria for turn laneAV = 975.1Va = 617
No
NO
Right Turn Taper Warrants
1. Check taper volume criteria
2. Check advance volume threshold criteria for taperAV = - Study Intersection
NO NORight Turn Taper Warranted: Left Turn Lane Warranted:
Methodology based on Washington State Transportation Center Research Report Method For Prioritizing Intersection Improvements , January 1997. The right turn lane and taper analysis is based on work conducted by Cottrell in 1981.The left turn lane analysis is based on work conducted by M.D. Harmelink in 1967, and modified by Kikuchi and Chakroborty in 1991.
mph
If AV<Va then warrant is met - Turn lane warranted if point falls to right of warrant threshold line
35Advancing Volume Threshold
Advancing Volume Va = 617 Two lane roadway warrant threshold for:
Advancing Volume ThresholdAdvancing Volume
If AV<Va then warrant is met
Right Turn Lane Warranted:
Southbound(evaluate if right turn lane is unwarranted)
NOT WARRANTED - Less than 20 vehicles
Percentage Left Turns
Advancing Volume Threshold
Thresholds not met, continue to next step If AV<Va then warrant is met
Southbound Right Turn Lane Warrants Northbound Left Turn Lane Warrants
Broadway (SR 12) Broadway (SR 12)
Southbound Volumes Northbound Volumes
Through Volume = = Through Volume
Right Turn Volume = = Left Turn Volume
2 Lanes - Undivided Project Driveway 2 Lanes - Undivided
Study Scenario: PM Existing plus Project
Direction of Analysis Street: North/South Cross Street Intersects: From the West
Turn Lane Warrant Analysis - Tee IntersectionsStudy Intersection: Broadway (SR 12)/Project Driveway
0
200
400
600
800
1000
1200
0 500 1000 1500 2000
Op
po
sin
g V
olu
me
(V
o)
Advancing Volume (Va)
W-Trans 5/10/2017

CLAY ST
BR
OA
DW
AY
(S
R 1
2)
Altam
ira F
am
ily A
partm
ents
Broadw
ay T
wo-W
ay Left-T
urn Lane E
xhibit
SON
045-
18
May
201
7
N.T
.S
.