traffic engineering studies - an-najah national...
TRANSCRIPT

21-Aug-14
1
1
2.1 Spot Speed Studies
2.2 Volume Studies
2.3 Travel Time and Delay Studies
2.4 Parking Studies
Traffic Engineering Studies
2
• The availability of wide transportation network with
developed facilities is associated with several
problems such as:
– Highway-related accidents
– Congestion
– Delay
– Parking difficulties
• To understand the extent, location characteristics of
each problem, adequate information is necessary.
Traffic surveys and
studies
TRANSPORTATION SYSTEM ENGINEERING 2 , 61463

21-Aug-14
2
3TRANSPORTATION SYSTEM ENGINEERING 2 , 61463
•The Traffic studies may be grouped into three main
categories:
a) Inventories: Provide a list or graphic display of
existing information, such as:
� streets widths.
� parking spaces.
� transit routes.
� parking spaces.
4TRANSPORTATION SYSTEM ENGINEERING 2 , 61463
b) Administrative studies:
�using existing engineering records, available in
government agencies and department.
� Include the result or surveys which may involve field
measurements and aerial photographic.

21-Aug-14
3
5TRANSPORTATION SYSTEM ENGINEERING 2 , 61463
c) Dynamic Studies: Our Topic in this Chapter .
Involve the collection of data under operational conditions.
� Include studies of:
• Speed
• Traffic volume
• Delay
• Parking
• Crashes
6
2.1 Spot Speed Studies
TRANSPORTATION SYSTEM ENGINEERING 2 , 61463

21-Aug-14
4
7
Radar Cameras
• It is conducted to estimate the distribution of vehicle
speeds in a stream of traffic at a particular location
• Speed: rate of movement of a vehicle (km/h) or (mi/h)
• Identified speed characteristics is valid only for the traffic
and environmental conditions that exist at the time of
the study.TRANSPORTATION SYSTEM ENGINEERING 2 , 61463
8
• Establish parameters for traffic operation and control
– Speed zones, speed limit and passing restrictions
• Evaluate the effectiveness of traffic control devices
– variable message signs at work zones.
• Monitor the effect of speed enforcement programs
• Evaluate and or determine the adequacy of highway
geometric characteristics
• Evaluate the effect of speed on highway safety through
the analysis of crash data for different speed
characteristics
• Determine speed trends
• Determine whether complaints about speeding are validTRANSPORTATION SYSTEM ENGINEERING 2 , 61463

21-Aug-14
5
9
• Location: In general the following locations are used
– Represent different traffic conditions on a highway
– Mid-blocks of urban highways
– Straight, level sections of rural highways
– Any location to solve a specific traffic eng. problem
• Time: depend on purpose of the study
– Establish speed limits
– Study speed trends
– Study complaints
• Duration: To allow collect data for the specified number
of veh., usually 1 hour
Collected data should be unbiased
Off peak hours
TRANSPORTATION SYSTEM ENGINEERING 2 , 61463
Time of complaint
10
• Average Speed: the arithmetic mean of all vehicle speeds
(that is, the sum of all spot speeds divided by the number
of vehicles).
speed groups individual speeds
• Median speed: the speed at the middle value in a series
of spot speeds that are arranged in ascending order.
• Modal speed: the value of speed that occurs most
frequently in a sample of spot speeds
or
TRANSPORTATION SYSTEM ENGINEERING 2 , 61463

21-Aug-14
6
11
• The ith percentile spot speed: the value of spot speed
below which ith percent of the vehicles travel.
• Pace: range of speed, usually taken at 10 mph intervals,
that has the greatest number of observations.
• Standard deviation of speeds: a measure of the spread
of the individual speeds
or
12
• Sample size: the minimum sample size depends on the
precision level desired.
– Precision level: the degree of confidence that the sampling
error of a produced estimate will fall within a desired fixed
range, which is also considered as Confidence level
– Level of significance (α) = 100 - Confidence level
– Assuming that speeds follows normal distribution:
Commonly used confidence level for speed counts is 95%
TRANSPORTATION SYSTEM ENGINEERING 2 , 61463

21-Aug-14
7
13Example 4.1
TRANSPORTATION SYSTEM ENGINEERING 2 , 61463
where
N= minimum sample size
Z= number of standard deviations corresponding to the required confidence
level 1.96 for 95 percent confidence level (Table 4.1)
σ = standard deviation (km/h) or (mi/h)
d = limit of acceptable error in the average speed estimate (km/h) or (mi/h)
14
Manual
Automatic using devices; grouped into three categories:
1. Road Detectors: Speed data can be collected and
volume data as well.
- They are laid such that the
probability of closing the
connection of the meter by a
passing vehicle during a speed
measurement is reduced to a
minimum
- Road detectors are usually
separated by a distance of 1 to 5
metersTRANSPORTATION SYSTEM ENGINEERING 2 , 61463

21-Aug-14
8
15
1. Road Detectors
– Pneumatic tubes: laid across the lane in which data are to
be collected.
• Air impulse
• Two tubes are placed across
the lane, usually about 2-3 m apart
– Induction loops: a rectangular wire loop buried under the
roadway surface. It usually serves as the detector of a
resonant circuit.
• When a motor vehicle passes across it, a disturbance in the
electrical field is created.
• This results in an impulse being sent to the counter.
TRANSPORTATION SYSTEM ENGINEERING 2 , 61463
16
2. Radar Based
– Difference between the frequency of the transmitted signal and
that of the reflected signal is used to estimate vehicle speed
– Measurement accuracy dependents on the angle between
vehicle direction and the line between the radar and the vehicle
→ → → underestimates the speed
– Using radars at inconspicuous position, can significantly reduce
the effects upon drivers
Doppler Principle Meters
21-Aug-14
9
17
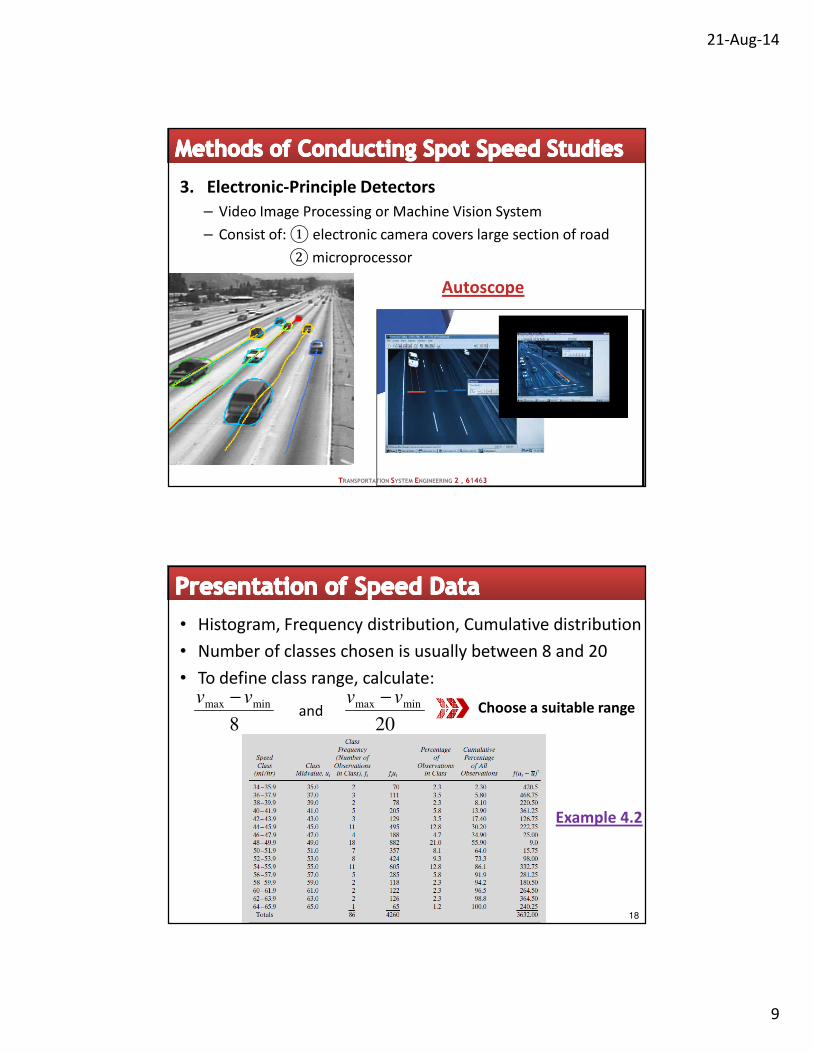
3. Electronic-Principle Detectors
– Video Image Processing or Machine Vision System
– Consist of: ① electronic camera covers large section of road
②microprocessor
Autoscope
TRANSPORTATION SYSTEM ENGINEERING 2 , 61463
18
• Histogram, Frequency distribution, Cumulative distribution
• Number of classes chosen is usually between 8 and 20
• To define class range, calculate:
8
minmaxvv −
and Choose a suitable range
Example 4.2
20
minmaxvv −

21-Aug-14
10
19
• To determine whether there is a significant difference
between the mean speeds of two spot speed studies.
There is significant
difference at the
confidence level
corresponding to ZExample 4.3