traffic calming of towns and villages on national roads
TRANSCRIPT

1
Evaluation of Traffic Calming Schemes Implemented 1997 ndash 2002
RS 472
Traffic Calming of Towns and Villages on National Roads
Evaluation of Schemes Implemented from 1997 to 2002
2
Evaluation of Traffic Calming Schemes Implemented 1997 ndash 2002
National Roads Authority St Martinrsquos House Waterloo Road Dublin 4 Tel 01 660 2511 Fax 01 668 0009 infonraie wwwnraie
3 3
Evaluation of Traffic Calming Schemes Implemented 1997 ndash 2002
RS 472 Road Safety Engineering
Traffic Calming of Towns and Villages on National Roads
Evaluation of Schemes Implemented from 1997 to 2002
August 2008
L Curtis
4
Evaluation of Traffic Calming Schemes Implemented 1997 ndash 2002
Evaluation of Traffic Calming Schemes Implemented 1997 ndash 2002
TABLE OF CONTENTS page
Acknowledgements IV
Foreword V
Executive Summary VII
1 INTRODUCTION 1
11 Scope of Report 1
12 Background to Traffic Calming 1
13 Traffic Calming on National Routes 1
14 Collisions 3
2 TRAFFIC CALMING SCHEMES 5
21 Criteria for Selection 5
22 Traffic Calming Measures 6
23 Amendments to Design in 2004 10
3 TRAFFIC CALMING SCHEMES 1997 - 2002 11
31 Schemes Implemented over Period 1997 - 2002 11
32 Towns and Villages With Only One End Treated 15
33 Different Designs of Scheme 16
4 EFFECTIVENESS IN REDUCING COLLISIONS 21
41 Collisions Before and After Scheme Implementation 21
42 Area of Influence of Traffic Calming Works 21
43 Control Data 21
44 Effect on Collision Occurrence 22
45 Statistical Significance 24
46 Collision Costs and Economic Evaluation 24
47 Results by Type of Scheme 25
48 Results By Type of Collision 27
49 Results for Towns and Villages Treated at One End Only 28
5 CASE STUDIES 29
51 Comparison of Types of Traffic Calming Schemes 29
52 Successful Schemes 33
6 CONCLUSIONS 39
61 Reduction in Collisions 39
62 Reduction in Comparison with Control Data 39
63 Reduction in Severity of Collisions 39
64 Cost Benefit Analysis 39
65 Effects of Different Types of Schemes 39
i
Evaluation of Traffic Calming Schemes Implemented 1997 ndash 2002
7 RECOMMENDATIONS 41
REFERENCES 43
APPENDIX A A1
Ranking of Sites According to Primary Criteria for Selection for Traffic Calming
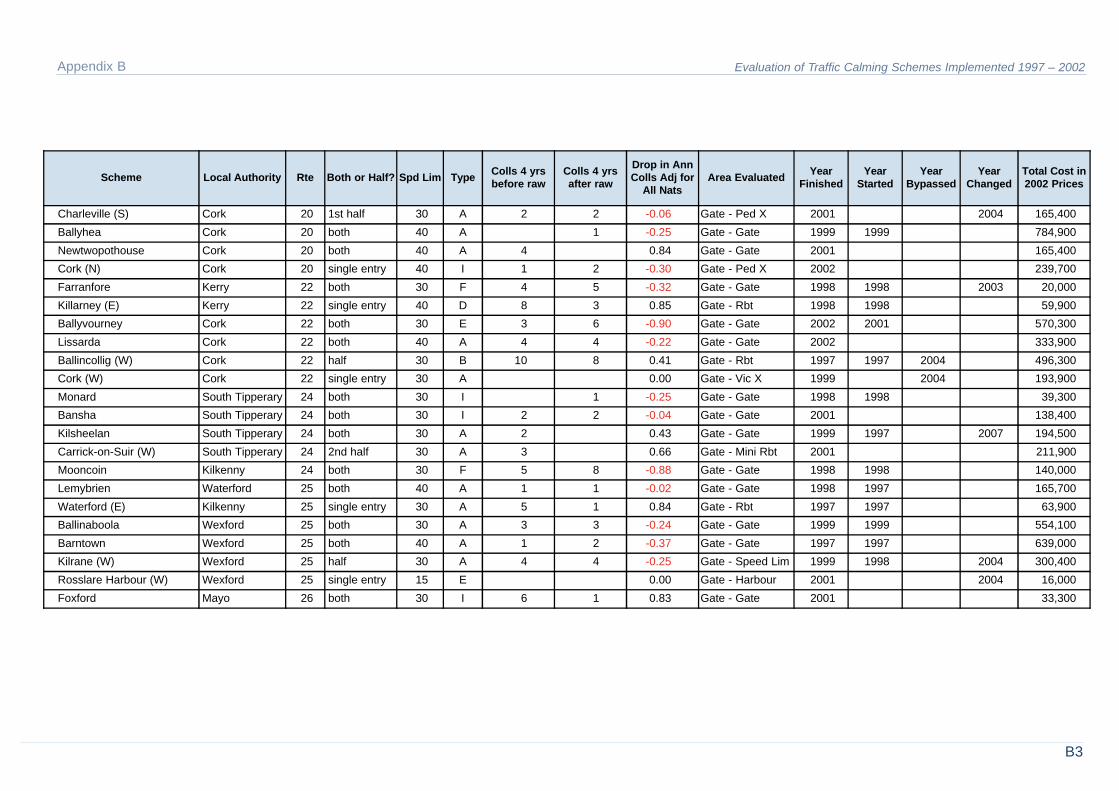
APPENDIX B B1
Scheme Details for All Sites
APPENDIX C C1
Collision Data Cost Data and First Year Rate of Return for All Sites
FIGURES AND TABLES
Summary Table
Figure 11 Approach to a typical village on national primary route 2
Figure 12 Typical wide entry into a town on national route 2
Figure 13 Typical wide open town centre with undefined road edge 3
Table 11 Collisions between 1994 and 1997 inside and outside urban areas 3
Table 21 Ranking of towns amp villages on national primary routes 5
Figure 21 Transition zone approaching village 7
Figure 22 A gateway 8
Figure 23 Inside gateway 9
Figure 24 Centre of village 10
Table 31 Schemes implemented per year 11
Table 32 Schemes implemented per year by county 12
Figure 31 Locations of traffic calming schemes 1997 to 2002 13
Table 33 Schemes implemented per year by route 14
Table 34 Types of traffic calming schemes 16
Figure 32 Typical gateway for types A B C and D 17
Figure 33 Typical gateway for types E F and G 18
Figure 34 Typical gateway for types H and I 18
Table 35 Types of traffic calming schemes by route 19
Table 41 Collisions before and after scheme implementation for each yearrsquos 22 programme
Table 42 Collision reductions for each yearrsquos programme 22
Table 43 Annual collision reductions for each yearrsquos programme 23
Table 44 Severities as a percentage of all collisions for each yearrsquos 23 programme
Table 45 Collision and cost saving for each yearrsquos programme 24
Table 46 Yearly rate of return 24
Table 47 Drop in collisions by type of scheme 26
ii
Evaluation of Traffic Calming Schemes Implemented 1997 ndash 2002
Table 48 Grouping type of scheme by type of gateway 26
Table 49 Types of scheme and their groupings 26
Table 410 Type of collision 27
Table 411 Division of schemes according to whether both ends were treated 28
Figure 51 Ballyshannon south approach 30
Figure 52 Ballybofey south approach 30
Figure 53 Ballybofey south zone inside gateway 31
Figure 54 Ballybofey south zone inside gateway 31
Figure 55 Killygordon west approach 32
Figure 56 Castlefinn west approach 32
Figure 57 Castlefinn centre before traffic calming 33
Figure 58 Castlefinn centre 33
Figure 59 Approach to a village similar to Grange before traffic calming 34
Figure 510 Gateway at Grange with central Island ndash Viewed from inside the 35village
Figure 511 Approach to Grange village centre from the north 35
Figure 512 Grange village centre 36
Figure 513 Approach to Newtwopothouse from north before traffic calming 37
Figure 514 Approach to Newtwopothouse from north 37
Figure 515 Crossroads at Newtwopothouse before traffic calming 38
Figure 516 Crossroads at Newtwopothouse with pedestrian crossing 38
iii
Evaluation of Traffic Calming Schemes Implemented 1997 ndash 2002
ACKNOWLEDGEMENTS
The NRA Road Safety Group which has funded the Traffic Calming programme since 1993
The NRA Regional Road Safety Engineers who not only co-ordinated the construction of the schemes but have also produced all the information and data used in this report
The Traffic Calming Working Group who first published Guidelines in 1999
The many Local Authority engineers who have designed and implemented the schemes
iv
Evaluation of Traffic Calming Schemes Implemented 1997 ndash 2002
FOREWORD
This report is the second in a series and examines the effectiveness of all traffic calming schemes that were completed between 1997 and 2002
It evaluates effectiveness by comparing collisions over four year periods both before and after construction of each scheme
A previous report ldquoEvaluation of Traffic Calming Schemes Constructed on National Roads 1993-1996rdquo covers schemes implemented before the period examined in this report
v
vi
Evaluation of Traffic Calming Schemes Implemented 1997 ndash 2002
Evaluation of Traffic Calming Schemes Implemented 1997 ndash 2002
EXECUTIVE SUMMARY In July 1998 the Government published ldquoThe Road to Safetyrdquo its strategy for road safety over the period 1998 ndash 2002 followed by a further strategy in 2004 for 2004 - 2006 A third Road to Safety document has recently been published setting out the governmentrsquos strategy for road safety over the period 2007 ndash 2012 with a target to reduce fatalities by 20 to 250 per year and to reduce injuries by 25 Under the terms of all strategies the National Roads Authority has been charged with undertaking a number of specific tasks In each of the strategies one of the tasks for NRA has been the implementation of traffic calming at towns and villages on the network of national roads and the evaluation of the effectiveness of these schemes This evaluation will enable NRA to prioritise the future programme of traffic calming by assessing the effectiveness of implemented schemes and identifying the successes of previous programmes
This report examines traffic calming schemes constructed between 1997 and 2002 It describes the principle behind traffic calming in reducing speed by altering the appearance of the road on the approach to the townvillage through the use of ldquogatewaysrdquo and by further traffic management measures within the town itself It lists the schemes undertaken in each of the six years from 1997 to 2002 and summarises the pershyformance of these schemes The report measures the effectiveness of the programmes based on collision data for a 4 year before period and a 4 year after period for each scheme
The objective of the traffic calming programme is to reduce the number and severity of collisions occurring in the treated towns and villages by reducing speed at these locations It has achieved that objective reducing the overall number of collisions by 13 Moreover the number of fatal collisions was reduced by 52 thus lowering the overall severity of crashes at traffic calming locations The number of serious and minor injury collisions decreased by 9
Between 1997 and 2002 there were 94 traffic calming schemes completed at towns and villages on the national roads 91 of these were evaluated and a summary of the results is shown below
Summary Table
Year of Completion
No of Schemes
Cost of Construction
euro
Reduction in Collisions (4 years adjusted)
Cost saving in Collisions per
year euro
Yearly Rate of Return
Fatal Serious Minor 1997 12 euro3024600 6 -6 1 euro2655300 88 1998 14 euro1852900 2 -2 -1 euro865600 47 1999 18 euro5369900 3 5 14 euro2177500 41 2000 9 euro1882000 -1 -4 6 -euro1034500 -55 2001 23 euro3881400 6 -4 25 euro3587700 92 2002 15 euro3446600 1 1 -7 euro641800 19
All Years 91 euro19457200 16 -10 37 euro8893400 46
The above table shows that comparing the four year period before with the four year period after each scheme and allowing for the overall decrease in collisions over the same period nationwide at similar sites there was an overall reduction of 43 collisions Fatal collisions reduced by 16 and minor injury collisions by 37 while serious injury collisions increased by 10 The cost (in 2002 market prices) of all the schemes constructed between 1997 and 2002 was just under euro195 million and the overall annual cost saving in collisions nearly euro89 million The Yearly Rate of Return of each yearrsquos programme varied quite considerably but averaged at 46 In cost benefit terms the schemes effectively paid for themselves within 2 years and are still creating annual savings of euro9m every year into the future
vii
viii
Evaluation of Traffic Calming Schemes Implemented 1997 ndash 2002
Evaluation of Traffic Calming Schemes Implemented 1997 ndash 2002
1 INTRODUCTION
11 Scope of Report In July 1998 the Government published ldquoThe Road to Safetyrdquo its strategy for road safety over the period 1998 ndash 2002 followed by a further strategy in 2004 for 2004 - 2006 The primary target of each of these was to reduce fatalities from road crashes by 20 from 1997 levels by 2002 and by 25 from average 1998 - 2003 levels by 2006 A third Road to Safety document has recently been published setting out the governmentrsquos strategy for road safety over the period 2007 ndash 2012 with a target to reduce fatalities by 20 to 250 per year and to reduce injuries by 25
Under the terms of all strategies the National Roads Authority has been charged with undertaking a number of specific tasks In each of the strategies one of the tasks for NRA has been the implementation of traffic calming at towns and villages on the network of national roads and the evaluation of the effectiveness of these schemes This evaluation will enable NRA to prioritise the future programme of traffic calming by assessing the effectiveness of implemented schemes and identifying the successes of previous programmes
This report examines traffic calming schemes constructed between 1997 and 2002 under the NRA programme of traffic calming for towns and villages located on national routes
12 Background to Traffic Calming Traffic calming is a way of reducing vehicle speeds by self-enforcing traffic engineering methods In Ireland two main types of traffic calming are used-
a) Traffic calming applied on national roads and other busy inter-urban roads to manage the speed of traffic passing through towns and villages located on these routes
b) Traffic calming on local urban and residential streets to manage both speed and volume of traffic on a number of streets within an area
Type a) is the form of traffic calming examined in this report
13 Traffic Calming on National Routes In towns and villages on the national road network reducing speed is the primary goal of traffic calming Posting of speed limits alone does not result in a significant reduction in speed (2005 Survey of Free Speeds NRA) since drivers typically drive at the speed they perceive as being safe A driverrsquos perception of what is safe is related to the design of the road which includes lane width curvature corner radii and available stopping-sight distance Traffic calming essentially reduces vehicle speeds by changing these elements of the roadrsquos design and thus driversrsquo perceptions of the road ahead
The transition zone between the high speed road approaching the village and the low speed street inside the village represents a difficult safety management problem In Ireland the problem first became apparent over twenty-five years ago with the proliferation of improved road sections with hard shoulders on the national roads Where these improved sections adjoined towns and villages approach speeds increased and the sections showed higher collision rates than rural sections
Many towns and villages are positioned on national roads Drivers travelling the national routes at speeds appropriate to through routes are often still travelling at those high speeds when entering towns and villages and maintain those speeds as they travel through the urban area Inside towns and villages the
1
Evaluation of Traffic Calming Schemes Implemented 1997 ndash 2002
national road usually functions as a typical main street with shops pubs housing school and church and their accompanying pedestrian and parking activity These types of activities would be more safely carried out in an environment where low speed prevails At higher speeds drivers have less time to react and are able to process less information in their field of view and the severity of injury is higher when a collision does occur For a pedestrian struck by a vehicle travelling at 64kmh the likelihood of them being killed is 85 at 48kmh the likelihood is 45 and at 32kmh it is 5 (ETSC Reducing Traffic Injuries Resulting From Excess and Inappropriate Speed 1995)
Figure 11 Approach to a typical village on national primary route
Figure 12 Typical wide entry into a town on national route
2
Evaluation of Traffic Calming Schemes Implemented 1997 ndash 2002
Figure 13 Typical wide open town centre with undefined road edge
14 Collisions The objective of the traffic calming programme is to reduce the number of collisions occurring in the treated towns and villages by reducing the speed of vehicles travelling through these locations In the four years before this programme of traffic calming started between 1994 and 1997 nearly half of the 9956 injury collisions on national roads occurred in urban areas Table 11 shows the breakdown of collision severity between rural and urban areas All areas where the speed limit at the time was 40mph or below were taken as ldquourbanrdquo
Table 11 Collisions between 1994 and 1997 inside and outside urban areas
Severity Urban National Roads Rural National Roads All National Roads
Fatal 161 531 692
Serious Injury 851 1573 2424
Minor Injury 3475 3365 6840
Total 4487 5469 9956
3
4
Evaluation of Traffic Calming Schemes Implemented 1997 ndash 2002
Evaluation of Traffic Calming Schemes Implemented 1997 ndash 2002
2 TRAFFIC CALMING SCHEMES
21 Criteria for Selection The criteria used for selection of towns and villages for traffic calming are set out in detail in the NRA document ldquoGuidelines On Traffic Calming For Towns And Villages On National Routesrdquo This was first published in 1999 and was updated in 2004
For the traffic calming programme over the years studied in this report (1997 ndash 2002) the criteria used to select sites for inclusion in the programme were those laid down in the Guidelines The period of implementation covered in this report starts in 1997 which was before the publication of the Guidelines However the principles were already in operation within the NRA Road Safety Group and the selection of sites in the early part of this period followed more or less the same process as the later ones
The main criterion was the collision history in and on approach to the village but data on all the following were collected when considering a location
Collisions Traffic flow Speed Geometry Future infrastructural developments
Collisions
The Guidelines states that selection based on collisions should take account of not just the simple collision numbers but should assess both risk per unit of travel and risk per head of population in the town or village In order to do this assessment a table was drawn up in 1999 listing these two risk categories for all towns and villages on national roads and ranking them according to a combination of the two categories The resulting table for national primary roads is reproduced in Appendix A but for illustration the 15 top ranking towns and villages on national primary roads are shown in Table 21 These 15 sites were all treated in the early years of the traffic calming programme 12 of them are among those examined in this report 3 were implemented before 1997 and were assessed in the preceding report to this
Table 21 Ranking of towns amp villages on national primary routes
Route Town Village Population AADT Length Colls over 5 yrs
Collisions per 10 Million VehKm
Collisions per year per
1000 Population
Combined Collision
Rate
N17 BALLINDINE 232 5058 0587 8 148 690 640
N25 KILRANE 214 5310 2255 10 46 935 559
N08 LITTLETON 566 5598 0591 10 166 353 508
N11 ASHFORD 500 12768 1352 19 60 760 501
N01 JULIANSTOWN 450 14270 1146 16 54 711 463
N05 FRENCHPARK 272 2994 0805 11 250 809 452
N02 COLLON 335 6164 0626 7 99 418 408
N18 KILCOLGAN 500 9565 0483 9 107 360 393
N08 WATERGRASSHILL 250 13706 0985 8 32 640 385
N01 CASTLEBELLINGHAM 762 10983 1891 20 53 525 368
N08 RATHCORMACK 500 11807 1158 11 44 440 308
N09 DUNGARVAN 500 3261 028 4 240 160 280
N04 DROMOD 250 3598 059 3 77 240 275
N20 CHARLEVILLE 3000 9655 1988 12 34 400 269
N25 LEMYBRIEN 222 6471 0918 4 37 360 254
5
Evaluation of Traffic Calming Schemes Implemented 1997 ndash 2002
Using the method of combining the two collision risk categories meant that small villages where there had been only a few collisions such as Dungarvan on N9 or Dromod on N4 ranked as highly as large towns with long lengths of national road and a higher number of collisions such as Charleville on N20 Thus several small villages where the actual collision numbers were low were given high priority in the traffic calming programme because the risk to road users from high speed traffic was comparatively high whereas many large towns with very much bigger numbers of actual collisions did not get priority
Speed
Selection is also based on the speed of vehicles in the towns and villages considered If speeds through a certain location were already low then that town or village was not given priority in the traffic calming programme Often this assessment would result in only one approach to a town or village being treated as described in section 32
Geometry
The other major criterion was the geometry of the road within the town or village considered If the separate physical elements that make up a traffic calming scheme especially that of narrowing the carriageway could not be applied to a certain location then a traffic calming scheme could not be fully implemented However several schemes were indeed implemented in towns and villages where the road width was already narrow prior to construction of the scheme These schemes often consisted of only signs and road markings this is discussed further in section 33
Other Factors
It must be acknowledged that several of the towns and villages assessed within this report did not have a collision history and did not have any record of high speeds before implementation of the traffic calming These sites were often selected for traffic calming because general road improvement work was scheduled at this location and traffic calming elements were incorporated into the work In some cases sites were selected solely on the basis of the perception of risk by residents and their representatives
22 Traffic Calming Measures The measures used as part of traffic calming break down into the four separate zones travelled through on approach to a town or village
bull the transition zone bull the gateway at the speed limit signs bull the zone inside the gateway bull the village centre
In small villages with a short length of national road there is usually no distinction between the last two zones but in the larger villages and towns there is often a zone which is inside the speed limited area yet cannot be described as a town centre These zones typically have either low density housing with off-street parking or warehouse-type commercial premises with sparsely spaced accesses
6
Evaluation of Traffic Calming Schemes Implemented 1997 ndash 2002
Transition Zone The principle behind traffic calming design is to change the driverrsquos perception of the surrounding environshyment
Figure 21 Transition zone approaching village
The ldquooptical widthrdquo perceived by the driver is dependent on the width between the boundaries of the road relative to the height of the adjoining vertical elements Generally in rural sections the width between fences is many times greater than the height of the hedges walls or fences which form the boundaries In urban streets the height of the buildings is generally greater than the width A driverrsquos perception of the appropriate driving speed is influenced by this relationship Speeds are lower where the height of the vertical elements is greater than the width of the road
Traffic calming aims to create a narrow optical width on the approach into towns and villages by using a combination of carriageway narrowing landscape treatment and the introduction of vertical elements such as signs lighting columns and trees Typically transition zone signs consist of a pair of ldquoTraffic Calming Aheadrdquo signs 400m from gateway and a pair of ldquoDo Not Passrdquo signs at 200m from the gateway
Gateway
The Gateway is placed at the start of the speed limited zone It should mark a definite change in the character of the surrounding area from rural to urban Therefore it needs to be conspicuous and the most prominent element in the transition zone The tall signs positioned close to the driving lane narrow the optical width
The guidelines recommend that where a town or village has two zones of speed limits first a 60kmh on the outskirts and then a 50kmh limit for the main body of the town the gateway should be placed at the change from 60kmh to 50kmh This is because usually the 50kmh limit has been placed at the edge of the properly built up area and the 60kmh zone covers the approach into the town where development is much less dense The design engineer can however choose to place the gateway at the 60kmh if surrounding development and environment are appropriate for this This has been done in a few of the cases examined
7
Evaluation of Traffic Calming Schemes Implemented 1997 ndash 2002
Figure 22 A gateway
Gateways fall into two distinct groups those with a solid kerbed central island and those with no island Early results from the first batch of traffic calming schemes constructed indicated that the presence of a central island at the gateway was a determining factor in the success of the scheme and the evaluation in this document confirms this The central island greatly increases the visual narrowing effect and the central lighting column signs and bollards are directly in the centre of the driverrsquos field of view
The gateway is always lit to a high standard with special gateway lanterns that shine directly onto the gateway signs This is not only effective in the dark during daylight hours the presence of lighting columns enhances the narrow optical width and is often noted subconsciously by the driver as an indication of an urban area
Inside Gateway
Treatment of the stretch of road between the gateway and the village centre is an important aspect of traffic calming The narrowing introduced at the gateway is continued so that the speed reduction occurring at the gateway is maintained on the driverrsquos journey through the town
This narrowing can be done by introducing any or all of the following central islands footpaths side kerb buildouts lining hatched markings and defined parking bays A shallow chicane can also sometimes be introduced by alternating side buildouts and parking between the two sides of the road The objectives are both to keep the driving lanes at no greater than 35m width and to give a visual impression to the driver of an urban area
Only narrowing and horizontal deflections are used as measures in traffic calming installations on national routes Vertical deflections such as humps or cushions are not appropriate because of the roadsrsquo function as main distributors between the major urban areas of the country Emergency vehicles and buses cannot easily negotiate routes where vertical deflection has been installed
As every gateway must be provided with lighting to illuminate the signs the infrastructure to supply street lighting needs to be provided at each end of the town or village It therefore follows that the supply for lightshying is usually available over the whole length of the village and lighting is provided over the full length of the scheme from gateway to gateway In the cases examined there are a few exceptions to this but even these few villages have street lighting for almost all of their length with only a few short gaps where no lamps are provided
8
Evaluation of Traffic Calming Schemes Implemented 1997 ndash 2002
Figure 23 Inside gateway
Town or Village Centre
In the town centre there is often not a need for narrowing works as part of the traffic calming as parking bays and footpaths may already exist However in locations where there is a wide road passing through the village centre it is necessary to narrow and define the through route with kerbing Even in locations where the through route is already well defined with kerbing and parking bays extra measures are usually required at junctions and where pedestrians wish to cross the national road or to cross side roads while walking along the main street
Typical works in the town centre are
bull definition of the limits of existing parking using kerb buildouts bull definition of junctions by the use of kerb buildouts bull provision of either pedestrian crossings or central islands to aid pedestrians in crossing
The main objective in the centre of the town or village is to provide a safe and pleasant environment that can easily be negotiated by vulnerable road users Thus it is important to provide safe places to cross where pedestrians are clearly visible to passing traffic and wide footpaths so that pedestrians are not forced to step into the road when passing others This often necessitates a reduction in the number of on street parking spaces and it can be difficult to persuade the local residents to accept this Extra off-street parking may have to be provided as part of the traffic calming scheme However there is a clear road safety advantage in both providing better facilities for pedestrians and in moving parking to off-street facilities Quite apart from the pedestrian collisions that result from vehicles reversing in and out of parking spaces and from parked vehicles masking crossing pedestrians as they step out onto the road many minor material damage collisions occur as vehicles pull in and out of parking spaces on busy through routes
9
Evaluation of Traffic Calming Schemes Implemented 1997 ndash 2002
Figure 24 Centre of village
23 Amendments to Design in 2004 The Guidelines on Traffic Calming were revised in 2004 Some of the changes made in this revision arose directly from problems encountered during construction and consequent operation of the schemes evaluated here There were numerous minor amendments but two of the main changes to design are worth notingshy
a) Increase of setback of signs The setback distance of the edge of the gateway signs from the kerb was originally specified as 600mm This width of setback was thought to provide enough clearance for overhanging loads on large vehicles while still giving the visual narrowing effect that was needed for the traffic calming gateway to be effective However in practice many gateway signs installed to this specification were hit glancing blows by passing large vehicles especially in areas where there was a significant proportion of agricultural vehicles in the mix of traffic
Consequently the specification was changed to a setback of 1m from the kerb So far this increased width appears to have succeeded in reducing the number of signs damaged by overhanging loads
b) Increase of ldquoexitrdquo width Where a central island is provided at a gateway the island and its signs and lighting column all form an obstruction for any abnormally wide load wishing to pass Whenever a wide load wishes to use the route through a village with this design of traffic calming the central lighting columns at each gateway must be temporarily disconnected and removed resulting in much inconvenience and an extra workload for the local authority and electricity supply engineers
To try to avoid this lengthy process of disconnection and removal an alternative design for gateways was put forward with extra width on the ldquoexitrdquo half of the gateway such that the width between edge kerb and central island on the lane for traffic approaching the village remains at the original 35m specified but the corresponding width on the lane for traffic leaving the village could be increased to anything up to 6m This design manages to keep the narrow optical effect for drivers approaching the village but provides an alternative route for wide loads which are guided through the approach to the village on the exit side of the central island
10
Evaluation of Traffic Calming Schemes Implemented 1997 ndash 2002
3 TRAFFIC CALMING SCHEMES 1997 - 2002
31 Schemes Implemented over Period 1997 - 2002 Between 1997 and 2002 there were 94 traffic calming schemes completed at towns and villages on the national roads Three of these schemes could not be evaluated because the collision data in the before period was considered to be unduly influenced by traffic calming on the other approach to the same village that had been implemented before 1997
The remaining 91 towns and villages have been assessed in this study
Table 31 below gives the number of schemes constructed per year and their costs Table 32 shows the spread across the different counties and Table 33 shows the spread across the national routes Figure 31 shows the locations of all the 94 schemes implemented in the period examined A detailed list of the 91 locations assessed and the measures implemented is given in Appendix B
Table 31 Schemes implemented per year
Year No of Schemes
Cost euro (market prices at
time of construction)
Cost euro (2002 prices)
Average Cost per Scheme euro
(2002 prices)
1997 12 1803000 3024500 252000
1998 14 1178800 1852900 132300
1999 18 3691800 5369900 298300
2000 9 1445200 1882000 209100
2001 23 3496400 3881300 168800
2002 15 3446600 3446600 229800
TOTALS 91 15061800 19457200 213800
The number of schemes constructed each year stayed roughly constant the average being about 15 or 16 per year There was a slight dip in the number finished in 2000 but there was a corresponding rise the next year The bulk of construction for most schemes took place within one year but where schemes carried on into following years it is the final year that is taken as the year of construction
The average cost per scheme was euro214000 over the six years All costs in this report are market prices given in 2002 prices The cost of an individual scheme varies immensely from euro16000 to euro785000 (See Appendix B) but the measures implemented in each scheme also varied greatly Some schemes were simply the installation of just 12 signs on approach to a village others included extensive urban renewal works including the complete restructuring of drainage and electricity supply for the village
Table 32 and Figure 31 show a fairly even spread of traffic calming implementation geographically across the country but it can be clearly seen in Table 33 that the majority of schemes implemented were on national primary roads Of all the schemes examined 81 are on primary routes and in the early years this division is even more marked with 88 of schemes implemented in 1997 and 1998 being on primary routes The fact that mainly primary routes were treated in the early years of the traffic calming programme can be directly attributed to the geometry of the national routes through these towns and villages Approaches to many urban areas on the primary routes had been realigned and widened during the twenty to thirty years preceding the traffic calming programme allowing traffic to approach the town or village at increased speed This increased speed and the consequent increase in collisions then identified these towns and villages as priority sites for traffic calming treatment On national secondary routes there had not
11
Evaluation of Traffic Calming Schemes Implemented 1997 ndash 2002
been such a widespread programme of realignment and widening and approaches to urban areas have mostly remained narrow Consequently on national secondary roads speeds are not so high on the approaches to urban areas collision rates also are not high and few towns and villages on secondary roads have met the criteria for the traffic calming programme
Table 32 Schemes implemented per year by county
Local Authority 1997 1998 1999 2000 2001 2002 Total
Cavan 1 1
Clare 2 2
Cork 2 3 2 4 11
Donegal 2 2 3 7
Galway 1 3 1 5
Kerry 2 2
Kildare 1 1
Kilkenny 1 1 2 4 8
Laois 2 2 4
Leitrim 1 1 2
Longford 1 1 2
Louth 4 1 5
Mayo 1 1 1 1 4
Meath 1 2 1 1 5
Monaghan 1 1 2 4
Offaly 1 2 3
Roscommon 2 2
Sligo 1 3 1 1 6
South Tipperary 2 1 2 5
Waterford 1 1
Westmeath 1 1 1 3
Wexford 1 2 2 2 7
Wicklow 1 1
Total 12 14 18 9 23 15 91
12
Evaluation of Traffic Calming Schemes Implemented 1997 ndash 2002
Figure 31 Locations of traffic calming schemes 1997 to 2002
13
Evaluation of Traffic Calming Schemes Implemented 1997 ndash 2002
Table 33 Schemes implemented per year by route
Route 1997 1998 1999 2000 2001 2002 Total
1 2 1 1 4
2 2 1 1 1 1 6
3 1 1
4 1 1 3 1 1 7
5 1 1 2
6 1 2 3
7 1 1 1 3
8 2 2
9 1 2 3
10 1 1 2
11 1 1 2
14 1 1
15 2 2 2 2 8
17 1 1 2
18 2 2 4
20 1 2 1 4
22 1 2 1 2 6
24 2 1 2 5
25 2 1 2 1 6
26 1 1
30 1 1 2
54 1 1
55 1 1
56 1 1
59 1 1 2
61 1 1
62 1 1
66 1 1
71 1 1 1 3
76 1 1
77 1 1
78 1 1
80 1 1
84 1 1
87 1 1
National Primary 11 12 15 8 19 9 74
National Secondary 1 2 3 1 4 6 17
Total 12 14 18 9 23 15 91
14
Evaluation of Traffic Calming Schemes Implemented 1997 ndash 2002
32 Towns and Villages With Only One End Treated
At 33 of the 94 locations implemented between 1997 and 2002 only one approach to the town or village was treated with traffic calming within this period
In 8 of these cases the one approach treated was the only entry of that route into a large town or city or into a coastal town where the route ended
In 6 of these towns and villages the other approach had already been treated in previous years before 1997 and the second treatment completed the traffic calming for the location In 3 of these villages it was considered that the first phase of traffic calming would have had an effect on collisions in the very same area that was influenced by the second phase Thus the ldquobeforerdquo data for the second phase of work would not have been usable and it was not possible to evaluate changes in collision data These are the three locations that have been removed from the evaluation The other three towns were large enough for the areas of influence from each phase of traffic calming not to overlap and consequently the collision data was not influenced by the first phase
In 2 towns the traffic calming within the study period 1997 - 2002 was the first phase in a two phase implementation and the second approach has since been treated in subsequent years In each of these towns the two areas of influence from the separate phases of work are considered not to overlap and so these two have been included in the study
For each scheme the ldquoevaluated areardquo over which the traffic calming is considered to have had an effect on collisions is described in the scheme details in Appendix B
In the other 17 cases the decision to treat only one approach was generally taken because the other end of town was not considered a suitable case for traffic calming The reasons for this were varied but broadly fell into two different categories
a) An existing feature in the road such as a right angled bend narrow bridge or a roundabout already acted as a measure to slow approaching traffic such as the northern approach to Ardee on N2 or the southern approach to Crusheen on N18
b) Traffic approaching the town or village from this particular direction was observed to be travelling slowly in general and did not need to be slowed further Usually this was because another nearby town or village had effectively slowed the traffic down and drivers had not yet regained the feel of an open road and speeded up The western approach from Dromod to Roosky on N4 and the southern approach from Ennis to Barefield on N18 are examples of this
15
Evaluation of Traffic Calming Schemes Implemented 1997 ndash 2002
33 Different Designs of Scheme
As traffic calming schemes are made up of all the different elements described in section 22 there is a very large number of variations possible but the 91 schemes examined can be broadly divided into 10 different types as follows-
A Gateway with side buildouts and central island Definition inside village using central islands and narrowing with kerbs
B Gateway with side buildouts and central island Definition inside village using narrowing with kerbs but no islands
C Gateway with side buildouts and central island Definition inside village using line marking only
D Gateway with side buildouts and central island No definition inside village
E Gateway with side buildouts only Definition inside village using central islands and narrowing with kerbs
F Gateway with side buildouts only Definition inside village using narrowing with kerbs but no islands
G Gateway with side buildouts only Definition inside village using line marking only
H Gateway signs only Definition inside village using line marking only
I Gateway signs only No definition inside village
J No gateway Definition inside village using narrowing with kerbs but no islands
Table 34 shows the number of schemes in each category and whether the traffic calming was done at both ends of the town or village or whether it was installed only at one end Towns and villages where traffic calming was constructed at only one end are indicated in Figure 31 and in the appendices lists by (W) (N) (E) or (S) following the town name
Table 34 Types of traffic calming schemes
Type Treatment no of villages
both ends
one end
A Central island gateway central islands amp narrowing with kerbs inside 39 29 10
B Central island gateway narrowing with kerbs amp no islands inside 8 3 5
C Central island gateway and lining 5 5
D Central island gateway and nothing else 1 1
E Simple gateway central islands amp narrowing with kerbs insides 10 5 5
F Simple gateway narrowing with kerbs amp no islands inside 11 10 1
G Simple gateway and lining 5 2 3
H Gateway signs and lining 3 3
I Gateway signs and nothing else 8 6 2
J No gateway narrowing with kerbs amp no islands inside 1 1
Total 91 64 27
16
Evaluation of Traffic Calming Schemes Implemented 1997 ndash 2002
The largest single category is type A with a gateway with side buildouts and central island with a string of central islands through the village approach and in the centre and also narrowing from the side with kerb buildouts through the approach and centre Most of the 39 schemes in this category give the full impression of a village at the point of passing the gateway and most have footpaths throughout the scheme from gateway to gateway They all have street lighting through the entire scheme
Another 14 sites have the full gateway with a central island and side buildouts but do not have such extensive works inside the village These fall into categories B C and D Types A B C and D are generally on national primary routes very few are on secondary routes Figure 32 illustrates a typical gateway into such a village where the wide carriageway is narrowed by kerbing the hard shoulder and inserting a central island
Figure 32 Typical gateway for types A B C and D
The next two biggest single categories are type E with 10 schemes and type F with 11 schemes These types along with type G have a gateway that has no central island but which does narrow the road using kerbed buildouts at the side of the road usually in the hard shoulder Types E F and G were installed at towns where the width of the approach into town was wide enough to warrant traffic calming but was less than the 157m minimum needed to accommodate central island signs and cycle bypass Types E F and G have varying degrees of definition work inside the village similar to types A B and C Figure 33 illustrates a typical gateway into such a village where the wide carriageway is narrowed by kerbing the hard shoulder but there is no central island
Types H and I do not have physical works at the gateway at all Typically there is no hard shoulder at these sites and the gateway signs and transition zone signs are simply installed on the verge In type H schemes some visual narrowing has been implemented inside the village using line markings and hatching but in type I there is nothing done other than installation of the gateway and transition zone signs The one scheme that was installed on a dual carriageway approach to a city falls into the category of type H Figure 34 illustrates a typical gateway into such a village where there is no narrowing or kerbs installed just signs placed in the verge
17
Evaluation of Traffic Calming Schemes Implemented 1997 ndash 2002
Figure 33 Typical gateway for types E F and G
Figure 34 Typical gateway for types H and I
One scheme examined in this report had neither gateway signs nor transition zone installed However extensive works were done in the centre of the small village to narrow the carriageway and define the parking areas behind kerbs This village does not fall into any the other categories and is the only type J in the study
For the purposes of examining results types A B C and D can be grouped together as a ldquoCentral Island Gatewayrdquo category types E F and G can be grouped together as a ldquoSimple Gatewayrdquo category and types H and I can be grouped together as a ldquoSigns Onlyrdquo category
Table 35 shows the incidence of each type of traffic calming scheme on each national routes Although there is a wide spread of types across all roads it can be seen that types A B C and D are mostly on the national primary roads while types H and I are largely on the national secondary routes and those sections of national primaries where widening has not taken place
18
Evaluation of Traffic Calming Schemes Implemented 1997 ndash 2002
Table 35 Types of traffic calming schemes by route
Route Type of Scheme
A B C D E F G H I J No in Study
1 1 1 1 1 4
2 4 1 1 6
3 1 1
4 2 3 1 1 7
5 1 1 2
6 1 2 3
7 1 1 1 3
8 2 2
9 1 2 3
10 1 1 2
11 1 1 2
14 1 1
15 4 1 1 2 8
17 1 1 2
18 2 1 1 4
20 3 1 4
22 2 1 1 1 1 6
24 2 1 2 5
25 5 1 6
26 1 1
30 1 1 2
54 1 1
55 1 1
56 1 1
59 2 2
61 1 1
62 1 1
66 1 1
71 1 1 1 3
76 1 1
77 1 1
78 1 1
80 1 1
84 1 1
87 1 1
National Primary 34 6 3 1 7 11 5 2 4 1 74
National Secondary 5 2 2 3 1 4 17
Total 39 8 5 1 10 11 5 3 8 1 91
19
20
Evaluation of Traffic Calming Schemes Implemented 1997 ndash 2002
Evaluation of Traffic Calming Schemes Implemented 1997 ndash 2002
4 EFFECTIVENESS IN REDUCING COLLISIONS
41 Collisions Before and After Scheme Implementation Collision numbers were measured at each of the 91 locations for the 4 years before and 4 years after implementation of each individual scheme The ldquoafterrdquo period was taken as beginning in the year after the final year of construction as the full effect of the scheme would not be noticeable during construction works Details of the collision data for each site are given in Appendix C but summary tables are given in this chapter
42 Area of Influence of Traffic Calming Works Collision numbers for both before and after data were taken from the map-based NRA Collision Database Only collisions taking place on the national routes were considered and any collision that was located within the length of road influenced by the traffic calming was included in the data This area of influence extended to 200m outside each gateway in order to take account of the effect of the transition zone Where only one side of a village was treated the area taken was from the gateway to the centre of the town Where an existing traffic calming feature existed within the speed limited zone on the entry into a town such as a sharp bend or a narrow bridge the area of influence was assumed to extend only as far as that feature Descriptions of the area of influence for each location are given in the detailed list of locations in Appendix B
43 Control Data This report takes account of the main confounding factors affecting these statistics Collision numbers in general on Irelandrsquos national roads have decreased throughout the before and after periods for these schemes and the assessment makes allowances for this trend Changes in traffic volume in patterns of traffic flow in population distribution in Garda enforcement and in attitude to road safety have all had an effect on collision rates on national roads in towns and villages whether or not traffic calming has been installed This effect is accommodated by adjusting the before and after data in line with a comparison group the collisions in each 4 year before and after period within all similar sized towns and villages on all national roads
The general trend nationwide within all towns and villages in the control group has been a drop in collisions of roughly 15 between before and after periods However the reduction varies markedly between the different collision rates fatal collisions have reduced by a similar percentage to the general trend but serious injury accidents have reduced by over 40 and minor injuries have reduced by only about 10 All reductions in collisions at the sites assessed in this study have to be compared against this general nationwide trend of a shift from serious injury to minor injury
The effect of ldquoregression to meanrdquo is more difficult to make allowances for in this study The random nature of road crashes tends to cause collision frequencies at specific locations to fluctuate The selection of towns and villages for treatment on the basis of their past collision record can introduce a source of potential bias in measuring the effectiveness of the scheme This arises because the selection process tends to pick sites at the peak of their fluctuations in collision frequencies and such sites might well have experienced reductions in collision rate in following years even if no treatment had been applied (Rune Elvik 2002)
To allow for the effect of regression to mean the change in collision rates at treated sites would need to be compared with a number of similar untreated control sites This could not have been done in the case of the traffic calming programme as no such control sites exist Whenever a town or village with a collision history was identified it was put on the programme for treatment with traffic calming it would have been considered unacceptable to leave the location untreated simply for the purposes of research
21
Evaluation of Traffic Calming Schemes Implemented 1997 ndash 2002
44 Effect on Collision Occurrence
Table 41 shows for each yearrsquos programme of traffic calming schemes the collisions over the 4 years before and after each scheme
Table 41 Collisions before and after scheme implementation for each yearrsquos programme
Year No of
Schemes
4 Years Before 4 Years After
Fatal Serious Minor Total Fatal Serious Minor Total
1997 12 10 16 52 78 3 15 51 69
1998 14 5 8 31 44 2 6 30 38
1999 18 5 23 54 82 1 8 36 45
2000 9 2 4 27 33 3 6 19 28
2001 23 10 13 95 118 3 12 59 74
2002 15 4 8 41 53 3 5 40 48
Total 91 36 72 300 408 15 52 235 302
The reduction in collisions for each yearrsquos programme is shown in Table 42 as is the adjusted reduction allowing for the general drop in collisions over the study years in the control group of other similar sites Table 43 shows these adjusted drops in annual terms and in percentages
All this data for each individual scheme can be seen in Appendix C
There is considerable fluctuation in results between each yearrsquos programme of traffic calming so it is best to concentrate on the overall figures for the entire six years
Over all 91 sites there was a drop of 106 collisions from 408 to 302
When adjusted for the general nationwide fall in collisions on similar sites this gives a total drop of 433 colshylisions or 108 per year
This is a 13 reduction on the collision numbers before implementation of the schemes
Table 42 Collision reductions for each yearrsquos programme
Year No of
Schemes
4 Year Reduction 4 Year Reduction Adjusted
Fatal Serious Minor Total Fatal Serious Minor Total
1997 12 7 1 1 9 55 -64 06 -03
1998 14 3 2 1 6 18 -20 -12 -15
1999 18 4 15 18 37 30 50 140 220
2000 9 -1 -2 8 5 -14 -36 59 08
2001 23 7 1 36 44 65 -37 246 274
2002 15 1 3 1 5 11 07 -71 -52
Total 91 21 20 65 106 164 -100 368 433
22
Evaluation of Traffic Calming Schemes Implemented 1997 ndash 2002
Table 43 Annual collision reductions for each yearrsquos programme
Year No of
Schemes
Annual Drop in Collisions Adjusted Percentage Drop in Collisions
Fatal Serious Minor Total Fatal Serious Minor Total
1997 12 14 -16 01 -01 65 -74 1 -0
1998 14 05 -05 -03 -04 47 -51 -4 -4
1999 18 07 13 35 55 75 39 28 33
2000 9 -04 -09 15 02 -88 -55 24 3
2001 23 16 -09 62 69 68 -44 29 27
2002 15 03 02 -18 -13 27 13 -21 -12
Total 91 41 -25 92 108 52 -24 14 13
While collisions of all severity types at the examined locations have reduced in actual numbers the decrease in serious injury collisions at these sites has not followed the general trend nationwide over this period on national roads which have experienced a particularly large decrease in serious injury collisions When allowing for the trend in the control data the actual reduction of 20 serious injury collisions in a 4 year period translates to a relative increase of 10 collisions
Looking at each individual severity type the adjusted reduction in fatal collisions is 164 or 41 per year and that in minor injury collisions is 368 or 92 per year The adjusted change in serious injury collisions is an increase of 25 per year These numbers represent a 52 drop in fatal collisions a 14 drop in minor injury collisions and a 24 rise in serious injury collisions
The implementation of traffic calming has clearly had a much more marked effect on fatal collisions than on other injury collisions resulting in a lowering of the severity of collisions overall Table 44 below shows for each year each severity category as a percentage of overall collisions in the 4 years before implementation and the 4 years after implementation It can be seen that in general for each yearrsquos programme except for year 2000 the proportion of fatal collisions has roughly halved the proportion of serious collisions has stayed much the same while that of minor collisions has slightly increased Looking at the entire six yearsrsquo programme in the four years before implementation of each traffic calming scheme fatal collisions constituted 9 of all collisions in these towns and villages while serious and minor injury collisions were 18 and 73 of the total respectively In the four years after implementation fatal collisions decreased to 5 of all collisions serious reduced very slightly to 17 and minor rose to 78
Table 44 Severities as a percentage of all collisions for each yearrsquos programme
Year No of
Schemes
Percentage of all Collisions 4 years before
Percentage of all Collisions 4 years after
Fatal Serious Minor Fatal Serious Minor
1997 12 13 20 67 4 22 74
1998 14 11 18 71 5 16 79
1999 18 6 28 66 2 18 80
2000 9 6 12 82 11 21 68
2001 23 8 11 81 4 16 80
2002 15 8 15 77 6 11 83
Total 91 9 18 73 5 17 78
It can therefore be concluded that implementation of these traffic calming schemes has not only reduced the number of collisions overall but has also reduced the average severity of those collisions that did occur
23
Evaluation of Traffic Calming Schemes Implemented 1997 ndash 2002
45 Statistical Significance Statistical significance is difficult to achieve with locations that have such small numbers of individual collisions However the chi squared test was used to compare the results with the control data and the overall result for all sites indicates an 80 confidence level meaning that there is a 20 chance that the observed reduction in collisions is due to mere random fluctuation
46 Collision Costs and Economic Evaluation Collision costs are calculated using figures from the Goodbody report on Cost-Benefit Analysis of Transport Projects 2004 The ldquoWillingness To Payrdquo method of economic assessment has been used dividing the collisions into the separate categories of fatal serious injury and minor injury Table 45 lists the cost savings per year and Table 46 compares these with construction costs to give an average yearly rate of return for each yearrsquos programme of traffic calming
Table 45 Collision and cost saving for each yearrsquos programme
Year No of
Schemes
Drop in Annual Collisions adjusted
Annual Cost Saving from Drop in Collisions euro 2002 prices
Fatal Serious Minor Fatal Serious Minor Total
1997 12 14 -16 01 3138300 -487300 4300 2655300
1998 14 05 -05 -03 1029900 -155000 -9200 865600
1999 18 07 13 35 1689100 383100 105200 2177500
2000 9 -04 -09 15 -800900 -277800 44200 -1034500
2001 23 16 -09 62 3681900 -278700 184600 3587700
2002 15 03 02 -18 638100 56800 -53100 641800
Total 91 41 -25 92 9376400 -759100 276100 8893400
The annual cost saving from the drop in collisions over all 91 schemes is calculated to be approximately euro89 million Most of this saving comes from the drop in fatal collisions which is the group with the most significant fall proportionately a drop of 41 per year from 79 per year (both figures adjusted for the control data)
Table 46 Yearly rate of return
Year No of
Schemes
Annual Collision Cost Saving euro
2002 prices
Cost of Constr euro 2002 prices
Yearly Rate of Return
1997 12 2655300 3024600 88
1998 14 865600 1852900 47
1999 18 2177500 5369900 41
2000 9 -1034500 1882000 -55
2001 23 3587700 3881400 92
2002 15 641800 3446600 19
Total 91 8893400 19457200 46
The average yearly rate of return for each yearrsquos programme varies between 92 and a negative return of 55 but the average rate of return over all six years is 46
24
Evaluation of Traffic Calming Schemes Implemented 1997 ndash 2002
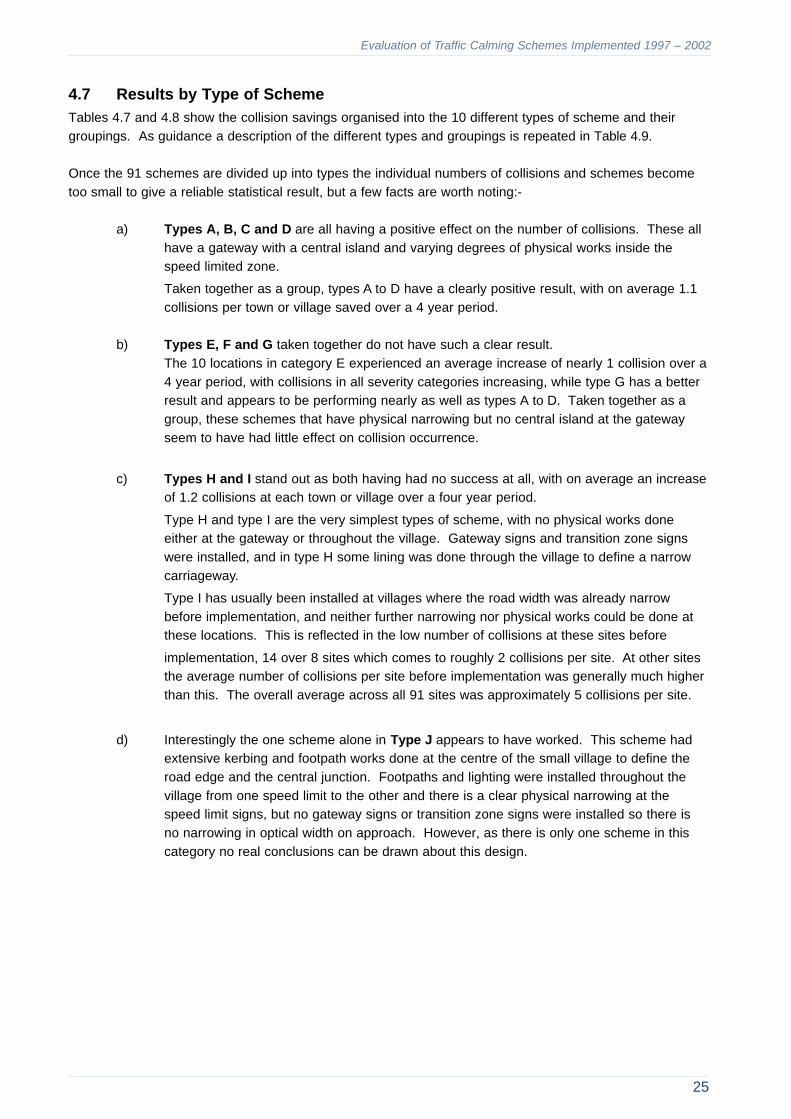
47 Results by Type of Scheme Tables 47 and 48 show the collision savings organised into the 10 different types of scheme and their groupings As guidance a description of the different types and groupings is repeated in Table 49
Once the 91 schemes are divided up into types the individual numbers of collisions and schemes become too small to give a reliable statistical result but a few facts are worth noting-
a) Types A B C and D are all having a positive effect on the number of collisions These all have a gateway with a central island and varying degrees of physical works inside the speed limited zone
Taken together as a group types A to D have a clearly positive result with on average 11 collisions per town or village saved over a 4 year period
b) Types E F and G taken together do not have such a clear result The 10 locations in category E experienced an average increase of nearly 1 collision over a 4 year period with collisions in all severity categories increasing while type G has a better result and appears to be performing nearly as well as types A to D Taken together as a group these schemes that have physical narrowing but no central island at the gateway seem to have had little effect on collision occurrence
c) Types H and I stand out as both having had no success at all with on average an increase of 12 collisions at each town or village over a four year period
Type H and type I are the very simplest types of scheme with no physical works done either at the gateway or throughout the village Gateway signs and transition zone signs were installed and in type H some lining was done through the village to define a narrow carriageway
Type I has usually been installed at villages where the road width was already narrow before implementation and neither further narrowing nor physical works could be done at these locations This is reflected in the low number of collisions at these sites before
implementation 14 over 8 sites which comes to roughly 2 collisions per site At other sites the average number of collisions per site before implementation was generally much higher than this The overall average across all 91 sites was approximately 5 collisions per site
d) Interestingly the one scheme alone in Type J appears to have worked This scheme had extensive kerbing and footpath works done at the centre of the small village to define the road edge and the central junction Footpaths and lighting were installed throughout the village from one speed limit to the other and there is a clear physical narrowing at the speed limit signs but no gateway signs or transition zone signs were installed so there is no narrowing in optical width on approach However as there is only one scheme in this category no real conclusions can be drawn about this design
25
Evaluation of Traffic Calming Schemes Implemented 1997 ndash 2002
Table 47 Drop in collisions by type of scheme
Type No in Study
All colls 4 years before
Drop in collisions (4 years adjusted) Annual cost saving euro
Fatal Serious Minor Total Tot per
site Total Per site
A 39 171 49 -19 347 377 10 2913300 74700
B 8 31 32 -12 78 98 12 1772300 221500
C 5 42 -02 13 80 91 18 42600 8500
D 1 8 -02 10 26 34 34 -40800 -40800
E 10 48 -11 -22 -56 -90 -09 -867800 -86800
F 11 55 58 -35 -49 -26 -02 2985200 271400
G 5 20 25 -09 28 43 09 1354000 270800
H 3 13 10 -37 -55 -82 -27 260900 87000
I 8 14 07 01 -59 -51 -06 366800 45900
J 1 6 00 11 27 38 38 106600 106600
Total 91 408 164 -100 368 433 05 8893400 Avge 97700
Table 48 Grouping type of scheme by type of gateway
Type No in Study
All colls 4 years before
Drop in collisions (4 years adjusted) Annual cost saving euro
Fatal Serious Minor Total Tot per
site Total Per site
Central Island
Gateway 53 252 76 -08 532 600 11 4687600 88400
Simple Gateway
26 123 71 -67 -77 -73 -03 3471500 133500
Signs Only
11 27 17 -36 -114 -133 -12 627800 57100
Type J 1 6 00 11 27 38 38 106600 106600
Total 91 408 164 -100 368 433 05 8893400 Avge 97700
Table 49 Types of scheme and their groupings
Type Treatment Group
A Central island gateway central islands amp narrowing with kerbs inside
Central Island Gateway
B Central island gateway narrowing with kerbs amp no islands inside
C Central island gateway and lining
D Central island gateway and nothing else
E Simple gateway central islands amp narrowing with kerbs insides Simple
GatewayF Simple gateway narrowing with kerbs amp no islands inside
G Simple gateway and lining
H Gateway signs and lining Signs Only
I Gateway signs and nothing else
J No gateway narrowing with kerbs amp no islands inside No Gateway
26
Evaluation of Traffic Calming Schemes Implemented 1997 ndash 2002
48 Results By Type of Collision Table 410 shows the before and after collisions each year for the three main types of collision pedestrian single vehicle and head on The drop shown in the table is an adjusted figure and is relative to the decrease in each of these types of collision in the control data throughout all similar towns and villages on national roads over the period examined
The results show that pedestrian collisions decreased overall by about 8 from a figure of 69 and head-on type collisions have decreased by about 14 from 45 These are quite significant decreases of about 13 and 29 respectively However there has been effectively no change in single vehicle collisions only a very small increase of negligible percentage change
Table 410 Type of collision
Year No of
Schemes
All collisions 4 years before Drop in collisions (4 years adjusted)
ped single veh head on ped single veh head on
1997 12 7 15 8 -70 -03 09
1998 14 3 3 7 -19 -34 -01
1999 18 18 13 7 93 59 13
2000 9 5 6 4 01 -20 12
2001 23 24 14 16 49 -10 132
2002 15 12 12 3 20 06 -30
Total 91 69 63 45 75 -02 135
Total Percentage Drop 13 -0 29
The greatest decrease is in head-on type collisions Head-on collisions are not a particularly significant proportion of all collisions within these towns and villages and before implementation of the traffic calming they constituted only about 11 of all of collisions However the reduction of 135 collisions over four years represents a 29 drop in this type of collision compared with figures before implementation which is a significant result This decrease can be directly attributed to the fundamental design of traffic calming in which the two directions of flow are divided by central kerbed islands and central hatched areas
Pedestrian collisions have also decreased Pedestrian collisions were about 19 of all collisions within these towns and villages and the drop of 13 in pedestrian collisions is much the same as the general drop of 13 in collisions overall within the treated towns Although this is a good result in that pedestrian collisions have decreased in treated towns and villages 13 more than they have decreased in other similar locations it is not as good as was expected It was assumed that the inherent ldquopedestrian friendlyrdquo nature of traffic calming with provision of footpaths and pedestrian crossings would have a comparatively greater effect on pedestrian collisions Examination of the individual collisions in the after period suggests that the increases in pedestrian collisions are occurring in only about a dozen of the 91 towns and villages and that half of these dozen have 3 or more pedestrian incidents in the four year after period There appears to be no correlation with the provision of a pedestrian crossing as part of the traffic calming scheme A more detailed study of these locations is needed to investigate pedestrian collisions further and to ascertain whether there is any link between the provision of either pedestrian crossings or footpaths and the decrease in pedestrian collisions
Single vehicle collisions have not changed at all in relation to the general decrease in single vehicle collisions in all similar towns and villages Single vehicle collisions are those involving only one vehicle Usually in single vehicle incidents the vehicle leaves the driving lane of the road and collides with a roadside object
27
Evaluation of Traffic Calming Schemes Implemented 1997 ndash 2002
Occasionally there is no collision with a roadside object but because of the difference in levels between road and surrounding ground the occupants are injured when the vehicle comes to a halt The lack of any significant change in the occurrence of single vehicle collisions could possibly be explained by the fact that implementation of traffic calming introduces many new objects into the roadside space and reduces the available width within the driving lane Thus when a driver does stray from the correct path there is less forgiveness in the roadside environment and the chances of leaving the defined driving lane or striking an object is increased The general decrease in collisions at traffic calming sites due to the reduced speed is offset by this increased chance of hitting a roadside object which has thus resulted in no change in the incidence of these types of collisions
49 Results for Towns and Villages Treated at One End Only At 27 of the 91 locations only one end of the town or village was treated with traffic calming In 8 of these cases these were entries into a large town or city or into a coastal town where the route ended at the remaining 19 locations there was a through route but only one half of the village was treated Table 411 shows the results arranged according to whether or not both ends of the town were treated
The previous report on traffic calming constructed between 1993 and 1996 concluded that villages which had traffic calming at only one end did not perform in evaluation as well as those where both ends were treated The results shown below repeat this phenomenon At the 27 locations where only one end of the town or village was treated collisions reduced only by an average of 8 while at the other 64 locations where both ends were treated the reduction in collisions was 14 on average
When the 8 ldquosingle entryrdquo locations are separated out it can be seen that these treatments worked better than the other 19 one-end towns and villages This can perhaps be explained by the fact that these 7 locations were put in place to reduce the speed of vehicles approaching the outskirts of large towns or cities and their effect is only required to act within the environs of the traffic calming works Once past the traffic calming scheme the traffic enters a congested network where speed is not a concern For these 8 sites it was only the short length immediately around the traffic calming works was that was evaluated in the study
Table 411 Division of schemes according to whether both ends were treated
Type No in study
All colls 4 years before
Drop in collisions (4 years adjusted) Percentage drops
Fatal Serious Minor Total Total
per site Fatal Serious Minor Total
Both Ends 64 310 130 -76 311 364 06 52 -24 15 14
Single Entry 8 31 06 08 47 61 08 38 29 22 23
Half 19 67 29 -32 11 08 00 59 -41 3 1
All One-end 27 98 35 -24 58 69 03 54 -22 9 8
Total 91 408 164 -100 368 433 05 52 -24 14 13
28
Evaluation of Traffic Calming Schemes Implemented 1997 ndash 2002
5 CASE STUDIES
51 Comparison of Types of Traffic Calming Schemes The results indicate that schemes that have a central island at the gateway types AB C and D as
described in section 33 are more effective at reducing collisions than those schemes that do not have censhytral islands Four schemes on N15 were chosen to illustrate the typical differences between these types of scheme so that the layout of a scheme that has succeeded in collision reduction can be compared with one
that has not
The schemes illustrated all on N15 and in County Donegal are Ballyshannon Ballybofey Killygordon Castlefinn
Schemes With Central Island Type Gateways
Ballybofey and Castlefinn are schemes of type A having a gateway with both side buildouts and central island Inside the village or town this definition is continued using central islands and narrowing with kerbs
Both of these sites have experienced a reduction in collisions as the figures for 4 year before and after periods show Castlefinn particularly has had a notable reduction very much larger than the average of 13 for all the sites in this study
TownVillage collisions before collisions after reduction (adjusted) Ballybofey 9 6 16 Castlefinn 4 1 72
Schemes With Signs Only at Gateways
Ballyshannon and Killygordon are schemes of type H having only signs and no physical works at the gateway Definition inside the town or village is given only by using road markings
None of these sites has experienced any significant reduction in collisions as the 4 year figures below show These locations have had a slight increase in collisions relative to the general decrease in collisions across all similar towns and villages in the control data
TownVillage collisions before collisions after reduction (adjusted) Ballyshannon 7 6 -4 (increase) Killygordon 2 2 -9 (increase)
Comparison of Ballyshannon and Ballybofey
Ballyshannon and Ballybofey are similar sized towns and before traffic calming was introduced had similar approaches In both towns the speed limit extends a long way outside the centre of town and the road was wide on these approaches Both towns have busy town centres with narrow streets where vehicle speeds are not particularly high but in the zone between gateway and town centre high speeds were a problem and were addressed by traffic calming
While Ballyshannon had no central island constructed at the gateway and was treated with only signs and line marking on these approaches Ballybofey was treated with a kerbed central island kerbs and footpaths to narrow the road and a string of further central islands between the gateway and the centre of town Figures 51 and 52 below illustrate this
29
Evaluation of Traffic Calming Schemes Implemented 1997 ndash 2002
Comparison of figures 51 and 52 shows that the optical width has been considerably narrowed in Ballybofey whereas the effect is not so marked in Ballyshannon Figures 53 and 54 show how in Ballybofey this narrowing is continued on for the 600m between gateway and town centre reinforcing the slowing down effect that drivers experienced at the gateway
The differences in design of the approaches to these towns may possibly account for the differences in collision occurrence after traffic calming implementation
Figure 51 Ballyshannon south approach
Figure 52 Ballybofey south approach
30
Evaluation of Traffic Calming Schemes Implemented 1997 ndash 2002
Figure 53 Ballybofey south zone inside gateway
Figure 54 Ballybofey south zone inside gateway
31
Evaluation of Traffic Calming Schemes Implemented 1997 ndash 2002
Comparison of Killygordon and Castlefinn
Killygordon and Castlefinn are located within 6km of each other on the most northern section of N15 with a much lower traffic volume than either Ballybofey or Ballyshannon The N15 along this section in general has a narrower cross section without hard shoulders
Killygordon is a small village and had narrow approaches even before implementation of the traffic calming and the low collision rate before implementation reflects this The minimal treatment to this village under the traffic calming programme did little to change the collision occurrence Castlefinn is a larger village and before implementation its approaches were wider than those to Killygordon The number of collisions in Castlefinn before implementation was twice that in Killygordon The construction of a kerbed central island kerbs and footpaths to narrow the road and a further central island at the centre of the village has evidently had an effect on collisions which have now reduced to numbers below that in Killygordon Figures 55 and 56 below illustrate the differences between the two villages at the gateway while Figures 57 and 58 illustrate the changed look of the centre of Castlefinn as a result of traffic calming construction
Figure 55 Killygordon west approach
Figure 56 Castlefinn west approach
32
Evaluation of Traffic Calming Schemes Implemented 1997 ndash 2002
Figure 57 Castlefinn centre before traffic calming
Figure 58 Castlefinn centre after traffic calming
33
Evaluation of Traffic Calming Schemes Implemented 1997 ndash 2002
Figure 59 Approach to a village similar to Grange before traffic calming
52 Successful Schemes
N15 Grange
Grange has had one of the greatest reductions in collisions in this study
Collisions in 4 years before 9 Collisions in 4 years after 2 reduction (adjusted) 75
Grange is on a busy section of N15 in County Sligo It is a medium sized village with shops pubs petrol station police station church and a few dozen dwelling houses all with frontage onto the national road It has two busy junctions with local primary distributor roads leading to a moderately populated hinterland in the summer the population increases significantly with holidaymakers visiting the coastal area
Traffic calming was installed in 2000 Before this the approaches to the village were wide with hard shoulshyders and this cross section continued through the length of the town On entering the village from the north the length within the built up area approaching the centre is downhill so that drivers would need constant concentration and awareness of their speed to achieve a reduction in speed and to maintain that reduction on this approach From the south there is also a downhill approach but outside the built up area so that speeds approaching the start of the speed limited zone were high
Although an appropriate photograph of Grange before construction of the traffic calming is not available the photograph below of a similar sized village on N24 with similar road widths is shown below in Figure 59
Grange was treated with kerbed central islands at each gateway kerbs and footpaths to narrow the road and a string of further central islands between the two gateways Driving lanes in each direction are now a constant 35m throughout the village A signalised controlled pedestrian crossing was also constructed at the centre of the town There are now footpaths for the entire length of village between gateways and as well as the controlled crossing there are several locations where pedestrians can cross the road with the aid of the central island refuges Figures 510 511 and 512 below illustrate the works
In the years since traffic calming was implemented further housing an industrial estate and commercial sites have been constructed in the vicinity Traffic volumes turning at the junction have increased substantially
34
Evaluation of Traffic Calming Schemes Implemented 1997 ndash 2002
Figure 510 Gateway at Grange with central Island ndash Viewed from inside the village
Figure 511 Approach to Grange village centre from the north
35
Evaluation of Traffic Calming Schemes Implemented 1997 ndash 2002
Figure 512 Grange village centre
In the four years before construction of traffic calming there were roughly 2 collisions each year in the vilshylage Four of the nine collisions were single vehicle incidents and two were pedestrian collisions both involving pedestrians attempting to cross the road Skidding occurred in six of the nine collisions which is an unusually large proportion and suggests that there was a high incidence of sudden braking from high speeds
In the four years after implementation of the scheme there have been only two collisions one in the village centre where the rear of a parked vehicle was hit and one single vehicle loss of control incident on the south approach to the village
N20 Newtwopothouse Newtwopothouse has also had a significant reduction in collisions in this study
Collisions in 4 years before 4
Collisions in 4 years after 0
reduction (adjusted) 100
Newtwopothouse is on a busy section of N20 in County Cork It is a tiny settlement on a staggered junction with only a pubcafe and a shoppost office having frontage onto the national road The bulk of the housing in the area is along the two side roads stretching a few hundred metres down each road and on the eastshyern side road there is a school about 100m from the N20 Before construction of the traffic calming it did not appear to the passing driver on N20 as if there were a village at all merely a crossroads However there was a fairly large volume of traffic turning to and from the two side roads and pedestrian traffic across the N20 between housing and school
Before implementation of traffic calming the road on approach to and through the location was wide being a standard 7m single carriageway with 3m hard shoulders Figures 513 and 515 show the location before traffic calming was installed
36
Evaluation of Traffic Calming Schemes Implemented 1997 ndash 2002
Figure 513 Approach to Newtwopothouse from north before traffic calming
Figure 514 Approach to Newtwopothouse from north
Traffic calming was implemented in 2001 Similarly to Grange Newtwopothouse was treated with kerbed central islands at each gateway kerbs and footpaths to narrow the road further central islands between the two gateways and a signalised controlled pedestrian crossing in the centre Driving lanes in each direction are now a constant 35m throughout the scheme and there is now lighting for the entire length between gateways and footpaths in the central stretch around the junction and bus stops Figures 514 and 516 below illustrate the works by showing the same locations as shown in Figures 513 and 515
37
Evaluation of Traffic Calming Schemes Implemented 1997 ndash 2002
Figure 515 Crossroads at Newtwopothouse before traffic calming
Figure 516 Crossroads at Newtwopothouse with pedestrian crossing
In the four years before construction of traffic calming there were 4 collisions at this location all of which involved turning at the junction
In the four years after implementation of the scheme there have been no collisions
38
Evaluation of Traffic Calming Schemes Implemented 1997 ndash 2002
6 CONCLUSIONS
61 Reduction in Collisions Between 1997 and 2002 there were 94 traffic calming schemes completed at towns and villages on the national roads
Over all the 91 studied locations comparing the 4 years before each scheme with the 4 years after there was a reduction of 106 collisions made up of 21 fatal collisions 20 serious injury collisions and 65 minor injury collisions
62 Reduction in Comparison with Control Data When comparing with the control data and allowing for the general decrease in collisions overall on national roads during this time period this translates to a reduction of 433 collisions This is made up of a reduction of 164 fatal collisions and 368 minor injury collisions and an increase of 100 serious collisions
These figures represent a 13 reduction in all collisions with fatal collisions reduced by 52 Serious and minor injury collisions together reduced by 9
63 Reduction in Severity of Collisions The implementation of traffic calming has therefore had the effect of reducing the number of crashes within the geographical areas of their influence Its more significant effect is in reducing the severity of collisions The percentage of all collisions that were fatal dropped from 9 in the 4 years before implementation to 5 in the 4 years after The percentage of minor injury collisions rose by a corresponding amount
64 Cost Benefit Analysis Using the ldquoWillingness to Payrdquo method of evaluation the average yearly rate of return over all the years evaluated is 46
65 Effects of Different Types of Schemes Traffic Calming Schemes that have a central island in the Gateway and continue this effect with solid central islands throughout the village are more effective in reducing collisions than those that do not
Schemes that consisted of only signs and had no physical works did not have any effect at all in reducing collisions
Traffic Calming Schemes where both ends of the town or village were treated were more effective in reducshying collisions than those where only one was treated
39
Evaluation of Traffic Calming Schemes Implemented 1997 ndash 2002
40
7
Evaluation of Traffic Calming Schemes Implemented 1997 ndash 2002
RECOMMENDATIONS
There are eight main recommendations that emerge from this study
1 The programme of traffic calming of towns and villages on national roads should be continued
2 The programme should be restricted to only towns and village where traffic calming is likely to have an impact
3 An updated priority list should be produced to identify those towns and villages where traffic calming is likely to have an impact
4 Prioritised towns and villages should have a) an injury collision record over the past 5 years that is higher than average b) 85 percentile speeds that are above the posted speed limit c) a physical layout that is possible to treat with traffic calming
5 Where traffic calming is implemented it should include a central island at the gateway and should include physical narrowings throughout the town or village No scheme should consist of just signs and road markings
6 At any location where traffic calming is being considered the existing vehicle speeds through the village must be surveyed
7 After each traffic calming scheme has been implemented the revised vehicle speeds through the village must be surveyed as soon as possible
8 A further study should examine in more detail the single vehicle accidents and pedestrian accidents that been identified in this study in treated villages and towns
41
Evaluation of Traffic Calming Schemes Implemented 1997 ndash 2002
42
Evaluation of Traffic Calming Schemes Implemented 1997 ndash 2002
REFERENCES
RS460 Evaluation of Traffic Calming Schemes Constructed on National Roads 1993-1996 National Roads Authority 2002
The Road to Safety Government Strategy for Road Safety 1998-2002 Department of the Environment and Local Government 1998
Road Safety Strategy Government Strategy for Road Safety 2004-2006 Department of Transport 2004
Road Safety Strategy 2007-2012 Road Safety Authority 2007
2005 Survey of Free Speeds (Urban and Rural) National Roads Authority 2006
Guidelines on Traffic Calming for Towns and Villages on National Routes National Roads Authority 2004
Reducing Traffic Injuries Resulting From Excess and Inappropriate Speed European Transport Safety Council 1995
The importance of confounding in observational before-and-after studies of road safety measures Rune Elvik Accident Analysis and Prevention 34(5) 2002
Parameter Values for Use in Cost-Benefit Analysis of Transport Projects Goodbody Economic Consultants 2004
43
Evaluation of Traffic Calming Schemes Implemented 1997 ndash 2002
44
Evaluation of Traffic Calming Schemes Implemented 1997 ndash 2002
Evaluation of Traffic Calming Schemes Implemented 1997 ndash 2002
APPENDIX A
Ranking of Sites According to Primary Criteria for Selection for Traffic Calming National Primary Routes Only
Route Town Village Population AADT Length Colls
over 5 yrs
Collisions per 10 million vehkm
Collisions per year per 1000
Population
+Combined Collision
Rate
N17 BALLINDINE 232 5058 0587 8 148 690 640
N25 KILRANE 214 5310 2255 10 46 935 559 N08 LITTLETON 566 5598 0591 10 166 353 508
N11 ASHFORD 500 12768 1352 19 60 760 501 N01 JULIANSTOWN 450 14270 1146 16 54 711 463
N05 FRENCHPARK 272 2994 0805 11 250 809 452
N02 COLLON 335 6164 0626 7 99 418 408 N18 KILCOLGAN 500 9565 0483 9 107 360 393
N08 WATERGRASSHILL 250 13706 0985 8 32 640 385 N01 CASTLEBELLINGHAM 762 10983 1891 20 53 525 368
N08 RATHCORMACK 500 11807 1158 11 44 440 308 N09 DUNGARVAN 500 3261 028 4 240 160 280
N04 DROMOD 250 3598 059 3 77 240 275 N20 CHARLEVILLE 3000 9655 1988 12 34 400 269
N25 LEMYBRIEN 222 6471 0918 4 37 360 254 N11 KILMACANOGE 763 26721 0692 13 39 341 247
N25 GLOUNTHAUNE 500 17499 0802 17 66 680 236
N07 MONEYGALL 344 6350 0576 4 60 233 236 N09 MULLINAVAT 283 3858 0925 7 107 495 231
N08 KILBEHENY 500 6897 0863 6 55 240 230 N02 CASTLEBLAYNEY 2938 4154 3525 21 79 143 229
N07 BORRIS IN OSSORY 500 7848 1141 7 43 280 226 N15 BUNDORAN 1463 7275 2371 17 54 232 224
N24 KILSHEELAN 435 4924 1027 5 54 230 223 N02 ARDEE 3604 7019 2394 24 78 133 223
N05 CHARLESTOWN 712 2956 125 5 74 140 219 N11 CAMOLIN 293 5192 1125 4 38 273 212
N06 CRAUGHWELL 232 7669 1558 4 18 345 209
N24 MONARD 500 5735 0392 3 73 120 206 N22 FARRANFORE 500 7614 1093 6 40 240 199
N21 ABBEYFEALE 1501 9982 3287 39 65 520 195 N15 GRANGE 500 6352 1427 6 36 240 193
N24 CARRICK ON SUIR 5143 4924 2903 20 77 078 192 N04 COLLOONEY 612 8617 0864 12 88 392 186
N18 BAREFIELD 500 5852 1087 5 43 200 186 N17 CLAREGALWAY 500 11128 166 7 21 280 182
N20 BALLYHAY 500 7440 0364 3 61 120 181 N14 CASTLEFINN 692 6024 0846 5 54 145 180
N26 FOXFORD 974 1928 1915 9 134 185 180
N18 ARDRAHAN 500 6650 0413 3 60 120 180 N02 ASHBOURNE 4411 10840 2792 30 54 136 177
N08 ABBEYLEIX 1299 8083 1778 11 42 169 169 N02 CARRICKMACROSS 3341 11436 2989 27 43 162 167
N11 OILGATE 262 6332 0393 2 44 153 164 N04 BALLINAFAD 500 3199 0239 2 143 080 163
N02 CASTLESHANE 250 5338 0875 5 59 400 159 N02 SLANE 699 6064 1885 13 62 372 155
N02 ANNAYALLA 500 5338 0655 6 94 240 154
N30 ENNISCORTHY 7655 3972 0565 6 146 016 150 N10 PAULSTOWN 234 4858 0753 2 30 171 145
A1
Evaluation of Traffic Calming Schemes Implemented 1997 ndash 2002
Route Town Village Population AADT Length Colls
over 5 yrs
Collisions per 10 million vehkm
Collisions per year per 1000
Population
+Combined Collision
Rate
N08 JOHNSTOWN 422 6063 1445 4 25 190 145 N07 TOOMYVARA 500 7606 069 7 73 280 143
N16 SLIGO 17302 5680 1796 25 134 029 142 N26 BALLINA 477 5398 1983 9 46 377 140
N16 GLENFARNE 500 1746 1846 5 85 200 135 N06 ROCHFORTBRIDGE 721 6202 1348 5 33 139 135
N24 LIMERICK JCN 250 5735 0698 4 55 320 135 N22 BALLINCOLLIG 12124 15125 6303 68 39 112 134
N24 FIDDOWN 500 4588 0966 6 74 240 134
N01 DROGHEDA 23914 19455 4526 79 49 066 131 N08 NEWINN 500 7163 0648 3 35 120 131
N15 STRANORLAR+BALLYBOFEY 2972 3337 3918 22 92 148 129 N14 LIFFORD 1359 3854 1151 4 49 059 128
N22 LISSARDA 500 7096 0696 6 67 240 127 N22 BALLYVOURNEY 500 3636 2786 8 43 320 123
N06 KILREEKILL 500 9055 059 3 31 120 122 N17 BELLAHY+CHARLESTOWN 712 3834 1103 3 39 084 120
N22 MACROOM 2363 7096 4588 31 52 262 118 N15 KILLYGORDON 500 6024 0493 2 37 080 114
N08 HORSEampJOCKEY 500 7607 026 3 83 120 113
N18 GORT 1093 7709 2855 16 40 293 113 N04 CLONARD 500 10570 0599 3 26 120 112
N02 EMYVALE 479 4073 0813 4 66 167 108 N05 BELLAVARY 500 5138 0633 4 67 160 107
N20 PATRICKSWELL 1019 14486 1742 15 33 294 106 N25 KILMEADAN 500 6177 1817 7 34 280 104
N24 PALLASGREEN 500 4638 0747 4 63 160 103 N15 BALLYSHANNON 2838 8955 2844 13 28 092 102
N21 TRALEE 17225 12840 1934 40 88 046 100 N03 KELLS 3539 8857 1737 10 36 057 099
N25 KILLEAGH 347 7244 1481 5 26 288 098
N24 BANSHA 293 4221 0855 3 46 205 097 N03 CARNAROSS 500 6683 0933 5 44 200 094
N02 MONAGHAN 5946 7630 3588 32 64 108 091 N24 CAHIR 2055 13277 2528 11 18 107 089
N01 DUNDALK 25843 22685 6273 153 59 118 089 N06 MILLTOWNPASS 500 6202 0733 4 48 160 088
N18 NEWMARKET-ON-FERGUS 1583 10584 1461 13 46 164 087 N17 CURRY 250 4585 0548 2 44 160 084
N03 CAVAN 5254 11709 236 28 56 107 082 N22 KILLARNEY 7275 9731 3819 19 28 052 082
N09 MOONE+TIMOLIN 500 6720 2231 6 22 240 082
N11 RATHNEW 1496 12736 1072 11 44 147 081 N15 DONEGAL 2193 6149 2053 12 52 109 079
N25 YOUGHAL 5828 7598 522 34 47 117 076 N03 DUNSHAUGHLIN 1275 15588 1458 6 14 094 076
N04 CARRICK ON SHANNON 2500 4257 2393 10 54 080 074 N06 BALLINASLOE 5812 9582 5241 37 40 127 072
N21 NEWCASTLE WEST 2500 7975 2766 16 40 128 072 N20 BUTTEVANT 1125 7440 1271 7 41 124 072
N15 SLIGO 17302 8932 1274 14 67 016 071 N15 DRUMCLIFF 500 9726 0737 2 15 080 071
N25 NEW ROSS 6079 6846 2424 17 56 056 070
A2
Evaluation of Traffic Calming Schemes Implemented 1997 ndash 2002
Route Town Village Population AADT Length Colls
over 5 yrs
Collisions per 10 million vehkm
Collisions per year per 1000
Population
+Combined Collision
Rate
N25 DUNGARVAN 6920 5688 4649 25 52 072 070
N20 CROOM 1090 5658 1036 5 47 092 070 N24 PILTOWN 717 4588 1166 4 41 112 069
N08 MITCHELSTOWN 3090 13395 2084 19 37 123 068 N07 MONASTEREVIN 2224 11968 1754 7 18 063 068
N15 CLIFFONEY 292 5089 0652 2 33 137 067 N09 GOWRAN 477 2517 0949 2 46 084 067
N08 FERMOY 4462 10622 2955 23 40 103 066 N04 RATHOWEN 500 5465 0439 1 23 040 066
N04 NEWTOWNFORBES 250 3711 1169 2 25 160 065 N30 NEW ROSS 6079 3514 2126 8 59 026 065
N07 NENAGH 5825 8352 2422 18 49 062 064
N07 MOUNTRATH 1375 6980 1827 8 34 116 063 N01 BALBRIGGAN 7724 13451 3226 33 42 085 063
N15 LISCOOLEY 500 6024 0423 2 43 080 063 N17 TOBERCURRY 1069 4585 2168 6 33 112 061
N03 NAVAN 11706 11782 4695 43 43 073 061 N04 ENFIELD 500 10570 1127 2 09 080 058
N30 CLONROCHE 500 2786 1049 2 37 080 057 N09 CARLOW 14027 9020 5154 37 44 053 057
N16 MANORHAMILTON 995 2393 1665 3 41 060 056 N24 MOONCOIN 500 8954 1507 2 08 080 056
N06 LOUGHREA 3271 8389 295 15 33 092 056
N06 MOATE 1529 5973 2482 4 15 052 056 N08 CULLAHILL 500 6063 051 1 18 040 055
N08 URLINGFORD 689 6407 1309 4 26 116 055 N08 CASHEL 2814 7238 2342 11 36 078 055
N11 GOREY 3840 13253 1949 16 34 083 055 N11 FERNS 859 5192 0974 3 33 070 050
N18 ENNIS 16058 13516 7938 59 30 073 049 N23 CASTLEISLAND 2207 3515 0727 2 43 018 047
N05 BELLANAGARE 500 2309 0639 1 37 040 047 N04 KINNEGAD 415 6954 2589 3 09 145 045
N09 CASTLEDERMOT 741 6112 2144 4 17 108 044
N11 ARKLOW 7987 12321 3857 24 28 060 043 N18 CRUSHEEN 500 5852 0853 1 11 040 042
N03 VIRGINIA 720 6683 1261 3 20 083 040 N05 BALLAGHADERREEN 1270 4251 2127 4 24 063 040
N07 BALLYBRITTAS 500 10826 0524 1 10 040 039 N06 TYRRELLSPASS 376 6707 1407 1 06 053 038
N11 ENNISCORTHY 7655 7570 1269 6 34 016 038 N04 SLIGO 17964 15138 3821 31 29 035 038
N24 TIPPERARY 4963 11547 2213 12 26 048 038 N26 SWINFORD 1216 1928 1963 2 29 033 037
N07 BIRDHILL 500 9770 0702 2 16 080 036
N07 KILDARE 4196 14907 2763 14 19 067 035 N20 MALLOW 7521 10164 2681 13 26 035 035
N05 STROKESTOWN 568 2809 2371 2 16 070 034 N10 KNOCKTOPHER 500 2734 0841 1 24 040 034
N17 TUAM 5540 10723 305 13 22 047 034 N04 EDGEWORTHSTOWN 801 5520 2094 3 14 075 033
N04 BALLYSADARE 500 8617 0996 2 13 080 033 N10 STONYFORD 500 3401 0717 1 22 040 032
A3
Evaluation of Traffic Calming Schemes Implemented 1997 ndash 2002
Route Town Village Population AADT Length Colls
over 5 yrs
Collisions per 10 million vehkm
Collisions per year per 1000
Population
+Combined Collision
Rate
N21 CASTLEISLAND 2207 5467 1873 4 21 036 030
N07 PORTLAOISE 8360 12097 501 19 17 045 029 N09 THOMASTOWN 2512 3261 2244 3 22 024 028
N05 TULSK 500 2220 1432 1 17 040 027 N25 SWEEP 500 4274 0755 1 17 040 027
N06 GALWAY 60000 24461 5106 50 22 017 026 N03 DROLCHEAD NUA 11778 5345 04 1 26 002 026
N03 BELTURBET 1223 3316 1868 2 18 033 026 N08 DURROW 721 7244 1338 2 11 055 025
N05 WESTPORT 3688 12879 1194 5 18 027 025 N19 SHANNON 7920 14965 05 3 22 008 024
N21 ADARE 500 3348 1288 1 13 040 023
N07 ROSCREA 4231 7718 3502 7 14 033 022 N17 KNOCK 440 3958 1251 1 11 045 022
N10 KILKENNY 17669 7149 3379 8 18 009 020 N13 STRANORLAR 2972 7141 0925 2 17 013 020
N20 LIMERICK 75000 20672 6595 42 17 011 020 N24 CLONMEL 15562 7270 5907 12 15 015 019
N13 BRIDGE END 500 8153 075 1 09 040 019 N05 CASTLEBAR 7648 7442 3988 7 13 018 018
N17 CLAREMORRIS 1907 5058 1868 2 12 021 017 N24 OOLA 474 4864 1937 1 06 042 016
N07 LIMERICK 75000 15709 10841 41 13 011 016
N21 TEMPLEGLANTINE 819 6759 0828 1 10 024 016 N17 GALWAY 60000 27843 3176 20 12 007 014
N05 LONGFORD 6824 6874 4021 5 10 015 014 N07 DUBLIN 500000 47272 2387 22 11 001 011
N04 BOYLE 2197 3199 2036 1 08 009 011 N11 DUBLIN 500000 40055 13999 95 09 004 010
N04 DUBLIN 500000 29736 9209 42 08 002 009 N18 LIMERICK 75000 27171 5095 17 07 005 008
N09 WATERFORD 75000 14883 1693 3 07 001 007 N50 DUBLIN 600000 18676 124 10 02 000 002
N24 LIMERICK 75436 10740 3098 1 02 000 002
N08 CORK 136000 32213 414 2 01 000 001 N22 CORK 136000 25429 3556 1 01 000 001
N09 BALLYHALE 500 3858 0867 0 00 000 000 N17 BALLYNACARROW 500 3807 0798 0 00 000 000
N04 BALLYNALACK 500 5465 0748 0 00 000 000 N03 BALLYSHANNON 2838 3088 0899 0 00 000 000
N05 CARRACASTLE 500 2956 1215 0 00 000 000 N04 CASTLEBALDWIN 500 3199 0252 0 00 000 000
N18 CLARINBRIDGE 500 9565 1417 0 00 000 000 N20 CORK 136000 15947 4267 0 00 000 000
N27 CORK 136000 13277 3778 0 00 000 000
N01 DUBLIN 500000 28975 4298 0 00 000 000 N02 DUBLIN 500000 11524 6397 0 00 000 000
N03 DUBLIN 500000 21436 4357 0 00 000 000 N06 HORSELEAP 500 6769 0735 0 00 000 000
N06 KILBEGGAN 617 6707 1286 0 00 000 000 N14 LETTERKENNY 10726 15411 093 0 00 000 000
N17 MILLTOWN 500 5467 0869 0 00 000 000 N21 PATRICKSWELL 1019 3348 0274 0 00 000 000
A4
Evaluation of Traffic Calming Schemes Implemented 1997 ndash 2002
Route Town Village Population AADT Length Colls
over 5 yrs
Collisions per 10 million vehkm
Collisions per year per 1000
Population
+Combined Collision
Rate
N09 PAULSTOWN 234 6653 0721 0 00 000 000
N04 ROOSKY 249 3827 0696 0 00 000 000 N28 SHANBALLY 500 5098 0506 0 00 000 000
N05 TERMONBARRY 500 3366 098 0 00 000 000 N25 WATERFORD 41853 10668 8427 0 00 000 000
N25 BALLINABOOLA N25 BARNTOWN
N07 DALYS CROSS N18 GORT RD ENNIS
N20 NEWTWOPOTHOUSE N08 RINGASKIDDY
+ Combined Collision Rate [Coll Rate 10mvehkmyr5 + Coll Rate 1000popyr2]2 These towns and villages were not assessed as funding was already committed
A5
Evaluation of Traffic Calming Schemes Implemented 1997 ndash 2002Evaluation of Traffic Calming Schemes Implemented 1997 ndash 2002
Evaluation of Traffic Calming Schemes Implemented 1997 ndash 2002
51
Appendix B Evaluation of Traffic Calming Schemes Implemented 1997 ndash 2002
APPENDIX B Scheme Details for All Sites
Scheme Local Authority Rte Both or Half Spd Lim Type Colls 4 yrs before raw
Colls 4 yrs after raw
Drop in Ann Colls Adj for
All Nats Area Evaluated Year
Finished Year
Started Year
Bypassed Year
Changed Total Cost in 2002 Prices
Carrickarnon Louth 1 both 60 F 15 10 079 Gate - Gate 2001 2007 109400
Greengates Louth 1 both 40 B 8 2 130 Gate - Gate 1997 2002 489900 KilsaranCastlebellingham Louth 1 both 30 A 23 10 260 Gate - Gate 1997 1997 2002 255600
Julianstown Meath 1 both 30 C 13 10 024 Gate - Gate 1999 1999 2003 767700 Emyvale Monaghan 2 both 30 F 5 7 -065 Gate - Gate 2001 46500
Castleblaney (N) Monaghan 2 2nd half 40 A 3 5 -073 Gate - Bend 2000 2000 2007 132300
Carrickmacross (N) Monaghan 2 half 40 A 7 4 008 Gate - Bend 1998 1998 2005 92500 Ardee (S) Louth 2 half 30 A 4 9 -152 Gate - R170 Jcn 1997 1997 238300
Collon Louth 2 both 30 E 6 7 -038 Gate - Gate 1997 1996 251600 Slane Meath 2 both 30 A 8 5 048 Gate - Gate 2002 2001 534500
Kells Meath 3 both 30 A 8 8 -024 Gate - Gate 2001 730900 Castlebaldwin Sligo 4 both 30 A 5 2 062 Gate - Gate 1999 1998 547500
Dromod Leitrim 4 both 30 B 1 3 -052 Gate - Gate 2000 1999 2008 418300 Roosky (E) Leitrim 4 half 30 B 1 -025 Gate - Centre 1998 1997 2008 123300
Newtownforbes (E) Longford 4 1st half 30 F 1 2 -028 Gate - Bend 2001 2003 73800 Rathowen Westmeath 4 both 30 A 1 1 -002 Gate - Gate 1999 1999 369400
Clonard (E) Meath 4 half 40 B 1 1 -000 Gate - Centre 1997 2006 53200
Enfield Meath 4 both 30 C 8 2 114 Gate - Gate 1999 1998 2002 73900 CharlestownBellahy (WN) Mayo 5 half 30 A 7 132 Gates - Centre 1999 1998 2008 523400
Frenchpark Roscommon 5 both 30 F 5 3 032 Gate - Gate 2001 133600 Craughwell Galway 6 both 40 F 6 6 -015 Gate - Gate 2000 1999 30600
Rochfordbridge Westmeath 6 both 30 A 7 5 037 Gate - Gate 1998 1998 2006 199600 Miltownpass Westmeath 6 both 40 F 1 1 -002 Gate - Gate 2000 2000 2006 2005 248000
B1
Appendix B Evaluation of Traffic Calming Schemes Implemented 1997 ndash 2002
Scheme Local Authority Rte Both or Half Spd Lim Type Colls 4 yrs before raw
Colls 4 yrs after raw
Drop in Ann Colls Adj for
All Nats Area Evaluated Year
Finished Year
Started Year
Bypassed Year
Changed Total Cost in 2002 Prices
Moneygall Offaly 7 both 30 C 2 4 -056 Gate - Gate 2001 1997 2002 410900 Ballybrittas Laois 7 both 40 A 5 3 025 Gate - Gate 2002 2005 197900
Monasterevin (W) Kildare 7 half 30 G 4 1 064 Gate - Bridge 1998 1998 2005 29900
Cullahill Laois 8 both 40 A 1 2 -027 Gate - Gate 2000 1999 134200 Abbeyleix (S) Laois 8 half 30 A 1 4 -077 Gate - Centre 2000 2000 330700
Mullinavat (N) Kilkenny 9 half 30 G 6 3 057 Gate - Centre 2001 96600 Dungarvan Kilkenny 9 both 40 G 1 2 -028 Gate - Gate 2001 212700
Paulstown Kilkenny 9 both 30 A 2 046 Gate - Gate 1999 1998 184700 Kilkenny (E) Kilkenny 10 single entry 30 B 10 3 133 Gate - Centre 2001 195200
Claragh Kilkenny 10 both 60 F 2 2 -016 Gate - Gate 1999 206500 Camolin Wexford 11 both 30 A 5 1 073 Gate - Gate 2002 581000
Ashford Wicklow 11 both 30 E 16 7 160 Gate - Gate 1999 1998 2004 92300 Lifford (N amp W) Donegal 14 both 30 A 10 5 095 Gate - Gate 2001 70400
Castlefinn Donegal 15 both 30 A 4 1 063 Gate - Gate 2001 127500
Killygordon Donegal 15 both 30 H 2 2 -004 Gate - Gate 2002 113300 Ballybofey (S) Donegal 15 half 40 A 9 6 029 Gate - Centre 2002 246400
Ballyshannon (S) Donegal 15 2nd half 40 G 7 6 -006 Gate - Bridge 1997 1996 2006 159700 Bundoran Donegal 15 both 40 H 9 15 -163 Gate - Gate 1997 2006 41900
Cliffony Sligo 15 both 30 A 2 1 019 Gate - Gate 2001 143800 Grange Sligo 15 both 30 A 9 2 149 Gate - Gate 2000 1999 172500
Drumcliffe Sligo 15 both 30 F 7 5 033 Gate - Gate 2000 1999 259100 Ballindine Mayo 17 both 30 E 3 6 -091 Gate - Gate 1997 1997 106500
Claregalway Galway 17 both 30 A 3 7 -116 Gate - Gate 1998 1997 328300 Kilcolgan Galway 18 both 40 E 8 8 -042 Gate - Gate 1999 1999 2003 46200
Ardrahan Galway 18 both 30 J 6 1 096 Gate - Gate 1999 1999 46200
Crusheen (N) Clare 18 half 30 E 1 -025 Gate - Bend 1998 1997 2003 251400 Barefield (N) Clare 18 half 40 G 2 1 021 Gate - Centre 1998 1997 2007 251400
B2
Appendix B Evaluation of Traffic Calming Schemes Implemented 1997 ndash 2002
Scheme Local Authority Rte Both or Half Spd Lim Type Colls 4 yrs before raw
Colls 4 yrs after raw
Drop in Ann Colls Adj for
All Nats Area Evaluated Year
Finished Year
Started Year
Bypassed Year
Changed Total Cost in 2002 Prices
Charleville (S) Cork 20 1st half 30 A 2 2 -006 Gate - Ped X 2001 2004 165400
Ballyhea Cork 20 both 40 A 1 -025 Gate - Gate 1999 1999 784900
Newtwopothouse Cork 20 both 40 A 4 084 Gate - Gate 2001 165400
Cork (N) Cork 20 single entry 40 I 1 2 -030 Gate - Ped X 2002 239700
Farranfore Kerry 22 both 30 F 4 5 -032 Gate - Gate 1998 1998 2003 20000
Killarney (E) Kerry 22 single entry 40 D 8 3 085 Gate - Rbt 1998 1998 59900
Ballyvourney Cork 22 both 30 E 3 6 -090 Gate - Gate 2002 2001 570300
Lissarda Cork 22 both 40 A 4 4 -022 Gate - Gate 2002 333900
Ballincollig (W) Cork 22 half 30 B 10 8 041 Gate - Rbt 1997 1997 2004 496300
Cork (W) Cork 22 single entry 30 A 000 Gate - Vic X 1999 2004 193900
Monard South Tipperary 24 both 30 I 1 -025 Gate - Gate 1998 1998 39300
Bansha South Tipperary 24 both 30 I 2 2 -004 Gate - Gate 2001 138400
Kilsheelan South Tipperary 24 both 30 A 2 043 Gate - Gate 1999 1997 2007 194500
Carrick-on-Suir (W) South Tipperary 24 2nd half 30 A 3 066 Gate - Mini Rbt 2001 211900
Mooncoin Kilkenny 24 both 30 F 5 8 -088 Gate - Gate 1998 1998 140000
Lemybrien Waterford 25 both 40 A 1 1 -002 Gate - Gate 1998 1997 165700
Waterford (E) Kilkenny 25 single entry 30 A 5 1 084 Gate - Rbt 1997 1997 63900
Ballinaboola Wexford 25 both 30 A 3 3 -024 Gate - Gate 1999 1999 554100
Barntown Wexford 25 both 40 A 1 2 -037 Gate - Gate 1997 1997 639000
Kilrane (W) Wexford 25 half 30 A 4 4 -025 Gate - Speed Lim 1999 1998 2004 300400
Rosslare Harbour (W) Wexford 25 single entry 15 E 000 Gate - Harbour 2001 2004 16000
Foxford Mayo 26 both 30 I 6 1 083 Gate - Gate 2001 33300
B3
Appendix B Evaluation of Traffic Calming Schemes Implemented 1997 ndash 2002
Scheme Local Authority Rte Both or Half Spd Lim Type Colls 4 yrs before raw
Colls 4 yrs after raw
Drop in Ann Colls Adj for
All Nats Area Evaluated Year
Finished Year
Started Year
Bypassed Year
Changed Total Cost in 2002 Prices
Clonroche Wexford 30 both 30 F 4 2 035 Gate - Gate 2001 20400
New Ross (N) Wexford 30 both 30 A 2 4 -060 Gate - Gate 2002 47500
Smithborough (W) Monaghan 54 half 30 A 2 1 019 Gate - Centre 2001 56900
Carrickboy Longford 55 both 40 H 2 3 -037 Gate - Gate 2002 57100
Gortahork Donegal 56 both 30 I 1 5 -105 Gate - Gate 2002 45500
Dromore West Sligo 59 both 30 A 4 084 Gate - Gate 2000 156200
Ballisodare Sligo 59 both 30 A 000 Gate - Speed Lim 2002 1997 142700
Hodson Bay Roscommon 61 both 40 A 5 112 Gate - Gate 2001 432500
Birr Offaly 62 both 30 C 15 9 087 Gate - Gate 2001 94700
Loughrea (W) Galway 66 single entry 30 I 1 3 -052 Gate - N6 Jcn 1999 1999 55400
Ballylickey Cork 71 both 40 I 1 2 -037 Gate - Gate 1997 228500
Bantry (N) Cork 71 half 30 E 5 5 -027 Gate - Centre 2002 115600
Clonakilty Cork 71 both 30 C 4 1 059 Gate - Gate 1999 331600
Grangemockler South Tipperary 76 both 30 I 2 042 Gate - Gate 1998 1998 2003 51900
Kilkenny (N) Kilkenny 77 single entry 30 E 6 8 -068 Gate - Centre 2001 195200
Newtown Laois 78 both 40 A 5 1 073 Gate - Gate 2002 181400
Killeigh Offaly 80 both 30 B 000 Gate - Gate 1999 1999 97400
Kilmaine (N) Mayo 84 half 30 B 1 019 Gate - R332 Jcn 1998 99800
Swanlinbar (S) Cavan 87 half 30 E 1 1 -005 Gate - Centre 2002 39900
B4
Appendix C
Evaluation of Traffic Calming Schemes Implemented 1997 ndash 2002 APPENDIX C Collision Data Cost Data and First Year Rate of Return for All Sites
Location Rte Yr Construction Cost
4 Years Before 4 Years After Drop in Annual Collisions adjusted Cost Saving from Drop in Collision
Yearly Rate of Return
F S M Tot F S M Tot F S M Tot F S M Tot
Carrickarnon 1 01 109400 3 1 11 15 1 1 8 10 046 -009 042 079 1047600 -27300 12600 1032900 944
Greengates 1 97 489900 2 1 5 8 0 0 2 2 043 013 074 130 969700 40900 22200 1032800 211
KilsaranCastlebellingham 1 97 255600 1 5 17 23 1 0 9 10 -004 067 197 260 -85200 204700 59000 178500 70
Julianstown 1 99 767700 0 3 10 13 1 1 8 10 -025 017 032 024 -570000 53300 9500 -507200 -66
Emyvale 2 01 46500 0 0 5 5 0 2 5 7 000 -050 -015 -065 0 -152300 -4500 -156800 -337
Castleblaney (N) 2 00 132300 0 2 1 3 0 2 3 5 000 -021 -052 -073 0 -62800 -15600 -78400 -59
Carrickmacross (N) 2 98 92500 0 5 2 7 0 0 4 4 000 062 -054 008 0 188700 -16100 172600 187
Ardee (S) 2 97 238300 1 2 1 4 1 4 4 9 -004 -073 -075 -152 -85200 -222700 -22600 -330500 -139
Collon 2 97 251600 0 1 5 6 0 3 4 7 000 -062 024 -038 0 -187500 7200 -180300 -72
Slane 2 02 534500 3 2 3 8 0 0 5 5 077 036 -065 048 1761000 109400 -19400 1851000 346
Kells 3 01 730900 0 0 8 8 1 1 6 8 -025 -025 026 -024 -570000 -76200 7800 -638400 -87
Castlebaldwin 4 99 547500 1 0 4 5 0 0 2 2 020 000 043 062 451800 0 12800 464600 85
Dromod 4 00 418300 0 0 1 1 0 2 1 3 000 -050 -002 -052 0 -152300 -600 -152900 -37
Roosky (E) 4 98 123300 0 0 0 0 0 0 1 1 000 000 -025 -025 0 0 -7500 -7500 -6
Newtownforbes (E) 4 01 73800 0 0 1 1 0 0 2 2 000 000 -028 -028 0 0 -8400 -8400 -11
Rathowen 4 99 369400 0 0 1 1 0 1 0 1 000 -025 023 -002 0 -76200 6900 -69300 -19
Clonard (E) 4 97 53200 0 0 1 1 0 0 1 1 000 000 -000 -000 0 0 -100 -100 -0
Enfield 4 99 73900 1 2 5 8 0 0 2 2 020 028 066 114 451800 86300 19700 557800 755
CharlestownBellahy (WN) 5 99 523400 1 3 3 7 0 0 0 0 020 042 069 132 451800 129400 20800 602000 115
Frenchpark 5 01 133600 2 1 2 5 0 1 2 3 047 -009 -006 032 1078400 -27300 -1800 1049300 785
Craughwell 6 00 30600 1 0 5 6 0 0 6 6 020 000 -035 -015 454600 0 -10400 444200 1452
Rochfordbridge 6 98 199600 0 0 7 7 0 0 5 5 000 000 037 037 0 0 11200 11200 6
Miltownpass 6 00 248000 0 0 1 1 0 0 1 1 000 000 -002 -002 0 0 -600 -600 -0
Moneygall 7 01 410900 0 0 2 2 0 2 2 4 000 -050 -006 -056 0 -152300 -1800 -154100 -38
C1
Appendix C Evaluation of Traffic Calming Schemes Implemented 1997 ndash 2002
Location Rte Yr Construction Cost
4 Years Before 4 Years After Drop in Annual Collisions adjusted Cost Saving from Drop in Collision
Yearly Rate of Return
F S M Tot F S M Tot F S M Tot F S M Tot
Ballybrittas 7 02 197900 0 0 5 5 0 0 3 3 000 000 025 025 0 0 7600 7600 4
Monasterevin (W) 7 98 29900 1 0 3 4 0 0 1 1 019 000 045 064 434000 0 13400 447400 1496
Cullahill 8 00 134200 0 0 1 1 1 0 1 2 -025 000 -002 -027 -570000 0 -600 -570600 -425
Abbeyleix (S) 8 00 330700 0 0 1 1 0 1 3 4 000 -025 -052 -077 0 -76200 -15600 -91800 -28
Mullinavat (N) 9 01 96600 0 0 6 6 0 0 3 3 000 000 057 057 0 0 17100 17100 18
Dungarvan 9 01 212700 0 0 1 1 0 0 2 2 000 000 -028 -028 0 0 -8400 -8400 -4
Paulstown 9 99 184700 0 0 2 2 0 0 0 0 000 000 046 046 0 0 13900 13900 8
Kilkenny (E) 10 01 195200 0 2 8 10 0 1 2 3 000 007 126 133 0 21600 37800 59400 30
Claragh 10 99 206500 1 1 0 2 0 0 2 2 020 014 -050 -016 451800 43100 -15000 479900 232
Camolin 11 02 581000 0 1 4 5 0 0 1 1 000 018 055 073 0 54700 16600 71300 12
Ashford 11 99 92300 0 4 12 16 0 1 6 7 000 032 128 160 0 96400 38400 134800 146
Lifford (N amp W) 14 01 70400 0 0 10 10 0 0 5 5 000 000 095 095 0 0 28500 28500 40
Castlefinn 15 01 127500 0 0 4 4 0 0 1 1 000 000 063 063 0 0 18900 18900 15
Killygordon 15 02 113300 1 0 1 2 0 0 2 2 026 000 -030 -004 587000 0 -9000 578000 510
Ballybofey (S) 15 02 246400 0 1 8 9 0 1 5 6 000 -007 036 029 0 -21500 10700 -10800 -4
Ballyshannon (S) 15 97 159700 2 2 3 7 0 1 5 6 043 002 -051 -006 969700 5700 -15200 960200 601
Bundoran 15 97 41900 0 1 8 9 0 4 11 15 000 -087 -077 -163 0 -263700 -23000 -286700 -684
Cliffony 15 01 143800 0 0 2 2 0 1 0 1 000 -025 044 019 0 -76200 13200 -63000 -44
Grange 15 00 172500 0 1 8 9 1 0 1 2 -025 015 159 149 -570000 44800 47800 -477400 -277
Drumcliffe 15 00 259100 1 0 6 7 1 1 3 5 -005 -025 063 033 -115400 -76200 19000 -172600 -67
Ballindine 17 97 106500 1 1 1 3 0 2 4 6 021 -037 -075 -091 484800 -111400 -22600 350800 329
Claregalway 17 98 328300 0 1 2 3 0 2 5 7 000 -038 -079 -116 0 -114600 -23600 -138200 -42
Kilcolgan 18 99 46200 0 3 5 8 0 1 7 8 000 017 -059 -042 0 53300 -17800 35500 77
Ardrahan 18 99 46200 0 2 4 6 0 0 1 1 000 028 068 096 0 86300 20300 106600 231
Crusheen (N) 18 98 251400 0 0 0 0 0 1 0 1 000 -025 000 -025 0 -76200 0 -76200 -30
Barefield (N) 18 98 251400 0 0 2 2 0 1 0 1 000 -025 046 021 0 -76200 13900 -62300 -25
Charleville (S) 20 01 165400 0 0 2 2 0 1 1 2 000 -025 019 -006 0 -76200 5700 -70500 -43
C2
Appendix C Evaluation of Traffic Calming Schemes Implemented 1997 ndash 2002
Location Rte Yr Construction Cost
4 Years Before 4 Years After Drop in Annual Collisions adjusted Cost Saving from Drop in Collision
Yearly Rate of Return
F S M Tot F S M Tot F S M Tot F S M Tot
Ballyhea 20 99 784900 0 0 0 0 0 0 1 1 000 000 -025 -025 0 0 -7500 -7500 -1
Newtwopothouse 20 01 165400 1 1 2 4 0 0 0 0 024 016 044 084 539200 48900 13200 601300 364
Cork (N) 20 02 239700 0 0 1 1 0 0 2 2 000 000 -030 -030 0 0 -9000 -9000 -4
Farranfore 22 98 20000 0 0 4 4 0 0 5 5 000 000 -032 -032 0 0 -9700 -9700 -49
Killarney (E) 22 98 59900 1 2 5 8 1 0 2 3 -006 025 066 085 -136000 75500 19800 -40700 -68
Ballyvourney 22 02 570300 0 0 3 3 2 0 4 6 -050 000 -040 -090 -1140000 0 -11900 -1151900 -202
Lissarda 22 02 333900 0 1 3 4 0 1 3 4 000 -007 -015 -022 0 -21500 -4400 -25900 -8
Ballincollig (W) 22 97 496300 2 0 8 10 1 0 7 8 018 000 023 041 399700 0 7000 406700 82
Cork (W) 22 99 193900 0 0 0 0 0 0 0 0 000 000 000 000 0 0 0 0 0
Monard 24 98 39300 0 0 0 0 0 0 1 1 000 000 -025 -025 0 0 -7500 -7500 -19
Bansha 24 01 138400 1 0 1 2 0 1 1 2 024 -025 -003 -004 539200 -76200 -900 462100 334
Kilsheelan 24 99 194500 1 0 1 2 0 0 0 0 020 000 023 043 451800 0 6900 458700 236
Carrick-on-Suir (W) 24 01 211900 0 0 3 3 0 0 0 0 000 000 066 066 0 0 19800 19800 9
Mooncoin 24 98 140000 1 0 4 5 1 1 6 8 -006 -025 -057 -088 -136000 -76200 -17200 -229400 -164
Lemybrien 25 98 165700 0 0 1 1 0 1 0 1 000 -025 023 -002 0 -76200 7000 -69200 -42
Waterford (E) 25 97 63900 1 1 3 5 0 0 1 1 021 013 049 084 484800 40900 14800 540500 846
Ballinaboola 25 99 554100 0 2 1 3 0 1 2 3 000 003 -027 -024 0 10100 -8100 2000 0
Barntown 25 97 639000 0 1 0 1 0 0 2 2 000 013 -050 -037 0 40900 -15000 25900 4
Kilrane (W) 25 99 300400 0 2 2 4 0 2 2 4 000 -022 -004 -025 0 -66000 -1100 -67100 -22
Rosslare Harbour (W) 25 01 16000 0 0 0 0 0 0 0 0 000 000 000 000 0 0 0 0 0
Foxford 26 01 33300 0 4 2 6 0 0 1 1 000 064 019 083 0 195400 5700 201100 604
Clonroche 30 01 20400 2 1 1 4 1 0 1 2 022 016 -003 035 508400 48900 -900 556400 2727
New Ross (N) 30 02 47500 0 0 2 2 0 1 3 4 000 -025 -035 -060 0 -76200 -10500 -86700 -183
Smithborough (W) 54 01 56900 0 0 2 2 0 0 1 1 000 000 019 019 0 0 5700 5700 10
Carrickboy 55 02 57100 0 1 1 2 0 1 2 3 000 -007 -030 -037 0 -21500 -9000 -30500 -53
Gortahork 56 02 45500 0 0 1 1 1 0 4 5 -025 000 -080 -105 -570000 0 -24000 -594000 -1305
Dromore West 59 00 156200 0 1 3 4 0 0 0 0 000 015 069 084 0 44800 20700 65500 42
C3
Appendix C Evaluation of Traffic Calming Schemes Implemented 1997 ndash 2002
Location Rte Yr Construction Cost
4 Years Before 4 Years After Drop in Annual Collisions adjusted Cost Saving from Drop in Collision
Yearly Rate of Return
F S M Tot F S M Tot F S M Tot F S M Tot
Ballisodare 59 02 142700 0 0 0 0 0 0 0 0 000 000 000 000 0 0 0 0 0
Hodson Bay 61 01 432500 1 0 4 5 0 0 0 0 024 000 088 112 539200 0 26400 565600 131
Birr 62 01 94700 0 3 12 15 0 1 8 9 000 023 064 087 0 70400 19200 89600 95
Loughrea (W) 66 99 55400 0 0 1 1 0 1 2 3 000 -025 -027 -052 0 -76200 -8100 -84300 -152
Ballylickey 71 97 228500 0 1 0 1 0 1 1 2 000 -012 -025 -037 0 -35200 -7500 -42700 -19
Bantry (N) 71 02 115600 0 1 4 5 0 0 5 5 000 018 -045 -027 0 54700 -13400 41300 36
Clonakilty 71 99 331600 0 1 3 4 0 0 1 1 000 014 044 059 0 43100 13300 56400 17
Grangemockler 76 98 51900 1 0 1 2 0 0 0 0 019 000 023 042 434000 0 7000 441000 850
Kilkenny (N) 77 01 195200 0 0 6 6 0 0 8 8 000 000 -068 -068 0 0 -20400 -20400 -10
Newtown 78 02 181400 0 1 4 5 0 1 0 1 000 -007 080 073 0 -21500 24100 2600 1
Killeigh 80 99 97400 0 0 0 0 0 0 0 0 000 000 000 000 0 0 0 0 0
Kilmaine (N) 84 98 99800 1 0 0 1 0 0 0 0 019 000 000 019 434000 0 0 434000 435
Swanlinbar (S) 87 02 39900 0 0 1 1 0 0 1 1 000 000 -005 -005 0 0 -1500 -1500 -4
19457200 36 72 300 408 15 52 235 302 411 -249 920 1082 9376400 -759100 276100 8892000 46
C4
9
Evaluation of Traffic Calming Schemes Implemented 1997 ndash 2002Appendix B

2
Evaluation of Traffic Calming Schemes Implemented 1997 ndash 2002
National Roads Authority St Martinrsquos House Waterloo Road Dublin 4 Tel 01 660 2511 Fax 01 668 0009 infonraie wwwnraie
3 3
Evaluation of Traffic Calming Schemes Implemented 1997 ndash 2002
RS 472 Road Safety Engineering
Traffic Calming of Towns and Villages on National Roads
Evaluation of Schemes Implemented from 1997 to 2002
August 2008
L Curtis
4
Evaluation of Traffic Calming Schemes Implemented 1997 ndash 2002
Evaluation of Traffic Calming Schemes Implemented 1997 ndash 2002
TABLE OF CONTENTS page
Acknowledgements IV
Foreword V
Executive Summary VII
1 INTRODUCTION 1
11 Scope of Report 1
12 Background to Traffic Calming 1
13 Traffic Calming on National Routes 1
14 Collisions 3
2 TRAFFIC CALMING SCHEMES 5
21 Criteria for Selection 5
22 Traffic Calming Measures 6
23 Amendments to Design in 2004 10
3 TRAFFIC CALMING SCHEMES 1997 - 2002 11
31 Schemes Implemented over Period 1997 - 2002 11
32 Towns and Villages With Only One End Treated 15
33 Different Designs of Scheme 16
4 EFFECTIVENESS IN REDUCING COLLISIONS 21
41 Collisions Before and After Scheme Implementation 21
42 Area of Influence of Traffic Calming Works 21
43 Control Data 21
44 Effect on Collision Occurrence 22
45 Statistical Significance 24
46 Collision Costs and Economic Evaluation 24
47 Results by Type of Scheme 25
48 Results By Type of Collision 27
49 Results for Towns and Villages Treated at One End Only 28
5 CASE STUDIES 29
51 Comparison of Types of Traffic Calming Schemes 29
52 Successful Schemes 33
6 CONCLUSIONS 39
61 Reduction in Collisions 39
62 Reduction in Comparison with Control Data 39
63 Reduction in Severity of Collisions 39
64 Cost Benefit Analysis 39
65 Effects of Different Types of Schemes 39
i
Evaluation of Traffic Calming Schemes Implemented 1997 ndash 2002
7 RECOMMENDATIONS 41
REFERENCES 43
APPENDIX A A1
Ranking of Sites According to Primary Criteria for Selection for Traffic Calming
APPENDIX B B1
Scheme Details for All Sites
APPENDIX C C1
Collision Data Cost Data and First Year Rate of Return for All Sites
FIGURES AND TABLES
Summary Table
Figure 11 Approach to a typical village on national primary route 2
Figure 12 Typical wide entry into a town on national route 2
Figure 13 Typical wide open town centre with undefined road edge 3
Table 11 Collisions between 1994 and 1997 inside and outside urban areas 3
Table 21 Ranking of towns amp villages on national primary routes 5
Figure 21 Transition zone approaching village 7
Figure 22 A gateway 8
Figure 23 Inside gateway 9
Figure 24 Centre of village 10
Table 31 Schemes implemented per year 11
Table 32 Schemes implemented per year by county 12
Figure 31 Locations of traffic calming schemes 1997 to 2002 13
Table 33 Schemes implemented per year by route 14
Table 34 Types of traffic calming schemes 16
Figure 32 Typical gateway for types A B C and D 17
Figure 33 Typical gateway for types E F and G 18
Figure 34 Typical gateway for types H and I 18
Table 35 Types of traffic calming schemes by route 19
Table 41 Collisions before and after scheme implementation for each yearrsquos 22 programme
Table 42 Collision reductions for each yearrsquos programme 22
Table 43 Annual collision reductions for each yearrsquos programme 23
Table 44 Severities as a percentage of all collisions for each yearrsquos 23 programme
Table 45 Collision and cost saving for each yearrsquos programme 24
Table 46 Yearly rate of return 24
Table 47 Drop in collisions by type of scheme 26
ii
Evaluation of Traffic Calming Schemes Implemented 1997 ndash 2002
Table 48 Grouping type of scheme by type of gateway 26
Table 49 Types of scheme and their groupings 26
Table 410 Type of collision 27
Table 411 Division of schemes according to whether both ends were treated 28
Figure 51 Ballyshannon south approach 30
Figure 52 Ballybofey south approach 30
Figure 53 Ballybofey south zone inside gateway 31
Figure 54 Ballybofey south zone inside gateway 31
Figure 55 Killygordon west approach 32
Figure 56 Castlefinn west approach 32
Figure 57 Castlefinn centre before traffic calming 33
Figure 58 Castlefinn centre 33
Figure 59 Approach to a village similar to Grange before traffic calming 34
Figure 510 Gateway at Grange with central Island ndash Viewed from inside the 35village
Figure 511 Approach to Grange village centre from the north 35
Figure 512 Grange village centre 36
Figure 513 Approach to Newtwopothouse from north before traffic calming 37
Figure 514 Approach to Newtwopothouse from north 37
Figure 515 Crossroads at Newtwopothouse before traffic calming 38
Figure 516 Crossroads at Newtwopothouse with pedestrian crossing 38
iii
Evaluation of Traffic Calming Schemes Implemented 1997 ndash 2002
ACKNOWLEDGEMENTS
The NRA Road Safety Group which has funded the Traffic Calming programme since 1993
The NRA Regional Road Safety Engineers who not only co-ordinated the construction of the schemes but have also produced all the information and data used in this report
The Traffic Calming Working Group who first published Guidelines in 1999
The many Local Authority engineers who have designed and implemented the schemes
iv
Evaluation of Traffic Calming Schemes Implemented 1997 ndash 2002
FOREWORD
This report is the second in a series and examines the effectiveness of all traffic calming schemes that were completed between 1997 and 2002
It evaluates effectiveness by comparing collisions over four year periods both before and after construction of each scheme
A previous report ldquoEvaluation of Traffic Calming Schemes Constructed on National Roads 1993-1996rdquo covers schemes implemented before the period examined in this report
v
vi
Evaluation of Traffic Calming Schemes Implemented 1997 ndash 2002
Evaluation of Traffic Calming Schemes Implemented 1997 ndash 2002
EXECUTIVE SUMMARY In July 1998 the Government published ldquoThe Road to Safetyrdquo its strategy for road safety over the period 1998 ndash 2002 followed by a further strategy in 2004 for 2004 - 2006 A third Road to Safety document has recently been published setting out the governmentrsquos strategy for road safety over the period 2007 ndash 2012 with a target to reduce fatalities by 20 to 250 per year and to reduce injuries by 25 Under the terms of all strategies the National Roads Authority has been charged with undertaking a number of specific tasks In each of the strategies one of the tasks for NRA has been the implementation of traffic calming at towns and villages on the network of national roads and the evaluation of the effectiveness of these schemes This evaluation will enable NRA to prioritise the future programme of traffic calming by assessing the effectiveness of implemented schemes and identifying the successes of previous programmes
This report examines traffic calming schemes constructed between 1997 and 2002 It describes the principle behind traffic calming in reducing speed by altering the appearance of the road on the approach to the townvillage through the use of ldquogatewaysrdquo and by further traffic management measures within the town itself It lists the schemes undertaken in each of the six years from 1997 to 2002 and summarises the pershyformance of these schemes The report measures the effectiveness of the programmes based on collision data for a 4 year before period and a 4 year after period for each scheme
The objective of the traffic calming programme is to reduce the number and severity of collisions occurring in the treated towns and villages by reducing speed at these locations It has achieved that objective reducing the overall number of collisions by 13 Moreover the number of fatal collisions was reduced by 52 thus lowering the overall severity of crashes at traffic calming locations The number of serious and minor injury collisions decreased by 9
Between 1997 and 2002 there were 94 traffic calming schemes completed at towns and villages on the national roads 91 of these were evaluated and a summary of the results is shown below
Summary Table
Year of Completion
No of Schemes
Cost of Construction
euro
Reduction in Collisions (4 years adjusted)
Cost saving in Collisions per
year euro
Yearly Rate of Return
Fatal Serious Minor 1997 12 euro3024600 6 -6 1 euro2655300 88 1998 14 euro1852900 2 -2 -1 euro865600 47 1999 18 euro5369900 3 5 14 euro2177500 41 2000 9 euro1882000 -1 -4 6 -euro1034500 -55 2001 23 euro3881400 6 -4 25 euro3587700 92 2002 15 euro3446600 1 1 -7 euro641800 19
All Years 91 euro19457200 16 -10 37 euro8893400 46
The above table shows that comparing the four year period before with the four year period after each scheme and allowing for the overall decrease in collisions over the same period nationwide at similar sites there was an overall reduction of 43 collisions Fatal collisions reduced by 16 and minor injury collisions by 37 while serious injury collisions increased by 10 The cost (in 2002 market prices) of all the schemes constructed between 1997 and 2002 was just under euro195 million and the overall annual cost saving in collisions nearly euro89 million The Yearly Rate of Return of each yearrsquos programme varied quite considerably but averaged at 46 In cost benefit terms the schemes effectively paid for themselves within 2 years and are still creating annual savings of euro9m every year into the future
vii
viii
Evaluation of Traffic Calming Schemes Implemented 1997 ndash 2002
Evaluation of Traffic Calming Schemes Implemented 1997 ndash 2002
1 INTRODUCTION
11 Scope of Report In July 1998 the Government published ldquoThe Road to Safetyrdquo its strategy for road safety over the period 1998 ndash 2002 followed by a further strategy in 2004 for 2004 - 2006 The primary target of each of these was to reduce fatalities from road crashes by 20 from 1997 levels by 2002 and by 25 from average 1998 - 2003 levels by 2006 A third Road to Safety document has recently been published setting out the governmentrsquos strategy for road safety over the period 2007 ndash 2012 with a target to reduce fatalities by 20 to 250 per year and to reduce injuries by 25
Under the terms of all strategies the National Roads Authority has been charged with undertaking a number of specific tasks In each of the strategies one of the tasks for NRA has been the implementation of traffic calming at towns and villages on the network of national roads and the evaluation of the effectiveness of these schemes This evaluation will enable NRA to prioritise the future programme of traffic calming by assessing the effectiveness of implemented schemes and identifying the successes of previous programmes
This report examines traffic calming schemes constructed between 1997 and 2002 under the NRA programme of traffic calming for towns and villages located on national routes
12 Background to Traffic Calming Traffic calming is a way of reducing vehicle speeds by self-enforcing traffic engineering methods In Ireland two main types of traffic calming are used-
a) Traffic calming applied on national roads and other busy inter-urban roads to manage the speed of traffic passing through towns and villages located on these routes
b) Traffic calming on local urban and residential streets to manage both speed and volume of traffic on a number of streets within an area
Type a) is the form of traffic calming examined in this report
13 Traffic Calming on National Routes In towns and villages on the national road network reducing speed is the primary goal of traffic calming Posting of speed limits alone does not result in a significant reduction in speed (2005 Survey of Free Speeds NRA) since drivers typically drive at the speed they perceive as being safe A driverrsquos perception of what is safe is related to the design of the road which includes lane width curvature corner radii and available stopping-sight distance Traffic calming essentially reduces vehicle speeds by changing these elements of the roadrsquos design and thus driversrsquo perceptions of the road ahead
The transition zone between the high speed road approaching the village and the low speed street inside the village represents a difficult safety management problem In Ireland the problem first became apparent over twenty-five years ago with the proliferation of improved road sections with hard shoulders on the national roads Where these improved sections adjoined towns and villages approach speeds increased and the sections showed higher collision rates than rural sections
Many towns and villages are positioned on national roads Drivers travelling the national routes at speeds appropriate to through routes are often still travelling at those high speeds when entering towns and villages and maintain those speeds as they travel through the urban area Inside towns and villages the
1
Evaluation of Traffic Calming Schemes Implemented 1997 ndash 2002
national road usually functions as a typical main street with shops pubs housing school and church and their accompanying pedestrian and parking activity These types of activities would be more safely carried out in an environment where low speed prevails At higher speeds drivers have less time to react and are able to process less information in their field of view and the severity of injury is higher when a collision does occur For a pedestrian struck by a vehicle travelling at 64kmh the likelihood of them being killed is 85 at 48kmh the likelihood is 45 and at 32kmh it is 5 (ETSC Reducing Traffic Injuries Resulting From Excess and Inappropriate Speed 1995)
Figure 11 Approach to a typical village on national primary route
Figure 12 Typical wide entry into a town on national route
2
Evaluation of Traffic Calming Schemes Implemented 1997 ndash 2002
Figure 13 Typical wide open town centre with undefined road edge
14 Collisions The objective of the traffic calming programme is to reduce the number of collisions occurring in the treated towns and villages by reducing the speed of vehicles travelling through these locations In the four years before this programme of traffic calming started between 1994 and 1997 nearly half of the 9956 injury collisions on national roads occurred in urban areas Table 11 shows the breakdown of collision severity between rural and urban areas All areas where the speed limit at the time was 40mph or below were taken as ldquourbanrdquo
Table 11 Collisions between 1994 and 1997 inside and outside urban areas
Severity Urban National Roads Rural National Roads All National Roads
Fatal 161 531 692
Serious Injury 851 1573 2424
Minor Injury 3475 3365 6840
Total 4487 5469 9956
3
4
Evaluation of Traffic Calming Schemes Implemented 1997 ndash 2002
Evaluation of Traffic Calming Schemes Implemented 1997 ndash 2002
2 TRAFFIC CALMING SCHEMES
21 Criteria for Selection The criteria used for selection of towns and villages for traffic calming are set out in detail in the NRA document ldquoGuidelines On Traffic Calming For Towns And Villages On National Routesrdquo This was first published in 1999 and was updated in 2004
For the traffic calming programme over the years studied in this report (1997 ndash 2002) the criteria used to select sites for inclusion in the programme were those laid down in the Guidelines The period of implementation covered in this report starts in 1997 which was before the publication of the Guidelines However the principles were already in operation within the NRA Road Safety Group and the selection of sites in the early part of this period followed more or less the same process as the later ones
The main criterion was the collision history in and on approach to the village but data on all the following were collected when considering a location
Collisions Traffic flow Speed Geometry Future infrastructural developments
Collisions
The Guidelines states that selection based on collisions should take account of not just the simple collision numbers but should assess both risk per unit of travel and risk per head of population in the town or village In order to do this assessment a table was drawn up in 1999 listing these two risk categories for all towns and villages on national roads and ranking them according to a combination of the two categories The resulting table for national primary roads is reproduced in Appendix A but for illustration the 15 top ranking towns and villages on national primary roads are shown in Table 21 These 15 sites were all treated in the early years of the traffic calming programme 12 of them are among those examined in this report 3 were implemented before 1997 and were assessed in the preceding report to this
Table 21 Ranking of towns amp villages on national primary routes
Route Town Village Population AADT Length Colls over 5 yrs
Collisions per 10 Million VehKm
Collisions per year per
1000 Population
Combined Collision
Rate
N17 BALLINDINE 232 5058 0587 8 148 690 640
N25 KILRANE 214 5310 2255 10 46 935 559
N08 LITTLETON 566 5598 0591 10 166 353 508
N11 ASHFORD 500 12768 1352 19 60 760 501
N01 JULIANSTOWN 450 14270 1146 16 54 711 463
N05 FRENCHPARK 272 2994 0805 11 250 809 452
N02 COLLON 335 6164 0626 7 99 418 408
N18 KILCOLGAN 500 9565 0483 9 107 360 393
N08 WATERGRASSHILL 250 13706 0985 8 32 640 385
N01 CASTLEBELLINGHAM 762 10983 1891 20 53 525 368
N08 RATHCORMACK 500 11807 1158 11 44 440 308
N09 DUNGARVAN 500 3261 028 4 240 160 280
N04 DROMOD 250 3598 059 3 77 240 275
N20 CHARLEVILLE 3000 9655 1988 12 34 400 269
N25 LEMYBRIEN 222 6471 0918 4 37 360 254
5
Evaluation of Traffic Calming Schemes Implemented 1997 ndash 2002
Using the method of combining the two collision risk categories meant that small villages where there had been only a few collisions such as Dungarvan on N9 or Dromod on N4 ranked as highly as large towns with long lengths of national road and a higher number of collisions such as Charleville on N20 Thus several small villages where the actual collision numbers were low were given high priority in the traffic calming programme because the risk to road users from high speed traffic was comparatively high whereas many large towns with very much bigger numbers of actual collisions did not get priority
Speed
Selection is also based on the speed of vehicles in the towns and villages considered If speeds through a certain location were already low then that town or village was not given priority in the traffic calming programme Often this assessment would result in only one approach to a town or village being treated as described in section 32
Geometry
The other major criterion was the geometry of the road within the town or village considered If the separate physical elements that make up a traffic calming scheme especially that of narrowing the carriageway could not be applied to a certain location then a traffic calming scheme could not be fully implemented However several schemes were indeed implemented in towns and villages where the road width was already narrow prior to construction of the scheme These schemes often consisted of only signs and road markings this is discussed further in section 33
Other Factors
It must be acknowledged that several of the towns and villages assessed within this report did not have a collision history and did not have any record of high speeds before implementation of the traffic calming These sites were often selected for traffic calming because general road improvement work was scheduled at this location and traffic calming elements were incorporated into the work In some cases sites were selected solely on the basis of the perception of risk by residents and their representatives
22 Traffic Calming Measures The measures used as part of traffic calming break down into the four separate zones travelled through on approach to a town or village
bull the transition zone bull the gateway at the speed limit signs bull the zone inside the gateway bull the village centre
In small villages with a short length of national road there is usually no distinction between the last two zones but in the larger villages and towns there is often a zone which is inside the speed limited area yet cannot be described as a town centre These zones typically have either low density housing with off-street parking or warehouse-type commercial premises with sparsely spaced accesses
6
Evaluation of Traffic Calming Schemes Implemented 1997 ndash 2002
Transition Zone The principle behind traffic calming design is to change the driverrsquos perception of the surrounding environshyment
Figure 21 Transition zone approaching village
The ldquooptical widthrdquo perceived by the driver is dependent on the width between the boundaries of the road relative to the height of the adjoining vertical elements Generally in rural sections the width between fences is many times greater than the height of the hedges walls or fences which form the boundaries In urban streets the height of the buildings is generally greater than the width A driverrsquos perception of the appropriate driving speed is influenced by this relationship Speeds are lower where the height of the vertical elements is greater than the width of the road
Traffic calming aims to create a narrow optical width on the approach into towns and villages by using a combination of carriageway narrowing landscape treatment and the introduction of vertical elements such as signs lighting columns and trees Typically transition zone signs consist of a pair of ldquoTraffic Calming Aheadrdquo signs 400m from gateway and a pair of ldquoDo Not Passrdquo signs at 200m from the gateway
Gateway
The Gateway is placed at the start of the speed limited zone It should mark a definite change in the character of the surrounding area from rural to urban Therefore it needs to be conspicuous and the most prominent element in the transition zone The tall signs positioned close to the driving lane narrow the optical width
The guidelines recommend that where a town or village has two zones of speed limits first a 60kmh on the outskirts and then a 50kmh limit for the main body of the town the gateway should be placed at the change from 60kmh to 50kmh This is because usually the 50kmh limit has been placed at the edge of the properly built up area and the 60kmh zone covers the approach into the town where development is much less dense The design engineer can however choose to place the gateway at the 60kmh if surrounding development and environment are appropriate for this This has been done in a few of the cases examined
7
Evaluation of Traffic Calming Schemes Implemented 1997 ndash 2002
Figure 22 A gateway
Gateways fall into two distinct groups those with a solid kerbed central island and those with no island Early results from the first batch of traffic calming schemes constructed indicated that the presence of a central island at the gateway was a determining factor in the success of the scheme and the evaluation in this document confirms this The central island greatly increases the visual narrowing effect and the central lighting column signs and bollards are directly in the centre of the driverrsquos field of view
The gateway is always lit to a high standard with special gateway lanterns that shine directly onto the gateway signs This is not only effective in the dark during daylight hours the presence of lighting columns enhances the narrow optical width and is often noted subconsciously by the driver as an indication of an urban area
Inside Gateway
Treatment of the stretch of road between the gateway and the village centre is an important aspect of traffic calming The narrowing introduced at the gateway is continued so that the speed reduction occurring at the gateway is maintained on the driverrsquos journey through the town
This narrowing can be done by introducing any or all of the following central islands footpaths side kerb buildouts lining hatched markings and defined parking bays A shallow chicane can also sometimes be introduced by alternating side buildouts and parking between the two sides of the road The objectives are both to keep the driving lanes at no greater than 35m width and to give a visual impression to the driver of an urban area
Only narrowing and horizontal deflections are used as measures in traffic calming installations on national routes Vertical deflections such as humps or cushions are not appropriate because of the roadsrsquo function as main distributors between the major urban areas of the country Emergency vehicles and buses cannot easily negotiate routes where vertical deflection has been installed
As every gateway must be provided with lighting to illuminate the signs the infrastructure to supply street lighting needs to be provided at each end of the town or village It therefore follows that the supply for lightshying is usually available over the whole length of the village and lighting is provided over the full length of the scheme from gateway to gateway In the cases examined there are a few exceptions to this but even these few villages have street lighting for almost all of their length with only a few short gaps where no lamps are provided
8
Evaluation of Traffic Calming Schemes Implemented 1997 ndash 2002
Figure 23 Inside gateway
Town or Village Centre
In the town centre there is often not a need for narrowing works as part of the traffic calming as parking bays and footpaths may already exist However in locations where there is a wide road passing through the village centre it is necessary to narrow and define the through route with kerbing Even in locations where the through route is already well defined with kerbing and parking bays extra measures are usually required at junctions and where pedestrians wish to cross the national road or to cross side roads while walking along the main street
Typical works in the town centre are
bull definition of the limits of existing parking using kerb buildouts bull definition of junctions by the use of kerb buildouts bull provision of either pedestrian crossings or central islands to aid pedestrians in crossing
The main objective in the centre of the town or village is to provide a safe and pleasant environment that can easily be negotiated by vulnerable road users Thus it is important to provide safe places to cross where pedestrians are clearly visible to passing traffic and wide footpaths so that pedestrians are not forced to step into the road when passing others This often necessitates a reduction in the number of on street parking spaces and it can be difficult to persuade the local residents to accept this Extra off-street parking may have to be provided as part of the traffic calming scheme However there is a clear road safety advantage in both providing better facilities for pedestrians and in moving parking to off-street facilities Quite apart from the pedestrian collisions that result from vehicles reversing in and out of parking spaces and from parked vehicles masking crossing pedestrians as they step out onto the road many minor material damage collisions occur as vehicles pull in and out of parking spaces on busy through routes
9
Evaluation of Traffic Calming Schemes Implemented 1997 ndash 2002
Figure 24 Centre of village
23 Amendments to Design in 2004 The Guidelines on Traffic Calming were revised in 2004 Some of the changes made in this revision arose directly from problems encountered during construction and consequent operation of the schemes evaluated here There were numerous minor amendments but two of the main changes to design are worth notingshy
a) Increase of setback of signs The setback distance of the edge of the gateway signs from the kerb was originally specified as 600mm This width of setback was thought to provide enough clearance for overhanging loads on large vehicles while still giving the visual narrowing effect that was needed for the traffic calming gateway to be effective However in practice many gateway signs installed to this specification were hit glancing blows by passing large vehicles especially in areas where there was a significant proportion of agricultural vehicles in the mix of traffic
Consequently the specification was changed to a setback of 1m from the kerb So far this increased width appears to have succeeded in reducing the number of signs damaged by overhanging loads
b) Increase of ldquoexitrdquo width Where a central island is provided at a gateway the island and its signs and lighting column all form an obstruction for any abnormally wide load wishing to pass Whenever a wide load wishes to use the route through a village with this design of traffic calming the central lighting columns at each gateway must be temporarily disconnected and removed resulting in much inconvenience and an extra workload for the local authority and electricity supply engineers
To try to avoid this lengthy process of disconnection and removal an alternative design for gateways was put forward with extra width on the ldquoexitrdquo half of the gateway such that the width between edge kerb and central island on the lane for traffic approaching the village remains at the original 35m specified but the corresponding width on the lane for traffic leaving the village could be increased to anything up to 6m This design manages to keep the narrow optical effect for drivers approaching the village but provides an alternative route for wide loads which are guided through the approach to the village on the exit side of the central island
10
Evaluation of Traffic Calming Schemes Implemented 1997 ndash 2002
3 TRAFFIC CALMING SCHEMES 1997 - 2002
31 Schemes Implemented over Period 1997 - 2002 Between 1997 and 2002 there were 94 traffic calming schemes completed at towns and villages on the national roads Three of these schemes could not be evaluated because the collision data in the before period was considered to be unduly influenced by traffic calming on the other approach to the same village that had been implemented before 1997
The remaining 91 towns and villages have been assessed in this study
Table 31 below gives the number of schemes constructed per year and their costs Table 32 shows the spread across the different counties and Table 33 shows the spread across the national routes Figure 31 shows the locations of all the 94 schemes implemented in the period examined A detailed list of the 91 locations assessed and the measures implemented is given in Appendix B
Table 31 Schemes implemented per year
Year No of Schemes
Cost euro (market prices at
time of construction)
Cost euro (2002 prices)
Average Cost per Scheme euro
(2002 prices)
1997 12 1803000 3024500 252000
1998 14 1178800 1852900 132300
1999 18 3691800 5369900 298300
2000 9 1445200 1882000 209100
2001 23 3496400 3881300 168800
2002 15 3446600 3446600 229800
TOTALS 91 15061800 19457200 213800
The number of schemes constructed each year stayed roughly constant the average being about 15 or 16 per year There was a slight dip in the number finished in 2000 but there was a corresponding rise the next year The bulk of construction for most schemes took place within one year but where schemes carried on into following years it is the final year that is taken as the year of construction
The average cost per scheme was euro214000 over the six years All costs in this report are market prices given in 2002 prices The cost of an individual scheme varies immensely from euro16000 to euro785000 (See Appendix B) but the measures implemented in each scheme also varied greatly Some schemes were simply the installation of just 12 signs on approach to a village others included extensive urban renewal works including the complete restructuring of drainage and electricity supply for the village
Table 32 and Figure 31 show a fairly even spread of traffic calming implementation geographically across the country but it can be clearly seen in Table 33 that the majority of schemes implemented were on national primary roads Of all the schemes examined 81 are on primary routes and in the early years this division is even more marked with 88 of schemes implemented in 1997 and 1998 being on primary routes The fact that mainly primary routes were treated in the early years of the traffic calming programme can be directly attributed to the geometry of the national routes through these towns and villages Approaches to many urban areas on the primary routes had been realigned and widened during the twenty to thirty years preceding the traffic calming programme allowing traffic to approach the town or village at increased speed This increased speed and the consequent increase in collisions then identified these towns and villages as priority sites for traffic calming treatment On national secondary routes there had not
11
Evaluation of Traffic Calming Schemes Implemented 1997 ndash 2002
been such a widespread programme of realignment and widening and approaches to urban areas have mostly remained narrow Consequently on national secondary roads speeds are not so high on the approaches to urban areas collision rates also are not high and few towns and villages on secondary roads have met the criteria for the traffic calming programme
Table 32 Schemes implemented per year by county
Local Authority 1997 1998 1999 2000 2001 2002 Total
Cavan 1 1
Clare 2 2
Cork 2 3 2 4 11
Donegal 2 2 3 7
Galway 1 3 1 5
Kerry 2 2
Kildare 1 1
Kilkenny 1 1 2 4 8
Laois 2 2 4
Leitrim 1 1 2
Longford 1 1 2
Louth 4 1 5
Mayo 1 1 1 1 4
Meath 1 2 1 1 5
Monaghan 1 1 2 4
Offaly 1 2 3
Roscommon 2 2
Sligo 1 3 1 1 6
South Tipperary 2 1 2 5
Waterford 1 1
Westmeath 1 1 1 3
Wexford 1 2 2 2 7
Wicklow 1 1
Total 12 14 18 9 23 15 91
12
Evaluation of Traffic Calming Schemes Implemented 1997 ndash 2002
Figure 31 Locations of traffic calming schemes 1997 to 2002
13
Evaluation of Traffic Calming Schemes Implemented 1997 ndash 2002
Table 33 Schemes implemented per year by route
Route 1997 1998 1999 2000 2001 2002 Total
1 2 1 1 4
2 2 1 1 1 1 6
3 1 1
4 1 1 3 1 1 7
5 1 1 2
6 1 2 3
7 1 1 1 3
8 2 2
9 1 2 3
10 1 1 2
11 1 1 2
14 1 1
15 2 2 2 2 8
17 1 1 2
18 2 2 4
20 1 2 1 4
22 1 2 1 2 6
24 2 1 2 5
25 2 1 2 1 6
26 1 1
30 1 1 2
54 1 1
55 1 1
56 1 1
59 1 1 2
61 1 1
62 1 1
66 1 1
71 1 1 1 3
76 1 1
77 1 1
78 1 1
80 1 1
84 1 1
87 1 1
National Primary 11 12 15 8 19 9 74
National Secondary 1 2 3 1 4 6 17
Total 12 14 18 9 23 15 91
14
Evaluation of Traffic Calming Schemes Implemented 1997 ndash 2002
32 Towns and Villages With Only One End Treated
At 33 of the 94 locations implemented between 1997 and 2002 only one approach to the town or village was treated with traffic calming within this period
In 8 of these cases the one approach treated was the only entry of that route into a large town or city or into a coastal town where the route ended
In 6 of these towns and villages the other approach had already been treated in previous years before 1997 and the second treatment completed the traffic calming for the location In 3 of these villages it was considered that the first phase of traffic calming would have had an effect on collisions in the very same area that was influenced by the second phase Thus the ldquobeforerdquo data for the second phase of work would not have been usable and it was not possible to evaluate changes in collision data These are the three locations that have been removed from the evaluation The other three towns were large enough for the areas of influence from each phase of traffic calming not to overlap and consequently the collision data was not influenced by the first phase
In 2 towns the traffic calming within the study period 1997 - 2002 was the first phase in a two phase implementation and the second approach has since been treated in subsequent years In each of these towns the two areas of influence from the separate phases of work are considered not to overlap and so these two have been included in the study
For each scheme the ldquoevaluated areardquo over which the traffic calming is considered to have had an effect on collisions is described in the scheme details in Appendix B
In the other 17 cases the decision to treat only one approach was generally taken because the other end of town was not considered a suitable case for traffic calming The reasons for this were varied but broadly fell into two different categories
a) An existing feature in the road such as a right angled bend narrow bridge or a roundabout already acted as a measure to slow approaching traffic such as the northern approach to Ardee on N2 or the southern approach to Crusheen on N18
b) Traffic approaching the town or village from this particular direction was observed to be travelling slowly in general and did not need to be slowed further Usually this was because another nearby town or village had effectively slowed the traffic down and drivers had not yet regained the feel of an open road and speeded up The western approach from Dromod to Roosky on N4 and the southern approach from Ennis to Barefield on N18 are examples of this
15
Evaluation of Traffic Calming Schemes Implemented 1997 ndash 2002
33 Different Designs of Scheme
As traffic calming schemes are made up of all the different elements described in section 22 there is a very large number of variations possible but the 91 schemes examined can be broadly divided into 10 different types as follows-
A Gateway with side buildouts and central island Definition inside village using central islands and narrowing with kerbs
B Gateway with side buildouts and central island Definition inside village using narrowing with kerbs but no islands
C Gateway with side buildouts and central island Definition inside village using line marking only
D Gateway with side buildouts and central island No definition inside village
E Gateway with side buildouts only Definition inside village using central islands and narrowing with kerbs
F Gateway with side buildouts only Definition inside village using narrowing with kerbs but no islands
G Gateway with side buildouts only Definition inside village using line marking only
H Gateway signs only Definition inside village using line marking only
I Gateway signs only No definition inside village
J No gateway Definition inside village using narrowing with kerbs but no islands
Table 34 shows the number of schemes in each category and whether the traffic calming was done at both ends of the town or village or whether it was installed only at one end Towns and villages where traffic calming was constructed at only one end are indicated in Figure 31 and in the appendices lists by (W) (N) (E) or (S) following the town name
Table 34 Types of traffic calming schemes
Type Treatment no of villages
both ends
one end
A Central island gateway central islands amp narrowing with kerbs inside 39 29 10
B Central island gateway narrowing with kerbs amp no islands inside 8 3 5
C Central island gateway and lining 5 5
D Central island gateway and nothing else 1 1
E Simple gateway central islands amp narrowing with kerbs insides 10 5 5
F Simple gateway narrowing with kerbs amp no islands inside 11 10 1
G Simple gateway and lining 5 2 3
H Gateway signs and lining 3 3
I Gateway signs and nothing else 8 6 2
J No gateway narrowing with kerbs amp no islands inside 1 1
Total 91 64 27
16
Evaluation of Traffic Calming Schemes Implemented 1997 ndash 2002
The largest single category is type A with a gateway with side buildouts and central island with a string of central islands through the village approach and in the centre and also narrowing from the side with kerb buildouts through the approach and centre Most of the 39 schemes in this category give the full impression of a village at the point of passing the gateway and most have footpaths throughout the scheme from gateway to gateway They all have street lighting through the entire scheme
Another 14 sites have the full gateway with a central island and side buildouts but do not have such extensive works inside the village These fall into categories B C and D Types A B C and D are generally on national primary routes very few are on secondary routes Figure 32 illustrates a typical gateway into such a village where the wide carriageway is narrowed by kerbing the hard shoulder and inserting a central island
Figure 32 Typical gateway for types A B C and D
The next two biggest single categories are type E with 10 schemes and type F with 11 schemes These types along with type G have a gateway that has no central island but which does narrow the road using kerbed buildouts at the side of the road usually in the hard shoulder Types E F and G were installed at towns where the width of the approach into town was wide enough to warrant traffic calming but was less than the 157m minimum needed to accommodate central island signs and cycle bypass Types E F and G have varying degrees of definition work inside the village similar to types A B and C Figure 33 illustrates a typical gateway into such a village where the wide carriageway is narrowed by kerbing the hard shoulder but there is no central island
Types H and I do not have physical works at the gateway at all Typically there is no hard shoulder at these sites and the gateway signs and transition zone signs are simply installed on the verge In type H schemes some visual narrowing has been implemented inside the village using line markings and hatching but in type I there is nothing done other than installation of the gateway and transition zone signs The one scheme that was installed on a dual carriageway approach to a city falls into the category of type H Figure 34 illustrates a typical gateway into such a village where there is no narrowing or kerbs installed just signs placed in the verge
17
Evaluation of Traffic Calming Schemes Implemented 1997 ndash 2002
Figure 33 Typical gateway for types E F and G
Figure 34 Typical gateway for types H and I
One scheme examined in this report had neither gateway signs nor transition zone installed However extensive works were done in the centre of the small village to narrow the carriageway and define the parking areas behind kerbs This village does not fall into any the other categories and is the only type J in the study
For the purposes of examining results types A B C and D can be grouped together as a ldquoCentral Island Gatewayrdquo category types E F and G can be grouped together as a ldquoSimple Gatewayrdquo category and types H and I can be grouped together as a ldquoSigns Onlyrdquo category
Table 35 shows the incidence of each type of traffic calming scheme on each national routes Although there is a wide spread of types across all roads it can be seen that types A B C and D are mostly on the national primary roads while types H and I are largely on the national secondary routes and those sections of national primaries where widening has not taken place
18
Evaluation of Traffic Calming Schemes Implemented 1997 ndash 2002
Table 35 Types of traffic calming schemes by route
Route Type of Scheme
A B C D E F G H I J No in Study
1 1 1 1 1 4
2 4 1 1 6
3 1 1
4 2 3 1 1 7
5 1 1 2
6 1 2 3
7 1 1 1 3
8 2 2
9 1 2 3
10 1 1 2
11 1 1 2
14 1 1
15 4 1 1 2 8
17 1 1 2
18 2 1 1 4
20 3 1 4
22 2 1 1 1 1 6
24 2 1 2 5
25 5 1 6
26 1 1
30 1 1 2
54 1 1
55 1 1
56 1 1
59 2 2
61 1 1
62 1 1
66 1 1
71 1 1 1 3
76 1 1
77 1 1
78 1 1
80 1 1
84 1 1
87 1 1
National Primary 34 6 3 1 7 11 5 2 4 1 74
National Secondary 5 2 2 3 1 4 17
Total 39 8 5 1 10 11 5 3 8 1 91
19
20
Evaluation of Traffic Calming Schemes Implemented 1997 ndash 2002
Evaluation of Traffic Calming Schemes Implemented 1997 ndash 2002
4 EFFECTIVENESS IN REDUCING COLLISIONS
41 Collisions Before and After Scheme Implementation Collision numbers were measured at each of the 91 locations for the 4 years before and 4 years after implementation of each individual scheme The ldquoafterrdquo period was taken as beginning in the year after the final year of construction as the full effect of the scheme would not be noticeable during construction works Details of the collision data for each site are given in Appendix C but summary tables are given in this chapter
42 Area of Influence of Traffic Calming Works Collision numbers for both before and after data were taken from the map-based NRA Collision Database Only collisions taking place on the national routes were considered and any collision that was located within the length of road influenced by the traffic calming was included in the data This area of influence extended to 200m outside each gateway in order to take account of the effect of the transition zone Where only one side of a village was treated the area taken was from the gateway to the centre of the town Where an existing traffic calming feature existed within the speed limited zone on the entry into a town such as a sharp bend or a narrow bridge the area of influence was assumed to extend only as far as that feature Descriptions of the area of influence for each location are given in the detailed list of locations in Appendix B
43 Control Data This report takes account of the main confounding factors affecting these statistics Collision numbers in general on Irelandrsquos national roads have decreased throughout the before and after periods for these schemes and the assessment makes allowances for this trend Changes in traffic volume in patterns of traffic flow in population distribution in Garda enforcement and in attitude to road safety have all had an effect on collision rates on national roads in towns and villages whether or not traffic calming has been installed This effect is accommodated by adjusting the before and after data in line with a comparison group the collisions in each 4 year before and after period within all similar sized towns and villages on all national roads
The general trend nationwide within all towns and villages in the control group has been a drop in collisions of roughly 15 between before and after periods However the reduction varies markedly between the different collision rates fatal collisions have reduced by a similar percentage to the general trend but serious injury accidents have reduced by over 40 and minor injuries have reduced by only about 10 All reductions in collisions at the sites assessed in this study have to be compared against this general nationwide trend of a shift from serious injury to minor injury
The effect of ldquoregression to meanrdquo is more difficult to make allowances for in this study The random nature of road crashes tends to cause collision frequencies at specific locations to fluctuate The selection of towns and villages for treatment on the basis of their past collision record can introduce a source of potential bias in measuring the effectiveness of the scheme This arises because the selection process tends to pick sites at the peak of their fluctuations in collision frequencies and such sites might well have experienced reductions in collision rate in following years even if no treatment had been applied (Rune Elvik 2002)
To allow for the effect of regression to mean the change in collision rates at treated sites would need to be compared with a number of similar untreated control sites This could not have been done in the case of the traffic calming programme as no such control sites exist Whenever a town or village with a collision history was identified it was put on the programme for treatment with traffic calming it would have been considered unacceptable to leave the location untreated simply for the purposes of research
21
Evaluation of Traffic Calming Schemes Implemented 1997 ndash 2002
44 Effect on Collision Occurrence
Table 41 shows for each yearrsquos programme of traffic calming schemes the collisions over the 4 years before and after each scheme
Table 41 Collisions before and after scheme implementation for each yearrsquos programme
Year No of
Schemes
4 Years Before 4 Years After
Fatal Serious Minor Total Fatal Serious Minor Total
1997 12 10 16 52 78 3 15 51 69
1998 14 5 8 31 44 2 6 30 38
1999 18 5 23 54 82 1 8 36 45
2000 9 2 4 27 33 3 6 19 28
2001 23 10 13 95 118 3 12 59 74
2002 15 4 8 41 53 3 5 40 48
Total 91 36 72 300 408 15 52 235 302
The reduction in collisions for each yearrsquos programme is shown in Table 42 as is the adjusted reduction allowing for the general drop in collisions over the study years in the control group of other similar sites Table 43 shows these adjusted drops in annual terms and in percentages
All this data for each individual scheme can be seen in Appendix C
There is considerable fluctuation in results between each yearrsquos programme of traffic calming so it is best to concentrate on the overall figures for the entire six years
Over all 91 sites there was a drop of 106 collisions from 408 to 302
When adjusted for the general nationwide fall in collisions on similar sites this gives a total drop of 433 colshylisions or 108 per year
This is a 13 reduction on the collision numbers before implementation of the schemes
Table 42 Collision reductions for each yearrsquos programme
Year No of
Schemes
4 Year Reduction 4 Year Reduction Adjusted
Fatal Serious Minor Total Fatal Serious Minor Total
1997 12 7 1 1 9 55 -64 06 -03
1998 14 3 2 1 6 18 -20 -12 -15
1999 18 4 15 18 37 30 50 140 220
2000 9 -1 -2 8 5 -14 -36 59 08
2001 23 7 1 36 44 65 -37 246 274
2002 15 1 3 1 5 11 07 -71 -52
Total 91 21 20 65 106 164 -100 368 433
22
Evaluation of Traffic Calming Schemes Implemented 1997 ndash 2002
Table 43 Annual collision reductions for each yearrsquos programme
Year No of
Schemes
Annual Drop in Collisions Adjusted Percentage Drop in Collisions
Fatal Serious Minor Total Fatal Serious Minor Total
1997 12 14 -16 01 -01 65 -74 1 -0
1998 14 05 -05 -03 -04 47 -51 -4 -4
1999 18 07 13 35 55 75 39 28 33
2000 9 -04 -09 15 02 -88 -55 24 3
2001 23 16 -09 62 69 68 -44 29 27
2002 15 03 02 -18 -13 27 13 -21 -12
Total 91 41 -25 92 108 52 -24 14 13
While collisions of all severity types at the examined locations have reduced in actual numbers the decrease in serious injury collisions at these sites has not followed the general trend nationwide over this period on national roads which have experienced a particularly large decrease in serious injury collisions When allowing for the trend in the control data the actual reduction of 20 serious injury collisions in a 4 year period translates to a relative increase of 10 collisions
Looking at each individual severity type the adjusted reduction in fatal collisions is 164 or 41 per year and that in minor injury collisions is 368 or 92 per year The adjusted change in serious injury collisions is an increase of 25 per year These numbers represent a 52 drop in fatal collisions a 14 drop in minor injury collisions and a 24 rise in serious injury collisions
The implementation of traffic calming has clearly had a much more marked effect on fatal collisions than on other injury collisions resulting in a lowering of the severity of collisions overall Table 44 below shows for each year each severity category as a percentage of overall collisions in the 4 years before implementation and the 4 years after implementation It can be seen that in general for each yearrsquos programme except for year 2000 the proportion of fatal collisions has roughly halved the proportion of serious collisions has stayed much the same while that of minor collisions has slightly increased Looking at the entire six yearsrsquo programme in the four years before implementation of each traffic calming scheme fatal collisions constituted 9 of all collisions in these towns and villages while serious and minor injury collisions were 18 and 73 of the total respectively In the four years after implementation fatal collisions decreased to 5 of all collisions serious reduced very slightly to 17 and minor rose to 78
Table 44 Severities as a percentage of all collisions for each yearrsquos programme
Year No of
Schemes
Percentage of all Collisions 4 years before
Percentage of all Collisions 4 years after
Fatal Serious Minor Fatal Serious Minor
1997 12 13 20 67 4 22 74
1998 14 11 18 71 5 16 79
1999 18 6 28 66 2 18 80
2000 9 6 12 82 11 21 68
2001 23 8 11 81 4 16 80
2002 15 8 15 77 6 11 83
Total 91 9 18 73 5 17 78
It can therefore be concluded that implementation of these traffic calming schemes has not only reduced the number of collisions overall but has also reduced the average severity of those collisions that did occur
23
Evaluation of Traffic Calming Schemes Implemented 1997 ndash 2002
45 Statistical Significance Statistical significance is difficult to achieve with locations that have such small numbers of individual collisions However the chi squared test was used to compare the results with the control data and the overall result for all sites indicates an 80 confidence level meaning that there is a 20 chance that the observed reduction in collisions is due to mere random fluctuation
46 Collision Costs and Economic Evaluation Collision costs are calculated using figures from the Goodbody report on Cost-Benefit Analysis of Transport Projects 2004 The ldquoWillingness To Payrdquo method of economic assessment has been used dividing the collisions into the separate categories of fatal serious injury and minor injury Table 45 lists the cost savings per year and Table 46 compares these with construction costs to give an average yearly rate of return for each yearrsquos programme of traffic calming
Table 45 Collision and cost saving for each yearrsquos programme
Year No of
Schemes
Drop in Annual Collisions adjusted
Annual Cost Saving from Drop in Collisions euro 2002 prices
Fatal Serious Minor Fatal Serious Minor Total
1997 12 14 -16 01 3138300 -487300 4300 2655300
1998 14 05 -05 -03 1029900 -155000 -9200 865600
1999 18 07 13 35 1689100 383100 105200 2177500
2000 9 -04 -09 15 -800900 -277800 44200 -1034500
2001 23 16 -09 62 3681900 -278700 184600 3587700
2002 15 03 02 -18 638100 56800 -53100 641800
Total 91 41 -25 92 9376400 -759100 276100 8893400
The annual cost saving from the drop in collisions over all 91 schemes is calculated to be approximately euro89 million Most of this saving comes from the drop in fatal collisions which is the group with the most significant fall proportionately a drop of 41 per year from 79 per year (both figures adjusted for the control data)
Table 46 Yearly rate of return
Year No of
Schemes
Annual Collision Cost Saving euro
2002 prices
Cost of Constr euro 2002 prices
Yearly Rate of Return
1997 12 2655300 3024600 88
1998 14 865600 1852900 47
1999 18 2177500 5369900 41
2000 9 -1034500 1882000 -55
2001 23 3587700 3881400 92
2002 15 641800 3446600 19
Total 91 8893400 19457200 46
The average yearly rate of return for each yearrsquos programme varies between 92 and a negative return of 55 but the average rate of return over all six years is 46
24
Evaluation of Traffic Calming Schemes Implemented 1997 ndash 2002
47 Results by Type of Scheme Tables 47 and 48 show the collision savings organised into the 10 different types of scheme and their groupings As guidance a description of the different types and groupings is repeated in Table 49
Once the 91 schemes are divided up into types the individual numbers of collisions and schemes become too small to give a reliable statistical result but a few facts are worth noting-
a) Types A B C and D are all having a positive effect on the number of collisions These all have a gateway with a central island and varying degrees of physical works inside the speed limited zone
Taken together as a group types A to D have a clearly positive result with on average 11 collisions per town or village saved over a 4 year period
b) Types E F and G taken together do not have such a clear result The 10 locations in category E experienced an average increase of nearly 1 collision over a 4 year period with collisions in all severity categories increasing while type G has a better result and appears to be performing nearly as well as types A to D Taken together as a group these schemes that have physical narrowing but no central island at the gateway seem to have had little effect on collision occurrence
c) Types H and I stand out as both having had no success at all with on average an increase of 12 collisions at each town or village over a four year period
Type H and type I are the very simplest types of scheme with no physical works done either at the gateway or throughout the village Gateway signs and transition zone signs were installed and in type H some lining was done through the village to define a narrow carriageway
Type I has usually been installed at villages where the road width was already narrow before implementation and neither further narrowing nor physical works could be done at these locations This is reflected in the low number of collisions at these sites before
implementation 14 over 8 sites which comes to roughly 2 collisions per site At other sites the average number of collisions per site before implementation was generally much higher than this The overall average across all 91 sites was approximately 5 collisions per site
d) Interestingly the one scheme alone in Type J appears to have worked This scheme had extensive kerbing and footpath works done at the centre of the small village to define the road edge and the central junction Footpaths and lighting were installed throughout the village from one speed limit to the other and there is a clear physical narrowing at the speed limit signs but no gateway signs or transition zone signs were installed so there is no narrowing in optical width on approach However as there is only one scheme in this category no real conclusions can be drawn about this design
25
Evaluation of Traffic Calming Schemes Implemented 1997 ndash 2002
Table 47 Drop in collisions by type of scheme
Type No in Study
All colls 4 years before
Drop in collisions (4 years adjusted) Annual cost saving euro
Fatal Serious Minor Total Tot per
site Total Per site
A 39 171 49 -19 347 377 10 2913300 74700
B 8 31 32 -12 78 98 12 1772300 221500
C 5 42 -02 13 80 91 18 42600 8500
D 1 8 -02 10 26 34 34 -40800 -40800
E 10 48 -11 -22 -56 -90 -09 -867800 -86800
F 11 55 58 -35 -49 -26 -02 2985200 271400
G 5 20 25 -09 28 43 09 1354000 270800
H 3 13 10 -37 -55 -82 -27 260900 87000
I 8 14 07 01 -59 -51 -06 366800 45900
J 1 6 00 11 27 38 38 106600 106600
Total 91 408 164 -100 368 433 05 8893400 Avge 97700
Table 48 Grouping type of scheme by type of gateway
Type No in Study
All colls 4 years before
Drop in collisions (4 years adjusted) Annual cost saving euro
Fatal Serious Minor Total Tot per
site Total Per site
Central Island
Gateway 53 252 76 -08 532 600 11 4687600 88400
Simple Gateway
26 123 71 -67 -77 -73 -03 3471500 133500
Signs Only
11 27 17 -36 -114 -133 -12 627800 57100
Type J 1 6 00 11 27 38 38 106600 106600
Total 91 408 164 -100 368 433 05 8893400 Avge 97700
Table 49 Types of scheme and their groupings
Type Treatment Group
A Central island gateway central islands amp narrowing with kerbs inside
Central Island Gateway
B Central island gateway narrowing with kerbs amp no islands inside
C Central island gateway and lining
D Central island gateway and nothing else
E Simple gateway central islands amp narrowing with kerbs insides Simple
GatewayF Simple gateway narrowing with kerbs amp no islands inside
G Simple gateway and lining
H Gateway signs and lining Signs Only
I Gateway signs and nothing else
J No gateway narrowing with kerbs amp no islands inside No Gateway
26
Evaluation of Traffic Calming Schemes Implemented 1997 ndash 2002
48 Results By Type of Collision Table 410 shows the before and after collisions each year for the three main types of collision pedestrian single vehicle and head on The drop shown in the table is an adjusted figure and is relative to the decrease in each of these types of collision in the control data throughout all similar towns and villages on national roads over the period examined
The results show that pedestrian collisions decreased overall by about 8 from a figure of 69 and head-on type collisions have decreased by about 14 from 45 These are quite significant decreases of about 13 and 29 respectively However there has been effectively no change in single vehicle collisions only a very small increase of negligible percentage change
Table 410 Type of collision
Year No of
Schemes
All collisions 4 years before Drop in collisions (4 years adjusted)
ped single veh head on ped single veh head on
1997 12 7 15 8 -70 -03 09
1998 14 3 3 7 -19 -34 -01
1999 18 18 13 7 93 59 13
2000 9 5 6 4 01 -20 12
2001 23 24 14 16 49 -10 132
2002 15 12 12 3 20 06 -30
Total 91 69 63 45 75 -02 135
Total Percentage Drop 13 -0 29
The greatest decrease is in head-on type collisions Head-on collisions are not a particularly significant proportion of all collisions within these towns and villages and before implementation of the traffic calming they constituted only about 11 of all of collisions However the reduction of 135 collisions over four years represents a 29 drop in this type of collision compared with figures before implementation which is a significant result This decrease can be directly attributed to the fundamental design of traffic calming in which the two directions of flow are divided by central kerbed islands and central hatched areas
Pedestrian collisions have also decreased Pedestrian collisions were about 19 of all collisions within these towns and villages and the drop of 13 in pedestrian collisions is much the same as the general drop of 13 in collisions overall within the treated towns Although this is a good result in that pedestrian collisions have decreased in treated towns and villages 13 more than they have decreased in other similar locations it is not as good as was expected It was assumed that the inherent ldquopedestrian friendlyrdquo nature of traffic calming with provision of footpaths and pedestrian crossings would have a comparatively greater effect on pedestrian collisions Examination of the individual collisions in the after period suggests that the increases in pedestrian collisions are occurring in only about a dozen of the 91 towns and villages and that half of these dozen have 3 or more pedestrian incidents in the four year after period There appears to be no correlation with the provision of a pedestrian crossing as part of the traffic calming scheme A more detailed study of these locations is needed to investigate pedestrian collisions further and to ascertain whether there is any link between the provision of either pedestrian crossings or footpaths and the decrease in pedestrian collisions
Single vehicle collisions have not changed at all in relation to the general decrease in single vehicle collisions in all similar towns and villages Single vehicle collisions are those involving only one vehicle Usually in single vehicle incidents the vehicle leaves the driving lane of the road and collides with a roadside object
27
Evaluation of Traffic Calming Schemes Implemented 1997 ndash 2002
Occasionally there is no collision with a roadside object but because of the difference in levels between road and surrounding ground the occupants are injured when the vehicle comes to a halt The lack of any significant change in the occurrence of single vehicle collisions could possibly be explained by the fact that implementation of traffic calming introduces many new objects into the roadside space and reduces the available width within the driving lane Thus when a driver does stray from the correct path there is less forgiveness in the roadside environment and the chances of leaving the defined driving lane or striking an object is increased The general decrease in collisions at traffic calming sites due to the reduced speed is offset by this increased chance of hitting a roadside object which has thus resulted in no change in the incidence of these types of collisions
49 Results for Towns and Villages Treated at One End Only At 27 of the 91 locations only one end of the town or village was treated with traffic calming In 8 of these cases these were entries into a large town or city or into a coastal town where the route ended at the remaining 19 locations there was a through route but only one half of the village was treated Table 411 shows the results arranged according to whether or not both ends of the town were treated
The previous report on traffic calming constructed between 1993 and 1996 concluded that villages which had traffic calming at only one end did not perform in evaluation as well as those where both ends were treated The results shown below repeat this phenomenon At the 27 locations where only one end of the town or village was treated collisions reduced only by an average of 8 while at the other 64 locations where both ends were treated the reduction in collisions was 14 on average
When the 8 ldquosingle entryrdquo locations are separated out it can be seen that these treatments worked better than the other 19 one-end towns and villages This can perhaps be explained by the fact that these 7 locations were put in place to reduce the speed of vehicles approaching the outskirts of large towns or cities and their effect is only required to act within the environs of the traffic calming works Once past the traffic calming scheme the traffic enters a congested network where speed is not a concern For these 8 sites it was only the short length immediately around the traffic calming works was that was evaluated in the study
Table 411 Division of schemes according to whether both ends were treated
Type No in study
All colls 4 years before
Drop in collisions (4 years adjusted) Percentage drops
Fatal Serious Minor Total Total
per site Fatal Serious Minor Total
Both Ends 64 310 130 -76 311 364 06 52 -24 15 14
Single Entry 8 31 06 08 47 61 08 38 29 22 23
Half 19 67 29 -32 11 08 00 59 -41 3 1
All One-end 27 98 35 -24 58 69 03 54 -22 9 8
Total 91 408 164 -100 368 433 05 52 -24 14 13
28
Evaluation of Traffic Calming Schemes Implemented 1997 ndash 2002
5 CASE STUDIES
51 Comparison of Types of Traffic Calming Schemes The results indicate that schemes that have a central island at the gateway types AB C and D as
described in section 33 are more effective at reducing collisions than those schemes that do not have censhytral islands Four schemes on N15 were chosen to illustrate the typical differences between these types of scheme so that the layout of a scheme that has succeeded in collision reduction can be compared with one
that has not
The schemes illustrated all on N15 and in County Donegal are Ballyshannon Ballybofey Killygordon Castlefinn
Schemes With Central Island Type Gateways
Ballybofey and Castlefinn are schemes of type A having a gateway with both side buildouts and central island Inside the village or town this definition is continued using central islands and narrowing with kerbs
Both of these sites have experienced a reduction in collisions as the figures for 4 year before and after periods show Castlefinn particularly has had a notable reduction very much larger than the average of 13 for all the sites in this study
TownVillage collisions before collisions after reduction (adjusted) Ballybofey 9 6 16 Castlefinn 4 1 72
Schemes With Signs Only at Gateways
Ballyshannon and Killygordon are schemes of type H having only signs and no physical works at the gateway Definition inside the town or village is given only by using road markings
None of these sites has experienced any significant reduction in collisions as the 4 year figures below show These locations have had a slight increase in collisions relative to the general decrease in collisions across all similar towns and villages in the control data
TownVillage collisions before collisions after reduction (adjusted) Ballyshannon 7 6 -4 (increase) Killygordon 2 2 -9 (increase)
Comparison of Ballyshannon and Ballybofey
Ballyshannon and Ballybofey are similar sized towns and before traffic calming was introduced had similar approaches In both towns the speed limit extends a long way outside the centre of town and the road was wide on these approaches Both towns have busy town centres with narrow streets where vehicle speeds are not particularly high but in the zone between gateway and town centre high speeds were a problem and were addressed by traffic calming
While Ballyshannon had no central island constructed at the gateway and was treated with only signs and line marking on these approaches Ballybofey was treated with a kerbed central island kerbs and footpaths to narrow the road and a string of further central islands between the gateway and the centre of town Figures 51 and 52 below illustrate this
29
Evaluation of Traffic Calming Schemes Implemented 1997 ndash 2002
Comparison of figures 51 and 52 shows that the optical width has been considerably narrowed in Ballybofey whereas the effect is not so marked in Ballyshannon Figures 53 and 54 show how in Ballybofey this narrowing is continued on for the 600m between gateway and town centre reinforcing the slowing down effect that drivers experienced at the gateway
The differences in design of the approaches to these towns may possibly account for the differences in collision occurrence after traffic calming implementation
Figure 51 Ballyshannon south approach
Figure 52 Ballybofey south approach
30
Evaluation of Traffic Calming Schemes Implemented 1997 ndash 2002
Figure 53 Ballybofey south zone inside gateway
Figure 54 Ballybofey south zone inside gateway
31
Evaluation of Traffic Calming Schemes Implemented 1997 ndash 2002
Comparison of Killygordon and Castlefinn
Killygordon and Castlefinn are located within 6km of each other on the most northern section of N15 with a much lower traffic volume than either Ballybofey or Ballyshannon The N15 along this section in general has a narrower cross section without hard shoulders
Killygordon is a small village and had narrow approaches even before implementation of the traffic calming and the low collision rate before implementation reflects this The minimal treatment to this village under the traffic calming programme did little to change the collision occurrence Castlefinn is a larger village and before implementation its approaches were wider than those to Killygordon The number of collisions in Castlefinn before implementation was twice that in Killygordon The construction of a kerbed central island kerbs and footpaths to narrow the road and a further central island at the centre of the village has evidently had an effect on collisions which have now reduced to numbers below that in Killygordon Figures 55 and 56 below illustrate the differences between the two villages at the gateway while Figures 57 and 58 illustrate the changed look of the centre of Castlefinn as a result of traffic calming construction
Figure 55 Killygordon west approach
Figure 56 Castlefinn west approach
32
Evaluation of Traffic Calming Schemes Implemented 1997 ndash 2002
Figure 57 Castlefinn centre before traffic calming
Figure 58 Castlefinn centre after traffic calming
33
Evaluation of Traffic Calming Schemes Implemented 1997 ndash 2002
Figure 59 Approach to a village similar to Grange before traffic calming
52 Successful Schemes
N15 Grange
Grange has had one of the greatest reductions in collisions in this study
Collisions in 4 years before 9 Collisions in 4 years after 2 reduction (adjusted) 75
Grange is on a busy section of N15 in County Sligo It is a medium sized village with shops pubs petrol station police station church and a few dozen dwelling houses all with frontage onto the national road It has two busy junctions with local primary distributor roads leading to a moderately populated hinterland in the summer the population increases significantly with holidaymakers visiting the coastal area
Traffic calming was installed in 2000 Before this the approaches to the village were wide with hard shoulshyders and this cross section continued through the length of the town On entering the village from the north the length within the built up area approaching the centre is downhill so that drivers would need constant concentration and awareness of their speed to achieve a reduction in speed and to maintain that reduction on this approach From the south there is also a downhill approach but outside the built up area so that speeds approaching the start of the speed limited zone were high
Although an appropriate photograph of Grange before construction of the traffic calming is not available the photograph below of a similar sized village on N24 with similar road widths is shown below in Figure 59
Grange was treated with kerbed central islands at each gateway kerbs and footpaths to narrow the road and a string of further central islands between the two gateways Driving lanes in each direction are now a constant 35m throughout the village A signalised controlled pedestrian crossing was also constructed at the centre of the town There are now footpaths for the entire length of village between gateways and as well as the controlled crossing there are several locations where pedestrians can cross the road with the aid of the central island refuges Figures 510 511 and 512 below illustrate the works
In the years since traffic calming was implemented further housing an industrial estate and commercial sites have been constructed in the vicinity Traffic volumes turning at the junction have increased substantially
34
Evaluation of Traffic Calming Schemes Implemented 1997 ndash 2002
Figure 510 Gateway at Grange with central Island ndash Viewed from inside the village
Figure 511 Approach to Grange village centre from the north
35
Evaluation of Traffic Calming Schemes Implemented 1997 ndash 2002
Figure 512 Grange village centre
In the four years before construction of traffic calming there were roughly 2 collisions each year in the vilshylage Four of the nine collisions were single vehicle incidents and two were pedestrian collisions both involving pedestrians attempting to cross the road Skidding occurred in six of the nine collisions which is an unusually large proportion and suggests that there was a high incidence of sudden braking from high speeds
In the four years after implementation of the scheme there have been only two collisions one in the village centre where the rear of a parked vehicle was hit and one single vehicle loss of control incident on the south approach to the village
N20 Newtwopothouse Newtwopothouse has also had a significant reduction in collisions in this study
Collisions in 4 years before 4
Collisions in 4 years after 0
reduction (adjusted) 100
Newtwopothouse is on a busy section of N20 in County Cork It is a tiny settlement on a staggered junction with only a pubcafe and a shoppost office having frontage onto the national road The bulk of the housing in the area is along the two side roads stretching a few hundred metres down each road and on the eastshyern side road there is a school about 100m from the N20 Before construction of the traffic calming it did not appear to the passing driver on N20 as if there were a village at all merely a crossroads However there was a fairly large volume of traffic turning to and from the two side roads and pedestrian traffic across the N20 between housing and school
Before implementation of traffic calming the road on approach to and through the location was wide being a standard 7m single carriageway with 3m hard shoulders Figures 513 and 515 show the location before traffic calming was installed
36
Evaluation of Traffic Calming Schemes Implemented 1997 ndash 2002
Figure 513 Approach to Newtwopothouse from north before traffic calming
Figure 514 Approach to Newtwopothouse from north
Traffic calming was implemented in 2001 Similarly to Grange Newtwopothouse was treated with kerbed central islands at each gateway kerbs and footpaths to narrow the road further central islands between the two gateways and a signalised controlled pedestrian crossing in the centre Driving lanes in each direction are now a constant 35m throughout the scheme and there is now lighting for the entire length between gateways and footpaths in the central stretch around the junction and bus stops Figures 514 and 516 below illustrate the works by showing the same locations as shown in Figures 513 and 515
37
Evaluation of Traffic Calming Schemes Implemented 1997 ndash 2002
Figure 515 Crossroads at Newtwopothouse before traffic calming
Figure 516 Crossroads at Newtwopothouse with pedestrian crossing
In the four years before construction of traffic calming there were 4 collisions at this location all of which involved turning at the junction
In the four years after implementation of the scheme there have been no collisions
38
Evaluation of Traffic Calming Schemes Implemented 1997 ndash 2002
6 CONCLUSIONS
61 Reduction in Collisions Between 1997 and 2002 there were 94 traffic calming schemes completed at towns and villages on the national roads
Over all the 91 studied locations comparing the 4 years before each scheme with the 4 years after there was a reduction of 106 collisions made up of 21 fatal collisions 20 serious injury collisions and 65 minor injury collisions
62 Reduction in Comparison with Control Data When comparing with the control data and allowing for the general decrease in collisions overall on national roads during this time period this translates to a reduction of 433 collisions This is made up of a reduction of 164 fatal collisions and 368 minor injury collisions and an increase of 100 serious collisions
These figures represent a 13 reduction in all collisions with fatal collisions reduced by 52 Serious and minor injury collisions together reduced by 9
63 Reduction in Severity of Collisions The implementation of traffic calming has therefore had the effect of reducing the number of crashes within the geographical areas of their influence Its more significant effect is in reducing the severity of collisions The percentage of all collisions that were fatal dropped from 9 in the 4 years before implementation to 5 in the 4 years after The percentage of minor injury collisions rose by a corresponding amount
64 Cost Benefit Analysis Using the ldquoWillingness to Payrdquo method of evaluation the average yearly rate of return over all the years evaluated is 46
65 Effects of Different Types of Schemes Traffic Calming Schemes that have a central island in the Gateway and continue this effect with solid central islands throughout the village are more effective in reducing collisions than those that do not
Schemes that consisted of only signs and had no physical works did not have any effect at all in reducing collisions
Traffic Calming Schemes where both ends of the town or village were treated were more effective in reducshying collisions than those where only one was treated
39
Evaluation of Traffic Calming Schemes Implemented 1997 ndash 2002
40
7
Evaluation of Traffic Calming Schemes Implemented 1997 ndash 2002
RECOMMENDATIONS
There are eight main recommendations that emerge from this study
1 The programme of traffic calming of towns and villages on national roads should be continued
2 The programme should be restricted to only towns and village where traffic calming is likely to have an impact
3 An updated priority list should be produced to identify those towns and villages where traffic calming is likely to have an impact
4 Prioritised towns and villages should have a) an injury collision record over the past 5 years that is higher than average b) 85 percentile speeds that are above the posted speed limit c) a physical layout that is possible to treat with traffic calming
5 Where traffic calming is implemented it should include a central island at the gateway and should include physical narrowings throughout the town or village No scheme should consist of just signs and road markings
6 At any location where traffic calming is being considered the existing vehicle speeds through the village must be surveyed
7 After each traffic calming scheme has been implemented the revised vehicle speeds through the village must be surveyed as soon as possible
8 A further study should examine in more detail the single vehicle accidents and pedestrian accidents that been identified in this study in treated villages and towns
41
Evaluation of Traffic Calming Schemes Implemented 1997 ndash 2002
42
Evaluation of Traffic Calming Schemes Implemented 1997 ndash 2002
REFERENCES
RS460 Evaluation of Traffic Calming Schemes Constructed on National Roads 1993-1996 National Roads Authority 2002
The Road to Safety Government Strategy for Road Safety 1998-2002 Department of the Environment and Local Government 1998
Road Safety Strategy Government Strategy for Road Safety 2004-2006 Department of Transport 2004
Road Safety Strategy 2007-2012 Road Safety Authority 2007
2005 Survey of Free Speeds (Urban and Rural) National Roads Authority 2006
Guidelines on Traffic Calming for Towns and Villages on National Routes National Roads Authority 2004
Reducing Traffic Injuries Resulting From Excess and Inappropriate Speed European Transport Safety Council 1995
The importance of confounding in observational before-and-after studies of road safety measures Rune Elvik Accident Analysis and Prevention 34(5) 2002
Parameter Values for Use in Cost-Benefit Analysis of Transport Projects Goodbody Economic Consultants 2004
43
Evaluation of Traffic Calming Schemes Implemented 1997 ndash 2002
44
Evaluation of Traffic Calming Schemes Implemented 1997 ndash 2002
Evaluation of Traffic Calming Schemes Implemented 1997 ndash 2002
APPENDIX A
Ranking of Sites According to Primary Criteria for Selection for Traffic Calming National Primary Routes Only
Route Town Village Population AADT Length Colls
over 5 yrs
Collisions per 10 million vehkm
Collisions per year per 1000
Population
+Combined Collision
Rate
N17 BALLINDINE 232 5058 0587 8 148 690 640
N25 KILRANE 214 5310 2255 10 46 935 559 N08 LITTLETON 566 5598 0591 10 166 353 508
N11 ASHFORD 500 12768 1352 19 60 760 501 N01 JULIANSTOWN 450 14270 1146 16 54 711 463
N05 FRENCHPARK 272 2994 0805 11 250 809 452
N02 COLLON 335 6164 0626 7 99 418 408 N18 KILCOLGAN 500 9565 0483 9 107 360 393
N08 WATERGRASSHILL 250 13706 0985 8 32 640 385 N01 CASTLEBELLINGHAM 762 10983 1891 20 53 525 368
N08 RATHCORMACK 500 11807 1158 11 44 440 308 N09 DUNGARVAN 500 3261 028 4 240 160 280
N04 DROMOD 250 3598 059 3 77 240 275 N20 CHARLEVILLE 3000 9655 1988 12 34 400 269
N25 LEMYBRIEN 222 6471 0918 4 37 360 254 N11 KILMACANOGE 763 26721 0692 13 39 341 247
N25 GLOUNTHAUNE 500 17499 0802 17 66 680 236
N07 MONEYGALL 344 6350 0576 4 60 233 236 N09 MULLINAVAT 283 3858 0925 7 107 495 231
N08 KILBEHENY 500 6897 0863 6 55 240 230 N02 CASTLEBLAYNEY 2938 4154 3525 21 79 143 229
N07 BORRIS IN OSSORY 500 7848 1141 7 43 280 226 N15 BUNDORAN 1463 7275 2371 17 54 232 224
N24 KILSHEELAN 435 4924 1027 5 54 230 223 N02 ARDEE 3604 7019 2394 24 78 133 223
N05 CHARLESTOWN 712 2956 125 5 74 140 219 N11 CAMOLIN 293 5192 1125 4 38 273 212
N06 CRAUGHWELL 232 7669 1558 4 18 345 209
N24 MONARD 500 5735 0392 3 73 120 206 N22 FARRANFORE 500 7614 1093 6 40 240 199
N21 ABBEYFEALE 1501 9982 3287 39 65 520 195 N15 GRANGE 500 6352 1427 6 36 240 193
N24 CARRICK ON SUIR 5143 4924 2903 20 77 078 192 N04 COLLOONEY 612 8617 0864 12 88 392 186
N18 BAREFIELD 500 5852 1087 5 43 200 186 N17 CLAREGALWAY 500 11128 166 7 21 280 182
N20 BALLYHAY 500 7440 0364 3 61 120 181 N14 CASTLEFINN 692 6024 0846 5 54 145 180
N26 FOXFORD 974 1928 1915 9 134 185 180
N18 ARDRAHAN 500 6650 0413 3 60 120 180 N02 ASHBOURNE 4411 10840 2792 30 54 136 177
N08 ABBEYLEIX 1299 8083 1778 11 42 169 169 N02 CARRICKMACROSS 3341 11436 2989 27 43 162 167
N11 OILGATE 262 6332 0393 2 44 153 164 N04 BALLINAFAD 500 3199 0239 2 143 080 163
N02 CASTLESHANE 250 5338 0875 5 59 400 159 N02 SLANE 699 6064 1885 13 62 372 155
N02 ANNAYALLA 500 5338 0655 6 94 240 154
N30 ENNISCORTHY 7655 3972 0565 6 146 016 150 N10 PAULSTOWN 234 4858 0753 2 30 171 145
A1
Evaluation of Traffic Calming Schemes Implemented 1997 ndash 2002
Route Town Village Population AADT Length Colls
over 5 yrs
Collisions per 10 million vehkm
Collisions per year per 1000
Population
+Combined Collision
Rate
N08 JOHNSTOWN 422 6063 1445 4 25 190 145 N07 TOOMYVARA 500 7606 069 7 73 280 143
N16 SLIGO 17302 5680 1796 25 134 029 142 N26 BALLINA 477 5398 1983 9 46 377 140
N16 GLENFARNE 500 1746 1846 5 85 200 135 N06 ROCHFORTBRIDGE 721 6202 1348 5 33 139 135
N24 LIMERICK JCN 250 5735 0698 4 55 320 135 N22 BALLINCOLLIG 12124 15125 6303 68 39 112 134
N24 FIDDOWN 500 4588 0966 6 74 240 134
N01 DROGHEDA 23914 19455 4526 79 49 066 131 N08 NEWINN 500 7163 0648 3 35 120 131
N15 STRANORLAR+BALLYBOFEY 2972 3337 3918 22 92 148 129 N14 LIFFORD 1359 3854 1151 4 49 059 128
N22 LISSARDA 500 7096 0696 6 67 240 127 N22 BALLYVOURNEY 500 3636 2786 8 43 320 123
N06 KILREEKILL 500 9055 059 3 31 120 122 N17 BELLAHY+CHARLESTOWN 712 3834 1103 3 39 084 120
N22 MACROOM 2363 7096 4588 31 52 262 118 N15 KILLYGORDON 500 6024 0493 2 37 080 114
N08 HORSEampJOCKEY 500 7607 026 3 83 120 113
N18 GORT 1093 7709 2855 16 40 293 113 N04 CLONARD 500 10570 0599 3 26 120 112
N02 EMYVALE 479 4073 0813 4 66 167 108 N05 BELLAVARY 500 5138 0633 4 67 160 107
N20 PATRICKSWELL 1019 14486 1742 15 33 294 106 N25 KILMEADAN 500 6177 1817 7 34 280 104
N24 PALLASGREEN 500 4638 0747 4 63 160 103 N15 BALLYSHANNON 2838 8955 2844 13 28 092 102
N21 TRALEE 17225 12840 1934 40 88 046 100 N03 KELLS 3539 8857 1737 10 36 057 099
N25 KILLEAGH 347 7244 1481 5 26 288 098
N24 BANSHA 293 4221 0855 3 46 205 097 N03 CARNAROSS 500 6683 0933 5 44 200 094
N02 MONAGHAN 5946 7630 3588 32 64 108 091 N24 CAHIR 2055 13277 2528 11 18 107 089
N01 DUNDALK 25843 22685 6273 153 59 118 089 N06 MILLTOWNPASS 500 6202 0733 4 48 160 088
N18 NEWMARKET-ON-FERGUS 1583 10584 1461 13 46 164 087 N17 CURRY 250 4585 0548 2 44 160 084
N03 CAVAN 5254 11709 236 28 56 107 082 N22 KILLARNEY 7275 9731 3819 19 28 052 082
N09 MOONE+TIMOLIN 500 6720 2231 6 22 240 082
N11 RATHNEW 1496 12736 1072 11 44 147 081 N15 DONEGAL 2193 6149 2053 12 52 109 079
N25 YOUGHAL 5828 7598 522 34 47 117 076 N03 DUNSHAUGHLIN 1275 15588 1458 6 14 094 076
N04 CARRICK ON SHANNON 2500 4257 2393 10 54 080 074 N06 BALLINASLOE 5812 9582 5241 37 40 127 072
N21 NEWCASTLE WEST 2500 7975 2766 16 40 128 072 N20 BUTTEVANT 1125 7440 1271 7 41 124 072
N15 SLIGO 17302 8932 1274 14 67 016 071 N15 DRUMCLIFF 500 9726 0737 2 15 080 071
N25 NEW ROSS 6079 6846 2424 17 56 056 070
A2
Evaluation of Traffic Calming Schemes Implemented 1997 ndash 2002
Route Town Village Population AADT Length Colls
over 5 yrs
Collisions per 10 million vehkm
Collisions per year per 1000
Population
+Combined Collision
Rate
N25 DUNGARVAN 6920 5688 4649 25 52 072 070
N20 CROOM 1090 5658 1036 5 47 092 070 N24 PILTOWN 717 4588 1166 4 41 112 069
N08 MITCHELSTOWN 3090 13395 2084 19 37 123 068 N07 MONASTEREVIN 2224 11968 1754 7 18 063 068
N15 CLIFFONEY 292 5089 0652 2 33 137 067 N09 GOWRAN 477 2517 0949 2 46 084 067
N08 FERMOY 4462 10622 2955 23 40 103 066 N04 RATHOWEN 500 5465 0439 1 23 040 066
N04 NEWTOWNFORBES 250 3711 1169 2 25 160 065 N30 NEW ROSS 6079 3514 2126 8 59 026 065
N07 NENAGH 5825 8352 2422 18 49 062 064
N07 MOUNTRATH 1375 6980 1827 8 34 116 063 N01 BALBRIGGAN 7724 13451 3226 33 42 085 063
N15 LISCOOLEY 500 6024 0423 2 43 080 063 N17 TOBERCURRY 1069 4585 2168 6 33 112 061
N03 NAVAN 11706 11782 4695 43 43 073 061 N04 ENFIELD 500 10570 1127 2 09 080 058
N30 CLONROCHE 500 2786 1049 2 37 080 057 N09 CARLOW 14027 9020 5154 37 44 053 057
N16 MANORHAMILTON 995 2393 1665 3 41 060 056 N24 MOONCOIN 500 8954 1507 2 08 080 056
N06 LOUGHREA 3271 8389 295 15 33 092 056
N06 MOATE 1529 5973 2482 4 15 052 056 N08 CULLAHILL 500 6063 051 1 18 040 055
N08 URLINGFORD 689 6407 1309 4 26 116 055 N08 CASHEL 2814 7238 2342 11 36 078 055
N11 GOREY 3840 13253 1949 16 34 083 055 N11 FERNS 859 5192 0974 3 33 070 050
N18 ENNIS 16058 13516 7938 59 30 073 049 N23 CASTLEISLAND 2207 3515 0727 2 43 018 047
N05 BELLANAGARE 500 2309 0639 1 37 040 047 N04 KINNEGAD 415 6954 2589 3 09 145 045
N09 CASTLEDERMOT 741 6112 2144 4 17 108 044
N11 ARKLOW 7987 12321 3857 24 28 060 043 N18 CRUSHEEN 500 5852 0853 1 11 040 042
N03 VIRGINIA 720 6683 1261 3 20 083 040 N05 BALLAGHADERREEN 1270 4251 2127 4 24 063 040
N07 BALLYBRITTAS 500 10826 0524 1 10 040 039 N06 TYRRELLSPASS 376 6707 1407 1 06 053 038
N11 ENNISCORTHY 7655 7570 1269 6 34 016 038 N04 SLIGO 17964 15138 3821 31 29 035 038
N24 TIPPERARY 4963 11547 2213 12 26 048 038 N26 SWINFORD 1216 1928 1963 2 29 033 037
N07 BIRDHILL 500 9770 0702 2 16 080 036
N07 KILDARE 4196 14907 2763 14 19 067 035 N20 MALLOW 7521 10164 2681 13 26 035 035
N05 STROKESTOWN 568 2809 2371 2 16 070 034 N10 KNOCKTOPHER 500 2734 0841 1 24 040 034
N17 TUAM 5540 10723 305 13 22 047 034 N04 EDGEWORTHSTOWN 801 5520 2094 3 14 075 033
N04 BALLYSADARE 500 8617 0996 2 13 080 033 N10 STONYFORD 500 3401 0717 1 22 040 032
A3
Evaluation of Traffic Calming Schemes Implemented 1997 ndash 2002
Route Town Village Population AADT Length Colls
over 5 yrs
Collisions per 10 million vehkm
Collisions per year per 1000
Population
+Combined Collision
Rate
N21 CASTLEISLAND 2207 5467 1873 4 21 036 030
N07 PORTLAOISE 8360 12097 501 19 17 045 029 N09 THOMASTOWN 2512 3261 2244 3 22 024 028
N05 TULSK 500 2220 1432 1 17 040 027 N25 SWEEP 500 4274 0755 1 17 040 027
N06 GALWAY 60000 24461 5106 50 22 017 026 N03 DROLCHEAD NUA 11778 5345 04 1 26 002 026
N03 BELTURBET 1223 3316 1868 2 18 033 026 N08 DURROW 721 7244 1338 2 11 055 025
N05 WESTPORT 3688 12879 1194 5 18 027 025 N19 SHANNON 7920 14965 05 3 22 008 024
N21 ADARE 500 3348 1288 1 13 040 023
N07 ROSCREA 4231 7718 3502 7 14 033 022 N17 KNOCK 440 3958 1251 1 11 045 022
N10 KILKENNY 17669 7149 3379 8 18 009 020 N13 STRANORLAR 2972 7141 0925 2 17 013 020
N20 LIMERICK 75000 20672 6595 42 17 011 020 N24 CLONMEL 15562 7270 5907 12 15 015 019
N13 BRIDGE END 500 8153 075 1 09 040 019 N05 CASTLEBAR 7648 7442 3988 7 13 018 018
N17 CLAREMORRIS 1907 5058 1868 2 12 021 017 N24 OOLA 474 4864 1937 1 06 042 016
N07 LIMERICK 75000 15709 10841 41 13 011 016
N21 TEMPLEGLANTINE 819 6759 0828 1 10 024 016 N17 GALWAY 60000 27843 3176 20 12 007 014
N05 LONGFORD 6824 6874 4021 5 10 015 014 N07 DUBLIN 500000 47272 2387 22 11 001 011
N04 BOYLE 2197 3199 2036 1 08 009 011 N11 DUBLIN 500000 40055 13999 95 09 004 010
N04 DUBLIN 500000 29736 9209 42 08 002 009 N18 LIMERICK 75000 27171 5095 17 07 005 008
N09 WATERFORD 75000 14883 1693 3 07 001 007 N50 DUBLIN 600000 18676 124 10 02 000 002
N24 LIMERICK 75436 10740 3098 1 02 000 002
N08 CORK 136000 32213 414 2 01 000 001 N22 CORK 136000 25429 3556 1 01 000 001
N09 BALLYHALE 500 3858 0867 0 00 000 000 N17 BALLYNACARROW 500 3807 0798 0 00 000 000
N04 BALLYNALACK 500 5465 0748 0 00 000 000 N03 BALLYSHANNON 2838 3088 0899 0 00 000 000
N05 CARRACASTLE 500 2956 1215 0 00 000 000 N04 CASTLEBALDWIN 500 3199 0252 0 00 000 000
N18 CLARINBRIDGE 500 9565 1417 0 00 000 000 N20 CORK 136000 15947 4267 0 00 000 000
N27 CORK 136000 13277 3778 0 00 000 000
N01 DUBLIN 500000 28975 4298 0 00 000 000 N02 DUBLIN 500000 11524 6397 0 00 000 000
N03 DUBLIN 500000 21436 4357 0 00 000 000 N06 HORSELEAP 500 6769 0735 0 00 000 000
N06 KILBEGGAN 617 6707 1286 0 00 000 000 N14 LETTERKENNY 10726 15411 093 0 00 000 000
N17 MILLTOWN 500 5467 0869 0 00 000 000 N21 PATRICKSWELL 1019 3348 0274 0 00 000 000
A4
Evaluation of Traffic Calming Schemes Implemented 1997 ndash 2002
Route Town Village Population AADT Length Colls
over 5 yrs
Collisions per 10 million vehkm
Collisions per year per 1000
Population
+Combined Collision
Rate
N09 PAULSTOWN 234 6653 0721 0 00 000 000
N04 ROOSKY 249 3827 0696 0 00 000 000 N28 SHANBALLY 500 5098 0506 0 00 000 000
N05 TERMONBARRY 500 3366 098 0 00 000 000 N25 WATERFORD 41853 10668 8427 0 00 000 000
N25 BALLINABOOLA N25 BARNTOWN
N07 DALYS CROSS N18 GORT RD ENNIS
N20 NEWTWOPOTHOUSE N08 RINGASKIDDY
+ Combined Collision Rate [Coll Rate 10mvehkmyr5 + Coll Rate 1000popyr2]2 These towns and villages were not assessed as funding was already committed
A5
Evaluation of Traffic Calming Schemes Implemented 1997 ndash 2002Evaluation of Traffic Calming Schemes Implemented 1997 ndash 2002
Evaluation of Traffic Calming Schemes Implemented 1997 ndash 2002
51
Appendix B Evaluation of Traffic Calming Schemes Implemented 1997 ndash 2002
APPENDIX B Scheme Details for All Sites
Scheme Local Authority Rte Both or Half Spd Lim Type Colls 4 yrs before raw
Colls 4 yrs after raw
Drop in Ann Colls Adj for
All Nats Area Evaluated Year
Finished Year
Started Year
Bypassed Year
Changed Total Cost in 2002 Prices
Carrickarnon Louth 1 both 60 F 15 10 079 Gate - Gate 2001 2007 109400
Greengates Louth 1 both 40 B 8 2 130 Gate - Gate 1997 2002 489900 KilsaranCastlebellingham Louth 1 both 30 A 23 10 260 Gate - Gate 1997 1997 2002 255600
Julianstown Meath 1 both 30 C 13 10 024 Gate - Gate 1999 1999 2003 767700 Emyvale Monaghan 2 both 30 F 5 7 -065 Gate - Gate 2001 46500
Castleblaney (N) Monaghan 2 2nd half 40 A 3 5 -073 Gate - Bend 2000 2000 2007 132300
Carrickmacross (N) Monaghan 2 half 40 A 7 4 008 Gate - Bend 1998 1998 2005 92500 Ardee (S) Louth 2 half 30 A 4 9 -152 Gate - R170 Jcn 1997 1997 238300
Collon Louth 2 both 30 E 6 7 -038 Gate - Gate 1997 1996 251600 Slane Meath 2 both 30 A 8 5 048 Gate - Gate 2002 2001 534500
Kells Meath 3 both 30 A 8 8 -024 Gate - Gate 2001 730900 Castlebaldwin Sligo 4 both 30 A 5 2 062 Gate - Gate 1999 1998 547500
Dromod Leitrim 4 both 30 B 1 3 -052 Gate - Gate 2000 1999 2008 418300 Roosky (E) Leitrim 4 half 30 B 1 -025 Gate - Centre 1998 1997 2008 123300
Newtownforbes (E) Longford 4 1st half 30 F 1 2 -028 Gate - Bend 2001 2003 73800 Rathowen Westmeath 4 both 30 A 1 1 -002 Gate - Gate 1999 1999 369400
Clonard (E) Meath 4 half 40 B 1 1 -000 Gate - Centre 1997 2006 53200
Enfield Meath 4 both 30 C 8 2 114 Gate - Gate 1999 1998 2002 73900 CharlestownBellahy (WN) Mayo 5 half 30 A 7 132 Gates - Centre 1999 1998 2008 523400
Frenchpark Roscommon 5 both 30 F 5 3 032 Gate - Gate 2001 133600 Craughwell Galway 6 both 40 F 6 6 -015 Gate - Gate 2000 1999 30600
Rochfordbridge Westmeath 6 both 30 A 7 5 037 Gate - Gate 1998 1998 2006 199600 Miltownpass Westmeath 6 both 40 F 1 1 -002 Gate - Gate 2000 2000 2006 2005 248000
B1
Appendix B Evaluation of Traffic Calming Schemes Implemented 1997 ndash 2002
Scheme Local Authority Rte Both or Half Spd Lim Type Colls 4 yrs before raw
Colls 4 yrs after raw
Drop in Ann Colls Adj for
All Nats Area Evaluated Year
Finished Year
Started Year
Bypassed Year
Changed Total Cost in 2002 Prices
Moneygall Offaly 7 both 30 C 2 4 -056 Gate - Gate 2001 1997 2002 410900 Ballybrittas Laois 7 both 40 A 5 3 025 Gate - Gate 2002 2005 197900
Monasterevin (W) Kildare 7 half 30 G 4 1 064 Gate - Bridge 1998 1998 2005 29900
Cullahill Laois 8 both 40 A 1 2 -027 Gate - Gate 2000 1999 134200 Abbeyleix (S) Laois 8 half 30 A 1 4 -077 Gate - Centre 2000 2000 330700
Mullinavat (N) Kilkenny 9 half 30 G 6 3 057 Gate - Centre 2001 96600 Dungarvan Kilkenny 9 both 40 G 1 2 -028 Gate - Gate 2001 212700
Paulstown Kilkenny 9 both 30 A 2 046 Gate - Gate 1999 1998 184700 Kilkenny (E) Kilkenny 10 single entry 30 B 10 3 133 Gate - Centre 2001 195200
Claragh Kilkenny 10 both 60 F 2 2 -016 Gate - Gate 1999 206500 Camolin Wexford 11 both 30 A 5 1 073 Gate - Gate 2002 581000
Ashford Wicklow 11 both 30 E 16 7 160 Gate - Gate 1999 1998 2004 92300 Lifford (N amp W) Donegal 14 both 30 A 10 5 095 Gate - Gate 2001 70400
Castlefinn Donegal 15 both 30 A 4 1 063 Gate - Gate 2001 127500
Killygordon Donegal 15 both 30 H 2 2 -004 Gate - Gate 2002 113300 Ballybofey (S) Donegal 15 half 40 A 9 6 029 Gate - Centre 2002 246400
Ballyshannon (S) Donegal 15 2nd half 40 G 7 6 -006 Gate - Bridge 1997 1996 2006 159700 Bundoran Donegal 15 both 40 H 9 15 -163 Gate - Gate 1997 2006 41900
Cliffony Sligo 15 both 30 A 2 1 019 Gate - Gate 2001 143800 Grange Sligo 15 both 30 A 9 2 149 Gate - Gate 2000 1999 172500
Drumcliffe Sligo 15 both 30 F 7 5 033 Gate - Gate 2000 1999 259100 Ballindine Mayo 17 both 30 E 3 6 -091 Gate - Gate 1997 1997 106500
Claregalway Galway 17 both 30 A 3 7 -116 Gate - Gate 1998 1997 328300 Kilcolgan Galway 18 both 40 E 8 8 -042 Gate - Gate 1999 1999 2003 46200
Ardrahan Galway 18 both 30 J 6 1 096 Gate - Gate 1999 1999 46200
Crusheen (N) Clare 18 half 30 E 1 -025 Gate - Bend 1998 1997 2003 251400 Barefield (N) Clare 18 half 40 G 2 1 021 Gate - Centre 1998 1997 2007 251400
B2
Appendix B Evaluation of Traffic Calming Schemes Implemented 1997 ndash 2002
Scheme Local Authority Rte Both or Half Spd Lim Type Colls 4 yrs before raw
Colls 4 yrs after raw
Drop in Ann Colls Adj for
All Nats Area Evaluated Year
Finished Year
Started Year
Bypassed Year
Changed Total Cost in 2002 Prices
Charleville (S) Cork 20 1st half 30 A 2 2 -006 Gate - Ped X 2001 2004 165400
Ballyhea Cork 20 both 40 A 1 -025 Gate - Gate 1999 1999 784900
Newtwopothouse Cork 20 both 40 A 4 084 Gate - Gate 2001 165400
Cork (N) Cork 20 single entry 40 I 1 2 -030 Gate - Ped X 2002 239700
Farranfore Kerry 22 both 30 F 4 5 -032 Gate - Gate 1998 1998 2003 20000
Killarney (E) Kerry 22 single entry 40 D 8 3 085 Gate - Rbt 1998 1998 59900
Ballyvourney Cork 22 both 30 E 3 6 -090 Gate - Gate 2002 2001 570300
Lissarda Cork 22 both 40 A 4 4 -022 Gate - Gate 2002 333900
Ballincollig (W) Cork 22 half 30 B 10 8 041 Gate - Rbt 1997 1997 2004 496300
Cork (W) Cork 22 single entry 30 A 000 Gate - Vic X 1999 2004 193900
Monard South Tipperary 24 both 30 I 1 -025 Gate - Gate 1998 1998 39300
Bansha South Tipperary 24 both 30 I 2 2 -004 Gate - Gate 2001 138400
Kilsheelan South Tipperary 24 both 30 A 2 043 Gate - Gate 1999 1997 2007 194500
Carrick-on-Suir (W) South Tipperary 24 2nd half 30 A 3 066 Gate - Mini Rbt 2001 211900
Mooncoin Kilkenny 24 both 30 F 5 8 -088 Gate - Gate 1998 1998 140000
Lemybrien Waterford 25 both 40 A 1 1 -002 Gate - Gate 1998 1997 165700
Waterford (E) Kilkenny 25 single entry 30 A 5 1 084 Gate - Rbt 1997 1997 63900
Ballinaboola Wexford 25 both 30 A 3 3 -024 Gate - Gate 1999 1999 554100
Barntown Wexford 25 both 40 A 1 2 -037 Gate - Gate 1997 1997 639000
Kilrane (W) Wexford 25 half 30 A 4 4 -025 Gate - Speed Lim 1999 1998 2004 300400
Rosslare Harbour (W) Wexford 25 single entry 15 E 000 Gate - Harbour 2001 2004 16000
Foxford Mayo 26 both 30 I 6 1 083 Gate - Gate 2001 33300
B3
Appendix B Evaluation of Traffic Calming Schemes Implemented 1997 ndash 2002
Scheme Local Authority Rte Both or Half Spd Lim Type Colls 4 yrs before raw
Colls 4 yrs after raw
Drop in Ann Colls Adj for
All Nats Area Evaluated Year
Finished Year
Started Year
Bypassed Year
Changed Total Cost in 2002 Prices
Clonroche Wexford 30 both 30 F 4 2 035 Gate - Gate 2001 20400
New Ross (N) Wexford 30 both 30 A 2 4 -060 Gate - Gate 2002 47500
Smithborough (W) Monaghan 54 half 30 A 2 1 019 Gate - Centre 2001 56900
Carrickboy Longford 55 both 40 H 2 3 -037 Gate - Gate 2002 57100
Gortahork Donegal 56 both 30 I 1 5 -105 Gate - Gate 2002 45500
Dromore West Sligo 59 both 30 A 4 084 Gate - Gate 2000 156200
Ballisodare Sligo 59 both 30 A 000 Gate - Speed Lim 2002 1997 142700
Hodson Bay Roscommon 61 both 40 A 5 112 Gate - Gate 2001 432500
Birr Offaly 62 both 30 C 15 9 087 Gate - Gate 2001 94700
Loughrea (W) Galway 66 single entry 30 I 1 3 -052 Gate - N6 Jcn 1999 1999 55400
Ballylickey Cork 71 both 40 I 1 2 -037 Gate - Gate 1997 228500
Bantry (N) Cork 71 half 30 E 5 5 -027 Gate - Centre 2002 115600
Clonakilty Cork 71 both 30 C 4 1 059 Gate - Gate 1999 331600
Grangemockler South Tipperary 76 both 30 I 2 042 Gate - Gate 1998 1998 2003 51900
Kilkenny (N) Kilkenny 77 single entry 30 E 6 8 -068 Gate - Centre 2001 195200
Newtown Laois 78 both 40 A 5 1 073 Gate - Gate 2002 181400
Killeigh Offaly 80 both 30 B 000 Gate - Gate 1999 1999 97400
Kilmaine (N) Mayo 84 half 30 B 1 019 Gate - R332 Jcn 1998 99800
Swanlinbar (S) Cavan 87 half 30 E 1 1 -005 Gate - Centre 2002 39900
B4
Appendix C
Evaluation of Traffic Calming Schemes Implemented 1997 ndash 2002 APPENDIX C Collision Data Cost Data and First Year Rate of Return for All Sites
Location Rte Yr Construction Cost
4 Years Before 4 Years After Drop in Annual Collisions adjusted Cost Saving from Drop in Collision
Yearly Rate of Return
F S M Tot F S M Tot F S M Tot F S M Tot
Carrickarnon 1 01 109400 3 1 11 15 1 1 8 10 046 -009 042 079 1047600 -27300 12600 1032900 944
Greengates 1 97 489900 2 1 5 8 0 0 2 2 043 013 074 130 969700 40900 22200 1032800 211
KilsaranCastlebellingham 1 97 255600 1 5 17 23 1 0 9 10 -004 067 197 260 -85200 204700 59000 178500 70
Julianstown 1 99 767700 0 3 10 13 1 1 8 10 -025 017 032 024 -570000 53300 9500 -507200 -66
Emyvale 2 01 46500 0 0 5 5 0 2 5 7 000 -050 -015 -065 0 -152300 -4500 -156800 -337
Castleblaney (N) 2 00 132300 0 2 1 3 0 2 3 5 000 -021 -052 -073 0 -62800 -15600 -78400 -59
Carrickmacross (N) 2 98 92500 0 5 2 7 0 0 4 4 000 062 -054 008 0 188700 -16100 172600 187
Ardee (S) 2 97 238300 1 2 1 4 1 4 4 9 -004 -073 -075 -152 -85200 -222700 -22600 -330500 -139
Collon 2 97 251600 0 1 5 6 0 3 4 7 000 -062 024 -038 0 -187500 7200 -180300 -72
Slane 2 02 534500 3 2 3 8 0 0 5 5 077 036 -065 048 1761000 109400 -19400 1851000 346
Kells 3 01 730900 0 0 8 8 1 1 6 8 -025 -025 026 -024 -570000 -76200 7800 -638400 -87
Castlebaldwin 4 99 547500 1 0 4 5 0 0 2 2 020 000 043 062 451800 0 12800 464600 85
Dromod 4 00 418300 0 0 1 1 0 2 1 3 000 -050 -002 -052 0 -152300 -600 -152900 -37
Roosky (E) 4 98 123300 0 0 0 0 0 0 1 1 000 000 -025 -025 0 0 -7500 -7500 -6
Newtownforbes (E) 4 01 73800 0 0 1 1 0 0 2 2 000 000 -028 -028 0 0 -8400 -8400 -11
Rathowen 4 99 369400 0 0 1 1 0 1 0 1 000 -025 023 -002 0 -76200 6900 -69300 -19
Clonard (E) 4 97 53200 0 0 1 1 0 0 1 1 000 000 -000 -000 0 0 -100 -100 -0
Enfield 4 99 73900 1 2 5 8 0 0 2 2 020 028 066 114 451800 86300 19700 557800 755
CharlestownBellahy (WN) 5 99 523400 1 3 3 7 0 0 0 0 020 042 069 132 451800 129400 20800 602000 115
Frenchpark 5 01 133600 2 1 2 5 0 1 2 3 047 -009 -006 032 1078400 -27300 -1800 1049300 785
Craughwell 6 00 30600 1 0 5 6 0 0 6 6 020 000 -035 -015 454600 0 -10400 444200 1452
Rochfordbridge 6 98 199600 0 0 7 7 0 0 5 5 000 000 037 037 0 0 11200 11200 6
Miltownpass 6 00 248000 0 0 1 1 0 0 1 1 000 000 -002 -002 0 0 -600 -600 -0
Moneygall 7 01 410900 0 0 2 2 0 2 2 4 000 -050 -006 -056 0 -152300 -1800 -154100 -38
C1
Appendix C Evaluation of Traffic Calming Schemes Implemented 1997 ndash 2002
Location Rte Yr Construction Cost
4 Years Before 4 Years After Drop in Annual Collisions adjusted Cost Saving from Drop in Collision
Yearly Rate of Return
F S M Tot F S M Tot F S M Tot F S M Tot
Ballybrittas 7 02 197900 0 0 5 5 0 0 3 3 000 000 025 025 0 0 7600 7600 4
Monasterevin (W) 7 98 29900 1 0 3 4 0 0 1 1 019 000 045 064 434000 0 13400 447400 1496
Cullahill 8 00 134200 0 0 1 1 1 0 1 2 -025 000 -002 -027 -570000 0 -600 -570600 -425
Abbeyleix (S) 8 00 330700 0 0 1 1 0 1 3 4 000 -025 -052 -077 0 -76200 -15600 -91800 -28
Mullinavat (N) 9 01 96600 0 0 6 6 0 0 3 3 000 000 057 057 0 0 17100 17100 18
Dungarvan 9 01 212700 0 0 1 1 0 0 2 2 000 000 -028 -028 0 0 -8400 -8400 -4
Paulstown 9 99 184700 0 0 2 2 0 0 0 0 000 000 046 046 0 0 13900 13900 8
Kilkenny (E) 10 01 195200 0 2 8 10 0 1 2 3 000 007 126 133 0 21600 37800 59400 30
Claragh 10 99 206500 1 1 0 2 0 0 2 2 020 014 -050 -016 451800 43100 -15000 479900 232
Camolin 11 02 581000 0 1 4 5 0 0 1 1 000 018 055 073 0 54700 16600 71300 12
Ashford 11 99 92300 0 4 12 16 0 1 6 7 000 032 128 160 0 96400 38400 134800 146
Lifford (N amp W) 14 01 70400 0 0 10 10 0 0 5 5 000 000 095 095 0 0 28500 28500 40
Castlefinn 15 01 127500 0 0 4 4 0 0 1 1 000 000 063 063 0 0 18900 18900 15
Killygordon 15 02 113300 1 0 1 2 0 0 2 2 026 000 -030 -004 587000 0 -9000 578000 510
Ballybofey (S) 15 02 246400 0 1 8 9 0 1 5 6 000 -007 036 029 0 -21500 10700 -10800 -4
Ballyshannon (S) 15 97 159700 2 2 3 7 0 1 5 6 043 002 -051 -006 969700 5700 -15200 960200 601
Bundoran 15 97 41900 0 1 8 9 0 4 11 15 000 -087 -077 -163 0 -263700 -23000 -286700 -684
Cliffony 15 01 143800 0 0 2 2 0 1 0 1 000 -025 044 019 0 -76200 13200 -63000 -44
Grange 15 00 172500 0 1 8 9 1 0 1 2 -025 015 159 149 -570000 44800 47800 -477400 -277
Drumcliffe 15 00 259100 1 0 6 7 1 1 3 5 -005 -025 063 033 -115400 -76200 19000 -172600 -67
Ballindine 17 97 106500 1 1 1 3 0 2 4 6 021 -037 -075 -091 484800 -111400 -22600 350800 329
Claregalway 17 98 328300 0 1 2 3 0 2 5 7 000 -038 -079 -116 0 -114600 -23600 -138200 -42
Kilcolgan 18 99 46200 0 3 5 8 0 1 7 8 000 017 -059 -042 0 53300 -17800 35500 77
Ardrahan 18 99 46200 0 2 4 6 0 0 1 1 000 028 068 096 0 86300 20300 106600 231
Crusheen (N) 18 98 251400 0 0 0 0 0 1 0 1 000 -025 000 -025 0 -76200 0 -76200 -30
Barefield (N) 18 98 251400 0 0 2 2 0 1 0 1 000 -025 046 021 0 -76200 13900 -62300 -25
Charleville (S) 20 01 165400 0 0 2 2 0 1 1 2 000 -025 019 -006 0 -76200 5700 -70500 -43
C2
Appendix C Evaluation of Traffic Calming Schemes Implemented 1997 ndash 2002
Location Rte Yr Construction Cost
4 Years Before 4 Years After Drop in Annual Collisions adjusted Cost Saving from Drop in Collision
Yearly Rate of Return
F S M Tot F S M Tot F S M Tot F S M Tot
Ballyhea 20 99 784900 0 0 0 0 0 0 1 1 000 000 -025 -025 0 0 -7500 -7500 -1
Newtwopothouse 20 01 165400 1 1 2 4 0 0 0 0 024 016 044 084 539200 48900 13200 601300 364
Cork (N) 20 02 239700 0 0 1 1 0 0 2 2 000 000 -030 -030 0 0 -9000 -9000 -4
Farranfore 22 98 20000 0 0 4 4 0 0 5 5 000 000 -032 -032 0 0 -9700 -9700 -49
Killarney (E) 22 98 59900 1 2 5 8 1 0 2 3 -006 025 066 085 -136000 75500 19800 -40700 -68
Ballyvourney 22 02 570300 0 0 3 3 2 0 4 6 -050 000 -040 -090 -1140000 0 -11900 -1151900 -202
Lissarda 22 02 333900 0 1 3 4 0 1 3 4 000 -007 -015 -022 0 -21500 -4400 -25900 -8
Ballincollig (W) 22 97 496300 2 0 8 10 1 0 7 8 018 000 023 041 399700 0 7000 406700 82
Cork (W) 22 99 193900 0 0 0 0 0 0 0 0 000 000 000 000 0 0 0 0 0
Monard 24 98 39300 0 0 0 0 0 0 1 1 000 000 -025 -025 0 0 -7500 -7500 -19
Bansha 24 01 138400 1 0 1 2 0 1 1 2 024 -025 -003 -004 539200 -76200 -900 462100 334
Kilsheelan 24 99 194500 1 0 1 2 0 0 0 0 020 000 023 043 451800 0 6900 458700 236
Carrick-on-Suir (W) 24 01 211900 0 0 3 3 0 0 0 0 000 000 066 066 0 0 19800 19800 9
Mooncoin 24 98 140000 1 0 4 5 1 1 6 8 -006 -025 -057 -088 -136000 -76200 -17200 -229400 -164
Lemybrien 25 98 165700 0 0 1 1 0 1 0 1 000 -025 023 -002 0 -76200 7000 -69200 -42
Waterford (E) 25 97 63900 1 1 3 5 0 0 1 1 021 013 049 084 484800 40900 14800 540500 846
Ballinaboola 25 99 554100 0 2 1 3 0 1 2 3 000 003 -027 -024 0 10100 -8100 2000 0
Barntown 25 97 639000 0 1 0 1 0 0 2 2 000 013 -050 -037 0 40900 -15000 25900 4
Kilrane (W) 25 99 300400 0 2 2 4 0 2 2 4 000 -022 -004 -025 0 -66000 -1100 -67100 -22
Rosslare Harbour (W) 25 01 16000 0 0 0 0 0 0 0 0 000 000 000 000 0 0 0 0 0
Foxford 26 01 33300 0 4 2 6 0 0 1 1 000 064 019 083 0 195400 5700 201100 604
Clonroche 30 01 20400 2 1 1 4 1 0 1 2 022 016 -003 035 508400 48900 -900 556400 2727
New Ross (N) 30 02 47500 0 0 2 2 0 1 3 4 000 -025 -035 -060 0 -76200 -10500 -86700 -183
Smithborough (W) 54 01 56900 0 0 2 2 0 0 1 1 000 000 019 019 0 0 5700 5700 10
Carrickboy 55 02 57100 0 1 1 2 0 1 2 3 000 -007 -030 -037 0 -21500 -9000 -30500 -53
Gortahork 56 02 45500 0 0 1 1 1 0 4 5 -025 000 -080 -105 -570000 0 -24000 -594000 -1305
Dromore West 59 00 156200 0 1 3 4 0 0 0 0 000 015 069 084 0 44800 20700 65500 42
C3
Appendix C Evaluation of Traffic Calming Schemes Implemented 1997 ndash 2002
Location Rte Yr Construction Cost
4 Years Before 4 Years After Drop in Annual Collisions adjusted Cost Saving from Drop in Collision
Yearly Rate of Return
F S M Tot F S M Tot F S M Tot F S M Tot
Ballisodare 59 02 142700 0 0 0 0 0 0 0 0 000 000 000 000 0 0 0 0 0
Hodson Bay 61 01 432500 1 0 4 5 0 0 0 0 024 000 088 112 539200 0 26400 565600 131
Birr 62 01 94700 0 3 12 15 0 1 8 9 000 023 064 087 0 70400 19200 89600 95
Loughrea (W) 66 99 55400 0 0 1 1 0 1 2 3 000 -025 -027 -052 0 -76200 -8100 -84300 -152
Ballylickey 71 97 228500 0 1 0 1 0 1 1 2 000 -012 -025 -037 0 -35200 -7500 -42700 -19
Bantry (N) 71 02 115600 0 1 4 5 0 0 5 5 000 018 -045 -027 0 54700 -13400 41300 36
Clonakilty 71 99 331600 0 1 3 4 0 0 1 1 000 014 044 059 0 43100 13300 56400 17
Grangemockler 76 98 51900 1 0 1 2 0 0 0 0 019 000 023 042 434000 0 7000 441000 850
Kilkenny (N) 77 01 195200 0 0 6 6 0 0 8 8 000 000 -068 -068 0 0 -20400 -20400 -10
Newtown 78 02 181400 0 1 4 5 0 1 0 1 000 -007 080 073 0 -21500 24100 2600 1
Killeigh 80 99 97400 0 0 0 0 0 0 0 0 000 000 000 000 0 0 0 0 0
Kilmaine (N) 84 98 99800 1 0 0 1 0 0 0 0 019 000 000 019 434000 0 0 434000 435
Swanlinbar (S) 87 02 39900 0 0 1 1 0 0 1 1 000 000 -005 -005 0 0 -1500 -1500 -4
19457200 36 72 300 408 15 52 235 302 411 -249 920 1082 9376400 -759100 276100 8892000 46
C4
9
Evaluation of Traffic Calming Schemes Implemented 1997 ndash 2002Appendix B

4
Evaluation of Traffic Calming Schemes Implemented 1997 ndash 2002
Evaluation of Traffic Calming Schemes Implemented 1997 ndash 2002
TABLE OF CONTENTS page
Acknowledgements IV
Foreword V
Executive Summary VII
1 INTRODUCTION 1
11 Scope of Report 1
12 Background to Traffic Calming 1
13 Traffic Calming on National Routes 1
14 Collisions 3
2 TRAFFIC CALMING SCHEMES 5
21 Criteria for Selection 5
22 Traffic Calming Measures 6
23 Amendments to Design in 2004 10
3 TRAFFIC CALMING SCHEMES 1997 - 2002 11
31 Schemes Implemented over Period 1997 - 2002 11
32 Towns and Villages With Only One End Treated 15
33 Different Designs of Scheme 16
4 EFFECTIVENESS IN REDUCING COLLISIONS 21
41 Collisions Before and After Scheme Implementation 21
42 Area of Influence of Traffic Calming Works 21
43 Control Data 21
44 Effect on Collision Occurrence 22
45 Statistical Significance 24
46 Collision Costs and Economic Evaluation 24
47 Results by Type of Scheme 25
48 Results By Type of Collision 27
49 Results for Towns and Villages Treated at One End Only 28
5 CASE STUDIES 29
51 Comparison of Types of Traffic Calming Schemes 29
52 Successful Schemes 33
6 CONCLUSIONS 39
61 Reduction in Collisions 39
62 Reduction in Comparison with Control Data 39
63 Reduction in Severity of Collisions 39
64 Cost Benefit Analysis 39
65 Effects of Different Types of Schemes 39
i
Evaluation of Traffic Calming Schemes Implemented 1997 ndash 2002
7 RECOMMENDATIONS 41
REFERENCES 43
APPENDIX A A1
Ranking of Sites According to Primary Criteria for Selection for Traffic Calming
APPENDIX B B1
Scheme Details for All Sites
APPENDIX C C1
Collision Data Cost Data and First Year Rate of Return for All Sites
FIGURES AND TABLES
Summary Table
Figure 11 Approach to a typical village on national primary route 2
Figure 12 Typical wide entry into a town on national route 2
Figure 13 Typical wide open town centre with undefined road edge 3
Table 11 Collisions between 1994 and 1997 inside and outside urban areas 3
Table 21 Ranking of towns amp villages on national primary routes 5
Figure 21 Transition zone approaching village 7
Figure 22 A gateway 8
Figure 23 Inside gateway 9
Figure 24 Centre of village 10
Table 31 Schemes implemented per year 11
Table 32 Schemes implemented per year by county 12
Figure 31 Locations of traffic calming schemes 1997 to 2002 13
Table 33 Schemes implemented per year by route 14
Table 34 Types of traffic calming schemes 16
Figure 32 Typical gateway for types A B C and D 17
Figure 33 Typical gateway for types E F and G 18
Figure 34 Typical gateway for types H and I 18
Table 35 Types of traffic calming schemes by route 19
Table 41 Collisions before and after scheme implementation for each yearrsquos 22 programme
Table 42 Collision reductions for each yearrsquos programme 22
Table 43 Annual collision reductions for each yearrsquos programme 23
Table 44 Severities as a percentage of all collisions for each yearrsquos 23 programme
Table 45 Collision and cost saving for each yearrsquos programme 24
Table 46 Yearly rate of return 24
Table 47 Drop in collisions by type of scheme 26
ii
Evaluation of Traffic Calming Schemes Implemented 1997 ndash 2002
Table 48 Grouping type of scheme by type of gateway 26
Table 49 Types of scheme and their groupings 26
Table 410 Type of collision 27
Table 411 Division of schemes according to whether both ends were treated 28
Figure 51 Ballyshannon south approach 30
Figure 52 Ballybofey south approach 30
Figure 53 Ballybofey south zone inside gateway 31
Figure 54 Ballybofey south zone inside gateway 31
Figure 55 Killygordon west approach 32
Figure 56 Castlefinn west approach 32
Figure 57 Castlefinn centre before traffic calming 33
Figure 58 Castlefinn centre 33
Figure 59 Approach to a village similar to Grange before traffic calming 34
Figure 510 Gateway at Grange with central Island ndash Viewed from inside the 35village
Figure 511 Approach to Grange village centre from the north 35
Figure 512 Grange village centre 36
Figure 513 Approach to Newtwopothouse from north before traffic calming 37
Figure 514 Approach to Newtwopothouse from north 37
Figure 515 Crossroads at Newtwopothouse before traffic calming 38
Figure 516 Crossroads at Newtwopothouse with pedestrian crossing 38
iii
Evaluation of Traffic Calming Schemes Implemented 1997 ndash 2002
ACKNOWLEDGEMENTS
The NRA Road Safety Group which has funded the Traffic Calming programme since 1993
The NRA Regional Road Safety Engineers who not only co-ordinated the construction of the schemes but have also produced all the information and data used in this report
The Traffic Calming Working Group who first published Guidelines in 1999
The many Local Authority engineers who have designed and implemented the schemes
iv
Evaluation of Traffic Calming Schemes Implemented 1997 ndash 2002
FOREWORD
This report is the second in a series and examines the effectiveness of all traffic calming schemes that were completed between 1997 and 2002
It evaluates effectiveness by comparing collisions over four year periods both before and after construction of each scheme
A previous report ldquoEvaluation of Traffic Calming Schemes Constructed on National Roads 1993-1996rdquo covers schemes implemented before the period examined in this report
v
vi
Evaluation of Traffic Calming Schemes Implemented 1997 ndash 2002
Evaluation of Traffic Calming Schemes Implemented 1997 ndash 2002
EXECUTIVE SUMMARY In July 1998 the Government published ldquoThe Road to Safetyrdquo its strategy for road safety over the period 1998 ndash 2002 followed by a further strategy in 2004 for 2004 - 2006 A third Road to Safety document has recently been published setting out the governmentrsquos strategy for road safety over the period 2007 ndash 2012 with a target to reduce fatalities by 20 to 250 per year and to reduce injuries by 25 Under the terms of all strategies the National Roads Authority has been charged with undertaking a number of specific tasks In each of the strategies one of the tasks for NRA has been the implementation of traffic calming at towns and villages on the network of national roads and the evaluation of the effectiveness of these schemes This evaluation will enable NRA to prioritise the future programme of traffic calming by assessing the effectiveness of implemented schemes and identifying the successes of previous programmes
This report examines traffic calming schemes constructed between 1997 and 2002 It describes the principle behind traffic calming in reducing speed by altering the appearance of the road on the approach to the townvillage through the use of ldquogatewaysrdquo and by further traffic management measures within the town itself It lists the schemes undertaken in each of the six years from 1997 to 2002 and summarises the pershyformance of these schemes The report measures the effectiveness of the programmes based on collision data for a 4 year before period and a 4 year after period for each scheme
The objective of the traffic calming programme is to reduce the number and severity of collisions occurring in the treated towns and villages by reducing speed at these locations It has achieved that objective reducing the overall number of collisions by 13 Moreover the number of fatal collisions was reduced by 52 thus lowering the overall severity of crashes at traffic calming locations The number of serious and minor injury collisions decreased by 9
Between 1997 and 2002 there were 94 traffic calming schemes completed at towns and villages on the national roads 91 of these were evaluated and a summary of the results is shown below
Summary Table
Year of Completion
No of Schemes
Cost of Construction
euro
Reduction in Collisions (4 years adjusted)
Cost saving in Collisions per
year euro
Yearly Rate of Return
Fatal Serious Minor 1997 12 euro3024600 6 -6 1 euro2655300 88 1998 14 euro1852900 2 -2 -1 euro865600 47 1999 18 euro5369900 3 5 14 euro2177500 41 2000 9 euro1882000 -1 -4 6 -euro1034500 -55 2001 23 euro3881400 6 -4 25 euro3587700 92 2002 15 euro3446600 1 1 -7 euro641800 19
All Years 91 euro19457200 16 -10 37 euro8893400 46
The above table shows that comparing the four year period before with the four year period after each scheme and allowing for the overall decrease in collisions over the same period nationwide at similar sites there was an overall reduction of 43 collisions Fatal collisions reduced by 16 and minor injury collisions by 37 while serious injury collisions increased by 10 The cost (in 2002 market prices) of all the schemes constructed between 1997 and 2002 was just under euro195 million and the overall annual cost saving in collisions nearly euro89 million The Yearly Rate of Return of each yearrsquos programme varied quite considerably but averaged at 46 In cost benefit terms the schemes effectively paid for themselves within 2 years and are still creating annual savings of euro9m every year into the future
vii
viii
Evaluation of Traffic Calming Schemes Implemented 1997 ndash 2002
Evaluation of Traffic Calming Schemes Implemented 1997 ndash 2002
1 INTRODUCTION
11 Scope of Report In July 1998 the Government published ldquoThe Road to Safetyrdquo its strategy for road safety over the period 1998 ndash 2002 followed by a further strategy in 2004 for 2004 - 2006 The primary target of each of these was to reduce fatalities from road crashes by 20 from 1997 levels by 2002 and by 25 from average 1998 - 2003 levels by 2006 A third Road to Safety document has recently been published setting out the governmentrsquos strategy for road safety over the period 2007 ndash 2012 with a target to reduce fatalities by 20 to 250 per year and to reduce injuries by 25
Under the terms of all strategies the National Roads Authority has been charged with undertaking a number of specific tasks In each of the strategies one of the tasks for NRA has been the implementation of traffic calming at towns and villages on the network of national roads and the evaluation of the effectiveness of these schemes This evaluation will enable NRA to prioritise the future programme of traffic calming by assessing the effectiveness of implemented schemes and identifying the successes of previous programmes
This report examines traffic calming schemes constructed between 1997 and 2002 under the NRA programme of traffic calming for towns and villages located on national routes
12 Background to Traffic Calming Traffic calming is a way of reducing vehicle speeds by self-enforcing traffic engineering methods In Ireland two main types of traffic calming are used-
a) Traffic calming applied on national roads and other busy inter-urban roads to manage the speed of traffic passing through towns and villages located on these routes
b) Traffic calming on local urban and residential streets to manage both speed and volume of traffic on a number of streets within an area
Type a) is the form of traffic calming examined in this report
13 Traffic Calming on National Routes In towns and villages on the national road network reducing speed is the primary goal of traffic calming Posting of speed limits alone does not result in a significant reduction in speed (2005 Survey of Free Speeds NRA) since drivers typically drive at the speed they perceive as being safe A driverrsquos perception of what is safe is related to the design of the road which includes lane width curvature corner radii and available stopping-sight distance Traffic calming essentially reduces vehicle speeds by changing these elements of the roadrsquos design and thus driversrsquo perceptions of the road ahead
The transition zone between the high speed road approaching the village and the low speed street inside the village represents a difficult safety management problem In Ireland the problem first became apparent over twenty-five years ago with the proliferation of improved road sections with hard shoulders on the national roads Where these improved sections adjoined towns and villages approach speeds increased and the sections showed higher collision rates than rural sections
Many towns and villages are positioned on national roads Drivers travelling the national routes at speeds appropriate to through routes are often still travelling at those high speeds when entering towns and villages and maintain those speeds as they travel through the urban area Inside towns and villages the
1
Evaluation of Traffic Calming Schemes Implemented 1997 ndash 2002
national road usually functions as a typical main street with shops pubs housing school and church and their accompanying pedestrian and parking activity These types of activities would be more safely carried out in an environment where low speed prevails At higher speeds drivers have less time to react and are able to process less information in their field of view and the severity of injury is higher when a collision does occur For a pedestrian struck by a vehicle travelling at 64kmh the likelihood of them being killed is 85 at 48kmh the likelihood is 45 and at 32kmh it is 5 (ETSC Reducing Traffic Injuries Resulting From Excess and Inappropriate Speed 1995)
Figure 11 Approach to a typical village on national primary route
Figure 12 Typical wide entry into a town on national route
2
Evaluation of Traffic Calming Schemes Implemented 1997 ndash 2002
Figure 13 Typical wide open town centre with undefined road edge
14 Collisions The objective of the traffic calming programme is to reduce the number of collisions occurring in the treated towns and villages by reducing the speed of vehicles travelling through these locations In the four years before this programme of traffic calming started between 1994 and 1997 nearly half of the 9956 injury collisions on national roads occurred in urban areas Table 11 shows the breakdown of collision severity between rural and urban areas All areas where the speed limit at the time was 40mph or below were taken as ldquourbanrdquo
Table 11 Collisions between 1994 and 1997 inside and outside urban areas
Severity Urban National Roads Rural National Roads All National Roads
Fatal 161 531 692
Serious Injury 851 1573 2424
Minor Injury 3475 3365 6840
Total 4487 5469 9956
3
4
Evaluation of Traffic Calming Schemes Implemented 1997 ndash 2002
Evaluation of Traffic Calming Schemes Implemented 1997 ndash 2002
2 TRAFFIC CALMING SCHEMES
21 Criteria for Selection The criteria used for selection of towns and villages for traffic calming are set out in detail in the NRA document ldquoGuidelines On Traffic Calming For Towns And Villages On National Routesrdquo This was first published in 1999 and was updated in 2004
For the traffic calming programme over the years studied in this report (1997 ndash 2002) the criteria used to select sites for inclusion in the programme were those laid down in the Guidelines The period of implementation covered in this report starts in 1997 which was before the publication of the Guidelines However the principles were already in operation within the NRA Road Safety Group and the selection of sites in the early part of this period followed more or less the same process as the later ones
The main criterion was the collision history in and on approach to the village but data on all the following were collected when considering a location
Collisions Traffic flow Speed Geometry Future infrastructural developments
Collisions
The Guidelines states that selection based on collisions should take account of not just the simple collision numbers but should assess both risk per unit of travel and risk per head of population in the town or village In order to do this assessment a table was drawn up in 1999 listing these two risk categories for all towns and villages on national roads and ranking them according to a combination of the two categories The resulting table for national primary roads is reproduced in Appendix A but for illustration the 15 top ranking towns and villages on national primary roads are shown in Table 21 These 15 sites were all treated in the early years of the traffic calming programme 12 of them are among those examined in this report 3 were implemented before 1997 and were assessed in the preceding report to this
Table 21 Ranking of towns amp villages on national primary routes
Route Town Village Population AADT Length Colls over 5 yrs
Collisions per 10 Million VehKm
Collisions per year per
1000 Population
Combined Collision
Rate
N17 BALLINDINE 232 5058 0587 8 148 690 640
N25 KILRANE 214 5310 2255 10 46 935 559
N08 LITTLETON 566 5598 0591 10 166 353 508
N11 ASHFORD 500 12768 1352 19 60 760 501
N01 JULIANSTOWN 450 14270 1146 16 54 711 463
N05 FRENCHPARK 272 2994 0805 11 250 809 452
N02 COLLON 335 6164 0626 7 99 418 408
N18 KILCOLGAN 500 9565 0483 9 107 360 393
N08 WATERGRASSHILL 250 13706 0985 8 32 640 385
N01 CASTLEBELLINGHAM 762 10983 1891 20 53 525 368
N08 RATHCORMACK 500 11807 1158 11 44 440 308
N09 DUNGARVAN 500 3261 028 4 240 160 280
N04 DROMOD 250 3598 059 3 77 240 275
N20 CHARLEVILLE 3000 9655 1988 12 34 400 269
N25 LEMYBRIEN 222 6471 0918 4 37 360 254
5
Evaluation of Traffic Calming Schemes Implemented 1997 ndash 2002
Using the method of combining the two collision risk categories meant that small villages where there had been only a few collisions such as Dungarvan on N9 or Dromod on N4 ranked as highly as large towns with long lengths of national road and a higher number of collisions such as Charleville on N20 Thus several small villages where the actual collision numbers were low were given high priority in the traffic calming programme because the risk to road users from high speed traffic was comparatively high whereas many large towns with very much bigger numbers of actual collisions did not get priority
Speed
Selection is also based on the speed of vehicles in the towns and villages considered If speeds through a certain location were already low then that town or village was not given priority in the traffic calming programme Often this assessment would result in only one approach to a town or village being treated as described in section 32
Geometry
The other major criterion was the geometry of the road within the town or village considered If the separate physical elements that make up a traffic calming scheme especially that of narrowing the carriageway could not be applied to a certain location then a traffic calming scheme could not be fully implemented However several schemes were indeed implemented in towns and villages where the road width was already narrow prior to construction of the scheme These schemes often consisted of only signs and road markings this is discussed further in section 33
Other Factors
It must be acknowledged that several of the towns and villages assessed within this report did not have a collision history and did not have any record of high speeds before implementation of the traffic calming These sites were often selected for traffic calming because general road improvement work was scheduled at this location and traffic calming elements were incorporated into the work In some cases sites were selected solely on the basis of the perception of risk by residents and their representatives
22 Traffic Calming Measures The measures used as part of traffic calming break down into the four separate zones travelled through on approach to a town or village
bull the transition zone bull the gateway at the speed limit signs bull the zone inside the gateway bull the village centre
In small villages with a short length of national road there is usually no distinction between the last two zones but in the larger villages and towns there is often a zone which is inside the speed limited area yet cannot be described as a town centre These zones typically have either low density housing with off-street parking or warehouse-type commercial premises with sparsely spaced accesses
6
Evaluation of Traffic Calming Schemes Implemented 1997 ndash 2002
Transition Zone The principle behind traffic calming design is to change the driverrsquos perception of the surrounding environshyment
Figure 21 Transition zone approaching village
The ldquooptical widthrdquo perceived by the driver is dependent on the width between the boundaries of the road relative to the height of the adjoining vertical elements Generally in rural sections the width between fences is many times greater than the height of the hedges walls or fences which form the boundaries In urban streets the height of the buildings is generally greater than the width A driverrsquos perception of the appropriate driving speed is influenced by this relationship Speeds are lower where the height of the vertical elements is greater than the width of the road
Traffic calming aims to create a narrow optical width on the approach into towns and villages by using a combination of carriageway narrowing landscape treatment and the introduction of vertical elements such as signs lighting columns and trees Typically transition zone signs consist of a pair of ldquoTraffic Calming Aheadrdquo signs 400m from gateway and a pair of ldquoDo Not Passrdquo signs at 200m from the gateway
Gateway
The Gateway is placed at the start of the speed limited zone It should mark a definite change in the character of the surrounding area from rural to urban Therefore it needs to be conspicuous and the most prominent element in the transition zone The tall signs positioned close to the driving lane narrow the optical width
The guidelines recommend that where a town or village has two zones of speed limits first a 60kmh on the outskirts and then a 50kmh limit for the main body of the town the gateway should be placed at the change from 60kmh to 50kmh This is because usually the 50kmh limit has been placed at the edge of the properly built up area and the 60kmh zone covers the approach into the town where development is much less dense The design engineer can however choose to place the gateway at the 60kmh if surrounding development and environment are appropriate for this This has been done in a few of the cases examined
7
Evaluation of Traffic Calming Schemes Implemented 1997 ndash 2002
Figure 22 A gateway
Gateways fall into two distinct groups those with a solid kerbed central island and those with no island Early results from the first batch of traffic calming schemes constructed indicated that the presence of a central island at the gateway was a determining factor in the success of the scheme and the evaluation in this document confirms this The central island greatly increases the visual narrowing effect and the central lighting column signs and bollards are directly in the centre of the driverrsquos field of view
The gateway is always lit to a high standard with special gateway lanterns that shine directly onto the gateway signs This is not only effective in the dark during daylight hours the presence of lighting columns enhances the narrow optical width and is often noted subconsciously by the driver as an indication of an urban area
Inside Gateway
Treatment of the stretch of road between the gateway and the village centre is an important aspect of traffic calming The narrowing introduced at the gateway is continued so that the speed reduction occurring at the gateway is maintained on the driverrsquos journey through the town
This narrowing can be done by introducing any or all of the following central islands footpaths side kerb buildouts lining hatched markings and defined parking bays A shallow chicane can also sometimes be introduced by alternating side buildouts and parking between the two sides of the road The objectives are both to keep the driving lanes at no greater than 35m width and to give a visual impression to the driver of an urban area
Only narrowing and horizontal deflections are used as measures in traffic calming installations on national routes Vertical deflections such as humps or cushions are not appropriate because of the roadsrsquo function as main distributors between the major urban areas of the country Emergency vehicles and buses cannot easily negotiate routes where vertical deflection has been installed
As every gateway must be provided with lighting to illuminate the signs the infrastructure to supply street lighting needs to be provided at each end of the town or village It therefore follows that the supply for lightshying is usually available over the whole length of the village and lighting is provided over the full length of the scheme from gateway to gateway In the cases examined there are a few exceptions to this but even these few villages have street lighting for almost all of their length with only a few short gaps where no lamps are provided
8
Evaluation of Traffic Calming Schemes Implemented 1997 ndash 2002
Figure 23 Inside gateway
Town or Village Centre
In the town centre there is often not a need for narrowing works as part of the traffic calming as parking bays and footpaths may already exist However in locations where there is a wide road passing through the village centre it is necessary to narrow and define the through route with kerbing Even in locations where the through route is already well defined with kerbing and parking bays extra measures are usually required at junctions and where pedestrians wish to cross the national road or to cross side roads while walking along the main street
Typical works in the town centre are
bull definition of the limits of existing parking using kerb buildouts bull definition of junctions by the use of kerb buildouts bull provision of either pedestrian crossings or central islands to aid pedestrians in crossing
The main objective in the centre of the town or village is to provide a safe and pleasant environment that can easily be negotiated by vulnerable road users Thus it is important to provide safe places to cross where pedestrians are clearly visible to passing traffic and wide footpaths so that pedestrians are not forced to step into the road when passing others This often necessitates a reduction in the number of on street parking spaces and it can be difficult to persuade the local residents to accept this Extra off-street parking may have to be provided as part of the traffic calming scheme However there is a clear road safety advantage in both providing better facilities for pedestrians and in moving parking to off-street facilities Quite apart from the pedestrian collisions that result from vehicles reversing in and out of parking spaces and from parked vehicles masking crossing pedestrians as they step out onto the road many minor material damage collisions occur as vehicles pull in and out of parking spaces on busy through routes
9
Evaluation of Traffic Calming Schemes Implemented 1997 ndash 2002
Figure 24 Centre of village
23 Amendments to Design in 2004 The Guidelines on Traffic Calming were revised in 2004 Some of the changes made in this revision arose directly from problems encountered during construction and consequent operation of the schemes evaluated here There were numerous minor amendments but two of the main changes to design are worth notingshy
a) Increase of setback of signs The setback distance of the edge of the gateway signs from the kerb was originally specified as 600mm This width of setback was thought to provide enough clearance for overhanging loads on large vehicles while still giving the visual narrowing effect that was needed for the traffic calming gateway to be effective However in practice many gateway signs installed to this specification were hit glancing blows by passing large vehicles especially in areas where there was a significant proportion of agricultural vehicles in the mix of traffic
Consequently the specification was changed to a setback of 1m from the kerb So far this increased width appears to have succeeded in reducing the number of signs damaged by overhanging loads
b) Increase of ldquoexitrdquo width Where a central island is provided at a gateway the island and its signs and lighting column all form an obstruction for any abnormally wide load wishing to pass Whenever a wide load wishes to use the route through a village with this design of traffic calming the central lighting columns at each gateway must be temporarily disconnected and removed resulting in much inconvenience and an extra workload for the local authority and electricity supply engineers
To try to avoid this lengthy process of disconnection and removal an alternative design for gateways was put forward with extra width on the ldquoexitrdquo half of the gateway such that the width between edge kerb and central island on the lane for traffic approaching the village remains at the original 35m specified but the corresponding width on the lane for traffic leaving the village could be increased to anything up to 6m This design manages to keep the narrow optical effect for drivers approaching the village but provides an alternative route for wide loads which are guided through the approach to the village on the exit side of the central island
10
Evaluation of Traffic Calming Schemes Implemented 1997 ndash 2002
3 TRAFFIC CALMING SCHEMES 1997 - 2002
31 Schemes Implemented over Period 1997 - 2002 Between 1997 and 2002 there were 94 traffic calming schemes completed at towns and villages on the national roads Three of these schemes could not be evaluated because the collision data in the before period was considered to be unduly influenced by traffic calming on the other approach to the same village that had been implemented before 1997
The remaining 91 towns and villages have been assessed in this study
Table 31 below gives the number of schemes constructed per year and their costs Table 32 shows the spread across the different counties and Table 33 shows the spread across the national routes Figure 31 shows the locations of all the 94 schemes implemented in the period examined A detailed list of the 91 locations assessed and the measures implemented is given in Appendix B
Table 31 Schemes implemented per year
Year No of Schemes
Cost euro (market prices at
time of construction)
Cost euro (2002 prices)
Average Cost per Scheme euro
(2002 prices)
1997 12 1803000 3024500 252000
1998 14 1178800 1852900 132300
1999 18 3691800 5369900 298300
2000 9 1445200 1882000 209100
2001 23 3496400 3881300 168800
2002 15 3446600 3446600 229800
TOTALS 91 15061800 19457200 213800
The number of schemes constructed each year stayed roughly constant the average being about 15 or 16 per year There was a slight dip in the number finished in 2000 but there was a corresponding rise the next year The bulk of construction for most schemes took place within one year but where schemes carried on into following years it is the final year that is taken as the year of construction
The average cost per scheme was euro214000 over the six years All costs in this report are market prices given in 2002 prices The cost of an individual scheme varies immensely from euro16000 to euro785000 (See Appendix B) but the measures implemented in each scheme also varied greatly Some schemes were simply the installation of just 12 signs on approach to a village others included extensive urban renewal works including the complete restructuring of drainage and electricity supply for the village
Table 32 and Figure 31 show a fairly even spread of traffic calming implementation geographically across the country but it can be clearly seen in Table 33 that the majority of schemes implemented were on national primary roads Of all the schemes examined 81 are on primary routes and in the early years this division is even more marked with 88 of schemes implemented in 1997 and 1998 being on primary routes The fact that mainly primary routes were treated in the early years of the traffic calming programme can be directly attributed to the geometry of the national routes through these towns and villages Approaches to many urban areas on the primary routes had been realigned and widened during the twenty to thirty years preceding the traffic calming programme allowing traffic to approach the town or village at increased speed This increased speed and the consequent increase in collisions then identified these towns and villages as priority sites for traffic calming treatment On national secondary routes there had not
11
Evaluation of Traffic Calming Schemes Implemented 1997 ndash 2002
been such a widespread programme of realignment and widening and approaches to urban areas have mostly remained narrow Consequently on national secondary roads speeds are not so high on the approaches to urban areas collision rates also are not high and few towns and villages on secondary roads have met the criteria for the traffic calming programme
Table 32 Schemes implemented per year by county
Local Authority 1997 1998 1999 2000 2001 2002 Total
Cavan 1 1
Clare 2 2
Cork 2 3 2 4 11
Donegal 2 2 3 7
Galway 1 3 1 5
Kerry 2 2
Kildare 1 1
Kilkenny 1 1 2 4 8
Laois 2 2 4
Leitrim 1 1 2
Longford 1 1 2
Louth 4 1 5
Mayo 1 1 1 1 4
Meath 1 2 1 1 5
Monaghan 1 1 2 4
Offaly 1 2 3
Roscommon 2 2
Sligo 1 3 1 1 6
South Tipperary 2 1 2 5
Waterford 1 1
Westmeath 1 1 1 3
Wexford 1 2 2 2 7
Wicklow 1 1
Total 12 14 18 9 23 15 91
12
Evaluation of Traffic Calming Schemes Implemented 1997 ndash 2002
Figure 31 Locations of traffic calming schemes 1997 to 2002
13
Evaluation of Traffic Calming Schemes Implemented 1997 ndash 2002
Table 33 Schemes implemented per year by route
Route 1997 1998 1999 2000 2001 2002 Total
1 2 1 1 4
2 2 1 1 1 1 6
3 1 1
4 1 1 3 1 1 7
5 1 1 2
6 1 2 3
7 1 1 1 3
8 2 2
9 1 2 3
10 1 1 2
11 1 1 2
14 1 1
15 2 2 2 2 8
17 1 1 2
18 2 2 4
20 1 2 1 4
22 1 2 1 2 6
24 2 1 2 5
25 2 1 2 1 6
26 1 1
30 1 1 2
54 1 1
55 1 1
56 1 1
59 1 1 2
61 1 1
62 1 1
66 1 1
71 1 1 1 3
76 1 1
77 1 1
78 1 1
80 1 1
84 1 1
87 1 1
National Primary 11 12 15 8 19 9 74
National Secondary 1 2 3 1 4 6 17
Total 12 14 18 9 23 15 91
14
Evaluation of Traffic Calming Schemes Implemented 1997 ndash 2002
32 Towns and Villages With Only One End Treated
At 33 of the 94 locations implemented between 1997 and 2002 only one approach to the town or village was treated with traffic calming within this period
In 8 of these cases the one approach treated was the only entry of that route into a large town or city or into a coastal town where the route ended
In 6 of these towns and villages the other approach had already been treated in previous years before 1997 and the second treatment completed the traffic calming for the location In 3 of these villages it was considered that the first phase of traffic calming would have had an effect on collisions in the very same area that was influenced by the second phase Thus the ldquobeforerdquo data for the second phase of work would not have been usable and it was not possible to evaluate changes in collision data These are the three locations that have been removed from the evaluation The other three towns were large enough for the areas of influence from each phase of traffic calming not to overlap and consequently the collision data was not influenced by the first phase
In 2 towns the traffic calming within the study period 1997 - 2002 was the first phase in a two phase implementation and the second approach has since been treated in subsequent years In each of these towns the two areas of influence from the separate phases of work are considered not to overlap and so these two have been included in the study
For each scheme the ldquoevaluated areardquo over which the traffic calming is considered to have had an effect on collisions is described in the scheme details in Appendix B
In the other 17 cases the decision to treat only one approach was generally taken because the other end of town was not considered a suitable case for traffic calming The reasons for this were varied but broadly fell into two different categories
a) An existing feature in the road such as a right angled bend narrow bridge or a roundabout already acted as a measure to slow approaching traffic such as the northern approach to Ardee on N2 or the southern approach to Crusheen on N18
b) Traffic approaching the town or village from this particular direction was observed to be travelling slowly in general and did not need to be slowed further Usually this was because another nearby town or village had effectively slowed the traffic down and drivers had not yet regained the feel of an open road and speeded up The western approach from Dromod to Roosky on N4 and the southern approach from Ennis to Barefield on N18 are examples of this
15
Evaluation of Traffic Calming Schemes Implemented 1997 ndash 2002
33 Different Designs of Scheme
As traffic calming schemes are made up of all the different elements described in section 22 there is a very large number of variations possible but the 91 schemes examined can be broadly divided into 10 different types as follows-
A Gateway with side buildouts and central island Definition inside village using central islands and narrowing with kerbs
B Gateway with side buildouts and central island Definition inside village using narrowing with kerbs but no islands
C Gateway with side buildouts and central island Definition inside village using line marking only
D Gateway with side buildouts and central island No definition inside village
E Gateway with side buildouts only Definition inside village using central islands and narrowing with kerbs
F Gateway with side buildouts only Definition inside village using narrowing with kerbs but no islands
G Gateway with side buildouts only Definition inside village using line marking only
H Gateway signs only Definition inside village using line marking only
I Gateway signs only No definition inside village
J No gateway Definition inside village using narrowing with kerbs but no islands
Table 34 shows the number of schemes in each category and whether the traffic calming was done at both ends of the town or village or whether it was installed only at one end Towns and villages where traffic calming was constructed at only one end are indicated in Figure 31 and in the appendices lists by (W) (N) (E) or (S) following the town name
Table 34 Types of traffic calming schemes
Type Treatment no of villages
both ends
one end
A Central island gateway central islands amp narrowing with kerbs inside 39 29 10
B Central island gateway narrowing with kerbs amp no islands inside 8 3 5
C Central island gateway and lining 5 5
D Central island gateway and nothing else 1 1
E Simple gateway central islands amp narrowing with kerbs insides 10 5 5
F Simple gateway narrowing with kerbs amp no islands inside 11 10 1
G Simple gateway and lining 5 2 3
H Gateway signs and lining 3 3
I Gateway signs and nothing else 8 6 2
J No gateway narrowing with kerbs amp no islands inside 1 1
Total 91 64 27
16
Evaluation of Traffic Calming Schemes Implemented 1997 ndash 2002
The largest single category is type A with a gateway with side buildouts and central island with a string of central islands through the village approach and in the centre and also narrowing from the side with kerb buildouts through the approach and centre Most of the 39 schemes in this category give the full impression of a village at the point of passing the gateway and most have footpaths throughout the scheme from gateway to gateway They all have street lighting through the entire scheme
Another 14 sites have the full gateway with a central island and side buildouts but do not have such extensive works inside the village These fall into categories B C and D Types A B C and D are generally on national primary routes very few are on secondary routes Figure 32 illustrates a typical gateway into such a village where the wide carriageway is narrowed by kerbing the hard shoulder and inserting a central island
Figure 32 Typical gateway for types A B C and D
The next two biggest single categories are type E with 10 schemes and type F with 11 schemes These types along with type G have a gateway that has no central island but which does narrow the road using kerbed buildouts at the side of the road usually in the hard shoulder Types E F and G were installed at towns where the width of the approach into town was wide enough to warrant traffic calming but was less than the 157m minimum needed to accommodate central island signs and cycle bypass Types E F and G have varying degrees of definition work inside the village similar to types A B and C Figure 33 illustrates a typical gateway into such a village where the wide carriageway is narrowed by kerbing the hard shoulder but there is no central island
Types H and I do not have physical works at the gateway at all Typically there is no hard shoulder at these sites and the gateway signs and transition zone signs are simply installed on the verge In type H schemes some visual narrowing has been implemented inside the village using line markings and hatching but in type I there is nothing done other than installation of the gateway and transition zone signs The one scheme that was installed on a dual carriageway approach to a city falls into the category of type H Figure 34 illustrates a typical gateway into such a village where there is no narrowing or kerbs installed just signs placed in the verge
17
Evaluation of Traffic Calming Schemes Implemented 1997 ndash 2002
Figure 33 Typical gateway for types E F and G
Figure 34 Typical gateway for types H and I
One scheme examined in this report had neither gateway signs nor transition zone installed However extensive works were done in the centre of the small village to narrow the carriageway and define the parking areas behind kerbs This village does not fall into any the other categories and is the only type J in the study
For the purposes of examining results types A B C and D can be grouped together as a ldquoCentral Island Gatewayrdquo category types E F and G can be grouped together as a ldquoSimple Gatewayrdquo category and types H and I can be grouped together as a ldquoSigns Onlyrdquo category
Table 35 shows the incidence of each type of traffic calming scheme on each national routes Although there is a wide spread of types across all roads it can be seen that types A B C and D are mostly on the national primary roads while types H and I are largely on the national secondary routes and those sections of national primaries where widening has not taken place
18
Evaluation of Traffic Calming Schemes Implemented 1997 ndash 2002
Table 35 Types of traffic calming schemes by route
Route Type of Scheme
A B C D E F G H I J No in Study
1 1 1 1 1 4
2 4 1 1 6
3 1 1
4 2 3 1 1 7
5 1 1 2
6 1 2 3
7 1 1 1 3
8 2 2
9 1 2 3
10 1 1 2
11 1 1 2
14 1 1
15 4 1 1 2 8
17 1 1 2
18 2 1 1 4
20 3 1 4
22 2 1 1 1 1 6
24 2 1 2 5
25 5 1 6
26 1 1
30 1 1 2
54 1 1
55 1 1
56 1 1
59 2 2
61 1 1
62 1 1
66 1 1
71 1 1 1 3
76 1 1
77 1 1
78 1 1
80 1 1
84 1 1
87 1 1
National Primary 34 6 3 1 7 11 5 2 4 1 74
National Secondary 5 2 2 3 1 4 17
Total 39 8 5 1 10 11 5 3 8 1 91
19
20
Evaluation of Traffic Calming Schemes Implemented 1997 ndash 2002
Evaluation of Traffic Calming Schemes Implemented 1997 ndash 2002
4 EFFECTIVENESS IN REDUCING COLLISIONS
41 Collisions Before and After Scheme Implementation Collision numbers were measured at each of the 91 locations for the 4 years before and 4 years after implementation of each individual scheme The ldquoafterrdquo period was taken as beginning in the year after the final year of construction as the full effect of the scheme would not be noticeable during construction works Details of the collision data for each site are given in Appendix C but summary tables are given in this chapter
42 Area of Influence of Traffic Calming Works Collision numbers for both before and after data were taken from the map-based NRA Collision Database Only collisions taking place on the national routes were considered and any collision that was located within the length of road influenced by the traffic calming was included in the data This area of influence extended to 200m outside each gateway in order to take account of the effect of the transition zone Where only one side of a village was treated the area taken was from the gateway to the centre of the town Where an existing traffic calming feature existed within the speed limited zone on the entry into a town such as a sharp bend or a narrow bridge the area of influence was assumed to extend only as far as that feature Descriptions of the area of influence for each location are given in the detailed list of locations in Appendix B
43 Control Data This report takes account of the main confounding factors affecting these statistics Collision numbers in general on Irelandrsquos national roads have decreased throughout the before and after periods for these schemes and the assessment makes allowances for this trend Changes in traffic volume in patterns of traffic flow in population distribution in Garda enforcement and in attitude to road safety have all had an effect on collision rates on national roads in towns and villages whether or not traffic calming has been installed This effect is accommodated by adjusting the before and after data in line with a comparison group the collisions in each 4 year before and after period within all similar sized towns and villages on all national roads
The general trend nationwide within all towns and villages in the control group has been a drop in collisions of roughly 15 between before and after periods However the reduction varies markedly between the different collision rates fatal collisions have reduced by a similar percentage to the general trend but serious injury accidents have reduced by over 40 and minor injuries have reduced by only about 10 All reductions in collisions at the sites assessed in this study have to be compared against this general nationwide trend of a shift from serious injury to minor injury
The effect of ldquoregression to meanrdquo is more difficult to make allowances for in this study The random nature of road crashes tends to cause collision frequencies at specific locations to fluctuate The selection of towns and villages for treatment on the basis of their past collision record can introduce a source of potential bias in measuring the effectiveness of the scheme This arises because the selection process tends to pick sites at the peak of their fluctuations in collision frequencies and such sites might well have experienced reductions in collision rate in following years even if no treatment had been applied (Rune Elvik 2002)
To allow for the effect of regression to mean the change in collision rates at treated sites would need to be compared with a number of similar untreated control sites This could not have been done in the case of the traffic calming programme as no such control sites exist Whenever a town or village with a collision history was identified it was put on the programme for treatment with traffic calming it would have been considered unacceptable to leave the location untreated simply for the purposes of research
21
Evaluation of Traffic Calming Schemes Implemented 1997 ndash 2002
44 Effect on Collision Occurrence
Table 41 shows for each yearrsquos programme of traffic calming schemes the collisions over the 4 years before and after each scheme
Table 41 Collisions before and after scheme implementation for each yearrsquos programme
Year No of
Schemes
4 Years Before 4 Years After
Fatal Serious Minor Total Fatal Serious Minor Total
1997 12 10 16 52 78 3 15 51 69
1998 14 5 8 31 44 2 6 30 38
1999 18 5 23 54 82 1 8 36 45
2000 9 2 4 27 33 3 6 19 28
2001 23 10 13 95 118 3 12 59 74
2002 15 4 8 41 53 3 5 40 48
Total 91 36 72 300 408 15 52 235 302
The reduction in collisions for each yearrsquos programme is shown in Table 42 as is the adjusted reduction allowing for the general drop in collisions over the study years in the control group of other similar sites Table 43 shows these adjusted drops in annual terms and in percentages
All this data for each individual scheme can be seen in Appendix C
There is considerable fluctuation in results between each yearrsquos programme of traffic calming so it is best to concentrate on the overall figures for the entire six years
Over all 91 sites there was a drop of 106 collisions from 408 to 302
When adjusted for the general nationwide fall in collisions on similar sites this gives a total drop of 433 colshylisions or 108 per year
This is a 13 reduction on the collision numbers before implementation of the schemes
Table 42 Collision reductions for each yearrsquos programme
Year No of
Schemes
4 Year Reduction 4 Year Reduction Adjusted
Fatal Serious Minor Total Fatal Serious Minor Total
1997 12 7 1 1 9 55 -64 06 -03
1998 14 3 2 1 6 18 -20 -12 -15
1999 18 4 15 18 37 30 50 140 220
2000 9 -1 -2 8 5 -14 -36 59 08
2001 23 7 1 36 44 65 -37 246 274
2002 15 1 3 1 5 11 07 -71 -52
Total 91 21 20 65 106 164 -100 368 433
22
Evaluation of Traffic Calming Schemes Implemented 1997 ndash 2002
Table 43 Annual collision reductions for each yearrsquos programme
Year No of
Schemes
Annual Drop in Collisions Adjusted Percentage Drop in Collisions
Fatal Serious Minor Total Fatal Serious Minor Total
1997 12 14 -16 01 -01 65 -74 1 -0
1998 14 05 -05 -03 -04 47 -51 -4 -4
1999 18 07 13 35 55 75 39 28 33
2000 9 -04 -09 15 02 -88 -55 24 3
2001 23 16 -09 62 69 68 -44 29 27
2002 15 03 02 -18 -13 27 13 -21 -12
Total 91 41 -25 92 108 52 -24 14 13
While collisions of all severity types at the examined locations have reduced in actual numbers the decrease in serious injury collisions at these sites has not followed the general trend nationwide over this period on national roads which have experienced a particularly large decrease in serious injury collisions When allowing for the trend in the control data the actual reduction of 20 serious injury collisions in a 4 year period translates to a relative increase of 10 collisions
Looking at each individual severity type the adjusted reduction in fatal collisions is 164 or 41 per year and that in minor injury collisions is 368 or 92 per year The adjusted change in serious injury collisions is an increase of 25 per year These numbers represent a 52 drop in fatal collisions a 14 drop in minor injury collisions and a 24 rise in serious injury collisions
The implementation of traffic calming has clearly had a much more marked effect on fatal collisions than on other injury collisions resulting in a lowering of the severity of collisions overall Table 44 below shows for each year each severity category as a percentage of overall collisions in the 4 years before implementation and the 4 years after implementation It can be seen that in general for each yearrsquos programme except for year 2000 the proportion of fatal collisions has roughly halved the proportion of serious collisions has stayed much the same while that of minor collisions has slightly increased Looking at the entire six yearsrsquo programme in the four years before implementation of each traffic calming scheme fatal collisions constituted 9 of all collisions in these towns and villages while serious and minor injury collisions were 18 and 73 of the total respectively In the four years after implementation fatal collisions decreased to 5 of all collisions serious reduced very slightly to 17 and minor rose to 78
Table 44 Severities as a percentage of all collisions for each yearrsquos programme
Year No of
Schemes
Percentage of all Collisions 4 years before
Percentage of all Collisions 4 years after
Fatal Serious Minor Fatal Serious Minor
1997 12 13 20 67 4 22 74
1998 14 11 18 71 5 16 79
1999 18 6 28 66 2 18 80
2000 9 6 12 82 11 21 68
2001 23 8 11 81 4 16 80
2002 15 8 15 77 6 11 83
Total 91 9 18 73 5 17 78
It can therefore be concluded that implementation of these traffic calming schemes has not only reduced the number of collisions overall but has also reduced the average severity of those collisions that did occur
23
Evaluation of Traffic Calming Schemes Implemented 1997 ndash 2002
45 Statistical Significance Statistical significance is difficult to achieve with locations that have such small numbers of individual collisions However the chi squared test was used to compare the results with the control data and the overall result for all sites indicates an 80 confidence level meaning that there is a 20 chance that the observed reduction in collisions is due to mere random fluctuation
46 Collision Costs and Economic Evaluation Collision costs are calculated using figures from the Goodbody report on Cost-Benefit Analysis of Transport Projects 2004 The ldquoWillingness To Payrdquo method of economic assessment has been used dividing the collisions into the separate categories of fatal serious injury and minor injury Table 45 lists the cost savings per year and Table 46 compares these with construction costs to give an average yearly rate of return for each yearrsquos programme of traffic calming
Table 45 Collision and cost saving for each yearrsquos programme
Year No of
Schemes
Drop in Annual Collisions adjusted
Annual Cost Saving from Drop in Collisions euro 2002 prices
Fatal Serious Minor Fatal Serious Minor Total
1997 12 14 -16 01 3138300 -487300 4300 2655300
1998 14 05 -05 -03 1029900 -155000 -9200 865600
1999 18 07 13 35 1689100 383100 105200 2177500
2000 9 -04 -09 15 -800900 -277800 44200 -1034500
2001 23 16 -09 62 3681900 -278700 184600 3587700
2002 15 03 02 -18 638100 56800 -53100 641800
Total 91 41 -25 92 9376400 -759100 276100 8893400
The annual cost saving from the drop in collisions over all 91 schemes is calculated to be approximately euro89 million Most of this saving comes from the drop in fatal collisions which is the group with the most significant fall proportionately a drop of 41 per year from 79 per year (both figures adjusted for the control data)
Table 46 Yearly rate of return
Year No of
Schemes
Annual Collision Cost Saving euro
2002 prices
Cost of Constr euro 2002 prices
Yearly Rate of Return
1997 12 2655300 3024600 88
1998 14 865600 1852900 47
1999 18 2177500 5369900 41
2000 9 -1034500 1882000 -55
2001 23 3587700 3881400 92
2002 15 641800 3446600 19
Total 91 8893400 19457200 46
The average yearly rate of return for each yearrsquos programme varies between 92 and a negative return of 55 but the average rate of return over all six years is 46
24
Evaluation of Traffic Calming Schemes Implemented 1997 ndash 2002
47 Results by Type of Scheme Tables 47 and 48 show the collision savings organised into the 10 different types of scheme and their groupings As guidance a description of the different types and groupings is repeated in Table 49
Once the 91 schemes are divided up into types the individual numbers of collisions and schemes become too small to give a reliable statistical result but a few facts are worth noting-
a) Types A B C and D are all having a positive effect on the number of collisions These all have a gateway with a central island and varying degrees of physical works inside the speed limited zone
Taken together as a group types A to D have a clearly positive result with on average 11 collisions per town or village saved over a 4 year period
b) Types E F and G taken together do not have such a clear result The 10 locations in category E experienced an average increase of nearly 1 collision over a 4 year period with collisions in all severity categories increasing while type G has a better result and appears to be performing nearly as well as types A to D Taken together as a group these schemes that have physical narrowing but no central island at the gateway seem to have had little effect on collision occurrence
c) Types H and I stand out as both having had no success at all with on average an increase of 12 collisions at each town or village over a four year period
Type H and type I are the very simplest types of scheme with no physical works done either at the gateway or throughout the village Gateway signs and transition zone signs were installed and in type H some lining was done through the village to define a narrow carriageway
Type I has usually been installed at villages where the road width was already narrow before implementation and neither further narrowing nor physical works could be done at these locations This is reflected in the low number of collisions at these sites before
implementation 14 over 8 sites which comes to roughly 2 collisions per site At other sites the average number of collisions per site before implementation was generally much higher than this The overall average across all 91 sites was approximately 5 collisions per site
d) Interestingly the one scheme alone in Type J appears to have worked This scheme had extensive kerbing and footpath works done at the centre of the small village to define the road edge and the central junction Footpaths and lighting were installed throughout the village from one speed limit to the other and there is a clear physical narrowing at the speed limit signs but no gateway signs or transition zone signs were installed so there is no narrowing in optical width on approach However as there is only one scheme in this category no real conclusions can be drawn about this design
25
Evaluation of Traffic Calming Schemes Implemented 1997 ndash 2002
Table 47 Drop in collisions by type of scheme
Type No in Study
All colls 4 years before
Drop in collisions (4 years adjusted) Annual cost saving euro
Fatal Serious Minor Total Tot per
site Total Per site
A 39 171 49 -19 347 377 10 2913300 74700
B 8 31 32 -12 78 98 12 1772300 221500
C 5 42 -02 13 80 91 18 42600 8500
D 1 8 -02 10 26 34 34 -40800 -40800
E 10 48 -11 -22 -56 -90 -09 -867800 -86800
F 11 55 58 -35 -49 -26 -02 2985200 271400
G 5 20 25 -09 28 43 09 1354000 270800
H 3 13 10 -37 -55 -82 -27 260900 87000
I 8 14 07 01 -59 -51 -06 366800 45900
J 1 6 00 11 27 38 38 106600 106600
Total 91 408 164 -100 368 433 05 8893400 Avge 97700
Table 48 Grouping type of scheme by type of gateway
Type No in Study
All colls 4 years before
Drop in collisions (4 years adjusted) Annual cost saving euro
Fatal Serious Minor Total Tot per
site Total Per site
Central Island
Gateway 53 252 76 -08 532 600 11 4687600 88400
Simple Gateway
26 123 71 -67 -77 -73 -03 3471500 133500
Signs Only
11 27 17 -36 -114 -133 -12 627800 57100
Type J 1 6 00 11 27 38 38 106600 106600
Total 91 408 164 -100 368 433 05 8893400 Avge 97700
Table 49 Types of scheme and their groupings
Type Treatment Group
A Central island gateway central islands amp narrowing with kerbs inside
Central Island Gateway
B Central island gateway narrowing with kerbs amp no islands inside
C Central island gateway and lining
D Central island gateway and nothing else
E Simple gateway central islands amp narrowing with kerbs insides Simple
GatewayF Simple gateway narrowing with kerbs amp no islands inside
G Simple gateway and lining
H Gateway signs and lining Signs Only
I Gateway signs and nothing else
J No gateway narrowing with kerbs amp no islands inside No Gateway
26
Evaluation of Traffic Calming Schemes Implemented 1997 ndash 2002
48 Results By Type of Collision Table 410 shows the before and after collisions each year for the three main types of collision pedestrian single vehicle and head on The drop shown in the table is an adjusted figure and is relative to the decrease in each of these types of collision in the control data throughout all similar towns and villages on national roads over the period examined
The results show that pedestrian collisions decreased overall by about 8 from a figure of 69 and head-on type collisions have decreased by about 14 from 45 These are quite significant decreases of about 13 and 29 respectively However there has been effectively no change in single vehicle collisions only a very small increase of negligible percentage change
Table 410 Type of collision
Year No of
Schemes
All collisions 4 years before Drop in collisions (4 years adjusted)
ped single veh head on ped single veh head on
1997 12 7 15 8 -70 -03 09
1998 14 3 3 7 -19 -34 -01
1999 18 18 13 7 93 59 13
2000 9 5 6 4 01 -20 12
2001 23 24 14 16 49 -10 132
2002 15 12 12 3 20 06 -30
Total 91 69 63 45 75 -02 135
Total Percentage Drop 13 -0 29
The greatest decrease is in head-on type collisions Head-on collisions are not a particularly significant proportion of all collisions within these towns and villages and before implementation of the traffic calming they constituted only about 11 of all of collisions However the reduction of 135 collisions over four years represents a 29 drop in this type of collision compared with figures before implementation which is a significant result This decrease can be directly attributed to the fundamental design of traffic calming in which the two directions of flow are divided by central kerbed islands and central hatched areas
Pedestrian collisions have also decreased Pedestrian collisions were about 19 of all collisions within these towns and villages and the drop of 13 in pedestrian collisions is much the same as the general drop of 13 in collisions overall within the treated towns Although this is a good result in that pedestrian collisions have decreased in treated towns and villages 13 more than they have decreased in other similar locations it is not as good as was expected It was assumed that the inherent ldquopedestrian friendlyrdquo nature of traffic calming with provision of footpaths and pedestrian crossings would have a comparatively greater effect on pedestrian collisions Examination of the individual collisions in the after period suggests that the increases in pedestrian collisions are occurring in only about a dozen of the 91 towns and villages and that half of these dozen have 3 or more pedestrian incidents in the four year after period There appears to be no correlation with the provision of a pedestrian crossing as part of the traffic calming scheme A more detailed study of these locations is needed to investigate pedestrian collisions further and to ascertain whether there is any link between the provision of either pedestrian crossings or footpaths and the decrease in pedestrian collisions
Single vehicle collisions have not changed at all in relation to the general decrease in single vehicle collisions in all similar towns and villages Single vehicle collisions are those involving only one vehicle Usually in single vehicle incidents the vehicle leaves the driving lane of the road and collides with a roadside object
27
Evaluation of Traffic Calming Schemes Implemented 1997 ndash 2002
Occasionally there is no collision with a roadside object but because of the difference in levels between road and surrounding ground the occupants are injured when the vehicle comes to a halt The lack of any significant change in the occurrence of single vehicle collisions could possibly be explained by the fact that implementation of traffic calming introduces many new objects into the roadside space and reduces the available width within the driving lane Thus when a driver does stray from the correct path there is less forgiveness in the roadside environment and the chances of leaving the defined driving lane or striking an object is increased The general decrease in collisions at traffic calming sites due to the reduced speed is offset by this increased chance of hitting a roadside object which has thus resulted in no change in the incidence of these types of collisions
49 Results for Towns and Villages Treated at One End Only At 27 of the 91 locations only one end of the town or village was treated with traffic calming In 8 of these cases these were entries into a large town or city or into a coastal town where the route ended at the remaining 19 locations there was a through route but only one half of the village was treated Table 411 shows the results arranged according to whether or not both ends of the town were treated
The previous report on traffic calming constructed between 1993 and 1996 concluded that villages which had traffic calming at only one end did not perform in evaluation as well as those where both ends were treated The results shown below repeat this phenomenon At the 27 locations where only one end of the town or village was treated collisions reduced only by an average of 8 while at the other 64 locations where both ends were treated the reduction in collisions was 14 on average
When the 8 ldquosingle entryrdquo locations are separated out it can be seen that these treatments worked better than the other 19 one-end towns and villages This can perhaps be explained by the fact that these 7 locations were put in place to reduce the speed of vehicles approaching the outskirts of large towns or cities and their effect is only required to act within the environs of the traffic calming works Once past the traffic calming scheme the traffic enters a congested network where speed is not a concern For these 8 sites it was only the short length immediately around the traffic calming works was that was evaluated in the study
Table 411 Division of schemes according to whether both ends were treated
Type No in study
All colls 4 years before
Drop in collisions (4 years adjusted) Percentage drops
Fatal Serious Minor Total Total
per site Fatal Serious Minor Total
Both Ends 64 310 130 -76 311 364 06 52 -24 15 14
Single Entry 8 31 06 08 47 61 08 38 29 22 23
Half 19 67 29 -32 11 08 00 59 -41 3 1
All One-end 27 98 35 -24 58 69 03 54 -22 9 8
Total 91 408 164 -100 368 433 05 52 -24 14 13
28
Evaluation of Traffic Calming Schemes Implemented 1997 ndash 2002
5 CASE STUDIES
51 Comparison of Types of Traffic Calming Schemes The results indicate that schemes that have a central island at the gateway types AB C and D as
described in section 33 are more effective at reducing collisions than those schemes that do not have censhytral islands Four schemes on N15 were chosen to illustrate the typical differences between these types of scheme so that the layout of a scheme that has succeeded in collision reduction can be compared with one
that has not
The schemes illustrated all on N15 and in County Donegal are Ballyshannon Ballybofey Killygordon Castlefinn
Schemes With Central Island Type Gateways
Ballybofey and Castlefinn are schemes of type A having a gateway with both side buildouts and central island Inside the village or town this definition is continued using central islands and narrowing with kerbs
Both of these sites have experienced a reduction in collisions as the figures for 4 year before and after periods show Castlefinn particularly has had a notable reduction very much larger than the average of 13 for all the sites in this study
TownVillage collisions before collisions after reduction (adjusted) Ballybofey 9 6 16 Castlefinn 4 1 72
Schemes With Signs Only at Gateways
Ballyshannon and Killygordon are schemes of type H having only signs and no physical works at the gateway Definition inside the town or village is given only by using road markings
None of these sites has experienced any significant reduction in collisions as the 4 year figures below show These locations have had a slight increase in collisions relative to the general decrease in collisions across all similar towns and villages in the control data
TownVillage collisions before collisions after reduction (adjusted) Ballyshannon 7 6 -4 (increase) Killygordon 2 2 -9 (increase)
Comparison of Ballyshannon and Ballybofey
Ballyshannon and Ballybofey are similar sized towns and before traffic calming was introduced had similar approaches In both towns the speed limit extends a long way outside the centre of town and the road was wide on these approaches Both towns have busy town centres with narrow streets where vehicle speeds are not particularly high but in the zone between gateway and town centre high speeds were a problem and were addressed by traffic calming
While Ballyshannon had no central island constructed at the gateway and was treated with only signs and line marking on these approaches Ballybofey was treated with a kerbed central island kerbs and footpaths to narrow the road and a string of further central islands between the gateway and the centre of town Figures 51 and 52 below illustrate this
29
Evaluation of Traffic Calming Schemes Implemented 1997 ndash 2002
Comparison of figures 51 and 52 shows that the optical width has been considerably narrowed in Ballybofey whereas the effect is not so marked in Ballyshannon Figures 53 and 54 show how in Ballybofey this narrowing is continued on for the 600m between gateway and town centre reinforcing the slowing down effect that drivers experienced at the gateway
The differences in design of the approaches to these towns may possibly account for the differences in collision occurrence after traffic calming implementation
Figure 51 Ballyshannon south approach
Figure 52 Ballybofey south approach
30
Evaluation of Traffic Calming Schemes Implemented 1997 ndash 2002
Figure 53 Ballybofey south zone inside gateway
Figure 54 Ballybofey south zone inside gateway
31
Evaluation of Traffic Calming Schemes Implemented 1997 ndash 2002
Comparison of Killygordon and Castlefinn
Killygordon and Castlefinn are located within 6km of each other on the most northern section of N15 with a much lower traffic volume than either Ballybofey or Ballyshannon The N15 along this section in general has a narrower cross section without hard shoulders
Killygordon is a small village and had narrow approaches even before implementation of the traffic calming and the low collision rate before implementation reflects this The minimal treatment to this village under the traffic calming programme did little to change the collision occurrence Castlefinn is a larger village and before implementation its approaches were wider than those to Killygordon The number of collisions in Castlefinn before implementation was twice that in Killygordon The construction of a kerbed central island kerbs and footpaths to narrow the road and a further central island at the centre of the village has evidently had an effect on collisions which have now reduced to numbers below that in Killygordon Figures 55 and 56 below illustrate the differences between the two villages at the gateway while Figures 57 and 58 illustrate the changed look of the centre of Castlefinn as a result of traffic calming construction
Figure 55 Killygordon west approach
Figure 56 Castlefinn west approach
32
Evaluation of Traffic Calming Schemes Implemented 1997 ndash 2002
Figure 57 Castlefinn centre before traffic calming
Figure 58 Castlefinn centre after traffic calming
33
Evaluation of Traffic Calming Schemes Implemented 1997 ndash 2002
Figure 59 Approach to a village similar to Grange before traffic calming
52 Successful Schemes
N15 Grange
Grange has had one of the greatest reductions in collisions in this study
Collisions in 4 years before 9 Collisions in 4 years after 2 reduction (adjusted) 75
Grange is on a busy section of N15 in County Sligo It is a medium sized village with shops pubs petrol station police station church and a few dozen dwelling houses all with frontage onto the national road It has two busy junctions with local primary distributor roads leading to a moderately populated hinterland in the summer the population increases significantly with holidaymakers visiting the coastal area
Traffic calming was installed in 2000 Before this the approaches to the village were wide with hard shoulshyders and this cross section continued through the length of the town On entering the village from the north the length within the built up area approaching the centre is downhill so that drivers would need constant concentration and awareness of their speed to achieve a reduction in speed and to maintain that reduction on this approach From the south there is also a downhill approach but outside the built up area so that speeds approaching the start of the speed limited zone were high
Although an appropriate photograph of Grange before construction of the traffic calming is not available the photograph below of a similar sized village on N24 with similar road widths is shown below in Figure 59
Grange was treated with kerbed central islands at each gateway kerbs and footpaths to narrow the road and a string of further central islands between the two gateways Driving lanes in each direction are now a constant 35m throughout the village A signalised controlled pedestrian crossing was also constructed at the centre of the town There are now footpaths for the entire length of village between gateways and as well as the controlled crossing there are several locations where pedestrians can cross the road with the aid of the central island refuges Figures 510 511 and 512 below illustrate the works
In the years since traffic calming was implemented further housing an industrial estate and commercial sites have been constructed in the vicinity Traffic volumes turning at the junction have increased substantially
34
Evaluation of Traffic Calming Schemes Implemented 1997 ndash 2002
Figure 510 Gateway at Grange with central Island ndash Viewed from inside the village
Figure 511 Approach to Grange village centre from the north
35
Evaluation of Traffic Calming Schemes Implemented 1997 ndash 2002
Figure 512 Grange village centre
In the four years before construction of traffic calming there were roughly 2 collisions each year in the vilshylage Four of the nine collisions were single vehicle incidents and two were pedestrian collisions both involving pedestrians attempting to cross the road Skidding occurred in six of the nine collisions which is an unusually large proportion and suggests that there was a high incidence of sudden braking from high speeds
In the four years after implementation of the scheme there have been only two collisions one in the village centre where the rear of a parked vehicle was hit and one single vehicle loss of control incident on the south approach to the village
N20 Newtwopothouse Newtwopothouse has also had a significant reduction in collisions in this study
Collisions in 4 years before 4
Collisions in 4 years after 0
reduction (adjusted) 100
Newtwopothouse is on a busy section of N20 in County Cork It is a tiny settlement on a staggered junction with only a pubcafe and a shoppost office having frontage onto the national road The bulk of the housing in the area is along the two side roads stretching a few hundred metres down each road and on the eastshyern side road there is a school about 100m from the N20 Before construction of the traffic calming it did not appear to the passing driver on N20 as if there were a village at all merely a crossroads However there was a fairly large volume of traffic turning to and from the two side roads and pedestrian traffic across the N20 between housing and school
Before implementation of traffic calming the road on approach to and through the location was wide being a standard 7m single carriageway with 3m hard shoulders Figures 513 and 515 show the location before traffic calming was installed
36
Evaluation of Traffic Calming Schemes Implemented 1997 ndash 2002
Figure 513 Approach to Newtwopothouse from north before traffic calming
Figure 514 Approach to Newtwopothouse from north
Traffic calming was implemented in 2001 Similarly to Grange Newtwopothouse was treated with kerbed central islands at each gateway kerbs and footpaths to narrow the road further central islands between the two gateways and a signalised controlled pedestrian crossing in the centre Driving lanes in each direction are now a constant 35m throughout the scheme and there is now lighting for the entire length between gateways and footpaths in the central stretch around the junction and bus stops Figures 514 and 516 below illustrate the works by showing the same locations as shown in Figures 513 and 515
37
Evaluation of Traffic Calming Schemes Implemented 1997 ndash 2002
Figure 515 Crossroads at Newtwopothouse before traffic calming
Figure 516 Crossroads at Newtwopothouse with pedestrian crossing
In the four years before construction of traffic calming there were 4 collisions at this location all of which involved turning at the junction
In the four years after implementation of the scheme there have been no collisions
38
Evaluation of Traffic Calming Schemes Implemented 1997 ndash 2002
6 CONCLUSIONS
61 Reduction in Collisions Between 1997 and 2002 there were 94 traffic calming schemes completed at towns and villages on the national roads
Over all the 91 studied locations comparing the 4 years before each scheme with the 4 years after there was a reduction of 106 collisions made up of 21 fatal collisions 20 serious injury collisions and 65 minor injury collisions
62 Reduction in Comparison with Control Data When comparing with the control data and allowing for the general decrease in collisions overall on national roads during this time period this translates to a reduction of 433 collisions This is made up of a reduction of 164 fatal collisions and 368 minor injury collisions and an increase of 100 serious collisions
These figures represent a 13 reduction in all collisions with fatal collisions reduced by 52 Serious and minor injury collisions together reduced by 9
63 Reduction in Severity of Collisions The implementation of traffic calming has therefore had the effect of reducing the number of crashes within the geographical areas of their influence Its more significant effect is in reducing the severity of collisions The percentage of all collisions that were fatal dropped from 9 in the 4 years before implementation to 5 in the 4 years after The percentage of minor injury collisions rose by a corresponding amount
64 Cost Benefit Analysis Using the ldquoWillingness to Payrdquo method of evaluation the average yearly rate of return over all the years evaluated is 46
65 Effects of Different Types of Schemes Traffic Calming Schemes that have a central island in the Gateway and continue this effect with solid central islands throughout the village are more effective in reducing collisions than those that do not
Schemes that consisted of only signs and had no physical works did not have any effect at all in reducing collisions
Traffic Calming Schemes where both ends of the town or village were treated were more effective in reducshying collisions than those where only one was treated
39
Evaluation of Traffic Calming Schemes Implemented 1997 ndash 2002
40
7
Evaluation of Traffic Calming Schemes Implemented 1997 ndash 2002
RECOMMENDATIONS
There are eight main recommendations that emerge from this study
1 The programme of traffic calming of towns and villages on national roads should be continued
2 The programme should be restricted to only towns and village where traffic calming is likely to have an impact
3 An updated priority list should be produced to identify those towns and villages where traffic calming is likely to have an impact
4 Prioritised towns and villages should have a) an injury collision record over the past 5 years that is higher than average b) 85 percentile speeds that are above the posted speed limit c) a physical layout that is possible to treat with traffic calming
5 Where traffic calming is implemented it should include a central island at the gateway and should include physical narrowings throughout the town or village No scheme should consist of just signs and road markings
6 At any location where traffic calming is being considered the existing vehicle speeds through the village must be surveyed
7 After each traffic calming scheme has been implemented the revised vehicle speeds through the village must be surveyed as soon as possible
8 A further study should examine in more detail the single vehicle accidents and pedestrian accidents that been identified in this study in treated villages and towns
41
Evaluation of Traffic Calming Schemes Implemented 1997 ndash 2002
42
Evaluation of Traffic Calming Schemes Implemented 1997 ndash 2002
REFERENCES
RS460 Evaluation of Traffic Calming Schemes Constructed on National Roads 1993-1996 National Roads Authority 2002
The Road to Safety Government Strategy for Road Safety 1998-2002 Department of the Environment and Local Government 1998
Road Safety Strategy Government Strategy for Road Safety 2004-2006 Department of Transport 2004
Road Safety Strategy 2007-2012 Road Safety Authority 2007
2005 Survey of Free Speeds (Urban and Rural) National Roads Authority 2006
Guidelines on Traffic Calming for Towns and Villages on National Routes National Roads Authority 2004
Reducing Traffic Injuries Resulting From Excess and Inappropriate Speed European Transport Safety Council 1995
The importance of confounding in observational before-and-after studies of road safety measures Rune Elvik Accident Analysis and Prevention 34(5) 2002
Parameter Values for Use in Cost-Benefit Analysis of Transport Projects Goodbody Economic Consultants 2004
43
Evaluation of Traffic Calming Schemes Implemented 1997 ndash 2002
44
Evaluation of Traffic Calming Schemes Implemented 1997 ndash 2002
Evaluation of Traffic Calming Schemes Implemented 1997 ndash 2002
APPENDIX A
Ranking of Sites According to Primary Criteria for Selection for Traffic Calming National Primary Routes Only
Route Town Village Population AADT Length Colls
over 5 yrs
Collisions per 10 million vehkm
Collisions per year per 1000
Population
+Combined Collision
Rate
N17 BALLINDINE 232 5058 0587 8 148 690 640
N25 KILRANE 214 5310 2255 10 46 935 559 N08 LITTLETON 566 5598 0591 10 166 353 508
N11 ASHFORD 500 12768 1352 19 60 760 501 N01 JULIANSTOWN 450 14270 1146 16 54 711 463
N05 FRENCHPARK 272 2994 0805 11 250 809 452
N02 COLLON 335 6164 0626 7 99 418 408 N18 KILCOLGAN 500 9565 0483 9 107 360 393
N08 WATERGRASSHILL 250 13706 0985 8 32 640 385 N01 CASTLEBELLINGHAM 762 10983 1891 20 53 525 368
N08 RATHCORMACK 500 11807 1158 11 44 440 308 N09 DUNGARVAN 500 3261 028 4 240 160 280
N04 DROMOD 250 3598 059 3 77 240 275 N20 CHARLEVILLE 3000 9655 1988 12 34 400 269
N25 LEMYBRIEN 222 6471 0918 4 37 360 254 N11 KILMACANOGE 763 26721 0692 13 39 341 247
N25 GLOUNTHAUNE 500 17499 0802 17 66 680 236
N07 MONEYGALL 344 6350 0576 4 60 233 236 N09 MULLINAVAT 283 3858 0925 7 107 495 231
N08 KILBEHENY 500 6897 0863 6 55 240 230 N02 CASTLEBLAYNEY 2938 4154 3525 21 79 143 229
N07 BORRIS IN OSSORY 500 7848 1141 7 43 280 226 N15 BUNDORAN 1463 7275 2371 17 54 232 224
N24 KILSHEELAN 435 4924 1027 5 54 230 223 N02 ARDEE 3604 7019 2394 24 78 133 223
N05 CHARLESTOWN 712 2956 125 5 74 140 219 N11 CAMOLIN 293 5192 1125 4 38 273 212
N06 CRAUGHWELL 232 7669 1558 4 18 345 209
N24 MONARD 500 5735 0392 3 73 120 206 N22 FARRANFORE 500 7614 1093 6 40 240 199
N21 ABBEYFEALE 1501 9982 3287 39 65 520 195 N15 GRANGE 500 6352 1427 6 36 240 193
N24 CARRICK ON SUIR 5143 4924 2903 20 77 078 192 N04 COLLOONEY 612 8617 0864 12 88 392 186
N18 BAREFIELD 500 5852 1087 5 43 200 186 N17 CLAREGALWAY 500 11128 166 7 21 280 182
N20 BALLYHAY 500 7440 0364 3 61 120 181 N14 CASTLEFINN 692 6024 0846 5 54 145 180
N26 FOXFORD 974 1928 1915 9 134 185 180
N18 ARDRAHAN 500 6650 0413 3 60 120 180 N02 ASHBOURNE 4411 10840 2792 30 54 136 177
N08 ABBEYLEIX 1299 8083 1778 11 42 169 169 N02 CARRICKMACROSS 3341 11436 2989 27 43 162 167
N11 OILGATE 262 6332 0393 2 44 153 164 N04 BALLINAFAD 500 3199 0239 2 143 080 163
N02 CASTLESHANE 250 5338 0875 5 59 400 159 N02 SLANE 699 6064 1885 13 62 372 155
N02 ANNAYALLA 500 5338 0655 6 94 240 154
N30 ENNISCORTHY 7655 3972 0565 6 146 016 150 N10 PAULSTOWN 234 4858 0753 2 30 171 145
A1
Evaluation of Traffic Calming Schemes Implemented 1997 ndash 2002
Route Town Village Population AADT Length Colls
over 5 yrs
Collisions per 10 million vehkm
Collisions per year per 1000
Population
+Combined Collision
Rate
N08 JOHNSTOWN 422 6063 1445 4 25 190 145 N07 TOOMYVARA 500 7606 069 7 73 280 143
N16 SLIGO 17302 5680 1796 25 134 029 142 N26 BALLINA 477 5398 1983 9 46 377 140
N16 GLENFARNE 500 1746 1846 5 85 200 135 N06 ROCHFORTBRIDGE 721 6202 1348 5 33 139 135
N24 LIMERICK JCN 250 5735 0698 4 55 320 135 N22 BALLINCOLLIG 12124 15125 6303 68 39 112 134
N24 FIDDOWN 500 4588 0966 6 74 240 134
N01 DROGHEDA 23914 19455 4526 79 49 066 131 N08 NEWINN 500 7163 0648 3 35 120 131
N15 STRANORLAR+BALLYBOFEY 2972 3337 3918 22 92 148 129 N14 LIFFORD 1359 3854 1151 4 49 059 128
N22 LISSARDA 500 7096 0696 6 67 240 127 N22 BALLYVOURNEY 500 3636 2786 8 43 320 123
N06 KILREEKILL 500 9055 059 3 31 120 122 N17 BELLAHY+CHARLESTOWN 712 3834 1103 3 39 084 120
N22 MACROOM 2363 7096 4588 31 52 262 118 N15 KILLYGORDON 500 6024 0493 2 37 080 114
N08 HORSEampJOCKEY 500 7607 026 3 83 120 113
N18 GORT 1093 7709 2855 16 40 293 113 N04 CLONARD 500 10570 0599 3 26 120 112
N02 EMYVALE 479 4073 0813 4 66 167 108 N05 BELLAVARY 500 5138 0633 4 67 160 107
N20 PATRICKSWELL 1019 14486 1742 15 33 294 106 N25 KILMEADAN 500 6177 1817 7 34 280 104
N24 PALLASGREEN 500 4638 0747 4 63 160 103 N15 BALLYSHANNON 2838 8955 2844 13 28 092 102
N21 TRALEE 17225 12840 1934 40 88 046 100 N03 KELLS 3539 8857 1737 10 36 057 099
N25 KILLEAGH 347 7244 1481 5 26 288 098
N24 BANSHA 293 4221 0855 3 46 205 097 N03 CARNAROSS 500 6683 0933 5 44 200 094
N02 MONAGHAN 5946 7630 3588 32 64 108 091 N24 CAHIR 2055 13277 2528 11 18 107 089
N01 DUNDALK 25843 22685 6273 153 59 118 089 N06 MILLTOWNPASS 500 6202 0733 4 48 160 088
N18 NEWMARKET-ON-FERGUS 1583 10584 1461 13 46 164 087 N17 CURRY 250 4585 0548 2 44 160 084
N03 CAVAN 5254 11709 236 28 56 107 082 N22 KILLARNEY 7275 9731 3819 19 28 052 082
N09 MOONE+TIMOLIN 500 6720 2231 6 22 240 082
N11 RATHNEW 1496 12736 1072 11 44 147 081 N15 DONEGAL 2193 6149 2053 12 52 109 079
N25 YOUGHAL 5828 7598 522 34 47 117 076 N03 DUNSHAUGHLIN 1275 15588 1458 6 14 094 076
N04 CARRICK ON SHANNON 2500 4257 2393 10 54 080 074 N06 BALLINASLOE 5812 9582 5241 37 40 127 072
N21 NEWCASTLE WEST 2500 7975 2766 16 40 128 072 N20 BUTTEVANT 1125 7440 1271 7 41 124 072
N15 SLIGO 17302 8932 1274 14 67 016 071 N15 DRUMCLIFF 500 9726 0737 2 15 080 071
N25 NEW ROSS 6079 6846 2424 17 56 056 070
A2
Evaluation of Traffic Calming Schemes Implemented 1997 ndash 2002
Route Town Village Population AADT Length Colls
over 5 yrs
Collisions per 10 million vehkm
Collisions per year per 1000
Population
+Combined Collision
Rate
N25 DUNGARVAN 6920 5688 4649 25 52 072 070
N20 CROOM 1090 5658 1036 5 47 092 070 N24 PILTOWN 717 4588 1166 4 41 112 069
N08 MITCHELSTOWN 3090 13395 2084 19 37 123 068 N07 MONASTEREVIN 2224 11968 1754 7 18 063 068
N15 CLIFFONEY 292 5089 0652 2 33 137 067 N09 GOWRAN 477 2517 0949 2 46 084 067
N08 FERMOY 4462 10622 2955 23 40 103 066 N04 RATHOWEN 500 5465 0439 1 23 040 066
N04 NEWTOWNFORBES 250 3711 1169 2 25 160 065 N30 NEW ROSS 6079 3514 2126 8 59 026 065
N07 NENAGH 5825 8352 2422 18 49 062 064
N07 MOUNTRATH 1375 6980 1827 8 34 116 063 N01 BALBRIGGAN 7724 13451 3226 33 42 085 063
N15 LISCOOLEY 500 6024 0423 2 43 080 063 N17 TOBERCURRY 1069 4585 2168 6 33 112 061
N03 NAVAN 11706 11782 4695 43 43 073 061 N04 ENFIELD 500 10570 1127 2 09 080 058
N30 CLONROCHE 500 2786 1049 2 37 080 057 N09 CARLOW 14027 9020 5154 37 44 053 057
N16 MANORHAMILTON 995 2393 1665 3 41 060 056 N24 MOONCOIN 500 8954 1507 2 08 080 056
N06 LOUGHREA 3271 8389 295 15 33 092 056
N06 MOATE 1529 5973 2482 4 15 052 056 N08 CULLAHILL 500 6063 051 1 18 040 055
N08 URLINGFORD 689 6407 1309 4 26 116 055 N08 CASHEL 2814 7238 2342 11 36 078 055
N11 GOREY 3840 13253 1949 16 34 083 055 N11 FERNS 859 5192 0974 3 33 070 050
N18 ENNIS 16058 13516 7938 59 30 073 049 N23 CASTLEISLAND 2207 3515 0727 2 43 018 047
N05 BELLANAGARE 500 2309 0639 1 37 040 047 N04 KINNEGAD 415 6954 2589 3 09 145 045
N09 CASTLEDERMOT 741 6112 2144 4 17 108 044
N11 ARKLOW 7987 12321 3857 24 28 060 043 N18 CRUSHEEN 500 5852 0853 1 11 040 042
N03 VIRGINIA 720 6683 1261 3 20 083 040 N05 BALLAGHADERREEN 1270 4251 2127 4 24 063 040
N07 BALLYBRITTAS 500 10826 0524 1 10 040 039 N06 TYRRELLSPASS 376 6707 1407 1 06 053 038
N11 ENNISCORTHY 7655 7570 1269 6 34 016 038 N04 SLIGO 17964 15138 3821 31 29 035 038
N24 TIPPERARY 4963 11547 2213 12 26 048 038 N26 SWINFORD 1216 1928 1963 2 29 033 037
N07 BIRDHILL 500 9770 0702 2 16 080 036
N07 KILDARE 4196 14907 2763 14 19 067 035 N20 MALLOW 7521 10164 2681 13 26 035 035
N05 STROKESTOWN 568 2809 2371 2 16 070 034 N10 KNOCKTOPHER 500 2734 0841 1 24 040 034
N17 TUAM 5540 10723 305 13 22 047 034 N04 EDGEWORTHSTOWN 801 5520 2094 3 14 075 033
N04 BALLYSADARE 500 8617 0996 2 13 080 033 N10 STONYFORD 500 3401 0717 1 22 040 032
A3
Evaluation of Traffic Calming Schemes Implemented 1997 ndash 2002
Route Town Village Population AADT Length Colls
over 5 yrs
Collisions per 10 million vehkm
Collisions per year per 1000
Population
+Combined Collision
Rate
N21 CASTLEISLAND 2207 5467 1873 4 21 036 030
N07 PORTLAOISE 8360 12097 501 19 17 045 029 N09 THOMASTOWN 2512 3261 2244 3 22 024 028
N05 TULSK 500 2220 1432 1 17 040 027 N25 SWEEP 500 4274 0755 1 17 040 027
N06 GALWAY 60000 24461 5106 50 22 017 026 N03 DROLCHEAD NUA 11778 5345 04 1 26 002 026
N03 BELTURBET 1223 3316 1868 2 18 033 026 N08 DURROW 721 7244 1338 2 11 055 025
N05 WESTPORT 3688 12879 1194 5 18 027 025 N19 SHANNON 7920 14965 05 3 22 008 024
N21 ADARE 500 3348 1288 1 13 040 023
N07 ROSCREA 4231 7718 3502 7 14 033 022 N17 KNOCK 440 3958 1251 1 11 045 022
N10 KILKENNY 17669 7149 3379 8 18 009 020 N13 STRANORLAR 2972 7141 0925 2 17 013 020
N20 LIMERICK 75000 20672 6595 42 17 011 020 N24 CLONMEL 15562 7270 5907 12 15 015 019
N13 BRIDGE END 500 8153 075 1 09 040 019 N05 CASTLEBAR 7648 7442 3988 7 13 018 018
N17 CLAREMORRIS 1907 5058 1868 2 12 021 017 N24 OOLA 474 4864 1937 1 06 042 016
N07 LIMERICK 75000 15709 10841 41 13 011 016
N21 TEMPLEGLANTINE 819 6759 0828 1 10 024 016 N17 GALWAY 60000 27843 3176 20 12 007 014
N05 LONGFORD 6824 6874 4021 5 10 015 014 N07 DUBLIN 500000 47272 2387 22 11 001 011
N04 BOYLE 2197 3199 2036 1 08 009 011 N11 DUBLIN 500000 40055 13999 95 09 004 010
N04 DUBLIN 500000 29736 9209 42 08 002 009 N18 LIMERICK 75000 27171 5095 17 07 005 008
N09 WATERFORD 75000 14883 1693 3 07 001 007 N50 DUBLIN 600000 18676 124 10 02 000 002
N24 LIMERICK 75436 10740 3098 1 02 000 002
N08 CORK 136000 32213 414 2 01 000 001 N22 CORK 136000 25429 3556 1 01 000 001
N09 BALLYHALE 500 3858 0867 0 00 000 000 N17 BALLYNACARROW 500 3807 0798 0 00 000 000
N04 BALLYNALACK 500 5465 0748 0 00 000 000 N03 BALLYSHANNON 2838 3088 0899 0 00 000 000
N05 CARRACASTLE 500 2956 1215 0 00 000 000 N04 CASTLEBALDWIN 500 3199 0252 0 00 000 000
N18 CLARINBRIDGE 500 9565 1417 0 00 000 000 N20 CORK 136000 15947 4267 0 00 000 000
N27 CORK 136000 13277 3778 0 00 000 000
N01 DUBLIN 500000 28975 4298 0 00 000 000 N02 DUBLIN 500000 11524 6397 0 00 000 000
N03 DUBLIN 500000 21436 4357 0 00 000 000 N06 HORSELEAP 500 6769 0735 0 00 000 000
N06 KILBEGGAN 617 6707 1286 0 00 000 000 N14 LETTERKENNY 10726 15411 093 0 00 000 000
N17 MILLTOWN 500 5467 0869 0 00 000 000 N21 PATRICKSWELL 1019 3348 0274 0 00 000 000
A4
Evaluation of Traffic Calming Schemes Implemented 1997 ndash 2002
Route Town Village Population AADT Length Colls
over 5 yrs
Collisions per 10 million vehkm
Collisions per year per 1000
Population
+Combined Collision
Rate
N09 PAULSTOWN 234 6653 0721 0 00 000 000
N04 ROOSKY 249 3827 0696 0 00 000 000 N28 SHANBALLY 500 5098 0506 0 00 000 000
N05 TERMONBARRY 500 3366 098 0 00 000 000 N25 WATERFORD 41853 10668 8427 0 00 000 000
N25 BALLINABOOLA N25 BARNTOWN
N07 DALYS CROSS N18 GORT RD ENNIS
N20 NEWTWOPOTHOUSE N08 RINGASKIDDY
+ Combined Collision Rate [Coll Rate 10mvehkmyr5 + Coll Rate 1000popyr2]2 These towns and villages were not assessed as funding was already committed
A5
Evaluation of Traffic Calming Schemes Implemented 1997 ndash 2002Evaluation of Traffic Calming Schemes Implemented 1997 ndash 2002
Evaluation of Traffic Calming Schemes Implemented 1997 ndash 2002
51
Appendix B Evaluation of Traffic Calming Schemes Implemented 1997 ndash 2002
APPENDIX B Scheme Details for All Sites
Scheme Local Authority Rte Both or Half Spd Lim Type Colls 4 yrs before raw
Colls 4 yrs after raw
Drop in Ann Colls Adj for
All Nats Area Evaluated Year
Finished Year
Started Year
Bypassed Year
Changed Total Cost in 2002 Prices
Carrickarnon Louth 1 both 60 F 15 10 079 Gate - Gate 2001 2007 109400
Greengates Louth 1 both 40 B 8 2 130 Gate - Gate 1997 2002 489900 KilsaranCastlebellingham Louth 1 both 30 A 23 10 260 Gate - Gate 1997 1997 2002 255600
Julianstown Meath 1 both 30 C 13 10 024 Gate - Gate 1999 1999 2003 767700 Emyvale Monaghan 2 both 30 F 5 7 -065 Gate - Gate 2001 46500
Castleblaney (N) Monaghan 2 2nd half 40 A 3 5 -073 Gate - Bend 2000 2000 2007 132300
Carrickmacross (N) Monaghan 2 half 40 A 7 4 008 Gate - Bend 1998 1998 2005 92500 Ardee (S) Louth 2 half 30 A 4 9 -152 Gate - R170 Jcn 1997 1997 238300
Collon Louth 2 both 30 E 6 7 -038 Gate - Gate 1997 1996 251600 Slane Meath 2 both 30 A 8 5 048 Gate - Gate 2002 2001 534500
Kells Meath 3 both 30 A 8 8 -024 Gate - Gate 2001 730900 Castlebaldwin Sligo 4 both 30 A 5 2 062 Gate - Gate 1999 1998 547500
Dromod Leitrim 4 both 30 B 1 3 -052 Gate - Gate 2000 1999 2008 418300 Roosky (E) Leitrim 4 half 30 B 1 -025 Gate - Centre 1998 1997 2008 123300
Newtownforbes (E) Longford 4 1st half 30 F 1 2 -028 Gate - Bend 2001 2003 73800 Rathowen Westmeath 4 both 30 A 1 1 -002 Gate - Gate 1999 1999 369400
Clonard (E) Meath 4 half 40 B 1 1 -000 Gate - Centre 1997 2006 53200
Enfield Meath 4 both 30 C 8 2 114 Gate - Gate 1999 1998 2002 73900 CharlestownBellahy (WN) Mayo 5 half 30 A 7 132 Gates - Centre 1999 1998 2008 523400
Frenchpark Roscommon 5 both 30 F 5 3 032 Gate - Gate 2001 133600 Craughwell Galway 6 both 40 F 6 6 -015 Gate - Gate 2000 1999 30600
Rochfordbridge Westmeath 6 both 30 A 7 5 037 Gate - Gate 1998 1998 2006 199600 Miltownpass Westmeath 6 both 40 F 1 1 -002 Gate - Gate 2000 2000 2006 2005 248000
B1
Appendix B Evaluation of Traffic Calming Schemes Implemented 1997 ndash 2002
Scheme Local Authority Rte Both or Half Spd Lim Type Colls 4 yrs before raw
Colls 4 yrs after raw
Drop in Ann Colls Adj for
All Nats Area Evaluated Year
Finished Year
Started Year
Bypassed Year
Changed Total Cost in 2002 Prices
Moneygall Offaly 7 both 30 C 2 4 -056 Gate - Gate 2001 1997 2002 410900 Ballybrittas Laois 7 both 40 A 5 3 025 Gate - Gate 2002 2005 197900
Monasterevin (W) Kildare 7 half 30 G 4 1 064 Gate - Bridge 1998 1998 2005 29900
Cullahill Laois 8 both 40 A 1 2 -027 Gate - Gate 2000 1999 134200 Abbeyleix (S) Laois 8 half 30 A 1 4 -077 Gate - Centre 2000 2000 330700
Mullinavat (N) Kilkenny 9 half 30 G 6 3 057 Gate - Centre 2001 96600 Dungarvan Kilkenny 9 both 40 G 1 2 -028 Gate - Gate 2001 212700
Paulstown Kilkenny 9 both 30 A 2 046 Gate - Gate 1999 1998 184700 Kilkenny (E) Kilkenny 10 single entry 30 B 10 3 133 Gate - Centre 2001 195200
Claragh Kilkenny 10 both 60 F 2 2 -016 Gate - Gate 1999 206500 Camolin Wexford 11 both 30 A 5 1 073 Gate - Gate 2002 581000
Ashford Wicklow 11 both 30 E 16 7 160 Gate - Gate 1999 1998 2004 92300 Lifford (N amp W) Donegal 14 both 30 A 10 5 095 Gate - Gate 2001 70400
Castlefinn Donegal 15 both 30 A 4 1 063 Gate - Gate 2001 127500
Killygordon Donegal 15 both 30 H 2 2 -004 Gate - Gate 2002 113300 Ballybofey (S) Donegal 15 half 40 A 9 6 029 Gate - Centre 2002 246400
Ballyshannon (S) Donegal 15 2nd half 40 G 7 6 -006 Gate - Bridge 1997 1996 2006 159700 Bundoran Donegal 15 both 40 H 9 15 -163 Gate - Gate 1997 2006 41900
Cliffony Sligo 15 both 30 A 2 1 019 Gate - Gate 2001 143800 Grange Sligo 15 both 30 A 9 2 149 Gate - Gate 2000 1999 172500
Drumcliffe Sligo 15 both 30 F 7 5 033 Gate - Gate 2000 1999 259100 Ballindine Mayo 17 both 30 E 3 6 -091 Gate - Gate 1997 1997 106500
Claregalway Galway 17 both 30 A 3 7 -116 Gate - Gate 1998 1997 328300 Kilcolgan Galway 18 both 40 E 8 8 -042 Gate - Gate 1999 1999 2003 46200
Ardrahan Galway 18 both 30 J 6 1 096 Gate - Gate 1999 1999 46200
Crusheen (N) Clare 18 half 30 E 1 -025 Gate - Bend 1998 1997 2003 251400 Barefield (N) Clare 18 half 40 G 2 1 021 Gate - Centre 1998 1997 2007 251400
B2
Appendix B Evaluation of Traffic Calming Schemes Implemented 1997 ndash 2002
Scheme Local Authority Rte Both or Half Spd Lim Type Colls 4 yrs before raw
Colls 4 yrs after raw
Drop in Ann Colls Adj for
All Nats Area Evaluated Year
Finished Year
Started Year
Bypassed Year
Changed Total Cost in 2002 Prices
Charleville (S) Cork 20 1st half 30 A 2 2 -006 Gate - Ped X 2001 2004 165400
Ballyhea Cork 20 both 40 A 1 -025 Gate - Gate 1999 1999 784900
Newtwopothouse Cork 20 both 40 A 4 084 Gate - Gate 2001 165400
Cork (N) Cork 20 single entry 40 I 1 2 -030 Gate - Ped X 2002 239700
Farranfore Kerry 22 both 30 F 4 5 -032 Gate - Gate 1998 1998 2003 20000
Killarney (E) Kerry 22 single entry 40 D 8 3 085 Gate - Rbt 1998 1998 59900
Ballyvourney Cork 22 both 30 E 3 6 -090 Gate - Gate 2002 2001 570300
Lissarda Cork 22 both 40 A 4 4 -022 Gate - Gate 2002 333900
Ballincollig (W) Cork 22 half 30 B 10 8 041 Gate - Rbt 1997 1997 2004 496300
Cork (W) Cork 22 single entry 30 A 000 Gate - Vic X 1999 2004 193900
Monard South Tipperary 24 both 30 I 1 -025 Gate - Gate 1998 1998 39300
Bansha South Tipperary 24 both 30 I 2 2 -004 Gate - Gate 2001 138400
Kilsheelan South Tipperary 24 both 30 A 2 043 Gate - Gate 1999 1997 2007 194500
Carrick-on-Suir (W) South Tipperary 24 2nd half 30 A 3 066 Gate - Mini Rbt 2001 211900
Mooncoin Kilkenny 24 both 30 F 5 8 -088 Gate - Gate 1998 1998 140000
Lemybrien Waterford 25 both 40 A 1 1 -002 Gate - Gate 1998 1997 165700
Waterford (E) Kilkenny 25 single entry 30 A 5 1 084 Gate - Rbt 1997 1997 63900
Ballinaboola Wexford 25 both 30 A 3 3 -024 Gate - Gate 1999 1999 554100
Barntown Wexford 25 both 40 A 1 2 -037 Gate - Gate 1997 1997 639000
Kilrane (W) Wexford 25 half 30 A 4 4 -025 Gate - Speed Lim 1999 1998 2004 300400
Rosslare Harbour (W) Wexford 25 single entry 15 E 000 Gate - Harbour 2001 2004 16000
Foxford Mayo 26 both 30 I 6 1 083 Gate - Gate 2001 33300
B3
Appendix B Evaluation of Traffic Calming Schemes Implemented 1997 ndash 2002
Scheme Local Authority Rte Both or Half Spd Lim Type Colls 4 yrs before raw
Colls 4 yrs after raw
Drop in Ann Colls Adj for
All Nats Area Evaluated Year
Finished Year
Started Year
Bypassed Year
Changed Total Cost in 2002 Prices
Clonroche Wexford 30 both 30 F 4 2 035 Gate - Gate 2001 20400
New Ross (N) Wexford 30 both 30 A 2 4 -060 Gate - Gate 2002 47500
Smithborough (W) Monaghan 54 half 30 A 2 1 019 Gate - Centre 2001 56900
Carrickboy Longford 55 both 40 H 2 3 -037 Gate - Gate 2002 57100
Gortahork Donegal 56 both 30 I 1 5 -105 Gate - Gate 2002 45500
Dromore West Sligo 59 both 30 A 4 084 Gate - Gate 2000 156200
Ballisodare Sligo 59 both 30 A 000 Gate - Speed Lim 2002 1997 142700
Hodson Bay Roscommon 61 both 40 A 5 112 Gate - Gate 2001 432500
Birr Offaly 62 both 30 C 15 9 087 Gate - Gate 2001 94700
Loughrea (W) Galway 66 single entry 30 I 1 3 -052 Gate - N6 Jcn 1999 1999 55400
Ballylickey Cork 71 both 40 I 1 2 -037 Gate - Gate 1997 228500
Bantry (N) Cork 71 half 30 E 5 5 -027 Gate - Centre 2002 115600
Clonakilty Cork 71 both 30 C 4 1 059 Gate - Gate 1999 331600
Grangemockler South Tipperary 76 both 30 I 2 042 Gate - Gate 1998 1998 2003 51900
Kilkenny (N) Kilkenny 77 single entry 30 E 6 8 -068 Gate - Centre 2001 195200
Newtown Laois 78 both 40 A 5 1 073 Gate - Gate 2002 181400
Killeigh Offaly 80 both 30 B 000 Gate - Gate 1999 1999 97400
Kilmaine (N) Mayo 84 half 30 B 1 019 Gate - R332 Jcn 1998 99800
Swanlinbar (S) Cavan 87 half 30 E 1 1 -005 Gate - Centre 2002 39900
B4
Appendix C
Evaluation of Traffic Calming Schemes Implemented 1997 ndash 2002 APPENDIX C Collision Data Cost Data and First Year Rate of Return for All Sites
Location Rte Yr Construction Cost
4 Years Before 4 Years After Drop in Annual Collisions adjusted Cost Saving from Drop in Collision
Yearly Rate of Return
F S M Tot F S M Tot F S M Tot F S M Tot
Carrickarnon 1 01 109400 3 1 11 15 1 1 8 10 046 -009 042 079 1047600 -27300 12600 1032900 944
Greengates 1 97 489900 2 1 5 8 0 0 2 2 043 013 074 130 969700 40900 22200 1032800 211
KilsaranCastlebellingham 1 97 255600 1 5 17 23 1 0 9 10 -004 067 197 260 -85200 204700 59000 178500 70
Julianstown 1 99 767700 0 3 10 13 1 1 8 10 -025 017 032 024 -570000 53300 9500 -507200 -66
Emyvale 2 01 46500 0 0 5 5 0 2 5 7 000 -050 -015 -065 0 -152300 -4500 -156800 -337
Castleblaney (N) 2 00 132300 0 2 1 3 0 2 3 5 000 -021 -052 -073 0 -62800 -15600 -78400 -59
Carrickmacross (N) 2 98 92500 0 5 2 7 0 0 4 4 000 062 -054 008 0 188700 -16100 172600 187
Ardee (S) 2 97 238300 1 2 1 4 1 4 4 9 -004 -073 -075 -152 -85200 -222700 -22600 -330500 -139
Collon 2 97 251600 0 1 5 6 0 3 4 7 000 -062 024 -038 0 -187500 7200 -180300 -72
Slane 2 02 534500 3 2 3 8 0 0 5 5 077 036 -065 048 1761000 109400 -19400 1851000 346
Kells 3 01 730900 0 0 8 8 1 1 6 8 -025 -025 026 -024 -570000 -76200 7800 -638400 -87
Castlebaldwin 4 99 547500 1 0 4 5 0 0 2 2 020 000 043 062 451800 0 12800 464600 85
Dromod 4 00 418300 0 0 1 1 0 2 1 3 000 -050 -002 -052 0 -152300 -600 -152900 -37
Roosky (E) 4 98 123300 0 0 0 0 0 0 1 1 000 000 -025 -025 0 0 -7500 -7500 -6
Newtownforbes (E) 4 01 73800 0 0 1 1 0 0 2 2 000 000 -028 -028 0 0 -8400 -8400 -11
Rathowen 4 99 369400 0 0 1 1 0 1 0 1 000 -025 023 -002 0 -76200 6900 -69300 -19
Clonard (E) 4 97 53200 0 0 1 1 0 0 1 1 000 000 -000 -000 0 0 -100 -100 -0
Enfield 4 99 73900 1 2 5 8 0 0 2 2 020 028 066 114 451800 86300 19700 557800 755
CharlestownBellahy (WN) 5 99 523400 1 3 3 7 0 0 0 0 020 042 069 132 451800 129400 20800 602000 115
Frenchpark 5 01 133600 2 1 2 5 0 1 2 3 047 -009 -006 032 1078400 -27300 -1800 1049300 785
Craughwell 6 00 30600 1 0 5 6 0 0 6 6 020 000 -035 -015 454600 0 -10400 444200 1452
Rochfordbridge 6 98 199600 0 0 7 7 0 0 5 5 000 000 037 037 0 0 11200 11200 6
Miltownpass 6 00 248000 0 0 1 1 0 0 1 1 000 000 -002 -002 0 0 -600 -600 -0
Moneygall 7 01 410900 0 0 2 2 0 2 2 4 000 -050 -006 -056 0 -152300 -1800 -154100 -38
C1
Appendix C Evaluation of Traffic Calming Schemes Implemented 1997 ndash 2002
Location Rte Yr Construction Cost
4 Years Before 4 Years After Drop in Annual Collisions adjusted Cost Saving from Drop in Collision
Yearly Rate of Return
F S M Tot F S M Tot F S M Tot F S M Tot
Ballybrittas 7 02 197900 0 0 5 5 0 0 3 3 000 000 025 025 0 0 7600 7600 4
Monasterevin (W) 7 98 29900 1 0 3 4 0 0 1 1 019 000 045 064 434000 0 13400 447400 1496
Cullahill 8 00 134200 0 0 1 1 1 0 1 2 -025 000 -002 -027 -570000 0 -600 -570600 -425
Abbeyleix (S) 8 00 330700 0 0 1 1 0 1 3 4 000 -025 -052 -077 0 -76200 -15600 -91800 -28
Mullinavat (N) 9 01 96600 0 0 6 6 0 0 3 3 000 000 057 057 0 0 17100 17100 18
Dungarvan 9 01 212700 0 0 1 1 0 0 2 2 000 000 -028 -028 0 0 -8400 -8400 -4
Paulstown 9 99 184700 0 0 2 2 0 0 0 0 000 000 046 046 0 0 13900 13900 8
Kilkenny (E) 10 01 195200 0 2 8 10 0 1 2 3 000 007 126 133 0 21600 37800 59400 30
Claragh 10 99 206500 1 1 0 2 0 0 2 2 020 014 -050 -016 451800 43100 -15000 479900 232
Camolin 11 02 581000 0 1 4 5 0 0 1 1 000 018 055 073 0 54700 16600 71300 12
Ashford 11 99 92300 0 4 12 16 0 1 6 7 000 032 128 160 0 96400 38400 134800 146
Lifford (N amp W) 14 01 70400 0 0 10 10 0 0 5 5 000 000 095 095 0 0 28500 28500 40
Castlefinn 15 01 127500 0 0 4 4 0 0 1 1 000 000 063 063 0 0 18900 18900 15
Killygordon 15 02 113300 1 0 1 2 0 0 2 2 026 000 -030 -004 587000 0 -9000 578000 510
Ballybofey (S) 15 02 246400 0 1 8 9 0 1 5 6 000 -007 036 029 0 -21500 10700 -10800 -4
Ballyshannon (S) 15 97 159700 2 2 3 7 0 1 5 6 043 002 -051 -006 969700 5700 -15200 960200 601
Bundoran 15 97 41900 0 1 8 9 0 4 11 15 000 -087 -077 -163 0 -263700 -23000 -286700 -684
Cliffony 15 01 143800 0 0 2 2 0 1 0 1 000 -025 044 019 0 -76200 13200 -63000 -44
Grange 15 00 172500 0 1 8 9 1 0 1 2 -025 015 159 149 -570000 44800 47800 -477400 -277
Drumcliffe 15 00 259100 1 0 6 7 1 1 3 5 -005 -025 063 033 -115400 -76200 19000 -172600 -67
Ballindine 17 97 106500 1 1 1 3 0 2 4 6 021 -037 -075 -091 484800 -111400 -22600 350800 329
Claregalway 17 98 328300 0 1 2 3 0 2 5 7 000 -038 -079 -116 0 -114600 -23600 -138200 -42
Kilcolgan 18 99 46200 0 3 5 8 0 1 7 8 000 017 -059 -042 0 53300 -17800 35500 77
Ardrahan 18 99 46200 0 2 4 6 0 0 1 1 000 028 068 096 0 86300 20300 106600 231
Crusheen (N) 18 98 251400 0 0 0 0 0 1 0 1 000 -025 000 -025 0 -76200 0 -76200 -30
Barefield (N) 18 98 251400 0 0 2 2 0 1 0 1 000 -025 046 021 0 -76200 13900 -62300 -25
Charleville (S) 20 01 165400 0 0 2 2 0 1 1 2 000 -025 019 -006 0 -76200 5700 -70500 -43
C2
Appendix C Evaluation of Traffic Calming Schemes Implemented 1997 ndash 2002
Location Rte Yr Construction Cost
4 Years Before 4 Years After Drop in Annual Collisions adjusted Cost Saving from Drop in Collision
Yearly Rate of Return
F S M Tot F S M Tot F S M Tot F S M Tot
Ballyhea 20 99 784900 0 0 0 0 0 0 1 1 000 000 -025 -025 0 0 -7500 -7500 -1
Newtwopothouse 20 01 165400 1 1 2 4 0 0 0 0 024 016 044 084 539200 48900 13200 601300 364
Cork (N) 20 02 239700 0 0 1 1 0 0 2 2 000 000 -030 -030 0 0 -9000 -9000 -4
Farranfore 22 98 20000 0 0 4 4 0 0 5 5 000 000 -032 -032 0 0 -9700 -9700 -49
Killarney (E) 22 98 59900 1 2 5 8 1 0 2 3 -006 025 066 085 -136000 75500 19800 -40700 -68
Ballyvourney 22 02 570300 0 0 3 3 2 0 4 6 -050 000 -040 -090 -1140000 0 -11900 -1151900 -202
Lissarda 22 02 333900 0 1 3 4 0 1 3 4 000 -007 -015 -022 0 -21500 -4400 -25900 -8
Ballincollig (W) 22 97 496300 2 0 8 10 1 0 7 8 018 000 023 041 399700 0 7000 406700 82
Cork (W) 22 99 193900 0 0 0 0 0 0 0 0 000 000 000 000 0 0 0 0 0
Monard 24 98 39300 0 0 0 0 0 0 1 1 000 000 -025 -025 0 0 -7500 -7500 -19
Bansha 24 01 138400 1 0 1 2 0 1 1 2 024 -025 -003 -004 539200 -76200 -900 462100 334
Kilsheelan 24 99 194500 1 0 1 2 0 0 0 0 020 000 023 043 451800 0 6900 458700 236
Carrick-on-Suir (W) 24 01 211900 0 0 3 3 0 0 0 0 000 000 066 066 0 0 19800 19800 9
Mooncoin 24 98 140000 1 0 4 5 1 1 6 8 -006 -025 -057 -088 -136000 -76200 -17200 -229400 -164
Lemybrien 25 98 165700 0 0 1 1 0 1 0 1 000 -025 023 -002 0 -76200 7000 -69200 -42
Waterford (E) 25 97 63900 1 1 3 5 0 0 1 1 021 013 049 084 484800 40900 14800 540500 846
Ballinaboola 25 99 554100 0 2 1 3 0 1 2 3 000 003 -027 -024 0 10100 -8100 2000 0
Barntown 25 97 639000 0 1 0 1 0 0 2 2 000 013 -050 -037 0 40900 -15000 25900 4
Kilrane (W) 25 99 300400 0 2 2 4 0 2 2 4 000 -022 -004 -025 0 -66000 -1100 -67100 -22
Rosslare Harbour (W) 25 01 16000 0 0 0 0 0 0 0 0 000 000 000 000 0 0 0 0 0
Foxford 26 01 33300 0 4 2 6 0 0 1 1 000 064 019 083 0 195400 5700 201100 604
Clonroche 30 01 20400 2 1 1 4 1 0 1 2 022 016 -003 035 508400 48900 -900 556400 2727
New Ross (N) 30 02 47500 0 0 2 2 0 1 3 4 000 -025 -035 -060 0 -76200 -10500 -86700 -183
Smithborough (W) 54 01 56900 0 0 2 2 0 0 1 1 000 000 019 019 0 0 5700 5700 10
Carrickboy 55 02 57100 0 1 1 2 0 1 2 3 000 -007 -030 -037 0 -21500 -9000 -30500 -53
Gortahork 56 02 45500 0 0 1 1 1 0 4 5 -025 000 -080 -105 -570000 0 -24000 -594000 -1305
Dromore West 59 00 156200 0 1 3 4 0 0 0 0 000 015 069 084 0 44800 20700 65500 42
C3
Appendix C Evaluation of Traffic Calming Schemes Implemented 1997 ndash 2002
Location Rte Yr Construction Cost
4 Years Before 4 Years After Drop in Annual Collisions adjusted Cost Saving from Drop in Collision
Yearly Rate of Return
F S M Tot F S M Tot F S M Tot F S M Tot
Ballisodare 59 02 142700 0 0 0 0 0 0 0 0 000 000 000 000 0 0 0 0 0
Hodson Bay 61 01 432500 1 0 4 5 0 0 0 0 024 000 088 112 539200 0 26400 565600 131
Birr 62 01 94700 0 3 12 15 0 1 8 9 000 023 064 087 0 70400 19200 89600 95
Loughrea (W) 66 99 55400 0 0 1 1 0 1 2 3 000 -025 -027 -052 0 -76200 -8100 -84300 -152
Ballylickey 71 97 228500 0 1 0 1 0 1 1 2 000 -012 -025 -037 0 -35200 -7500 -42700 -19
Bantry (N) 71 02 115600 0 1 4 5 0 0 5 5 000 018 -045 -027 0 54700 -13400 41300 36
Clonakilty 71 99 331600 0 1 3 4 0 0 1 1 000 014 044 059 0 43100 13300 56400 17
Grangemockler 76 98 51900 1 0 1 2 0 0 0 0 019 000 023 042 434000 0 7000 441000 850
Kilkenny (N) 77 01 195200 0 0 6 6 0 0 8 8 000 000 -068 -068 0 0 -20400 -20400 -10
Newtown 78 02 181400 0 1 4 5 0 1 0 1 000 -007 080 073 0 -21500 24100 2600 1
Killeigh 80 99 97400 0 0 0 0 0 0 0 0 000 000 000 000 0 0 0 0 0
Kilmaine (N) 84 98 99800 1 0 0 1 0 0 0 0 019 000 000 019 434000 0 0 434000 435
Swanlinbar (S) 87 02 39900 0 0 1 1 0 0 1 1 000 000 -005 -005 0 0 -1500 -1500 -4
19457200 36 72 300 408 15 52 235 302 411 -249 920 1082 9376400 -759100 276100 8892000 46
C4
9
Evaluation of Traffic Calming Schemes Implemented 1997 ndash 2002Appendix B

Evaluation of Traffic Calming Schemes Implemented 1997 ndash 2002
FOREWORD
This report is the second in a series and examines the effectiveness of all traffic calming schemes that were completed between 1997 and 2002
It evaluates effectiveness by comparing collisions over four year periods both before and after construction of each scheme
A previous report ldquoEvaluation of Traffic Calming Schemes Constructed on National Roads 1993-1996rdquo covers schemes implemented before the period examined in this report
v
vi
Evaluation of Traffic Calming Schemes Implemented 1997 ndash 2002
Evaluation of Traffic Calming Schemes Implemented 1997 ndash 2002
EXECUTIVE SUMMARY In July 1998 the Government published ldquoThe Road to Safetyrdquo its strategy for road safety over the period 1998 ndash 2002 followed by a further strategy in 2004 for 2004 - 2006 A third Road to Safety document has recently been published setting out the governmentrsquos strategy for road safety over the period 2007 ndash 2012 with a target to reduce fatalities by 20 to 250 per year and to reduce injuries by 25 Under the terms of all strategies the National Roads Authority has been charged with undertaking a number of specific tasks In each of the strategies one of the tasks for NRA has been the implementation of traffic calming at towns and villages on the network of national roads and the evaluation of the effectiveness of these schemes This evaluation will enable NRA to prioritise the future programme of traffic calming by assessing the effectiveness of implemented schemes and identifying the successes of previous programmes
This report examines traffic calming schemes constructed between 1997 and 2002 It describes the principle behind traffic calming in reducing speed by altering the appearance of the road on the approach to the townvillage through the use of ldquogatewaysrdquo and by further traffic management measures within the town itself It lists the schemes undertaken in each of the six years from 1997 to 2002 and summarises the pershyformance of these schemes The report measures the effectiveness of the programmes based on collision data for a 4 year before period and a 4 year after period for each scheme
The objective of the traffic calming programme is to reduce the number and severity of collisions occurring in the treated towns and villages by reducing speed at these locations It has achieved that objective reducing the overall number of collisions by 13 Moreover the number of fatal collisions was reduced by 52 thus lowering the overall severity of crashes at traffic calming locations The number of serious and minor injury collisions decreased by 9
Between 1997 and 2002 there were 94 traffic calming schemes completed at towns and villages on the national roads 91 of these were evaluated and a summary of the results is shown below
Summary Table
Year of Completion
No of Schemes
Cost of Construction
euro
Reduction in Collisions (4 years adjusted)
Cost saving in Collisions per
year euro
Yearly Rate of Return
Fatal Serious Minor 1997 12 euro3024600 6 -6 1 euro2655300 88 1998 14 euro1852900 2 -2 -1 euro865600 47 1999 18 euro5369900 3 5 14 euro2177500 41 2000 9 euro1882000 -1 -4 6 -euro1034500 -55 2001 23 euro3881400 6 -4 25 euro3587700 92 2002 15 euro3446600 1 1 -7 euro641800 19
All Years 91 euro19457200 16 -10 37 euro8893400 46
The above table shows that comparing the four year period before with the four year period after each scheme and allowing for the overall decrease in collisions over the same period nationwide at similar sites there was an overall reduction of 43 collisions Fatal collisions reduced by 16 and minor injury collisions by 37 while serious injury collisions increased by 10 The cost (in 2002 market prices) of all the schemes constructed between 1997 and 2002 was just under euro195 million and the overall annual cost saving in collisions nearly euro89 million The Yearly Rate of Return of each yearrsquos programme varied quite considerably but averaged at 46 In cost benefit terms the schemes effectively paid for themselves within 2 years and are still creating annual savings of euro9m every year into the future
vii
viii
Evaluation of Traffic Calming Schemes Implemented 1997 ndash 2002
Evaluation of Traffic Calming Schemes Implemented 1997 ndash 2002
1 INTRODUCTION
11 Scope of Report In July 1998 the Government published ldquoThe Road to Safetyrdquo its strategy for road safety over the period 1998 ndash 2002 followed by a further strategy in 2004 for 2004 - 2006 The primary target of each of these was to reduce fatalities from road crashes by 20 from 1997 levels by 2002 and by 25 from average 1998 - 2003 levels by 2006 A third Road to Safety document has recently been published setting out the governmentrsquos strategy for road safety over the period 2007 ndash 2012 with a target to reduce fatalities by 20 to 250 per year and to reduce injuries by 25
Under the terms of all strategies the National Roads Authority has been charged with undertaking a number of specific tasks In each of the strategies one of the tasks for NRA has been the implementation of traffic calming at towns and villages on the network of national roads and the evaluation of the effectiveness of these schemes This evaluation will enable NRA to prioritise the future programme of traffic calming by assessing the effectiveness of implemented schemes and identifying the successes of previous programmes
This report examines traffic calming schemes constructed between 1997 and 2002 under the NRA programme of traffic calming for towns and villages located on national routes
12 Background to Traffic Calming Traffic calming is a way of reducing vehicle speeds by self-enforcing traffic engineering methods In Ireland two main types of traffic calming are used-
a) Traffic calming applied on national roads and other busy inter-urban roads to manage the speed of traffic passing through towns and villages located on these routes
b) Traffic calming on local urban and residential streets to manage both speed and volume of traffic on a number of streets within an area
Type a) is the form of traffic calming examined in this report
13 Traffic Calming on National Routes In towns and villages on the national road network reducing speed is the primary goal of traffic calming Posting of speed limits alone does not result in a significant reduction in speed (2005 Survey of Free Speeds NRA) since drivers typically drive at the speed they perceive as being safe A driverrsquos perception of what is safe is related to the design of the road which includes lane width curvature corner radii and available stopping-sight distance Traffic calming essentially reduces vehicle speeds by changing these elements of the roadrsquos design and thus driversrsquo perceptions of the road ahead
The transition zone between the high speed road approaching the village and the low speed street inside the village represents a difficult safety management problem In Ireland the problem first became apparent over twenty-five years ago with the proliferation of improved road sections with hard shoulders on the national roads Where these improved sections adjoined towns and villages approach speeds increased and the sections showed higher collision rates than rural sections
Many towns and villages are positioned on national roads Drivers travelling the national routes at speeds appropriate to through routes are often still travelling at those high speeds when entering towns and villages and maintain those speeds as they travel through the urban area Inside towns and villages the
1
Evaluation of Traffic Calming Schemes Implemented 1997 ndash 2002
national road usually functions as a typical main street with shops pubs housing school and church and their accompanying pedestrian and parking activity These types of activities would be more safely carried out in an environment where low speed prevails At higher speeds drivers have less time to react and are able to process less information in their field of view and the severity of injury is higher when a collision does occur For a pedestrian struck by a vehicle travelling at 64kmh the likelihood of them being killed is 85 at 48kmh the likelihood is 45 and at 32kmh it is 5 (ETSC Reducing Traffic Injuries Resulting From Excess and Inappropriate Speed 1995)
Figure 11 Approach to a typical village on national primary route
Figure 12 Typical wide entry into a town on national route
2
Evaluation of Traffic Calming Schemes Implemented 1997 ndash 2002
Figure 13 Typical wide open town centre with undefined road edge
14 Collisions The objective of the traffic calming programme is to reduce the number of collisions occurring in the treated towns and villages by reducing the speed of vehicles travelling through these locations In the four years before this programme of traffic calming started between 1994 and 1997 nearly half of the 9956 injury collisions on national roads occurred in urban areas Table 11 shows the breakdown of collision severity between rural and urban areas All areas where the speed limit at the time was 40mph or below were taken as ldquourbanrdquo
Table 11 Collisions between 1994 and 1997 inside and outside urban areas
Severity Urban National Roads Rural National Roads All National Roads
Fatal 161 531 692
Serious Injury 851 1573 2424
Minor Injury 3475 3365 6840
Total 4487 5469 9956
3
4
Evaluation of Traffic Calming Schemes Implemented 1997 ndash 2002
Evaluation of Traffic Calming Schemes Implemented 1997 ndash 2002
2 TRAFFIC CALMING SCHEMES
21 Criteria for Selection The criteria used for selection of towns and villages for traffic calming are set out in detail in the NRA document ldquoGuidelines On Traffic Calming For Towns And Villages On National Routesrdquo This was first published in 1999 and was updated in 2004
For the traffic calming programme over the years studied in this report (1997 ndash 2002) the criteria used to select sites for inclusion in the programme were those laid down in the Guidelines The period of implementation covered in this report starts in 1997 which was before the publication of the Guidelines However the principles were already in operation within the NRA Road Safety Group and the selection of sites in the early part of this period followed more or less the same process as the later ones
The main criterion was the collision history in and on approach to the village but data on all the following were collected when considering a location
Collisions Traffic flow Speed Geometry Future infrastructural developments
Collisions
The Guidelines states that selection based on collisions should take account of not just the simple collision numbers but should assess both risk per unit of travel and risk per head of population in the town or village In order to do this assessment a table was drawn up in 1999 listing these two risk categories for all towns and villages on national roads and ranking them according to a combination of the two categories The resulting table for national primary roads is reproduced in Appendix A but for illustration the 15 top ranking towns and villages on national primary roads are shown in Table 21 These 15 sites were all treated in the early years of the traffic calming programme 12 of them are among those examined in this report 3 were implemented before 1997 and were assessed in the preceding report to this
Table 21 Ranking of towns amp villages on national primary routes
Route Town Village Population AADT Length Colls over 5 yrs
Collisions per 10 Million VehKm
Collisions per year per
1000 Population
Combined Collision
Rate
N17 BALLINDINE 232 5058 0587 8 148 690 640
N25 KILRANE 214 5310 2255 10 46 935 559
N08 LITTLETON 566 5598 0591 10 166 353 508
N11 ASHFORD 500 12768 1352 19 60 760 501
N01 JULIANSTOWN 450 14270 1146 16 54 711 463
N05 FRENCHPARK 272 2994 0805 11 250 809 452
N02 COLLON 335 6164 0626 7 99 418 408
N18 KILCOLGAN 500 9565 0483 9 107 360 393
N08 WATERGRASSHILL 250 13706 0985 8 32 640 385
N01 CASTLEBELLINGHAM 762 10983 1891 20 53 525 368
N08 RATHCORMACK 500 11807 1158 11 44 440 308
N09 DUNGARVAN 500 3261 028 4 240 160 280
N04 DROMOD 250 3598 059 3 77 240 275
N20 CHARLEVILLE 3000 9655 1988 12 34 400 269
N25 LEMYBRIEN 222 6471 0918 4 37 360 254
5
Evaluation of Traffic Calming Schemes Implemented 1997 ndash 2002
Using the method of combining the two collision risk categories meant that small villages where there had been only a few collisions such as Dungarvan on N9 or Dromod on N4 ranked as highly as large towns with long lengths of national road and a higher number of collisions such as Charleville on N20 Thus several small villages where the actual collision numbers were low were given high priority in the traffic calming programme because the risk to road users from high speed traffic was comparatively high whereas many large towns with very much bigger numbers of actual collisions did not get priority
Speed
Selection is also based on the speed of vehicles in the towns and villages considered If speeds through a certain location were already low then that town or village was not given priority in the traffic calming programme Often this assessment would result in only one approach to a town or village being treated as described in section 32
Geometry
The other major criterion was the geometry of the road within the town or village considered If the separate physical elements that make up a traffic calming scheme especially that of narrowing the carriageway could not be applied to a certain location then a traffic calming scheme could not be fully implemented However several schemes were indeed implemented in towns and villages where the road width was already narrow prior to construction of the scheme These schemes often consisted of only signs and road markings this is discussed further in section 33
Other Factors
It must be acknowledged that several of the towns and villages assessed within this report did not have a collision history and did not have any record of high speeds before implementation of the traffic calming These sites were often selected for traffic calming because general road improvement work was scheduled at this location and traffic calming elements were incorporated into the work In some cases sites were selected solely on the basis of the perception of risk by residents and their representatives
22 Traffic Calming Measures The measures used as part of traffic calming break down into the four separate zones travelled through on approach to a town or village
bull the transition zone bull the gateway at the speed limit signs bull the zone inside the gateway bull the village centre
In small villages with a short length of national road there is usually no distinction between the last two zones but in the larger villages and towns there is often a zone which is inside the speed limited area yet cannot be described as a town centre These zones typically have either low density housing with off-street parking or warehouse-type commercial premises with sparsely spaced accesses
6
Evaluation of Traffic Calming Schemes Implemented 1997 ndash 2002
Transition Zone The principle behind traffic calming design is to change the driverrsquos perception of the surrounding environshyment
Figure 21 Transition zone approaching village
The ldquooptical widthrdquo perceived by the driver is dependent on the width between the boundaries of the road relative to the height of the adjoining vertical elements Generally in rural sections the width between fences is many times greater than the height of the hedges walls or fences which form the boundaries In urban streets the height of the buildings is generally greater than the width A driverrsquos perception of the appropriate driving speed is influenced by this relationship Speeds are lower where the height of the vertical elements is greater than the width of the road
Traffic calming aims to create a narrow optical width on the approach into towns and villages by using a combination of carriageway narrowing landscape treatment and the introduction of vertical elements such as signs lighting columns and trees Typically transition zone signs consist of a pair of ldquoTraffic Calming Aheadrdquo signs 400m from gateway and a pair of ldquoDo Not Passrdquo signs at 200m from the gateway
Gateway
The Gateway is placed at the start of the speed limited zone It should mark a definite change in the character of the surrounding area from rural to urban Therefore it needs to be conspicuous and the most prominent element in the transition zone The tall signs positioned close to the driving lane narrow the optical width
The guidelines recommend that where a town or village has two zones of speed limits first a 60kmh on the outskirts and then a 50kmh limit for the main body of the town the gateway should be placed at the change from 60kmh to 50kmh This is because usually the 50kmh limit has been placed at the edge of the properly built up area and the 60kmh zone covers the approach into the town where development is much less dense The design engineer can however choose to place the gateway at the 60kmh if surrounding development and environment are appropriate for this This has been done in a few of the cases examined
7
Evaluation of Traffic Calming Schemes Implemented 1997 ndash 2002
Figure 22 A gateway
Gateways fall into two distinct groups those with a solid kerbed central island and those with no island Early results from the first batch of traffic calming schemes constructed indicated that the presence of a central island at the gateway was a determining factor in the success of the scheme and the evaluation in this document confirms this The central island greatly increases the visual narrowing effect and the central lighting column signs and bollards are directly in the centre of the driverrsquos field of view
The gateway is always lit to a high standard with special gateway lanterns that shine directly onto the gateway signs This is not only effective in the dark during daylight hours the presence of lighting columns enhances the narrow optical width and is often noted subconsciously by the driver as an indication of an urban area
Inside Gateway
Treatment of the stretch of road between the gateway and the village centre is an important aspect of traffic calming The narrowing introduced at the gateway is continued so that the speed reduction occurring at the gateway is maintained on the driverrsquos journey through the town
This narrowing can be done by introducing any or all of the following central islands footpaths side kerb buildouts lining hatched markings and defined parking bays A shallow chicane can also sometimes be introduced by alternating side buildouts and parking between the two sides of the road The objectives are both to keep the driving lanes at no greater than 35m width and to give a visual impression to the driver of an urban area
Only narrowing and horizontal deflections are used as measures in traffic calming installations on national routes Vertical deflections such as humps or cushions are not appropriate because of the roadsrsquo function as main distributors between the major urban areas of the country Emergency vehicles and buses cannot easily negotiate routes where vertical deflection has been installed
As every gateway must be provided with lighting to illuminate the signs the infrastructure to supply street lighting needs to be provided at each end of the town or village It therefore follows that the supply for lightshying is usually available over the whole length of the village and lighting is provided over the full length of the scheme from gateway to gateway In the cases examined there are a few exceptions to this but even these few villages have street lighting for almost all of their length with only a few short gaps where no lamps are provided
8
Evaluation of Traffic Calming Schemes Implemented 1997 ndash 2002
Figure 23 Inside gateway
Town or Village Centre
In the town centre there is often not a need for narrowing works as part of the traffic calming as parking bays and footpaths may already exist However in locations where there is a wide road passing through the village centre it is necessary to narrow and define the through route with kerbing Even in locations where the through route is already well defined with kerbing and parking bays extra measures are usually required at junctions and where pedestrians wish to cross the national road or to cross side roads while walking along the main street
Typical works in the town centre are
bull definition of the limits of existing parking using kerb buildouts bull definition of junctions by the use of kerb buildouts bull provision of either pedestrian crossings or central islands to aid pedestrians in crossing
The main objective in the centre of the town or village is to provide a safe and pleasant environment that can easily be negotiated by vulnerable road users Thus it is important to provide safe places to cross where pedestrians are clearly visible to passing traffic and wide footpaths so that pedestrians are not forced to step into the road when passing others This often necessitates a reduction in the number of on street parking spaces and it can be difficult to persuade the local residents to accept this Extra off-street parking may have to be provided as part of the traffic calming scheme However there is a clear road safety advantage in both providing better facilities for pedestrians and in moving parking to off-street facilities Quite apart from the pedestrian collisions that result from vehicles reversing in and out of parking spaces and from parked vehicles masking crossing pedestrians as they step out onto the road many minor material damage collisions occur as vehicles pull in and out of parking spaces on busy through routes
9
Evaluation of Traffic Calming Schemes Implemented 1997 ndash 2002
Figure 24 Centre of village
23 Amendments to Design in 2004 The Guidelines on Traffic Calming were revised in 2004 Some of the changes made in this revision arose directly from problems encountered during construction and consequent operation of the schemes evaluated here There were numerous minor amendments but two of the main changes to design are worth notingshy
a) Increase of setback of signs The setback distance of the edge of the gateway signs from the kerb was originally specified as 600mm This width of setback was thought to provide enough clearance for overhanging loads on large vehicles while still giving the visual narrowing effect that was needed for the traffic calming gateway to be effective However in practice many gateway signs installed to this specification were hit glancing blows by passing large vehicles especially in areas where there was a significant proportion of agricultural vehicles in the mix of traffic
Consequently the specification was changed to a setback of 1m from the kerb So far this increased width appears to have succeeded in reducing the number of signs damaged by overhanging loads
b) Increase of ldquoexitrdquo width Where a central island is provided at a gateway the island and its signs and lighting column all form an obstruction for any abnormally wide load wishing to pass Whenever a wide load wishes to use the route through a village with this design of traffic calming the central lighting columns at each gateway must be temporarily disconnected and removed resulting in much inconvenience and an extra workload for the local authority and electricity supply engineers
To try to avoid this lengthy process of disconnection and removal an alternative design for gateways was put forward with extra width on the ldquoexitrdquo half of the gateway such that the width between edge kerb and central island on the lane for traffic approaching the village remains at the original 35m specified but the corresponding width on the lane for traffic leaving the village could be increased to anything up to 6m This design manages to keep the narrow optical effect for drivers approaching the village but provides an alternative route for wide loads which are guided through the approach to the village on the exit side of the central island
10
Evaluation of Traffic Calming Schemes Implemented 1997 ndash 2002
3 TRAFFIC CALMING SCHEMES 1997 - 2002
31 Schemes Implemented over Period 1997 - 2002 Between 1997 and 2002 there were 94 traffic calming schemes completed at towns and villages on the national roads Three of these schemes could not be evaluated because the collision data in the before period was considered to be unduly influenced by traffic calming on the other approach to the same village that had been implemented before 1997
The remaining 91 towns and villages have been assessed in this study
Table 31 below gives the number of schemes constructed per year and their costs Table 32 shows the spread across the different counties and Table 33 shows the spread across the national routes Figure 31 shows the locations of all the 94 schemes implemented in the period examined A detailed list of the 91 locations assessed and the measures implemented is given in Appendix B
Table 31 Schemes implemented per year
Year No of Schemes
Cost euro (market prices at
time of construction)
Cost euro (2002 prices)
Average Cost per Scheme euro
(2002 prices)
1997 12 1803000 3024500 252000
1998 14 1178800 1852900 132300
1999 18 3691800 5369900 298300
2000 9 1445200 1882000 209100
2001 23 3496400 3881300 168800
2002 15 3446600 3446600 229800
TOTALS 91 15061800 19457200 213800
The number of schemes constructed each year stayed roughly constant the average being about 15 or 16 per year There was a slight dip in the number finished in 2000 but there was a corresponding rise the next year The bulk of construction for most schemes took place within one year but where schemes carried on into following years it is the final year that is taken as the year of construction
The average cost per scheme was euro214000 over the six years All costs in this report are market prices given in 2002 prices The cost of an individual scheme varies immensely from euro16000 to euro785000 (See Appendix B) but the measures implemented in each scheme also varied greatly Some schemes were simply the installation of just 12 signs on approach to a village others included extensive urban renewal works including the complete restructuring of drainage and electricity supply for the village
Table 32 and Figure 31 show a fairly even spread of traffic calming implementation geographically across the country but it can be clearly seen in Table 33 that the majority of schemes implemented were on national primary roads Of all the schemes examined 81 are on primary routes and in the early years this division is even more marked with 88 of schemes implemented in 1997 and 1998 being on primary routes The fact that mainly primary routes were treated in the early years of the traffic calming programme can be directly attributed to the geometry of the national routes through these towns and villages Approaches to many urban areas on the primary routes had been realigned and widened during the twenty to thirty years preceding the traffic calming programme allowing traffic to approach the town or village at increased speed This increased speed and the consequent increase in collisions then identified these towns and villages as priority sites for traffic calming treatment On national secondary routes there had not
11
Evaluation of Traffic Calming Schemes Implemented 1997 ndash 2002
been such a widespread programme of realignment and widening and approaches to urban areas have mostly remained narrow Consequently on national secondary roads speeds are not so high on the approaches to urban areas collision rates also are not high and few towns and villages on secondary roads have met the criteria for the traffic calming programme
Table 32 Schemes implemented per year by county
Local Authority 1997 1998 1999 2000 2001 2002 Total
Cavan 1 1
Clare 2 2
Cork 2 3 2 4 11
Donegal 2 2 3 7
Galway 1 3 1 5
Kerry 2 2
Kildare 1 1
Kilkenny 1 1 2 4 8
Laois 2 2 4
Leitrim 1 1 2
Longford 1 1 2
Louth 4 1 5
Mayo 1 1 1 1 4
Meath 1 2 1 1 5
Monaghan 1 1 2 4
Offaly 1 2 3
Roscommon 2 2
Sligo 1 3 1 1 6
South Tipperary 2 1 2 5
Waterford 1 1
Westmeath 1 1 1 3
Wexford 1 2 2 2 7
Wicklow 1 1
Total 12 14 18 9 23 15 91
12
Evaluation of Traffic Calming Schemes Implemented 1997 ndash 2002
Figure 31 Locations of traffic calming schemes 1997 to 2002
13
Evaluation of Traffic Calming Schemes Implemented 1997 ndash 2002
Table 33 Schemes implemented per year by route
Route 1997 1998 1999 2000 2001 2002 Total
1 2 1 1 4
2 2 1 1 1 1 6
3 1 1
4 1 1 3 1 1 7
5 1 1 2
6 1 2 3
7 1 1 1 3
8 2 2
9 1 2 3
10 1 1 2
11 1 1 2
14 1 1
15 2 2 2 2 8
17 1 1 2
18 2 2 4
20 1 2 1 4
22 1 2 1 2 6
24 2 1 2 5
25 2 1 2 1 6
26 1 1
30 1 1 2
54 1 1
55 1 1
56 1 1
59 1 1 2
61 1 1
62 1 1
66 1 1
71 1 1 1 3
76 1 1
77 1 1
78 1 1
80 1 1
84 1 1
87 1 1
National Primary 11 12 15 8 19 9 74
National Secondary 1 2 3 1 4 6 17
Total 12 14 18 9 23 15 91
14
Evaluation of Traffic Calming Schemes Implemented 1997 ndash 2002
32 Towns and Villages With Only One End Treated
At 33 of the 94 locations implemented between 1997 and 2002 only one approach to the town or village was treated with traffic calming within this period
In 8 of these cases the one approach treated was the only entry of that route into a large town or city or into a coastal town where the route ended
In 6 of these towns and villages the other approach had already been treated in previous years before 1997 and the second treatment completed the traffic calming for the location In 3 of these villages it was considered that the first phase of traffic calming would have had an effect on collisions in the very same area that was influenced by the second phase Thus the ldquobeforerdquo data for the second phase of work would not have been usable and it was not possible to evaluate changes in collision data These are the three locations that have been removed from the evaluation The other three towns were large enough for the areas of influence from each phase of traffic calming not to overlap and consequently the collision data was not influenced by the first phase
In 2 towns the traffic calming within the study period 1997 - 2002 was the first phase in a two phase implementation and the second approach has since been treated in subsequent years In each of these towns the two areas of influence from the separate phases of work are considered not to overlap and so these two have been included in the study
For each scheme the ldquoevaluated areardquo over which the traffic calming is considered to have had an effect on collisions is described in the scheme details in Appendix B
In the other 17 cases the decision to treat only one approach was generally taken because the other end of town was not considered a suitable case for traffic calming The reasons for this were varied but broadly fell into two different categories
a) An existing feature in the road such as a right angled bend narrow bridge or a roundabout already acted as a measure to slow approaching traffic such as the northern approach to Ardee on N2 or the southern approach to Crusheen on N18
b) Traffic approaching the town or village from this particular direction was observed to be travelling slowly in general and did not need to be slowed further Usually this was because another nearby town or village had effectively slowed the traffic down and drivers had not yet regained the feel of an open road and speeded up The western approach from Dromod to Roosky on N4 and the southern approach from Ennis to Barefield on N18 are examples of this
15
Evaluation of Traffic Calming Schemes Implemented 1997 ndash 2002
33 Different Designs of Scheme
As traffic calming schemes are made up of all the different elements described in section 22 there is a very large number of variations possible but the 91 schemes examined can be broadly divided into 10 different types as follows-
A Gateway with side buildouts and central island Definition inside village using central islands and narrowing with kerbs
B Gateway with side buildouts and central island Definition inside village using narrowing with kerbs but no islands
C Gateway with side buildouts and central island Definition inside village using line marking only
D Gateway with side buildouts and central island No definition inside village
E Gateway with side buildouts only Definition inside village using central islands and narrowing with kerbs
F Gateway with side buildouts only Definition inside village using narrowing with kerbs but no islands
G Gateway with side buildouts only Definition inside village using line marking only
H Gateway signs only Definition inside village using line marking only
I Gateway signs only No definition inside village
J No gateway Definition inside village using narrowing with kerbs but no islands
Table 34 shows the number of schemes in each category and whether the traffic calming was done at both ends of the town or village or whether it was installed only at one end Towns and villages where traffic calming was constructed at only one end are indicated in Figure 31 and in the appendices lists by (W) (N) (E) or (S) following the town name
Table 34 Types of traffic calming schemes
Type Treatment no of villages
both ends
one end
A Central island gateway central islands amp narrowing with kerbs inside 39 29 10
B Central island gateway narrowing with kerbs amp no islands inside 8 3 5
C Central island gateway and lining 5 5
D Central island gateway and nothing else 1 1
E Simple gateway central islands amp narrowing with kerbs insides 10 5 5
F Simple gateway narrowing with kerbs amp no islands inside 11 10 1
G Simple gateway and lining 5 2 3
H Gateway signs and lining 3 3
I Gateway signs and nothing else 8 6 2
J No gateway narrowing with kerbs amp no islands inside 1 1
Total 91 64 27
16
Evaluation of Traffic Calming Schemes Implemented 1997 ndash 2002
The largest single category is type A with a gateway with side buildouts and central island with a string of central islands through the village approach and in the centre and also narrowing from the side with kerb buildouts through the approach and centre Most of the 39 schemes in this category give the full impression of a village at the point of passing the gateway and most have footpaths throughout the scheme from gateway to gateway They all have street lighting through the entire scheme
Another 14 sites have the full gateway with a central island and side buildouts but do not have such extensive works inside the village These fall into categories B C and D Types A B C and D are generally on national primary routes very few are on secondary routes Figure 32 illustrates a typical gateway into such a village where the wide carriageway is narrowed by kerbing the hard shoulder and inserting a central island
Figure 32 Typical gateway for types A B C and D
The next two biggest single categories are type E with 10 schemes and type F with 11 schemes These types along with type G have a gateway that has no central island but which does narrow the road using kerbed buildouts at the side of the road usually in the hard shoulder Types E F and G were installed at towns where the width of the approach into town was wide enough to warrant traffic calming but was less than the 157m minimum needed to accommodate central island signs and cycle bypass Types E F and G have varying degrees of definition work inside the village similar to types A B and C Figure 33 illustrates a typical gateway into such a village where the wide carriageway is narrowed by kerbing the hard shoulder but there is no central island
Types H and I do not have physical works at the gateway at all Typically there is no hard shoulder at these sites and the gateway signs and transition zone signs are simply installed on the verge In type H schemes some visual narrowing has been implemented inside the village using line markings and hatching but in type I there is nothing done other than installation of the gateway and transition zone signs The one scheme that was installed on a dual carriageway approach to a city falls into the category of type H Figure 34 illustrates a typical gateway into such a village where there is no narrowing or kerbs installed just signs placed in the verge
17
Evaluation of Traffic Calming Schemes Implemented 1997 ndash 2002
Figure 33 Typical gateway for types E F and G
Figure 34 Typical gateway for types H and I
One scheme examined in this report had neither gateway signs nor transition zone installed However extensive works were done in the centre of the small village to narrow the carriageway and define the parking areas behind kerbs This village does not fall into any the other categories and is the only type J in the study
For the purposes of examining results types A B C and D can be grouped together as a ldquoCentral Island Gatewayrdquo category types E F and G can be grouped together as a ldquoSimple Gatewayrdquo category and types H and I can be grouped together as a ldquoSigns Onlyrdquo category
Table 35 shows the incidence of each type of traffic calming scheme on each national routes Although there is a wide spread of types across all roads it can be seen that types A B C and D are mostly on the national primary roads while types H and I are largely on the national secondary routes and those sections of national primaries where widening has not taken place
18
Evaluation of Traffic Calming Schemes Implemented 1997 ndash 2002
Table 35 Types of traffic calming schemes by route
Route Type of Scheme
A B C D E F G H I J No in Study
1 1 1 1 1 4
2 4 1 1 6
3 1 1
4 2 3 1 1 7
5 1 1 2
6 1 2 3
7 1 1 1 3
8 2 2
9 1 2 3
10 1 1 2
11 1 1 2
14 1 1
15 4 1 1 2 8
17 1 1 2
18 2 1 1 4
20 3 1 4
22 2 1 1 1 1 6
24 2 1 2 5
25 5 1 6
26 1 1
30 1 1 2
54 1 1
55 1 1
56 1 1
59 2 2
61 1 1
62 1 1
66 1 1
71 1 1 1 3
76 1 1
77 1 1
78 1 1
80 1 1
84 1 1
87 1 1
National Primary 34 6 3 1 7 11 5 2 4 1 74
National Secondary 5 2 2 3 1 4 17
Total 39 8 5 1 10 11 5 3 8 1 91
19
20
Evaluation of Traffic Calming Schemes Implemented 1997 ndash 2002
Evaluation of Traffic Calming Schemes Implemented 1997 ndash 2002
4 EFFECTIVENESS IN REDUCING COLLISIONS
41 Collisions Before and After Scheme Implementation Collision numbers were measured at each of the 91 locations for the 4 years before and 4 years after implementation of each individual scheme The ldquoafterrdquo period was taken as beginning in the year after the final year of construction as the full effect of the scheme would not be noticeable during construction works Details of the collision data for each site are given in Appendix C but summary tables are given in this chapter
42 Area of Influence of Traffic Calming Works Collision numbers for both before and after data were taken from the map-based NRA Collision Database Only collisions taking place on the national routes were considered and any collision that was located within the length of road influenced by the traffic calming was included in the data This area of influence extended to 200m outside each gateway in order to take account of the effect of the transition zone Where only one side of a village was treated the area taken was from the gateway to the centre of the town Where an existing traffic calming feature existed within the speed limited zone on the entry into a town such as a sharp bend or a narrow bridge the area of influence was assumed to extend only as far as that feature Descriptions of the area of influence for each location are given in the detailed list of locations in Appendix B
43 Control Data This report takes account of the main confounding factors affecting these statistics Collision numbers in general on Irelandrsquos national roads have decreased throughout the before and after periods for these schemes and the assessment makes allowances for this trend Changes in traffic volume in patterns of traffic flow in population distribution in Garda enforcement and in attitude to road safety have all had an effect on collision rates on national roads in towns and villages whether or not traffic calming has been installed This effect is accommodated by adjusting the before and after data in line with a comparison group the collisions in each 4 year before and after period within all similar sized towns and villages on all national roads
The general trend nationwide within all towns and villages in the control group has been a drop in collisions of roughly 15 between before and after periods However the reduction varies markedly between the different collision rates fatal collisions have reduced by a similar percentage to the general trend but serious injury accidents have reduced by over 40 and minor injuries have reduced by only about 10 All reductions in collisions at the sites assessed in this study have to be compared against this general nationwide trend of a shift from serious injury to minor injury
The effect of ldquoregression to meanrdquo is more difficult to make allowances for in this study The random nature of road crashes tends to cause collision frequencies at specific locations to fluctuate The selection of towns and villages for treatment on the basis of their past collision record can introduce a source of potential bias in measuring the effectiveness of the scheme This arises because the selection process tends to pick sites at the peak of their fluctuations in collision frequencies and such sites might well have experienced reductions in collision rate in following years even if no treatment had been applied (Rune Elvik 2002)
To allow for the effect of regression to mean the change in collision rates at treated sites would need to be compared with a number of similar untreated control sites This could not have been done in the case of the traffic calming programme as no such control sites exist Whenever a town or village with a collision history was identified it was put on the programme for treatment with traffic calming it would have been considered unacceptable to leave the location untreated simply for the purposes of research
21
Evaluation of Traffic Calming Schemes Implemented 1997 ndash 2002
44 Effect on Collision Occurrence
Table 41 shows for each yearrsquos programme of traffic calming schemes the collisions over the 4 years before and after each scheme
Table 41 Collisions before and after scheme implementation for each yearrsquos programme
Year No of
Schemes
4 Years Before 4 Years After
Fatal Serious Minor Total Fatal Serious Minor Total
1997 12 10 16 52 78 3 15 51 69
1998 14 5 8 31 44 2 6 30 38
1999 18 5 23 54 82 1 8 36 45
2000 9 2 4 27 33 3 6 19 28
2001 23 10 13 95 118 3 12 59 74
2002 15 4 8 41 53 3 5 40 48
Total 91 36 72 300 408 15 52 235 302
The reduction in collisions for each yearrsquos programme is shown in Table 42 as is the adjusted reduction allowing for the general drop in collisions over the study years in the control group of other similar sites Table 43 shows these adjusted drops in annual terms and in percentages
All this data for each individual scheme can be seen in Appendix C
There is considerable fluctuation in results between each yearrsquos programme of traffic calming so it is best to concentrate on the overall figures for the entire six years
Over all 91 sites there was a drop of 106 collisions from 408 to 302
When adjusted for the general nationwide fall in collisions on similar sites this gives a total drop of 433 colshylisions or 108 per year
This is a 13 reduction on the collision numbers before implementation of the schemes
Table 42 Collision reductions for each yearrsquos programme
Year No of
Schemes
4 Year Reduction 4 Year Reduction Adjusted
Fatal Serious Minor Total Fatal Serious Minor Total
1997 12 7 1 1 9 55 -64 06 -03
1998 14 3 2 1 6 18 -20 -12 -15
1999 18 4 15 18 37 30 50 140 220
2000 9 -1 -2 8 5 -14 -36 59 08
2001 23 7 1 36 44 65 -37 246 274
2002 15 1 3 1 5 11 07 -71 -52
Total 91 21 20 65 106 164 -100 368 433
22
Evaluation of Traffic Calming Schemes Implemented 1997 ndash 2002
Table 43 Annual collision reductions for each yearrsquos programme
Year No of
Schemes
Annual Drop in Collisions Adjusted Percentage Drop in Collisions
Fatal Serious Minor Total Fatal Serious Minor Total
1997 12 14 -16 01 -01 65 -74 1 -0
1998 14 05 -05 -03 -04 47 -51 -4 -4
1999 18 07 13 35 55 75 39 28 33
2000 9 -04 -09 15 02 -88 -55 24 3
2001 23 16 -09 62 69 68 -44 29 27
2002 15 03 02 -18 -13 27 13 -21 -12
Total 91 41 -25 92 108 52 -24 14 13
While collisions of all severity types at the examined locations have reduced in actual numbers the decrease in serious injury collisions at these sites has not followed the general trend nationwide over this period on national roads which have experienced a particularly large decrease in serious injury collisions When allowing for the trend in the control data the actual reduction of 20 serious injury collisions in a 4 year period translates to a relative increase of 10 collisions
Looking at each individual severity type the adjusted reduction in fatal collisions is 164 or 41 per year and that in minor injury collisions is 368 or 92 per year The adjusted change in serious injury collisions is an increase of 25 per year These numbers represent a 52 drop in fatal collisions a 14 drop in minor injury collisions and a 24 rise in serious injury collisions
The implementation of traffic calming has clearly had a much more marked effect on fatal collisions than on other injury collisions resulting in a lowering of the severity of collisions overall Table 44 below shows for each year each severity category as a percentage of overall collisions in the 4 years before implementation and the 4 years after implementation It can be seen that in general for each yearrsquos programme except for year 2000 the proportion of fatal collisions has roughly halved the proportion of serious collisions has stayed much the same while that of minor collisions has slightly increased Looking at the entire six yearsrsquo programme in the four years before implementation of each traffic calming scheme fatal collisions constituted 9 of all collisions in these towns and villages while serious and minor injury collisions were 18 and 73 of the total respectively In the four years after implementation fatal collisions decreased to 5 of all collisions serious reduced very slightly to 17 and minor rose to 78
Table 44 Severities as a percentage of all collisions for each yearrsquos programme
Year No of
Schemes
Percentage of all Collisions 4 years before
Percentage of all Collisions 4 years after
Fatal Serious Minor Fatal Serious Minor
1997 12 13 20 67 4 22 74
1998 14 11 18 71 5 16 79
1999 18 6 28 66 2 18 80
2000 9 6 12 82 11 21 68
2001 23 8 11 81 4 16 80
2002 15 8 15 77 6 11 83
Total 91 9 18 73 5 17 78
It can therefore be concluded that implementation of these traffic calming schemes has not only reduced the number of collisions overall but has also reduced the average severity of those collisions that did occur
23
Evaluation of Traffic Calming Schemes Implemented 1997 ndash 2002
45 Statistical Significance Statistical significance is difficult to achieve with locations that have such small numbers of individual collisions However the chi squared test was used to compare the results with the control data and the overall result for all sites indicates an 80 confidence level meaning that there is a 20 chance that the observed reduction in collisions is due to mere random fluctuation
46 Collision Costs and Economic Evaluation Collision costs are calculated using figures from the Goodbody report on Cost-Benefit Analysis of Transport Projects 2004 The ldquoWillingness To Payrdquo method of economic assessment has been used dividing the collisions into the separate categories of fatal serious injury and minor injury Table 45 lists the cost savings per year and Table 46 compares these with construction costs to give an average yearly rate of return for each yearrsquos programme of traffic calming
Table 45 Collision and cost saving for each yearrsquos programme
Year No of
Schemes
Drop in Annual Collisions adjusted
Annual Cost Saving from Drop in Collisions euro 2002 prices
Fatal Serious Minor Fatal Serious Minor Total
1997 12 14 -16 01 3138300 -487300 4300 2655300
1998 14 05 -05 -03 1029900 -155000 -9200 865600
1999 18 07 13 35 1689100 383100 105200 2177500
2000 9 -04 -09 15 -800900 -277800 44200 -1034500
2001 23 16 -09 62 3681900 -278700 184600 3587700
2002 15 03 02 -18 638100 56800 -53100 641800
Total 91 41 -25 92 9376400 -759100 276100 8893400
The annual cost saving from the drop in collisions over all 91 schemes is calculated to be approximately euro89 million Most of this saving comes from the drop in fatal collisions which is the group with the most significant fall proportionately a drop of 41 per year from 79 per year (both figures adjusted for the control data)
Table 46 Yearly rate of return
Year No of
Schemes
Annual Collision Cost Saving euro
2002 prices
Cost of Constr euro 2002 prices
Yearly Rate of Return
1997 12 2655300 3024600 88
1998 14 865600 1852900 47
1999 18 2177500 5369900 41
2000 9 -1034500 1882000 -55
2001 23 3587700 3881400 92
2002 15 641800 3446600 19
Total 91 8893400 19457200 46
The average yearly rate of return for each yearrsquos programme varies between 92 and a negative return of 55 but the average rate of return over all six years is 46
24
Evaluation of Traffic Calming Schemes Implemented 1997 ndash 2002
47 Results by Type of Scheme Tables 47 and 48 show the collision savings organised into the 10 different types of scheme and their groupings As guidance a description of the different types and groupings is repeated in Table 49
Once the 91 schemes are divided up into types the individual numbers of collisions and schemes become too small to give a reliable statistical result but a few facts are worth noting-
a) Types A B C and D are all having a positive effect on the number of collisions These all have a gateway with a central island and varying degrees of physical works inside the speed limited zone
Taken together as a group types A to D have a clearly positive result with on average 11 collisions per town or village saved over a 4 year period
b) Types E F and G taken together do not have such a clear result The 10 locations in category E experienced an average increase of nearly 1 collision over a 4 year period with collisions in all severity categories increasing while type G has a better result and appears to be performing nearly as well as types A to D Taken together as a group these schemes that have physical narrowing but no central island at the gateway seem to have had little effect on collision occurrence
c) Types H and I stand out as both having had no success at all with on average an increase of 12 collisions at each town or village over a four year period
Type H and type I are the very simplest types of scheme with no physical works done either at the gateway or throughout the village Gateway signs and transition zone signs were installed and in type H some lining was done through the village to define a narrow carriageway
Type I has usually been installed at villages where the road width was already narrow before implementation and neither further narrowing nor physical works could be done at these locations This is reflected in the low number of collisions at these sites before
implementation 14 over 8 sites which comes to roughly 2 collisions per site At other sites the average number of collisions per site before implementation was generally much higher than this The overall average across all 91 sites was approximately 5 collisions per site
d) Interestingly the one scheme alone in Type J appears to have worked This scheme had extensive kerbing and footpath works done at the centre of the small village to define the road edge and the central junction Footpaths and lighting were installed throughout the village from one speed limit to the other and there is a clear physical narrowing at the speed limit signs but no gateway signs or transition zone signs were installed so there is no narrowing in optical width on approach However as there is only one scheme in this category no real conclusions can be drawn about this design
25
Evaluation of Traffic Calming Schemes Implemented 1997 ndash 2002
Table 47 Drop in collisions by type of scheme
Type No in Study
All colls 4 years before
Drop in collisions (4 years adjusted) Annual cost saving euro
Fatal Serious Minor Total Tot per
site Total Per site
A 39 171 49 -19 347 377 10 2913300 74700
B 8 31 32 -12 78 98 12 1772300 221500
C 5 42 -02 13 80 91 18 42600 8500
D 1 8 -02 10 26 34 34 -40800 -40800
E 10 48 -11 -22 -56 -90 -09 -867800 -86800
F 11 55 58 -35 -49 -26 -02 2985200 271400
G 5 20 25 -09 28 43 09 1354000 270800
H 3 13 10 -37 -55 -82 -27 260900 87000
I 8 14 07 01 -59 -51 -06 366800 45900
J 1 6 00 11 27 38 38 106600 106600
Total 91 408 164 -100 368 433 05 8893400 Avge 97700
Table 48 Grouping type of scheme by type of gateway
Type No in Study
All colls 4 years before
Drop in collisions (4 years adjusted) Annual cost saving euro
Fatal Serious Minor Total Tot per
site Total Per site
Central Island
Gateway 53 252 76 -08 532 600 11 4687600 88400
Simple Gateway
26 123 71 -67 -77 -73 -03 3471500 133500
Signs Only
11 27 17 -36 -114 -133 -12 627800 57100
Type J 1 6 00 11 27 38 38 106600 106600
Total 91 408 164 -100 368 433 05 8893400 Avge 97700
Table 49 Types of scheme and their groupings
Type Treatment Group
A Central island gateway central islands amp narrowing with kerbs inside
Central Island Gateway
B Central island gateway narrowing with kerbs amp no islands inside
C Central island gateway and lining
D Central island gateway and nothing else
E Simple gateway central islands amp narrowing with kerbs insides Simple
GatewayF Simple gateway narrowing with kerbs amp no islands inside
G Simple gateway and lining
H Gateway signs and lining Signs Only
I Gateway signs and nothing else
J No gateway narrowing with kerbs amp no islands inside No Gateway
26
Evaluation of Traffic Calming Schemes Implemented 1997 ndash 2002
48 Results By Type of Collision Table 410 shows the before and after collisions each year for the three main types of collision pedestrian single vehicle and head on The drop shown in the table is an adjusted figure and is relative to the decrease in each of these types of collision in the control data throughout all similar towns and villages on national roads over the period examined
The results show that pedestrian collisions decreased overall by about 8 from a figure of 69 and head-on type collisions have decreased by about 14 from 45 These are quite significant decreases of about 13 and 29 respectively However there has been effectively no change in single vehicle collisions only a very small increase of negligible percentage change
Table 410 Type of collision
Year No of
Schemes
All collisions 4 years before Drop in collisions (4 years adjusted)
ped single veh head on ped single veh head on
1997 12 7 15 8 -70 -03 09
1998 14 3 3 7 -19 -34 -01
1999 18 18 13 7 93 59 13
2000 9 5 6 4 01 -20 12
2001 23 24 14 16 49 -10 132
2002 15 12 12 3 20 06 -30
Total 91 69 63 45 75 -02 135
Total Percentage Drop 13 -0 29
The greatest decrease is in head-on type collisions Head-on collisions are not a particularly significant proportion of all collisions within these towns and villages and before implementation of the traffic calming they constituted only about 11 of all of collisions However the reduction of 135 collisions over four years represents a 29 drop in this type of collision compared with figures before implementation which is a significant result This decrease can be directly attributed to the fundamental design of traffic calming in which the two directions of flow are divided by central kerbed islands and central hatched areas
Pedestrian collisions have also decreased Pedestrian collisions were about 19 of all collisions within these towns and villages and the drop of 13 in pedestrian collisions is much the same as the general drop of 13 in collisions overall within the treated towns Although this is a good result in that pedestrian collisions have decreased in treated towns and villages 13 more than they have decreased in other similar locations it is not as good as was expected It was assumed that the inherent ldquopedestrian friendlyrdquo nature of traffic calming with provision of footpaths and pedestrian crossings would have a comparatively greater effect on pedestrian collisions Examination of the individual collisions in the after period suggests that the increases in pedestrian collisions are occurring in only about a dozen of the 91 towns and villages and that half of these dozen have 3 or more pedestrian incidents in the four year after period There appears to be no correlation with the provision of a pedestrian crossing as part of the traffic calming scheme A more detailed study of these locations is needed to investigate pedestrian collisions further and to ascertain whether there is any link between the provision of either pedestrian crossings or footpaths and the decrease in pedestrian collisions
Single vehicle collisions have not changed at all in relation to the general decrease in single vehicle collisions in all similar towns and villages Single vehicle collisions are those involving only one vehicle Usually in single vehicle incidents the vehicle leaves the driving lane of the road and collides with a roadside object
27
Evaluation of Traffic Calming Schemes Implemented 1997 ndash 2002
Occasionally there is no collision with a roadside object but because of the difference in levels between road and surrounding ground the occupants are injured when the vehicle comes to a halt The lack of any significant change in the occurrence of single vehicle collisions could possibly be explained by the fact that implementation of traffic calming introduces many new objects into the roadside space and reduces the available width within the driving lane Thus when a driver does stray from the correct path there is less forgiveness in the roadside environment and the chances of leaving the defined driving lane or striking an object is increased The general decrease in collisions at traffic calming sites due to the reduced speed is offset by this increased chance of hitting a roadside object which has thus resulted in no change in the incidence of these types of collisions
49 Results for Towns and Villages Treated at One End Only At 27 of the 91 locations only one end of the town or village was treated with traffic calming In 8 of these cases these were entries into a large town or city or into a coastal town where the route ended at the remaining 19 locations there was a through route but only one half of the village was treated Table 411 shows the results arranged according to whether or not both ends of the town were treated
The previous report on traffic calming constructed between 1993 and 1996 concluded that villages which had traffic calming at only one end did not perform in evaluation as well as those where both ends were treated The results shown below repeat this phenomenon At the 27 locations where only one end of the town or village was treated collisions reduced only by an average of 8 while at the other 64 locations where both ends were treated the reduction in collisions was 14 on average
When the 8 ldquosingle entryrdquo locations are separated out it can be seen that these treatments worked better than the other 19 one-end towns and villages This can perhaps be explained by the fact that these 7 locations were put in place to reduce the speed of vehicles approaching the outskirts of large towns or cities and their effect is only required to act within the environs of the traffic calming works Once past the traffic calming scheme the traffic enters a congested network where speed is not a concern For these 8 sites it was only the short length immediately around the traffic calming works was that was evaluated in the study
Table 411 Division of schemes according to whether both ends were treated
Type No in study
All colls 4 years before
Drop in collisions (4 years adjusted) Percentage drops
Fatal Serious Minor Total Total
per site Fatal Serious Minor Total
Both Ends 64 310 130 -76 311 364 06 52 -24 15 14
Single Entry 8 31 06 08 47 61 08 38 29 22 23
Half 19 67 29 -32 11 08 00 59 -41 3 1
All One-end 27 98 35 -24 58 69 03 54 -22 9 8
Total 91 408 164 -100 368 433 05 52 -24 14 13
28
Evaluation of Traffic Calming Schemes Implemented 1997 ndash 2002
5 CASE STUDIES
51 Comparison of Types of Traffic Calming Schemes The results indicate that schemes that have a central island at the gateway types AB C and D as
described in section 33 are more effective at reducing collisions than those schemes that do not have censhytral islands Four schemes on N15 were chosen to illustrate the typical differences between these types of scheme so that the layout of a scheme that has succeeded in collision reduction can be compared with one
that has not
The schemes illustrated all on N15 and in County Donegal are Ballyshannon Ballybofey Killygordon Castlefinn
Schemes With Central Island Type Gateways
Ballybofey and Castlefinn are schemes of type A having a gateway with both side buildouts and central island Inside the village or town this definition is continued using central islands and narrowing with kerbs
Both of these sites have experienced a reduction in collisions as the figures for 4 year before and after periods show Castlefinn particularly has had a notable reduction very much larger than the average of 13 for all the sites in this study
TownVillage collisions before collisions after reduction (adjusted) Ballybofey 9 6 16 Castlefinn 4 1 72
Schemes With Signs Only at Gateways
Ballyshannon and Killygordon are schemes of type H having only signs and no physical works at the gateway Definition inside the town or village is given only by using road markings
None of these sites has experienced any significant reduction in collisions as the 4 year figures below show These locations have had a slight increase in collisions relative to the general decrease in collisions across all similar towns and villages in the control data
TownVillage collisions before collisions after reduction (adjusted) Ballyshannon 7 6 -4 (increase) Killygordon 2 2 -9 (increase)
Comparison of Ballyshannon and Ballybofey
Ballyshannon and Ballybofey are similar sized towns and before traffic calming was introduced had similar approaches In both towns the speed limit extends a long way outside the centre of town and the road was wide on these approaches Both towns have busy town centres with narrow streets where vehicle speeds are not particularly high but in the zone between gateway and town centre high speeds were a problem and were addressed by traffic calming
While Ballyshannon had no central island constructed at the gateway and was treated with only signs and line marking on these approaches Ballybofey was treated with a kerbed central island kerbs and footpaths to narrow the road and a string of further central islands between the gateway and the centre of town Figures 51 and 52 below illustrate this
29
Evaluation of Traffic Calming Schemes Implemented 1997 ndash 2002
Comparison of figures 51 and 52 shows that the optical width has been considerably narrowed in Ballybofey whereas the effect is not so marked in Ballyshannon Figures 53 and 54 show how in Ballybofey this narrowing is continued on for the 600m between gateway and town centre reinforcing the slowing down effect that drivers experienced at the gateway
The differences in design of the approaches to these towns may possibly account for the differences in collision occurrence after traffic calming implementation
Figure 51 Ballyshannon south approach
Figure 52 Ballybofey south approach
30
Evaluation of Traffic Calming Schemes Implemented 1997 ndash 2002
Figure 53 Ballybofey south zone inside gateway
Figure 54 Ballybofey south zone inside gateway
31
Evaluation of Traffic Calming Schemes Implemented 1997 ndash 2002
Comparison of Killygordon and Castlefinn
Killygordon and Castlefinn are located within 6km of each other on the most northern section of N15 with a much lower traffic volume than either Ballybofey or Ballyshannon The N15 along this section in general has a narrower cross section without hard shoulders
Killygordon is a small village and had narrow approaches even before implementation of the traffic calming and the low collision rate before implementation reflects this The minimal treatment to this village under the traffic calming programme did little to change the collision occurrence Castlefinn is a larger village and before implementation its approaches were wider than those to Killygordon The number of collisions in Castlefinn before implementation was twice that in Killygordon The construction of a kerbed central island kerbs and footpaths to narrow the road and a further central island at the centre of the village has evidently had an effect on collisions which have now reduced to numbers below that in Killygordon Figures 55 and 56 below illustrate the differences between the two villages at the gateway while Figures 57 and 58 illustrate the changed look of the centre of Castlefinn as a result of traffic calming construction
Figure 55 Killygordon west approach
Figure 56 Castlefinn west approach
32
Evaluation of Traffic Calming Schemes Implemented 1997 ndash 2002
Figure 57 Castlefinn centre before traffic calming
Figure 58 Castlefinn centre after traffic calming
33
Evaluation of Traffic Calming Schemes Implemented 1997 ndash 2002
Figure 59 Approach to a village similar to Grange before traffic calming
52 Successful Schemes
N15 Grange
Grange has had one of the greatest reductions in collisions in this study
Collisions in 4 years before 9 Collisions in 4 years after 2 reduction (adjusted) 75
Grange is on a busy section of N15 in County Sligo It is a medium sized village with shops pubs petrol station police station church and a few dozen dwelling houses all with frontage onto the national road It has two busy junctions with local primary distributor roads leading to a moderately populated hinterland in the summer the population increases significantly with holidaymakers visiting the coastal area
Traffic calming was installed in 2000 Before this the approaches to the village were wide with hard shoulshyders and this cross section continued through the length of the town On entering the village from the north the length within the built up area approaching the centre is downhill so that drivers would need constant concentration and awareness of their speed to achieve a reduction in speed and to maintain that reduction on this approach From the south there is also a downhill approach but outside the built up area so that speeds approaching the start of the speed limited zone were high
Although an appropriate photograph of Grange before construction of the traffic calming is not available the photograph below of a similar sized village on N24 with similar road widths is shown below in Figure 59
Grange was treated with kerbed central islands at each gateway kerbs and footpaths to narrow the road and a string of further central islands between the two gateways Driving lanes in each direction are now a constant 35m throughout the village A signalised controlled pedestrian crossing was also constructed at the centre of the town There are now footpaths for the entire length of village between gateways and as well as the controlled crossing there are several locations where pedestrians can cross the road with the aid of the central island refuges Figures 510 511 and 512 below illustrate the works
In the years since traffic calming was implemented further housing an industrial estate and commercial sites have been constructed in the vicinity Traffic volumes turning at the junction have increased substantially
34
Evaluation of Traffic Calming Schemes Implemented 1997 ndash 2002
Figure 510 Gateway at Grange with central Island ndash Viewed from inside the village
Figure 511 Approach to Grange village centre from the north
35
Evaluation of Traffic Calming Schemes Implemented 1997 ndash 2002
Figure 512 Grange village centre
In the four years before construction of traffic calming there were roughly 2 collisions each year in the vilshylage Four of the nine collisions were single vehicle incidents and two were pedestrian collisions both involving pedestrians attempting to cross the road Skidding occurred in six of the nine collisions which is an unusually large proportion and suggests that there was a high incidence of sudden braking from high speeds
In the four years after implementation of the scheme there have been only two collisions one in the village centre where the rear of a parked vehicle was hit and one single vehicle loss of control incident on the south approach to the village
N20 Newtwopothouse Newtwopothouse has also had a significant reduction in collisions in this study
Collisions in 4 years before 4
Collisions in 4 years after 0
reduction (adjusted) 100
Newtwopothouse is on a busy section of N20 in County Cork It is a tiny settlement on a staggered junction with only a pubcafe and a shoppost office having frontage onto the national road The bulk of the housing in the area is along the two side roads stretching a few hundred metres down each road and on the eastshyern side road there is a school about 100m from the N20 Before construction of the traffic calming it did not appear to the passing driver on N20 as if there were a village at all merely a crossroads However there was a fairly large volume of traffic turning to and from the two side roads and pedestrian traffic across the N20 between housing and school
Before implementation of traffic calming the road on approach to and through the location was wide being a standard 7m single carriageway with 3m hard shoulders Figures 513 and 515 show the location before traffic calming was installed
36
Evaluation of Traffic Calming Schemes Implemented 1997 ndash 2002
Figure 513 Approach to Newtwopothouse from north before traffic calming
Figure 514 Approach to Newtwopothouse from north
Traffic calming was implemented in 2001 Similarly to Grange Newtwopothouse was treated with kerbed central islands at each gateway kerbs and footpaths to narrow the road further central islands between the two gateways and a signalised controlled pedestrian crossing in the centre Driving lanes in each direction are now a constant 35m throughout the scheme and there is now lighting for the entire length between gateways and footpaths in the central stretch around the junction and bus stops Figures 514 and 516 below illustrate the works by showing the same locations as shown in Figures 513 and 515
37
Evaluation of Traffic Calming Schemes Implemented 1997 ndash 2002
Figure 515 Crossroads at Newtwopothouse before traffic calming
Figure 516 Crossroads at Newtwopothouse with pedestrian crossing
In the four years before construction of traffic calming there were 4 collisions at this location all of which involved turning at the junction
In the four years after implementation of the scheme there have been no collisions
38
Evaluation of Traffic Calming Schemes Implemented 1997 ndash 2002
6 CONCLUSIONS
61 Reduction in Collisions Between 1997 and 2002 there were 94 traffic calming schemes completed at towns and villages on the national roads
Over all the 91 studied locations comparing the 4 years before each scheme with the 4 years after there was a reduction of 106 collisions made up of 21 fatal collisions 20 serious injury collisions and 65 minor injury collisions
62 Reduction in Comparison with Control Data When comparing with the control data and allowing for the general decrease in collisions overall on national roads during this time period this translates to a reduction of 433 collisions This is made up of a reduction of 164 fatal collisions and 368 minor injury collisions and an increase of 100 serious collisions
These figures represent a 13 reduction in all collisions with fatal collisions reduced by 52 Serious and minor injury collisions together reduced by 9
63 Reduction in Severity of Collisions The implementation of traffic calming has therefore had the effect of reducing the number of crashes within the geographical areas of their influence Its more significant effect is in reducing the severity of collisions The percentage of all collisions that were fatal dropped from 9 in the 4 years before implementation to 5 in the 4 years after The percentage of minor injury collisions rose by a corresponding amount
64 Cost Benefit Analysis Using the ldquoWillingness to Payrdquo method of evaluation the average yearly rate of return over all the years evaluated is 46
65 Effects of Different Types of Schemes Traffic Calming Schemes that have a central island in the Gateway and continue this effect with solid central islands throughout the village are more effective in reducing collisions than those that do not
Schemes that consisted of only signs and had no physical works did not have any effect at all in reducing collisions
Traffic Calming Schemes where both ends of the town or village were treated were more effective in reducshying collisions than those where only one was treated
39
Evaluation of Traffic Calming Schemes Implemented 1997 ndash 2002
40
7
Evaluation of Traffic Calming Schemes Implemented 1997 ndash 2002
RECOMMENDATIONS
There are eight main recommendations that emerge from this study
1 The programme of traffic calming of towns and villages on national roads should be continued
2 The programme should be restricted to only towns and village where traffic calming is likely to have an impact
3 An updated priority list should be produced to identify those towns and villages where traffic calming is likely to have an impact
4 Prioritised towns and villages should have a) an injury collision record over the past 5 years that is higher than average b) 85 percentile speeds that are above the posted speed limit c) a physical layout that is possible to treat with traffic calming
5 Where traffic calming is implemented it should include a central island at the gateway and should include physical narrowings throughout the town or village No scheme should consist of just signs and road markings
6 At any location where traffic calming is being considered the existing vehicle speeds through the village must be surveyed
7 After each traffic calming scheme has been implemented the revised vehicle speeds through the village must be surveyed as soon as possible
8 A further study should examine in more detail the single vehicle accidents and pedestrian accidents that been identified in this study in treated villages and towns
41
Evaluation of Traffic Calming Schemes Implemented 1997 ndash 2002
42
Evaluation of Traffic Calming Schemes Implemented 1997 ndash 2002
REFERENCES
RS460 Evaluation of Traffic Calming Schemes Constructed on National Roads 1993-1996 National Roads Authority 2002
The Road to Safety Government Strategy for Road Safety 1998-2002 Department of the Environment and Local Government 1998
Road Safety Strategy Government Strategy for Road Safety 2004-2006 Department of Transport 2004
Road Safety Strategy 2007-2012 Road Safety Authority 2007
2005 Survey of Free Speeds (Urban and Rural) National Roads Authority 2006
Guidelines on Traffic Calming for Towns and Villages on National Routes National Roads Authority 2004
Reducing Traffic Injuries Resulting From Excess and Inappropriate Speed European Transport Safety Council 1995
The importance of confounding in observational before-and-after studies of road safety measures Rune Elvik Accident Analysis and Prevention 34(5) 2002
Parameter Values for Use in Cost-Benefit Analysis of Transport Projects Goodbody Economic Consultants 2004
43
Evaluation of Traffic Calming Schemes Implemented 1997 ndash 2002
44
Evaluation of Traffic Calming Schemes Implemented 1997 ndash 2002
Evaluation of Traffic Calming Schemes Implemented 1997 ndash 2002
APPENDIX A
Ranking of Sites According to Primary Criteria for Selection for Traffic Calming National Primary Routes Only
Route Town Village Population AADT Length Colls
over 5 yrs
Collisions per 10 million vehkm
Collisions per year per 1000
Population
+Combined Collision
Rate
N17 BALLINDINE 232 5058 0587 8 148 690 640
N25 KILRANE 214 5310 2255 10 46 935 559 N08 LITTLETON 566 5598 0591 10 166 353 508
N11 ASHFORD 500 12768 1352 19 60 760 501 N01 JULIANSTOWN 450 14270 1146 16 54 711 463
N05 FRENCHPARK 272 2994 0805 11 250 809 452
N02 COLLON 335 6164 0626 7 99 418 408 N18 KILCOLGAN 500 9565 0483 9 107 360 393
N08 WATERGRASSHILL 250 13706 0985 8 32 640 385 N01 CASTLEBELLINGHAM 762 10983 1891 20 53 525 368
N08 RATHCORMACK 500 11807 1158 11 44 440 308 N09 DUNGARVAN 500 3261 028 4 240 160 280
N04 DROMOD 250 3598 059 3 77 240 275 N20 CHARLEVILLE 3000 9655 1988 12 34 400 269
N25 LEMYBRIEN 222 6471 0918 4 37 360 254 N11 KILMACANOGE 763 26721 0692 13 39 341 247
N25 GLOUNTHAUNE 500 17499 0802 17 66 680 236
N07 MONEYGALL 344 6350 0576 4 60 233 236 N09 MULLINAVAT 283 3858 0925 7 107 495 231
N08 KILBEHENY 500 6897 0863 6 55 240 230 N02 CASTLEBLAYNEY 2938 4154 3525 21 79 143 229
N07 BORRIS IN OSSORY 500 7848 1141 7 43 280 226 N15 BUNDORAN 1463 7275 2371 17 54 232 224
N24 KILSHEELAN 435 4924 1027 5 54 230 223 N02 ARDEE 3604 7019 2394 24 78 133 223
N05 CHARLESTOWN 712 2956 125 5 74 140 219 N11 CAMOLIN 293 5192 1125 4 38 273 212
N06 CRAUGHWELL 232 7669 1558 4 18 345 209
N24 MONARD 500 5735 0392 3 73 120 206 N22 FARRANFORE 500 7614 1093 6 40 240 199
N21 ABBEYFEALE 1501 9982 3287 39 65 520 195 N15 GRANGE 500 6352 1427 6 36 240 193
N24 CARRICK ON SUIR 5143 4924 2903 20 77 078 192 N04 COLLOONEY 612 8617 0864 12 88 392 186
N18 BAREFIELD 500 5852 1087 5 43 200 186 N17 CLAREGALWAY 500 11128 166 7 21 280 182
N20 BALLYHAY 500 7440 0364 3 61 120 181 N14 CASTLEFINN 692 6024 0846 5 54 145 180
N26 FOXFORD 974 1928 1915 9 134 185 180
N18 ARDRAHAN 500 6650 0413 3 60 120 180 N02 ASHBOURNE 4411 10840 2792 30 54 136 177
N08 ABBEYLEIX 1299 8083 1778 11 42 169 169 N02 CARRICKMACROSS 3341 11436 2989 27 43 162 167
N11 OILGATE 262 6332 0393 2 44 153 164 N04 BALLINAFAD 500 3199 0239 2 143 080 163
N02 CASTLESHANE 250 5338 0875 5 59 400 159 N02 SLANE 699 6064 1885 13 62 372 155
N02 ANNAYALLA 500 5338 0655 6 94 240 154
N30 ENNISCORTHY 7655 3972 0565 6 146 016 150 N10 PAULSTOWN 234 4858 0753 2 30 171 145
A1
Evaluation of Traffic Calming Schemes Implemented 1997 ndash 2002
Route Town Village Population AADT Length Colls
over 5 yrs
Collisions per 10 million vehkm
Collisions per year per 1000
Population
+Combined Collision
Rate
N08 JOHNSTOWN 422 6063 1445 4 25 190 145 N07 TOOMYVARA 500 7606 069 7 73 280 143
N16 SLIGO 17302 5680 1796 25 134 029 142 N26 BALLINA 477 5398 1983 9 46 377 140
N16 GLENFARNE 500 1746 1846 5 85 200 135 N06 ROCHFORTBRIDGE 721 6202 1348 5 33 139 135
N24 LIMERICK JCN 250 5735 0698 4 55 320 135 N22 BALLINCOLLIG 12124 15125 6303 68 39 112 134
N24 FIDDOWN 500 4588 0966 6 74 240 134
N01 DROGHEDA 23914 19455 4526 79 49 066 131 N08 NEWINN 500 7163 0648 3 35 120 131
N15 STRANORLAR+BALLYBOFEY 2972 3337 3918 22 92 148 129 N14 LIFFORD 1359 3854 1151 4 49 059 128
N22 LISSARDA 500 7096 0696 6 67 240 127 N22 BALLYVOURNEY 500 3636 2786 8 43 320 123
N06 KILREEKILL 500 9055 059 3 31 120 122 N17 BELLAHY+CHARLESTOWN 712 3834 1103 3 39 084 120
N22 MACROOM 2363 7096 4588 31 52 262 118 N15 KILLYGORDON 500 6024 0493 2 37 080 114
N08 HORSEampJOCKEY 500 7607 026 3 83 120 113
N18 GORT 1093 7709 2855 16 40 293 113 N04 CLONARD 500 10570 0599 3 26 120 112
N02 EMYVALE 479 4073 0813 4 66 167 108 N05 BELLAVARY 500 5138 0633 4 67 160 107
N20 PATRICKSWELL 1019 14486 1742 15 33 294 106 N25 KILMEADAN 500 6177 1817 7 34 280 104
N24 PALLASGREEN 500 4638 0747 4 63 160 103 N15 BALLYSHANNON 2838 8955 2844 13 28 092 102
N21 TRALEE 17225 12840 1934 40 88 046 100 N03 KELLS 3539 8857 1737 10 36 057 099
N25 KILLEAGH 347 7244 1481 5 26 288 098
N24 BANSHA 293 4221 0855 3 46 205 097 N03 CARNAROSS 500 6683 0933 5 44 200 094
N02 MONAGHAN 5946 7630 3588 32 64 108 091 N24 CAHIR 2055 13277 2528 11 18 107 089
N01 DUNDALK 25843 22685 6273 153 59 118 089 N06 MILLTOWNPASS 500 6202 0733 4 48 160 088
N18 NEWMARKET-ON-FERGUS 1583 10584 1461 13 46 164 087 N17 CURRY 250 4585 0548 2 44 160 084
N03 CAVAN 5254 11709 236 28 56 107 082 N22 KILLARNEY 7275 9731 3819 19 28 052 082
N09 MOONE+TIMOLIN 500 6720 2231 6 22 240 082
N11 RATHNEW 1496 12736 1072 11 44 147 081 N15 DONEGAL 2193 6149 2053 12 52 109 079
N25 YOUGHAL 5828 7598 522 34 47 117 076 N03 DUNSHAUGHLIN 1275 15588 1458 6 14 094 076
N04 CARRICK ON SHANNON 2500 4257 2393 10 54 080 074 N06 BALLINASLOE 5812 9582 5241 37 40 127 072
N21 NEWCASTLE WEST 2500 7975 2766 16 40 128 072 N20 BUTTEVANT 1125 7440 1271 7 41 124 072
N15 SLIGO 17302 8932 1274 14 67 016 071 N15 DRUMCLIFF 500 9726 0737 2 15 080 071
N25 NEW ROSS 6079 6846 2424 17 56 056 070
A2
Evaluation of Traffic Calming Schemes Implemented 1997 ndash 2002
Route Town Village Population AADT Length Colls
over 5 yrs
Collisions per 10 million vehkm
Collisions per year per 1000
Population
+Combined Collision
Rate
N25 DUNGARVAN 6920 5688 4649 25 52 072 070
N20 CROOM 1090 5658 1036 5 47 092 070 N24 PILTOWN 717 4588 1166 4 41 112 069
N08 MITCHELSTOWN 3090 13395 2084 19 37 123 068 N07 MONASTEREVIN 2224 11968 1754 7 18 063 068
N15 CLIFFONEY 292 5089 0652 2 33 137 067 N09 GOWRAN 477 2517 0949 2 46 084 067
N08 FERMOY 4462 10622 2955 23 40 103 066 N04 RATHOWEN 500 5465 0439 1 23 040 066
N04 NEWTOWNFORBES 250 3711 1169 2 25 160 065 N30 NEW ROSS 6079 3514 2126 8 59 026 065
N07 NENAGH 5825 8352 2422 18 49 062 064
N07 MOUNTRATH 1375 6980 1827 8 34 116 063 N01 BALBRIGGAN 7724 13451 3226 33 42 085 063
N15 LISCOOLEY 500 6024 0423 2 43 080 063 N17 TOBERCURRY 1069 4585 2168 6 33 112 061
N03 NAVAN 11706 11782 4695 43 43 073 061 N04 ENFIELD 500 10570 1127 2 09 080 058
N30 CLONROCHE 500 2786 1049 2 37 080 057 N09 CARLOW 14027 9020 5154 37 44 053 057
N16 MANORHAMILTON 995 2393 1665 3 41 060 056 N24 MOONCOIN 500 8954 1507 2 08 080 056
N06 LOUGHREA 3271 8389 295 15 33 092 056
N06 MOATE 1529 5973 2482 4 15 052 056 N08 CULLAHILL 500 6063 051 1 18 040 055
N08 URLINGFORD 689 6407 1309 4 26 116 055 N08 CASHEL 2814 7238 2342 11 36 078 055
N11 GOREY 3840 13253 1949 16 34 083 055 N11 FERNS 859 5192 0974 3 33 070 050
N18 ENNIS 16058 13516 7938 59 30 073 049 N23 CASTLEISLAND 2207 3515 0727 2 43 018 047
N05 BELLANAGARE 500 2309 0639 1 37 040 047 N04 KINNEGAD 415 6954 2589 3 09 145 045
N09 CASTLEDERMOT 741 6112 2144 4 17 108 044
N11 ARKLOW 7987 12321 3857 24 28 060 043 N18 CRUSHEEN 500 5852 0853 1 11 040 042
N03 VIRGINIA 720 6683 1261 3 20 083 040 N05 BALLAGHADERREEN 1270 4251 2127 4 24 063 040
N07 BALLYBRITTAS 500 10826 0524 1 10 040 039 N06 TYRRELLSPASS 376 6707 1407 1 06 053 038
N11 ENNISCORTHY 7655 7570 1269 6 34 016 038 N04 SLIGO 17964 15138 3821 31 29 035 038
N24 TIPPERARY 4963 11547 2213 12 26 048 038 N26 SWINFORD 1216 1928 1963 2 29 033 037
N07 BIRDHILL 500 9770 0702 2 16 080 036
N07 KILDARE 4196 14907 2763 14 19 067 035 N20 MALLOW 7521 10164 2681 13 26 035 035
N05 STROKESTOWN 568 2809 2371 2 16 070 034 N10 KNOCKTOPHER 500 2734 0841 1 24 040 034
N17 TUAM 5540 10723 305 13 22 047 034 N04 EDGEWORTHSTOWN 801 5520 2094 3 14 075 033
N04 BALLYSADARE 500 8617 0996 2 13 080 033 N10 STONYFORD 500 3401 0717 1 22 040 032
A3
Evaluation of Traffic Calming Schemes Implemented 1997 ndash 2002
Route Town Village Population AADT Length Colls
over 5 yrs
Collisions per 10 million vehkm
Collisions per year per 1000
Population
+Combined Collision
Rate
N21 CASTLEISLAND 2207 5467 1873 4 21 036 030
N07 PORTLAOISE 8360 12097 501 19 17 045 029 N09 THOMASTOWN 2512 3261 2244 3 22 024 028
N05 TULSK 500 2220 1432 1 17 040 027 N25 SWEEP 500 4274 0755 1 17 040 027
N06 GALWAY 60000 24461 5106 50 22 017 026 N03 DROLCHEAD NUA 11778 5345 04 1 26 002 026
N03 BELTURBET 1223 3316 1868 2 18 033 026 N08 DURROW 721 7244 1338 2 11 055 025
N05 WESTPORT 3688 12879 1194 5 18 027 025 N19 SHANNON 7920 14965 05 3 22 008 024
N21 ADARE 500 3348 1288 1 13 040 023
N07 ROSCREA 4231 7718 3502 7 14 033 022 N17 KNOCK 440 3958 1251 1 11 045 022
N10 KILKENNY 17669 7149 3379 8 18 009 020 N13 STRANORLAR 2972 7141 0925 2 17 013 020
N20 LIMERICK 75000 20672 6595 42 17 011 020 N24 CLONMEL 15562 7270 5907 12 15 015 019
N13 BRIDGE END 500 8153 075 1 09 040 019 N05 CASTLEBAR 7648 7442 3988 7 13 018 018
N17 CLAREMORRIS 1907 5058 1868 2 12 021 017 N24 OOLA 474 4864 1937 1 06 042 016
N07 LIMERICK 75000 15709 10841 41 13 011 016
N21 TEMPLEGLANTINE 819 6759 0828 1 10 024 016 N17 GALWAY 60000 27843 3176 20 12 007 014
N05 LONGFORD 6824 6874 4021 5 10 015 014 N07 DUBLIN 500000 47272 2387 22 11 001 011
N04 BOYLE 2197 3199 2036 1 08 009 011 N11 DUBLIN 500000 40055 13999 95 09 004 010
N04 DUBLIN 500000 29736 9209 42 08 002 009 N18 LIMERICK 75000 27171 5095 17 07 005 008
N09 WATERFORD 75000 14883 1693 3 07 001 007 N50 DUBLIN 600000 18676 124 10 02 000 002
N24 LIMERICK 75436 10740 3098 1 02 000 002
N08 CORK 136000 32213 414 2 01 000 001 N22 CORK 136000 25429 3556 1 01 000 001
N09 BALLYHALE 500 3858 0867 0 00 000 000 N17 BALLYNACARROW 500 3807 0798 0 00 000 000
N04 BALLYNALACK 500 5465 0748 0 00 000 000 N03 BALLYSHANNON 2838 3088 0899 0 00 000 000
N05 CARRACASTLE 500 2956 1215 0 00 000 000 N04 CASTLEBALDWIN 500 3199 0252 0 00 000 000
N18 CLARINBRIDGE 500 9565 1417 0 00 000 000 N20 CORK 136000 15947 4267 0 00 000 000
N27 CORK 136000 13277 3778 0 00 000 000
N01 DUBLIN 500000 28975 4298 0 00 000 000 N02 DUBLIN 500000 11524 6397 0 00 000 000
N03 DUBLIN 500000 21436 4357 0 00 000 000 N06 HORSELEAP 500 6769 0735 0 00 000 000
N06 KILBEGGAN 617 6707 1286 0 00 000 000 N14 LETTERKENNY 10726 15411 093 0 00 000 000
N17 MILLTOWN 500 5467 0869 0 00 000 000 N21 PATRICKSWELL 1019 3348 0274 0 00 000 000
A4
Evaluation of Traffic Calming Schemes Implemented 1997 ndash 2002
Route Town Village Population AADT Length Colls
over 5 yrs
Collisions per 10 million vehkm
Collisions per year per 1000
Population
+Combined Collision
Rate
N09 PAULSTOWN 234 6653 0721 0 00 000 000
N04 ROOSKY 249 3827 0696 0 00 000 000 N28 SHANBALLY 500 5098 0506 0 00 000 000
N05 TERMONBARRY 500 3366 098 0 00 000 000 N25 WATERFORD 41853 10668 8427 0 00 000 000
N25 BALLINABOOLA N25 BARNTOWN
N07 DALYS CROSS N18 GORT RD ENNIS
N20 NEWTWOPOTHOUSE N08 RINGASKIDDY
+ Combined Collision Rate [Coll Rate 10mvehkmyr5 + Coll Rate 1000popyr2]2 These towns and villages were not assessed as funding was already committed
A5
Evaluation of Traffic Calming Schemes Implemented 1997 ndash 2002Evaluation of Traffic Calming Schemes Implemented 1997 ndash 2002
Evaluation of Traffic Calming Schemes Implemented 1997 ndash 2002
51
Appendix B Evaluation of Traffic Calming Schemes Implemented 1997 ndash 2002
APPENDIX B Scheme Details for All Sites
Scheme Local Authority Rte Both or Half Spd Lim Type Colls 4 yrs before raw
Colls 4 yrs after raw
Drop in Ann Colls Adj for
All Nats Area Evaluated Year
Finished Year
Started Year
Bypassed Year
Changed Total Cost in 2002 Prices
Carrickarnon Louth 1 both 60 F 15 10 079 Gate - Gate 2001 2007 109400
Greengates Louth 1 both 40 B 8 2 130 Gate - Gate 1997 2002 489900 KilsaranCastlebellingham Louth 1 both 30 A 23 10 260 Gate - Gate 1997 1997 2002 255600
Julianstown Meath 1 both 30 C 13 10 024 Gate - Gate 1999 1999 2003 767700 Emyvale Monaghan 2 both 30 F 5 7 -065 Gate - Gate 2001 46500
Castleblaney (N) Monaghan 2 2nd half 40 A 3 5 -073 Gate - Bend 2000 2000 2007 132300
Carrickmacross (N) Monaghan 2 half 40 A 7 4 008 Gate - Bend 1998 1998 2005 92500 Ardee (S) Louth 2 half 30 A 4 9 -152 Gate - R170 Jcn 1997 1997 238300
Collon Louth 2 both 30 E 6 7 -038 Gate - Gate 1997 1996 251600 Slane Meath 2 both 30 A 8 5 048 Gate - Gate 2002 2001 534500
Kells Meath 3 both 30 A 8 8 -024 Gate - Gate 2001 730900 Castlebaldwin Sligo 4 both 30 A 5 2 062 Gate - Gate 1999 1998 547500
Dromod Leitrim 4 both 30 B 1 3 -052 Gate - Gate 2000 1999 2008 418300 Roosky (E) Leitrim 4 half 30 B 1 -025 Gate - Centre 1998 1997 2008 123300
Newtownforbes (E) Longford 4 1st half 30 F 1 2 -028 Gate - Bend 2001 2003 73800 Rathowen Westmeath 4 both 30 A 1 1 -002 Gate - Gate 1999 1999 369400
Clonard (E) Meath 4 half 40 B 1 1 -000 Gate - Centre 1997 2006 53200
Enfield Meath 4 both 30 C 8 2 114 Gate - Gate 1999 1998 2002 73900 CharlestownBellahy (WN) Mayo 5 half 30 A 7 132 Gates - Centre 1999 1998 2008 523400
Frenchpark Roscommon 5 both 30 F 5 3 032 Gate - Gate 2001 133600 Craughwell Galway 6 both 40 F 6 6 -015 Gate - Gate 2000 1999 30600
Rochfordbridge Westmeath 6 both 30 A 7 5 037 Gate - Gate 1998 1998 2006 199600 Miltownpass Westmeath 6 both 40 F 1 1 -002 Gate - Gate 2000 2000 2006 2005 248000
B1
Appendix B Evaluation of Traffic Calming Schemes Implemented 1997 ndash 2002
Scheme Local Authority Rte Both or Half Spd Lim Type Colls 4 yrs before raw
Colls 4 yrs after raw
Drop in Ann Colls Adj for
All Nats Area Evaluated Year
Finished Year
Started Year
Bypassed Year
Changed Total Cost in 2002 Prices
Moneygall Offaly 7 both 30 C 2 4 -056 Gate - Gate 2001 1997 2002 410900 Ballybrittas Laois 7 both 40 A 5 3 025 Gate - Gate 2002 2005 197900
Monasterevin (W) Kildare 7 half 30 G 4 1 064 Gate - Bridge 1998 1998 2005 29900
Cullahill Laois 8 both 40 A 1 2 -027 Gate - Gate 2000 1999 134200 Abbeyleix (S) Laois 8 half 30 A 1 4 -077 Gate - Centre 2000 2000 330700
Mullinavat (N) Kilkenny 9 half 30 G 6 3 057 Gate - Centre 2001 96600 Dungarvan Kilkenny 9 both 40 G 1 2 -028 Gate - Gate 2001 212700
Paulstown Kilkenny 9 both 30 A 2 046 Gate - Gate 1999 1998 184700 Kilkenny (E) Kilkenny 10 single entry 30 B 10 3 133 Gate - Centre 2001 195200
Claragh Kilkenny 10 both 60 F 2 2 -016 Gate - Gate 1999 206500 Camolin Wexford 11 both 30 A 5 1 073 Gate - Gate 2002 581000
Ashford Wicklow 11 both 30 E 16 7 160 Gate - Gate 1999 1998 2004 92300 Lifford (N amp W) Donegal 14 both 30 A 10 5 095 Gate - Gate 2001 70400
Castlefinn Donegal 15 both 30 A 4 1 063 Gate - Gate 2001 127500
Killygordon Donegal 15 both 30 H 2 2 -004 Gate - Gate 2002 113300 Ballybofey (S) Donegal 15 half 40 A 9 6 029 Gate - Centre 2002 246400
Ballyshannon (S) Donegal 15 2nd half 40 G 7 6 -006 Gate - Bridge 1997 1996 2006 159700 Bundoran Donegal 15 both 40 H 9 15 -163 Gate - Gate 1997 2006 41900
Cliffony Sligo 15 both 30 A 2 1 019 Gate - Gate 2001 143800 Grange Sligo 15 both 30 A 9 2 149 Gate - Gate 2000 1999 172500
Drumcliffe Sligo 15 both 30 F 7 5 033 Gate - Gate 2000 1999 259100 Ballindine Mayo 17 both 30 E 3 6 -091 Gate - Gate 1997 1997 106500
Claregalway Galway 17 both 30 A 3 7 -116 Gate - Gate 1998 1997 328300 Kilcolgan Galway 18 both 40 E 8 8 -042 Gate - Gate 1999 1999 2003 46200
Ardrahan Galway 18 both 30 J 6 1 096 Gate - Gate 1999 1999 46200
Crusheen (N) Clare 18 half 30 E 1 -025 Gate - Bend 1998 1997 2003 251400 Barefield (N) Clare 18 half 40 G 2 1 021 Gate - Centre 1998 1997 2007 251400
B2
Appendix B Evaluation of Traffic Calming Schemes Implemented 1997 ndash 2002
Scheme Local Authority Rte Both or Half Spd Lim Type Colls 4 yrs before raw
Colls 4 yrs after raw
Drop in Ann Colls Adj for
All Nats Area Evaluated Year
Finished Year
Started Year
Bypassed Year
Changed Total Cost in 2002 Prices
Charleville (S) Cork 20 1st half 30 A 2 2 -006 Gate - Ped X 2001 2004 165400
Ballyhea Cork 20 both 40 A 1 -025 Gate - Gate 1999 1999 784900
Newtwopothouse Cork 20 both 40 A 4 084 Gate - Gate 2001 165400
Cork (N) Cork 20 single entry 40 I 1 2 -030 Gate - Ped X 2002 239700
Farranfore Kerry 22 both 30 F 4 5 -032 Gate - Gate 1998 1998 2003 20000
Killarney (E) Kerry 22 single entry 40 D 8 3 085 Gate - Rbt 1998 1998 59900
Ballyvourney Cork 22 both 30 E 3 6 -090 Gate - Gate 2002 2001 570300
Lissarda Cork 22 both 40 A 4 4 -022 Gate - Gate 2002 333900
Ballincollig (W) Cork 22 half 30 B 10 8 041 Gate - Rbt 1997 1997 2004 496300
Cork (W) Cork 22 single entry 30 A 000 Gate - Vic X 1999 2004 193900
Monard South Tipperary 24 both 30 I 1 -025 Gate - Gate 1998 1998 39300
Bansha South Tipperary 24 both 30 I 2 2 -004 Gate - Gate 2001 138400
Kilsheelan South Tipperary 24 both 30 A 2 043 Gate - Gate 1999 1997 2007 194500
Carrick-on-Suir (W) South Tipperary 24 2nd half 30 A 3 066 Gate - Mini Rbt 2001 211900
Mooncoin Kilkenny 24 both 30 F 5 8 -088 Gate - Gate 1998 1998 140000
Lemybrien Waterford 25 both 40 A 1 1 -002 Gate - Gate 1998 1997 165700
Waterford (E) Kilkenny 25 single entry 30 A 5 1 084 Gate - Rbt 1997 1997 63900
Ballinaboola Wexford 25 both 30 A 3 3 -024 Gate - Gate 1999 1999 554100
Barntown Wexford 25 both 40 A 1 2 -037 Gate - Gate 1997 1997 639000
Kilrane (W) Wexford 25 half 30 A 4 4 -025 Gate - Speed Lim 1999 1998 2004 300400
Rosslare Harbour (W) Wexford 25 single entry 15 E 000 Gate - Harbour 2001 2004 16000
Foxford Mayo 26 both 30 I 6 1 083 Gate - Gate 2001 33300
B3
Appendix B Evaluation of Traffic Calming Schemes Implemented 1997 ndash 2002
Scheme Local Authority Rte Both or Half Spd Lim Type Colls 4 yrs before raw
Colls 4 yrs after raw
Drop in Ann Colls Adj for
All Nats Area Evaluated Year
Finished Year
Started Year
Bypassed Year
Changed Total Cost in 2002 Prices
Clonroche Wexford 30 both 30 F 4 2 035 Gate - Gate 2001 20400
New Ross (N) Wexford 30 both 30 A 2 4 -060 Gate - Gate 2002 47500
Smithborough (W) Monaghan 54 half 30 A 2 1 019 Gate - Centre 2001 56900
Carrickboy Longford 55 both 40 H 2 3 -037 Gate - Gate 2002 57100
Gortahork Donegal 56 both 30 I 1 5 -105 Gate - Gate 2002 45500
Dromore West Sligo 59 both 30 A 4 084 Gate - Gate 2000 156200
Ballisodare Sligo 59 both 30 A 000 Gate - Speed Lim 2002 1997 142700
Hodson Bay Roscommon 61 both 40 A 5 112 Gate - Gate 2001 432500
Birr Offaly 62 both 30 C 15 9 087 Gate - Gate 2001 94700
Loughrea (W) Galway 66 single entry 30 I 1 3 -052 Gate - N6 Jcn 1999 1999 55400
Ballylickey Cork 71 both 40 I 1 2 -037 Gate - Gate 1997 228500
Bantry (N) Cork 71 half 30 E 5 5 -027 Gate - Centre 2002 115600
Clonakilty Cork 71 both 30 C 4 1 059 Gate - Gate 1999 331600
Grangemockler South Tipperary 76 both 30 I 2 042 Gate - Gate 1998 1998 2003 51900
Kilkenny (N) Kilkenny 77 single entry 30 E 6 8 -068 Gate - Centre 2001 195200
Newtown Laois 78 both 40 A 5 1 073 Gate - Gate 2002 181400
Killeigh Offaly 80 both 30 B 000 Gate - Gate 1999 1999 97400
Kilmaine (N) Mayo 84 half 30 B 1 019 Gate - R332 Jcn 1998 99800
Swanlinbar (S) Cavan 87 half 30 E 1 1 -005 Gate - Centre 2002 39900
B4
Appendix C
Evaluation of Traffic Calming Schemes Implemented 1997 ndash 2002 APPENDIX C Collision Data Cost Data and First Year Rate of Return for All Sites
Location Rte Yr Construction Cost
4 Years Before 4 Years After Drop in Annual Collisions adjusted Cost Saving from Drop in Collision
Yearly Rate of Return
F S M Tot F S M Tot F S M Tot F S M Tot
Carrickarnon 1 01 109400 3 1 11 15 1 1 8 10 046 -009 042 079 1047600 -27300 12600 1032900 944
Greengates 1 97 489900 2 1 5 8 0 0 2 2 043 013 074 130 969700 40900 22200 1032800 211
KilsaranCastlebellingham 1 97 255600 1 5 17 23 1 0 9 10 -004 067 197 260 -85200 204700 59000 178500 70
Julianstown 1 99 767700 0 3 10 13 1 1 8 10 -025 017 032 024 -570000 53300 9500 -507200 -66
Emyvale 2 01 46500 0 0 5 5 0 2 5 7 000 -050 -015 -065 0 -152300 -4500 -156800 -337
Castleblaney (N) 2 00 132300 0 2 1 3 0 2 3 5 000 -021 -052 -073 0 -62800 -15600 -78400 -59
Carrickmacross (N) 2 98 92500 0 5 2 7 0 0 4 4 000 062 -054 008 0 188700 -16100 172600 187
Ardee (S) 2 97 238300 1 2 1 4 1 4 4 9 -004 -073 -075 -152 -85200 -222700 -22600 -330500 -139
Collon 2 97 251600 0 1 5 6 0 3 4 7 000 -062 024 -038 0 -187500 7200 -180300 -72
Slane 2 02 534500 3 2 3 8 0 0 5 5 077 036 -065 048 1761000 109400 -19400 1851000 346
Kells 3 01 730900 0 0 8 8 1 1 6 8 -025 -025 026 -024 -570000 -76200 7800 -638400 -87
Castlebaldwin 4 99 547500 1 0 4 5 0 0 2 2 020 000 043 062 451800 0 12800 464600 85
Dromod 4 00 418300 0 0 1 1 0 2 1 3 000 -050 -002 -052 0 -152300 -600 -152900 -37
Roosky (E) 4 98 123300 0 0 0 0 0 0 1 1 000 000 -025 -025 0 0 -7500 -7500 -6
Newtownforbes (E) 4 01 73800 0 0 1 1 0 0 2 2 000 000 -028 -028 0 0 -8400 -8400 -11
Rathowen 4 99 369400 0 0 1 1 0 1 0 1 000 -025 023 -002 0 -76200 6900 -69300 -19
Clonard (E) 4 97 53200 0 0 1 1 0 0 1 1 000 000 -000 -000 0 0 -100 -100 -0
Enfield 4 99 73900 1 2 5 8 0 0 2 2 020 028 066 114 451800 86300 19700 557800 755
CharlestownBellahy (WN) 5 99 523400 1 3 3 7 0 0 0 0 020 042 069 132 451800 129400 20800 602000 115
Frenchpark 5 01 133600 2 1 2 5 0 1 2 3 047 -009 -006 032 1078400 -27300 -1800 1049300 785
Craughwell 6 00 30600 1 0 5 6 0 0 6 6 020 000 -035 -015 454600 0 -10400 444200 1452
Rochfordbridge 6 98 199600 0 0 7 7 0 0 5 5 000 000 037 037 0 0 11200 11200 6
Miltownpass 6 00 248000 0 0 1 1 0 0 1 1 000 000 -002 -002 0 0 -600 -600 -0
Moneygall 7 01 410900 0 0 2 2 0 2 2 4 000 -050 -006 -056 0 -152300 -1800 -154100 -38
C1
Appendix C Evaluation of Traffic Calming Schemes Implemented 1997 ndash 2002
Location Rte Yr Construction Cost
4 Years Before 4 Years After Drop in Annual Collisions adjusted Cost Saving from Drop in Collision
Yearly Rate of Return
F S M Tot F S M Tot F S M Tot F S M Tot
Ballybrittas 7 02 197900 0 0 5 5 0 0 3 3 000 000 025 025 0 0 7600 7600 4
Monasterevin (W) 7 98 29900 1 0 3 4 0 0 1 1 019 000 045 064 434000 0 13400 447400 1496
Cullahill 8 00 134200 0 0 1 1 1 0 1 2 -025 000 -002 -027 -570000 0 -600 -570600 -425
Abbeyleix (S) 8 00 330700 0 0 1 1 0 1 3 4 000 -025 -052 -077 0 -76200 -15600 -91800 -28
Mullinavat (N) 9 01 96600 0 0 6 6 0 0 3 3 000 000 057 057 0 0 17100 17100 18
Dungarvan 9 01 212700 0 0 1 1 0 0 2 2 000 000 -028 -028 0 0 -8400 -8400 -4
Paulstown 9 99 184700 0 0 2 2 0 0 0 0 000 000 046 046 0 0 13900 13900 8
Kilkenny (E) 10 01 195200 0 2 8 10 0 1 2 3 000 007 126 133 0 21600 37800 59400 30
Claragh 10 99 206500 1 1 0 2 0 0 2 2 020 014 -050 -016 451800 43100 -15000 479900 232
Camolin 11 02 581000 0 1 4 5 0 0 1 1 000 018 055 073 0 54700 16600 71300 12
Ashford 11 99 92300 0 4 12 16 0 1 6 7 000 032 128 160 0 96400 38400 134800 146
Lifford (N amp W) 14 01 70400 0 0 10 10 0 0 5 5 000 000 095 095 0 0 28500 28500 40
Castlefinn 15 01 127500 0 0 4 4 0 0 1 1 000 000 063 063 0 0 18900 18900 15
Killygordon 15 02 113300 1 0 1 2 0 0 2 2 026 000 -030 -004 587000 0 -9000 578000 510
Ballybofey (S) 15 02 246400 0 1 8 9 0 1 5 6 000 -007 036 029 0 -21500 10700 -10800 -4
Ballyshannon (S) 15 97 159700 2 2 3 7 0 1 5 6 043 002 -051 -006 969700 5700 -15200 960200 601
Bundoran 15 97 41900 0 1 8 9 0 4 11 15 000 -087 -077 -163 0 -263700 -23000 -286700 -684
Cliffony 15 01 143800 0 0 2 2 0 1 0 1 000 -025 044 019 0 -76200 13200 -63000 -44
Grange 15 00 172500 0 1 8 9 1 0 1 2 -025 015 159 149 -570000 44800 47800 -477400 -277
Drumcliffe 15 00 259100 1 0 6 7 1 1 3 5 -005 -025 063 033 -115400 -76200 19000 -172600 -67
Ballindine 17 97 106500 1 1 1 3 0 2 4 6 021 -037 -075 -091 484800 -111400 -22600 350800 329
Claregalway 17 98 328300 0 1 2 3 0 2 5 7 000 -038 -079 -116 0 -114600 -23600 -138200 -42
Kilcolgan 18 99 46200 0 3 5 8 0 1 7 8 000 017 -059 -042 0 53300 -17800 35500 77
Ardrahan 18 99 46200 0 2 4 6 0 0 1 1 000 028 068 096 0 86300 20300 106600 231
Crusheen (N) 18 98 251400 0 0 0 0 0 1 0 1 000 -025 000 -025 0 -76200 0 -76200 -30
Barefield (N) 18 98 251400 0 0 2 2 0 1 0 1 000 -025 046 021 0 -76200 13900 -62300 -25
Charleville (S) 20 01 165400 0 0 2 2 0 1 1 2 000 -025 019 -006 0 -76200 5700 -70500 -43
C2
Appendix C Evaluation of Traffic Calming Schemes Implemented 1997 ndash 2002
Location Rte Yr Construction Cost
4 Years Before 4 Years After Drop in Annual Collisions adjusted Cost Saving from Drop in Collision
Yearly Rate of Return
F S M Tot F S M Tot F S M Tot F S M Tot
Ballyhea 20 99 784900 0 0 0 0 0 0 1 1 000 000 -025 -025 0 0 -7500 -7500 -1
Newtwopothouse 20 01 165400 1 1 2 4 0 0 0 0 024 016 044 084 539200 48900 13200 601300 364
Cork (N) 20 02 239700 0 0 1 1 0 0 2 2 000 000 -030 -030 0 0 -9000 -9000 -4
Farranfore 22 98 20000 0 0 4 4 0 0 5 5 000 000 -032 -032 0 0 -9700 -9700 -49
Killarney (E) 22 98 59900 1 2 5 8 1 0 2 3 -006 025 066 085 -136000 75500 19800 -40700 -68
Ballyvourney 22 02 570300 0 0 3 3 2 0 4 6 -050 000 -040 -090 -1140000 0 -11900 -1151900 -202
Lissarda 22 02 333900 0 1 3 4 0 1 3 4 000 -007 -015 -022 0 -21500 -4400 -25900 -8
Ballincollig (W) 22 97 496300 2 0 8 10 1 0 7 8 018 000 023 041 399700 0 7000 406700 82
Cork (W) 22 99 193900 0 0 0 0 0 0 0 0 000 000 000 000 0 0 0 0 0
Monard 24 98 39300 0 0 0 0 0 0 1 1 000 000 -025 -025 0 0 -7500 -7500 -19
Bansha 24 01 138400 1 0 1 2 0 1 1 2 024 -025 -003 -004 539200 -76200 -900 462100 334
Kilsheelan 24 99 194500 1 0 1 2 0 0 0 0 020 000 023 043 451800 0 6900 458700 236
Carrick-on-Suir (W) 24 01 211900 0 0 3 3 0 0 0 0 000 000 066 066 0 0 19800 19800 9
Mooncoin 24 98 140000 1 0 4 5 1 1 6 8 -006 -025 -057 -088 -136000 -76200 -17200 -229400 -164
Lemybrien 25 98 165700 0 0 1 1 0 1 0 1 000 -025 023 -002 0 -76200 7000 -69200 -42
Waterford (E) 25 97 63900 1 1 3 5 0 0 1 1 021 013 049 084 484800 40900 14800 540500 846
Ballinaboola 25 99 554100 0 2 1 3 0 1 2 3 000 003 -027 -024 0 10100 -8100 2000 0
Barntown 25 97 639000 0 1 0 1 0 0 2 2 000 013 -050 -037 0 40900 -15000 25900 4
Kilrane (W) 25 99 300400 0 2 2 4 0 2 2 4 000 -022 -004 -025 0 -66000 -1100 -67100 -22
Rosslare Harbour (W) 25 01 16000 0 0 0 0 0 0 0 0 000 000 000 000 0 0 0 0 0
Foxford 26 01 33300 0 4 2 6 0 0 1 1 000 064 019 083 0 195400 5700 201100 604
Clonroche 30 01 20400 2 1 1 4 1 0 1 2 022 016 -003 035 508400 48900 -900 556400 2727
New Ross (N) 30 02 47500 0 0 2 2 0 1 3 4 000 -025 -035 -060 0 -76200 -10500 -86700 -183
Smithborough (W) 54 01 56900 0 0 2 2 0 0 1 1 000 000 019 019 0 0 5700 5700 10
Carrickboy 55 02 57100 0 1 1 2 0 1 2 3 000 -007 -030 -037 0 -21500 -9000 -30500 -53
Gortahork 56 02 45500 0 0 1 1 1 0 4 5 -025 000 -080 -105 -570000 0 -24000 -594000 -1305
Dromore West 59 00 156200 0 1 3 4 0 0 0 0 000 015 069 084 0 44800 20700 65500 42
C3
Appendix C Evaluation of Traffic Calming Schemes Implemented 1997 ndash 2002
Location Rte Yr Construction Cost
4 Years Before 4 Years After Drop in Annual Collisions adjusted Cost Saving from Drop in Collision
Yearly Rate of Return
F S M Tot F S M Tot F S M Tot F S M Tot
Ballisodare 59 02 142700 0 0 0 0 0 0 0 0 000 000 000 000 0 0 0 0 0
Hodson Bay 61 01 432500 1 0 4 5 0 0 0 0 024 000 088 112 539200 0 26400 565600 131
Birr 62 01 94700 0 3 12 15 0 1 8 9 000 023 064 087 0 70400 19200 89600 95
Loughrea (W) 66 99 55400 0 0 1 1 0 1 2 3 000 -025 -027 -052 0 -76200 -8100 -84300 -152
Ballylickey 71 97 228500 0 1 0 1 0 1 1 2 000 -012 -025 -037 0 -35200 -7500 -42700 -19
Bantry (N) 71 02 115600 0 1 4 5 0 0 5 5 000 018 -045 -027 0 54700 -13400 41300 36
Clonakilty 71 99 331600 0 1 3 4 0 0 1 1 000 014 044 059 0 43100 13300 56400 17
Grangemockler 76 98 51900 1 0 1 2 0 0 0 0 019 000 023 042 434000 0 7000 441000 850
Kilkenny (N) 77 01 195200 0 0 6 6 0 0 8 8 000 000 -068 -068 0 0 -20400 -20400 -10
Newtown 78 02 181400 0 1 4 5 0 1 0 1 000 -007 080 073 0 -21500 24100 2600 1
Killeigh 80 99 97400 0 0 0 0 0 0 0 0 000 000 000 000 0 0 0 0 0
Kilmaine (N) 84 98 99800 1 0 0 1 0 0 0 0 019 000 000 019 434000 0 0 434000 435
Swanlinbar (S) 87 02 39900 0 0 1 1 0 0 1 1 000 000 -005 -005 0 0 -1500 -1500 -4
19457200 36 72 300 408 15 52 235 302 411 -249 920 1082 9376400 -759100 276100 8892000 46
C4
9
Evaluation of Traffic Calming Schemes Implemented 1997 ndash 2002Appendix B

Evaluation of Traffic Calming Schemes Implemented 1997 ndash 2002
EXECUTIVE SUMMARY In July 1998 the Government published ldquoThe Road to Safetyrdquo its strategy for road safety over the period 1998 ndash 2002 followed by a further strategy in 2004 for 2004 - 2006 A third Road to Safety document has recently been published setting out the governmentrsquos strategy for road safety over the period 2007 ndash 2012 with a target to reduce fatalities by 20 to 250 per year and to reduce injuries by 25 Under the terms of all strategies the National Roads Authority has been charged with undertaking a number of specific tasks In each of the strategies one of the tasks for NRA has been the implementation of traffic calming at towns and villages on the network of national roads and the evaluation of the effectiveness of these schemes This evaluation will enable NRA to prioritise the future programme of traffic calming by assessing the effectiveness of implemented schemes and identifying the successes of previous programmes
This report examines traffic calming schemes constructed between 1997 and 2002 It describes the principle behind traffic calming in reducing speed by altering the appearance of the road on the approach to the townvillage through the use of ldquogatewaysrdquo and by further traffic management measures within the town itself It lists the schemes undertaken in each of the six years from 1997 to 2002 and summarises the pershyformance of these schemes The report measures the effectiveness of the programmes based on collision data for a 4 year before period and a 4 year after period for each scheme
The objective of the traffic calming programme is to reduce the number and severity of collisions occurring in the treated towns and villages by reducing speed at these locations It has achieved that objective reducing the overall number of collisions by 13 Moreover the number of fatal collisions was reduced by 52 thus lowering the overall severity of crashes at traffic calming locations The number of serious and minor injury collisions decreased by 9
Between 1997 and 2002 there were 94 traffic calming schemes completed at towns and villages on the national roads 91 of these were evaluated and a summary of the results is shown below
Summary Table
Year of Completion
No of Schemes
Cost of Construction
euro
Reduction in Collisions (4 years adjusted)
Cost saving in Collisions per
year euro
Yearly Rate of Return
Fatal Serious Minor 1997 12 euro3024600 6 -6 1 euro2655300 88 1998 14 euro1852900 2 -2 -1 euro865600 47 1999 18 euro5369900 3 5 14 euro2177500 41 2000 9 euro1882000 -1 -4 6 -euro1034500 -55 2001 23 euro3881400 6 -4 25 euro3587700 92 2002 15 euro3446600 1 1 -7 euro641800 19
All Years 91 euro19457200 16 -10 37 euro8893400 46
The above table shows that comparing the four year period before with the four year period after each scheme and allowing for the overall decrease in collisions over the same period nationwide at similar sites there was an overall reduction of 43 collisions Fatal collisions reduced by 16 and minor injury collisions by 37 while serious injury collisions increased by 10 The cost (in 2002 market prices) of all the schemes constructed between 1997 and 2002 was just under euro195 million and the overall annual cost saving in collisions nearly euro89 million The Yearly Rate of Return of each yearrsquos programme varied quite considerably but averaged at 46 In cost benefit terms the schemes effectively paid for themselves within 2 years and are still creating annual savings of euro9m every year into the future
vii
viii
Evaluation of Traffic Calming Schemes Implemented 1997 ndash 2002
Evaluation of Traffic Calming Schemes Implemented 1997 ndash 2002
1 INTRODUCTION
11 Scope of Report In July 1998 the Government published ldquoThe Road to Safetyrdquo its strategy for road safety over the period 1998 ndash 2002 followed by a further strategy in 2004 for 2004 - 2006 The primary target of each of these was to reduce fatalities from road crashes by 20 from 1997 levels by 2002 and by 25 from average 1998 - 2003 levels by 2006 A third Road to Safety document has recently been published setting out the governmentrsquos strategy for road safety over the period 2007 ndash 2012 with a target to reduce fatalities by 20 to 250 per year and to reduce injuries by 25
Under the terms of all strategies the National Roads Authority has been charged with undertaking a number of specific tasks In each of the strategies one of the tasks for NRA has been the implementation of traffic calming at towns and villages on the network of national roads and the evaluation of the effectiveness of these schemes This evaluation will enable NRA to prioritise the future programme of traffic calming by assessing the effectiveness of implemented schemes and identifying the successes of previous programmes
This report examines traffic calming schemes constructed between 1997 and 2002 under the NRA programme of traffic calming for towns and villages located on national routes
12 Background to Traffic Calming Traffic calming is a way of reducing vehicle speeds by self-enforcing traffic engineering methods In Ireland two main types of traffic calming are used-
a) Traffic calming applied on national roads and other busy inter-urban roads to manage the speed of traffic passing through towns and villages located on these routes
b) Traffic calming on local urban and residential streets to manage both speed and volume of traffic on a number of streets within an area
Type a) is the form of traffic calming examined in this report
13 Traffic Calming on National Routes In towns and villages on the national road network reducing speed is the primary goal of traffic calming Posting of speed limits alone does not result in a significant reduction in speed (2005 Survey of Free Speeds NRA) since drivers typically drive at the speed they perceive as being safe A driverrsquos perception of what is safe is related to the design of the road which includes lane width curvature corner radii and available stopping-sight distance Traffic calming essentially reduces vehicle speeds by changing these elements of the roadrsquos design and thus driversrsquo perceptions of the road ahead
The transition zone between the high speed road approaching the village and the low speed street inside the village represents a difficult safety management problem In Ireland the problem first became apparent over twenty-five years ago with the proliferation of improved road sections with hard shoulders on the national roads Where these improved sections adjoined towns and villages approach speeds increased and the sections showed higher collision rates than rural sections
Many towns and villages are positioned on national roads Drivers travelling the national routes at speeds appropriate to through routes are often still travelling at those high speeds when entering towns and villages and maintain those speeds as they travel through the urban area Inside towns and villages the
1
Evaluation of Traffic Calming Schemes Implemented 1997 ndash 2002
national road usually functions as a typical main street with shops pubs housing school and church and their accompanying pedestrian and parking activity These types of activities would be more safely carried out in an environment where low speed prevails At higher speeds drivers have less time to react and are able to process less information in their field of view and the severity of injury is higher when a collision does occur For a pedestrian struck by a vehicle travelling at 64kmh the likelihood of them being killed is 85 at 48kmh the likelihood is 45 and at 32kmh it is 5 (ETSC Reducing Traffic Injuries Resulting From Excess and Inappropriate Speed 1995)
Figure 11 Approach to a typical village on national primary route
Figure 12 Typical wide entry into a town on national route
2
Evaluation of Traffic Calming Schemes Implemented 1997 ndash 2002
Figure 13 Typical wide open town centre with undefined road edge
14 Collisions The objective of the traffic calming programme is to reduce the number of collisions occurring in the treated towns and villages by reducing the speed of vehicles travelling through these locations In the four years before this programme of traffic calming started between 1994 and 1997 nearly half of the 9956 injury collisions on national roads occurred in urban areas Table 11 shows the breakdown of collision severity between rural and urban areas All areas where the speed limit at the time was 40mph or below were taken as ldquourbanrdquo
Table 11 Collisions between 1994 and 1997 inside and outside urban areas
Severity Urban National Roads Rural National Roads All National Roads
Fatal 161 531 692
Serious Injury 851 1573 2424
Minor Injury 3475 3365 6840
Total 4487 5469 9956
3
4
Evaluation of Traffic Calming Schemes Implemented 1997 ndash 2002
Evaluation of Traffic Calming Schemes Implemented 1997 ndash 2002
2 TRAFFIC CALMING SCHEMES
21 Criteria for Selection The criteria used for selection of towns and villages for traffic calming are set out in detail in the NRA document ldquoGuidelines On Traffic Calming For Towns And Villages On National Routesrdquo This was first published in 1999 and was updated in 2004
For the traffic calming programme over the years studied in this report (1997 ndash 2002) the criteria used to select sites for inclusion in the programme were those laid down in the Guidelines The period of implementation covered in this report starts in 1997 which was before the publication of the Guidelines However the principles were already in operation within the NRA Road Safety Group and the selection of sites in the early part of this period followed more or less the same process as the later ones
The main criterion was the collision history in and on approach to the village but data on all the following were collected when considering a location
Collisions Traffic flow Speed Geometry Future infrastructural developments
Collisions
The Guidelines states that selection based on collisions should take account of not just the simple collision numbers but should assess both risk per unit of travel and risk per head of population in the town or village In order to do this assessment a table was drawn up in 1999 listing these two risk categories for all towns and villages on national roads and ranking them according to a combination of the two categories The resulting table for national primary roads is reproduced in Appendix A but for illustration the 15 top ranking towns and villages on national primary roads are shown in Table 21 These 15 sites were all treated in the early years of the traffic calming programme 12 of them are among those examined in this report 3 were implemented before 1997 and were assessed in the preceding report to this
Table 21 Ranking of towns amp villages on national primary routes
Route Town Village Population AADT Length Colls over 5 yrs
Collisions per 10 Million VehKm
Collisions per year per
1000 Population
Combined Collision
Rate
N17 BALLINDINE 232 5058 0587 8 148 690 640
N25 KILRANE 214 5310 2255 10 46 935 559
N08 LITTLETON 566 5598 0591 10 166 353 508
N11 ASHFORD 500 12768 1352 19 60 760 501
N01 JULIANSTOWN 450 14270 1146 16 54 711 463
N05 FRENCHPARK 272 2994 0805 11 250 809 452
N02 COLLON 335 6164 0626 7 99 418 408
N18 KILCOLGAN 500 9565 0483 9 107 360 393
N08 WATERGRASSHILL 250 13706 0985 8 32 640 385
N01 CASTLEBELLINGHAM 762 10983 1891 20 53 525 368
N08 RATHCORMACK 500 11807 1158 11 44 440 308
N09 DUNGARVAN 500 3261 028 4 240 160 280
N04 DROMOD 250 3598 059 3 77 240 275
N20 CHARLEVILLE 3000 9655 1988 12 34 400 269
N25 LEMYBRIEN 222 6471 0918 4 37 360 254
5
Evaluation of Traffic Calming Schemes Implemented 1997 ndash 2002
Using the method of combining the two collision risk categories meant that small villages where there had been only a few collisions such as Dungarvan on N9 or Dromod on N4 ranked as highly as large towns with long lengths of national road and a higher number of collisions such as Charleville on N20 Thus several small villages where the actual collision numbers were low were given high priority in the traffic calming programme because the risk to road users from high speed traffic was comparatively high whereas many large towns with very much bigger numbers of actual collisions did not get priority
Speed
Selection is also based on the speed of vehicles in the towns and villages considered If speeds through a certain location were already low then that town or village was not given priority in the traffic calming programme Often this assessment would result in only one approach to a town or village being treated as described in section 32
Geometry
The other major criterion was the geometry of the road within the town or village considered If the separate physical elements that make up a traffic calming scheme especially that of narrowing the carriageway could not be applied to a certain location then a traffic calming scheme could not be fully implemented However several schemes were indeed implemented in towns and villages where the road width was already narrow prior to construction of the scheme These schemes often consisted of only signs and road markings this is discussed further in section 33
Other Factors
It must be acknowledged that several of the towns and villages assessed within this report did not have a collision history and did not have any record of high speeds before implementation of the traffic calming These sites were often selected for traffic calming because general road improvement work was scheduled at this location and traffic calming elements were incorporated into the work In some cases sites were selected solely on the basis of the perception of risk by residents and their representatives
22 Traffic Calming Measures The measures used as part of traffic calming break down into the four separate zones travelled through on approach to a town or village
bull the transition zone bull the gateway at the speed limit signs bull the zone inside the gateway bull the village centre
In small villages with a short length of national road there is usually no distinction between the last two zones but in the larger villages and towns there is often a zone which is inside the speed limited area yet cannot be described as a town centre These zones typically have either low density housing with off-street parking or warehouse-type commercial premises with sparsely spaced accesses
6
Evaluation of Traffic Calming Schemes Implemented 1997 ndash 2002
Transition Zone The principle behind traffic calming design is to change the driverrsquos perception of the surrounding environshyment
Figure 21 Transition zone approaching village
The ldquooptical widthrdquo perceived by the driver is dependent on the width between the boundaries of the road relative to the height of the adjoining vertical elements Generally in rural sections the width between fences is many times greater than the height of the hedges walls or fences which form the boundaries In urban streets the height of the buildings is generally greater than the width A driverrsquos perception of the appropriate driving speed is influenced by this relationship Speeds are lower where the height of the vertical elements is greater than the width of the road
Traffic calming aims to create a narrow optical width on the approach into towns and villages by using a combination of carriageway narrowing landscape treatment and the introduction of vertical elements such as signs lighting columns and trees Typically transition zone signs consist of a pair of ldquoTraffic Calming Aheadrdquo signs 400m from gateway and a pair of ldquoDo Not Passrdquo signs at 200m from the gateway
Gateway
The Gateway is placed at the start of the speed limited zone It should mark a definite change in the character of the surrounding area from rural to urban Therefore it needs to be conspicuous and the most prominent element in the transition zone The tall signs positioned close to the driving lane narrow the optical width
The guidelines recommend that where a town or village has two zones of speed limits first a 60kmh on the outskirts and then a 50kmh limit for the main body of the town the gateway should be placed at the change from 60kmh to 50kmh This is because usually the 50kmh limit has been placed at the edge of the properly built up area and the 60kmh zone covers the approach into the town where development is much less dense The design engineer can however choose to place the gateway at the 60kmh if surrounding development and environment are appropriate for this This has been done in a few of the cases examined
7
Evaluation of Traffic Calming Schemes Implemented 1997 ndash 2002
Figure 22 A gateway
Gateways fall into two distinct groups those with a solid kerbed central island and those with no island Early results from the first batch of traffic calming schemes constructed indicated that the presence of a central island at the gateway was a determining factor in the success of the scheme and the evaluation in this document confirms this The central island greatly increases the visual narrowing effect and the central lighting column signs and bollards are directly in the centre of the driverrsquos field of view
The gateway is always lit to a high standard with special gateway lanterns that shine directly onto the gateway signs This is not only effective in the dark during daylight hours the presence of lighting columns enhances the narrow optical width and is often noted subconsciously by the driver as an indication of an urban area
Inside Gateway
Treatment of the stretch of road between the gateway and the village centre is an important aspect of traffic calming The narrowing introduced at the gateway is continued so that the speed reduction occurring at the gateway is maintained on the driverrsquos journey through the town
This narrowing can be done by introducing any or all of the following central islands footpaths side kerb buildouts lining hatched markings and defined parking bays A shallow chicane can also sometimes be introduced by alternating side buildouts and parking between the two sides of the road The objectives are both to keep the driving lanes at no greater than 35m width and to give a visual impression to the driver of an urban area
Only narrowing and horizontal deflections are used as measures in traffic calming installations on national routes Vertical deflections such as humps or cushions are not appropriate because of the roadsrsquo function as main distributors between the major urban areas of the country Emergency vehicles and buses cannot easily negotiate routes where vertical deflection has been installed
As every gateway must be provided with lighting to illuminate the signs the infrastructure to supply street lighting needs to be provided at each end of the town or village It therefore follows that the supply for lightshying is usually available over the whole length of the village and lighting is provided over the full length of the scheme from gateway to gateway In the cases examined there are a few exceptions to this but even these few villages have street lighting for almost all of their length with only a few short gaps where no lamps are provided
8
Evaluation of Traffic Calming Schemes Implemented 1997 ndash 2002
Figure 23 Inside gateway
Town or Village Centre
In the town centre there is often not a need for narrowing works as part of the traffic calming as parking bays and footpaths may already exist However in locations where there is a wide road passing through the village centre it is necessary to narrow and define the through route with kerbing Even in locations where the through route is already well defined with kerbing and parking bays extra measures are usually required at junctions and where pedestrians wish to cross the national road or to cross side roads while walking along the main street
Typical works in the town centre are
bull definition of the limits of existing parking using kerb buildouts bull definition of junctions by the use of kerb buildouts bull provision of either pedestrian crossings or central islands to aid pedestrians in crossing
The main objective in the centre of the town or village is to provide a safe and pleasant environment that can easily be negotiated by vulnerable road users Thus it is important to provide safe places to cross where pedestrians are clearly visible to passing traffic and wide footpaths so that pedestrians are not forced to step into the road when passing others This often necessitates a reduction in the number of on street parking spaces and it can be difficult to persuade the local residents to accept this Extra off-street parking may have to be provided as part of the traffic calming scheme However there is a clear road safety advantage in both providing better facilities for pedestrians and in moving parking to off-street facilities Quite apart from the pedestrian collisions that result from vehicles reversing in and out of parking spaces and from parked vehicles masking crossing pedestrians as they step out onto the road many minor material damage collisions occur as vehicles pull in and out of parking spaces on busy through routes
9
Evaluation of Traffic Calming Schemes Implemented 1997 ndash 2002
Figure 24 Centre of village
23 Amendments to Design in 2004 The Guidelines on Traffic Calming were revised in 2004 Some of the changes made in this revision arose directly from problems encountered during construction and consequent operation of the schemes evaluated here There were numerous minor amendments but two of the main changes to design are worth notingshy
a) Increase of setback of signs The setback distance of the edge of the gateway signs from the kerb was originally specified as 600mm This width of setback was thought to provide enough clearance for overhanging loads on large vehicles while still giving the visual narrowing effect that was needed for the traffic calming gateway to be effective However in practice many gateway signs installed to this specification were hit glancing blows by passing large vehicles especially in areas where there was a significant proportion of agricultural vehicles in the mix of traffic
Consequently the specification was changed to a setback of 1m from the kerb So far this increased width appears to have succeeded in reducing the number of signs damaged by overhanging loads
b) Increase of ldquoexitrdquo width Where a central island is provided at a gateway the island and its signs and lighting column all form an obstruction for any abnormally wide load wishing to pass Whenever a wide load wishes to use the route through a village with this design of traffic calming the central lighting columns at each gateway must be temporarily disconnected and removed resulting in much inconvenience and an extra workload for the local authority and electricity supply engineers
To try to avoid this lengthy process of disconnection and removal an alternative design for gateways was put forward with extra width on the ldquoexitrdquo half of the gateway such that the width between edge kerb and central island on the lane for traffic approaching the village remains at the original 35m specified but the corresponding width on the lane for traffic leaving the village could be increased to anything up to 6m This design manages to keep the narrow optical effect for drivers approaching the village but provides an alternative route for wide loads which are guided through the approach to the village on the exit side of the central island
10
Evaluation of Traffic Calming Schemes Implemented 1997 ndash 2002
3 TRAFFIC CALMING SCHEMES 1997 - 2002
31 Schemes Implemented over Period 1997 - 2002 Between 1997 and 2002 there were 94 traffic calming schemes completed at towns and villages on the national roads Three of these schemes could not be evaluated because the collision data in the before period was considered to be unduly influenced by traffic calming on the other approach to the same village that had been implemented before 1997
The remaining 91 towns and villages have been assessed in this study
Table 31 below gives the number of schemes constructed per year and their costs Table 32 shows the spread across the different counties and Table 33 shows the spread across the national routes Figure 31 shows the locations of all the 94 schemes implemented in the period examined A detailed list of the 91 locations assessed and the measures implemented is given in Appendix B
Table 31 Schemes implemented per year
Year No of Schemes
Cost euro (market prices at
time of construction)
Cost euro (2002 prices)
Average Cost per Scheme euro
(2002 prices)
1997 12 1803000 3024500 252000
1998 14 1178800 1852900 132300
1999 18 3691800 5369900 298300
2000 9 1445200 1882000 209100
2001 23 3496400 3881300 168800
2002 15 3446600 3446600 229800
TOTALS 91 15061800 19457200 213800
The number of schemes constructed each year stayed roughly constant the average being about 15 or 16 per year There was a slight dip in the number finished in 2000 but there was a corresponding rise the next year The bulk of construction for most schemes took place within one year but where schemes carried on into following years it is the final year that is taken as the year of construction
The average cost per scheme was euro214000 over the six years All costs in this report are market prices given in 2002 prices The cost of an individual scheme varies immensely from euro16000 to euro785000 (See Appendix B) but the measures implemented in each scheme also varied greatly Some schemes were simply the installation of just 12 signs on approach to a village others included extensive urban renewal works including the complete restructuring of drainage and electricity supply for the village
Table 32 and Figure 31 show a fairly even spread of traffic calming implementation geographically across the country but it can be clearly seen in Table 33 that the majority of schemes implemented were on national primary roads Of all the schemes examined 81 are on primary routes and in the early years this division is even more marked with 88 of schemes implemented in 1997 and 1998 being on primary routes The fact that mainly primary routes were treated in the early years of the traffic calming programme can be directly attributed to the geometry of the national routes through these towns and villages Approaches to many urban areas on the primary routes had been realigned and widened during the twenty to thirty years preceding the traffic calming programme allowing traffic to approach the town or village at increased speed This increased speed and the consequent increase in collisions then identified these towns and villages as priority sites for traffic calming treatment On national secondary routes there had not
11
Evaluation of Traffic Calming Schemes Implemented 1997 ndash 2002
been such a widespread programme of realignment and widening and approaches to urban areas have mostly remained narrow Consequently on national secondary roads speeds are not so high on the approaches to urban areas collision rates also are not high and few towns and villages on secondary roads have met the criteria for the traffic calming programme
Table 32 Schemes implemented per year by county
Local Authority 1997 1998 1999 2000 2001 2002 Total
Cavan 1 1
Clare 2 2
Cork 2 3 2 4 11
Donegal 2 2 3 7
Galway 1 3 1 5
Kerry 2 2
Kildare 1 1
Kilkenny 1 1 2 4 8
Laois 2 2 4
Leitrim 1 1 2
Longford 1 1 2
Louth 4 1 5
Mayo 1 1 1 1 4
Meath 1 2 1 1 5
Monaghan 1 1 2 4
Offaly 1 2 3
Roscommon 2 2
Sligo 1 3 1 1 6
South Tipperary 2 1 2 5
Waterford 1 1
Westmeath 1 1 1 3
Wexford 1 2 2 2 7
Wicklow 1 1
Total 12 14 18 9 23 15 91
12
Evaluation of Traffic Calming Schemes Implemented 1997 ndash 2002
Figure 31 Locations of traffic calming schemes 1997 to 2002
13
Evaluation of Traffic Calming Schemes Implemented 1997 ndash 2002
Table 33 Schemes implemented per year by route
Route 1997 1998 1999 2000 2001 2002 Total
1 2 1 1 4
2 2 1 1 1 1 6
3 1 1
4 1 1 3 1 1 7
5 1 1 2
6 1 2 3
7 1 1 1 3
8 2 2
9 1 2 3
10 1 1 2
11 1 1 2
14 1 1
15 2 2 2 2 8
17 1 1 2
18 2 2 4
20 1 2 1 4
22 1 2 1 2 6
24 2 1 2 5
25 2 1 2 1 6
26 1 1
30 1 1 2
54 1 1
55 1 1
56 1 1
59 1 1 2
61 1 1
62 1 1
66 1 1
71 1 1 1 3
76 1 1
77 1 1
78 1 1
80 1 1
84 1 1
87 1 1
National Primary 11 12 15 8 19 9 74
National Secondary 1 2 3 1 4 6 17
Total 12 14 18 9 23 15 91
14
Evaluation of Traffic Calming Schemes Implemented 1997 ndash 2002
32 Towns and Villages With Only One End Treated
At 33 of the 94 locations implemented between 1997 and 2002 only one approach to the town or village was treated with traffic calming within this period
In 8 of these cases the one approach treated was the only entry of that route into a large town or city or into a coastal town where the route ended
In 6 of these towns and villages the other approach had already been treated in previous years before 1997 and the second treatment completed the traffic calming for the location In 3 of these villages it was considered that the first phase of traffic calming would have had an effect on collisions in the very same area that was influenced by the second phase Thus the ldquobeforerdquo data for the second phase of work would not have been usable and it was not possible to evaluate changes in collision data These are the three locations that have been removed from the evaluation The other three towns were large enough for the areas of influence from each phase of traffic calming not to overlap and consequently the collision data was not influenced by the first phase
In 2 towns the traffic calming within the study period 1997 - 2002 was the first phase in a two phase implementation and the second approach has since been treated in subsequent years In each of these towns the two areas of influence from the separate phases of work are considered not to overlap and so these two have been included in the study
For each scheme the ldquoevaluated areardquo over which the traffic calming is considered to have had an effect on collisions is described in the scheme details in Appendix B
In the other 17 cases the decision to treat only one approach was generally taken because the other end of town was not considered a suitable case for traffic calming The reasons for this were varied but broadly fell into two different categories
a) An existing feature in the road such as a right angled bend narrow bridge or a roundabout already acted as a measure to slow approaching traffic such as the northern approach to Ardee on N2 or the southern approach to Crusheen on N18
b) Traffic approaching the town or village from this particular direction was observed to be travelling slowly in general and did not need to be slowed further Usually this was because another nearby town or village had effectively slowed the traffic down and drivers had not yet regained the feel of an open road and speeded up The western approach from Dromod to Roosky on N4 and the southern approach from Ennis to Barefield on N18 are examples of this
15
Evaluation of Traffic Calming Schemes Implemented 1997 ndash 2002
33 Different Designs of Scheme
As traffic calming schemes are made up of all the different elements described in section 22 there is a very large number of variations possible but the 91 schemes examined can be broadly divided into 10 different types as follows-
A Gateway with side buildouts and central island Definition inside village using central islands and narrowing with kerbs
B Gateway with side buildouts and central island Definition inside village using narrowing with kerbs but no islands
C Gateway with side buildouts and central island Definition inside village using line marking only
D Gateway with side buildouts and central island No definition inside village
E Gateway with side buildouts only Definition inside village using central islands and narrowing with kerbs
F Gateway with side buildouts only Definition inside village using narrowing with kerbs but no islands
G Gateway with side buildouts only Definition inside village using line marking only
H Gateway signs only Definition inside village using line marking only
I Gateway signs only No definition inside village
J No gateway Definition inside village using narrowing with kerbs but no islands
Table 34 shows the number of schemes in each category and whether the traffic calming was done at both ends of the town or village or whether it was installed only at one end Towns and villages where traffic calming was constructed at only one end are indicated in Figure 31 and in the appendices lists by (W) (N) (E) or (S) following the town name
Table 34 Types of traffic calming schemes
Type Treatment no of villages
both ends
one end
A Central island gateway central islands amp narrowing with kerbs inside 39 29 10
B Central island gateway narrowing with kerbs amp no islands inside 8 3 5
C Central island gateway and lining 5 5
D Central island gateway and nothing else 1 1
E Simple gateway central islands amp narrowing with kerbs insides 10 5 5
F Simple gateway narrowing with kerbs amp no islands inside 11 10 1
G Simple gateway and lining 5 2 3
H Gateway signs and lining 3 3
I Gateway signs and nothing else 8 6 2
J No gateway narrowing with kerbs amp no islands inside 1 1
Total 91 64 27
16
Evaluation of Traffic Calming Schemes Implemented 1997 ndash 2002
The largest single category is type A with a gateway with side buildouts and central island with a string of central islands through the village approach and in the centre and also narrowing from the side with kerb buildouts through the approach and centre Most of the 39 schemes in this category give the full impression of a village at the point of passing the gateway and most have footpaths throughout the scheme from gateway to gateway They all have street lighting through the entire scheme
Another 14 sites have the full gateway with a central island and side buildouts but do not have such extensive works inside the village These fall into categories B C and D Types A B C and D are generally on national primary routes very few are on secondary routes Figure 32 illustrates a typical gateway into such a village where the wide carriageway is narrowed by kerbing the hard shoulder and inserting a central island
Figure 32 Typical gateway for types A B C and D
The next two biggest single categories are type E with 10 schemes and type F with 11 schemes These types along with type G have a gateway that has no central island but which does narrow the road using kerbed buildouts at the side of the road usually in the hard shoulder Types E F and G were installed at towns where the width of the approach into town was wide enough to warrant traffic calming but was less than the 157m minimum needed to accommodate central island signs and cycle bypass Types E F and G have varying degrees of definition work inside the village similar to types A B and C Figure 33 illustrates a typical gateway into such a village where the wide carriageway is narrowed by kerbing the hard shoulder but there is no central island
Types H and I do not have physical works at the gateway at all Typically there is no hard shoulder at these sites and the gateway signs and transition zone signs are simply installed on the verge In type H schemes some visual narrowing has been implemented inside the village using line markings and hatching but in type I there is nothing done other than installation of the gateway and transition zone signs The one scheme that was installed on a dual carriageway approach to a city falls into the category of type H Figure 34 illustrates a typical gateway into such a village where there is no narrowing or kerbs installed just signs placed in the verge
17
Evaluation of Traffic Calming Schemes Implemented 1997 ndash 2002
Figure 33 Typical gateway for types E F and G
Figure 34 Typical gateway for types H and I
One scheme examined in this report had neither gateway signs nor transition zone installed However extensive works were done in the centre of the small village to narrow the carriageway and define the parking areas behind kerbs This village does not fall into any the other categories and is the only type J in the study
For the purposes of examining results types A B C and D can be grouped together as a ldquoCentral Island Gatewayrdquo category types E F and G can be grouped together as a ldquoSimple Gatewayrdquo category and types H and I can be grouped together as a ldquoSigns Onlyrdquo category
Table 35 shows the incidence of each type of traffic calming scheme on each national routes Although there is a wide spread of types across all roads it can be seen that types A B C and D are mostly on the national primary roads while types H and I are largely on the national secondary routes and those sections of national primaries where widening has not taken place
18
Evaluation of Traffic Calming Schemes Implemented 1997 ndash 2002
Table 35 Types of traffic calming schemes by route
Route Type of Scheme
A B C D E F G H I J No in Study
1 1 1 1 1 4
2 4 1 1 6
3 1 1
4 2 3 1 1 7
5 1 1 2
6 1 2 3
7 1 1 1 3
8 2 2
9 1 2 3
10 1 1 2
11 1 1 2
14 1 1
15 4 1 1 2 8
17 1 1 2
18 2 1 1 4
20 3 1 4
22 2 1 1 1 1 6
24 2 1 2 5
25 5 1 6
26 1 1
30 1 1 2
54 1 1
55 1 1
56 1 1
59 2 2
61 1 1
62 1 1
66 1 1
71 1 1 1 3
76 1 1
77 1 1
78 1 1
80 1 1
84 1 1
87 1 1
National Primary 34 6 3 1 7 11 5 2 4 1 74
National Secondary 5 2 2 3 1 4 17
Total 39 8 5 1 10 11 5 3 8 1 91
19
20
Evaluation of Traffic Calming Schemes Implemented 1997 ndash 2002
Evaluation of Traffic Calming Schemes Implemented 1997 ndash 2002
4 EFFECTIVENESS IN REDUCING COLLISIONS
41 Collisions Before and After Scheme Implementation Collision numbers were measured at each of the 91 locations for the 4 years before and 4 years after implementation of each individual scheme The ldquoafterrdquo period was taken as beginning in the year after the final year of construction as the full effect of the scheme would not be noticeable during construction works Details of the collision data for each site are given in Appendix C but summary tables are given in this chapter
42 Area of Influence of Traffic Calming Works Collision numbers for both before and after data were taken from the map-based NRA Collision Database Only collisions taking place on the national routes were considered and any collision that was located within the length of road influenced by the traffic calming was included in the data This area of influence extended to 200m outside each gateway in order to take account of the effect of the transition zone Where only one side of a village was treated the area taken was from the gateway to the centre of the town Where an existing traffic calming feature existed within the speed limited zone on the entry into a town such as a sharp bend or a narrow bridge the area of influence was assumed to extend only as far as that feature Descriptions of the area of influence for each location are given in the detailed list of locations in Appendix B
43 Control Data This report takes account of the main confounding factors affecting these statistics Collision numbers in general on Irelandrsquos national roads have decreased throughout the before and after periods for these schemes and the assessment makes allowances for this trend Changes in traffic volume in patterns of traffic flow in population distribution in Garda enforcement and in attitude to road safety have all had an effect on collision rates on national roads in towns and villages whether or not traffic calming has been installed This effect is accommodated by adjusting the before and after data in line with a comparison group the collisions in each 4 year before and after period within all similar sized towns and villages on all national roads
The general trend nationwide within all towns and villages in the control group has been a drop in collisions of roughly 15 between before and after periods However the reduction varies markedly between the different collision rates fatal collisions have reduced by a similar percentage to the general trend but serious injury accidents have reduced by over 40 and minor injuries have reduced by only about 10 All reductions in collisions at the sites assessed in this study have to be compared against this general nationwide trend of a shift from serious injury to minor injury
The effect of ldquoregression to meanrdquo is more difficult to make allowances for in this study The random nature of road crashes tends to cause collision frequencies at specific locations to fluctuate The selection of towns and villages for treatment on the basis of their past collision record can introduce a source of potential bias in measuring the effectiveness of the scheme This arises because the selection process tends to pick sites at the peak of their fluctuations in collision frequencies and such sites might well have experienced reductions in collision rate in following years even if no treatment had been applied (Rune Elvik 2002)
To allow for the effect of regression to mean the change in collision rates at treated sites would need to be compared with a number of similar untreated control sites This could not have been done in the case of the traffic calming programme as no such control sites exist Whenever a town or village with a collision history was identified it was put on the programme for treatment with traffic calming it would have been considered unacceptable to leave the location untreated simply for the purposes of research
21
Evaluation of Traffic Calming Schemes Implemented 1997 ndash 2002
44 Effect on Collision Occurrence
Table 41 shows for each yearrsquos programme of traffic calming schemes the collisions over the 4 years before and after each scheme
Table 41 Collisions before and after scheme implementation for each yearrsquos programme
Year No of
Schemes
4 Years Before 4 Years After
Fatal Serious Minor Total Fatal Serious Minor Total
1997 12 10 16 52 78 3 15 51 69
1998 14 5 8 31 44 2 6 30 38
1999 18 5 23 54 82 1 8 36 45
2000 9 2 4 27 33 3 6 19 28
2001 23 10 13 95 118 3 12 59 74
2002 15 4 8 41 53 3 5 40 48
Total 91 36 72 300 408 15 52 235 302
The reduction in collisions for each yearrsquos programme is shown in Table 42 as is the adjusted reduction allowing for the general drop in collisions over the study years in the control group of other similar sites Table 43 shows these adjusted drops in annual terms and in percentages
All this data for each individual scheme can be seen in Appendix C
There is considerable fluctuation in results between each yearrsquos programme of traffic calming so it is best to concentrate on the overall figures for the entire six years
Over all 91 sites there was a drop of 106 collisions from 408 to 302
When adjusted for the general nationwide fall in collisions on similar sites this gives a total drop of 433 colshylisions or 108 per year
This is a 13 reduction on the collision numbers before implementation of the schemes
Table 42 Collision reductions for each yearrsquos programme
Year No of
Schemes
4 Year Reduction 4 Year Reduction Adjusted
Fatal Serious Minor Total Fatal Serious Minor Total
1997 12 7 1 1 9 55 -64 06 -03
1998 14 3 2 1 6 18 -20 -12 -15
1999 18 4 15 18 37 30 50 140 220
2000 9 -1 -2 8 5 -14 -36 59 08
2001 23 7 1 36 44 65 -37 246 274
2002 15 1 3 1 5 11 07 -71 -52
Total 91 21 20 65 106 164 -100 368 433
22
Evaluation of Traffic Calming Schemes Implemented 1997 ndash 2002
Table 43 Annual collision reductions for each yearrsquos programme
Year No of
Schemes
Annual Drop in Collisions Adjusted Percentage Drop in Collisions
Fatal Serious Minor Total Fatal Serious Minor Total
1997 12 14 -16 01 -01 65 -74 1 -0
1998 14 05 -05 -03 -04 47 -51 -4 -4
1999 18 07 13 35 55 75 39 28 33
2000 9 -04 -09 15 02 -88 -55 24 3
2001 23 16 -09 62 69 68 -44 29 27
2002 15 03 02 -18 -13 27 13 -21 -12
Total 91 41 -25 92 108 52 -24 14 13
While collisions of all severity types at the examined locations have reduced in actual numbers the decrease in serious injury collisions at these sites has not followed the general trend nationwide over this period on national roads which have experienced a particularly large decrease in serious injury collisions When allowing for the trend in the control data the actual reduction of 20 serious injury collisions in a 4 year period translates to a relative increase of 10 collisions
Looking at each individual severity type the adjusted reduction in fatal collisions is 164 or 41 per year and that in minor injury collisions is 368 or 92 per year The adjusted change in serious injury collisions is an increase of 25 per year These numbers represent a 52 drop in fatal collisions a 14 drop in minor injury collisions and a 24 rise in serious injury collisions
The implementation of traffic calming has clearly had a much more marked effect on fatal collisions than on other injury collisions resulting in a lowering of the severity of collisions overall Table 44 below shows for each year each severity category as a percentage of overall collisions in the 4 years before implementation and the 4 years after implementation It can be seen that in general for each yearrsquos programme except for year 2000 the proportion of fatal collisions has roughly halved the proportion of serious collisions has stayed much the same while that of minor collisions has slightly increased Looking at the entire six yearsrsquo programme in the four years before implementation of each traffic calming scheme fatal collisions constituted 9 of all collisions in these towns and villages while serious and minor injury collisions were 18 and 73 of the total respectively In the four years after implementation fatal collisions decreased to 5 of all collisions serious reduced very slightly to 17 and minor rose to 78
Table 44 Severities as a percentage of all collisions for each yearrsquos programme
Year No of
Schemes
Percentage of all Collisions 4 years before
Percentage of all Collisions 4 years after
Fatal Serious Minor Fatal Serious Minor
1997 12 13 20 67 4 22 74
1998 14 11 18 71 5 16 79
1999 18 6 28 66 2 18 80
2000 9 6 12 82 11 21 68
2001 23 8 11 81 4 16 80
2002 15 8 15 77 6 11 83
Total 91 9 18 73 5 17 78
It can therefore be concluded that implementation of these traffic calming schemes has not only reduced the number of collisions overall but has also reduced the average severity of those collisions that did occur
23
Evaluation of Traffic Calming Schemes Implemented 1997 ndash 2002
45 Statistical Significance Statistical significance is difficult to achieve with locations that have such small numbers of individual collisions However the chi squared test was used to compare the results with the control data and the overall result for all sites indicates an 80 confidence level meaning that there is a 20 chance that the observed reduction in collisions is due to mere random fluctuation
46 Collision Costs and Economic Evaluation Collision costs are calculated using figures from the Goodbody report on Cost-Benefit Analysis of Transport Projects 2004 The ldquoWillingness To Payrdquo method of economic assessment has been used dividing the collisions into the separate categories of fatal serious injury and minor injury Table 45 lists the cost savings per year and Table 46 compares these with construction costs to give an average yearly rate of return for each yearrsquos programme of traffic calming
Table 45 Collision and cost saving for each yearrsquos programme
Year No of
Schemes
Drop in Annual Collisions adjusted
Annual Cost Saving from Drop in Collisions euro 2002 prices
Fatal Serious Minor Fatal Serious Minor Total
1997 12 14 -16 01 3138300 -487300 4300 2655300
1998 14 05 -05 -03 1029900 -155000 -9200 865600
1999 18 07 13 35 1689100 383100 105200 2177500
2000 9 -04 -09 15 -800900 -277800 44200 -1034500
2001 23 16 -09 62 3681900 -278700 184600 3587700
2002 15 03 02 -18 638100 56800 -53100 641800
Total 91 41 -25 92 9376400 -759100 276100 8893400
The annual cost saving from the drop in collisions over all 91 schemes is calculated to be approximately euro89 million Most of this saving comes from the drop in fatal collisions which is the group with the most significant fall proportionately a drop of 41 per year from 79 per year (both figures adjusted for the control data)
Table 46 Yearly rate of return
Year No of
Schemes
Annual Collision Cost Saving euro
2002 prices
Cost of Constr euro 2002 prices
Yearly Rate of Return
1997 12 2655300 3024600 88
1998 14 865600 1852900 47
1999 18 2177500 5369900 41
2000 9 -1034500 1882000 -55
2001 23 3587700 3881400 92
2002 15 641800 3446600 19
Total 91 8893400 19457200 46
The average yearly rate of return for each yearrsquos programme varies between 92 and a negative return of 55 but the average rate of return over all six years is 46
24
Evaluation of Traffic Calming Schemes Implemented 1997 ndash 2002
47 Results by Type of Scheme Tables 47 and 48 show the collision savings organised into the 10 different types of scheme and their groupings As guidance a description of the different types and groupings is repeated in Table 49
Once the 91 schemes are divided up into types the individual numbers of collisions and schemes become too small to give a reliable statistical result but a few facts are worth noting-
a) Types A B C and D are all having a positive effect on the number of collisions These all have a gateway with a central island and varying degrees of physical works inside the speed limited zone
Taken together as a group types A to D have a clearly positive result with on average 11 collisions per town or village saved over a 4 year period
b) Types E F and G taken together do not have such a clear result The 10 locations in category E experienced an average increase of nearly 1 collision over a 4 year period with collisions in all severity categories increasing while type G has a better result and appears to be performing nearly as well as types A to D Taken together as a group these schemes that have physical narrowing but no central island at the gateway seem to have had little effect on collision occurrence
c) Types H and I stand out as both having had no success at all with on average an increase of 12 collisions at each town or village over a four year period
Type H and type I are the very simplest types of scheme with no physical works done either at the gateway or throughout the village Gateway signs and transition zone signs were installed and in type H some lining was done through the village to define a narrow carriageway
Type I has usually been installed at villages where the road width was already narrow before implementation and neither further narrowing nor physical works could be done at these locations This is reflected in the low number of collisions at these sites before
implementation 14 over 8 sites which comes to roughly 2 collisions per site At other sites the average number of collisions per site before implementation was generally much higher than this The overall average across all 91 sites was approximately 5 collisions per site
d) Interestingly the one scheme alone in Type J appears to have worked This scheme had extensive kerbing and footpath works done at the centre of the small village to define the road edge and the central junction Footpaths and lighting were installed throughout the village from one speed limit to the other and there is a clear physical narrowing at the speed limit signs but no gateway signs or transition zone signs were installed so there is no narrowing in optical width on approach However as there is only one scheme in this category no real conclusions can be drawn about this design
25
Evaluation of Traffic Calming Schemes Implemented 1997 ndash 2002
Table 47 Drop in collisions by type of scheme
Type No in Study
All colls 4 years before
Drop in collisions (4 years adjusted) Annual cost saving euro
Fatal Serious Minor Total Tot per
site Total Per site
A 39 171 49 -19 347 377 10 2913300 74700
B 8 31 32 -12 78 98 12 1772300 221500
C 5 42 -02 13 80 91 18 42600 8500
D 1 8 -02 10 26 34 34 -40800 -40800
E 10 48 -11 -22 -56 -90 -09 -867800 -86800
F 11 55 58 -35 -49 -26 -02 2985200 271400
G 5 20 25 -09 28 43 09 1354000 270800
H 3 13 10 -37 -55 -82 -27 260900 87000
I 8 14 07 01 -59 -51 -06 366800 45900
J 1 6 00 11 27 38 38 106600 106600
Total 91 408 164 -100 368 433 05 8893400 Avge 97700
Table 48 Grouping type of scheme by type of gateway
Type No in Study
All colls 4 years before
Drop in collisions (4 years adjusted) Annual cost saving euro
Fatal Serious Minor Total Tot per
site Total Per site
Central Island
Gateway 53 252 76 -08 532 600 11 4687600 88400
Simple Gateway
26 123 71 -67 -77 -73 -03 3471500 133500
Signs Only
11 27 17 -36 -114 -133 -12 627800 57100
Type J 1 6 00 11 27 38 38 106600 106600
Total 91 408 164 -100 368 433 05 8893400 Avge 97700
Table 49 Types of scheme and their groupings
Type Treatment Group
A Central island gateway central islands amp narrowing with kerbs inside
Central Island Gateway
B Central island gateway narrowing with kerbs amp no islands inside
C Central island gateway and lining
D Central island gateway and nothing else
E Simple gateway central islands amp narrowing with kerbs insides Simple
GatewayF Simple gateway narrowing with kerbs amp no islands inside
G Simple gateway and lining
H Gateway signs and lining Signs Only
I Gateway signs and nothing else
J No gateway narrowing with kerbs amp no islands inside No Gateway
26
Evaluation of Traffic Calming Schemes Implemented 1997 ndash 2002
48 Results By Type of Collision Table 410 shows the before and after collisions each year for the three main types of collision pedestrian single vehicle and head on The drop shown in the table is an adjusted figure and is relative to the decrease in each of these types of collision in the control data throughout all similar towns and villages on national roads over the period examined
The results show that pedestrian collisions decreased overall by about 8 from a figure of 69 and head-on type collisions have decreased by about 14 from 45 These are quite significant decreases of about 13 and 29 respectively However there has been effectively no change in single vehicle collisions only a very small increase of negligible percentage change
Table 410 Type of collision
Year No of
Schemes
All collisions 4 years before Drop in collisions (4 years adjusted)
ped single veh head on ped single veh head on
1997 12 7 15 8 -70 -03 09
1998 14 3 3 7 -19 -34 -01
1999 18 18 13 7 93 59 13
2000 9 5 6 4 01 -20 12
2001 23 24 14 16 49 -10 132
2002 15 12 12 3 20 06 -30
Total 91 69 63 45 75 -02 135
Total Percentage Drop 13 -0 29
The greatest decrease is in head-on type collisions Head-on collisions are not a particularly significant proportion of all collisions within these towns and villages and before implementation of the traffic calming they constituted only about 11 of all of collisions However the reduction of 135 collisions over four years represents a 29 drop in this type of collision compared with figures before implementation which is a significant result This decrease can be directly attributed to the fundamental design of traffic calming in which the two directions of flow are divided by central kerbed islands and central hatched areas
Pedestrian collisions have also decreased Pedestrian collisions were about 19 of all collisions within these towns and villages and the drop of 13 in pedestrian collisions is much the same as the general drop of 13 in collisions overall within the treated towns Although this is a good result in that pedestrian collisions have decreased in treated towns and villages 13 more than they have decreased in other similar locations it is not as good as was expected It was assumed that the inherent ldquopedestrian friendlyrdquo nature of traffic calming with provision of footpaths and pedestrian crossings would have a comparatively greater effect on pedestrian collisions Examination of the individual collisions in the after period suggests that the increases in pedestrian collisions are occurring in only about a dozen of the 91 towns and villages and that half of these dozen have 3 or more pedestrian incidents in the four year after period There appears to be no correlation with the provision of a pedestrian crossing as part of the traffic calming scheme A more detailed study of these locations is needed to investigate pedestrian collisions further and to ascertain whether there is any link between the provision of either pedestrian crossings or footpaths and the decrease in pedestrian collisions
Single vehicle collisions have not changed at all in relation to the general decrease in single vehicle collisions in all similar towns and villages Single vehicle collisions are those involving only one vehicle Usually in single vehicle incidents the vehicle leaves the driving lane of the road and collides with a roadside object
27
Evaluation of Traffic Calming Schemes Implemented 1997 ndash 2002
Occasionally there is no collision with a roadside object but because of the difference in levels between road and surrounding ground the occupants are injured when the vehicle comes to a halt The lack of any significant change in the occurrence of single vehicle collisions could possibly be explained by the fact that implementation of traffic calming introduces many new objects into the roadside space and reduces the available width within the driving lane Thus when a driver does stray from the correct path there is less forgiveness in the roadside environment and the chances of leaving the defined driving lane or striking an object is increased The general decrease in collisions at traffic calming sites due to the reduced speed is offset by this increased chance of hitting a roadside object which has thus resulted in no change in the incidence of these types of collisions
49 Results for Towns and Villages Treated at One End Only At 27 of the 91 locations only one end of the town or village was treated with traffic calming In 8 of these cases these were entries into a large town or city or into a coastal town where the route ended at the remaining 19 locations there was a through route but only one half of the village was treated Table 411 shows the results arranged according to whether or not both ends of the town were treated
The previous report on traffic calming constructed between 1993 and 1996 concluded that villages which had traffic calming at only one end did not perform in evaluation as well as those where both ends were treated The results shown below repeat this phenomenon At the 27 locations where only one end of the town or village was treated collisions reduced only by an average of 8 while at the other 64 locations where both ends were treated the reduction in collisions was 14 on average
When the 8 ldquosingle entryrdquo locations are separated out it can be seen that these treatments worked better than the other 19 one-end towns and villages This can perhaps be explained by the fact that these 7 locations were put in place to reduce the speed of vehicles approaching the outskirts of large towns or cities and their effect is only required to act within the environs of the traffic calming works Once past the traffic calming scheme the traffic enters a congested network where speed is not a concern For these 8 sites it was only the short length immediately around the traffic calming works was that was evaluated in the study
Table 411 Division of schemes according to whether both ends were treated
Type No in study
All colls 4 years before
Drop in collisions (4 years adjusted) Percentage drops
Fatal Serious Minor Total Total
per site Fatal Serious Minor Total
Both Ends 64 310 130 -76 311 364 06 52 -24 15 14
Single Entry 8 31 06 08 47 61 08 38 29 22 23
Half 19 67 29 -32 11 08 00 59 -41 3 1
All One-end 27 98 35 -24 58 69 03 54 -22 9 8
Total 91 408 164 -100 368 433 05 52 -24 14 13
28
Evaluation of Traffic Calming Schemes Implemented 1997 ndash 2002
5 CASE STUDIES
51 Comparison of Types of Traffic Calming Schemes The results indicate that schemes that have a central island at the gateway types AB C and D as
described in section 33 are more effective at reducing collisions than those schemes that do not have censhytral islands Four schemes on N15 were chosen to illustrate the typical differences between these types of scheme so that the layout of a scheme that has succeeded in collision reduction can be compared with one
that has not
The schemes illustrated all on N15 and in County Donegal are Ballyshannon Ballybofey Killygordon Castlefinn
Schemes With Central Island Type Gateways
Ballybofey and Castlefinn are schemes of type A having a gateway with both side buildouts and central island Inside the village or town this definition is continued using central islands and narrowing with kerbs
Both of these sites have experienced a reduction in collisions as the figures for 4 year before and after periods show Castlefinn particularly has had a notable reduction very much larger than the average of 13 for all the sites in this study
TownVillage collisions before collisions after reduction (adjusted) Ballybofey 9 6 16 Castlefinn 4 1 72
Schemes With Signs Only at Gateways
Ballyshannon and Killygordon are schemes of type H having only signs and no physical works at the gateway Definition inside the town or village is given only by using road markings
None of these sites has experienced any significant reduction in collisions as the 4 year figures below show These locations have had a slight increase in collisions relative to the general decrease in collisions across all similar towns and villages in the control data
TownVillage collisions before collisions after reduction (adjusted) Ballyshannon 7 6 -4 (increase) Killygordon 2 2 -9 (increase)
Comparison of Ballyshannon and Ballybofey
Ballyshannon and Ballybofey are similar sized towns and before traffic calming was introduced had similar approaches In both towns the speed limit extends a long way outside the centre of town and the road was wide on these approaches Both towns have busy town centres with narrow streets where vehicle speeds are not particularly high but in the zone between gateway and town centre high speeds were a problem and were addressed by traffic calming
While Ballyshannon had no central island constructed at the gateway and was treated with only signs and line marking on these approaches Ballybofey was treated with a kerbed central island kerbs and footpaths to narrow the road and a string of further central islands between the gateway and the centre of town Figures 51 and 52 below illustrate this
29
Evaluation of Traffic Calming Schemes Implemented 1997 ndash 2002
Comparison of figures 51 and 52 shows that the optical width has been considerably narrowed in Ballybofey whereas the effect is not so marked in Ballyshannon Figures 53 and 54 show how in Ballybofey this narrowing is continued on for the 600m between gateway and town centre reinforcing the slowing down effect that drivers experienced at the gateway
The differences in design of the approaches to these towns may possibly account for the differences in collision occurrence after traffic calming implementation
Figure 51 Ballyshannon south approach
Figure 52 Ballybofey south approach
30
Evaluation of Traffic Calming Schemes Implemented 1997 ndash 2002
Figure 53 Ballybofey south zone inside gateway
Figure 54 Ballybofey south zone inside gateway
31
Evaluation of Traffic Calming Schemes Implemented 1997 ndash 2002
Comparison of Killygordon and Castlefinn
Killygordon and Castlefinn are located within 6km of each other on the most northern section of N15 with a much lower traffic volume than either Ballybofey or Ballyshannon The N15 along this section in general has a narrower cross section without hard shoulders
Killygordon is a small village and had narrow approaches even before implementation of the traffic calming and the low collision rate before implementation reflects this The minimal treatment to this village under the traffic calming programme did little to change the collision occurrence Castlefinn is a larger village and before implementation its approaches were wider than those to Killygordon The number of collisions in Castlefinn before implementation was twice that in Killygordon The construction of a kerbed central island kerbs and footpaths to narrow the road and a further central island at the centre of the village has evidently had an effect on collisions which have now reduced to numbers below that in Killygordon Figures 55 and 56 below illustrate the differences between the two villages at the gateway while Figures 57 and 58 illustrate the changed look of the centre of Castlefinn as a result of traffic calming construction
Figure 55 Killygordon west approach
Figure 56 Castlefinn west approach
32
Evaluation of Traffic Calming Schemes Implemented 1997 ndash 2002
Figure 57 Castlefinn centre before traffic calming
Figure 58 Castlefinn centre after traffic calming
33
Evaluation of Traffic Calming Schemes Implemented 1997 ndash 2002
Figure 59 Approach to a village similar to Grange before traffic calming
52 Successful Schemes
N15 Grange
Grange has had one of the greatest reductions in collisions in this study
Collisions in 4 years before 9 Collisions in 4 years after 2 reduction (adjusted) 75
Grange is on a busy section of N15 in County Sligo It is a medium sized village with shops pubs petrol station police station church and a few dozen dwelling houses all with frontage onto the national road It has two busy junctions with local primary distributor roads leading to a moderately populated hinterland in the summer the population increases significantly with holidaymakers visiting the coastal area
Traffic calming was installed in 2000 Before this the approaches to the village were wide with hard shoulshyders and this cross section continued through the length of the town On entering the village from the north the length within the built up area approaching the centre is downhill so that drivers would need constant concentration and awareness of their speed to achieve a reduction in speed and to maintain that reduction on this approach From the south there is also a downhill approach but outside the built up area so that speeds approaching the start of the speed limited zone were high
Although an appropriate photograph of Grange before construction of the traffic calming is not available the photograph below of a similar sized village on N24 with similar road widths is shown below in Figure 59
Grange was treated with kerbed central islands at each gateway kerbs and footpaths to narrow the road and a string of further central islands between the two gateways Driving lanes in each direction are now a constant 35m throughout the village A signalised controlled pedestrian crossing was also constructed at the centre of the town There are now footpaths for the entire length of village between gateways and as well as the controlled crossing there are several locations where pedestrians can cross the road with the aid of the central island refuges Figures 510 511 and 512 below illustrate the works
In the years since traffic calming was implemented further housing an industrial estate and commercial sites have been constructed in the vicinity Traffic volumes turning at the junction have increased substantially
34
Evaluation of Traffic Calming Schemes Implemented 1997 ndash 2002
Figure 510 Gateway at Grange with central Island ndash Viewed from inside the village
Figure 511 Approach to Grange village centre from the north
35
Evaluation of Traffic Calming Schemes Implemented 1997 ndash 2002
Figure 512 Grange village centre
In the four years before construction of traffic calming there were roughly 2 collisions each year in the vilshylage Four of the nine collisions were single vehicle incidents and two were pedestrian collisions both involving pedestrians attempting to cross the road Skidding occurred in six of the nine collisions which is an unusually large proportion and suggests that there was a high incidence of sudden braking from high speeds
In the four years after implementation of the scheme there have been only two collisions one in the village centre where the rear of a parked vehicle was hit and one single vehicle loss of control incident on the south approach to the village
N20 Newtwopothouse Newtwopothouse has also had a significant reduction in collisions in this study
Collisions in 4 years before 4
Collisions in 4 years after 0
reduction (adjusted) 100
Newtwopothouse is on a busy section of N20 in County Cork It is a tiny settlement on a staggered junction with only a pubcafe and a shoppost office having frontage onto the national road The bulk of the housing in the area is along the two side roads stretching a few hundred metres down each road and on the eastshyern side road there is a school about 100m from the N20 Before construction of the traffic calming it did not appear to the passing driver on N20 as if there were a village at all merely a crossroads However there was a fairly large volume of traffic turning to and from the two side roads and pedestrian traffic across the N20 between housing and school
Before implementation of traffic calming the road on approach to and through the location was wide being a standard 7m single carriageway with 3m hard shoulders Figures 513 and 515 show the location before traffic calming was installed
36
Evaluation of Traffic Calming Schemes Implemented 1997 ndash 2002
Figure 513 Approach to Newtwopothouse from north before traffic calming
Figure 514 Approach to Newtwopothouse from north
Traffic calming was implemented in 2001 Similarly to Grange Newtwopothouse was treated with kerbed central islands at each gateway kerbs and footpaths to narrow the road further central islands between the two gateways and a signalised controlled pedestrian crossing in the centre Driving lanes in each direction are now a constant 35m throughout the scheme and there is now lighting for the entire length between gateways and footpaths in the central stretch around the junction and bus stops Figures 514 and 516 below illustrate the works by showing the same locations as shown in Figures 513 and 515
37
Evaluation of Traffic Calming Schemes Implemented 1997 ndash 2002
Figure 515 Crossroads at Newtwopothouse before traffic calming
Figure 516 Crossroads at Newtwopothouse with pedestrian crossing
In the four years before construction of traffic calming there were 4 collisions at this location all of which involved turning at the junction
In the four years after implementation of the scheme there have been no collisions
38
Evaluation of Traffic Calming Schemes Implemented 1997 ndash 2002
6 CONCLUSIONS
61 Reduction in Collisions Between 1997 and 2002 there were 94 traffic calming schemes completed at towns and villages on the national roads
Over all the 91 studied locations comparing the 4 years before each scheme with the 4 years after there was a reduction of 106 collisions made up of 21 fatal collisions 20 serious injury collisions and 65 minor injury collisions
62 Reduction in Comparison with Control Data When comparing with the control data and allowing for the general decrease in collisions overall on national roads during this time period this translates to a reduction of 433 collisions This is made up of a reduction of 164 fatal collisions and 368 minor injury collisions and an increase of 100 serious collisions
These figures represent a 13 reduction in all collisions with fatal collisions reduced by 52 Serious and minor injury collisions together reduced by 9
63 Reduction in Severity of Collisions The implementation of traffic calming has therefore had the effect of reducing the number of crashes within the geographical areas of their influence Its more significant effect is in reducing the severity of collisions The percentage of all collisions that were fatal dropped from 9 in the 4 years before implementation to 5 in the 4 years after The percentage of minor injury collisions rose by a corresponding amount
64 Cost Benefit Analysis Using the ldquoWillingness to Payrdquo method of evaluation the average yearly rate of return over all the years evaluated is 46
65 Effects of Different Types of Schemes Traffic Calming Schemes that have a central island in the Gateway and continue this effect with solid central islands throughout the village are more effective in reducing collisions than those that do not
Schemes that consisted of only signs and had no physical works did not have any effect at all in reducing collisions
Traffic Calming Schemes where both ends of the town or village were treated were more effective in reducshying collisions than those where only one was treated
39
Evaluation of Traffic Calming Schemes Implemented 1997 ndash 2002
40
7
Evaluation of Traffic Calming Schemes Implemented 1997 ndash 2002
RECOMMENDATIONS
There are eight main recommendations that emerge from this study
1 The programme of traffic calming of towns and villages on national roads should be continued
2 The programme should be restricted to only towns and village where traffic calming is likely to have an impact
3 An updated priority list should be produced to identify those towns and villages where traffic calming is likely to have an impact
4 Prioritised towns and villages should have a) an injury collision record over the past 5 years that is higher than average b) 85 percentile speeds that are above the posted speed limit c) a physical layout that is possible to treat with traffic calming
5 Where traffic calming is implemented it should include a central island at the gateway and should include physical narrowings throughout the town or village No scheme should consist of just signs and road markings
6 At any location where traffic calming is being considered the existing vehicle speeds through the village must be surveyed
7 After each traffic calming scheme has been implemented the revised vehicle speeds through the village must be surveyed as soon as possible
8 A further study should examine in more detail the single vehicle accidents and pedestrian accidents that been identified in this study in treated villages and towns
41
Evaluation of Traffic Calming Schemes Implemented 1997 ndash 2002
42
Evaluation of Traffic Calming Schemes Implemented 1997 ndash 2002
REFERENCES
RS460 Evaluation of Traffic Calming Schemes Constructed on National Roads 1993-1996 National Roads Authority 2002
The Road to Safety Government Strategy for Road Safety 1998-2002 Department of the Environment and Local Government 1998
Road Safety Strategy Government Strategy for Road Safety 2004-2006 Department of Transport 2004
Road Safety Strategy 2007-2012 Road Safety Authority 2007
2005 Survey of Free Speeds (Urban and Rural) National Roads Authority 2006
Guidelines on Traffic Calming for Towns and Villages on National Routes National Roads Authority 2004
Reducing Traffic Injuries Resulting From Excess and Inappropriate Speed European Transport Safety Council 1995
The importance of confounding in observational before-and-after studies of road safety measures Rune Elvik Accident Analysis and Prevention 34(5) 2002
Parameter Values for Use in Cost-Benefit Analysis of Transport Projects Goodbody Economic Consultants 2004
43
Evaluation of Traffic Calming Schemes Implemented 1997 ndash 2002
44
Evaluation of Traffic Calming Schemes Implemented 1997 ndash 2002
Evaluation of Traffic Calming Schemes Implemented 1997 ndash 2002
APPENDIX A
Ranking of Sites According to Primary Criteria for Selection for Traffic Calming National Primary Routes Only
Route Town Village Population AADT Length Colls
over 5 yrs
Collisions per 10 million vehkm
Collisions per year per 1000
Population
+Combined Collision
Rate
N17 BALLINDINE 232 5058 0587 8 148 690 640
N25 KILRANE 214 5310 2255 10 46 935 559 N08 LITTLETON 566 5598 0591 10 166 353 508
N11 ASHFORD 500 12768 1352 19 60 760 501 N01 JULIANSTOWN 450 14270 1146 16 54 711 463
N05 FRENCHPARK 272 2994 0805 11 250 809 452
N02 COLLON 335 6164 0626 7 99 418 408 N18 KILCOLGAN 500 9565 0483 9 107 360 393
N08 WATERGRASSHILL 250 13706 0985 8 32 640 385 N01 CASTLEBELLINGHAM 762 10983 1891 20 53 525 368
N08 RATHCORMACK 500 11807 1158 11 44 440 308 N09 DUNGARVAN 500 3261 028 4 240 160 280
N04 DROMOD 250 3598 059 3 77 240 275 N20 CHARLEVILLE 3000 9655 1988 12 34 400 269
N25 LEMYBRIEN 222 6471 0918 4 37 360 254 N11 KILMACANOGE 763 26721 0692 13 39 341 247
N25 GLOUNTHAUNE 500 17499 0802 17 66 680 236
N07 MONEYGALL 344 6350 0576 4 60 233 236 N09 MULLINAVAT 283 3858 0925 7 107 495 231
N08 KILBEHENY 500 6897 0863 6 55 240 230 N02 CASTLEBLAYNEY 2938 4154 3525 21 79 143 229
N07 BORRIS IN OSSORY 500 7848 1141 7 43 280 226 N15 BUNDORAN 1463 7275 2371 17 54 232 224
N24 KILSHEELAN 435 4924 1027 5 54 230 223 N02 ARDEE 3604 7019 2394 24 78 133 223
N05 CHARLESTOWN 712 2956 125 5 74 140 219 N11 CAMOLIN 293 5192 1125 4 38 273 212
N06 CRAUGHWELL 232 7669 1558 4 18 345 209
N24 MONARD 500 5735 0392 3 73 120 206 N22 FARRANFORE 500 7614 1093 6 40 240 199
N21 ABBEYFEALE 1501 9982 3287 39 65 520 195 N15 GRANGE 500 6352 1427 6 36 240 193
N24 CARRICK ON SUIR 5143 4924 2903 20 77 078 192 N04 COLLOONEY 612 8617 0864 12 88 392 186
N18 BAREFIELD 500 5852 1087 5 43 200 186 N17 CLAREGALWAY 500 11128 166 7 21 280 182
N20 BALLYHAY 500 7440 0364 3 61 120 181 N14 CASTLEFINN 692 6024 0846 5 54 145 180
N26 FOXFORD 974 1928 1915 9 134 185 180
N18 ARDRAHAN 500 6650 0413 3 60 120 180 N02 ASHBOURNE 4411 10840 2792 30 54 136 177
N08 ABBEYLEIX 1299 8083 1778 11 42 169 169 N02 CARRICKMACROSS 3341 11436 2989 27 43 162 167
N11 OILGATE 262 6332 0393 2 44 153 164 N04 BALLINAFAD 500 3199 0239 2 143 080 163
N02 CASTLESHANE 250 5338 0875 5 59 400 159 N02 SLANE 699 6064 1885 13 62 372 155
N02 ANNAYALLA 500 5338 0655 6 94 240 154
N30 ENNISCORTHY 7655 3972 0565 6 146 016 150 N10 PAULSTOWN 234 4858 0753 2 30 171 145
A1
Evaluation of Traffic Calming Schemes Implemented 1997 ndash 2002
Route Town Village Population AADT Length Colls
over 5 yrs
Collisions per 10 million vehkm
Collisions per year per 1000
Population
+Combined Collision
Rate
N08 JOHNSTOWN 422 6063 1445 4 25 190 145 N07 TOOMYVARA 500 7606 069 7 73 280 143
N16 SLIGO 17302 5680 1796 25 134 029 142 N26 BALLINA 477 5398 1983 9 46 377 140
N16 GLENFARNE 500 1746 1846 5 85 200 135 N06 ROCHFORTBRIDGE 721 6202 1348 5 33 139 135
N24 LIMERICK JCN 250 5735 0698 4 55 320 135 N22 BALLINCOLLIG 12124 15125 6303 68 39 112 134
N24 FIDDOWN 500 4588 0966 6 74 240 134
N01 DROGHEDA 23914 19455 4526 79 49 066 131 N08 NEWINN 500 7163 0648 3 35 120 131
N15 STRANORLAR+BALLYBOFEY 2972 3337 3918 22 92 148 129 N14 LIFFORD 1359 3854 1151 4 49 059 128
N22 LISSARDA 500 7096 0696 6 67 240 127 N22 BALLYVOURNEY 500 3636 2786 8 43 320 123
N06 KILREEKILL 500 9055 059 3 31 120 122 N17 BELLAHY+CHARLESTOWN 712 3834 1103 3 39 084 120
N22 MACROOM 2363 7096 4588 31 52 262 118 N15 KILLYGORDON 500 6024 0493 2 37 080 114
N08 HORSEampJOCKEY 500 7607 026 3 83 120 113
N18 GORT 1093 7709 2855 16 40 293 113 N04 CLONARD 500 10570 0599 3 26 120 112
N02 EMYVALE 479 4073 0813 4 66 167 108 N05 BELLAVARY 500 5138 0633 4 67 160 107
N20 PATRICKSWELL 1019 14486 1742 15 33 294 106 N25 KILMEADAN 500 6177 1817 7 34 280 104
N24 PALLASGREEN 500 4638 0747 4 63 160 103 N15 BALLYSHANNON 2838 8955 2844 13 28 092 102
N21 TRALEE 17225 12840 1934 40 88 046 100 N03 KELLS 3539 8857 1737 10 36 057 099
N25 KILLEAGH 347 7244 1481 5 26 288 098
N24 BANSHA 293 4221 0855 3 46 205 097 N03 CARNAROSS 500 6683 0933 5 44 200 094
N02 MONAGHAN 5946 7630 3588 32 64 108 091 N24 CAHIR 2055 13277 2528 11 18 107 089
N01 DUNDALK 25843 22685 6273 153 59 118 089 N06 MILLTOWNPASS 500 6202 0733 4 48 160 088
N18 NEWMARKET-ON-FERGUS 1583 10584 1461 13 46 164 087 N17 CURRY 250 4585 0548 2 44 160 084
N03 CAVAN 5254 11709 236 28 56 107 082 N22 KILLARNEY 7275 9731 3819 19 28 052 082
N09 MOONE+TIMOLIN 500 6720 2231 6 22 240 082
N11 RATHNEW 1496 12736 1072 11 44 147 081 N15 DONEGAL 2193 6149 2053 12 52 109 079
N25 YOUGHAL 5828 7598 522 34 47 117 076 N03 DUNSHAUGHLIN 1275 15588 1458 6 14 094 076
N04 CARRICK ON SHANNON 2500 4257 2393 10 54 080 074 N06 BALLINASLOE 5812 9582 5241 37 40 127 072
N21 NEWCASTLE WEST 2500 7975 2766 16 40 128 072 N20 BUTTEVANT 1125 7440 1271 7 41 124 072
N15 SLIGO 17302 8932 1274 14 67 016 071 N15 DRUMCLIFF 500 9726 0737 2 15 080 071
N25 NEW ROSS 6079 6846 2424 17 56 056 070
A2
Evaluation of Traffic Calming Schemes Implemented 1997 ndash 2002
Route Town Village Population AADT Length Colls
over 5 yrs
Collisions per 10 million vehkm
Collisions per year per 1000
Population
+Combined Collision
Rate
N25 DUNGARVAN 6920 5688 4649 25 52 072 070
N20 CROOM 1090 5658 1036 5 47 092 070 N24 PILTOWN 717 4588 1166 4 41 112 069
N08 MITCHELSTOWN 3090 13395 2084 19 37 123 068 N07 MONASTEREVIN 2224 11968 1754 7 18 063 068
N15 CLIFFONEY 292 5089 0652 2 33 137 067 N09 GOWRAN 477 2517 0949 2 46 084 067
N08 FERMOY 4462 10622 2955 23 40 103 066 N04 RATHOWEN 500 5465 0439 1 23 040 066
N04 NEWTOWNFORBES 250 3711 1169 2 25 160 065 N30 NEW ROSS 6079 3514 2126 8 59 026 065
N07 NENAGH 5825 8352 2422 18 49 062 064
N07 MOUNTRATH 1375 6980 1827 8 34 116 063 N01 BALBRIGGAN 7724 13451 3226 33 42 085 063
N15 LISCOOLEY 500 6024 0423 2 43 080 063 N17 TOBERCURRY 1069 4585 2168 6 33 112 061
N03 NAVAN 11706 11782 4695 43 43 073 061 N04 ENFIELD 500 10570 1127 2 09 080 058
N30 CLONROCHE 500 2786 1049 2 37 080 057 N09 CARLOW 14027 9020 5154 37 44 053 057
N16 MANORHAMILTON 995 2393 1665 3 41 060 056 N24 MOONCOIN 500 8954 1507 2 08 080 056
N06 LOUGHREA 3271 8389 295 15 33 092 056
N06 MOATE 1529 5973 2482 4 15 052 056 N08 CULLAHILL 500 6063 051 1 18 040 055
N08 URLINGFORD 689 6407 1309 4 26 116 055 N08 CASHEL 2814 7238 2342 11 36 078 055
N11 GOREY 3840 13253 1949 16 34 083 055 N11 FERNS 859 5192 0974 3 33 070 050
N18 ENNIS 16058 13516 7938 59 30 073 049 N23 CASTLEISLAND 2207 3515 0727 2 43 018 047
N05 BELLANAGARE 500 2309 0639 1 37 040 047 N04 KINNEGAD 415 6954 2589 3 09 145 045
N09 CASTLEDERMOT 741 6112 2144 4 17 108 044
N11 ARKLOW 7987 12321 3857 24 28 060 043 N18 CRUSHEEN 500 5852 0853 1 11 040 042
N03 VIRGINIA 720 6683 1261 3 20 083 040 N05 BALLAGHADERREEN 1270 4251 2127 4 24 063 040
N07 BALLYBRITTAS 500 10826 0524 1 10 040 039 N06 TYRRELLSPASS 376 6707 1407 1 06 053 038
N11 ENNISCORTHY 7655 7570 1269 6 34 016 038 N04 SLIGO 17964 15138 3821 31 29 035 038
N24 TIPPERARY 4963 11547 2213 12 26 048 038 N26 SWINFORD 1216 1928 1963 2 29 033 037
N07 BIRDHILL 500 9770 0702 2 16 080 036
N07 KILDARE 4196 14907 2763 14 19 067 035 N20 MALLOW 7521 10164 2681 13 26 035 035
N05 STROKESTOWN 568 2809 2371 2 16 070 034 N10 KNOCKTOPHER 500 2734 0841 1 24 040 034
N17 TUAM 5540 10723 305 13 22 047 034 N04 EDGEWORTHSTOWN 801 5520 2094 3 14 075 033
N04 BALLYSADARE 500 8617 0996 2 13 080 033 N10 STONYFORD 500 3401 0717 1 22 040 032
A3
Evaluation of Traffic Calming Schemes Implemented 1997 ndash 2002
Route Town Village Population AADT Length Colls
over 5 yrs
Collisions per 10 million vehkm
Collisions per year per 1000
Population
+Combined Collision
Rate
N21 CASTLEISLAND 2207 5467 1873 4 21 036 030
N07 PORTLAOISE 8360 12097 501 19 17 045 029 N09 THOMASTOWN 2512 3261 2244 3 22 024 028
N05 TULSK 500 2220 1432 1 17 040 027 N25 SWEEP 500 4274 0755 1 17 040 027
N06 GALWAY 60000 24461 5106 50 22 017 026 N03 DROLCHEAD NUA 11778 5345 04 1 26 002 026
N03 BELTURBET 1223 3316 1868 2 18 033 026 N08 DURROW 721 7244 1338 2 11 055 025
N05 WESTPORT 3688 12879 1194 5 18 027 025 N19 SHANNON 7920 14965 05 3 22 008 024
N21 ADARE 500 3348 1288 1 13 040 023
N07 ROSCREA 4231 7718 3502 7 14 033 022 N17 KNOCK 440 3958 1251 1 11 045 022
N10 KILKENNY 17669 7149 3379 8 18 009 020 N13 STRANORLAR 2972 7141 0925 2 17 013 020
N20 LIMERICK 75000 20672 6595 42 17 011 020 N24 CLONMEL 15562 7270 5907 12 15 015 019
N13 BRIDGE END 500 8153 075 1 09 040 019 N05 CASTLEBAR 7648 7442 3988 7 13 018 018
N17 CLAREMORRIS 1907 5058 1868 2 12 021 017 N24 OOLA 474 4864 1937 1 06 042 016
N07 LIMERICK 75000 15709 10841 41 13 011 016
N21 TEMPLEGLANTINE 819 6759 0828 1 10 024 016 N17 GALWAY 60000 27843 3176 20 12 007 014
N05 LONGFORD 6824 6874 4021 5 10 015 014 N07 DUBLIN 500000 47272 2387 22 11 001 011
N04 BOYLE 2197 3199 2036 1 08 009 011 N11 DUBLIN 500000 40055 13999 95 09 004 010
N04 DUBLIN 500000 29736 9209 42 08 002 009 N18 LIMERICK 75000 27171 5095 17 07 005 008
N09 WATERFORD 75000 14883 1693 3 07 001 007 N50 DUBLIN 600000 18676 124 10 02 000 002
N24 LIMERICK 75436 10740 3098 1 02 000 002
N08 CORK 136000 32213 414 2 01 000 001 N22 CORK 136000 25429 3556 1 01 000 001
N09 BALLYHALE 500 3858 0867 0 00 000 000 N17 BALLYNACARROW 500 3807 0798 0 00 000 000
N04 BALLYNALACK 500 5465 0748 0 00 000 000 N03 BALLYSHANNON 2838 3088 0899 0 00 000 000
N05 CARRACASTLE 500 2956 1215 0 00 000 000 N04 CASTLEBALDWIN 500 3199 0252 0 00 000 000
N18 CLARINBRIDGE 500 9565 1417 0 00 000 000 N20 CORK 136000 15947 4267 0 00 000 000
N27 CORK 136000 13277 3778 0 00 000 000
N01 DUBLIN 500000 28975 4298 0 00 000 000 N02 DUBLIN 500000 11524 6397 0 00 000 000
N03 DUBLIN 500000 21436 4357 0 00 000 000 N06 HORSELEAP 500 6769 0735 0 00 000 000
N06 KILBEGGAN 617 6707 1286 0 00 000 000 N14 LETTERKENNY 10726 15411 093 0 00 000 000
N17 MILLTOWN 500 5467 0869 0 00 000 000 N21 PATRICKSWELL 1019 3348 0274 0 00 000 000
A4
Evaluation of Traffic Calming Schemes Implemented 1997 ndash 2002
Route Town Village Population AADT Length Colls
over 5 yrs
Collisions per 10 million vehkm
Collisions per year per 1000
Population
+Combined Collision
Rate
N09 PAULSTOWN 234 6653 0721 0 00 000 000
N04 ROOSKY 249 3827 0696 0 00 000 000 N28 SHANBALLY 500 5098 0506 0 00 000 000
N05 TERMONBARRY 500 3366 098 0 00 000 000 N25 WATERFORD 41853 10668 8427 0 00 000 000
N25 BALLINABOOLA N25 BARNTOWN
N07 DALYS CROSS N18 GORT RD ENNIS
N20 NEWTWOPOTHOUSE N08 RINGASKIDDY
+ Combined Collision Rate [Coll Rate 10mvehkmyr5 + Coll Rate 1000popyr2]2 These towns and villages were not assessed as funding was already committed
A5
Evaluation of Traffic Calming Schemes Implemented 1997 ndash 2002Evaluation of Traffic Calming Schemes Implemented 1997 ndash 2002
Evaluation of Traffic Calming Schemes Implemented 1997 ndash 2002
51
Appendix B Evaluation of Traffic Calming Schemes Implemented 1997 ndash 2002
APPENDIX B Scheme Details for All Sites
Scheme Local Authority Rte Both or Half Spd Lim Type Colls 4 yrs before raw
Colls 4 yrs after raw
Drop in Ann Colls Adj for
All Nats Area Evaluated Year
Finished Year
Started Year
Bypassed Year
Changed Total Cost in 2002 Prices
Carrickarnon Louth 1 both 60 F 15 10 079 Gate - Gate 2001 2007 109400
Greengates Louth 1 both 40 B 8 2 130 Gate - Gate 1997 2002 489900 KilsaranCastlebellingham Louth 1 both 30 A 23 10 260 Gate - Gate 1997 1997 2002 255600
Julianstown Meath 1 both 30 C 13 10 024 Gate - Gate 1999 1999 2003 767700 Emyvale Monaghan 2 both 30 F 5 7 -065 Gate - Gate 2001 46500
Castleblaney (N) Monaghan 2 2nd half 40 A 3 5 -073 Gate - Bend 2000 2000 2007 132300
Carrickmacross (N) Monaghan 2 half 40 A 7 4 008 Gate - Bend 1998 1998 2005 92500 Ardee (S) Louth 2 half 30 A 4 9 -152 Gate - R170 Jcn 1997 1997 238300
Collon Louth 2 both 30 E 6 7 -038 Gate - Gate 1997 1996 251600 Slane Meath 2 both 30 A 8 5 048 Gate - Gate 2002 2001 534500
Kells Meath 3 both 30 A 8 8 -024 Gate - Gate 2001 730900 Castlebaldwin Sligo 4 both 30 A 5 2 062 Gate - Gate 1999 1998 547500
Dromod Leitrim 4 both 30 B 1 3 -052 Gate - Gate 2000 1999 2008 418300 Roosky (E) Leitrim 4 half 30 B 1 -025 Gate - Centre 1998 1997 2008 123300
Newtownforbes (E) Longford 4 1st half 30 F 1 2 -028 Gate - Bend 2001 2003 73800 Rathowen Westmeath 4 both 30 A 1 1 -002 Gate - Gate 1999 1999 369400
Clonard (E) Meath 4 half 40 B 1 1 -000 Gate - Centre 1997 2006 53200
Enfield Meath 4 both 30 C 8 2 114 Gate - Gate 1999 1998 2002 73900 CharlestownBellahy (WN) Mayo 5 half 30 A 7 132 Gates - Centre 1999 1998 2008 523400
Frenchpark Roscommon 5 both 30 F 5 3 032 Gate - Gate 2001 133600 Craughwell Galway 6 both 40 F 6 6 -015 Gate - Gate 2000 1999 30600
Rochfordbridge Westmeath 6 both 30 A 7 5 037 Gate - Gate 1998 1998 2006 199600 Miltownpass Westmeath 6 both 40 F 1 1 -002 Gate - Gate 2000 2000 2006 2005 248000
B1
Appendix B Evaluation of Traffic Calming Schemes Implemented 1997 ndash 2002
Scheme Local Authority Rte Both or Half Spd Lim Type Colls 4 yrs before raw
Colls 4 yrs after raw
Drop in Ann Colls Adj for
All Nats Area Evaluated Year
Finished Year
Started Year
Bypassed Year
Changed Total Cost in 2002 Prices
Moneygall Offaly 7 both 30 C 2 4 -056 Gate - Gate 2001 1997 2002 410900 Ballybrittas Laois 7 both 40 A 5 3 025 Gate - Gate 2002 2005 197900
Monasterevin (W) Kildare 7 half 30 G 4 1 064 Gate - Bridge 1998 1998 2005 29900
Cullahill Laois 8 both 40 A 1 2 -027 Gate - Gate 2000 1999 134200 Abbeyleix (S) Laois 8 half 30 A 1 4 -077 Gate - Centre 2000 2000 330700
Mullinavat (N) Kilkenny 9 half 30 G 6 3 057 Gate - Centre 2001 96600 Dungarvan Kilkenny 9 both 40 G 1 2 -028 Gate - Gate 2001 212700
Paulstown Kilkenny 9 both 30 A 2 046 Gate - Gate 1999 1998 184700 Kilkenny (E) Kilkenny 10 single entry 30 B 10 3 133 Gate - Centre 2001 195200
Claragh Kilkenny 10 both 60 F 2 2 -016 Gate - Gate 1999 206500 Camolin Wexford 11 both 30 A 5 1 073 Gate - Gate 2002 581000
Ashford Wicklow 11 both 30 E 16 7 160 Gate - Gate 1999 1998 2004 92300 Lifford (N amp W) Donegal 14 both 30 A 10 5 095 Gate - Gate 2001 70400
Castlefinn Donegal 15 both 30 A 4 1 063 Gate - Gate 2001 127500
Killygordon Donegal 15 both 30 H 2 2 -004 Gate - Gate 2002 113300 Ballybofey (S) Donegal 15 half 40 A 9 6 029 Gate - Centre 2002 246400
Ballyshannon (S) Donegal 15 2nd half 40 G 7 6 -006 Gate - Bridge 1997 1996 2006 159700 Bundoran Donegal 15 both 40 H 9 15 -163 Gate - Gate 1997 2006 41900
Cliffony Sligo 15 both 30 A 2 1 019 Gate - Gate 2001 143800 Grange Sligo 15 both 30 A 9 2 149 Gate - Gate 2000 1999 172500
Drumcliffe Sligo 15 both 30 F 7 5 033 Gate - Gate 2000 1999 259100 Ballindine Mayo 17 both 30 E 3 6 -091 Gate - Gate 1997 1997 106500
Claregalway Galway 17 both 30 A 3 7 -116 Gate - Gate 1998 1997 328300 Kilcolgan Galway 18 both 40 E 8 8 -042 Gate - Gate 1999 1999 2003 46200
Ardrahan Galway 18 both 30 J 6 1 096 Gate - Gate 1999 1999 46200
Crusheen (N) Clare 18 half 30 E 1 -025 Gate - Bend 1998 1997 2003 251400 Barefield (N) Clare 18 half 40 G 2 1 021 Gate - Centre 1998 1997 2007 251400
B2
Appendix B Evaluation of Traffic Calming Schemes Implemented 1997 ndash 2002
Scheme Local Authority Rte Both or Half Spd Lim Type Colls 4 yrs before raw
Colls 4 yrs after raw
Drop in Ann Colls Adj for
All Nats Area Evaluated Year
Finished Year
Started Year
Bypassed Year
Changed Total Cost in 2002 Prices
Charleville (S) Cork 20 1st half 30 A 2 2 -006 Gate - Ped X 2001 2004 165400
Ballyhea Cork 20 both 40 A 1 -025 Gate - Gate 1999 1999 784900
Newtwopothouse Cork 20 both 40 A 4 084 Gate - Gate 2001 165400
Cork (N) Cork 20 single entry 40 I 1 2 -030 Gate - Ped X 2002 239700
Farranfore Kerry 22 both 30 F 4 5 -032 Gate - Gate 1998 1998 2003 20000
Killarney (E) Kerry 22 single entry 40 D 8 3 085 Gate - Rbt 1998 1998 59900
Ballyvourney Cork 22 both 30 E 3 6 -090 Gate - Gate 2002 2001 570300
Lissarda Cork 22 both 40 A 4 4 -022 Gate - Gate 2002 333900
Ballincollig (W) Cork 22 half 30 B 10 8 041 Gate - Rbt 1997 1997 2004 496300
Cork (W) Cork 22 single entry 30 A 000 Gate - Vic X 1999 2004 193900
Monard South Tipperary 24 both 30 I 1 -025 Gate - Gate 1998 1998 39300
Bansha South Tipperary 24 both 30 I 2 2 -004 Gate - Gate 2001 138400
Kilsheelan South Tipperary 24 both 30 A 2 043 Gate - Gate 1999 1997 2007 194500
Carrick-on-Suir (W) South Tipperary 24 2nd half 30 A 3 066 Gate - Mini Rbt 2001 211900
Mooncoin Kilkenny 24 both 30 F 5 8 -088 Gate - Gate 1998 1998 140000
Lemybrien Waterford 25 both 40 A 1 1 -002 Gate - Gate 1998 1997 165700
Waterford (E) Kilkenny 25 single entry 30 A 5 1 084 Gate - Rbt 1997 1997 63900
Ballinaboola Wexford 25 both 30 A 3 3 -024 Gate - Gate 1999 1999 554100
Barntown Wexford 25 both 40 A 1 2 -037 Gate - Gate 1997 1997 639000
Kilrane (W) Wexford 25 half 30 A 4 4 -025 Gate - Speed Lim 1999 1998 2004 300400
Rosslare Harbour (W) Wexford 25 single entry 15 E 000 Gate - Harbour 2001 2004 16000
Foxford Mayo 26 both 30 I 6 1 083 Gate - Gate 2001 33300
B3
Appendix B Evaluation of Traffic Calming Schemes Implemented 1997 ndash 2002
Scheme Local Authority Rte Both or Half Spd Lim Type Colls 4 yrs before raw
Colls 4 yrs after raw
Drop in Ann Colls Adj for
All Nats Area Evaluated Year
Finished Year
Started Year
Bypassed Year
Changed Total Cost in 2002 Prices
Clonroche Wexford 30 both 30 F 4 2 035 Gate - Gate 2001 20400
New Ross (N) Wexford 30 both 30 A 2 4 -060 Gate - Gate 2002 47500
Smithborough (W) Monaghan 54 half 30 A 2 1 019 Gate - Centre 2001 56900
Carrickboy Longford 55 both 40 H 2 3 -037 Gate - Gate 2002 57100
Gortahork Donegal 56 both 30 I 1 5 -105 Gate - Gate 2002 45500
Dromore West Sligo 59 both 30 A 4 084 Gate - Gate 2000 156200
Ballisodare Sligo 59 both 30 A 000 Gate - Speed Lim 2002 1997 142700
Hodson Bay Roscommon 61 both 40 A 5 112 Gate - Gate 2001 432500
Birr Offaly 62 both 30 C 15 9 087 Gate - Gate 2001 94700
Loughrea (W) Galway 66 single entry 30 I 1 3 -052 Gate - N6 Jcn 1999 1999 55400
Ballylickey Cork 71 both 40 I 1 2 -037 Gate - Gate 1997 228500
Bantry (N) Cork 71 half 30 E 5 5 -027 Gate - Centre 2002 115600
Clonakilty Cork 71 both 30 C 4 1 059 Gate - Gate 1999 331600
Grangemockler South Tipperary 76 both 30 I 2 042 Gate - Gate 1998 1998 2003 51900
Kilkenny (N) Kilkenny 77 single entry 30 E 6 8 -068 Gate - Centre 2001 195200
Newtown Laois 78 both 40 A 5 1 073 Gate - Gate 2002 181400
Killeigh Offaly 80 both 30 B 000 Gate - Gate 1999 1999 97400
Kilmaine (N) Mayo 84 half 30 B 1 019 Gate - R332 Jcn 1998 99800
Swanlinbar (S) Cavan 87 half 30 E 1 1 -005 Gate - Centre 2002 39900
B4
Appendix C
Evaluation of Traffic Calming Schemes Implemented 1997 ndash 2002 APPENDIX C Collision Data Cost Data and First Year Rate of Return for All Sites
Location Rte Yr Construction Cost
4 Years Before 4 Years After Drop in Annual Collisions adjusted Cost Saving from Drop in Collision
Yearly Rate of Return
F S M Tot F S M Tot F S M Tot F S M Tot
Carrickarnon 1 01 109400 3 1 11 15 1 1 8 10 046 -009 042 079 1047600 -27300 12600 1032900 944
Greengates 1 97 489900 2 1 5 8 0 0 2 2 043 013 074 130 969700 40900 22200 1032800 211
KilsaranCastlebellingham 1 97 255600 1 5 17 23 1 0 9 10 -004 067 197 260 -85200 204700 59000 178500 70
Julianstown 1 99 767700 0 3 10 13 1 1 8 10 -025 017 032 024 -570000 53300 9500 -507200 -66
Emyvale 2 01 46500 0 0 5 5 0 2 5 7 000 -050 -015 -065 0 -152300 -4500 -156800 -337
Castleblaney (N) 2 00 132300 0 2 1 3 0 2 3 5 000 -021 -052 -073 0 -62800 -15600 -78400 -59
Carrickmacross (N) 2 98 92500 0 5 2 7 0 0 4 4 000 062 -054 008 0 188700 -16100 172600 187
Ardee (S) 2 97 238300 1 2 1 4 1 4 4 9 -004 -073 -075 -152 -85200 -222700 -22600 -330500 -139
Collon 2 97 251600 0 1 5 6 0 3 4 7 000 -062 024 -038 0 -187500 7200 -180300 -72
Slane 2 02 534500 3 2 3 8 0 0 5 5 077 036 -065 048 1761000 109400 -19400 1851000 346
Kells 3 01 730900 0 0 8 8 1 1 6 8 -025 -025 026 -024 -570000 -76200 7800 -638400 -87
Castlebaldwin 4 99 547500 1 0 4 5 0 0 2 2 020 000 043 062 451800 0 12800 464600 85
Dromod 4 00 418300 0 0 1 1 0 2 1 3 000 -050 -002 -052 0 -152300 -600 -152900 -37
Roosky (E) 4 98 123300 0 0 0 0 0 0 1 1 000 000 -025 -025 0 0 -7500 -7500 -6
Newtownforbes (E) 4 01 73800 0 0 1 1 0 0 2 2 000 000 -028 -028 0 0 -8400 -8400 -11
Rathowen 4 99 369400 0 0 1 1 0 1 0 1 000 -025 023 -002 0 -76200 6900 -69300 -19
Clonard (E) 4 97 53200 0 0 1 1 0 0 1 1 000 000 -000 -000 0 0 -100 -100 -0
Enfield 4 99 73900 1 2 5 8 0 0 2 2 020 028 066 114 451800 86300 19700 557800 755
CharlestownBellahy (WN) 5 99 523400 1 3 3 7 0 0 0 0 020 042 069 132 451800 129400 20800 602000 115
Frenchpark 5 01 133600 2 1 2 5 0 1 2 3 047 -009 -006 032 1078400 -27300 -1800 1049300 785
Craughwell 6 00 30600 1 0 5 6 0 0 6 6 020 000 -035 -015 454600 0 -10400 444200 1452
Rochfordbridge 6 98 199600 0 0 7 7 0 0 5 5 000 000 037 037 0 0 11200 11200 6
Miltownpass 6 00 248000 0 0 1 1 0 0 1 1 000 000 -002 -002 0 0 -600 -600 -0
Moneygall 7 01 410900 0 0 2 2 0 2 2 4 000 -050 -006 -056 0 -152300 -1800 -154100 -38
C1
Appendix C Evaluation of Traffic Calming Schemes Implemented 1997 ndash 2002
Location Rte Yr Construction Cost
4 Years Before 4 Years After Drop in Annual Collisions adjusted Cost Saving from Drop in Collision
Yearly Rate of Return
F S M Tot F S M Tot F S M Tot F S M Tot
Ballybrittas 7 02 197900 0 0 5 5 0 0 3 3 000 000 025 025 0 0 7600 7600 4
Monasterevin (W) 7 98 29900 1 0 3 4 0 0 1 1 019 000 045 064 434000 0 13400 447400 1496
Cullahill 8 00 134200 0 0 1 1 1 0 1 2 -025 000 -002 -027 -570000 0 -600 -570600 -425
Abbeyleix (S) 8 00 330700 0 0 1 1 0 1 3 4 000 -025 -052 -077 0 -76200 -15600 -91800 -28
Mullinavat (N) 9 01 96600 0 0 6 6 0 0 3 3 000 000 057 057 0 0 17100 17100 18
Dungarvan 9 01 212700 0 0 1 1 0 0 2 2 000 000 -028 -028 0 0 -8400 -8400 -4
Paulstown 9 99 184700 0 0 2 2 0 0 0 0 000 000 046 046 0 0 13900 13900 8
Kilkenny (E) 10 01 195200 0 2 8 10 0 1 2 3 000 007 126 133 0 21600 37800 59400 30
Claragh 10 99 206500 1 1 0 2 0 0 2 2 020 014 -050 -016 451800 43100 -15000 479900 232
Camolin 11 02 581000 0 1 4 5 0 0 1 1 000 018 055 073 0 54700 16600 71300 12
Ashford 11 99 92300 0 4 12 16 0 1 6 7 000 032 128 160 0 96400 38400 134800 146
Lifford (N amp W) 14 01 70400 0 0 10 10 0 0 5 5 000 000 095 095 0 0 28500 28500 40
Castlefinn 15 01 127500 0 0 4 4 0 0 1 1 000 000 063 063 0 0 18900 18900 15
Killygordon 15 02 113300 1 0 1 2 0 0 2 2 026 000 -030 -004 587000 0 -9000 578000 510
Ballybofey (S) 15 02 246400 0 1 8 9 0 1 5 6 000 -007 036 029 0 -21500 10700 -10800 -4
Ballyshannon (S) 15 97 159700 2 2 3 7 0 1 5 6 043 002 -051 -006 969700 5700 -15200 960200 601
Bundoran 15 97 41900 0 1 8 9 0 4 11 15 000 -087 -077 -163 0 -263700 -23000 -286700 -684
Cliffony 15 01 143800 0 0 2 2 0 1 0 1 000 -025 044 019 0 -76200 13200 -63000 -44
Grange 15 00 172500 0 1 8 9 1 0 1 2 -025 015 159 149 -570000 44800 47800 -477400 -277
Drumcliffe 15 00 259100 1 0 6 7 1 1 3 5 -005 -025 063 033 -115400 -76200 19000 -172600 -67
Ballindine 17 97 106500 1 1 1 3 0 2 4 6 021 -037 -075 -091 484800 -111400 -22600 350800 329
Claregalway 17 98 328300 0 1 2 3 0 2 5 7 000 -038 -079 -116 0 -114600 -23600 -138200 -42
Kilcolgan 18 99 46200 0 3 5 8 0 1 7 8 000 017 -059 -042 0 53300 -17800 35500 77
Ardrahan 18 99 46200 0 2 4 6 0 0 1 1 000 028 068 096 0 86300 20300 106600 231
Crusheen (N) 18 98 251400 0 0 0 0 0 1 0 1 000 -025 000 -025 0 -76200 0 -76200 -30
Barefield (N) 18 98 251400 0 0 2 2 0 1 0 1 000 -025 046 021 0 -76200 13900 -62300 -25
Charleville (S) 20 01 165400 0 0 2 2 0 1 1 2 000 -025 019 -006 0 -76200 5700 -70500 -43
C2
Appendix C Evaluation of Traffic Calming Schemes Implemented 1997 ndash 2002
Location Rte Yr Construction Cost
4 Years Before 4 Years After Drop in Annual Collisions adjusted Cost Saving from Drop in Collision
Yearly Rate of Return
F S M Tot F S M Tot F S M Tot F S M Tot
Ballyhea 20 99 784900 0 0 0 0 0 0 1 1 000 000 -025 -025 0 0 -7500 -7500 -1
Newtwopothouse 20 01 165400 1 1 2 4 0 0 0 0 024 016 044 084 539200 48900 13200 601300 364
Cork (N) 20 02 239700 0 0 1 1 0 0 2 2 000 000 -030 -030 0 0 -9000 -9000 -4
Farranfore 22 98 20000 0 0 4 4 0 0 5 5 000 000 -032 -032 0 0 -9700 -9700 -49
Killarney (E) 22 98 59900 1 2 5 8 1 0 2 3 -006 025 066 085 -136000 75500 19800 -40700 -68
Ballyvourney 22 02 570300 0 0 3 3 2 0 4 6 -050 000 -040 -090 -1140000 0 -11900 -1151900 -202
Lissarda 22 02 333900 0 1 3 4 0 1 3 4 000 -007 -015 -022 0 -21500 -4400 -25900 -8
Ballincollig (W) 22 97 496300 2 0 8 10 1 0 7 8 018 000 023 041 399700 0 7000 406700 82
Cork (W) 22 99 193900 0 0 0 0 0 0 0 0 000 000 000 000 0 0 0 0 0
Monard 24 98 39300 0 0 0 0 0 0 1 1 000 000 -025 -025 0 0 -7500 -7500 -19
Bansha 24 01 138400 1 0 1 2 0 1 1 2 024 -025 -003 -004 539200 -76200 -900 462100 334
Kilsheelan 24 99 194500 1 0 1 2 0 0 0 0 020 000 023 043 451800 0 6900 458700 236
Carrick-on-Suir (W) 24 01 211900 0 0 3 3 0 0 0 0 000 000 066 066 0 0 19800 19800 9
Mooncoin 24 98 140000 1 0 4 5 1 1 6 8 -006 -025 -057 -088 -136000 -76200 -17200 -229400 -164
Lemybrien 25 98 165700 0 0 1 1 0 1 0 1 000 -025 023 -002 0 -76200 7000 -69200 -42
Waterford (E) 25 97 63900 1 1 3 5 0 0 1 1 021 013 049 084 484800 40900 14800 540500 846
Ballinaboola 25 99 554100 0 2 1 3 0 1 2 3 000 003 -027 -024 0 10100 -8100 2000 0
Barntown 25 97 639000 0 1 0 1 0 0 2 2 000 013 -050 -037 0 40900 -15000 25900 4
Kilrane (W) 25 99 300400 0 2 2 4 0 2 2 4 000 -022 -004 -025 0 -66000 -1100 -67100 -22
Rosslare Harbour (W) 25 01 16000 0 0 0 0 0 0 0 0 000 000 000 000 0 0 0 0 0
Foxford 26 01 33300 0 4 2 6 0 0 1 1 000 064 019 083 0 195400 5700 201100 604
Clonroche 30 01 20400 2 1 1 4 1 0 1 2 022 016 -003 035 508400 48900 -900 556400 2727
New Ross (N) 30 02 47500 0 0 2 2 0 1 3 4 000 -025 -035 -060 0 -76200 -10500 -86700 -183
Smithborough (W) 54 01 56900 0 0 2 2 0 0 1 1 000 000 019 019 0 0 5700 5700 10
Carrickboy 55 02 57100 0 1 1 2 0 1 2 3 000 -007 -030 -037 0 -21500 -9000 -30500 -53
Gortahork 56 02 45500 0 0 1 1 1 0 4 5 -025 000 -080 -105 -570000 0 -24000 -594000 -1305
Dromore West 59 00 156200 0 1 3 4 0 0 0 0 000 015 069 084 0 44800 20700 65500 42
C3
Appendix C Evaluation of Traffic Calming Schemes Implemented 1997 ndash 2002
Location Rte Yr Construction Cost
4 Years Before 4 Years After Drop in Annual Collisions adjusted Cost Saving from Drop in Collision
Yearly Rate of Return
F S M Tot F S M Tot F S M Tot F S M Tot
Ballisodare 59 02 142700 0 0 0 0 0 0 0 0 000 000 000 000 0 0 0 0 0
Hodson Bay 61 01 432500 1 0 4 5 0 0 0 0 024 000 088 112 539200 0 26400 565600 131
Birr 62 01 94700 0 3 12 15 0 1 8 9 000 023 064 087 0 70400 19200 89600 95
Loughrea (W) 66 99 55400 0 0 1 1 0 1 2 3 000 -025 -027 -052 0 -76200 -8100 -84300 -152
Ballylickey 71 97 228500 0 1 0 1 0 1 1 2 000 -012 -025 -037 0 -35200 -7500 -42700 -19
Bantry (N) 71 02 115600 0 1 4 5 0 0 5 5 000 018 -045 -027 0 54700 -13400 41300 36
Clonakilty 71 99 331600 0 1 3 4 0 0 1 1 000 014 044 059 0 43100 13300 56400 17
Grangemockler 76 98 51900 1 0 1 2 0 0 0 0 019 000 023 042 434000 0 7000 441000 850
Kilkenny (N) 77 01 195200 0 0 6 6 0 0 8 8 000 000 -068 -068 0 0 -20400 -20400 -10
Newtown 78 02 181400 0 1 4 5 0 1 0 1 000 -007 080 073 0 -21500 24100 2600 1
Killeigh 80 99 97400 0 0 0 0 0 0 0 0 000 000 000 000 0 0 0 0 0
Kilmaine (N) 84 98 99800 1 0 0 1 0 0 0 0 019 000 000 019 434000 0 0 434000 435
Swanlinbar (S) 87 02 39900 0 0 1 1 0 0 1 1 000 000 -005 -005 0 0 -1500 -1500 -4
19457200 36 72 300 408 15 52 235 302 411 -249 920 1082 9376400 -759100 276100 8892000 46
C4
9
Evaluation of Traffic Calming Schemes Implemented 1997 ndash 2002Appendix B

Evaluation of Traffic Calming Schemes Implemented 1997 ndash 2002
national road usually functions as a typical main street with shops pubs housing school and church and their accompanying pedestrian and parking activity These types of activities would be more safely carried out in an environment where low speed prevails At higher speeds drivers have less time to react and are able to process less information in their field of view and the severity of injury is higher when a collision does occur For a pedestrian struck by a vehicle travelling at 64kmh the likelihood of them being killed is 85 at 48kmh the likelihood is 45 and at 32kmh it is 5 (ETSC Reducing Traffic Injuries Resulting From Excess and Inappropriate Speed 1995)
Figure 11 Approach to a typical village on national primary route
Figure 12 Typical wide entry into a town on national route
2
Evaluation of Traffic Calming Schemes Implemented 1997 ndash 2002
Figure 13 Typical wide open town centre with undefined road edge
14 Collisions The objective of the traffic calming programme is to reduce the number of collisions occurring in the treated towns and villages by reducing the speed of vehicles travelling through these locations In the four years before this programme of traffic calming started between 1994 and 1997 nearly half of the 9956 injury collisions on national roads occurred in urban areas Table 11 shows the breakdown of collision severity between rural and urban areas All areas where the speed limit at the time was 40mph or below were taken as ldquourbanrdquo
Table 11 Collisions between 1994 and 1997 inside and outside urban areas
Severity Urban National Roads Rural National Roads All National Roads
Fatal 161 531 692
Serious Injury 851 1573 2424
Minor Injury 3475 3365 6840
Total 4487 5469 9956
3
4
Evaluation of Traffic Calming Schemes Implemented 1997 ndash 2002
Evaluation of Traffic Calming Schemes Implemented 1997 ndash 2002
2 TRAFFIC CALMING SCHEMES
21 Criteria for Selection The criteria used for selection of towns and villages for traffic calming are set out in detail in the NRA document ldquoGuidelines On Traffic Calming For Towns And Villages On National Routesrdquo This was first published in 1999 and was updated in 2004
For the traffic calming programme over the years studied in this report (1997 ndash 2002) the criteria used to select sites for inclusion in the programme were those laid down in the Guidelines The period of implementation covered in this report starts in 1997 which was before the publication of the Guidelines However the principles were already in operation within the NRA Road Safety Group and the selection of sites in the early part of this period followed more or less the same process as the later ones
The main criterion was the collision history in and on approach to the village but data on all the following were collected when considering a location
Collisions Traffic flow Speed Geometry Future infrastructural developments
Collisions
The Guidelines states that selection based on collisions should take account of not just the simple collision numbers but should assess both risk per unit of travel and risk per head of population in the town or village In order to do this assessment a table was drawn up in 1999 listing these two risk categories for all towns and villages on national roads and ranking them according to a combination of the two categories The resulting table for national primary roads is reproduced in Appendix A but for illustration the 15 top ranking towns and villages on national primary roads are shown in Table 21 These 15 sites were all treated in the early years of the traffic calming programme 12 of them are among those examined in this report 3 were implemented before 1997 and were assessed in the preceding report to this
Table 21 Ranking of towns amp villages on national primary routes
Route Town Village Population AADT Length Colls over 5 yrs
Collisions per 10 Million VehKm
Collisions per year per
1000 Population
Combined Collision
Rate
N17 BALLINDINE 232 5058 0587 8 148 690 640
N25 KILRANE 214 5310 2255 10 46 935 559
N08 LITTLETON 566 5598 0591 10 166 353 508
N11 ASHFORD 500 12768 1352 19 60 760 501
N01 JULIANSTOWN 450 14270 1146 16 54 711 463
N05 FRENCHPARK 272 2994 0805 11 250 809 452
N02 COLLON 335 6164 0626 7 99 418 408
N18 KILCOLGAN 500 9565 0483 9 107 360 393
N08 WATERGRASSHILL 250 13706 0985 8 32 640 385
N01 CASTLEBELLINGHAM 762 10983 1891 20 53 525 368
N08 RATHCORMACK 500 11807 1158 11 44 440 308
N09 DUNGARVAN 500 3261 028 4 240 160 280
N04 DROMOD 250 3598 059 3 77 240 275
N20 CHARLEVILLE 3000 9655 1988 12 34 400 269
N25 LEMYBRIEN 222 6471 0918 4 37 360 254
5
Evaluation of Traffic Calming Schemes Implemented 1997 ndash 2002
Using the method of combining the two collision risk categories meant that small villages where there had been only a few collisions such as Dungarvan on N9 or Dromod on N4 ranked as highly as large towns with long lengths of national road and a higher number of collisions such as Charleville on N20 Thus several small villages where the actual collision numbers were low were given high priority in the traffic calming programme because the risk to road users from high speed traffic was comparatively high whereas many large towns with very much bigger numbers of actual collisions did not get priority
Speed
Selection is also based on the speed of vehicles in the towns and villages considered If speeds through a certain location were already low then that town or village was not given priority in the traffic calming programme Often this assessment would result in only one approach to a town or village being treated as described in section 32
Geometry
The other major criterion was the geometry of the road within the town or village considered If the separate physical elements that make up a traffic calming scheme especially that of narrowing the carriageway could not be applied to a certain location then a traffic calming scheme could not be fully implemented However several schemes were indeed implemented in towns and villages where the road width was already narrow prior to construction of the scheme These schemes often consisted of only signs and road markings this is discussed further in section 33
Other Factors
It must be acknowledged that several of the towns and villages assessed within this report did not have a collision history and did not have any record of high speeds before implementation of the traffic calming These sites were often selected for traffic calming because general road improvement work was scheduled at this location and traffic calming elements were incorporated into the work In some cases sites were selected solely on the basis of the perception of risk by residents and their representatives
22 Traffic Calming Measures The measures used as part of traffic calming break down into the four separate zones travelled through on approach to a town or village
bull the transition zone bull the gateway at the speed limit signs bull the zone inside the gateway bull the village centre
In small villages with a short length of national road there is usually no distinction between the last two zones but in the larger villages and towns there is often a zone which is inside the speed limited area yet cannot be described as a town centre These zones typically have either low density housing with off-street parking or warehouse-type commercial premises with sparsely spaced accesses
6
Evaluation of Traffic Calming Schemes Implemented 1997 ndash 2002
Transition Zone The principle behind traffic calming design is to change the driverrsquos perception of the surrounding environshyment
Figure 21 Transition zone approaching village
The ldquooptical widthrdquo perceived by the driver is dependent on the width between the boundaries of the road relative to the height of the adjoining vertical elements Generally in rural sections the width between fences is many times greater than the height of the hedges walls or fences which form the boundaries In urban streets the height of the buildings is generally greater than the width A driverrsquos perception of the appropriate driving speed is influenced by this relationship Speeds are lower where the height of the vertical elements is greater than the width of the road
Traffic calming aims to create a narrow optical width on the approach into towns and villages by using a combination of carriageway narrowing landscape treatment and the introduction of vertical elements such as signs lighting columns and trees Typically transition zone signs consist of a pair of ldquoTraffic Calming Aheadrdquo signs 400m from gateway and a pair of ldquoDo Not Passrdquo signs at 200m from the gateway
Gateway
The Gateway is placed at the start of the speed limited zone It should mark a definite change in the character of the surrounding area from rural to urban Therefore it needs to be conspicuous and the most prominent element in the transition zone The tall signs positioned close to the driving lane narrow the optical width
The guidelines recommend that where a town or village has two zones of speed limits first a 60kmh on the outskirts and then a 50kmh limit for the main body of the town the gateway should be placed at the change from 60kmh to 50kmh This is because usually the 50kmh limit has been placed at the edge of the properly built up area and the 60kmh zone covers the approach into the town where development is much less dense The design engineer can however choose to place the gateway at the 60kmh if surrounding development and environment are appropriate for this This has been done in a few of the cases examined
7
Evaluation of Traffic Calming Schemes Implemented 1997 ndash 2002
Figure 22 A gateway
Gateways fall into two distinct groups those with a solid kerbed central island and those with no island Early results from the first batch of traffic calming schemes constructed indicated that the presence of a central island at the gateway was a determining factor in the success of the scheme and the evaluation in this document confirms this The central island greatly increases the visual narrowing effect and the central lighting column signs and bollards are directly in the centre of the driverrsquos field of view
The gateway is always lit to a high standard with special gateway lanterns that shine directly onto the gateway signs This is not only effective in the dark during daylight hours the presence of lighting columns enhances the narrow optical width and is often noted subconsciously by the driver as an indication of an urban area
Inside Gateway
Treatment of the stretch of road between the gateway and the village centre is an important aspect of traffic calming The narrowing introduced at the gateway is continued so that the speed reduction occurring at the gateway is maintained on the driverrsquos journey through the town
This narrowing can be done by introducing any or all of the following central islands footpaths side kerb buildouts lining hatched markings and defined parking bays A shallow chicane can also sometimes be introduced by alternating side buildouts and parking between the two sides of the road The objectives are both to keep the driving lanes at no greater than 35m width and to give a visual impression to the driver of an urban area
Only narrowing and horizontal deflections are used as measures in traffic calming installations on national routes Vertical deflections such as humps or cushions are not appropriate because of the roadsrsquo function as main distributors between the major urban areas of the country Emergency vehicles and buses cannot easily negotiate routes where vertical deflection has been installed
As every gateway must be provided with lighting to illuminate the signs the infrastructure to supply street lighting needs to be provided at each end of the town or village It therefore follows that the supply for lightshying is usually available over the whole length of the village and lighting is provided over the full length of the scheme from gateway to gateway In the cases examined there are a few exceptions to this but even these few villages have street lighting for almost all of their length with only a few short gaps where no lamps are provided
8
Evaluation of Traffic Calming Schemes Implemented 1997 ndash 2002
Figure 23 Inside gateway
Town or Village Centre
In the town centre there is often not a need for narrowing works as part of the traffic calming as parking bays and footpaths may already exist However in locations where there is a wide road passing through the village centre it is necessary to narrow and define the through route with kerbing Even in locations where the through route is already well defined with kerbing and parking bays extra measures are usually required at junctions and where pedestrians wish to cross the national road or to cross side roads while walking along the main street
Typical works in the town centre are
bull definition of the limits of existing parking using kerb buildouts bull definition of junctions by the use of kerb buildouts bull provision of either pedestrian crossings or central islands to aid pedestrians in crossing
The main objective in the centre of the town or village is to provide a safe and pleasant environment that can easily be negotiated by vulnerable road users Thus it is important to provide safe places to cross where pedestrians are clearly visible to passing traffic and wide footpaths so that pedestrians are not forced to step into the road when passing others This often necessitates a reduction in the number of on street parking spaces and it can be difficult to persuade the local residents to accept this Extra off-street parking may have to be provided as part of the traffic calming scheme However there is a clear road safety advantage in both providing better facilities for pedestrians and in moving parking to off-street facilities Quite apart from the pedestrian collisions that result from vehicles reversing in and out of parking spaces and from parked vehicles masking crossing pedestrians as they step out onto the road many minor material damage collisions occur as vehicles pull in and out of parking spaces on busy through routes
9
Evaluation of Traffic Calming Schemes Implemented 1997 ndash 2002
Figure 24 Centre of village
23 Amendments to Design in 2004 The Guidelines on Traffic Calming were revised in 2004 Some of the changes made in this revision arose directly from problems encountered during construction and consequent operation of the schemes evaluated here There were numerous minor amendments but two of the main changes to design are worth notingshy
a) Increase of setback of signs The setback distance of the edge of the gateway signs from the kerb was originally specified as 600mm This width of setback was thought to provide enough clearance for overhanging loads on large vehicles while still giving the visual narrowing effect that was needed for the traffic calming gateway to be effective However in practice many gateway signs installed to this specification were hit glancing blows by passing large vehicles especially in areas where there was a significant proportion of agricultural vehicles in the mix of traffic
Consequently the specification was changed to a setback of 1m from the kerb So far this increased width appears to have succeeded in reducing the number of signs damaged by overhanging loads
b) Increase of ldquoexitrdquo width Where a central island is provided at a gateway the island and its signs and lighting column all form an obstruction for any abnormally wide load wishing to pass Whenever a wide load wishes to use the route through a village with this design of traffic calming the central lighting columns at each gateway must be temporarily disconnected and removed resulting in much inconvenience and an extra workload for the local authority and electricity supply engineers
To try to avoid this lengthy process of disconnection and removal an alternative design for gateways was put forward with extra width on the ldquoexitrdquo half of the gateway such that the width between edge kerb and central island on the lane for traffic approaching the village remains at the original 35m specified but the corresponding width on the lane for traffic leaving the village could be increased to anything up to 6m This design manages to keep the narrow optical effect for drivers approaching the village but provides an alternative route for wide loads which are guided through the approach to the village on the exit side of the central island
10
Evaluation of Traffic Calming Schemes Implemented 1997 ndash 2002
3 TRAFFIC CALMING SCHEMES 1997 - 2002
31 Schemes Implemented over Period 1997 - 2002 Between 1997 and 2002 there were 94 traffic calming schemes completed at towns and villages on the national roads Three of these schemes could not be evaluated because the collision data in the before period was considered to be unduly influenced by traffic calming on the other approach to the same village that had been implemented before 1997
The remaining 91 towns and villages have been assessed in this study
Table 31 below gives the number of schemes constructed per year and their costs Table 32 shows the spread across the different counties and Table 33 shows the spread across the national routes Figure 31 shows the locations of all the 94 schemes implemented in the period examined A detailed list of the 91 locations assessed and the measures implemented is given in Appendix B
Table 31 Schemes implemented per year
Year No of Schemes
Cost euro (market prices at
time of construction)
Cost euro (2002 prices)
Average Cost per Scheme euro
(2002 prices)
1997 12 1803000 3024500 252000
1998 14 1178800 1852900 132300
1999 18 3691800 5369900 298300
2000 9 1445200 1882000 209100
2001 23 3496400 3881300 168800
2002 15 3446600 3446600 229800
TOTALS 91 15061800 19457200 213800
The number of schemes constructed each year stayed roughly constant the average being about 15 or 16 per year There was a slight dip in the number finished in 2000 but there was a corresponding rise the next year The bulk of construction for most schemes took place within one year but where schemes carried on into following years it is the final year that is taken as the year of construction
The average cost per scheme was euro214000 over the six years All costs in this report are market prices given in 2002 prices The cost of an individual scheme varies immensely from euro16000 to euro785000 (See Appendix B) but the measures implemented in each scheme also varied greatly Some schemes were simply the installation of just 12 signs on approach to a village others included extensive urban renewal works including the complete restructuring of drainage and electricity supply for the village
Table 32 and Figure 31 show a fairly even spread of traffic calming implementation geographically across the country but it can be clearly seen in Table 33 that the majority of schemes implemented were on national primary roads Of all the schemes examined 81 are on primary routes and in the early years this division is even more marked with 88 of schemes implemented in 1997 and 1998 being on primary routes The fact that mainly primary routes were treated in the early years of the traffic calming programme can be directly attributed to the geometry of the national routes through these towns and villages Approaches to many urban areas on the primary routes had been realigned and widened during the twenty to thirty years preceding the traffic calming programme allowing traffic to approach the town or village at increased speed This increased speed and the consequent increase in collisions then identified these towns and villages as priority sites for traffic calming treatment On national secondary routes there had not
11
Evaluation of Traffic Calming Schemes Implemented 1997 ndash 2002
been such a widespread programme of realignment and widening and approaches to urban areas have mostly remained narrow Consequently on national secondary roads speeds are not so high on the approaches to urban areas collision rates also are not high and few towns and villages on secondary roads have met the criteria for the traffic calming programme
Table 32 Schemes implemented per year by county
Local Authority 1997 1998 1999 2000 2001 2002 Total
Cavan 1 1
Clare 2 2
Cork 2 3 2 4 11
Donegal 2 2 3 7
Galway 1 3 1 5
Kerry 2 2
Kildare 1 1
Kilkenny 1 1 2 4 8
Laois 2 2 4
Leitrim 1 1 2
Longford 1 1 2
Louth 4 1 5
Mayo 1 1 1 1 4
Meath 1 2 1 1 5
Monaghan 1 1 2 4
Offaly 1 2 3
Roscommon 2 2
Sligo 1 3 1 1 6
South Tipperary 2 1 2 5
Waterford 1 1
Westmeath 1 1 1 3
Wexford 1 2 2 2 7
Wicklow 1 1
Total 12 14 18 9 23 15 91
12
Evaluation of Traffic Calming Schemes Implemented 1997 ndash 2002
Figure 31 Locations of traffic calming schemes 1997 to 2002
13
Evaluation of Traffic Calming Schemes Implemented 1997 ndash 2002
Table 33 Schemes implemented per year by route
Route 1997 1998 1999 2000 2001 2002 Total
1 2 1 1 4
2 2 1 1 1 1 6
3 1 1
4 1 1 3 1 1 7
5 1 1 2
6 1 2 3
7 1 1 1 3
8 2 2
9 1 2 3
10 1 1 2
11 1 1 2
14 1 1
15 2 2 2 2 8
17 1 1 2
18 2 2 4
20 1 2 1 4
22 1 2 1 2 6
24 2 1 2 5
25 2 1 2 1 6
26 1 1
30 1 1 2
54 1 1
55 1 1
56 1 1
59 1 1 2
61 1 1
62 1 1
66 1 1
71 1 1 1 3
76 1 1
77 1 1
78 1 1
80 1 1
84 1 1
87 1 1
National Primary 11 12 15 8 19 9 74
National Secondary 1 2 3 1 4 6 17
Total 12 14 18 9 23 15 91
14
Evaluation of Traffic Calming Schemes Implemented 1997 ndash 2002
32 Towns and Villages With Only One End Treated
At 33 of the 94 locations implemented between 1997 and 2002 only one approach to the town or village was treated with traffic calming within this period
In 8 of these cases the one approach treated was the only entry of that route into a large town or city or into a coastal town where the route ended
In 6 of these towns and villages the other approach had already been treated in previous years before 1997 and the second treatment completed the traffic calming for the location In 3 of these villages it was considered that the first phase of traffic calming would have had an effect on collisions in the very same area that was influenced by the second phase Thus the ldquobeforerdquo data for the second phase of work would not have been usable and it was not possible to evaluate changes in collision data These are the three locations that have been removed from the evaluation The other three towns were large enough for the areas of influence from each phase of traffic calming not to overlap and consequently the collision data was not influenced by the first phase
In 2 towns the traffic calming within the study period 1997 - 2002 was the first phase in a two phase implementation and the second approach has since been treated in subsequent years In each of these towns the two areas of influence from the separate phases of work are considered not to overlap and so these two have been included in the study
For each scheme the ldquoevaluated areardquo over which the traffic calming is considered to have had an effect on collisions is described in the scheme details in Appendix B
In the other 17 cases the decision to treat only one approach was generally taken because the other end of town was not considered a suitable case for traffic calming The reasons for this were varied but broadly fell into two different categories
a) An existing feature in the road such as a right angled bend narrow bridge or a roundabout already acted as a measure to slow approaching traffic such as the northern approach to Ardee on N2 or the southern approach to Crusheen on N18
b) Traffic approaching the town or village from this particular direction was observed to be travelling slowly in general and did not need to be slowed further Usually this was because another nearby town or village had effectively slowed the traffic down and drivers had not yet regained the feel of an open road and speeded up The western approach from Dromod to Roosky on N4 and the southern approach from Ennis to Barefield on N18 are examples of this
15
Evaluation of Traffic Calming Schemes Implemented 1997 ndash 2002
33 Different Designs of Scheme
As traffic calming schemes are made up of all the different elements described in section 22 there is a very large number of variations possible but the 91 schemes examined can be broadly divided into 10 different types as follows-
A Gateway with side buildouts and central island Definition inside village using central islands and narrowing with kerbs
B Gateway with side buildouts and central island Definition inside village using narrowing with kerbs but no islands
C Gateway with side buildouts and central island Definition inside village using line marking only
D Gateway with side buildouts and central island No definition inside village
E Gateway with side buildouts only Definition inside village using central islands and narrowing with kerbs
F Gateway with side buildouts only Definition inside village using narrowing with kerbs but no islands
G Gateway with side buildouts only Definition inside village using line marking only
H Gateway signs only Definition inside village using line marking only
I Gateway signs only No definition inside village
J No gateway Definition inside village using narrowing with kerbs but no islands
Table 34 shows the number of schemes in each category and whether the traffic calming was done at both ends of the town or village or whether it was installed only at one end Towns and villages where traffic calming was constructed at only one end are indicated in Figure 31 and in the appendices lists by (W) (N) (E) or (S) following the town name
Table 34 Types of traffic calming schemes
Type Treatment no of villages
both ends
one end
A Central island gateway central islands amp narrowing with kerbs inside 39 29 10
B Central island gateway narrowing with kerbs amp no islands inside 8 3 5
C Central island gateway and lining 5 5
D Central island gateway and nothing else 1 1
E Simple gateway central islands amp narrowing with kerbs insides 10 5 5
F Simple gateway narrowing with kerbs amp no islands inside 11 10 1
G Simple gateway and lining 5 2 3
H Gateway signs and lining 3 3
I Gateway signs and nothing else 8 6 2
J No gateway narrowing with kerbs amp no islands inside 1 1
Total 91 64 27
16
Evaluation of Traffic Calming Schemes Implemented 1997 ndash 2002
The largest single category is type A with a gateway with side buildouts and central island with a string of central islands through the village approach and in the centre and also narrowing from the side with kerb buildouts through the approach and centre Most of the 39 schemes in this category give the full impression of a village at the point of passing the gateway and most have footpaths throughout the scheme from gateway to gateway They all have street lighting through the entire scheme
Another 14 sites have the full gateway with a central island and side buildouts but do not have such extensive works inside the village These fall into categories B C and D Types A B C and D are generally on national primary routes very few are on secondary routes Figure 32 illustrates a typical gateway into such a village where the wide carriageway is narrowed by kerbing the hard shoulder and inserting a central island
Figure 32 Typical gateway for types A B C and D
The next two biggest single categories are type E with 10 schemes and type F with 11 schemes These types along with type G have a gateway that has no central island but which does narrow the road using kerbed buildouts at the side of the road usually in the hard shoulder Types E F and G were installed at towns where the width of the approach into town was wide enough to warrant traffic calming but was less than the 157m minimum needed to accommodate central island signs and cycle bypass Types E F and G have varying degrees of definition work inside the village similar to types A B and C Figure 33 illustrates a typical gateway into such a village where the wide carriageway is narrowed by kerbing the hard shoulder but there is no central island
Types H and I do not have physical works at the gateway at all Typically there is no hard shoulder at these sites and the gateway signs and transition zone signs are simply installed on the verge In type H schemes some visual narrowing has been implemented inside the village using line markings and hatching but in type I there is nothing done other than installation of the gateway and transition zone signs The one scheme that was installed on a dual carriageway approach to a city falls into the category of type H Figure 34 illustrates a typical gateway into such a village where there is no narrowing or kerbs installed just signs placed in the verge
17
Evaluation of Traffic Calming Schemes Implemented 1997 ndash 2002
Figure 33 Typical gateway for types E F and G
Figure 34 Typical gateway for types H and I
One scheme examined in this report had neither gateway signs nor transition zone installed However extensive works were done in the centre of the small village to narrow the carriageway and define the parking areas behind kerbs This village does not fall into any the other categories and is the only type J in the study
For the purposes of examining results types A B C and D can be grouped together as a ldquoCentral Island Gatewayrdquo category types E F and G can be grouped together as a ldquoSimple Gatewayrdquo category and types H and I can be grouped together as a ldquoSigns Onlyrdquo category
Table 35 shows the incidence of each type of traffic calming scheme on each national routes Although there is a wide spread of types across all roads it can be seen that types A B C and D are mostly on the national primary roads while types H and I are largely on the national secondary routes and those sections of national primaries where widening has not taken place
18
Evaluation of Traffic Calming Schemes Implemented 1997 ndash 2002
Table 35 Types of traffic calming schemes by route
Route Type of Scheme
A B C D E F G H I J No in Study
1 1 1 1 1 4
2 4 1 1 6
3 1 1
4 2 3 1 1 7
5 1 1 2
6 1 2 3
7 1 1 1 3
8 2 2
9 1 2 3
10 1 1 2
11 1 1 2
14 1 1
15 4 1 1 2 8
17 1 1 2
18 2 1 1 4
20 3 1 4
22 2 1 1 1 1 6
24 2 1 2 5
25 5 1 6
26 1 1
30 1 1 2
54 1 1
55 1 1
56 1 1
59 2 2
61 1 1
62 1 1
66 1 1
71 1 1 1 3
76 1 1
77 1 1
78 1 1
80 1 1
84 1 1
87 1 1
National Primary 34 6 3 1 7 11 5 2 4 1 74
National Secondary 5 2 2 3 1 4 17
Total 39 8 5 1 10 11 5 3 8 1 91
19
20
Evaluation of Traffic Calming Schemes Implemented 1997 ndash 2002
Evaluation of Traffic Calming Schemes Implemented 1997 ndash 2002
4 EFFECTIVENESS IN REDUCING COLLISIONS
41 Collisions Before and After Scheme Implementation Collision numbers were measured at each of the 91 locations for the 4 years before and 4 years after implementation of each individual scheme The ldquoafterrdquo period was taken as beginning in the year after the final year of construction as the full effect of the scheme would not be noticeable during construction works Details of the collision data for each site are given in Appendix C but summary tables are given in this chapter
42 Area of Influence of Traffic Calming Works Collision numbers for both before and after data were taken from the map-based NRA Collision Database Only collisions taking place on the national routes were considered and any collision that was located within the length of road influenced by the traffic calming was included in the data This area of influence extended to 200m outside each gateway in order to take account of the effect of the transition zone Where only one side of a village was treated the area taken was from the gateway to the centre of the town Where an existing traffic calming feature existed within the speed limited zone on the entry into a town such as a sharp bend or a narrow bridge the area of influence was assumed to extend only as far as that feature Descriptions of the area of influence for each location are given in the detailed list of locations in Appendix B
43 Control Data This report takes account of the main confounding factors affecting these statistics Collision numbers in general on Irelandrsquos national roads have decreased throughout the before and after periods for these schemes and the assessment makes allowances for this trend Changes in traffic volume in patterns of traffic flow in population distribution in Garda enforcement and in attitude to road safety have all had an effect on collision rates on national roads in towns and villages whether or not traffic calming has been installed This effect is accommodated by adjusting the before and after data in line with a comparison group the collisions in each 4 year before and after period within all similar sized towns and villages on all national roads
The general trend nationwide within all towns and villages in the control group has been a drop in collisions of roughly 15 between before and after periods However the reduction varies markedly between the different collision rates fatal collisions have reduced by a similar percentage to the general trend but serious injury accidents have reduced by over 40 and minor injuries have reduced by only about 10 All reductions in collisions at the sites assessed in this study have to be compared against this general nationwide trend of a shift from serious injury to minor injury
The effect of ldquoregression to meanrdquo is more difficult to make allowances for in this study The random nature of road crashes tends to cause collision frequencies at specific locations to fluctuate The selection of towns and villages for treatment on the basis of their past collision record can introduce a source of potential bias in measuring the effectiveness of the scheme This arises because the selection process tends to pick sites at the peak of their fluctuations in collision frequencies and such sites might well have experienced reductions in collision rate in following years even if no treatment had been applied (Rune Elvik 2002)
To allow for the effect of regression to mean the change in collision rates at treated sites would need to be compared with a number of similar untreated control sites This could not have been done in the case of the traffic calming programme as no such control sites exist Whenever a town or village with a collision history was identified it was put on the programme for treatment with traffic calming it would have been considered unacceptable to leave the location untreated simply for the purposes of research
21
Evaluation of Traffic Calming Schemes Implemented 1997 ndash 2002
44 Effect on Collision Occurrence
Table 41 shows for each yearrsquos programme of traffic calming schemes the collisions over the 4 years before and after each scheme
Table 41 Collisions before and after scheme implementation for each yearrsquos programme
Year No of
Schemes
4 Years Before 4 Years After
Fatal Serious Minor Total Fatal Serious Minor Total
1997 12 10 16 52 78 3 15 51 69
1998 14 5 8 31 44 2 6 30 38
1999 18 5 23 54 82 1 8 36 45
2000 9 2 4 27 33 3 6 19 28
2001 23 10 13 95 118 3 12 59 74
2002 15 4 8 41 53 3 5 40 48
Total 91 36 72 300 408 15 52 235 302
The reduction in collisions for each yearrsquos programme is shown in Table 42 as is the adjusted reduction allowing for the general drop in collisions over the study years in the control group of other similar sites Table 43 shows these adjusted drops in annual terms and in percentages
All this data for each individual scheme can be seen in Appendix C
There is considerable fluctuation in results between each yearrsquos programme of traffic calming so it is best to concentrate on the overall figures for the entire six years
Over all 91 sites there was a drop of 106 collisions from 408 to 302
When adjusted for the general nationwide fall in collisions on similar sites this gives a total drop of 433 colshylisions or 108 per year
This is a 13 reduction on the collision numbers before implementation of the schemes
Table 42 Collision reductions for each yearrsquos programme
Year No of
Schemes
4 Year Reduction 4 Year Reduction Adjusted
Fatal Serious Minor Total Fatal Serious Minor Total
1997 12 7 1 1 9 55 -64 06 -03
1998 14 3 2 1 6 18 -20 -12 -15
1999 18 4 15 18 37 30 50 140 220
2000 9 -1 -2 8 5 -14 -36 59 08
2001 23 7 1 36 44 65 -37 246 274
2002 15 1 3 1 5 11 07 -71 -52
Total 91 21 20 65 106 164 -100 368 433
22
Evaluation of Traffic Calming Schemes Implemented 1997 ndash 2002
Table 43 Annual collision reductions for each yearrsquos programme
Year No of
Schemes
Annual Drop in Collisions Adjusted Percentage Drop in Collisions
Fatal Serious Minor Total Fatal Serious Minor Total
1997 12 14 -16 01 -01 65 -74 1 -0
1998 14 05 -05 -03 -04 47 -51 -4 -4
1999 18 07 13 35 55 75 39 28 33
2000 9 -04 -09 15 02 -88 -55 24 3
2001 23 16 -09 62 69 68 -44 29 27
2002 15 03 02 -18 -13 27 13 -21 -12
Total 91 41 -25 92 108 52 -24 14 13
While collisions of all severity types at the examined locations have reduced in actual numbers the decrease in serious injury collisions at these sites has not followed the general trend nationwide over this period on national roads which have experienced a particularly large decrease in serious injury collisions When allowing for the trend in the control data the actual reduction of 20 serious injury collisions in a 4 year period translates to a relative increase of 10 collisions
Looking at each individual severity type the adjusted reduction in fatal collisions is 164 or 41 per year and that in minor injury collisions is 368 or 92 per year The adjusted change in serious injury collisions is an increase of 25 per year These numbers represent a 52 drop in fatal collisions a 14 drop in minor injury collisions and a 24 rise in serious injury collisions
The implementation of traffic calming has clearly had a much more marked effect on fatal collisions than on other injury collisions resulting in a lowering of the severity of collisions overall Table 44 below shows for each year each severity category as a percentage of overall collisions in the 4 years before implementation and the 4 years after implementation It can be seen that in general for each yearrsquos programme except for year 2000 the proportion of fatal collisions has roughly halved the proportion of serious collisions has stayed much the same while that of minor collisions has slightly increased Looking at the entire six yearsrsquo programme in the four years before implementation of each traffic calming scheme fatal collisions constituted 9 of all collisions in these towns and villages while serious and minor injury collisions were 18 and 73 of the total respectively In the four years after implementation fatal collisions decreased to 5 of all collisions serious reduced very slightly to 17 and minor rose to 78
Table 44 Severities as a percentage of all collisions for each yearrsquos programme
Year No of
Schemes
Percentage of all Collisions 4 years before
Percentage of all Collisions 4 years after
Fatal Serious Minor Fatal Serious Minor
1997 12 13 20 67 4 22 74
1998 14 11 18 71 5 16 79
1999 18 6 28 66 2 18 80
2000 9 6 12 82 11 21 68
2001 23 8 11 81 4 16 80
2002 15 8 15 77 6 11 83
Total 91 9 18 73 5 17 78
It can therefore be concluded that implementation of these traffic calming schemes has not only reduced the number of collisions overall but has also reduced the average severity of those collisions that did occur
23
Evaluation of Traffic Calming Schemes Implemented 1997 ndash 2002
45 Statistical Significance Statistical significance is difficult to achieve with locations that have such small numbers of individual collisions However the chi squared test was used to compare the results with the control data and the overall result for all sites indicates an 80 confidence level meaning that there is a 20 chance that the observed reduction in collisions is due to mere random fluctuation
46 Collision Costs and Economic Evaluation Collision costs are calculated using figures from the Goodbody report on Cost-Benefit Analysis of Transport Projects 2004 The ldquoWillingness To Payrdquo method of economic assessment has been used dividing the collisions into the separate categories of fatal serious injury and minor injury Table 45 lists the cost savings per year and Table 46 compares these with construction costs to give an average yearly rate of return for each yearrsquos programme of traffic calming
Table 45 Collision and cost saving for each yearrsquos programme
Year No of
Schemes
Drop in Annual Collisions adjusted
Annual Cost Saving from Drop in Collisions euro 2002 prices
Fatal Serious Minor Fatal Serious Minor Total
1997 12 14 -16 01 3138300 -487300 4300 2655300
1998 14 05 -05 -03 1029900 -155000 -9200 865600
1999 18 07 13 35 1689100 383100 105200 2177500
2000 9 -04 -09 15 -800900 -277800 44200 -1034500
2001 23 16 -09 62 3681900 -278700 184600 3587700
2002 15 03 02 -18 638100 56800 -53100 641800
Total 91 41 -25 92 9376400 -759100 276100 8893400
The annual cost saving from the drop in collisions over all 91 schemes is calculated to be approximately euro89 million Most of this saving comes from the drop in fatal collisions which is the group with the most significant fall proportionately a drop of 41 per year from 79 per year (both figures adjusted for the control data)
Table 46 Yearly rate of return
Year No of
Schemes
Annual Collision Cost Saving euro
2002 prices
Cost of Constr euro 2002 prices
Yearly Rate of Return
1997 12 2655300 3024600 88
1998 14 865600 1852900 47
1999 18 2177500 5369900 41
2000 9 -1034500 1882000 -55
2001 23 3587700 3881400 92
2002 15 641800 3446600 19
Total 91 8893400 19457200 46
The average yearly rate of return for each yearrsquos programme varies between 92 and a negative return of 55 but the average rate of return over all six years is 46
24
Evaluation of Traffic Calming Schemes Implemented 1997 ndash 2002
47 Results by Type of Scheme Tables 47 and 48 show the collision savings organised into the 10 different types of scheme and their groupings As guidance a description of the different types and groupings is repeated in Table 49
Once the 91 schemes are divided up into types the individual numbers of collisions and schemes become too small to give a reliable statistical result but a few facts are worth noting-
a) Types A B C and D are all having a positive effect on the number of collisions These all have a gateway with a central island and varying degrees of physical works inside the speed limited zone
Taken together as a group types A to D have a clearly positive result with on average 11 collisions per town or village saved over a 4 year period
b) Types E F and G taken together do not have such a clear result The 10 locations in category E experienced an average increase of nearly 1 collision over a 4 year period with collisions in all severity categories increasing while type G has a better result and appears to be performing nearly as well as types A to D Taken together as a group these schemes that have physical narrowing but no central island at the gateway seem to have had little effect on collision occurrence
c) Types H and I stand out as both having had no success at all with on average an increase of 12 collisions at each town or village over a four year period
Type H and type I are the very simplest types of scheme with no physical works done either at the gateway or throughout the village Gateway signs and transition zone signs were installed and in type H some lining was done through the village to define a narrow carriageway
Type I has usually been installed at villages where the road width was already narrow before implementation and neither further narrowing nor physical works could be done at these locations This is reflected in the low number of collisions at these sites before
implementation 14 over 8 sites which comes to roughly 2 collisions per site At other sites the average number of collisions per site before implementation was generally much higher than this The overall average across all 91 sites was approximately 5 collisions per site
d) Interestingly the one scheme alone in Type J appears to have worked This scheme had extensive kerbing and footpath works done at the centre of the small village to define the road edge and the central junction Footpaths and lighting were installed throughout the village from one speed limit to the other and there is a clear physical narrowing at the speed limit signs but no gateway signs or transition zone signs were installed so there is no narrowing in optical width on approach However as there is only one scheme in this category no real conclusions can be drawn about this design
25
Evaluation of Traffic Calming Schemes Implemented 1997 ndash 2002
Table 47 Drop in collisions by type of scheme
Type No in Study
All colls 4 years before
Drop in collisions (4 years adjusted) Annual cost saving euro
Fatal Serious Minor Total Tot per
site Total Per site
A 39 171 49 -19 347 377 10 2913300 74700
B 8 31 32 -12 78 98 12 1772300 221500
C 5 42 -02 13 80 91 18 42600 8500
D 1 8 -02 10 26 34 34 -40800 -40800
E 10 48 -11 -22 -56 -90 -09 -867800 -86800
F 11 55 58 -35 -49 -26 -02 2985200 271400
G 5 20 25 -09 28 43 09 1354000 270800
H 3 13 10 -37 -55 -82 -27 260900 87000
I 8 14 07 01 -59 -51 -06 366800 45900
J 1 6 00 11 27 38 38 106600 106600
Total 91 408 164 -100 368 433 05 8893400 Avge 97700
Table 48 Grouping type of scheme by type of gateway
Type No in Study
All colls 4 years before
Drop in collisions (4 years adjusted) Annual cost saving euro
Fatal Serious Minor Total Tot per
site Total Per site
Central Island
Gateway 53 252 76 -08 532 600 11 4687600 88400
Simple Gateway
26 123 71 -67 -77 -73 -03 3471500 133500
Signs Only
11 27 17 -36 -114 -133 -12 627800 57100
Type J 1 6 00 11 27 38 38 106600 106600
Total 91 408 164 -100 368 433 05 8893400 Avge 97700
Table 49 Types of scheme and their groupings
Type Treatment Group
A Central island gateway central islands amp narrowing with kerbs inside
Central Island Gateway
B Central island gateway narrowing with kerbs amp no islands inside
C Central island gateway and lining
D Central island gateway and nothing else
E Simple gateway central islands amp narrowing with kerbs insides Simple
GatewayF Simple gateway narrowing with kerbs amp no islands inside
G Simple gateway and lining
H Gateway signs and lining Signs Only
I Gateway signs and nothing else
J No gateway narrowing with kerbs amp no islands inside No Gateway
26
Evaluation of Traffic Calming Schemes Implemented 1997 ndash 2002
48 Results By Type of Collision Table 410 shows the before and after collisions each year for the three main types of collision pedestrian single vehicle and head on The drop shown in the table is an adjusted figure and is relative to the decrease in each of these types of collision in the control data throughout all similar towns and villages on national roads over the period examined
The results show that pedestrian collisions decreased overall by about 8 from a figure of 69 and head-on type collisions have decreased by about 14 from 45 These are quite significant decreases of about 13 and 29 respectively However there has been effectively no change in single vehicle collisions only a very small increase of negligible percentage change
Table 410 Type of collision
Year No of
Schemes
All collisions 4 years before Drop in collisions (4 years adjusted)
ped single veh head on ped single veh head on
1997 12 7 15 8 -70 -03 09
1998 14 3 3 7 -19 -34 -01
1999 18 18 13 7 93 59 13
2000 9 5 6 4 01 -20 12
2001 23 24 14 16 49 -10 132
2002 15 12 12 3 20 06 -30
Total 91 69 63 45 75 -02 135
Total Percentage Drop 13 -0 29
The greatest decrease is in head-on type collisions Head-on collisions are not a particularly significant proportion of all collisions within these towns and villages and before implementation of the traffic calming they constituted only about 11 of all of collisions However the reduction of 135 collisions over four years represents a 29 drop in this type of collision compared with figures before implementation which is a significant result This decrease can be directly attributed to the fundamental design of traffic calming in which the two directions of flow are divided by central kerbed islands and central hatched areas
Pedestrian collisions have also decreased Pedestrian collisions were about 19 of all collisions within these towns and villages and the drop of 13 in pedestrian collisions is much the same as the general drop of 13 in collisions overall within the treated towns Although this is a good result in that pedestrian collisions have decreased in treated towns and villages 13 more than they have decreased in other similar locations it is not as good as was expected It was assumed that the inherent ldquopedestrian friendlyrdquo nature of traffic calming with provision of footpaths and pedestrian crossings would have a comparatively greater effect on pedestrian collisions Examination of the individual collisions in the after period suggests that the increases in pedestrian collisions are occurring in only about a dozen of the 91 towns and villages and that half of these dozen have 3 or more pedestrian incidents in the four year after period There appears to be no correlation with the provision of a pedestrian crossing as part of the traffic calming scheme A more detailed study of these locations is needed to investigate pedestrian collisions further and to ascertain whether there is any link between the provision of either pedestrian crossings or footpaths and the decrease in pedestrian collisions
Single vehicle collisions have not changed at all in relation to the general decrease in single vehicle collisions in all similar towns and villages Single vehicle collisions are those involving only one vehicle Usually in single vehicle incidents the vehicle leaves the driving lane of the road and collides with a roadside object
27
Evaluation of Traffic Calming Schemes Implemented 1997 ndash 2002
Occasionally there is no collision with a roadside object but because of the difference in levels between road and surrounding ground the occupants are injured when the vehicle comes to a halt The lack of any significant change in the occurrence of single vehicle collisions could possibly be explained by the fact that implementation of traffic calming introduces many new objects into the roadside space and reduces the available width within the driving lane Thus when a driver does stray from the correct path there is less forgiveness in the roadside environment and the chances of leaving the defined driving lane or striking an object is increased The general decrease in collisions at traffic calming sites due to the reduced speed is offset by this increased chance of hitting a roadside object which has thus resulted in no change in the incidence of these types of collisions
49 Results for Towns and Villages Treated at One End Only At 27 of the 91 locations only one end of the town or village was treated with traffic calming In 8 of these cases these were entries into a large town or city or into a coastal town where the route ended at the remaining 19 locations there was a through route but only one half of the village was treated Table 411 shows the results arranged according to whether or not both ends of the town were treated
The previous report on traffic calming constructed between 1993 and 1996 concluded that villages which had traffic calming at only one end did not perform in evaluation as well as those where both ends were treated The results shown below repeat this phenomenon At the 27 locations where only one end of the town or village was treated collisions reduced only by an average of 8 while at the other 64 locations where both ends were treated the reduction in collisions was 14 on average
When the 8 ldquosingle entryrdquo locations are separated out it can be seen that these treatments worked better than the other 19 one-end towns and villages This can perhaps be explained by the fact that these 7 locations were put in place to reduce the speed of vehicles approaching the outskirts of large towns or cities and their effect is only required to act within the environs of the traffic calming works Once past the traffic calming scheme the traffic enters a congested network where speed is not a concern For these 8 sites it was only the short length immediately around the traffic calming works was that was evaluated in the study
Table 411 Division of schemes according to whether both ends were treated
Type No in study
All colls 4 years before
Drop in collisions (4 years adjusted) Percentage drops
Fatal Serious Minor Total Total
per site Fatal Serious Minor Total
Both Ends 64 310 130 -76 311 364 06 52 -24 15 14
Single Entry 8 31 06 08 47 61 08 38 29 22 23
Half 19 67 29 -32 11 08 00 59 -41 3 1
All One-end 27 98 35 -24 58 69 03 54 -22 9 8
Total 91 408 164 -100 368 433 05 52 -24 14 13
28
Evaluation of Traffic Calming Schemes Implemented 1997 ndash 2002
5 CASE STUDIES
51 Comparison of Types of Traffic Calming Schemes The results indicate that schemes that have a central island at the gateway types AB C and D as
described in section 33 are more effective at reducing collisions than those schemes that do not have censhytral islands Four schemes on N15 were chosen to illustrate the typical differences between these types of scheme so that the layout of a scheme that has succeeded in collision reduction can be compared with one
that has not
The schemes illustrated all on N15 and in County Donegal are Ballyshannon Ballybofey Killygordon Castlefinn
Schemes With Central Island Type Gateways
Ballybofey and Castlefinn are schemes of type A having a gateway with both side buildouts and central island Inside the village or town this definition is continued using central islands and narrowing with kerbs
Both of these sites have experienced a reduction in collisions as the figures for 4 year before and after periods show Castlefinn particularly has had a notable reduction very much larger than the average of 13 for all the sites in this study
TownVillage collisions before collisions after reduction (adjusted) Ballybofey 9 6 16 Castlefinn 4 1 72
Schemes With Signs Only at Gateways
Ballyshannon and Killygordon are schemes of type H having only signs and no physical works at the gateway Definition inside the town or village is given only by using road markings
None of these sites has experienced any significant reduction in collisions as the 4 year figures below show These locations have had a slight increase in collisions relative to the general decrease in collisions across all similar towns and villages in the control data
TownVillage collisions before collisions after reduction (adjusted) Ballyshannon 7 6 -4 (increase) Killygordon 2 2 -9 (increase)
Comparison of Ballyshannon and Ballybofey
Ballyshannon and Ballybofey are similar sized towns and before traffic calming was introduced had similar approaches In both towns the speed limit extends a long way outside the centre of town and the road was wide on these approaches Both towns have busy town centres with narrow streets where vehicle speeds are not particularly high but in the zone between gateway and town centre high speeds were a problem and were addressed by traffic calming
While Ballyshannon had no central island constructed at the gateway and was treated with only signs and line marking on these approaches Ballybofey was treated with a kerbed central island kerbs and footpaths to narrow the road and a string of further central islands between the gateway and the centre of town Figures 51 and 52 below illustrate this
29
Evaluation of Traffic Calming Schemes Implemented 1997 ndash 2002
Comparison of figures 51 and 52 shows that the optical width has been considerably narrowed in Ballybofey whereas the effect is not so marked in Ballyshannon Figures 53 and 54 show how in Ballybofey this narrowing is continued on for the 600m between gateway and town centre reinforcing the slowing down effect that drivers experienced at the gateway
The differences in design of the approaches to these towns may possibly account for the differences in collision occurrence after traffic calming implementation
Figure 51 Ballyshannon south approach
Figure 52 Ballybofey south approach
30
Evaluation of Traffic Calming Schemes Implemented 1997 ndash 2002
Figure 53 Ballybofey south zone inside gateway
Figure 54 Ballybofey south zone inside gateway
31
Evaluation of Traffic Calming Schemes Implemented 1997 ndash 2002
Comparison of Killygordon and Castlefinn
Killygordon and Castlefinn are located within 6km of each other on the most northern section of N15 with a much lower traffic volume than either Ballybofey or Ballyshannon The N15 along this section in general has a narrower cross section without hard shoulders
Killygordon is a small village and had narrow approaches even before implementation of the traffic calming and the low collision rate before implementation reflects this The minimal treatment to this village under the traffic calming programme did little to change the collision occurrence Castlefinn is a larger village and before implementation its approaches were wider than those to Killygordon The number of collisions in Castlefinn before implementation was twice that in Killygordon The construction of a kerbed central island kerbs and footpaths to narrow the road and a further central island at the centre of the village has evidently had an effect on collisions which have now reduced to numbers below that in Killygordon Figures 55 and 56 below illustrate the differences between the two villages at the gateway while Figures 57 and 58 illustrate the changed look of the centre of Castlefinn as a result of traffic calming construction
Figure 55 Killygordon west approach
Figure 56 Castlefinn west approach
32
Evaluation of Traffic Calming Schemes Implemented 1997 ndash 2002
Figure 57 Castlefinn centre before traffic calming
Figure 58 Castlefinn centre after traffic calming
33
Evaluation of Traffic Calming Schemes Implemented 1997 ndash 2002
Figure 59 Approach to a village similar to Grange before traffic calming
52 Successful Schemes
N15 Grange
Grange has had one of the greatest reductions in collisions in this study
Collisions in 4 years before 9 Collisions in 4 years after 2 reduction (adjusted) 75
Grange is on a busy section of N15 in County Sligo It is a medium sized village with shops pubs petrol station police station church and a few dozen dwelling houses all with frontage onto the national road It has two busy junctions with local primary distributor roads leading to a moderately populated hinterland in the summer the population increases significantly with holidaymakers visiting the coastal area
Traffic calming was installed in 2000 Before this the approaches to the village were wide with hard shoulshyders and this cross section continued through the length of the town On entering the village from the north the length within the built up area approaching the centre is downhill so that drivers would need constant concentration and awareness of their speed to achieve a reduction in speed and to maintain that reduction on this approach From the south there is also a downhill approach but outside the built up area so that speeds approaching the start of the speed limited zone were high
Although an appropriate photograph of Grange before construction of the traffic calming is not available the photograph below of a similar sized village on N24 with similar road widths is shown below in Figure 59
Grange was treated with kerbed central islands at each gateway kerbs and footpaths to narrow the road and a string of further central islands between the two gateways Driving lanes in each direction are now a constant 35m throughout the village A signalised controlled pedestrian crossing was also constructed at the centre of the town There are now footpaths for the entire length of village between gateways and as well as the controlled crossing there are several locations where pedestrians can cross the road with the aid of the central island refuges Figures 510 511 and 512 below illustrate the works
In the years since traffic calming was implemented further housing an industrial estate and commercial sites have been constructed in the vicinity Traffic volumes turning at the junction have increased substantially
34
Evaluation of Traffic Calming Schemes Implemented 1997 ndash 2002
Figure 510 Gateway at Grange with central Island ndash Viewed from inside the village
Figure 511 Approach to Grange village centre from the north
35
Evaluation of Traffic Calming Schemes Implemented 1997 ndash 2002
Figure 512 Grange village centre
In the four years before construction of traffic calming there were roughly 2 collisions each year in the vilshylage Four of the nine collisions were single vehicle incidents and two were pedestrian collisions both involving pedestrians attempting to cross the road Skidding occurred in six of the nine collisions which is an unusually large proportion and suggests that there was a high incidence of sudden braking from high speeds
In the four years after implementation of the scheme there have been only two collisions one in the village centre where the rear of a parked vehicle was hit and one single vehicle loss of control incident on the south approach to the village
N20 Newtwopothouse Newtwopothouse has also had a significant reduction in collisions in this study
Collisions in 4 years before 4
Collisions in 4 years after 0
reduction (adjusted) 100
Newtwopothouse is on a busy section of N20 in County Cork It is a tiny settlement on a staggered junction with only a pubcafe and a shoppost office having frontage onto the national road The bulk of the housing in the area is along the two side roads stretching a few hundred metres down each road and on the eastshyern side road there is a school about 100m from the N20 Before construction of the traffic calming it did not appear to the passing driver on N20 as if there were a village at all merely a crossroads However there was a fairly large volume of traffic turning to and from the two side roads and pedestrian traffic across the N20 between housing and school
Before implementation of traffic calming the road on approach to and through the location was wide being a standard 7m single carriageway with 3m hard shoulders Figures 513 and 515 show the location before traffic calming was installed
36
Evaluation of Traffic Calming Schemes Implemented 1997 ndash 2002
Figure 513 Approach to Newtwopothouse from north before traffic calming
Figure 514 Approach to Newtwopothouse from north
Traffic calming was implemented in 2001 Similarly to Grange Newtwopothouse was treated with kerbed central islands at each gateway kerbs and footpaths to narrow the road further central islands between the two gateways and a signalised controlled pedestrian crossing in the centre Driving lanes in each direction are now a constant 35m throughout the scheme and there is now lighting for the entire length between gateways and footpaths in the central stretch around the junction and bus stops Figures 514 and 516 below illustrate the works by showing the same locations as shown in Figures 513 and 515
37
Evaluation of Traffic Calming Schemes Implemented 1997 ndash 2002
Figure 515 Crossroads at Newtwopothouse before traffic calming
Figure 516 Crossroads at Newtwopothouse with pedestrian crossing
In the four years before construction of traffic calming there were 4 collisions at this location all of which involved turning at the junction
In the four years after implementation of the scheme there have been no collisions
38
Evaluation of Traffic Calming Schemes Implemented 1997 ndash 2002
6 CONCLUSIONS
61 Reduction in Collisions Between 1997 and 2002 there were 94 traffic calming schemes completed at towns and villages on the national roads
Over all the 91 studied locations comparing the 4 years before each scheme with the 4 years after there was a reduction of 106 collisions made up of 21 fatal collisions 20 serious injury collisions and 65 minor injury collisions
62 Reduction in Comparison with Control Data When comparing with the control data and allowing for the general decrease in collisions overall on national roads during this time period this translates to a reduction of 433 collisions This is made up of a reduction of 164 fatal collisions and 368 minor injury collisions and an increase of 100 serious collisions
These figures represent a 13 reduction in all collisions with fatal collisions reduced by 52 Serious and minor injury collisions together reduced by 9
63 Reduction in Severity of Collisions The implementation of traffic calming has therefore had the effect of reducing the number of crashes within the geographical areas of their influence Its more significant effect is in reducing the severity of collisions The percentage of all collisions that were fatal dropped from 9 in the 4 years before implementation to 5 in the 4 years after The percentage of minor injury collisions rose by a corresponding amount
64 Cost Benefit Analysis Using the ldquoWillingness to Payrdquo method of evaluation the average yearly rate of return over all the years evaluated is 46
65 Effects of Different Types of Schemes Traffic Calming Schemes that have a central island in the Gateway and continue this effect with solid central islands throughout the village are more effective in reducing collisions than those that do not
Schemes that consisted of only signs and had no physical works did not have any effect at all in reducing collisions
Traffic Calming Schemes where both ends of the town or village were treated were more effective in reducshying collisions than those where only one was treated
39
Evaluation of Traffic Calming Schemes Implemented 1997 ndash 2002
40
7
Evaluation of Traffic Calming Schemes Implemented 1997 ndash 2002
RECOMMENDATIONS
There are eight main recommendations that emerge from this study
1 The programme of traffic calming of towns and villages on national roads should be continued
2 The programme should be restricted to only towns and village where traffic calming is likely to have an impact
3 An updated priority list should be produced to identify those towns and villages where traffic calming is likely to have an impact
4 Prioritised towns and villages should have a) an injury collision record over the past 5 years that is higher than average b) 85 percentile speeds that are above the posted speed limit c) a physical layout that is possible to treat with traffic calming
5 Where traffic calming is implemented it should include a central island at the gateway and should include physical narrowings throughout the town or village No scheme should consist of just signs and road markings
6 At any location where traffic calming is being considered the existing vehicle speeds through the village must be surveyed
7 After each traffic calming scheme has been implemented the revised vehicle speeds through the village must be surveyed as soon as possible
8 A further study should examine in more detail the single vehicle accidents and pedestrian accidents that been identified in this study in treated villages and towns
41
Evaluation of Traffic Calming Schemes Implemented 1997 ndash 2002
42
Evaluation of Traffic Calming Schemes Implemented 1997 ndash 2002
REFERENCES
RS460 Evaluation of Traffic Calming Schemes Constructed on National Roads 1993-1996 National Roads Authority 2002
The Road to Safety Government Strategy for Road Safety 1998-2002 Department of the Environment and Local Government 1998
Road Safety Strategy Government Strategy for Road Safety 2004-2006 Department of Transport 2004
Road Safety Strategy 2007-2012 Road Safety Authority 2007
2005 Survey of Free Speeds (Urban and Rural) National Roads Authority 2006
Guidelines on Traffic Calming for Towns and Villages on National Routes National Roads Authority 2004
Reducing Traffic Injuries Resulting From Excess and Inappropriate Speed European Transport Safety Council 1995
The importance of confounding in observational before-and-after studies of road safety measures Rune Elvik Accident Analysis and Prevention 34(5) 2002
Parameter Values for Use in Cost-Benefit Analysis of Transport Projects Goodbody Economic Consultants 2004
43
Evaluation of Traffic Calming Schemes Implemented 1997 ndash 2002
44
Evaluation of Traffic Calming Schemes Implemented 1997 ndash 2002
Evaluation of Traffic Calming Schemes Implemented 1997 ndash 2002
APPENDIX A
Ranking of Sites According to Primary Criteria for Selection for Traffic Calming National Primary Routes Only
Route Town Village Population AADT Length Colls
over 5 yrs
Collisions per 10 million vehkm
Collisions per year per 1000
Population
+Combined Collision
Rate
N17 BALLINDINE 232 5058 0587 8 148 690 640
N25 KILRANE 214 5310 2255 10 46 935 559 N08 LITTLETON 566 5598 0591 10 166 353 508
N11 ASHFORD 500 12768 1352 19 60 760 501 N01 JULIANSTOWN 450 14270 1146 16 54 711 463
N05 FRENCHPARK 272 2994 0805 11 250 809 452
N02 COLLON 335 6164 0626 7 99 418 408 N18 KILCOLGAN 500 9565 0483 9 107 360 393
N08 WATERGRASSHILL 250 13706 0985 8 32 640 385 N01 CASTLEBELLINGHAM 762 10983 1891 20 53 525 368
N08 RATHCORMACK 500 11807 1158 11 44 440 308 N09 DUNGARVAN 500 3261 028 4 240 160 280
N04 DROMOD 250 3598 059 3 77 240 275 N20 CHARLEVILLE 3000 9655 1988 12 34 400 269
N25 LEMYBRIEN 222 6471 0918 4 37 360 254 N11 KILMACANOGE 763 26721 0692 13 39 341 247
N25 GLOUNTHAUNE 500 17499 0802 17 66 680 236
N07 MONEYGALL 344 6350 0576 4 60 233 236 N09 MULLINAVAT 283 3858 0925 7 107 495 231
N08 KILBEHENY 500 6897 0863 6 55 240 230 N02 CASTLEBLAYNEY 2938 4154 3525 21 79 143 229
N07 BORRIS IN OSSORY 500 7848 1141 7 43 280 226 N15 BUNDORAN 1463 7275 2371 17 54 232 224
N24 KILSHEELAN 435 4924 1027 5 54 230 223 N02 ARDEE 3604 7019 2394 24 78 133 223
N05 CHARLESTOWN 712 2956 125 5 74 140 219 N11 CAMOLIN 293 5192 1125 4 38 273 212
N06 CRAUGHWELL 232 7669 1558 4 18 345 209
N24 MONARD 500 5735 0392 3 73 120 206 N22 FARRANFORE 500 7614 1093 6 40 240 199
N21 ABBEYFEALE 1501 9982 3287 39 65 520 195 N15 GRANGE 500 6352 1427 6 36 240 193
N24 CARRICK ON SUIR 5143 4924 2903 20 77 078 192 N04 COLLOONEY 612 8617 0864 12 88 392 186
N18 BAREFIELD 500 5852 1087 5 43 200 186 N17 CLAREGALWAY 500 11128 166 7 21 280 182
N20 BALLYHAY 500 7440 0364 3 61 120 181 N14 CASTLEFINN 692 6024 0846 5 54 145 180
N26 FOXFORD 974 1928 1915 9 134 185 180
N18 ARDRAHAN 500 6650 0413 3 60 120 180 N02 ASHBOURNE 4411 10840 2792 30 54 136 177
N08 ABBEYLEIX 1299 8083 1778 11 42 169 169 N02 CARRICKMACROSS 3341 11436 2989 27 43 162 167
N11 OILGATE 262 6332 0393 2 44 153 164 N04 BALLINAFAD 500 3199 0239 2 143 080 163
N02 CASTLESHANE 250 5338 0875 5 59 400 159 N02 SLANE 699 6064 1885 13 62 372 155
N02 ANNAYALLA 500 5338 0655 6 94 240 154
N30 ENNISCORTHY 7655 3972 0565 6 146 016 150 N10 PAULSTOWN 234 4858 0753 2 30 171 145
A1
Evaluation of Traffic Calming Schemes Implemented 1997 ndash 2002
Route Town Village Population AADT Length Colls
over 5 yrs
Collisions per 10 million vehkm
Collisions per year per 1000
Population
+Combined Collision
Rate
N08 JOHNSTOWN 422 6063 1445 4 25 190 145 N07 TOOMYVARA 500 7606 069 7 73 280 143
N16 SLIGO 17302 5680 1796 25 134 029 142 N26 BALLINA 477 5398 1983 9 46 377 140
N16 GLENFARNE 500 1746 1846 5 85 200 135 N06 ROCHFORTBRIDGE 721 6202 1348 5 33 139 135
N24 LIMERICK JCN 250 5735 0698 4 55 320 135 N22 BALLINCOLLIG 12124 15125 6303 68 39 112 134
N24 FIDDOWN 500 4588 0966 6 74 240 134
N01 DROGHEDA 23914 19455 4526 79 49 066 131 N08 NEWINN 500 7163 0648 3 35 120 131
N15 STRANORLAR+BALLYBOFEY 2972 3337 3918 22 92 148 129 N14 LIFFORD 1359 3854 1151 4 49 059 128
N22 LISSARDA 500 7096 0696 6 67 240 127 N22 BALLYVOURNEY 500 3636 2786 8 43 320 123
N06 KILREEKILL 500 9055 059 3 31 120 122 N17 BELLAHY+CHARLESTOWN 712 3834 1103 3 39 084 120
N22 MACROOM 2363 7096 4588 31 52 262 118 N15 KILLYGORDON 500 6024 0493 2 37 080 114
N08 HORSEampJOCKEY 500 7607 026 3 83 120 113
N18 GORT 1093 7709 2855 16 40 293 113 N04 CLONARD 500 10570 0599 3 26 120 112
N02 EMYVALE 479 4073 0813 4 66 167 108 N05 BELLAVARY 500 5138 0633 4 67 160 107
N20 PATRICKSWELL 1019 14486 1742 15 33 294 106 N25 KILMEADAN 500 6177 1817 7 34 280 104
N24 PALLASGREEN 500 4638 0747 4 63 160 103 N15 BALLYSHANNON 2838 8955 2844 13 28 092 102
N21 TRALEE 17225 12840 1934 40 88 046 100 N03 KELLS 3539 8857 1737 10 36 057 099
N25 KILLEAGH 347 7244 1481 5 26 288 098
N24 BANSHA 293 4221 0855 3 46 205 097 N03 CARNAROSS 500 6683 0933 5 44 200 094
N02 MONAGHAN 5946 7630 3588 32 64 108 091 N24 CAHIR 2055 13277 2528 11 18 107 089
N01 DUNDALK 25843 22685 6273 153 59 118 089 N06 MILLTOWNPASS 500 6202 0733 4 48 160 088
N18 NEWMARKET-ON-FERGUS 1583 10584 1461 13 46 164 087 N17 CURRY 250 4585 0548 2 44 160 084
N03 CAVAN 5254 11709 236 28 56 107 082 N22 KILLARNEY 7275 9731 3819 19 28 052 082
N09 MOONE+TIMOLIN 500 6720 2231 6 22 240 082
N11 RATHNEW 1496 12736 1072 11 44 147 081 N15 DONEGAL 2193 6149 2053 12 52 109 079
N25 YOUGHAL 5828 7598 522 34 47 117 076 N03 DUNSHAUGHLIN 1275 15588 1458 6 14 094 076
N04 CARRICK ON SHANNON 2500 4257 2393 10 54 080 074 N06 BALLINASLOE 5812 9582 5241 37 40 127 072
N21 NEWCASTLE WEST 2500 7975 2766 16 40 128 072 N20 BUTTEVANT 1125 7440 1271 7 41 124 072
N15 SLIGO 17302 8932 1274 14 67 016 071 N15 DRUMCLIFF 500 9726 0737 2 15 080 071
N25 NEW ROSS 6079 6846 2424 17 56 056 070
A2
Evaluation of Traffic Calming Schemes Implemented 1997 ndash 2002
Route Town Village Population AADT Length Colls
over 5 yrs
Collisions per 10 million vehkm
Collisions per year per 1000
Population
+Combined Collision
Rate
N25 DUNGARVAN 6920 5688 4649 25 52 072 070
N20 CROOM 1090 5658 1036 5 47 092 070 N24 PILTOWN 717 4588 1166 4 41 112 069
N08 MITCHELSTOWN 3090 13395 2084 19 37 123 068 N07 MONASTEREVIN 2224 11968 1754 7 18 063 068
N15 CLIFFONEY 292 5089 0652 2 33 137 067 N09 GOWRAN 477 2517 0949 2 46 084 067
N08 FERMOY 4462 10622 2955 23 40 103 066 N04 RATHOWEN 500 5465 0439 1 23 040 066
N04 NEWTOWNFORBES 250 3711 1169 2 25 160 065 N30 NEW ROSS 6079 3514 2126 8 59 026 065
N07 NENAGH 5825 8352 2422 18 49 062 064
N07 MOUNTRATH 1375 6980 1827 8 34 116 063 N01 BALBRIGGAN 7724 13451 3226 33 42 085 063
N15 LISCOOLEY 500 6024 0423 2 43 080 063 N17 TOBERCURRY 1069 4585 2168 6 33 112 061
N03 NAVAN 11706 11782 4695 43 43 073 061 N04 ENFIELD 500 10570 1127 2 09 080 058
N30 CLONROCHE 500 2786 1049 2 37 080 057 N09 CARLOW 14027 9020 5154 37 44 053 057
N16 MANORHAMILTON 995 2393 1665 3 41 060 056 N24 MOONCOIN 500 8954 1507 2 08 080 056
N06 LOUGHREA 3271 8389 295 15 33 092 056
N06 MOATE 1529 5973 2482 4 15 052 056 N08 CULLAHILL 500 6063 051 1 18 040 055
N08 URLINGFORD 689 6407 1309 4 26 116 055 N08 CASHEL 2814 7238 2342 11 36 078 055
N11 GOREY 3840 13253 1949 16 34 083 055 N11 FERNS 859 5192 0974 3 33 070 050
N18 ENNIS 16058 13516 7938 59 30 073 049 N23 CASTLEISLAND 2207 3515 0727 2 43 018 047
N05 BELLANAGARE 500 2309 0639 1 37 040 047 N04 KINNEGAD 415 6954 2589 3 09 145 045
N09 CASTLEDERMOT 741 6112 2144 4 17 108 044
N11 ARKLOW 7987 12321 3857 24 28 060 043 N18 CRUSHEEN 500 5852 0853 1 11 040 042
N03 VIRGINIA 720 6683 1261 3 20 083 040 N05 BALLAGHADERREEN 1270 4251 2127 4 24 063 040
N07 BALLYBRITTAS 500 10826 0524 1 10 040 039 N06 TYRRELLSPASS 376 6707 1407 1 06 053 038
N11 ENNISCORTHY 7655 7570 1269 6 34 016 038 N04 SLIGO 17964 15138 3821 31 29 035 038
N24 TIPPERARY 4963 11547 2213 12 26 048 038 N26 SWINFORD 1216 1928 1963 2 29 033 037
N07 BIRDHILL 500 9770 0702 2 16 080 036
N07 KILDARE 4196 14907 2763 14 19 067 035 N20 MALLOW 7521 10164 2681 13 26 035 035
N05 STROKESTOWN 568 2809 2371 2 16 070 034 N10 KNOCKTOPHER 500 2734 0841 1 24 040 034
N17 TUAM 5540 10723 305 13 22 047 034 N04 EDGEWORTHSTOWN 801 5520 2094 3 14 075 033
N04 BALLYSADARE 500 8617 0996 2 13 080 033 N10 STONYFORD 500 3401 0717 1 22 040 032
A3
Evaluation of Traffic Calming Schemes Implemented 1997 ndash 2002
Route Town Village Population AADT Length Colls
over 5 yrs
Collisions per 10 million vehkm
Collisions per year per 1000
Population
+Combined Collision
Rate
N21 CASTLEISLAND 2207 5467 1873 4 21 036 030
N07 PORTLAOISE 8360 12097 501 19 17 045 029 N09 THOMASTOWN 2512 3261 2244 3 22 024 028
N05 TULSK 500 2220 1432 1 17 040 027 N25 SWEEP 500 4274 0755 1 17 040 027
N06 GALWAY 60000 24461 5106 50 22 017 026 N03 DROLCHEAD NUA 11778 5345 04 1 26 002 026
N03 BELTURBET 1223 3316 1868 2 18 033 026 N08 DURROW 721 7244 1338 2 11 055 025
N05 WESTPORT 3688 12879 1194 5 18 027 025 N19 SHANNON 7920 14965 05 3 22 008 024
N21 ADARE 500 3348 1288 1 13 040 023
N07 ROSCREA 4231 7718 3502 7 14 033 022 N17 KNOCK 440 3958 1251 1 11 045 022
N10 KILKENNY 17669 7149 3379 8 18 009 020 N13 STRANORLAR 2972 7141 0925 2 17 013 020
N20 LIMERICK 75000 20672 6595 42 17 011 020 N24 CLONMEL 15562 7270 5907 12 15 015 019
N13 BRIDGE END 500 8153 075 1 09 040 019 N05 CASTLEBAR 7648 7442 3988 7 13 018 018
N17 CLAREMORRIS 1907 5058 1868 2 12 021 017 N24 OOLA 474 4864 1937 1 06 042 016
N07 LIMERICK 75000 15709 10841 41 13 011 016
N21 TEMPLEGLANTINE 819 6759 0828 1 10 024 016 N17 GALWAY 60000 27843 3176 20 12 007 014
N05 LONGFORD 6824 6874 4021 5 10 015 014 N07 DUBLIN 500000 47272 2387 22 11 001 011
N04 BOYLE 2197 3199 2036 1 08 009 011 N11 DUBLIN 500000 40055 13999 95 09 004 010
N04 DUBLIN 500000 29736 9209 42 08 002 009 N18 LIMERICK 75000 27171 5095 17 07 005 008
N09 WATERFORD 75000 14883 1693 3 07 001 007 N50 DUBLIN 600000 18676 124 10 02 000 002
N24 LIMERICK 75436 10740 3098 1 02 000 002
N08 CORK 136000 32213 414 2 01 000 001 N22 CORK 136000 25429 3556 1 01 000 001
N09 BALLYHALE 500 3858 0867 0 00 000 000 N17 BALLYNACARROW 500 3807 0798 0 00 000 000
N04 BALLYNALACK 500 5465 0748 0 00 000 000 N03 BALLYSHANNON 2838 3088 0899 0 00 000 000
N05 CARRACASTLE 500 2956 1215 0 00 000 000 N04 CASTLEBALDWIN 500 3199 0252 0 00 000 000
N18 CLARINBRIDGE 500 9565 1417 0 00 000 000 N20 CORK 136000 15947 4267 0 00 000 000
N27 CORK 136000 13277 3778 0 00 000 000
N01 DUBLIN 500000 28975 4298 0 00 000 000 N02 DUBLIN 500000 11524 6397 0 00 000 000
N03 DUBLIN 500000 21436 4357 0 00 000 000 N06 HORSELEAP 500 6769 0735 0 00 000 000
N06 KILBEGGAN 617 6707 1286 0 00 000 000 N14 LETTERKENNY 10726 15411 093 0 00 000 000
N17 MILLTOWN 500 5467 0869 0 00 000 000 N21 PATRICKSWELL 1019 3348 0274 0 00 000 000
A4
Evaluation of Traffic Calming Schemes Implemented 1997 ndash 2002
Route Town Village Population AADT Length Colls
over 5 yrs
Collisions per 10 million vehkm
Collisions per year per 1000
Population
+Combined Collision
Rate
N09 PAULSTOWN 234 6653 0721 0 00 000 000
N04 ROOSKY 249 3827 0696 0 00 000 000 N28 SHANBALLY 500 5098 0506 0 00 000 000
N05 TERMONBARRY 500 3366 098 0 00 000 000 N25 WATERFORD 41853 10668 8427 0 00 000 000
N25 BALLINABOOLA N25 BARNTOWN
N07 DALYS CROSS N18 GORT RD ENNIS
N20 NEWTWOPOTHOUSE N08 RINGASKIDDY
+ Combined Collision Rate [Coll Rate 10mvehkmyr5 + Coll Rate 1000popyr2]2 These towns and villages were not assessed as funding was already committed
A5
Evaluation of Traffic Calming Schemes Implemented 1997 ndash 2002Evaluation of Traffic Calming Schemes Implemented 1997 ndash 2002
Evaluation of Traffic Calming Schemes Implemented 1997 ndash 2002
51
Appendix B Evaluation of Traffic Calming Schemes Implemented 1997 ndash 2002
APPENDIX B Scheme Details for All Sites
Scheme Local Authority Rte Both or Half Spd Lim Type Colls 4 yrs before raw
Colls 4 yrs after raw
Drop in Ann Colls Adj for
All Nats Area Evaluated Year
Finished Year
Started Year
Bypassed Year
Changed Total Cost in 2002 Prices
Carrickarnon Louth 1 both 60 F 15 10 079 Gate - Gate 2001 2007 109400
Greengates Louth 1 both 40 B 8 2 130 Gate - Gate 1997 2002 489900 KilsaranCastlebellingham Louth 1 both 30 A 23 10 260 Gate - Gate 1997 1997 2002 255600
Julianstown Meath 1 both 30 C 13 10 024 Gate - Gate 1999 1999 2003 767700 Emyvale Monaghan 2 both 30 F 5 7 -065 Gate - Gate 2001 46500
Castleblaney (N) Monaghan 2 2nd half 40 A 3 5 -073 Gate - Bend 2000 2000 2007 132300
Carrickmacross (N) Monaghan 2 half 40 A 7 4 008 Gate - Bend 1998 1998 2005 92500 Ardee (S) Louth 2 half 30 A 4 9 -152 Gate - R170 Jcn 1997 1997 238300
Collon Louth 2 both 30 E 6 7 -038 Gate - Gate 1997 1996 251600 Slane Meath 2 both 30 A 8 5 048 Gate - Gate 2002 2001 534500
Kells Meath 3 both 30 A 8 8 -024 Gate - Gate 2001 730900 Castlebaldwin Sligo 4 both 30 A 5 2 062 Gate - Gate 1999 1998 547500
Dromod Leitrim 4 both 30 B 1 3 -052 Gate - Gate 2000 1999 2008 418300 Roosky (E) Leitrim 4 half 30 B 1 -025 Gate - Centre 1998 1997 2008 123300
Newtownforbes (E) Longford 4 1st half 30 F 1 2 -028 Gate - Bend 2001 2003 73800 Rathowen Westmeath 4 both 30 A 1 1 -002 Gate - Gate 1999 1999 369400
Clonard (E) Meath 4 half 40 B 1 1 -000 Gate - Centre 1997 2006 53200
Enfield Meath 4 both 30 C 8 2 114 Gate - Gate 1999 1998 2002 73900 CharlestownBellahy (WN) Mayo 5 half 30 A 7 132 Gates - Centre 1999 1998 2008 523400
Frenchpark Roscommon 5 both 30 F 5 3 032 Gate - Gate 2001 133600 Craughwell Galway 6 both 40 F 6 6 -015 Gate - Gate 2000 1999 30600
Rochfordbridge Westmeath 6 both 30 A 7 5 037 Gate - Gate 1998 1998 2006 199600 Miltownpass Westmeath 6 both 40 F 1 1 -002 Gate - Gate 2000 2000 2006 2005 248000
B1
Appendix B Evaluation of Traffic Calming Schemes Implemented 1997 ndash 2002
Scheme Local Authority Rte Both or Half Spd Lim Type Colls 4 yrs before raw
Colls 4 yrs after raw
Drop in Ann Colls Adj for
All Nats Area Evaluated Year
Finished Year
Started Year
Bypassed Year
Changed Total Cost in 2002 Prices
Moneygall Offaly 7 both 30 C 2 4 -056 Gate - Gate 2001 1997 2002 410900 Ballybrittas Laois 7 both 40 A 5 3 025 Gate - Gate 2002 2005 197900
Monasterevin (W) Kildare 7 half 30 G 4 1 064 Gate - Bridge 1998 1998 2005 29900
Cullahill Laois 8 both 40 A 1 2 -027 Gate - Gate 2000 1999 134200 Abbeyleix (S) Laois 8 half 30 A 1 4 -077 Gate - Centre 2000 2000 330700
Mullinavat (N) Kilkenny 9 half 30 G 6 3 057 Gate - Centre 2001 96600 Dungarvan Kilkenny 9 both 40 G 1 2 -028 Gate - Gate 2001 212700
Paulstown Kilkenny 9 both 30 A 2 046 Gate - Gate 1999 1998 184700 Kilkenny (E) Kilkenny 10 single entry 30 B 10 3 133 Gate - Centre 2001 195200
Claragh Kilkenny 10 both 60 F 2 2 -016 Gate - Gate 1999 206500 Camolin Wexford 11 both 30 A 5 1 073 Gate - Gate 2002 581000
Ashford Wicklow 11 both 30 E 16 7 160 Gate - Gate 1999 1998 2004 92300 Lifford (N amp W) Donegal 14 both 30 A 10 5 095 Gate - Gate 2001 70400
Castlefinn Donegal 15 both 30 A 4 1 063 Gate - Gate 2001 127500
Killygordon Donegal 15 both 30 H 2 2 -004 Gate - Gate 2002 113300 Ballybofey (S) Donegal 15 half 40 A 9 6 029 Gate - Centre 2002 246400
Ballyshannon (S) Donegal 15 2nd half 40 G 7 6 -006 Gate - Bridge 1997 1996 2006 159700 Bundoran Donegal 15 both 40 H 9 15 -163 Gate - Gate 1997 2006 41900
Cliffony Sligo 15 both 30 A 2 1 019 Gate - Gate 2001 143800 Grange Sligo 15 both 30 A 9 2 149 Gate - Gate 2000 1999 172500
Drumcliffe Sligo 15 both 30 F 7 5 033 Gate - Gate 2000 1999 259100 Ballindine Mayo 17 both 30 E 3 6 -091 Gate - Gate 1997 1997 106500
Claregalway Galway 17 both 30 A 3 7 -116 Gate - Gate 1998 1997 328300 Kilcolgan Galway 18 both 40 E 8 8 -042 Gate - Gate 1999 1999 2003 46200
Ardrahan Galway 18 both 30 J 6 1 096 Gate - Gate 1999 1999 46200
Crusheen (N) Clare 18 half 30 E 1 -025 Gate - Bend 1998 1997 2003 251400 Barefield (N) Clare 18 half 40 G 2 1 021 Gate - Centre 1998 1997 2007 251400
B2
Appendix B Evaluation of Traffic Calming Schemes Implemented 1997 ndash 2002
Scheme Local Authority Rte Both or Half Spd Lim Type Colls 4 yrs before raw
Colls 4 yrs after raw
Drop in Ann Colls Adj for
All Nats Area Evaluated Year
Finished Year
Started Year
Bypassed Year
Changed Total Cost in 2002 Prices
Charleville (S) Cork 20 1st half 30 A 2 2 -006 Gate - Ped X 2001 2004 165400
Ballyhea Cork 20 both 40 A 1 -025 Gate - Gate 1999 1999 784900
Newtwopothouse Cork 20 both 40 A 4 084 Gate - Gate 2001 165400
Cork (N) Cork 20 single entry 40 I 1 2 -030 Gate - Ped X 2002 239700
Farranfore Kerry 22 both 30 F 4 5 -032 Gate - Gate 1998 1998 2003 20000
Killarney (E) Kerry 22 single entry 40 D 8 3 085 Gate - Rbt 1998 1998 59900
Ballyvourney Cork 22 both 30 E 3 6 -090 Gate - Gate 2002 2001 570300
Lissarda Cork 22 both 40 A 4 4 -022 Gate - Gate 2002 333900
Ballincollig (W) Cork 22 half 30 B 10 8 041 Gate - Rbt 1997 1997 2004 496300
Cork (W) Cork 22 single entry 30 A 000 Gate - Vic X 1999 2004 193900
Monard South Tipperary 24 both 30 I 1 -025 Gate - Gate 1998 1998 39300
Bansha South Tipperary 24 both 30 I 2 2 -004 Gate - Gate 2001 138400
Kilsheelan South Tipperary 24 both 30 A 2 043 Gate - Gate 1999 1997 2007 194500
Carrick-on-Suir (W) South Tipperary 24 2nd half 30 A 3 066 Gate - Mini Rbt 2001 211900
Mooncoin Kilkenny 24 both 30 F 5 8 -088 Gate - Gate 1998 1998 140000
Lemybrien Waterford 25 both 40 A 1 1 -002 Gate - Gate 1998 1997 165700
Waterford (E) Kilkenny 25 single entry 30 A 5 1 084 Gate - Rbt 1997 1997 63900
Ballinaboola Wexford 25 both 30 A 3 3 -024 Gate - Gate 1999 1999 554100
Barntown Wexford 25 both 40 A 1 2 -037 Gate - Gate 1997 1997 639000
Kilrane (W) Wexford 25 half 30 A 4 4 -025 Gate - Speed Lim 1999 1998 2004 300400
Rosslare Harbour (W) Wexford 25 single entry 15 E 000 Gate - Harbour 2001 2004 16000
Foxford Mayo 26 both 30 I 6 1 083 Gate - Gate 2001 33300
B3
Appendix B Evaluation of Traffic Calming Schemes Implemented 1997 ndash 2002
Scheme Local Authority Rte Both or Half Spd Lim Type Colls 4 yrs before raw
Colls 4 yrs after raw
Drop in Ann Colls Adj for
All Nats Area Evaluated Year
Finished Year
Started Year
Bypassed Year
Changed Total Cost in 2002 Prices
Clonroche Wexford 30 both 30 F 4 2 035 Gate - Gate 2001 20400
New Ross (N) Wexford 30 both 30 A 2 4 -060 Gate - Gate 2002 47500
Smithborough (W) Monaghan 54 half 30 A 2 1 019 Gate - Centre 2001 56900
Carrickboy Longford 55 both 40 H 2 3 -037 Gate - Gate 2002 57100
Gortahork Donegal 56 both 30 I 1 5 -105 Gate - Gate 2002 45500
Dromore West Sligo 59 both 30 A 4 084 Gate - Gate 2000 156200
Ballisodare Sligo 59 both 30 A 000 Gate - Speed Lim 2002 1997 142700
Hodson Bay Roscommon 61 both 40 A 5 112 Gate - Gate 2001 432500
Birr Offaly 62 both 30 C 15 9 087 Gate - Gate 2001 94700
Loughrea (W) Galway 66 single entry 30 I 1 3 -052 Gate - N6 Jcn 1999 1999 55400
Ballylickey Cork 71 both 40 I 1 2 -037 Gate - Gate 1997 228500
Bantry (N) Cork 71 half 30 E 5 5 -027 Gate - Centre 2002 115600
Clonakilty Cork 71 both 30 C 4 1 059 Gate - Gate 1999 331600
Grangemockler South Tipperary 76 both 30 I 2 042 Gate - Gate 1998 1998 2003 51900
Kilkenny (N) Kilkenny 77 single entry 30 E 6 8 -068 Gate - Centre 2001 195200
Newtown Laois 78 both 40 A 5 1 073 Gate - Gate 2002 181400
Killeigh Offaly 80 both 30 B 000 Gate - Gate 1999 1999 97400
Kilmaine (N) Mayo 84 half 30 B 1 019 Gate - R332 Jcn 1998 99800
Swanlinbar (S) Cavan 87 half 30 E 1 1 -005 Gate - Centre 2002 39900
B4
Appendix C
Evaluation of Traffic Calming Schemes Implemented 1997 ndash 2002 APPENDIX C Collision Data Cost Data and First Year Rate of Return for All Sites
Location Rte Yr Construction Cost
4 Years Before 4 Years After Drop in Annual Collisions adjusted Cost Saving from Drop in Collision
Yearly Rate of Return
F S M Tot F S M Tot F S M Tot F S M Tot
Carrickarnon 1 01 109400 3 1 11 15 1 1 8 10 046 -009 042 079 1047600 -27300 12600 1032900 944
Greengates 1 97 489900 2 1 5 8 0 0 2 2 043 013 074 130 969700 40900 22200 1032800 211
KilsaranCastlebellingham 1 97 255600 1 5 17 23 1 0 9 10 -004 067 197 260 -85200 204700 59000 178500 70
Julianstown 1 99 767700 0 3 10 13 1 1 8 10 -025 017 032 024 -570000 53300 9500 -507200 -66
Emyvale 2 01 46500 0 0 5 5 0 2 5 7 000 -050 -015 -065 0 -152300 -4500 -156800 -337
Castleblaney (N) 2 00 132300 0 2 1 3 0 2 3 5 000 -021 -052 -073 0 -62800 -15600 -78400 -59
Carrickmacross (N) 2 98 92500 0 5 2 7 0 0 4 4 000 062 -054 008 0 188700 -16100 172600 187
Ardee (S) 2 97 238300 1 2 1 4 1 4 4 9 -004 -073 -075 -152 -85200 -222700 -22600 -330500 -139
Collon 2 97 251600 0 1 5 6 0 3 4 7 000 -062 024 -038 0 -187500 7200 -180300 -72
Slane 2 02 534500 3 2 3 8 0 0 5 5 077 036 -065 048 1761000 109400 -19400 1851000 346
Kells 3 01 730900 0 0 8 8 1 1 6 8 -025 -025 026 -024 -570000 -76200 7800 -638400 -87
Castlebaldwin 4 99 547500 1 0 4 5 0 0 2 2 020 000 043 062 451800 0 12800 464600 85
Dromod 4 00 418300 0 0 1 1 0 2 1 3 000 -050 -002 -052 0 -152300 -600 -152900 -37
Roosky (E) 4 98 123300 0 0 0 0 0 0 1 1 000 000 -025 -025 0 0 -7500 -7500 -6
Newtownforbes (E) 4 01 73800 0 0 1 1 0 0 2 2 000 000 -028 -028 0 0 -8400 -8400 -11
Rathowen 4 99 369400 0 0 1 1 0 1 0 1 000 -025 023 -002 0 -76200 6900 -69300 -19
Clonard (E) 4 97 53200 0 0 1 1 0 0 1 1 000 000 -000 -000 0 0 -100 -100 -0
Enfield 4 99 73900 1 2 5 8 0 0 2 2 020 028 066 114 451800 86300 19700 557800 755
CharlestownBellahy (WN) 5 99 523400 1 3 3 7 0 0 0 0 020 042 069 132 451800 129400 20800 602000 115
Frenchpark 5 01 133600 2 1 2 5 0 1 2 3 047 -009 -006 032 1078400 -27300 -1800 1049300 785
Craughwell 6 00 30600 1 0 5 6 0 0 6 6 020 000 -035 -015 454600 0 -10400 444200 1452
Rochfordbridge 6 98 199600 0 0 7 7 0 0 5 5 000 000 037 037 0 0 11200 11200 6
Miltownpass 6 00 248000 0 0 1 1 0 0 1 1 000 000 -002 -002 0 0 -600 -600 -0
Moneygall 7 01 410900 0 0 2 2 0 2 2 4 000 -050 -006 -056 0 -152300 -1800 -154100 -38
C1
Appendix C Evaluation of Traffic Calming Schemes Implemented 1997 ndash 2002
Location Rte Yr Construction Cost
4 Years Before 4 Years After Drop in Annual Collisions adjusted Cost Saving from Drop in Collision
Yearly Rate of Return
F S M Tot F S M Tot F S M Tot F S M Tot
Ballybrittas 7 02 197900 0 0 5 5 0 0 3 3 000 000 025 025 0 0 7600 7600 4
Monasterevin (W) 7 98 29900 1 0 3 4 0 0 1 1 019 000 045 064 434000 0 13400 447400 1496
Cullahill 8 00 134200 0 0 1 1 1 0 1 2 -025 000 -002 -027 -570000 0 -600 -570600 -425
Abbeyleix (S) 8 00 330700 0 0 1 1 0 1 3 4 000 -025 -052 -077 0 -76200 -15600 -91800 -28
Mullinavat (N) 9 01 96600 0 0 6 6 0 0 3 3 000 000 057 057 0 0 17100 17100 18
Dungarvan 9 01 212700 0 0 1 1 0 0 2 2 000 000 -028 -028 0 0 -8400 -8400 -4
Paulstown 9 99 184700 0 0 2 2 0 0 0 0 000 000 046 046 0 0 13900 13900 8
Kilkenny (E) 10 01 195200 0 2 8 10 0 1 2 3 000 007 126 133 0 21600 37800 59400 30
Claragh 10 99 206500 1 1 0 2 0 0 2 2 020 014 -050 -016 451800 43100 -15000 479900 232
Camolin 11 02 581000 0 1 4 5 0 0 1 1 000 018 055 073 0 54700 16600 71300 12
Ashford 11 99 92300 0 4 12 16 0 1 6 7 000 032 128 160 0 96400 38400 134800 146
Lifford (N amp W) 14 01 70400 0 0 10 10 0 0 5 5 000 000 095 095 0 0 28500 28500 40
Castlefinn 15 01 127500 0 0 4 4 0 0 1 1 000 000 063 063 0 0 18900 18900 15
Killygordon 15 02 113300 1 0 1 2 0 0 2 2 026 000 -030 -004 587000 0 -9000 578000 510
Ballybofey (S) 15 02 246400 0 1 8 9 0 1 5 6 000 -007 036 029 0 -21500 10700 -10800 -4
Ballyshannon (S) 15 97 159700 2 2 3 7 0 1 5 6 043 002 -051 -006 969700 5700 -15200 960200 601
Bundoran 15 97 41900 0 1 8 9 0 4 11 15 000 -087 -077 -163 0 -263700 -23000 -286700 -684
Cliffony 15 01 143800 0 0 2 2 0 1 0 1 000 -025 044 019 0 -76200 13200 -63000 -44
Grange 15 00 172500 0 1 8 9 1 0 1 2 -025 015 159 149 -570000 44800 47800 -477400 -277
Drumcliffe 15 00 259100 1 0 6 7 1 1 3 5 -005 -025 063 033 -115400 -76200 19000 -172600 -67
Ballindine 17 97 106500 1 1 1 3 0 2 4 6 021 -037 -075 -091 484800 -111400 -22600 350800 329
Claregalway 17 98 328300 0 1 2 3 0 2 5 7 000 -038 -079 -116 0 -114600 -23600 -138200 -42
Kilcolgan 18 99 46200 0 3 5 8 0 1 7 8 000 017 -059 -042 0 53300 -17800 35500 77
Ardrahan 18 99 46200 0 2 4 6 0 0 1 1 000 028 068 096 0 86300 20300 106600 231
Crusheen (N) 18 98 251400 0 0 0 0 0 1 0 1 000 -025 000 -025 0 -76200 0 -76200 -30
Barefield (N) 18 98 251400 0 0 2 2 0 1 0 1 000 -025 046 021 0 -76200 13900 -62300 -25
Charleville (S) 20 01 165400 0 0 2 2 0 1 1 2 000 -025 019 -006 0 -76200 5700 -70500 -43
C2
Appendix C Evaluation of Traffic Calming Schemes Implemented 1997 ndash 2002
Location Rte Yr Construction Cost
4 Years Before 4 Years After Drop in Annual Collisions adjusted Cost Saving from Drop in Collision
Yearly Rate of Return
F S M Tot F S M Tot F S M Tot F S M Tot
Ballyhea 20 99 784900 0 0 0 0 0 0 1 1 000 000 -025 -025 0 0 -7500 -7500 -1
Newtwopothouse 20 01 165400 1 1 2 4 0 0 0 0 024 016 044 084 539200 48900 13200 601300 364
Cork (N) 20 02 239700 0 0 1 1 0 0 2 2 000 000 -030 -030 0 0 -9000 -9000 -4
Farranfore 22 98 20000 0 0 4 4 0 0 5 5 000 000 -032 -032 0 0 -9700 -9700 -49
Killarney (E) 22 98 59900 1 2 5 8 1 0 2 3 -006 025 066 085 -136000 75500 19800 -40700 -68
Ballyvourney 22 02 570300 0 0 3 3 2 0 4 6 -050 000 -040 -090 -1140000 0 -11900 -1151900 -202
Lissarda 22 02 333900 0 1 3 4 0 1 3 4 000 -007 -015 -022 0 -21500 -4400 -25900 -8
Ballincollig (W) 22 97 496300 2 0 8 10 1 0 7 8 018 000 023 041 399700 0 7000 406700 82
Cork (W) 22 99 193900 0 0 0 0 0 0 0 0 000 000 000 000 0 0 0 0 0
Monard 24 98 39300 0 0 0 0 0 0 1 1 000 000 -025 -025 0 0 -7500 -7500 -19
Bansha 24 01 138400 1 0 1 2 0 1 1 2 024 -025 -003 -004 539200 -76200 -900 462100 334
Kilsheelan 24 99 194500 1 0 1 2 0 0 0 0 020 000 023 043 451800 0 6900 458700 236
Carrick-on-Suir (W) 24 01 211900 0 0 3 3 0 0 0 0 000 000 066 066 0 0 19800 19800 9
Mooncoin 24 98 140000 1 0 4 5 1 1 6 8 -006 -025 -057 -088 -136000 -76200 -17200 -229400 -164
Lemybrien 25 98 165700 0 0 1 1 0 1 0 1 000 -025 023 -002 0 -76200 7000 -69200 -42
Waterford (E) 25 97 63900 1 1 3 5 0 0 1 1 021 013 049 084 484800 40900 14800 540500 846
Ballinaboola 25 99 554100 0 2 1 3 0 1 2 3 000 003 -027 -024 0 10100 -8100 2000 0
Barntown 25 97 639000 0 1 0 1 0 0 2 2 000 013 -050 -037 0 40900 -15000 25900 4
Kilrane (W) 25 99 300400 0 2 2 4 0 2 2 4 000 -022 -004 -025 0 -66000 -1100 -67100 -22
Rosslare Harbour (W) 25 01 16000 0 0 0 0 0 0 0 0 000 000 000 000 0 0 0 0 0
Foxford 26 01 33300 0 4 2 6 0 0 1 1 000 064 019 083 0 195400 5700 201100 604
Clonroche 30 01 20400 2 1 1 4 1 0 1 2 022 016 -003 035 508400 48900 -900 556400 2727
New Ross (N) 30 02 47500 0 0 2 2 0 1 3 4 000 -025 -035 -060 0 -76200 -10500 -86700 -183
Smithborough (W) 54 01 56900 0 0 2 2 0 0 1 1 000 000 019 019 0 0 5700 5700 10
Carrickboy 55 02 57100 0 1 1 2 0 1 2 3 000 -007 -030 -037 0 -21500 -9000 -30500 -53
Gortahork 56 02 45500 0 0 1 1 1 0 4 5 -025 000 -080 -105 -570000 0 -24000 -594000 -1305
Dromore West 59 00 156200 0 1 3 4 0 0 0 0 000 015 069 084 0 44800 20700 65500 42
C3
Appendix C Evaluation of Traffic Calming Schemes Implemented 1997 ndash 2002
Location Rte Yr Construction Cost
4 Years Before 4 Years After Drop in Annual Collisions adjusted Cost Saving from Drop in Collision
Yearly Rate of Return
F S M Tot F S M Tot F S M Tot F S M Tot
Ballisodare 59 02 142700 0 0 0 0 0 0 0 0 000 000 000 000 0 0 0 0 0
Hodson Bay 61 01 432500 1 0 4 5 0 0 0 0 024 000 088 112 539200 0 26400 565600 131
Birr 62 01 94700 0 3 12 15 0 1 8 9 000 023 064 087 0 70400 19200 89600 95
Loughrea (W) 66 99 55400 0 0 1 1 0 1 2 3 000 -025 -027 -052 0 -76200 -8100 -84300 -152
Ballylickey 71 97 228500 0 1 0 1 0 1 1 2 000 -012 -025 -037 0 -35200 -7500 -42700 -19
Bantry (N) 71 02 115600 0 1 4 5 0 0 5 5 000 018 -045 -027 0 54700 -13400 41300 36
Clonakilty 71 99 331600 0 1 3 4 0 0 1 1 000 014 044 059 0 43100 13300 56400 17
Grangemockler 76 98 51900 1 0 1 2 0 0 0 0 019 000 023 042 434000 0 7000 441000 850
Kilkenny (N) 77 01 195200 0 0 6 6 0 0 8 8 000 000 -068 -068 0 0 -20400 -20400 -10
Newtown 78 02 181400 0 1 4 5 0 1 0 1 000 -007 080 073 0 -21500 24100 2600 1
Killeigh 80 99 97400 0 0 0 0 0 0 0 0 000 000 000 000 0 0 0 0 0
Kilmaine (N) 84 98 99800 1 0 0 1 0 0 0 0 019 000 000 019 434000 0 0 434000 435
Swanlinbar (S) 87 02 39900 0 0 1 1 0 0 1 1 000 000 -005 -005 0 0 -1500 -1500 -4
19457200 36 72 300 408 15 52 235 302 411 -249 920 1082 9376400 -759100 276100 8892000 46
C4
9
Evaluation of Traffic Calming Schemes Implemented 1997 ndash 2002Appendix B
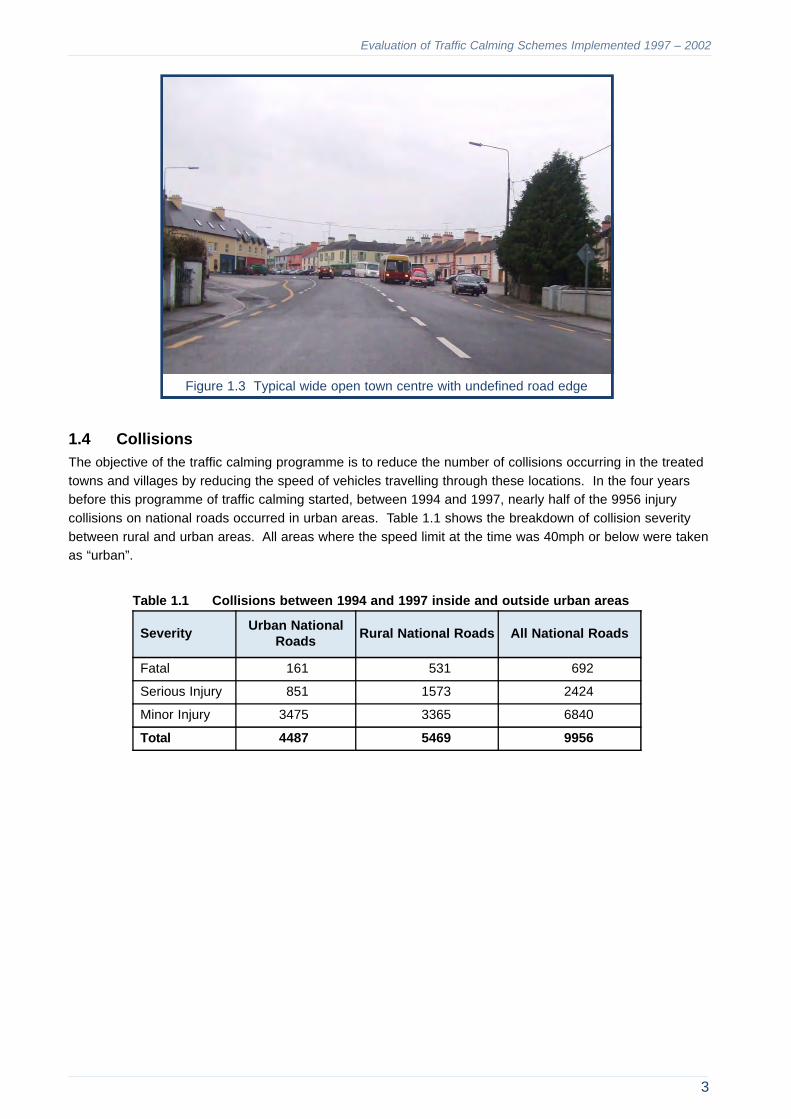
Evaluation of Traffic Calming Schemes Implemented 1997 ndash 2002
Figure 13 Typical wide open town centre with undefined road edge
14 Collisions The objective of the traffic calming programme is to reduce the number of collisions occurring in the treated towns and villages by reducing the speed of vehicles travelling through these locations In the four years before this programme of traffic calming started between 1994 and 1997 nearly half of the 9956 injury collisions on national roads occurred in urban areas Table 11 shows the breakdown of collision severity between rural and urban areas All areas where the speed limit at the time was 40mph or below were taken as ldquourbanrdquo
Table 11 Collisions between 1994 and 1997 inside and outside urban areas
Severity Urban National Roads Rural National Roads All National Roads
Fatal 161 531 692
Serious Injury 851 1573 2424
Minor Injury 3475 3365 6840
Total 4487 5469 9956
3
4
Evaluation of Traffic Calming Schemes Implemented 1997 ndash 2002
Evaluation of Traffic Calming Schemes Implemented 1997 ndash 2002
2 TRAFFIC CALMING SCHEMES
21 Criteria for Selection The criteria used for selection of towns and villages for traffic calming are set out in detail in the NRA document ldquoGuidelines On Traffic Calming For Towns And Villages On National Routesrdquo This was first published in 1999 and was updated in 2004
For the traffic calming programme over the years studied in this report (1997 ndash 2002) the criteria used to select sites for inclusion in the programme were those laid down in the Guidelines The period of implementation covered in this report starts in 1997 which was before the publication of the Guidelines However the principles were already in operation within the NRA Road Safety Group and the selection of sites in the early part of this period followed more or less the same process as the later ones
The main criterion was the collision history in and on approach to the village but data on all the following were collected when considering a location
Collisions Traffic flow Speed Geometry Future infrastructural developments
Collisions
The Guidelines states that selection based on collisions should take account of not just the simple collision numbers but should assess both risk per unit of travel and risk per head of population in the town or village In order to do this assessment a table was drawn up in 1999 listing these two risk categories for all towns and villages on national roads and ranking them according to a combination of the two categories The resulting table for national primary roads is reproduced in Appendix A but for illustration the 15 top ranking towns and villages on national primary roads are shown in Table 21 These 15 sites were all treated in the early years of the traffic calming programme 12 of them are among those examined in this report 3 were implemented before 1997 and were assessed in the preceding report to this
Table 21 Ranking of towns amp villages on national primary routes
Route Town Village Population AADT Length Colls over 5 yrs
Collisions per 10 Million VehKm
Collisions per year per
1000 Population
Combined Collision
Rate
N17 BALLINDINE 232 5058 0587 8 148 690 640
N25 KILRANE 214 5310 2255 10 46 935 559
N08 LITTLETON 566 5598 0591 10 166 353 508
N11 ASHFORD 500 12768 1352 19 60 760 501
N01 JULIANSTOWN 450 14270 1146 16 54 711 463
N05 FRENCHPARK 272 2994 0805 11 250 809 452
N02 COLLON 335 6164 0626 7 99 418 408
N18 KILCOLGAN 500 9565 0483 9 107 360 393
N08 WATERGRASSHILL 250 13706 0985 8 32 640 385
N01 CASTLEBELLINGHAM 762 10983 1891 20 53 525 368
N08 RATHCORMACK 500 11807 1158 11 44 440 308
N09 DUNGARVAN 500 3261 028 4 240 160 280
N04 DROMOD 250 3598 059 3 77 240 275
N20 CHARLEVILLE 3000 9655 1988 12 34 400 269
N25 LEMYBRIEN 222 6471 0918 4 37 360 254
5
Evaluation of Traffic Calming Schemes Implemented 1997 ndash 2002
Using the method of combining the two collision risk categories meant that small villages where there had been only a few collisions such as Dungarvan on N9 or Dromod on N4 ranked as highly as large towns with long lengths of national road and a higher number of collisions such as Charleville on N20 Thus several small villages where the actual collision numbers were low were given high priority in the traffic calming programme because the risk to road users from high speed traffic was comparatively high whereas many large towns with very much bigger numbers of actual collisions did not get priority
Speed
Selection is also based on the speed of vehicles in the towns and villages considered If speeds through a certain location were already low then that town or village was not given priority in the traffic calming programme Often this assessment would result in only one approach to a town or village being treated as described in section 32
Geometry
The other major criterion was the geometry of the road within the town or village considered If the separate physical elements that make up a traffic calming scheme especially that of narrowing the carriageway could not be applied to a certain location then a traffic calming scheme could not be fully implemented However several schemes were indeed implemented in towns and villages where the road width was already narrow prior to construction of the scheme These schemes often consisted of only signs and road markings this is discussed further in section 33
Other Factors
It must be acknowledged that several of the towns and villages assessed within this report did not have a collision history and did not have any record of high speeds before implementation of the traffic calming These sites were often selected for traffic calming because general road improvement work was scheduled at this location and traffic calming elements were incorporated into the work In some cases sites were selected solely on the basis of the perception of risk by residents and their representatives
22 Traffic Calming Measures The measures used as part of traffic calming break down into the four separate zones travelled through on approach to a town or village
bull the transition zone bull the gateway at the speed limit signs bull the zone inside the gateway bull the village centre
In small villages with a short length of national road there is usually no distinction between the last two zones but in the larger villages and towns there is often a zone which is inside the speed limited area yet cannot be described as a town centre These zones typically have either low density housing with off-street parking or warehouse-type commercial premises with sparsely spaced accesses
6
Evaluation of Traffic Calming Schemes Implemented 1997 ndash 2002
Transition Zone The principle behind traffic calming design is to change the driverrsquos perception of the surrounding environshyment
Figure 21 Transition zone approaching village
The ldquooptical widthrdquo perceived by the driver is dependent on the width between the boundaries of the road relative to the height of the adjoining vertical elements Generally in rural sections the width between fences is many times greater than the height of the hedges walls or fences which form the boundaries In urban streets the height of the buildings is generally greater than the width A driverrsquos perception of the appropriate driving speed is influenced by this relationship Speeds are lower where the height of the vertical elements is greater than the width of the road
Traffic calming aims to create a narrow optical width on the approach into towns and villages by using a combination of carriageway narrowing landscape treatment and the introduction of vertical elements such as signs lighting columns and trees Typically transition zone signs consist of a pair of ldquoTraffic Calming Aheadrdquo signs 400m from gateway and a pair of ldquoDo Not Passrdquo signs at 200m from the gateway
Gateway
The Gateway is placed at the start of the speed limited zone It should mark a definite change in the character of the surrounding area from rural to urban Therefore it needs to be conspicuous and the most prominent element in the transition zone The tall signs positioned close to the driving lane narrow the optical width
The guidelines recommend that where a town or village has two zones of speed limits first a 60kmh on the outskirts and then a 50kmh limit for the main body of the town the gateway should be placed at the change from 60kmh to 50kmh This is because usually the 50kmh limit has been placed at the edge of the properly built up area and the 60kmh zone covers the approach into the town where development is much less dense The design engineer can however choose to place the gateway at the 60kmh if surrounding development and environment are appropriate for this This has been done in a few of the cases examined
7
Evaluation of Traffic Calming Schemes Implemented 1997 ndash 2002
Figure 22 A gateway
Gateways fall into two distinct groups those with a solid kerbed central island and those with no island Early results from the first batch of traffic calming schemes constructed indicated that the presence of a central island at the gateway was a determining factor in the success of the scheme and the evaluation in this document confirms this The central island greatly increases the visual narrowing effect and the central lighting column signs and bollards are directly in the centre of the driverrsquos field of view
The gateway is always lit to a high standard with special gateway lanterns that shine directly onto the gateway signs This is not only effective in the dark during daylight hours the presence of lighting columns enhances the narrow optical width and is often noted subconsciously by the driver as an indication of an urban area
Inside Gateway
Treatment of the stretch of road between the gateway and the village centre is an important aspect of traffic calming The narrowing introduced at the gateway is continued so that the speed reduction occurring at the gateway is maintained on the driverrsquos journey through the town
This narrowing can be done by introducing any or all of the following central islands footpaths side kerb buildouts lining hatched markings and defined parking bays A shallow chicane can also sometimes be introduced by alternating side buildouts and parking between the two sides of the road The objectives are both to keep the driving lanes at no greater than 35m width and to give a visual impression to the driver of an urban area
Only narrowing and horizontal deflections are used as measures in traffic calming installations on national routes Vertical deflections such as humps or cushions are not appropriate because of the roadsrsquo function as main distributors between the major urban areas of the country Emergency vehicles and buses cannot easily negotiate routes where vertical deflection has been installed
As every gateway must be provided with lighting to illuminate the signs the infrastructure to supply street lighting needs to be provided at each end of the town or village It therefore follows that the supply for lightshying is usually available over the whole length of the village and lighting is provided over the full length of the scheme from gateway to gateway In the cases examined there are a few exceptions to this but even these few villages have street lighting for almost all of their length with only a few short gaps where no lamps are provided
8
Evaluation of Traffic Calming Schemes Implemented 1997 ndash 2002
Figure 23 Inside gateway
Town or Village Centre
In the town centre there is often not a need for narrowing works as part of the traffic calming as parking bays and footpaths may already exist However in locations where there is a wide road passing through the village centre it is necessary to narrow and define the through route with kerbing Even in locations where the through route is already well defined with kerbing and parking bays extra measures are usually required at junctions and where pedestrians wish to cross the national road or to cross side roads while walking along the main street
Typical works in the town centre are
bull definition of the limits of existing parking using kerb buildouts bull definition of junctions by the use of kerb buildouts bull provision of either pedestrian crossings or central islands to aid pedestrians in crossing
The main objective in the centre of the town or village is to provide a safe and pleasant environment that can easily be negotiated by vulnerable road users Thus it is important to provide safe places to cross where pedestrians are clearly visible to passing traffic and wide footpaths so that pedestrians are not forced to step into the road when passing others This often necessitates a reduction in the number of on street parking spaces and it can be difficult to persuade the local residents to accept this Extra off-street parking may have to be provided as part of the traffic calming scheme However there is a clear road safety advantage in both providing better facilities for pedestrians and in moving parking to off-street facilities Quite apart from the pedestrian collisions that result from vehicles reversing in and out of parking spaces and from parked vehicles masking crossing pedestrians as they step out onto the road many minor material damage collisions occur as vehicles pull in and out of parking spaces on busy through routes
9
Evaluation of Traffic Calming Schemes Implemented 1997 ndash 2002
Figure 24 Centre of village
23 Amendments to Design in 2004 The Guidelines on Traffic Calming were revised in 2004 Some of the changes made in this revision arose directly from problems encountered during construction and consequent operation of the schemes evaluated here There were numerous minor amendments but two of the main changes to design are worth notingshy
a) Increase of setback of signs The setback distance of the edge of the gateway signs from the kerb was originally specified as 600mm This width of setback was thought to provide enough clearance for overhanging loads on large vehicles while still giving the visual narrowing effect that was needed for the traffic calming gateway to be effective However in practice many gateway signs installed to this specification were hit glancing blows by passing large vehicles especially in areas where there was a significant proportion of agricultural vehicles in the mix of traffic
Consequently the specification was changed to a setback of 1m from the kerb So far this increased width appears to have succeeded in reducing the number of signs damaged by overhanging loads
b) Increase of ldquoexitrdquo width Where a central island is provided at a gateway the island and its signs and lighting column all form an obstruction for any abnormally wide load wishing to pass Whenever a wide load wishes to use the route through a village with this design of traffic calming the central lighting columns at each gateway must be temporarily disconnected and removed resulting in much inconvenience and an extra workload for the local authority and electricity supply engineers
To try to avoid this lengthy process of disconnection and removal an alternative design for gateways was put forward with extra width on the ldquoexitrdquo half of the gateway such that the width between edge kerb and central island on the lane for traffic approaching the village remains at the original 35m specified but the corresponding width on the lane for traffic leaving the village could be increased to anything up to 6m This design manages to keep the narrow optical effect for drivers approaching the village but provides an alternative route for wide loads which are guided through the approach to the village on the exit side of the central island
10
Evaluation of Traffic Calming Schemes Implemented 1997 ndash 2002
3 TRAFFIC CALMING SCHEMES 1997 - 2002
31 Schemes Implemented over Period 1997 - 2002 Between 1997 and 2002 there were 94 traffic calming schemes completed at towns and villages on the national roads Three of these schemes could not be evaluated because the collision data in the before period was considered to be unduly influenced by traffic calming on the other approach to the same village that had been implemented before 1997
The remaining 91 towns and villages have been assessed in this study
Table 31 below gives the number of schemes constructed per year and their costs Table 32 shows the spread across the different counties and Table 33 shows the spread across the national routes Figure 31 shows the locations of all the 94 schemes implemented in the period examined A detailed list of the 91 locations assessed and the measures implemented is given in Appendix B
Table 31 Schemes implemented per year
Year No of Schemes
Cost euro (market prices at
time of construction)
Cost euro (2002 prices)
Average Cost per Scheme euro
(2002 prices)
1997 12 1803000 3024500 252000
1998 14 1178800 1852900 132300
1999 18 3691800 5369900 298300
2000 9 1445200 1882000 209100
2001 23 3496400 3881300 168800
2002 15 3446600 3446600 229800
TOTALS 91 15061800 19457200 213800
The number of schemes constructed each year stayed roughly constant the average being about 15 or 16 per year There was a slight dip in the number finished in 2000 but there was a corresponding rise the next year The bulk of construction for most schemes took place within one year but where schemes carried on into following years it is the final year that is taken as the year of construction
The average cost per scheme was euro214000 over the six years All costs in this report are market prices given in 2002 prices The cost of an individual scheme varies immensely from euro16000 to euro785000 (See Appendix B) but the measures implemented in each scheme also varied greatly Some schemes were simply the installation of just 12 signs on approach to a village others included extensive urban renewal works including the complete restructuring of drainage and electricity supply for the village
Table 32 and Figure 31 show a fairly even spread of traffic calming implementation geographically across the country but it can be clearly seen in Table 33 that the majority of schemes implemented were on national primary roads Of all the schemes examined 81 are on primary routes and in the early years this division is even more marked with 88 of schemes implemented in 1997 and 1998 being on primary routes The fact that mainly primary routes were treated in the early years of the traffic calming programme can be directly attributed to the geometry of the national routes through these towns and villages Approaches to many urban areas on the primary routes had been realigned and widened during the twenty to thirty years preceding the traffic calming programme allowing traffic to approach the town or village at increased speed This increased speed and the consequent increase in collisions then identified these towns and villages as priority sites for traffic calming treatment On national secondary routes there had not
11
Evaluation of Traffic Calming Schemes Implemented 1997 ndash 2002
been such a widespread programme of realignment and widening and approaches to urban areas have mostly remained narrow Consequently on national secondary roads speeds are not so high on the approaches to urban areas collision rates also are not high and few towns and villages on secondary roads have met the criteria for the traffic calming programme
Table 32 Schemes implemented per year by county
Local Authority 1997 1998 1999 2000 2001 2002 Total
Cavan 1 1
Clare 2 2
Cork 2 3 2 4 11
Donegal 2 2 3 7
Galway 1 3 1 5
Kerry 2 2
Kildare 1 1
Kilkenny 1 1 2 4 8
Laois 2 2 4
Leitrim 1 1 2
Longford 1 1 2
Louth 4 1 5
Mayo 1 1 1 1 4
Meath 1 2 1 1 5
Monaghan 1 1 2 4
Offaly 1 2 3
Roscommon 2 2
Sligo 1 3 1 1 6
South Tipperary 2 1 2 5
Waterford 1 1
Westmeath 1 1 1 3
Wexford 1 2 2 2 7
Wicklow 1 1
Total 12 14 18 9 23 15 91
12
Evaluation of Traffic Calming Schemes Implemented 1997 ndash 2002
Figure 31 Locations of traffic calming schemes 1997 to 2002
13
Evaluation of Traffic Calming Schemes Implemented 1997 ndash 2002
Table 33 Schemes implemented per year by route
Route 1997 1998 1999 2000 2001 2002 Total
1 2 1 1 4
2 2 1 1 1 1 6
3 1 1
4 1 1 3 1 1 7
5 1 1 2
6 1 2 3
7 1 1 1 3
8 2 2
9 1 2 3
10 1 1 2
11 1 1 2
14 1 1
15 2 2 2 2 8
17 1 1 2
18 2 2 4
20 1 2 1 4
22 1 2 1 2 6
24 2 1 2 5
25 2 1 2 1 6
26 1 1
30 1 1 2
54 1 1
55 1 1
56 1 1
59 1 1 2
61 1 1
62 1 1
66 1 1
71 1 1 1 3
76 1 1
77 1 1
78 1 1
80 1 1
84 1 1
87 1 1
National Primary 11 12 15 8 19 9 74
National Secondary 1 2 3 1 4 6 17
Total 12 14 18 9 23 15 91
14
Evaluation of Traffic Calming Schemes Implemented 1997 ndash 2002
32 Towns and Villages With Only One End Treated
At 33 of the 94 locations implemented between 1997 and 2002 only one approach to the town or village was treated with traffic calming within this period
In 8 of these cases the one approach treated was the only entry of that route into a large town or city or into a coastal town where the route ended
In 6 of these towns and villages the other approach had already been treated in previous years before 1997 and the second treatment completed the traffic calming for the location In 3 of these villages it was considered that the first phase of traffic calming would have had an effect on collisions in the very same area that was influenced by the second phase Thus the ldquobeforerdquo data for the second phase of work would not have been usable and it was not possible to evaluate changes in collision data These are the three locations that have been removed from the evaluation The other three towns were large enough for the areas of influence from each phase of traffic calming not to overlap and consequently the collision data was not influenced by the first phase
In 2 towns the traffic calming within the study period 1997 - 2002 was the first phase in a two phase implementation and the second approach has since been treated in subsequent years In each of these towns the two areas of influence from the separate phases of work are considered not to overlap and so these two have been included in the study
For each scheme the ldquoevaluated areardquo over which the traffic calming is considered to have had an effect on collisions is described in the scheme details in Appendix B
In the other 17 cases the decision to treat only one approach was generally taken because the other end of town was not considered a suitable case for traffic calming The reasons for this were varied but broadly fell into two different categories
a) An existing feature in the road such as a right angled bend narrow bridge or a roundabout already acted as a measure to slow approaching traffic such as the northern approach to Ardee on N2 or the southern approach to Crusheen on N18
b) Traffic approaching the town or village from this particular direction was observed to be travelling slowly in general and did not need to be slowed further Usually this was because another nearby town or village had effectively slowed the traffic down and drivers had not yet regained the feel of an open road and speeded up The western approach from Dromod to Roosky on N4 and the southern approach from Ennis to Barefield on N18 are examples of this
15
Evaluation of Traffic Calming Schemes Implemented 1997 ndash 2002
33 Different Designs of Scheme
As traffic calming schemes are made up of all the different elements described in section 22 there is a very large number of variations possible but the 91 schemes examined can be broadly divided into 10 different types as follows-
A Gateway with side buildouts and central island Definition inside village using central islands and narrowing with kerbs
B Gateway with side buildouts and central island Definition inside village using narrowing with kerbs but no islands
C Gateway with side buildouts and central island Definition inside village using line marking only
D Gateway with side buildouts and central island No definition inside village
E Gateway with side buildouts only Definition inside village using central islands and narrowing with kerbs
F Gateway with side buildouts only Definition inside village using narrowing with kerbs but no islands
G Gateway with side buildouts only Definition inside village using line marking only
H Gateway signs only Definition inside village using line marking only
I Gateway signs only No definition inside village
J No gateway Definition inside village using narrowing with kerbs but no islands
Table 34 shows the number of schemes in each category and whether the traffic calming was done at both ends of the town or village or whether it was installed only at one end Towns and villages where traffic calming was constructed at only one end are indicated in Figure 31 and in the appendices lists by (W) (N) (E) or (S) following the town name
Table 34 Types of traffic calming schemes
Type Treatment no of villages
both ends
one end
A Central island gateway central islands amp narrowing with kerbs inside 39 29 10
B Central island gateway narrowing with kerbs amp no islands inside 8 3 5
C Central island gateway and lining 5 5
D Central island gateway and nothing else 1 1
E Simple gateway central islands amp narrowing with kerbs insides 10 5 5
F Simple gateway narrowing with kerbs amp no islands inside 11 10 1
G Simple gateway and lining 5 2 3
H Gateway signs and lining 3 3
I Gateway signs and nothing else 8 6 2
J No gateway narrowing with kerbs amp no islands inside 1 1
Total 91 64 27
16
Evaluation of Traffic Calming Schemes Implemented 1997 ndash 2002
The largest single category is type A with a gateway with side buildouts and central island with a string of central islands through the village approach and in the centre and also narrowing from the side with kerb buildouts through the approach and centre Most of the 39 schemes in this category give the full impression of a village at the point of passing the gateway and most have footpaths throughout the scheme from gateway to gateway They all have street lighting through the entire scheme
Another 14 sites have the full gateway with a central island and side buildouts but do not have such extensive works inside the village These fall into categories B C and D Types A B C and D are generally on national primary routes very few are on secondary routes Figure 32 illustrates a typical gateway into such a village where the wide carriageway is narrowed by kerbing the hard shoulder and inserting a central island
Figure 32 Typical gateway for types A B C and D
The next two biggest single categories are type E with 10 schemes and type F with 11 schemes These types along with type G have a gateway that has no central island but which does narrow the road using kerbed buildouts at the side of the road usually in the hard shoulder Types E F and G were installed at towns where the width of the approach into town was wide enough to warrant traffic calming but was less than the 157m minimum needed to accommodate central island signs and cycle bypass Types E F and G have varying degrees of definition work inside the village similar to types A B and C Figure 33 illustrates a typical gateway into such a village where the wide carriageway is narrowed by kerbing the hard shoulder but there is no central island
Types H and I do not have physical works at the gateway at all Typically there is no hard shoulder at these sites and the gateway signs and transition zone signs are simply installed on the verge In type H schemes some visual narrowing has been implemented inside the village using line markings and hatching but in type I there is nothing done other than installation of the gateway and transition zone signs The one scheme that was installed on a dual carriageway approach to a city falls into the category of type H Figure 34 illustrates a typical gateway into such a village where there is no narrowing or kerbs installed just signs placed in the verge
17
Evaluation of Traffic Calming Schemes Implemented 1997 ndash 2002
Figure 33 Typical gateway for types E F and G
Figure 34 Typical gateway for types H and I
One scheme examined in this report had neither gateway signs nor transition zone installed However extensive works were done in the centre of the small village to narrow the carriageway and define the parking areas behind kerbs This village does not fall into any the other categories and is the only type J in the study
For the purposes of examining results types A B C and D can be grouped together as a ldquoCentral Island Gatewayrdquo category types E F and G can be grouped together as a ldquoSimple Gatewayrdquo category and types H and I can be grouped together as a ldquoSigns Onlyrdquo category
Table 35 shows the incidence of each type of traffic calming scheme on each national routes Although there is a wide spread of types across all roads it can be seen that types A B C and D are mostly on the national primary roads while types H and I are largely on the national secondary routes and those sections of national primaries where widening has not taken place
18
Evaluation of Traffic Calming Schemes Implemented 1997 ndash 2002
Table 35 Types of traffic calming schemes by route
Route Type of Scheme
A B C D E F G H I J No in Study
1 1 1 1 1 4
2 4 1 1 6
3 1 1
4 2 3 1 1 7
5 1 1 2
6 1 2 3
7 1 1 1 3
8 2 2
9 1 2 3
10 1 1 2
11 1 1 2
14 1 1
15 4 1 1 2 8
17 1 1 2
18 2 1 1 4
20 3 1 4
22 2 1 1 1 1 6
24 2 1 2 5
25 5 1 6
26 1 1
30 1 1 2
54 1 1
55 1 1
56 1 1
59 2 2
61 1 1
62 1 1
66 1 1
71 1 1 1 3
76 1 1
77 1 1
78 1 1
80 1 1
84 1 1
87 1 1
National Primary 34 6 3 1 7 11 5 2 4 1 74
National Secondary 5 2 2 3 1 4 17
Total 39 8 5 1 10 11 5 3 8 1 91
19
20
Evaluation of Traffic Calming Schemes Implemented 1997 ndash 2002
Evaluation of Traffic Calming Schemes Implemented 1997 ndash 2002
4 EFFECTIVENESS IN REDUCING COLLISIONS
41 Collisions Before and After Scheme Implementation Collision numbers were measured at each of the 91 locations for the 4 years before and 4 years after implementation of each individual scheme The ldquoafterrdquo period was taken as beginning in the year after the final year of construction as the full effect of the scheme would not be noticeable during construction works Details of the collision data for each site are given in Appendix C but summary tables are given in this chapter
42 Area of Influence of Traffic Calming Works Collision numbers for both before and after data were taken from the map-based NRA Collision Database Only collisions taking place on the national routes were considered and any collision that was located within the length of road influenced by the traffic calming was included in the data This area of influence extended to 200m outside each gateway in order to take account of the effect of the transition zone Where only one side of a village was treated the area taken was from the gateway to the centre of the town Where an existing traffic calming feature existed within the speed limited zone on the entry into a town such as a sharp bend or a narrow bridge the area of influence was assumed to extend only as far as that feature Descriptions of the area of influence for each location are given in the detailed list of locations in Appendix B
43 Control Data This report takes account of the main confounding factors affecting these statistics Collision numbers in general on Irelandrsquos national roads have decreased throughout the before and after periods for these schemes and the assessment makes allowances for this trend Changes in traffic volume in patterns of traffic flow in population distribution in Garda enforcement and in attitude to road safety have all had an effect on collision rates on national roads in towns and villages whether or not traffic calming has been installed This effect is accommodated by adjusting the before and after data in line with a comparison group the collisions in each 4 year before and after period within all similar sized towns and villages on all national roads
The general trend nationwide within all towns and villages in the control group has been a drop in collisions of roughly 15 between before and after periods However the reduction varies markedly between the different collision rates fatal collisions have reduced by a similar percentage to the general trend but serious injury accidents have reduced by over 40 and minor injuries have reduced by only about 10 All reductions in collisions at the sites assessed in this study have to be compared against this general nationwide trend of a shift from serious injury to minor injury
The effect of ldquoregression to meanrdquo is more difficult to make allowances for in this study The random nature of road crashes tends to cause collision frequencies at specific locations to fluctuate The selection of towns and villages for treatment on the basis of their past collision record can introduce a source of potential bias in measuring the effectiveness of the scheme This arises because the selection process tends to pick sites at the peak of their fluctuations in collision frequencies and such sites might well have experienced reductions in collision rate in following years even if no treatment had been applied (Rune Elvik 2002)
To allow for the effect of regression to mean the change in collision rates at treated sites would need to be compared with a number of similar untreated control sites This could not have been done in the case of the traffic calming programme as no such control sites exist Whenever a town or village with a collision history was identified it was put on the programme for treatment with traffic calming it would have been considered unacceptable to leave the location untreated simply for the purposes of research
21
Evaluation of Traffic Calming Schemes Implemented 1997 ndash 2002
44 Effect on Collision Occurrence
Table 41 shows for each yearrsquos programme of traffic calming schemes the collisions over the 4 years before and after each scheme
Table 41 Collisions before and after scheme implementation for each yearrsquos programme
Year No of
Schemes
4 Years Before 4 Years After
Fatal Serious Minor Total Fatal Serious Minor Total
1997 12 10 16 52 78 3 15 51 69
1998 14 5 8 31 44 2 6 30 38
1999 18 5 23 54 82 1 8 36 45
2000 9 2 4 27 33 3 6 19 28
2001 23 10 13 95 118 3 12 59 74
2002 15 4 8 41 53 3 5 40 48
Total 91 36 72 300 408 15 52 235 302
The reduction in collisions for each yearrsquos programme is shown in Table 42 as is the adjusted reduction allowing for the general drop in collisions over the study years in the control group of other similar sites Table 43 shows these adjusted drops in annual terms and in percentages
All this data for each individual scheme can be seen in Appendix C
There is considerable fluctuation in results between each yearrsquos programme of traffic calming so it is best to concentrate on the overall figures for the entire six years
Over all 91 sites there was a drop of 106 collisions from 408 to 302
When adjusted for the general nationwide fall in collisions on similar sites this gives a total drop of 433 colshylisions or 108 per year
This is a 13 reduction on the collision numbers before implementation of the schemes
Table 42 Collision reductions for each yearrsquos programme
Year No of
Schemes
4 Year Reduction 4 Year Reduction Adjusted
Fatal Serious Minor Total Fatal Serious Minor Total
1997 12 7 1 1 9 55 -64 06 -03
1998 14 3 2 1 6 18 -20 -12 -15
1999 18 4 15 18 37 30 50 140 220
2000 9 -1 -2 8 5 -14 -36 59 08
2001 23 7 1 36 44 65 -37 246 274
2002 15 1 3 1 5 11 07 -71 -52
Total 91 21 20 65 106 164 -100 368 433
22
Evaluation of Traffic Calming Schemes Implemented 1997 ndash 2002
Table 43 Annual collision reductions for each yearrsquos programme
Year No of
Schemes
Annual Drop in Collisions Adjusted Percentage Drop in Collisions
Fatal Serious Minor Total Fatal Serious Minor Total
1997 12 14 -16 01 -01 65 -74 1 -0
1998 14 05 -05 -03 -04 47 -51 -4 -4
1999 18 07 13 35 55 75 39 28 33
2000 9 -04 -09 15 02 -88 -55 24 3
2001 23 16 -09 62 69 68 -44 29 27
2002 15 03 02 -18 -13 27 13 -21 -12
Total 91 41 -25 92 108 52 -24 14 13
While collisions of all severity types at the examined locations have reduced in actual numbers the decrease in serious injury collisions at these sites has not followed the general trend nationwide over this period on national roads which have experienced a particularly large decrease in serious injury collisions When allowing for the trend in the control data the actual reduction of 20 serious injury collisions in a 4 year period translates to a relative increase of 10 collisions
Looking at each individual severity type the adjusted reduction in fatal collisions is 164 or 41 per year and that in minor injury collisions is 368 or 92 per year The adjusted change in serious injury collisions is an increase of 25 per year These numbers represent a 52 drop in fatal collisions a 14 drop in minor injury collisions and a 24 rise in serious injury collisions
The implementation of traffic calming has clearly had a much more marked effect on fatal collisions than on other injury collisions resulting in a lowering of the severity of collisions overall Table 44 below shows for each year each severity category as a percentage of overall collisions in the 4 years before implementation and the 4 years after implementation It can be seen that in general for each yearrsquos programme except for year 2000 the proportion of fatal collisions has roughly halved the proportion of serious collisions has stayed much the same while that of minor collisions has slightly increased Looking at the entire six yearsrsquo programme in the four years before implementation of each traffic calming scheme fatal collisions constituted 9 of all collisions in these towns and villages while serious and minor injury collisions were 18 and 73 of the total respectively In the four years after implementation fatal collisions decreased to 5 of all collisions serious reduced very slightly to 17 and minor rose to 78
Table 44 Severities as a percentage of all collisions for each yearrsquos programme
Year No of
Schemes
Percentage of all Collisions 4 years before
Percentage of all Collisions 4 years after
Fatal Serious Minor Fatal Serious Minor
1997 12 13 20 67 4 22 74
1998 14 11 18 71 5 16 79
1999 18 6 28 66 2 18 80
2000 9 6 12 82 11 21 68
2001 23 8 11 81 4 16 80
2002 15 8 15 77 6 11 83
Total 91 9 18 73 5 17 78
It can therefore be concluded that implementation of these traffic calming schemes has not only reduced the number of collisions overall but has also reduced the average severity of those collisions that did occur
23
Evaluation of Traffic Calming Schemes Implemented 1997 ndash 2002
45 Statistical Significance Statistical significance is difficult to achieve with locations that have such small numbers of individual collisions However the chi squared test was used to compare the results with the control data and the overall result for all sites indicates an 80 confidence level meaning that there is a 20 chance that the observed reduction in collisions is due to mere random fluctuation
46 Collision Costs and Economic Evaluation Collision costs are calculated using figures from the Goodbody report on Cost-Benefit Analysis of Transport Projects 2004 The ldquoWillingness To Payrdquo method of economic assessment has been used dividing the collisions into the separate categories of fatal serious injury and minor injury Table 45 lists the cost savings per year and Table 46 compares these with construction costs to give an average yearly rate of return for each yearrsquos programme of traffic calming
Table 45 Collision and cost saving for each yearrsquos programme
Year No of
Schemes
Drop in Annual Collisions adjusted
Annual Cost Saving from Drop in Collisions euro 2002 prices
Fatal Serious Minor Fatal Serious Minor Total
1997 12 14 -16 01 3138300 -487300 4300 2655300
1998 14 05 -05 -03 1029900 -155000 -9200 865600
1999 18 07 13 35 1689100 383100 105200 2177500
2000 9 -04 -09 15 -800900 -277800 44200 -1034500
2001 23 16 -09 62 3681900 -278700 184600 3587700
2002 15 03 02 -18 638100 56800 -53100 641800
Total 91 41 -25 92 9376400 -759100 276100 8893400
The annual cost saving from the drop in collisions over all 91 schemes is calculated to be approximately euro89 million Most of this saving comes from the drop in fatal collisions which is the group with the most significant fall proportionately a drop of 41 per year from 79 per year (both figures adjusted for the control data)
Table 46 Yearly rate of return
Year No of
Schemes
Annual Collision Cost Saving euro
2002 prices
Cost of Constr euro 2002 prices
Yearly Rate of Return
1997 12 2655300 3024600 88
1998 14 865600 1852900 47
1999 18 2177500 5369900 41
2000 9 -1034500 1882000 -55
2001 23 3587700 3881400 92
2002 15 641800 3446600 19
Total 91 8893400 19457200 46
The average yearly rate of return for each yearrsquos programme varies between 92 and a negative return of 55 but the average rate of return over all six years is 46
24
Evaluation of Traffic Calming Schemes Implemented 1997 ndash 2002
47 Results by Type of Scheme Tables 47 and 48 show the collision savings organised into the 10 different types of scheme and their groupings As guidance a description of the different types and groupings is repeated in Table 49
Once the 91 schemes are divided up into types the individual numbers of collisions and schemes become too small to give a reliable statistical result but a few facts are worth noting-
a) Types A B C and D are all having a positive effect on the number of collisions These all have a gateway with a central island and varying degrees of physical works inside the speed limited zone
Taken together as a group types A to D have a clearly positive result with on average 11 collisions per town or village saved over a 4 year period
b) Types E F and G taken together do not have such a clear result The 10 locations in category E experienced an average increase of nearly 1 collision over a 4 year period with collisions in all severity categories increasing while type G has a better result and appears to be performing nearly as well as types A to D Taken together as a group these schemes that have physical narrowing but no central island at the gateway seem to have had little effect on collision occurrence
c) Types H and I stand out as both having had no success at all with on average an increase of 12 collisions at each town or village over a four year period
Type H and type I are the very simplest types of scheme with no physical works done either at the gateway or throughout the village Gateway signs and transition zone signs were installed and in type H some lining was done through the village to define a narrow carriageway
Type I has usually been installed at villages where the road width was already narrow before implementation and neither further narrowing nor physical works could be done at these locations This is reflected in the low number of collisions at these sites before
implementation 14 over 8 sites which comes to roughly 2 collisions per site At other sites the average number of collisions per site before implementation was generally much higher than this The overall average across all 91 sites was approximately 5 collisions per site
d) Interestingly the one scheme alone in Type J appears to have worked This scheme had extensive kerbing and footpath works done at the centre of the small village to define the road edge and the central junction Footpaths and lighting were installed throughout the village from one speed limit to the other and there is a clear physical narrowing at the speed limit signs but no gateway signs or transition zone signs were installed so there is no narrowing in optical width on approach However as there is only one scheme in this category no real conclusions can be drawn about this design
25
Evaluation of Traffic Calming Schemes Implemented 1997 ndash 2002
Table 47 Drop in collisions by type of scheme
Type No in Study
All colls 4 years before
Drop in collisions (4 years adjusted) Annual cost saving euro
Fatal Serious Minor Total Tot per
site Total Per site
A 39 171 49 -19 347 377 10 2913300 74700
B 8 31 32 -12 78 98 12 1772300 221500
C 5 42 -02 13 80 91 18 42600 8500
D 1 8 -02 10 26 34 34 -40800 -40800
E 10 48 -11 -22 -56 -90 -09 -867800 -86800
F 11 55 58 -35 -49 -26 -02 2985200 271400
G 5 20 25 -09 28 43 09 1354000 270800
H 3 13 10 -37 -55 -82 -27 260900 87000
I 8 14 07 01 -59 -51 -06 366800 45900
J 1 6 00 11 27 38 38 106600 106600
Total 91 408 164 -100 368 433 05 8893400 Avge 97700
Table 48 Grouping type of scheme by type of gateway
Type No in Study
All colls 4 years before
Drop in collisions (4 years adjusted) Annual cost saving euro
Fatal Serious Minor Total Tot per
site Total Per site
Central Island
Gateway 53 252 76 -08 532 600 11 4687600 88400
Simple Gateway
26 123 71 -67 -77 -73 -03 3471500 133500
Signs Only
11 27 17 -36 -114 -133 -12 627800 57100
Type J 1 6 00 11 27 38 38 106600 106600
Total 91 408 164 -100 368 433 05 8893400 Avge 97700
Table 49 Types of scheme and their groupings
Type Treatment Group
A Central island gateway central islands amp narrowing with kerbs inside
Central Island Gateway
B Central island gateway narrowing with kerbs amp no islands inside
C Central island gateway and lining
D Central island gateway and nothing else
E Simple gateway central islands amp narrowing with kerbs insides Simple
GatewayF Simple gateway narrowing with kerbs amp no islands inside
G Simple gateway and lining
H Gateway signs and lining Signs Only
I Gateway signs and nothing else
J No gateway narrowing with kerbs amp no islands inside No Gateway
26
Evaluation of Traffic Calming Schemes Implemented 1997 ndash 2002
48 Results By Type of Collision Table 410 shows the before and after collisions each year for the three main types of collision pedestrian single vehicle and head on The drop shown in the table is an adjusted figure and is relative to the decrease in each of these types of collision in the control data throughout all similar towns and villages on national roads over the period examined
The results show that pedestrian collisions decreased overall by about 8 from a figure of 69 and head-on type collisions have decreased by about 14 from 45 These are quite significant decreases of about 13 and 29 respectively However there has been effectively no change in single vehicle collisions only a very small increase of negligible percentage change
Table 410 Type of collision
Year No of
Schemes
All collisions 4 years before Drop in collisions (4 years adjusted)
ped single veh head on ped single veh head on
1997 12 7 15 8 -70 -03 09
1998 14 3 3 7 -19 -34 -01
1999 18 18 13 7 93 59 13
2000 9 5 6 4 01 -20 12
2001 23 24 14 16 49 -10 132
2002 15 12 12 3 20 06 -30
Total 91 69 63 45 75 -02 135
Total Percentage Drop 13 -0 29
The greatest decrease is in head-on type collisions Head-on collisions are not a particularly significant proportion of all collisions within these towns and villages and before implementation of the traffic calming they constituted only about 11 of all of collisions However the reduction of 135 collisions over four years represents a 29 drop in this type of collision compared with figures before implementation which is a significant result This decrease can be directly attributed to the fundamental design of traffic calming in which the two directions of flow are divided by central kerbed islands and central hatched areas
Pedestrian collisions have also decreased Pedestrian collisions were about 19 of all collisions within these towns and villages and the drop of 13 in pedestrian collisions is much the same as the general drop of 13 in collisions overall within the treated towns Although this is a good result in that pedestrian collisions have decreased in treated towns and villages 13 more than they have decreased in other similar locations it is not as good as was expected It was assumed that the inherent ldquopedestrian friendlyrdquo nature of traffic calming with provision of footpaths and pedestrian crossings would have a comparatively greater effect on pedestrian collisions Examination of the individual collisions in the after period suggests that the increases in pedestrian collisions are occurring in only about a dozen of the 91 towns and villages and that half of these dozen have 3 or more pedestrian incidents in the four year after period There appears to be no correlation with the provision of a pedestrian crossing as part of the traffic calming scheme A more detailed study of these locations is needed to investigate pedestrian collisions further and to ascertain whether there is any link between the provision of either pedestrian crossings or footpaths and the decrease in pedestrian collisions
Single vehicle collisions have not changed at all in relation to the general decrease in single vehicle collisions in all similar towns and villages Single vehicle collisions are those involving only one vehicle Usually in single vehicle incidents the vehicle leaves the driving lane of the road and collides with a roadside object
27
Evaluation of Traffic Calming Schemes Implemented 1997 ndash 2002
Occasionally there is no collision with a roadside object but because of the difference in levels between road and surrounding ground the occupants are injured when the vehicle comes to a halt The lack of any significant change in the occurrence of single vehicle collisions could possibly be explained by the fact that implementation of traffic calming introduces many new objects into the roadside space and reduces the available width within the driving lane Thus when a driver does stray from the correct path there is less forgiveness in the roadside environment and the chances of leaving the defined driving lane or striking an object is increased The general decrease in collisions at traffic calming sites due to the reduced speed is offset by this increased chance of hitting a roadside object which has thus resulted in no change in the incidence of these types of collisions
49 Results for Towns and Villages Treated at One End Only At 27 of the 91 locations only one end of the town or village was treated with traffic calming In 8 of these cases these were entries into a large town or city or into a coastal town where the route ended at the remaining 19 locations there was a through route but only one half of the village was treated Table 411 shows the results arranged according to whether or not both ends of the town were treated
The previous report on traffic calming constructed between 1993 and 1996 concluded that villages which had traffic calming at only one end did not perform in evaluation as well as those where both ends were treated The results shown below repeat this phenomenon At the 27 locations where only one end of the town or village was treated collisions reduced only by an average of 8 while at the other 64 locations where both ends were treated the reduction in collisions was 14 on average
When the 8 ldquosingle entryrdquo locations are separated out it can be seen that these treatments worked better than the other 19 one-end towns and villages This can perhaps be explained by the fact that these 7 locations were put in place to reduce the speed of vehicles approaching the outskirts of large towns or cities and their effect is only required to act within the environs of the traffic calming works Once past the traffic calming scheme the traffic enters a congested network where speed is not a concern For these 8 sites it was only the short length immediately around the traffic calming works was that was evaluated in the study
Table 411 Division of schemes according to whether both ends were treated
Type No in study
All colls 4 years before
Drop in collisions (4 years adjusted) Percentage drops
Fatal Serious Minor Total Total
per site Fatal Serious Minor Total
Both Ends 64 310 130 -76 311 364 06 52 -24 15 14
Single Entry 8 31 06 08 47 61 08 38 29 22 23
Half 19 67 29 -32 11 08 00 59 -41 3 1
All One-end 27 98 35 -24 58 69 03 54 -22 9 8
Total 91 408 164 -100 368 433 05 52 -24 14 13
28
Evaluation of Traffic Calming Schemes Implemented 1997 ndash 2002
5 CASE STUDIES
51 Comparison of Types of Traffic Calming Schemes The results indicate that schemes that have a central island at the gateway types AB C and D as
described in section 33 are more effective at reducing collisions than those schemes that do not have censhytral islands Four schemes on N15 were chosen to illustrate the typical differences between these types of scheme so that the layout of a scheme that has succeeded in collision reduction can be compared with one
that has not
The schemes illustrated all on N15 and in County Donegal are Ballyshannon Ballybofey Killygordon Castlefinn
Schemes With Central Island Type Gateways
Ballybofey and Castlefinn are schemes of type A having a gateway with both side buildouts and central island Inside the village or town this definition is continued using central islands and narrowing with kerbs
Both of these sites have experienced a reduction in collisions as the figures for 4 year before and after periods show Castlefinn particularly has had a notable reduction very much larger than the average of 13 for all the sites in this study
TownVillage collisions before collisions after reduction (adjusted) Ballybofey 9 6 16 Castlefinn 4 1 72
Schemes With Signs Only at Gateways
Ballyshannon and Killygordon are schemes of type H having only signs and no physical works at the gateway Definition inside the town or village is given only by using road markings
None of these sites has experienced any significant reduction in collisions as the 4 year figures below show These locations have had a slight increase in collisions relative to the general decrease in collisions across all similar towns and villages in the control data
TownVillage collisions before collisions after reduction (adjusted) Ballyshannon 7 6 -4 (increase) Killygordon 2 2 -9 (increase)
Comparison of Ballyshannon and Ballybofey
Ballyshannon and Ballybofey are similar sized towns and before traffic calming was introduced had similar approaches In both towns the speed limit extends a long way outside the centre of town and the road was wide on these approaches Both towns have busy town centres with narrow streets where vehicle speeds are not particularly high but in the zone between gateway and town centre high speeds were a problem and were addressed by traffic calming
While Ballyshannon had no central island constructed at the gateway and was treated with only signs and line marking on these approaches Ballybofey was treated with a kerbed central island kerbs and footpaths to narrow the road and a string of further central islands between the gateway and the centre of town Figures 51 and 52 below illustrate this
29
Evaluation of Traffic Calming Schemes Implemented 1997 ndash 2002
Comparison of figures 51 and 52 shows that the optical width has been considerably narrowed in Ballybofey whereas the effect is not so marked in Ballyshannon Figures 53 and 54 show how in Ballybofey this narrowing is continued on for the 600m between gateway and town centre reinforcing the slowing down effect that drivers experienced at the gateway
The differences in design of the approaches to these towns may possibly account for the differences in collision occurrence after traffic calming implementation
Figure 51 Ballyshannon south approach
Figure 52 Ballybofey south approach
30
Evaluation of Traffic Calming Schemes Implemented 1997 ndash 2002
Figure 53 Ballybofey south zone inside gateway
Figure 54 Ballybofey south zone inside gateway
31
Evaluation of Traffic Calming Schemes Implemented 1997 ndash 2002
Comparison of Killygordon and Castlefinn
Killygordon and Castlefinn are located within 6km of each other on the most northern section of N15 with a much lower traffic volume than either Ballybofey or Ballyshannon The N15 along this section in general has a narrower cross section without hard shoulders
Killygordon is a small village and had narrow approaches even before implementation of the traffic calming and the low collision rate before implementation reflects this The minimal treatment to this village under the traffic calming programme did little to change the collision occurrence Castlefinn is a larger village and before implementation its approaches were wider than those to Killygordon The number of collisions in Castlefinn before implementation was twice that in Killygordon The construction of a kerbed central island kerbs and footpaths to narrow the road and a further central island at the centre of the village has evidently had an effect on collisions which have now reduced to numbers below that in Killygordon Figures 55 and 56 below illustrate the differences between the two villages at the gateway while Figures 57 and 58 illustrate the changed look of the centre of Castlefinn as a result of traffic calming construction
Figure 55 Killygordon west approach
Figure 56 Castlefinn west approach
32
Evaluation of Traffic Calming Schemes Implemented 1997 ndash 2002
Figure 57 Castlefinn centre before traffic calming
Figure 58 Castlefinn centre after traffic calming
33
Evaluation of Traffic Calming Schemes Implemented 1997 ndash 2002
Figure 59 Approach to a village similar to Grange before traffic calming
52 Successful Schemes
N15 Grange
Grange has had one of the greatest reductions in collisions in this study
Collisions in 4 years before 9 Collisions in 4 years after 2 reduction (adjusted) 75
Grange is on a busy section of N15 in County Sligo It is a medium sized village with shops pubs petrol station police station church and a few dozen dwelling houses all with frontage onto the national road It has two busy junctions with local primary distributor roads leading to a moderately populated hinterland in the summer the population increases significantly with holidaymakers visiting the coastal area
Traffic calming was installed in 2000 Before this the approaches to the village were wide with hard shoulshyders and this cross section continued through the length of the town On entering the village from the north the length within the built up area approaching the centre is downhill so that drivers would need constant concentration and awareness of their speed to achieve a reduction in speed and to maintain that reduction on this approach From the south there is also a downhill approach but outside the built up area so that speeds approaching the start of the speed limited zone were high
Although an appropriate photograph of Grange before construction of the traffic calming is not available the photograph below of a similar sized village on N24 with similar road widths is shown below in Figure 59
Grange was treated with kerbed central islands at each gateway kerbs and footpaths to narrow the road and a string of further central islands between the two gateways Driving lanes in each direction are now a constant 35m throughout the village A signalised controlled pedestrian crossing was also constructed at the centre of the town There are now footpaths for the entire length of village between gateways and as well as the controlled crossing there are several locations where pedestrians can cross the road with the aid of the central island refuges Figures 510 511 and 512 below illustrate the works
In the years since traffic calming was implemented further housing an industrial estate and commercial sites have been constructed in the vicinity Traffic volumes turning at the junction have increased substantially
34
Evaluation of Traffic Calming Schemes Implemented 1997 ndash 2002
Figure 510 Gateway at Grange with central Island ndash Viewed from inside the village
Figure 511 Approach to Grange village centre from the north
35
Evaluation of Traffic Calming Schemes Implemented 1997 ndash 2002
Figure 512 Grange village centre
In the four years before construction of traffic calming there were roughly 2 collisions each year in the vilshylage Four of the nine collisions were single vehicle incidents and two were pedestrian collisions both involving pedestrians attempting to cross the road Skidding occurred in six of the nine collisions which is an unusually large proportion and suggests that there was a high incidence of sudden braking from high speeds
In the four years after implementation of the scheme there have been only two collisions one in the village centre where the rear of a parked vehicle was hit and one single vehicle loss of control incident on the south approach to the village
N20 Newtwopothouse Newtwopothouse has also had a significant reduction in collisions in this study
Collisions in 4 years before 4
Collisions in 4 years after 0
reduction (adjusted) 100
Newtwopothouse is on a busy section of N20 in County Cork It is a tiny settlement on a staggered junction with only a pubcafe and a shoppost office having frontage onto the national road The bulk of the housing in the area is along the two side roads stretching a few hundred metres down each road and on the eastshyern side road there is a school about 100m from the N20 Before construction of the traffic calming it did not appear to the passing driver on N20 as if there were a village at all merely a crossroads However there was a fairly large volume of traffic turning to and from the two side roads and pedestrian traffic across the N20 between housing and school
Before implementation of traffic calming the road on approach to and through the location was wide being a standard 7m single carriageway with 3m hard shoulders Figures 513 and 515 show the location before traffic calming was installed
36
Evaluation of Traffic Calming Schemes Implemented 1997 ndash 2002
Figure 513 Approach to Newtwopothouse from north before traffic calming
Figure 514 Approach to Newtwopothouse from north
Traffic calming was implemented in 2001 Similarly to Grange Newtwopothouse was treated with kerbed central islands at each gateway kerbs and footpaths to narrow the road further central islands between the two gateways and a signalised controlled pedestrian crossing in the centre Driving lanes in each direction are now a constant 35m throughout the scheme and there is now lighting for the entire length between gateways and footpaths in the central stretch around the junction and bus stops Figures 514 and 516 below illustrate the works by showing the same locations as shown in Figures 513 and 515
37
Evaluation of Traffic Calming Schemes Implemented 1997 ndash 2002
Figure 515 Crossroads at Newtwopothouse before traffic calming
Figure 516 Crossroads at Newtwopothouse with pedestrian crossing
In the four years before construction of traffic calming there were 4 collisions at this location all of which involved turning at the junction
In the four years after implementation of the scheme there have been no collisions
38
Evaluation of Traffic Calming Schemes Implemented 1997 ndash 2002
6 CONCLUSIONS
61 Reduction in Collisions Between 1997 and 2002 there were 94 traffic calming schemes completed at towns and villages on the national roads
Over all the 91 studied locations comparing the 4 years before each scheme with the 4 years after there was a reduction of 106 collisions made up of 21 fatal collisions 20 serious injury collisions and 65 minor injury collisions
62 Reduction in Comparison with Control Data When comparing with the control data and allowing for the general decrease in collisions overall on national roads during this time period this translates to a reduction of 433 collisions This is made up of a reduction of 164 fatal collisions and 368 minor injury collisions and an increase of 100 serious collisions
These figures represent a 13 reduction in all collisions with fatal collisions reduced by 52 Serious and minor injury collisions together reduced by 9
63 Reduction in Severity of Collisions The implementation of traffic calming has therefore had the effect of reducing the number of crashes within the geographical areas of their influence Its more significant effect is in reducing the severity of collisions The percentage of all collisions that were fatal dropped from 9 in the 4 years before implementation to 5 in the 4 years after The percentage of minor injury collisions rose by a corresponding amount
64 Cost Benefit Analysis Using the ldquoWillingness to Payrdquo method of evaluation the average yearly rate of return over all the years evaluated is 46
65 Effects of Different Types of Schemes Traffic Calming Schemes that have a central island in the Gateway and continue this effect with solid central islands throughout the village are more effective in reducing collisions than those that do not
Schemes that consisted of only signs and had no physical works did not have any effect at all in reducing collisions
Traffic Calming Schemes where both ends of the town or village were treated were more effective in reducshying collisions than those where only one was treated
39
Evaluation of Traffic Calming Schemes Implemented 1997 ndash 2002
40
7
Evaluation of Traffic Calming Schemes Implemented 1997 ndash 2002
RECOMMENDATIONS
There are eight main recommendations that emerge from this study
1 The programme of traffic calming of towns and villages on national roads should be continued
2 The programme should be restricted to only towns and village where traffic calming is likely to have an impact
3 An updated priority list should be produced to identify those towns and villages where traffic calming is likely to have an impact
4 Prioritised towns and villages should have a) an injury collision record over the past 5 years that is higher than average b) 85 percentile speeds that are above the posted speed limit c) a physical layout that is possible to treat with traffic calming
5 Where traffic calming is implemented it should include a central island at the gateway and should include physical narrowings throughout the town or village No scheme should consist of just signs and road markings
6 At any location where traffic calming is being considered the existing vehicle speeds through the village must be surveyed
7 After each traffic calming scheme has been implemented the revised vehicle speeds through the village must be surveyed as soon as possible
8 A further study should examine in more detail the single vehicle accidents and pedestrian accidents that been identified in this study in treated villages and towns
41
Evaluation of Traffic Calming Schemes Implemented 1997 ndash 2002
42
Evaluation of Traffic Calming Schemes Implemented 1997 ndash 2002
REFERENCES
RS460 Evaluation of Traffic Calming Schemes Constructed on National Roads 1993-1996 National Roads Authority 2002
The Road to Safety Government Strategy for Road Safety 1998-2002 Department of the Environment and Local Government 1998
Road Safety Strategy Government Strategy for Road Safety 2004-2006 Department of Transport 2004
Road Safety Strategy 2007-2012 Road Safety Authority 2007
2005 Survey of Free Speeds (Urban and Rural) National Roads Authority 2006
Guidelines on Traffic Calming for Towns and Villages on National Routes National Roads Authority 2004
Reducing Traffic Injuries Resulting From Excess and Inappropriate Speed European Transport Safety Council 1995
The importance of confounding in observational before-and-after studies of road safety measures Rune Elvik Accident Analysis and Prevention 34(5) 2002
Parameter Values for Use in Cost-Benefit Analysis of Transport Projects Goodbody Economic Consultants 2004
43
Evaluation of Traffic Calming Schemes Implemented 1997 ndash 2002
44
Evaluation of Traffic Calming Schemes Implemented 1997 ndash 2002
Evaluation of Traffic Calming Schemes Implemented 1997 ndash 2002
APPENDIX A
Ranking of Sites According to Primary Criteria for Selection for Traffic Calming National Primary Routes Only
Route Town Village Population AADT Length Colls
over 5 yrs
Collisions per 10 million vehkm
Collisions per year per 1000
Population
+Combined Collision
Rate
N17 BALLINDINE 232 5058 0587 8 148 690 640
N25 KILRANE 214 5310 2255 10 46 935 559 N08 LITTLETON 566 5598 0591 10 166 353 508
N11 ASHFORD 500 12768 1352 19 60 760 501 N01 JULIANSTOWN 450 14270 1146 16 54 711 463
N05 FRENCHPARK 272 2994 0805 11 250 809 452
N02 COLLON 335 6164 0626 7 99 418 408 N18 KILCOLGAN 500 9565 0483 9 107 360 393
N08 WATERGRASSHILL 250 13706 0985 8 32 640 385 N01 CASTLEBELLINGHAM 762 10983 1891 20 53 525 368
N08 RATHCORMACK 500 11807 1158 11 44 440 308 N09 DUNGARVAN 500 3261 028 4 240 160 280
N04 DROMOD 250 3598 059 3 77 240 275 N20 CHARLEVILLE 3000 9655 1988 12 34 400 269
N25 LEMYBRIEN 222 6471 0918 4 37 360 254 N11 KILMACANOGE 763 26721 0692 13 39 341 247
N25 GLOUNTHAUNE 500 17499 0802 17 66 680 236
N07 MONEYGALL 344 6350 0576 4 60 233 236 N09 MULLINAVAT 283 3858 0925 7 107 495 231
N08 KILBEHENY 500 6897 0863 6 55 240 230 N02 CASTLEBLAYNEY 2938 4154 3525 21 79 143 229
N07 BORRIS IN OSSORY 500 7848 1141 7 43 280 226 N15 BUNDORAN 1463 7275 2371 17 54 232 224
N24 KILSHEELAN 435 4924 1027 5 54 230 223 N02 ARDEE 3604 7019 2394 24 78 133 223
N05 CHARLESTOWN 712 2956 125 5 74 140 219 N11 CAMOLIN 293 5192 1125 4 38 273 212
N06 CRAUGHWELL 232 7669 1558 4 18 345 209
N24 MONARD 500 5735 0392 3 73 120 206 N22 FARRANFORE 500 7614 1093 6 40 240 199
N21 ABBEYFEALE 1501 9982 3287 39 65 520 195 N15 GRANGE 500 6352 1427 6 36 240 193
N24 CARRICK ON SUIR 5143 4924 2903 20 77 078 192 N04 COLLOONEY 612 8617 0864 12 88 392 186
N18 BAREFIELD 500 5852 1087 5 43 200 186 N17 CLAREGALWAY 500 11128 166 7 21 280 182
N20 BALLYHAY 500 7440 0364 3 61 120 181 N14 CASTLEFINN 692 6024 0846 5 54 145 180
N26 FOXFORD 974 1928 1915 9 134 185 180
N18 ARDRAHAN 500 6650 0413 3 60 120 180 N02 ASHBOURNE 4411 10840 2792 30 54 136 177
N08 ABBEYLEIX 1299 8083 1778 11 42 169 169 N02 CARRICKMACROSS 3341 11436 2989 27 43 162 167
N11 OILGATE 262 6332 0393 2 44 153 164 N04 BALLINAFAD 500 3199 0239 2 143 080 163
N02 CASTLESHANE 250 5338 0875 5 59 400 159 N02 SLANE 699 6064 1885 13 62 372 155
N02 ANNAYALLA 500 5338 0655 6 94 240 154
N30 ENNISCORTHY 7655 3972 0565 6 146 016 150 N10 PAULSTOWN 234 4858 0753 2 30 171 145
A1
Evaluation of Traffic Calming Schemes Implemented 1997 ndash 2002
Route Town Village Population AADT Length Colls
over 5 yrs
Collisions per 10 million vehkm
Collisions per year per 1000
Population
+Combined Collision
Rate
N08 JOHNSTOWN 422 6063 1445 4 25 190 145 N07 TOOMYVARA 500 7606 069 7 73 280 143
N16 SLIGO 17302 5680 1796 25 134 029 142 N26 BALLINA 477 5398 1983 9 46 377 140
N16 GLENFARNE 500 1746 1846 5 85 200 135 N06 ROCHFORTBRIDGE 721 6202 1348 5 33 139 135
N24 LIMERICK JCN 250 5735 0698 4 55 320 135 N22 BALLINCOLLIG 12124 15125 6303 68 39 112 134
N24 FIDDOWN 500 4588 0966 6 74 240 134
N01 DROGHEDA 23914 19455 4526 79 49 066 131 N08 NEWINN 500 7163 0648 3 35 120 131
N15 STRANORLAR+BALLYBOFEY 2972 3337 3918 22 92 148 129 N14 LIFFORD 1359 3854 1151 4 49 059 128
N22 LISSARDA 500 7096 0696 6 67 240 127 N22 BALLYVOURNEY 500 3636 2786 8 43 320 123
N06 KILREEKILL 500 9055 059 3 31 120 122 N17 BELLAHY+CHARLESTOWN 712 3834 1103 3 39 084 120
N22 MACROOM 2363 7096 4588 31 52 262 118 N15 KILLYGORDON 500 6024 0493 2 37 080 114
N08 HORSEampJOCKEY 500 7607 026 3 83 120 113
N18 GORT 1093 7709 2855 16 40 293 113 N04 CLONARD 500 10570 0599 3 26 120 112
N02 EMYVALE 479 4073 0813 4 66 167 108 N05 BELLAVARY 500 5138 0633 4 67 160 107
N20 PATRICKSWELL 1019 14486 1742 15 33 294 106 N25 KILMEADAN 500 6177 1817 7 34 280 104
N24 PALLASGREEN 500 4638 0747 4 63 160 103 N15 BALLYSHANNON 2838 8955 2844 13 28 092 102
N21 TRALEE 17225 12840 1934 40 88 046 100 N03 KELLS 3539 8857 1737 10 36 057 099
N25 KILLEAGH 347 7244 1481 5 26 288 098
N24 BANSHA 293 4221 0855 3 46 205 097 N03 CARNAROSS 500 6683 0933 5 44 200 094
N02 MONAGHAN 5946 7630 3588 32 64 108 091 N24 CAHIR 2055 13277 2528 11 18 107 089
N01 DUNDALK 25843 22685 6273 153 59 118 089 N06 MILLTOWNPASS 500 6202 0733 4 48 160 088
N18 NEWMARKET-ON-FERGUS 1583 10584 1461 13 46 164 087 N17 CURRY 250 4585 0548 2 44 160 084
N03 CAVAN 5254 11709 236 28 56 107 082 N22 KILLARNEY 7275 9731 3819 19 28 052 082
N09 MOONE+TIMOLIN 500 6720 2231 6 22 240 082
N11 RATHNEW 1496 12736 1072 11 44 147 081 N15 DONEGAL 2193 6149 2053 12 52 109 079
N25 YOUGHAL 5828 7598 522 34 47 117 076 N03 DUNSHAUGHLIN 1275 15588 1458 6 14 094 076
N04 CARRICK ON SHANNON 2500 4257 2393 10 54 080 074 N06 BALLINASLOE 5812 9582 5241 37 40 127 072
N21 NEWCASTLE WEST 2500 7975 2766 16 40 128 072 N20 BUTTEVANT 1125 7440 1271 7 41 124 072
N15 SLIGO 17302 8932 1274 14 67 016 071 N15 DRUMCLIFF 500 9726 0737 2 15 080 071
N25 NEW ROSS 6079 6846 2424 17 56 056 070
A2
Evaluation of Traffic Calming Schemes Implemented 1997 ndash 2002
Route Town Village Population AADT Length Colls
over 5 yrs
Collisions per 10 million vehkm
Collisions per year per 1000
Population
+Combined Collision
Rate
N25 DUNGARVAN 6920 5688 4649 25 52 072 070
N20 CROOM 1090 5658 1036 5 47 092 070 N24 PILTOWN 717 4588 1166 4 41 112 069
N08 MITCHELSTOWN 3090 13395 2084 19 37 123 068 N07 MONASTEREVIN 2224 11968 1754 7 18 063 068
N15 CLIFFONEY 292 5089 0652 2 33 137 067 N09 GOWRAN 477 2517 0949 2 46 084 067
N08 FERMOY 4462 10622 2955 23 40 103 066 N04 RATHOWEN 500 5465 0439 1 23 040 066
N04 NEWTOWNFORBES 250 3711 1169 2 25 160 065 N30 NEW ROSS 6079 3514 2126 8 59 026 065
N07 NENAGH 5825 8352 2422 18 49 062 064
N07 MOUNTRATH 1375 6980 1827 8 34 116 063 N01 BALBRIGGAN 7724 13451 3226 33 42 085 063
N15 LISCOOLEY 500 6024 0423 2 43 080 063 N17 TOBERCURRY 1069 4585 2168 6 33 112 061
N03 NAVAN 11706 11782 4695 43 43 073 061 N04 ENFIELD 500 10570 1127 2 09 080 058
N30 CLONROCHE 500 2786 1049 2 37 080 057 N09 CARLOW 14027 9020 5154 37 44 053 057
N16 MANORHAMILTON 995 2393 1665 3 41 060 056 N24 MOONCOIN 500 8954 1507 2 08 080 056
N06 LOUGHREA 3271 8389 295 15 33 092 056
N06 MOATE 1529 5973 2482 4 15 052 056 N08 CULLAHILL 500 6063 051 1 18 040 055
N08 URLINGFORD 689 6407 1309 4 26 116 055 N08 CASHEL 2814 7238 2342 11 36 078 055
N11 GOREY 3840 13253 1949 16 34 083 055 N11 FERNS 859 5192 0974 3 33 070 050
N18 ENNIS 16058 13516 7938 59 30 073 049 N23 CASTLEISLAND 2207 3515 0727 2 43 018 047
N05 BELLANAGARE 500 2309 0639 1 37 040 047 N04 KINNEGAD 415 6954 2589 3 09 145 045
N09 CASTLEDERMOT 741 6112 2144 4 17 108 044
N11 ARKLOW 7987 12321 3857 24 28 060 043 N18 CRUSHEEN 500 5852 0853 1 11 040 042
N03 VIRGINIA 720 6683 1261 3 20 083 040 N05 BALLAGHADERREEN 1270 4251 2127 4 24 063 040
N07 BALLYBRITTAS 500 10826 0524 1 10 040 039 N06 TYRRELLSPASS 376 6707 1407 1 06 053 038
N11 ENNISCORTHY 7655 7570 1269 6 34 016 038 N04 SLIGO 17964 15138 3821 31 29 035 038
N24 TIPPERARY 4963 11547 2213 12 26 048 038 N26 SWINFORD 1216 1928 1963 2 29 033 037
N07 BIRDHILL 500 9770 0702 2 16 080 036
N07 KILDARE 4196 14907 2763 14 19 067 035 N20 MALLOW 7521 10164 2681 13 26 035 035
N05 STROKESTOWN 568 2809 2371 2 16 070 034 N10 KNOCKTOPHER 500 2734 0841 1 24 040 034
N17 TUAM 5540 10723 305 13 22 047 034 N04 EDGEWORTHSTOWN 801 5520 2094 3 14 075 033
N04 BALLYSADARE 500 8617 0996 2 13 080 033 N10 STONYFORD 500 3401 0717 1 22 040 032
A3
Evaluation of Traffic Calming Schemes Implemented 1997 ndash 2002
Route Town Village Population AADT Length Colls
over 5 yrs
Collisions per 10 million vehkm
Collisions per year per 1000
Population
+Combined Collision
Rate
N21 CASTLEISLAND 2207 5467 1873 4 21 036 030
N07 PORTLAOISE 8360 12097 501 19 17 045 029 N09 THOMASTOWN 2512 3261 2244 3 22 024 028
N05 TULSK 500 2220 1432 1 17 040 027 N25 SWEEP 500 4274 0755 1 17 040 027
N06 GALWAY 60000 24461 5106 50 22 017 026 N03 DROLCHEAD NUA 11778 5345 04 1 26 002 026
N03 BELTURBET 1223 3316 1868 2 18 033 026 N08 DURROW 721 7244 1338 2 11 055 025
N05 WESTPORT 3688 12879 1194 5 18 027 025 N19 SHANNON 7920 14965 05 3 22 008 024
N21 ADARE 500 3348 1288 1 13 040 023
N07 ROSCREA 4231 7718 3502 7 14 033 022 N17 KNOCK 440 3958 1251 1 11 045 022
N10 KILKENNY 17669 7149 3379 8 18 009 020 N13 STRANORLAR 2972 7141 0925 2 17 013 020
N20 LIMERICK 75000 20672 6595 42 17 011 020 N24 CLONMEL 15562 7270 5907 12 15 015 019
N13 BRIDGE END 500 8153 075 1 09 040 019 N05 CASTLEBAR 7648 7442 3988 7 13 018 018
N17 CLAREMORRIS 1907 5058 1868 2 12 021 017 N24 OOLA 474 4864 1937 1 06 042 016
N07 LIMERICK 75000 15709 10841 41 13 011 016
N21 TEMPLEGLANTINE 819 6759 0828 1 10 024 016 N17 GALWAY 60000 27843 3176 20 12 007 014
N05 LONGFORD 6824 6874 4021 5 10 015 014 N07 DUBLIN 500000 47272 2387 22 11 001 011
N04 BOYLE 2197 3199 2036 1 08 009 011 N11 DUBLIN 500000 40055 13999 95 09 004 010
N04 DUBLIN 500000 29736 9209 42 08 002 009 N18 LIMERICK 75000 27171 5095 17 07 005 008
N09 WATERFORD 75000 14883 1693 3 07 001 007 N50 DUBLIN 600000 18676 124 10 02 000 002
N24 LIMERICK 75436 10740 3098 1 02 000 002
N08 CORK 136000 32213 414 2 01 000 001 N22 CORK 136000 25429 3556 1 01 000 001
N09 BALLYHALE 500 3858 0867 0 00 000 000 N17 BALLYNACARROW 500 3807 0798 0 00 000 000
N04 BALLYNALACK 500 5465 0748 0 00 000 000 N03 BALLYSHANNON 2838 3088 0899 0 00 000 000
N05 CARRACASTLE 500 2956 1215 0 00 000 000 N04 CASTLEBALDWIN 500 3199 0252 0 00 000 000
N18 CLARINBRIDGE 500 9565 1417 0 00 000 000 N20 CORK 136000 15947 4267 0 00 000 000
N27 CORK 136000 13277 3778 0 00 000 000
N01 DUBLIN 500000 28975 4298 0 00 000 000 N02 DUBLIN 500000 11524 6397 0 00 000 000
N03 DUBLIN 500000 21436 4357 0 00 000 000 N06 HORSELEAP 500 6769 0735 0 00 000 000
N06 KILBEGGAN 617 6707 1286 0 00 000 000 N14 LETTERKENNY 10726 15411 093 0 00 000 000
N17 MILLTOWN 500 5467 0869 0 00 000 000 N21 PATRICKSWELL 1019 3348 0274 0 00 000 000
A4
Evaluation of Traffic Calming Schemes Implemented 1997 ndash 2002
Route Town Village Population AADT Length Colls
over 5 yrs
Collisions per 10 million vehkm
Collisions per year per 1000
Population
+Combined Collision
Rate
N09 PAULSTOWN 234 6653 0721 0 00 000 000
N04 ROOSKY 249 3827 0696 0 00 000 000 N28 SHANBALLY 500 5098 0506 0 00 000 000
N05 TERMONBARRY 500 3366 098 0 00 000 000 N25 WATERFORD 41853 10668 8427 0 00 000 000
N25 BALLINABOOLA N25 BARNTOWN
N07 DALYS CROSS N18 GORT RD ENNIS
N20 NEWTWOPOTHOUSE N08 RINGASKIDDY
+ Combined Collision Rate [Coll Rate 10mvehkmyr5 + Coll Rate 1000popyr2]2 These towns and villages were not assessed as funding was already committed
A5
Evaluation of Traffic Calming Schemes Implemented 1997 ndash 2002Evaluation of Traffic Calming Schemes Implemented 1997 ndash 2002
Evaluation of Traffic Calming Schemes Implemented 1997 ndash 2002
51
Appendix B Evaluation of Traffic Calming Schemes Implemented 1997 ndash 2002
APPENDIX B Scheme Details for All Sites
Scheme Local Authority Rte Both or Half Spd Lim Type Colls 4 yrs before raw
Colls 4 yrs after raw
Drop in Ann Colls Adj for
All Nats Area Evaluated Year
Finished Year
Started Year
Bypassed Year
Changed Total Cost in 2002 Prices
Carrickarnon Louth 1 both 60 F 15 10 079 Gate - Gate 2001 2007 109400
Greengates Louth 1 both 40 B 8 2 130 Gate - Gate 1997 2002 489900 KilsaranCastlebellingham Louth 1 both 30 A 23 10 260 Gate - Gate 1997 1997 2002 255600
Julianstown Meath 1 both 30 C 13 10 024 Gate - Gate 1999 1999 2003 767700 Emyvale Monaghan 2 both 30 F 5 7 -065 Gate - Gate 2001 46500
Castleblaney (N) Monaghan 2 2nd half 40 A 3 5 -073 Gate - Bend 2000 2000 2007 132300
Carrickmacross (N) Monaghan 2 half 40 A 7 4 008 Gate - Bend 1998 1998 2005 92500 Ardee (S) Louth 2 half 30 A 4 9 -152 Gate - R170 Jcn 1997 1997 238300
Collon Louth 2 both 30 E 6 7 -038 Gate - Gate 1997 1996 251600 Slane Meath 2 both 30 A 8 5 048 Gate - Gate 2002 2001 534500
Kells Meath 3 both 30 A 8 8 -024 Gate - Gate 2001 730900 Castlebaldwin Sligo 4 both 30 A 5 2 062 Gate - Gate 1999 1998 547500
Dromod Leitrim 4 both 30 B 1 3 -052 Gate - Gate 2000 1999 2008 418300 Roosky (E) Leitrim 4 half 30 B 1 -025 Gate - Centre 1998 1997 2008 123300
Newtownforbes (E) Longford 4 1st half 30 F 1 2 -028 Gate - Bend 2001 2003 73800 Rathowen Westmeath 4 both 30 A 1 1 -002 Gate - Gate 1999 1999 369400
Clonard (E) Meath 4 half 40 B 1 1 -000 Gate - Centre 1997 2006 53200
Enfield Meath 4 both 30 C 8 2 114 Gate - Gate 1999 1998 2002 73900 CharlestownBellahy (WN) Mayo 5 half 30 A 7 132 Gates - Centre 1999 1998 2008 523400
Frenchpark Roscommon 5 both 30 F 5 3 032 Gate - Gate 2001 133600 Craughwell Galway 6 both 40 F 6 6 -015 Gate - Gate 2000 1999 30600
Rochfordbridge Westmeath 6 both 30 A 7 5 037 Gate - Gate 1998 1998 2006 199600 Miltownpass Westmeath 6 both 40 F 1 1 -002 Gate - Gate 2000 2000 2006 2005 248000
B1
Appendix B Evaluation of Traffic Calming Schemes Implemented 1997 ndash 2002
Scheme Local Authority Rte Both or Half Spd Lim Type Colls 4 yrs before raw
Colls 4 yrs after raw
Drop in Ann Colls Adj for
All Nats Area Evaluated Year
Finished Year
Started Year
Bypassed Year
Changed Total Cost in 2002 Prices
Moneygall Offaly 7 both 30 C 2 4 -056 Gate - Gate 2001 1997 2002 410900 Ballybrittas Laois 7 both 40 A 5 3 025 Gate - Gate 2002 2005 197900
Monasterevin (W) Kildare 7 half 30 G 4 1 064 Gate - Bridge 1998 1998 2005 29900
Cullahill Laois 8 both 40 A 1 2 -027 Gate - Gate 2000 1999 134200 Abbeyleix (S) Laois 8 half 30 A 1 4 -077 Gate - Centre 2000 2000 330700
Mullinavat (N) Kilkenny 9 half 30 G 6 3 057 Gate - Centre 2001 96600 Dungarvan Kilkenny 9 both 40 G 1 2 -028 Gate - Gate 2001 212700
Paulstown Kilkenny 9 both 30 A 2 046 Gate - Gate 1999 1998 184700 Kilkenny (E) Kilkenny 10 single entry 30 B 10 3 133 Gate - Centre 2001 195200
Claragh Kilkenny 10 both 60 F 2 2 -016 Gate - Gate 1999 206500 Camolin Wexford 11 both 30 A 5 1 073 Gate - Gate 2002 581000
Ashford Wicklow 11 both 30 E 16 7 160 Gate - Gate 1999 1998 2004 92300 Lifford (N amp W) Donegal 14 both 30 A 10 5 095 Gate - Gate 2001 70400
Castlefinn Donegal 15 both 30 A 4 1 063 Gate - Gate 2001 127500
Killygordon Donegal 15 both 30 H 2 2 -004 Gate - Gate 2002 113300 Ballybofey (S) Donegal 15 half 40 A 9 6 029 Gate - Centre 2002 246400
Ballyshannon (S) Donegal 15 2nd half 40 G 7 6 -006 Gate - Bridge 1997 1996 2006 159700 Bundoran Donegal 15 both 40 H 9 15 -163 Gate - Gate 1997 2006 41900
Cliffony Sligo 15 both 30 A 2 1 019 Gate - Gate 2001 143800 Grange Sligo 15 both 30 A 9 2 149 Gate - Gate 2000 1999 172500
Drumcliffe Sligo 15 both 30 F 7 5 033 Gate - Gate 2000 1999 259100 Ballindine Mayo 17 both 30 E 3 6 -091 Gate - Gate 1997 1997 106500
Claregalway Galway 17 both 30 A 3 7 -116 Gate - Gate 1998 1997 328300 Kilcolgan Galway 18 both 40 E 8 8 -042 Gate - Gate 1999 1999 2003 46200
Ardrahan Galway 18 both 30 J 6 1 096 Gate - Gate 1999 1999 46200
Crusheen (N) Clare 18 half 30 E 1 -025 Gate - Bend 1998 1997 2003 251400 Barefield (N) Clare 18 half 40 G 2 1 021 Gate - Centre 1998 1997 2007 251400
B2
Appendix B Evaluation of Traffic Calming Schemes Implemented 1997 ndash 2002
Scheme Local Authority Rte Both or Half Spd Lim Type Colls 4 yrs before raw
Colls 4 yrs after raw
Drop in Ann Colls Adj for
All Nats Area Evaluated Year
Finished Year
Started Year
Bypassed Year
Changed Total Cost in 2002 Prices
Charleville (S) Cork 20 1st half 30 A 2 2 -006 Gate - Ped X 2001 2004 165400
Ballyhea Cork 20 both 40 A 1 -025 Gate - Gate 1999 1999 784900
Newtwopothouse Cork 20 both 40 A 4 084 Gate - Gate 2001 165400
Cork (N) Cork 20 single entry 40 I 1 2 -030 Gate - Ped X 2002 239700
Farranfore Kerry 22 both 30 F 4 5 -032 Gate - Gate 1998 1998 2003 20000
Killarney (E) Kerry 22 single entry 40 D 8 3 085 Gate - Rbt 1998 1998 59900
Ballyvourney Cork 22 both 30 E 3 6 -090 Gate - Gate 2002 2001 570300
Lissarda Cork 22 both 40 A 4 4 -022 Gate - Gate 2002 333900
Ballincollig (W) Cork 22 half 30 B 10 8 041 Gate - Rbt 1997 1997 2004 496300
Cork (W) Cork 22 single entry 30 A 000 Gate - Vic X 1999 2004 193900
Monard South Tipperary 24 both 30 I 1 -025 Gate - Gate 1998 1998 39300
Bansha South Tipperary 24 both 30 I 2 2 -004 Gate - Gate 2001 138400
Kilsheelan South Tipperary 24 both 30 A 2 043 Gate - Gate 1999 1997 2007 194500
Carrick-on-Suir (W) South Tipperary 24 2nd half 30 A 3 066 Gate - Mini Rbt 2001 211900
Mooncoin Kilkenny 24 both 30 F 5 8 -088 Gate - Gate 1998 1998 140000
Lemybrien Waterford 25 both 40 A 1 1 -002 Gate - Gate 1998 1997 165700
Waterford (E) Kilkenny 25 single entry 30 A 5 1 084 Gate - Rbt 1997 1997 63900
Ballinaboola Wexford 25 both 30 A 3 3 -024 Gate - Gate 1999 1999 554100
Barntown Wexford 25 both 40 A 1 2 -037 Gate - Gate 1997 1997 639000
Kilrane (W) Wexford 25 half 30 A 4 4 -025 Gate - Speed Lim 1999 1998 2004 300400
Rosslare Harbour (W) Wexford 25 single entry 15 E 000 Gate - Harbour 2001 2004 16000
Foxford Mayo 26 both 30 I 6 1 083 Gate - Gate 2001 33300
B3
Appendix B Evaluation of Traffic Calming Schemes Implemented 1997 ndash 2002
Scheme Local Authority Rte Both or Half Spd Lim Type Colls 4 yrs before raw
Colls 4 yrs after raw
Drop in Ann Colls Adj for
All Nats Area Evaluated Year
Finished Year
Started Year
Bypassed Year
Changed Total Cost in 2002 Prices
Clonroche Wexford 30 both 30 F 4 2 035 Gate - Gate 2001 20400
New Ross (N) Wexford 30 both 30 A 2 4 -060 Gate - Gate 2002 47500
Smithborough (W) Monaghan 54 half 30 A 2 1 019 Gate - Centre 2001 56900
Carrickboy Longford 55 both 40 H 2 3 -037 Gate - Gate 2002 57100
Gortahork Donegal 56 both 30 I 1 5 -105 Gate - Gate 2002 45500
Dromore West Sligo 59 both 30 A 4 084 Gate - Gate 2000 156200
Ballisodare Sligo 59 both 30 A 000 Gate - Speed Lim 2002 1997 142700
Hodson Bay Roscommon 61 both 40 A 5 112 Gate - Gate 2001 432500
Birr Offaly 62 both 30 C 15 9 087 Gate - Gate 2001 94700
Loughrea (W) Galway 66 single entry 30 I 1 3 -052 Gate - N6 Jcn 1999 1999 55400
Ballylickey Cork 71 both 40 I 1 2 -037 Gate - Gate 1997 228500
Bantry (N) Cork 71 half 30 E 5 5 -027 Gate - Centre 2002 115600
Clonakilty Cork 71 both 30 C 4 1 059 Gate - Gate 1999 331600
Grangemockler South Tipperary 76 both 30 I 2 042 Gate - Gate 1998 1998 2003 51900
Kilkenny (N) Kilkenny 77 single entry 30 E 6 8 -068 Gate - Centre 2001 195200
Newtown Laois 78 both 40 A 5 1 073 Gate - Gate 2002 181400
Killeigh Offaly 80 both 30 B 000 Gate - Gate 1999 1999 97400
Kilmaine (N) Mayo 84 half 30 B 1 019 Gate - R332 Jcn 1998 99800
Swanlinbar (S) Cavan 87 half 30 E 1 1 -005 Gate - Centre 2002 39900
B4
Appendix C
Evaluation of Traffic Calming Schemes Implemented 1997 ndash 2002 APPENDIX C Collision Data Cost Data and First Year Rate of Return for All Sites
Location Rte Yr Construction Cost
4 Years Before 4 Years After Drop in Annual Collisions adjusted Cost Saving from Drop in Collision
Yearly Rate of Return
F S M Tot F S M Tot F S M Tot F S M Tot
Carrickarnon 1 01 109400 3 1 11 15 1 1 8 10 046 -009 042 079 1047600 -27300 12600 1032900 944
Greengates 1 97 489900 2 1 5 8 0 0 2 2 043 013 074 130 969700 40900 22200 1032800 211
KilsaranCastlebellingham 1 97 255600 1 5 17 23 1 0 9 10 -004 067 197 260 -85200 204700 59000 178500 70
Julianstown 1 99 767700 0 3 10 13 1 1 8 10 -025 017 032 024 -570000 53300 9500 -507200 -66
Emyvale 2 01 46500 0 0 5 5 0 2 5 7 000 -050 -015 -065 0 -152300 -4500 -156800 -337
Castleblaney (N) 2 00 132300 0 2 1 3 0 2 3 5 000 -021 -052 -073 0 -62800 -15600 -78400 -59
Carrickmacross (N) 2 98 92500 0 5 2 7 0 0 4 4 000 062 -054 008 0 188700 -16100 172600 187
Ardee (S) 2 97 238300 1 2 1 4 1 4 4 9 -004 -073 -075 -152 -85200 -222700 -22600 -330500 -139
Collon 2 97 251600 0 1 5 6 0 3 4 7 000 -062 024 -038 0 -187500 7200 -180300 -72
Slane 2 02 534500 3 2 3 8 0 0 5 5 077 036 -065 048 1761000 109400 -19400 1851000 346
Kells 3 01 730900 0 0 8 8 1 1 6 8 -025 -025 026 -024 -570000 -76200 7800 -638400 -87
Castlebaldwin 4 99 547500 1 0 4 5 0 0 2 2 020 000 043 062 451800 0 12800 464600 85
Dromod 4 00 418300 0 0 1 1 0 2 1 3 000 -050 -002 -052 0 -152300 -600 -152900 -37
Roosky (E) 4 98 123300 0 0 0 0 0 0 1 1 000 000 -025 -025 0 0 -7500 -7500 -6
Newtownforbes (E) 4 01 73800 0 0 1 1 0 0 2 2 000 000 -028 -028 0 0 -8400 -8400 -11
Rathowen 4 99 369400 0 0 1 1 0 1 0 1 000 -025 023 -002 0 -76200 6900 -69300 -19
Clonard (E) 4 97 53200 0 0 1 1 0 0 1 1 000 000 -000 -000 0 0 -100 -100 -0
Enfield 4 99 73900 1 2 5 8 0 0 2 2 020 028 066 114 451800 86300 19700 557800 755
CharlestownBellahy (WN) 5 99 523400 1 3 3 7 0 0 0 0 020 042 069 132 451800 129400 20800 602000 115
Frenchpark 5 01 133600 2 1 2 5 0 1 2 3 047 -009 -006 032 1078400 -27300 -1800 1049300 785
Craughwell 6 00 30600 1 0 5 6 0 0 6 6 020 000 -035 -015 454600 0 -10400 444200 1452
Rochfordbridge 6 98 199600 0 0 7 7 0 0 5 5 000 000 037 037 0 0 11200 11200 6
Miltownpass 6 00 248000 0 0 1 1 0 0 1 1 000 000 -002 -002 0 0 -600 -600 -0
Moneygall 7 01 410900 0 0 2 2 0 2 2 4 000 -050 -006 -056 0 -152300 -1800 -154100 -38
C1
Appendix C Evaluation of Traffic Calming Schemes Implemented 1997 ndash 2002
Location Rte Yr Construction Cost
4 Years Before 4 Years After Drop in Annual Collisions adjusted Cost Saving from Drop in Collision
Yearly Rate of Return
F S M Tot F S M Tot F S M Tot F S M Tot
Ballybrittas 7 02 197900 0 0 5 5 0 0 3 3 000 000 025 025 0 0 7600 7600 4
Monasterevin (W) 7 98 29900 1 0 3 4 0 0 1 1 019 000 045 064 434000 0 13400 447400 1496
Cullahill 8 00 134200 0 0 1 1 1 0 1 2 -025 000 -002 -027 -570000 0 -600 -570600 -425
Abbeyleix (S) 8 00 330700 0 0 1 1 0 1 3 4 000 -025 -052 -077 0 -76200 -15600 -91800 -28
Mullinavat (N) 9 01 96600 0 0 6 6 0 0 3 3 000 000 057 057 0 0 17100 17100 18
Dungarvan 9 01 212700 0 0 1 1 0 0 2 2 000 000 -028 -028 0 0 -8400 -8400 -4
Paulstown 9 99 184700 0 0 2 2 0 0 0 0 000 000 046 046 0 0 13900 13900 8
Kilkenny (E) 10 01 195200 0 2 8 10 0 1 2 3 000 007 126 133 0 21600 37800 59400 30
Claragh 10 99 206500 1 1 0 2 0 0 2 2 020 014 -050 -016 451800 43100 -15000 479900 232
Camolin 11 02 581000 0 1 4 5 0 0 1 1 000 018 055 073 0 54700 16600 71300 12
Ashford 11 99 92300 0 4 12 16 0 1 6 7 000 032 128 160 0 96400 38400 134800 146
Lifford (N amp W) 14 01 70400 0 0 10 10 0 0 5 5 000 000 095 095 0 0 28500 28500 40
Castlefinn 15 01 127500 0 0 4 4 0 0 1 1 000 000 063 063 0 0 18900 18900 15
Killygordon 15 02 113300 1 0 1 2 0 0 2 2 026 000 -030 -004 587000 0 -9000 578000 510
Ballybofey (S) 15 02 246400 0 1 8 9 0 1 5 6 000 -007 036 029 0 -21500 10700 -10800 -4
Ballyshannon (S) 15 97 159700 2 2 3 7 0 1 5 6 043 002 -051 -006 969700 5700 -15200 960200 601
Bundoran 15 97 41900 0 1 8 9 0 4 11 15 000 -087 -077 -163 0 -263700 -23000 -286700 -684
Cliffony 15 01 143800 0 0 2 2 0 1 0 1 000 -025 044 019 0 -76200 13200 -63000 -44
Grange 15 00 172500 0 1 8 9 1 0 1 2 -025 015 159 149 -570000 44800 47800 -477400 -277
Drumcliffe 15 00 259100 1 0 6 7 1 1 3 5 -005 -025 063 033 -115400 -76200 19000 -172600 -67
Ballindine 17 97 106500 1 1 1 3 0 2 4 6 021 -037 -075 -091 484800 -111400 -22600 350800 329
Claregalway 17 98 328300 0 1 2 3 0 2 5 7 000 -038 -079 -116 0 -114600 -23600 -138200 -42
Kilcolgan 18 99 46200 0 3 5 8 0 1 7 8 000 017 -059 -042 0 53300 -17800 35500 77
Ardrahan 18 99 46200 0 2 4 6 0 0 1 1 000 028 068 096 0 86300 20300 106600 231
Crusheen (N) 18 98 251400 0 0 0 0 0 1 0 1 000 -025 000 -025 0 -76200 0 -76200 -30
Barefield (N) 18 98 251400 0 0 2 2 0 1 0 1 000 -025 046 021 0 -76200 13900 -62300 -25
Charleville (S) 20 01 165400 0 0 2 2 0 1 1 2 000 -025 019 -006 0 -76200 5700 -70500 -43
C2
Appendix C Evaluation of Traffic Calming Schemes Implemented 1997 ndash 2002
Location Rte Yr Construction Cost
4 Years Before 4 Years After Drop in Annual Collisions adjusted Cost Saving from Drop in Collision
Yearly Rate of Return
F S M Tot F S M Tot F S M Tot F S M Tot
Ballyhea 20 99 784900 0 0 0 0 0 0 1 1 000 000 -025 -025 0 0 -7500 -7500 -1
Newtwopothouse 20 01 165400 1 1 2 4 0 0 0 0 024 016 044 084 539200 48900 13200 601300 364
Cork (N) 20 02 239700 0 0 1 1 0 0 2 2 000 000 -030 -030 0 0 -9000 -9000 -4
Farranfore 22 98 20000 0 0 4 4 0 0 5 5 000 000 -032 -032 0 0 -9700 -9700 -49
Killarney (E) 22 98 59900 1 2 5 8 1 0 2 3 -006 025 066 085 -136000 75500 19800 -40700 -68
Ballyvourney 22 02 570300 0 0 3 3 2 0 4 6 -050 000 -040 -090 -1140000 0 -11900 -1151900 -202
Lissarda 22 02 333900 0 1 3 4 0 1 3 4 000 -007 -015 -022 0 -21500 -4400 -25900 -8
Ballincollig (W) 22 97 496300 2 0 8 10 1 0 7 8 018 000 023 041 399700 0 7000 406700 82
Cork (W) 22 99 193900 0 0 0 0 0 0 0 0 000 000 000 000 0 0 0 0 0
Monard 24 98 39300 0 0 0 0 0 0 1 1 000 000 -025 -025 0 0 -7500 -7500 -19
Bansha 24 01 138400 1 0 1 2 0 1 1 2 024 -025 -003 -004 539200 -76200 -900 462100 334
Kilsheelan 24 99 194500 1 0 1 2 0 0 0 0 020 000 023 043 451800 0 6900 458700 236
Carrick-on-Suir (W) 24 01 211900 0 0 3 3 0 0 0 0 000 000 066 066 0 0 19800 19800 9
Mooncoin 24 98 140000 1 0 4 5 1 1 6 8 -006 -025 -057 -088 -136000 -76200 -17200 -229400 -164
Lemybrien 25 98 165700 0 0 1 1 0 1 0 1 000 -025 023 -002 0 -76200 7000 -69200 -42
Waterford (E) 25 97 63900 1 1 3 5 0 0 1 1 021 013 049 084 484800 40900 14800 540500 846
Ballinaboola 25 99 554100 0 2 1 3 0 1 2 3 000 003 -027 -024 0 10100 -8100 2000 0
Barntown 25 97 639000 0 1 0 1 0 0 2 2 000 013 -050 -037 0 40900 -15000 25900 4
Kilrane (W) 25 99 300400 0 2 2 4 0 2 2 4 000 -022 -004 -025 0 -66000 -1100 -67100 -22
Rosslare Harbour (W) 25 01 16000 0 0 0 0 0 0 0 0 000 000 000 000 0 0 0 0 0
Foxford 26 01 33300 0 4 2 6 0 0 1 1 000 064 019 083 0 195400 5700 201100 604
Clonroche 30 01 20400 2 1 1 4 1 0 1 2 022 016 -003 035 508400 48900 -900 556400 2727
New Ross (N) 30 02 47500 0 0 2 2 0 1 3 4 000 -025 -035 -060 0 -76200 -10500 -86700 -183
Smithborough (W) 54 01 56900 0 0 2 2 0 0 1 1 000 000 019 019 0 0 5700 5700 10
Carrickboy 55 02 57100 0 1 1 2 0 1 2 3 000 -007 -030 -037 0 -21500 -9000 -30500 -53
Gortahork 56 02 45500 0 0 1 1 1 0 4 5 -025 000 -080 -105 -570000 0 -24000 -594000 -1305
Dromore West 59 00 156200 0 1 3 4 0 0 0 0 000 015 069 084 0 44800 20700 65500 42
C3
Appendix C Evaluation of Traffic Calming Schemes Implemented 1997 ndash 2002
Location Rte Yr Construction Cost
4 Years Before 4 Years After Drop in Annual Collisions adjusted Cost Saving from Drop in Collision
Yearly Rate of Return
F S M Tot F S M Tot F S M Tot F S M Tot
Ballisodare 59 02 142700 0 0 0 0 0 0 0 0 000 000 000 000 0 0 0 0 0
Hodson Bay 61 01 432500 1 0 4 5 0 0 0 0 024 000 088 112 539200 0 26400 565600 131
Birr 62 01 94700 0 3 12 15 0 1 8 9 000 023 064 087 0 70400 19200 89600 95
Loughrea (W) 66 99 55400 0 0 1 1 0 1 2 3 000 -025 -027 -052 0 -76200 -8100 -84300 -152
Ballylickey 71 97 228500 0 1 0 1 0 1 1 2 000 -012 -025 -037 0 -35200 -7500 -42700 -19
Bantry (N) 71 02 115600 0 1 4 5 0 0 5 5 000 018 -045 -027 0 54700 -13400 41300 36
Clonakilty 71 99 331600 0 1 3 4 0 0 1 1 000 014 044 059 0 43100 13300 56400 17
Grangemockler 76 98 51900 1 0 1 2 0 0 0 0 019 000 023 042 434000 0 7000 441000 850
Kilkenny (N) 77 01 195200 0 0 6 6 0 0 8 8 000 000 -068 -068 0 0 -20400 -20400 -10
Newtown 78 02 181400 0 1 4 5 0 1 0 1 000 -007 080 073 0 -21500 24100 2600 1
Killeigh 80 99 97400 0 0 0 0 0 0 0 0 000 000 000 000 0 0 0 0 0
Kilmaine (N) 84 98 99800 1 0 0 1 0 0 0 0 019 000 000 019 434000 0 0 434000 435
Swanlinbar (S) 87 02 39900 0 0 1 1 0 0 1 1 000 000 -005 -005 0 0 -1500 -1500 -4
19457200 36 72 300 408 15 52 235 302 411 -249 920 1082 9376400 -759100 276100 8892000 46
C4
9
Evaluation of Traffic Calming Schemes Implemented 1997 ndash 2002Appendix B

Evaluation of Traffic Calming Schemes Implemented 1997 ndash 2002
Using the method of combining the two collision risk categories meant that small villages where there had been only a few collisions such as Dungarvan on N9 or Dromod on N4 ranked as highly as large towns with long lengths of national road and a higher number of collisions such as Charleville on N20 Thus several small villages where the actual collision numbers were low were given high priority in the traffic calming programme because the risk to road users from high speed traffic was comparatively high whereas many large towns with very much bigger numbers of actual collisions did not get priority
Speed
Selection is also based on the speed of vehicles in the towns and villages considered If speeds through a certain location were already low then that town or village was not given priority in the traffic calming programme Often this assessment would result in only one approach to a town or village being treated as described in section 32
Geometry
The other major criterion was the geometry of the road within the town or village considered If the separate physical elements that make up a traffic calming scheme especially that of narrowing the carriageway could not be applied to a certain location then a traffic calming scheme could not be fully implemented However several schemes were indeed implemented in towns and villages where the road width was already narrow prior to construction of the scheme These schemes often consisted of only signs and road markings this is discussed further in section 33
Other Factors
It must be acknowledged that several of the towns and villages assessed within this report did not have a collision history and did not have any record of high speeds before implementation of the traffic calming These sites were often selected for traffic calming because general road improvement work was scheduled at this location and traffic calming elements were incorporated into the work In some cases sites were selected solely on the basis of the perception of risk by residents and their representatives
22 Traffic Calming Measures The measures used as part of traffic calming break down into the four separate zones travelled through on approach to a town or village
bull the transition zone bull the gateway at the speed limit signs bull the zone inside the gateway bull the village centre
In small villages with a short length of national road there is usually no distinction between the last two zones but in the larger villages and towns there is often a zone which is inside the speed limited area yet cannot be described as a town centre These zones typically have either low density housing with off-street parking or warehouse-type commercial premises with sparsely spaced accesses
6
Evaluation of Traffic Calming Schemes Implemented 1997 ndash 2002
Transition Zone The principle behind traffic calming design is to change the driverrsquos perception of the surrounding environshyment
Figure 21 Transition zone approaching village
The ldquooptical widthrdquo perceived by the driver is dependent on the width between the boundaries of the road relative to the height of the adjoining vertical elements Generally in rural sections the width between fences is many times greater than the height of the hedges walls or fences which form the boundaries In urban streets the height of the buildings is generally greater than the width A driverrsquos perception of the appropriate driving speed is influenced by this relationship Speeds are lower where the height of the vertical elements is greater than the width of the road
Traffic calming aims to create a narrow optical width on the approach into towns and villages by using a combination of carriageway narrowing landscape treatment and the introduction of vertical elements such as signs lighting columns and trees Typically transition zone signs consist of a pair of ldquoTraffic Calming Aheadrdquo signs 400m from gateway and a pair of ldquoDo Not Passrdquo signs at 200m from the gateway
Gateway
The Gateway is placed at the start of the speed limited zone It should mark a definite change in the character of the surrounding area from rural to urban Therefore it needs to be conspicuous and the most prominent element in the transition zone The tall signs positioned close to the driving lane narrow the optical width
The guidelines recommend that where a town or village has two zones of speed limits first a 60kmh on the outskirts and then a 50kmh limit for the main body of the town the gateway should be placed at the change from 60kmh to 50kmh This is because usually the 50kmh limit has been placed at the edge of the properly built up area and the 60kmh zone covers the approach into the town where development is much less dense The design engineer can however choose to place the gateway at the 60kmh if surrounding development and environment are appropriate for this This has been done in a few of the cases examined
7
Evaluation of Traffic Calming Schemes Implemented 1997 ndash 2002
Figure 22 A gateway
Gateways fall into two distinct groups those with a solid kerbed central island and those with no island Early results from the first batch of traffic calming schemes constructed indicated that the presence of a central island at the gateway was a determining factor in the success of the scheme and the evaluation in this document confirms this The central island greatly increases the visual narrowing effect and the central lighting column signs and bollards are directly in the centre of the driverrsquos field of view
The gateway is always lit to a high standard with special gateway lanterns that shine directly onto the gateway signs This is not only effective in the dark during daylight hours the presence of lighting columns enhances the narrow optical width and is often noted subconsciously by the driver as an indication of an urban area
Inside Gateway
Treatment of the stretch of road between the gateway and the village centre is an important aspect of traffic calming The narrowing introduced at the gateway is continued so that the speed reduction occurring at the gateway is maintained on the driverrsquos journey through the town
This narrowing can be done by introducing any or all of the following central islands footpaths side kerb buildouts lining hatched markings and defined parking bays A shallow chicane can also sometimes be introduced by alternating side buildouts and parking between the two sides of the road The objectives are both to keep the driving lanes at no greater than 35m width and to give a visual impression to the driver of an urban area
Only narrowing and horizontal deflections are used as measures in traffic calming installations on national routes Vertical deflections such as humps or cushions are not appropriate because of the roadsrsquo function as main distributors between the major urban areas of the country Emergency vehicles and buses cannot easily negotiate routes where vertical deflection has been installed
As every gateway must be provided with lighting to illuminate the signs the infrastructure to supply street lighting needs to be provided at each end of the town or village It therefore follows that the supply for lightshying is usually available over the whole length of the village and lighting is provided over the full length of the scheme from gateway to gateway In the cases examined there are a few exceptions to this but even these few villages have street lighting for almost all of their length with only a few short gaps where no lamps are provided
8
Evaluation of Traffic Calming Schemes Implemented 1997 ndash 2002
Figure 23 Inside gateway
Town or Village Centre
In the town centre there is often not a need for narrowing works as part of the traffic calming as parking bays and footpaths may already exist However in locations where there is a wide road passing through the village centre it is necessary to narrow and define the through route with kerbing Even in locations where the through route is already well defined with kerbing and parking bays extra measures are usually required at junctions and where pedestrians wish to cross the national road or to cross side roads while walking along the main street
Typical works in the town centre are
bull definition of the limits of existing parking using kerb buildouts bull definition of junctions by the use of kerb buildouts bull provision of either pedestrian crossings or central islands to aid pedestrians in crossing
The main objective in the centre of the town or village is to provide a safe and pleasant environment that can easily be negotiated by vulnerable road users Thus it is important to provide safe places to cross where pedestrians are clearly visible to passing traffic and wide footpaths so that pedestrians are not forced to step into the road when passing others This often necessitates a reduction in the number of on street parking spaces and it can be difficult to persuade the local residents to accept this Extra off-street parking may have to be provided as part of the traffic calming scheme However there is a clear road safety advantage in both providing better facilities for pedestrians and in moving parking to off-street facilities Quite apart from the pedestrian collisions that result from vehicles reversing in and out of parking spaces and from parked vehicles masking crossing pedestrians as they step out onto the road many minor material damage collisions occur as vehicles pull in and out of parking spaces on busy through routes
9
Evaluation of Traffic Calming Schemes Implemented 1997 ndash 2002
Figure 24 Centre of village
23 Amendments to Design in 2004 The Guidelines on Traffic Calming were revised in 2004 Some of the changes made in this revision arose directly from problems encountered during construction and consequent operation of the schemes evaluated here There were numerous minor amendments but two of the main changes to design are worth notingshy
a) Increase of setback of signs The setback distance of the edge of the gateway signs from the kerb was originally specified as 600mm This width of setback was thought to provide enough clearance for overhanging loads on large vehicles while still giving the visual narrowing effect that was needed for the traffic calming gateway to be effective However in practice many gateway signs installed to this specification were hit glancing blows by passing large vehicles especially in areas where there was a significant proportion of agricultural vehicles in the mix of traffic
Consequently the specification was changed to a setback of 1m from the kerb So far this increased width appears to have succeeded in reducing the number of signs damaged by overhanging loads
b) Increase of ldquoexitrdquo width Where a central island is provided at a gateway the island and its signs and lighting column all form an obstruction for any abnormally wide load wishing to pass Whenever a wide load wishes to use the route through a village with this design of traffic calming the central lighting columns at each gateway must be temporarily disconnected and removed resulting in much inconvenience and an extra workload for the local authority and electricity supply engineers
To try to avoid this lengthy process of disconnection and removal an alternative design for gateways was put forward with extra width on the ldquoexitrdquo half of the gateway such that the width between edge kerb and central island on the lane for traffic approaching the village remains at the original 35m specified but the corresponding width on the lane for traffic leaving the village could be increased to anything up to 6m This design manages to keep the narrow optical effect for drivers approaching the village but provides an alternative route for wide loads which are guided through the approach to the village on the exit side of the central island
10
Evaluation of Traffic Calming Schemes Implemented 1997 ndash 2002
3 TRAFFIC CALMING SCHEMES 1997 - 2002
31 Schemes Implemented over Period 1997 - 2002 Between 1997 and 2002 there were 94 traffic calming schemes completed at towns and villages on the national roads Three of these schemes could not be evaluated because the collision data in the before period was considered to be unduly influenced by traffic calming on the other approach to the same village that had been implemented before 1997
The remaining 91 towns and villages have been assessed in this study
Table 31 below gives the number of schemes constructed per year and their costs Table 32 shows the spread across the different counties and Table 33 shows the spread across the national routes Figure 31 shows the locations of all the 94 schemes implemented in the period examined A detailed list of the 91 locations assessed and the measures implemented is given in Appendix B
Table 31 Schemes implemented per year
Year No of Schemes
Cost euro (market prices at
time of construction)
Cost euro (2002 prices)
Average Cost per Scheme euro
(2002 prices)
1997 12 1803000 3024500 252000
1998 14 1178800 1852900 132300
1999 18 3691800 5369900 298300
2000 9 1445200 1882000 209100
2001 23 3496400 3881300 168800
2002 15 3446600 3446600 229800
TOTALS 91 15061800 19457200 213800
The number of schemes constructed each year stayed roughly constant the average being about 15 or 16 per year There was a slight dip in the number finished in 2000 but there was a corresponding rise the next year The bulk of construction for most schemes took place within one year but where schemes carried on into following years it is the final year that is taken as the year of construction
The average cost per scheme was euro214000 over the six years All costs in this report are market prices given in 2002 prices The cost of an individual scheme varies immensely from euro16000 to euro785000 (See Appendix B) but the measures implemented in each scheme also varied greatly Some schemes were simply the installation of just 12 signs on approach to a village others included extensive urban renewal works including the complete restructuring of drainage and electricity supply for the village
Table 32 and Figure 31 show a fairly even spread of traffic calming implementation geographically across the country but it can be clearly seen in Table 33 that the majority of schemes implemented were on national primary roads Of all the schemes examined 81 are on primary routes and in the early years this division is even more marked with 88 of schemes implemented in 1997 and 1998 being on primary routes The fact that mainly primary routes were treated in the early years of the traffic calming programme can be directly attributed to the geometry of the national routes through these towns and villages Approaches to many urban areas on the primary routes had been realigned and widened during the twenty to thirty years preceding the traffic calming programme allowing traffic to approach the town or village at increased speed This increased speed and the consequent increase in collisions then identified these towns and villages as priority sites for traffic calming treatment On national secondary routes there had not
11
Evaluation of Traffic Calming Schemes Implemented 1997 ndash 2002
been such a widespread programme of realignment and widening and approaches to urban areas have mostly remained narrow Consequently on national secondary roads speeds are not so high on the approaches to urban areas collision rates also are not high and few towns and villages on secondary roads have met the criteria for the traffic calming programme
Table 32 Schemes implemented per year by county
Local Authority 1997 1998 1999 2000 2001 2002 Total
Cavan 1 1
Clare 2 2
Cork 2 3 2 4 11
Donegal 2 2 3 7
Galway 1 3 1 5
Kerry 2 2
Kildare 1 1
Kilkenny 1 1 2 4 8
Laois 2 2 4
Leitrim 1 1 2
Longford 1 1 2
Louth 4 1 5
Mayo 1 1 1 1 4
Meath 1 2 1 1 5
Monaghan 1 1 2 4
Offaly 1 2 3
Roscommon 2 2
Sligo 1 3 1 1 6
South Tipperary 2 1 2 5
Waterford 1 1
Westmeath 1 1 1 3
Wexford 1 2 2 2 7
Wicklow 1 1
Total 12 14 18 9 23 15 91
12
Evaluation of Traffic Calming Schemes Implemented 1997 ndash 2002
Figure 31 Locations of traffic calming schemes 1997 to 2002
13
Evaluation of Traffic Calming Schemes Implemented 1997 ndash 2002
Table 33 Schemes implemented per year by route
Route 1997 1998 1999 2000 2001 2002 Total
1 2 1 1 4
2 2 1 1 1 1 6
3 1 1
4 1 1 3 1 1 7
5 1 1 2
6 1 2 3
7 1 1 1 3
8 2 2
9 1 2 3
10 1 1 2
11 1 1 2
14 1 1
15 2 2 2 2 8
17 1 1 2
18 2 2 4
20 1 2 1 4
22 1 2 1 2 6
24 2 1 2 5
25 2 1 2 1 6
26 1 1
30 1 1 2
54 1 1
55 1 1
56 1 1
59 1 1 2
61 1 1
62 1 1
66 1 1
71 1 1 1 3
76 1 1
77 1 1
78 1 1
80 1 1
84 1 1
87 1 1
National Primary 11 12 15 8 19 9 74
National Secondary 1 2 3 1 4 6 17
Total 12 14 18 9 23 15 91
14
Evaluation of Traffic Calming Schemes Implemented 1997 ndash 2002
32 Towns and Villages With Only One End Treated
At 33 of the 94 locations implemented between 1997 and 2002 only one approach to the town or village was treated with traffic calming within this period
In 8 of these cases the one approach treated was the only entry of that route into a large town or city or into a coastal town where the route ended
In 6 of these towns and villages the other approach had already been treated in previous years before 1997 and the second treatment completed the traffic calming for the location In 3 of these villages it was considered that the first phase of traffic calming would have had an effect on collisions in the very same area that was influenced by the second phase Thus the ldquobeforerdquo data for the second phase of work would not have been usable and it was not possible to evaluate changes in collision data These are the three locations that have been removed from the evaluation The other three towns were large enough for the areas of influence from each phase of traffic calming not to overlap and consequently the collision data was not influenced by the first phase
In 2 towns the traffic calming within the study period 1997 - 2002 was the first phase in a two phase implementation and the second approach has since been treated in subsequent years In each of these towns the two areas of influence from the separate phases of work are considered not to overlap and so these two have been included in the study
For each scheme the ldquoevaluated areardquo over which the traffic calming is considered to have had an effect on collisions is described in the scheme details in Appendix B
In the other 17 cases the decision to treat only one approach was generally taken because the other end of town was not considered a suitable case for traffic calming The reasons for this were varied but broadly fell into two different categories
a) An existing feature in the road such as a right angled bend narrow bridge or a roundabout already acted as a measure to slow approaching traffic such as the northern approach to Ardee on N2 or the southern approach to Crusheen on N18
b) Traffic approaching the town or village from this particular direction was observed to be travelling slowly in general and did not need to be slowed further Usually this was because another nearby town or village had effectively slowed the traffic down and drivers had not yet regained the feel of an open road and speeded up The western approach from Dromod to Roosky on N4 and the southern approach from Ennis to Barefield on N18 are examples of this
15
Evaluation of Traffic Calming Schemes Implemented 1997 ndash 2002
33 Different Designs of Scheme
As traffic calming schemes are made up of all the different elements described in section 22 there is a very large number of variations possible but the 91 schemes examined can be broadly divided into 10 different types as follows-
A Gateway with side buildouts and central island Definition inside village using central islands and narrowing with kerbs
B Gateway with side buildouts and central island Definition inside village using narrowing with kerbs but no islands
C Gateway with side buildouts and central island Definition inside village using line marking only
D Gateway with side buildouts and central island No definition inside village
E Gateway with side buildouts only Definition inside village using central islands and narrowing with kerbs
F Gateway with side buildouts only Definition inside village using narrowing with kerbs but no islands
G Gateway with side buildouts only Definition inside village using line marking only
H Gateway signs only Definition inside village using line marking only
I Gateway signs only No definition inside village
J No gateway Definition inside village using narrowing with kerbs but no islands
Table 34 shows the number of schemes in each category and whether the traffic calming was done at both ends of the town or village or whether it was installed only at one end Towns and villages where traffic calming was constructed at only one end are indicated in Figure 31 and in the appendices lists by (W) (N) (E) or (S) following the town name
Table 34 Types of traffic calming schemes
Type Treatment no of villages
both ends
one end
A Central island gateway central islands amp narrowing with kerbs inside 39 29 10
B Central island gateway narrowing with kerbs amp no islands inside 8 3 5
C Central island gateway and lining 5 5
D Central island gateway and nothing else 1 1
E Simple gateway central islands amp narrowing with kerbs insides 10 5 5
F Simple gateway narrowing with kerbs amp no islands inside 11 10 1
G Simple gateway and lining 5 2 3
H Gateway signs and lining 3 3
I Gateway signs and nothing else 8 6 2
J No gateway narrowing with kerbs amp no islands inside 1 1
Total 91 64 27
16
Evaluation of Traffic Calming Schemes Implemented 1997 ndash 2002
The largest single category is type A with a gateway with side buildouts and central island with a string of central islands through the village approach and in the centre and also narrowing from the side with kerb buildouts through the approach and centre Most of the 39 schemes in this category give the full impression of a village at the point of passing the gateway and most have footpaths throughout the scheme from gateway to gateway They all have street lighting through the entire scheme
Another 14 sites have the full gateway with a central island and side buildouts but do not have such extensive works inside the village These fall into categories B C and D Types A B C and D are generally on national primary routes very few are on secondary routes Figure 32 illustrates a typical gateway into such a village where the wide carriageway is narrowed by kerbing the hard shoulder and inserting a central island
Figure 32 Typical gateway for types A B C and D
The next two biggest single categories are type E with 10 schemes and type F with 11 schemes These types along with type G have a gateway that has no central island but which does narrow the road using kerbed buildouts at the side of the road usually in the hard shoulder Types E F and G were installed at towns where the width of the approach into town was wide enough to warrant traffic calming but was less than the 157m minimum needed to accommodate central island signs and cycle bypass Types E F and G have varying degrees of definition work inside the village similar to types A B and C Figure 33 illustrates a typical gateway into such a village where the wide carriageway is narrowed by kerbing the hard shoulder but there is no central island
Types H and I do not have physical works at the gateway at all Typically there is no hard shoulder at these sites and the gateway signs and transition zone signs are simply installed on the verge In type H schemes some visual narrowing has been implemented inside the village using line markings and hatching but in type I there is nothing done other than installation of the gateway and transition zone signs The one scheme that was installed on a dual carriageway approach to a city falls into the category of type H Figure 34 illustrates a typical gateway into such a village where there is no narrowing or kerbs installed just signs placed in the verge
17
Evaluation of Traffic Calming Schemes Implemented 1997 ndash 2002
Figure 33 Typical gateway for types E F and G
Figure 34 Typical gateway for types H and I
One scheme examined in this report had neither gateway signs nor transition zone installed However extensive works were done in the centre of the small village to narrow the carriageway and define the parking areas behind kerbs This village does not fall into any the other categories and is the only type J in the study
For the purposes of examining results types A B C and D can be grouped together as a ldquoCentral Island Gatewayrdquo category types E F and G can be grouped together as a ldquoSimple Gatewayrdquo category and types H and I can be grouped together as a ldquoSigns Onlyrdquo category
Table 35 shows the incidence of each type of traffic calming scheme on each national routes Although there is a wide spread of types across all roads it can be seen that types A B C and D are mostly on the national primary roads while types H and I are largely on the national secondary routes and those sections of national primaries where widening has not taken place
18
Evaluation of Traffic Calming Schemes Implemented 1997 ndash 2002
Table 35 Types of traffic calming schemes by route
Route Type of Scheme
A B C D E F G H I J No in Study
1 1 1 1 1 4
2 4 1 1 6
3 1 1
4 2 3 1 1 7
5 1 1 2
6 1 2 3
7 1 1 1 3
8 2 2
9 1 2 3
10 1 1 2
11 1 1 2
14 1 1
15 4 1 1 2 8
17 1 1 2
18 2 1 1 4
20 3 1 4
22 2 1 1 1 1 6
24 2 1 2 5
25 5 1 6
26 1 1
30 1 1 2
54 1 1
55 1 1
56 1 1
59 2 2
61 1 1
62 1 1
66 1 1
71 1 1 1 3
76 1 1
77 1 1
78 1 1
80 1 1
84 1 1
87 1 1
National Primary 34 6 3 1 7 11 5 2 4 1 74
National Secondary 5 2 2 3 1 4 17
Total 39 8 5 1 10 11 5 3 8 1 91
19
20
Evaluation of Traffic Calming Schemes Implemented 1997 ndash 2002
Evaluation of Traffic Calming Schemes Implemented 1997 ndash 2002
4 EFFECTIVENESS IN REDUCING COLLISIONS
41 Collisions Before and After Scheme Implementation Collision numbers were measured at each of the 91 locations for the 4 years before and 4 years after implementation of each individual scheme The ldquoafterrdquo period was taken as beginning in the year after the final year of construction as the full effect of the scheme would not be noticeable during construction works Details of the collision data for each site are given in Appendix C but summary tables are given in this chapter
42 Area of Influence of Traffic Calming Works Collision numbers for both before and after data were taken from the map-based NRA Collision Database Only collisions taking place on the national routes were considered and any collision that was located within the length of road influenced by the traffic calming was included in the data This area of influence extended to 200m outside each gateway in order to take account of the effect of the transition zone Where only one side of a village was treated the area taken was from the gateway to the centre of the town Where an existing traffic calming feature existed within the speed limited zone on the entry into a town such as a sharp bend or a narrow bridge the area of influence was assumed to extend only as far as that feature Descriptions of the area of influence for each location are given in the detailed list of locations in Appendix B
43 Control Data This report takes account of the main confounding factors affecting these statistics Collision numbers in general on Irelandrsquos national roads have decreased throughout the before and after periods for these schemes and the assessment makes allowances for this trend Changes in traffic volume in patterns of traffic flow in population distribution in Garda enforcement and in attitude to road safety have all had an effect on collision rates on national roads in towns and villages whether or not traffic calming has been installed This effect is accommodated by adjusting the before and after data in line with a comparison group the collisions in each 4 year before and after period within all similar sized towns and villages on all national roads
The general trend nationwide within all towns and villages in the control group has been a drop in collisions of roughly 15 between before and after periods However the reduction varies markedly between the different collision rates fatal collisions have reduced by a similar percentage to the general trend but serious injury accidents have reduced by over 40 and minor injuries have reduced by only about 10 All reductions in collisions at the sites assessed in this study have to be compared against this general nationwide trend of a shift from serious injury to minor injury
The effect of ldquoregression to meanrdquo is more difficult to make allowances for in this study The random nature of road crashes tends to cause collision frequencies at specific locations to fluctuate The selection of towns and villages for treatment on the basis of their past collision record can introduce a source of potential bias in measuring the effectiveness of the scheme This arises because the selection process tends to pick sites at the peak of their fluctuations in collision frequencies and such sites might well have experienced reductions in collision rate in following years even if no treatment had been applied (Rune Elvik 2002)
To allow for the effect of regression to mean the change in collision rates at treated sites would need to be compared with a number of similar untreated control sites This could not have been done in the case of the traffic calming programme as no such control sites exist Whenever a town or village with a collision history was identified it was put on the programme for treatment with traffic calming it would have been considered unacceptable to leave the location untreated simply for the purposes of research
21
Evaluation of Traffic Calming Schemes Implemented 1997 ndash 2002
44 Effect on Collision Occurrence
Table 41 shows for each yearrsquos programme of traffic calming schemes the collisions over the 4 years before and after each scheme
Table 41 Collisions before and after scheme implementation for each yearrsquos programme
Year No of
Schemes
4 Years Before 4 Years After
Fatal Serious Minor Total Fatal Serious Minor Total
1997 12 10 16 52 78 3 15 51 69
1998 14 5 8 31 44 2 6 30 38
1999 18 5 23 54 82 1 8 36 45
2000 9 2 4 27 33 3 6 19 28
2001 23 10 13 95 118 3 12 59 74
2002 15 4 8 41 53 3 5 40 48
Total 91 36 72 300 408 15 52 235 302
The reduction in collisions for each yearrsquos programme is shown in Table 42 as is the adjusted reduction allowing for the general drop in collisions over the study years in the control group of other similar sites Table 43 shows these adjusted drops in annual terms and in percentages
All this data for each individual scheme can be seen in Appendix C
There is considerable fluctuation in results between each yearrsquos programme of traffic calming so it is best to concentrate on the overall figures for the entire six years
Over all 91 sites there was a drop of 106 collisions from 408 to 302
When adjusted for the general nationwide fall in collisions on similar sites this gives a total drop of 433 colshylisions or 108 per year
This is a 13 reduction on the collision numbers before implementation of the schemes
Table 42 Collision reductions for each yearrsquos programme
Year No of
Schemes
4 Year Reduction 4 Year Reduction Adjusted
Fatal Serious Minor Total Fatal Serious Minor Total
1997 12 7 1 1 9 55 -64 06 -03
1998 14 3 2 1 6 18 -20 -12 -15
1999 18 4 15 18 37 30 50 140 220
2000 9 -1 -2 8 5 -14 -36 59 08
2001 23 7 1 36 44 65 -37 246 274
2002 15 1 3 1 5 11 07 -71 -52
Total 91 21 20 65 106 164 -100 368 433
22
Evaluation of Traffic Calming Schemes Implemented 1997 ndash 2002
Table 43 Annual collision reductions for each yearrsquos programme
Year No of
Schemes
Annual Drop in Collisions Adjusted Percentage Drop in Collisions
Fatal Serious Minor Total Fatal Serious Minor Total
1997 12 14 -16 01 -01 65 -74 1 -0
1998 14 05 -05 -03 -04 47 -51 -4 -4
1999 18 07 13 35 55 75 39 28 33
2000 9 -04 -09 15 02 -88 -55 24 3
2001 23 16 -09 62 69 68 -44 29 27
2002 15 03 02 -18 -13 27 13 -21 -12
Total 91 41 -25 92 108 52 -24 14 13
While collisions of all severity types at the examined locations have reduced in actual numbers the decrease in serious injury collisions at these sites has not followed the general trend nationwide over this period on national roads which have experienced a particularly large decrease in serious injury collisions When allowing for the trend in the control data the actual reduction of 20 serious injury collisions in a 4 year period translates to a relative increase of 10 collisions
Looking at each individual severity type the adjusted reduction in fatal collisions is 164 or 41 per year and that in minor injury collisions is 368 or 92 per year The adjusted change in serious injury collisions is an increase of 25 per year These numbers represent a 52 drop in fatal collisions a 14 drop in minor injury collisions and a 24 rise in serious injury collisions
The implementation of traffic calming has clearly had a much more marked effect on fatal collisions than on other injury collisions resulting in a lowering of the severity of collisions overall Table 44 below shows for each year each severity category as a percentage of overall collisions in the 4 years before implementation and the 4 years after implementation It can be seen that in general for each yearrsquos programme except for year 2000 the proportion of fatal collisions has roughly halved the proportion of serious collisions has stayed much the same while that of minor collisions has slightly increased Looking at the entire six yearsrsquo programme in the four years before implementation of each traffic calming scheme fatal collisions constituted 9 of all collisions in these towns and villages while serious and minor injury collisions were 18 and 73 of the total respectively In the four years after implementation fatal collisions decreased to 5 of all collisions serious reduced very slightly to 17 and minor rose to 78
Table 44 Severities as a percentage of all collisions for each yearrsquos programme
Year No of
Schemes
Percentage of all Collisions 4 years before
Percentage of all Collisions 4 years after
Fatal Serious Minor Fatal Serious Minor
1997 12 13 20 67 4 22 74
1998 14 11 18 71 5 16 79
1999 18 6 28 66 2 18 80
2000 9 6 12 82 11 21 68
2001 23 8 11 81 4 16 80
2002 15 8 15 77 6 11 83
Total 91 9 18 73 5 17 78
It can therefore be concluded that implementation of these traffic calming schemes has not only reduced the number of collisions overall but has also reduced the average severity of those collisions that did occur
23
Evaluation of Traffic Calming Schemes Implemented 1997 ndash 2002
45 Statistical Significance Statistical significance is difficult to achieve with locations that have such small numbers of individual collisions However the chi squared test was used to compare the results with the control data and the overall result for all sites indicates an 80 confidence level meaning that there is a 20 chance that the observed reduction in collisions is due to mere random fluctuation
46 Collision Costs and Economic Evaluation Collision costs are calculated using figures from the Goodbody report on Cost-Benefit Analysis of Transport Projects 2004 The ldquoWillingness To Payrdquo method of economic assessment has been used dividing the collisions into the separate categories of fatal serious injury and minor injury Table 45 lists the cost savings per year and Table 46 compares these with construction costs to give an average yearly rate of return for each yearrsquos programme of traffic calming
Table 45 Collision and cost saving for each yearrsquos programme
Year No of
Schemes
Drop in Annual Collisions adjusted
Annual Cost Saving from Drop in Collisions euro 2002 prices
Fatal Serious Minor Fatal Serious Minor Total
1997 12 14 -16 01 3138300 -487300 4300 2655300
1998 14 05 -05 -03 1029900 -155000 -9200 865600
1999 18 07 13 35 1689100 383100 105200 2177500
2000 9 -04 -09 15 -800900 -277800 44200 -1034500
2001 23 16 -09 62 3681900 -278700 184600 3587700
2002 15 03 02 -18 638100 56800 -53100 641800
Total 91 41 -25 92 9376400 -759100 276100 8893400
The annual cost saving from the drop in collisions over all 91 schemes is calculated to be approximately euro89 million Most of this saving comes from the drop in fatal collisions which is the group with the most significant fall proportionately a drop of 41 per year from 79 per year (both figures adjusted for the control data)
Table 46 Yearly rate of return
Year No of
Schemes
Annual Collision Cost Saving euro
2002 prices
Cost of Constr euro 2002 prices
Yearly Rate of Return
1997 12 2655300 3024600 88
1998 14 865600 1852900 47
1999 18 2177500 5369900 41
2000 9 -1034500 1882000 -55
2001 23 3587700 3881400 92
2002 15 641800 3446600 19
Total 91 8893400 19457200 46
The average yearly rate of return for each yearrsquos programme varies between 92 and a negative return of 55 but the average rate of return over all six years is 46
24
Evaluation of Traffic Calming Schemes Implemented 1997 ndash 2002
47 Results by Type of Scheme Tables 47 and 48 show the collision savings organised into the 10 different types of scheme and their groupings As guidance a description of the different types and groupings is repeated in Table 49
Once the 91 schemes are divided up into types the individual numbers of collisions and schemes become too small to give a reliable statistical result but a few facts are worth noting-
a) Types A B C and D are all having a positive effect on the number of collisions These all have a gateway with a central island and varying degrees of physical works inside the speed limited zone
Taken together as a group types A to D have a clearly positive result with on average 11 collisions per town or village saved over a 4 year period
b) Types E F and G taken together do not have such a clear result The 10 locations in category E experienced an average increase of nearly 1 collision over a 4 year period with collisions in all severity categories increasing while type G has a better result and appears to be performing nearly as well as types A to D Taken together as a group these schemes that have physical narrowing but no central island at the gateway seem to have had little effect on collision occurrence
c) Types H and I stand out as both having had no success at all with on average an increase of 12 collisions at each town or village over a four year period
Type H and type I are the very simplest types of scheme with no physical works done either at the gateway or throughout the village Gateway signs and transition zone signs were installed and in type H some lining was done through the village to define a narrow carriageway
Type I has usually been installed at villages where the road width was already narrow before implementation and neither further narrowing nor physical works could be done at these locations This is reflected in the low number of collisions at these sites before
implementation 14 over 8 sites which comes to roughly 2 collisions per site At other sites the average number of collisions per site before implementation was generally much higher than this The overall average across all 91 sites was approximately 5 collisions per site
d) Interestingly the one scheme alone in Type J appears to have worked This scheme had extensive kerbing and footpath works done at the centre of the small village to define the road edge and the central junction Footpaths and lighting were installed throughout the village from one speed limit to the other and there is a clear physical narrowing at the speed limit signs but no gateway signs or transition zone signs were installed so there is no narrowing in optical width on approach However as there is only one scheme in this category no real conclusions can be drawn about this design
25
Evaluation of Traffic Calming Schemes Implemented 1997 ndash 2002
Table 47 Drop in collisions by type of scheme
Type No in Study
All colls 4 years before
Drop in collisions (4 years adjusted) Annual cost saving euro
Fatal Serious Minor Total Tot per
site Total Per site
A 39 171 49 -19 347 377 10 2913300 74700
B 8 31 32 -12 78 98 12 1772300 221500
C 5 42 -02 13 80 91 18 42600 8500
D 1 8 -02 10 26 34 34 -40800 -40800
E 10 48 -11 -22 -56 -90 -09 -867800 -86800
F 11 55 58 -35 -49 -26 -02 2985200 271400
G 5 20 25 -09 28 43 09 1354000 270800
H 3 13 10 -37 -55 -82 -27 260900 87000
I 8 14 07 01 -59 -51 -06 366800 45900
J 1 6 00 11 27 38 38 106600 106600
Total 91 408 164 -100 368 433 05 8893400 Avge 97700
Table 48 Grouping type of scheme by type of gateway
Type No in Study
All colls 4 years before
Drop in collisions (4 years adjusted) Annual cost saving euro
Fatal Serious Minor Total Tot per
site Total Per site
Central Island
Gateway 53 252 76 -08 532 600 11 4687600 88400
Simple Gateway
26 123 71 -67 -77 -73 -03 3471500 133500
Signs Only
11 27 17 -36 -114 -133 -12 627800 57100
Type J 1 6 00 11 27 38 38 106600 106600
Total 91 408 164 -100 368 433 05 8893400 Avge 97700
Table 49 Types of scheme and their groupings
Type Treatment Group
A Central island gateway central islands amp narrowing with kerbs inside
Central Island Gateway
B Central island gateway narrowing with kerbs amp no islands inside
C Central island gateway and lining
D Central island gateway and nothing else
E Simple gateway central islands amp narrowing with kerbs insides Simple
GatewayF Simple gateway narrowing with kerbs amp no islands inside
G Simple gateway and lining
H Gateway signs and lining Signs Only
I Gateway signs and nothing else
J No gateway narrowing with kerbs amp no islands inside No Gateway
26
Evaluation of Traffic Calming Schemes Implemented 1997 ndash 2002
48 Results By Type of Collision Table 410 shows the before and after collisions each year for the three main types of collision pedestrian single vehicle and head on The drop shown in the table is an adjusted figure and is relative to the decrease in each of these types of collision in the control data throughout all similar towns and villages on national roads over the period examined
The results show that pedestrian collisions decreased overall by about 8 from a figure of 69 and head-on type collisions have decreased by about 14 from 45 These are quite significant decreases of about 13 and 29 respectively However there has been effectively no change in single vehicle collisions only a very small increase of negligible percentage change
Table 410 Type of collision
Year No of
Schemes
All collisions 4 years before Drop in collisions (4 years adjusted)
ped single veh head on ped single veh head on
1997 12 7 15 8 -70 -03 09
1998 14 3 3 7 -19 -34 -01
1999 18 18 13 7 93 59 13
2000 9 5 6 4 01 -20 12
2001 23 24 14 16 49 -10 132
2002 15 12 12 3 20 06 -30
Total 91 69 63 45 75 -02 135
Total Percentage Drop 13 -0 29
The greatest decrease is in head-on type collisions Head-on collisions are not a particularly significant proportion of all collisions within these towns and villages and before implementation of the traffic calming they constituted only about 11 of all of collisions However the reduction of 135 collisions over four years represents a 29 drop in this type of collision compared with figures before implementation which is a significant result This decrease can be directly attributed to the fundamental design of traffic calming in which the two directions of flow are divided by central kerbed islands and central hatched areas
Pedestrian collisions have also decreased Pedestrian collisions were about 19 of all collisions within these towns and villages and the drop of 13 in pedestrian collisions is much the same as the general drop of 13 in collisions overall within the treated towns Although this is a good result in that pedestrian collisions have decreased in treated towns and villages 13 more than they have decreased in other similar locations it is not as good as was expected It was assumed that the inherent ldquopedestrian friendlyrdquo nature of traffic calming with provision of footpaths and pedestrian crossings would have a comparatively greater effect on pedestrian collisions Examination of the individual collisions in the after period suggests that the increases in pedestrian collisions are occurring in only about a dozen of the 91 towns and villages and that half of these dozen have 3 or more pedestrian incidents in the four year after period There appears to be no correlation with the provision of a pedestrian crossing as part of the traffic calming scheme A more detailed study of these locations is needed to investigate pedestrian collisions further and to ascertain whether there is any link between the provision of either pedestrian crossings or footpaths and the decrease in pedestrian collisions
Single vehicle collisions have not changed at all in relation to the general decrease in single vehicle collisions in all similar towns and villages Single vehicle collisions are those involving only one vehicle Usually in single vehicle incidents the vehicle leaves the driving lane of the road and collides with a roadside object
27
Evaluation of Traffic Calming Schemes Implemented 1997 ndash 2002
Occasionally there is no collision with a roadside object but because of the difference in levels between road and surrounding ground the occupants are injured when the vehicle comes to a halt The lack of any significant change in the occurrence of single vehicle collisions could possibly be explained by the fact that implementation of traffic calming introduces many new objects into the roadside space and reduces the available width within the driving lane Thus when a driver does stray from the correct path there is less forgiveness in the roadside environment and the chances of leaving the defined driving lane or striking an object is increased The general decrease in collisions at traffic calming sites due to the reduced speed is offset by this increased chance of hitting a roadside object which has thus resulted in no change in the incidence of these types of collisions
49 Results for Towns and Villages Treated at One End Only At 27 of the 91 locations only one end of the town or village was treated with traffic calming In 8 of these cases these were entries into a large town or city or into a coastal town where the route ended at the remaining 19 locations there was a through route but only one half of the village was treated Table 411 shows the results arranged according to whether or not both ends of the town were treated
The previous report on traffic calming constructed between 1993 and 1996 concluded that villages which had traffic calming at only one end did not perform in evaluation as well as those where both ends were treated The results shown below repeat this phenomenon At the 27 locations where only one end of the town or village was treated collisions reduced only by an average of 8 while at the other 64 locations where both ends were treated the reduction in collisions was 14 on average
When the 8 ldquosingle entryrdquo locations are separated out it can be seen that these treatments worked better than the other 19 one-end towns and villages This can perhaps be explained by the fact that these 7 locations were put in place to reduce the speed of vehicles approaching the outskirts of large towns or cities and their effect is only required to act within the environs of the traffic calming works Once past the traffic calming scheme the traffic enters a congested network where speed is not a concern For these 8 sites it was only the short length immediately around the traffic calming works was that was evaluated in the study
Table 411 Division of schemes according to whether both ends were treated
Type No in study
All colls 4 years before
Drop in collisions (4 years adjusted) Percentage drops
Fatal Serious Minor Total Total
per site Fatal Serious Minor Total
Both Ends 64 310 130 -76 311 364 06 52 -24 15 14
Single Entry 8 31 06 08 47 61 08 38 29 22 23
Half 19 67 29 -32 11 08 00 59 -41 3 1
All One-end 27 98 35 -24 58 69 03 54 -22 9 8
Total 91 408 164 -100 368 433 05 52 -24 14 13
28
Evaluation of Traffic Calming Schemes Implemented 1997 ndash 2002
5 CASE STUDIES
51 Comparison of Types of Traffic Calming Schemes The results indicate that schemes that have a central island at the gateway types AB C and D as
described in section 33 are more effective at reducing collisions than those schemes that do not have censhytral islands Four schemes on N15 were chosen to illustrate the typical differences between these types of scheme so that the layout of a scheme that has succeeded in collision reduction can be compared with one
that has not
The schemes illustrated all on N15 and in County Donegal are Ballyshannon Ballybofey Killygordon Castlefinn
Schemes With Central Island Type Gateways
Ballybofey and Castlefinn are schemes of type A having a gateway with both side buildouts and central island Inside the village or town this definition is continued using central islands and narrowing with kerbs
Both of these sites have experienced a reduction in collisions as the figures for 4 year before and after periods show Castlefinn particularly has had a notable reduction very much larger than the average of 13 for all the sites in this study
TownVillage collisions before collisions after reduction (adjusted) Ballybofey 9 6 16 Castlefinn 4 1 72
Schemes With Signs Only at Gateways
Ballyshannon and Killygordon are schemes of type H having only signs and no physical works at the gateway Definition inside the town or village is given only by using road markings
None of these sites has experienced any significant reduction in collisions as the 4 year figures below show These locations have had a slight increase in collisions relative to the general decrease in collisions across all similar towns and villages in the control data
TownVillage collisions before collisions after reduction (adjusted) Ballyshannon 7 6 -4 (increase) Killygordon 2 2 -9 (increase)
Comparison of Ballyshannon and Ballybofey
Ballyshannon and Ballybofey are similar sized towns and before traffic calming was introduced had similar approaches In both towns the speed limit extends a long way outside the centre of town and the road was wide on these approaches Both towns have busy town centres with narrow streets where vehicle speeds are not particularly high but in the zone between gateway and town centre high speeds were a problem and were addressed by traffic calming
While Ballyshannon had no central island constructed at the gateway and was treated with only signs and line marking on these approaches Ballybofey was treated with a kerbed central island kerbs and footpaths to narrow the road and a string of further central islands between the gateway and the centre of town Figures 51 and 52 below illustrate this
29
Evaluation of Traffic Calming Schemes Implemented 1997 ndash 2002
Comparison of figures 51 and 52 shows that the optical width has been considerably narrowed in Ballybofey whereas the effect is not so marked in Ballyshannon Figures 53 and 54 show how in Ballybofey this narrowing is continued on for the 600m between gateway and town centre reinforcing the slowing down effect that drivers experienced at the gateway
The differences in design of the approaches to these towns may possibly account for the differences in collision occurrence after traffic calming implementation
Figure 51 Ballyshannon south approach
Figure 52 Ballybofey south approach
30
Evaluation of Traffic Calming Schemes Implemented 1997 ndash 2002
Figure 53 Ballybofey south zone inside gateway
Figure 54 Ballybofey south zone inside gateway
31
Evaluation of Traffic Calming Schemes Implemented 1997 ndash 2002
Comparison of Killygordon and Castlefinn
Killygordon and Castlefinn are located within 6km of each other on the most northern section of N15 with a much lower traffic volume than either Ballybofey or Ballyshannon The N15 along this section in general has a narrower cross section without hard shoulders
Killygordon is a small village and had narrow approaches even before implementation of the traffic calming and the low collision rate before implementation reflects this The minimal treatment to this village under the traffic calming programme did little to change the collision occurrence Castlefinn is a larger village and before implementation its approaches were wider than those to Killygordon The number of collisions in Castlefinn before implementation was twice that in Killygordon The construction of a kerbed central island kerbs and footpaths to narrow the road and a further central island at the centre of the village has evidently had an effect on collisions which have now reduced to numbers below that in Killygordon Figures 55 and 56 below illustrate the differences between the two villages at the gateway while Figures 57 and 58 illustrate the changed look of the centre of Castlefinn as a result of traffic calming construction
Figure 55 Killygordon west approach
Figure 56 Castlefinn west approach
32
Evaluation of Traffic Calming Schemes Implemented 1997 ndash 2002
Figure 57 Castlefinn centre before traffic calming
Figure 58 Castlefinn centre after traffic calming
33
Evaluation of Traffic Calming Schemes Implemented 1997 ndash 2002
Figure 59 Approach to a village similar to Grange before traffic calming
52 Successful Schemes
N15 Grange
Grange has had one of the greatest reductions in collisions in this study
Collisions in 4 years before 9 Collisions in 4 years after 2 reduction (adjusted) 75
Grange is on a busy section of N15 in County Sligo It is a medium sized village with shops pubs petrol station police station church and a few dozen dwelling houses all with frontage onto the national road It has two busy junctions with local primary distributor roads leading to a moderately populated hinterland in the summer the population increases significantly with holidaymakers visiting the coastal area
Traffic calming was installed in 2000 Before this the approaches to the village were wide with hard shoulshyders and this cross section continued through the length of the town On entering the village from the north the length within the built up area approaching the centre is downhill so that drivers would need constant concentration and awareness of their speed to achieve a reduction in speed and to maintain that reduction on this approach From the south there is also a downhill approach but outside the built up area so that speeds approaching the start of the speed limited zone were high
Although an appropriate photograph of Grange before construction of the traffic calming is not available the photograph below of a similar sized village on N24 with similar road widths is shown below in Figure 59
Grange was treated with kerbed central islands at each gateway kerbs and footpaths to narrow the road and a string of further central islands between the two gateways Driving lanes in each direction are now a constant 35m throughout the village A signalised controlled pedestrian crossing was also constructed at the centre of the town There are now footpaths for the entire length of village between gateways and as well as the controlled crossing there are several locations where pedestrians can cross the road with the aid of the central island refuges Figures 510 511 and 512 below illustrate the works
In the years since traffic calming was implemented further housing an industrial estate and commercial sites have been constructed in the vicinity Traffic volumes turning at the junction have increased substantially
34
Evaluation of Traffic Calming Schemes Implemented 1997 ndash 2002
Figure 510 Gateway at Grange with central Island ndash Viewed from inside the village
Figure 511 Approach to Grange village centre from the north
35
Evaluation of Traffic Calming Schemes Implemented 1997 ndash 2002
Figure 512 Grange village centre
In the four years before construction of traffic calming there were roughly 2 collisions each year in the vilshylage Four of the nine collisions were single vehicle incidents and two were pedestrian collisions both involving pedestrians attempting to cross the road Skidding occurred in six of the nine collisions which is an unusually large proportion and suggests that there was a high incidence of sudden braking from high speeds
In the four years after implementation of the scheme there have been only two collisions one in the village centre where the rear of a parked vehicle was hit and one single vehicle loss of control incident on the south approach to the village
N20 Newtwopothouse Newtwopothouse has also had a significant reduction in collisions in this study
Collisions in 4 years before 4
Collisions in 4 years after 0
reduction (adjusted) 100
Newtwopothouse is on a busy section of N20 in County Cork It is a tiny settlement on a staggered junction with only a pubcafe and a shoppost office having frontage onto the national road The bulk of the housing in the area is along the two side roads stretching a few hundred metres down each road and on the eastshyern side road there is a school about 100m from the N20 Before construction of the traffic calming it did not appear to the passing driver on N20 as if there were a village at all merely a crossroads However there was a fairly large volume of traffic turning to and from the two side roads and pedestrian traffic across the N20 between housing and school
Before implementation of traffic calming the road on approach to and through the location was wide being a standard 7m single carriageway with 3m hard shoulders Figures 513 and 515 show the location before traffic calming was installed
36
Evaluation of Traffic Calming Schemes Implemented 1997 ndash 2002
Figure 513 Approach to Newtwopothouse from north before traffic calming
Figure 514 Approach to Newtwopothouse from north
Traffic calming was implemented in 2001 Similarly to Grange Newtwopothouse was treated with kerbed central islands at each gateway kerbs and footpaths to narrow the road further central islands between the two gateways and a signalised controlled pedestrian crossing in the centre Driving lanes in each direction are now a constant 35m throughout the scheme and there is now lighting for the entire length between gateways and footpaths in the central stretch around the junction and bus stops Figures 514 and 516 below illustrate the works by showing the same locations as shown in Figures 513 and 515
37
Evaluation of Traffic Calming Schemes Implemented 1997 ndash 2002
Figure 515 Crossroads at Newtwopothouse before traffic calming
Figure 516 Crossroads at Newtwopothouse with pedestrian crossing
In the four years before construction of traffic calming there were 4 collisions at this location all of which involved turning at the junction
In the four years after implementation of the scheme there have been no collisions
38
Evaluation of Traffic Calming Schemes Implemented 1997 ndash 2002
6 CONCLUSIONS
61 Reduction in Collisions Between 1997 and 2002 there were 94 traffic calming schemes completed at towns and villages on the national roads
Over all the 91 studied locations comparing the 4 years before each scheme with the 4 years after there was a reduction of 106 collisions made up of 21 fatal collisions 20 serious injury collisions and 65 minor injury collisions
62 Reduction in Comparison with Control Data When comparing with the control data and allowing for the general decrease in collisions overall on national roads during this time period this translates to a reduction of 433 collisions This is made up of a reduction of 164 fatal collisions and 368 minor injury collisions and an increase of 100 serious collisions
These figures represent a 13 reduction in all collisions with fatal collisions reduced by 52 Serious and minor injury collisions together reduced by 9
63 Reduction in Severity of Collisions The implementation of traffic calming has therefore had the effect of reducing the number of crashes within the geographical areas of their influence Its more significant effect is in reducing the severity of collisions The percentage of all collisions that were fatal dropped from 9 in the 4 years before implementation to 5 in the 4 years after The percentage of minor injury collisions rose by a corresponding amount
64 Cost Benefit Analysis Using the ldquoWillingness to Payrdquo method of evaluation the average yearly rate of return over all the years evaluated is 46
65 Effects of Different Types of Schemes Traffic Calming Schemes that have a central island in the Gateway and continue this effect with solid central islands throughout the village are more effective in reducing collisions than those that do not
Schemes that consisted of only signs and had no physical works did not have any effect at all in reducing collisions
Traffic Calming Schemes where both ends of the town or village were treated were more effective in reducshying collisions than those where only one was treated
39
Evaluation of Traffic Calming Schemes Implemented 1997 ndash 2002
40
7
Evaluation of Traffic Calming Schemes Implemented 1997 ndash 2002
RECOMMENDATIONS
There are eight main recommendations that emerge from this study
1 The programme of traffic calming of towns and villages on national roads should be continued
2 The programme should be restricted to only towns and village where traffic calming is likely to have an impact
3 An updated priority list should be produced to identify those towns and villages where traffic calming is likely to have an impact
4 Prioritised towns and villages should have a) an injury collision record over the past 5 years that is higher than average b) 85 percentile speeds that are above the posted speed limit c) a physical layout that is possible to treat with traffic calming
5 Where traffic calming is implemented it should include a central island at the gateway and should include physical narrowings throughout the town or village No scheme should consist of just signs and road markings
6 At any location where traffic calming is being considered the existing vehicle speeds through the village must be surveyed
7 After each traffic calming scheme has been implemented the revised vehicle speeds through the village must be surveyed as soon as possible
8 A further study should examine in more detail the single vehicle accidents and pedestrian accidents that been identified in this study in treated villages and towns
41
Evaluation of Traffic Calming Schemes Implemented 1997 ndash 2002
42
Evaluation of Traffic Calming Schemes Implemented 1997 ndash 2002
REFERENCES
RS460 Evaluation of Traffic Calming Schemes Constructed on National Roads 1993-1996 National Roads Authority 2002
The Road to Safety Government Strategy for Road Safety 1998-2002 Department of the Environment and Local Government 1998
Road Safety Strategy Government Strategy for Road Safety 2004-2006 Department of Transport 2004
Road Safety Strategy 2007-2012 Road Safety Authority 2007
2005 Survey of Free Speeds (Urban and Rural) National Roads Authority 2006
Guidelines on Traffic Calming for Towns and Villages on National Routes National Roads Authority 2004
Reducing Traffic Injuries Resulting From Excess and Inappropriate Speed European Transport Safety Council 1995
The importance of confounding in observational before-and-after studies of road safety measures Rune Elvik Accident Analysis and Prevention 34(5) 2002
Parameter Values for Use in Cost-Benefit Analysis of Transport Projects Goodbody Economic Consultants 2004
43
Evaluation of Traffic Calming Schemes Implemented 1997 ndash 2002
44
Evaluation of Traffic Calming Schemes Implemented 1997 ndash 2002
Evaluation of Traffic Calming Schemes Implemented 1997 ndash 2002
APPENDIX A
Ranking of Sites According to Primary Criteria for Selection for Traffic Calming National Primary Routes Only
Route Town Village Population AADT Length Colls
over 5 yrs
Collisions per 10 million vehkm
Collisions per year per 1000
Population
+Combined Collision
Rate
N17 BALLINDINE 232 5058 0587 8 148 690 640
N25 KILRANE 214 5310 2255 10 46 935 559 N08 LITTLETON 566 5598 0591 10 166 353 508
N11 ASHFORD 500 12768 1352 19 60 760 501 N01 JULIANSTOWN 450 14270 1146 16 54 711 463
N05 FRENCHPARK 272 2994 0805 11 250 809 452
N02 COLLON 335 6164 0626 7 99 418 408 N18 KILCOLGAN 500 9565 0483 9 107 360 393
N08 WATERGRASSHILL 250 13706 0985 8 32 640 385 N01 CASTLEBELLINGHAM 762 10983 1891 20 53 525 368
N08 RATHCORMACK 500 11807 1158 11 44 440 308 N09 DUNGARVAN 500 3261 028 4 240 160 280
N04 DROMOD 250 3598 059 3 77 240 275 N20 CHARLEVILLE 3000 9655 1988 12 34 400 269
N25 LEMYBRIEN 222 6471 0918 4 37 360 254 N11 KILMACANOGE 763 26721 0692 13 39 341 247
N25 GLOUNTHAUNE 500 17499 0802 17 66 680 236
N07 MONEYGALL 344 6350 0576 4 60 233 236 N09 MULLINAVAT 283 3858 0925 7 107 495 231
N08 KILBEHENY 500 6897 0863 6 55 240 230 N02 CASTLEBLAYNEY 2938 4154 3525 21 79 143 229
N07 BORRIS IN OSSORY 500 7848 1141 7 43 280 226 N15 BUNDORAN 1463 7275 2371 17 54 232 224
N24 KILSHEELAN 435 4924 1027 5 54 230 223 N02 ARDEE 3604 7019 2394 24 78 133 223
N05 CHARLESTOWN 712 2956 125 5 74 140 219 N11 CAMOLIN 293 5192 1125 4 38 273 212
N06 CRAUGHWELL 232 7669 1558 4 18 345 209
N24 MONARD 500 5735 0392 3 73 120 206 N22 FARRANFORE 500 7614 1093 6 40 240 199
N21 ABBEYFEALE 1501 9982 3287 39 65 520 195 N15 GRANGE 500 6352 1427 6 36 240 193
N24 CARRICK ON SUIR 5143 4924 2903 20 77 078 192 N04 COLLOONEY 612 8617 0864 12 88 392 186
N18 BAREFIELD 500 5852 1087 5 43 200 186 N17 CLAREGALWAY 500 11128 166 7 21 280 182
N20 BALLYHAY 500 7440 0364 3 61 120 181 N14 CASTLEFINN 692 6024 0846 5 54 145 180
N26 FOXFORD 974 1928 1915 9 134 185 180
N18 ARDRAHAN 500 6650 0413 3 60 120 180 N02 ASHBOURNE 4411 10840 2792 30 54 136 177
N08 ABBEYLEIX 1299 8083 1778 11 42 169 169 N02 CARRICKMACROSS 3341 11436 2989 27 43 162 167
N11 OILGATE 262 6332 0393 2 44 153 164 N04 BALLINAFAD 500 3199 0239 2 143 080 163
N02 CASTLESHANE 250 5338 0875 5 59 400 159 N02 SLANE 699 6064 1885 13 62 372 155
N02 ANNAYALLA 500 5338 0655 6 94 240 154
N30 ENNISCORTHY 7655 3972 0565 6 146 016 150 N10 PAULSTOWN 234 4858 0753 2 30 171 145
A1
Evaluation of Traffic Calming Schemes Implemented 1997 ndash 2002
Route Town Village Population AADT Length Colls
over 5 yrs
Collisions per 10 million vehkm
Collisions per year per 1000
Population
+Combined Collision
Rate
N08 JOHNSTOWN 422 6063 1445 4 25 190 145 N07 TOOMYVARA 500 7606 069 7 73 280 143
N16 SLIGO 17302 5680 1796 25 134 029 142 N26 BALLINA 477 5398 1983 9 46 377 140
N16 GLENFARNE 500 1746 1846 5 85 200 135 N06 ROCHFORTBRIDGE 721 6202 1348 5 33 139 135
N24 LIMERICK JCN 250 5735 0698 4 55 320 135 N22 BALLINCOLLIG 12124 15125 6303 68 39 112 134
N24 FIDDOWN 500 4588 0966 6 74 240 134
N01 DROGHEDA 23914 19455 4526 79 49 066 131 N08 NEWINN 500 7163 0648 3 35 120 131
N15 STRANORLAR+BALLYBOFEY 2972 3337 3918 22 92 148 129 N14 LIFFORD 1359 3854 1151 4 49 059 128
N22 LISSARDA 500 7096 0696 6 67 240 127 N22 BALLYVOURNEY 500 3636 2786 8 43 320 123
N06 KILREEKILL 500 9055 059 3 31 120 122 N17 BELLAHY+CHARLESTOWN 712 3834 1103 3 39 084 120
N22 MACROOM 2363 7096 4588 31 52 262 118 N15 KILLYGORDON 500 6024 0493 2 37 080 114
N08 HORSEampJOCKEY 500 7607 026 3 83 120 113
N18 GORT 1093 7709 2855 16 40 293 113 N04 CLONARD 500 10570 0599 3 26 120 112
N02 EMYVALE 479 4073 0813 4 66 167 108 N05 BELLAVARY 500 5138 0633 4 67 160 107
N20 PATRICKSWELL 1019 14486 1742 15 33 294 106 N25 KILMEADAN 500 6177 1817 7 34 280 104
N24 PALLASGREEN 500 4638 0747 4 63 160 103 N15 BALLYSHANNON 2838 8955 2844 13 28 092 102
N21 TRALEE 17225 12840 1934 40 88 046 100 N03 KELLS 3539 8857 1737 10 36 057 099
N25 KILLEAGH 347 7244 1481 5 26 288 098
N24 BANSHA 293 4221 0855 3 46 205 097 N03 CARNAROSS 500 6683 0933 5 44 200 094
N02 MONAGHAN 5946 7630 3588 32 64 108 091 N24 CAHIR 2055 13277 2528 11 18 107 089
N01 DUNDALK 25843 22685 6273 153 59 118 089 N06 MILLTOWNPASS 500 6202 0733 4 48 160 088
N18 NEWMARKET-ON-FERGUS 1583 10584 1461 13 46 164 087 N17 CURRY 250 4585 0548 2 44 160 084
N03 CAVAN 5254 11709 236 28 56 107 082 N22 KILLARNEY 7275 9731 3819 19 28 052 082
N09 MOONE+TIMOLIN 500 6720 2231 6 22 240 082
N11 RATHNEW 1496 12736 1072 11 44 147 081 N15 DONEGAL 2193 6149 2053 12 52 109 079
N25 YOUGHAL 5828 7598 522 34 47 117 076 N03 DUNSHAUGHLIN 1275 15588 1458 6 14 094 076
N04 CARRICK ON SHANNON 2500 4257 2393 10 54 080 074 N06 BALLINASLOE 5812 9582 5241 37 40 127 072
N21 NEWCASTLE WEST 2500 7975 2766 16 40 128 072 N20 BUTTEVANT 1125 7440 1271 7 41 124 072
N15 SLIGO 17302 8932 1274 14 67 016 071 N15 DRUMCLIFF 500 9726 0737 2 15 080 071
N25 NEW ROSS 6079 6846 2424 17 56 056 070
A2
Evaluation of Traffic Calming Schemes Implemented 1997 ndash 2002
Route Town Village Population AADT Length Colls
over 5 yrs
Collisions per 10 million vehkm
Collisions per year per 1000
Population
+Combined Collision
Rate
N25 DUNGARVAN 6920 5688 4649 25 52 072 070
N20 CROOM 1090 5658 1036 5 47 092 070 N24 PILTOWN 717 4588 1166 4 41 112 069
N08 MITCHELSTOWN 3090 13395 2084 19 37 123 068 N07 MONASTEREVIN 2224 11968 1754 7 18 063 068
N15 CLIFFONEY 292 5089 0652 2 33 137 067 N09 GOWRAN 477 2517 0949 2 46 084 067
N08 FERMOY 4462 10622 2955 23 40 103 066 N04 RATHOWEN 500 5465 0439 1 23 040 066
N04 NEWTOWNFORBES 250 3711 1169 2 25 160 065 N30 NEW ROSS 6079 3514 2126 8 59 026 065
N07 NENAGH 5825 8352 2422 18 49 062 064
N07 MOUNTRATH 1375 6980 1827 8 34 116 063 N01 BALBRIGGAN 7724 13451 3226 33 42 085 063
N15 LISCOOLEY 500 6024 0423 2 43 080 063 N17 TOBERCURRY 1069 4585 2168 6 33 112 061
N03 NAVAN 11706 11782 4695 43 43 073 061 N04 ENFIELD 500 10570 1127 2 09 080 058
N30 CLONROCHE 500 2786 1049 2 37 080 057 N09 CARLOW 14027 9020 5154 37 44 053 057
N16 MANORHAMILTON 995 2393 1665 3 41 060 056 N24 MOONCOIN 500 8954 1507 2 08 080 056
N06 LOUGHREA 3271 8389 295 15 33 092 056
N06 MOATE 1529 5973 2482 4 15 052 056 N08 CULLAHILL 500 6063 051 1 18 040 055
N08 URLINGFORD 689 6407 1309 4 26 116 055 N08 CASHEL 2814 7238 2342 11 36 078 055
N11 GOREY 3840 13253 1949 16 34 083 055 N11 FERNS 859 5192 0974 3 33 070 050
N18 ENNIS 16058 13516 7938 59 30 073 049 N23 CASTLEISLAND 2207 3515 0727 2 43 018 047
N05 BELLANAGARE 500 2309 0639 1 37 040 047 N04 KINNEGAD 415 6954 2589 3 09 145 045
N09 CASTLEDERMOT 741 6112 2144 4 17 108 044
N11 ARKLOW 7987 12321 3857 24 28 060 043 N18 CRUSHEEN 500 5852 0853 1 11 040 042
N03 VIRGINIA 720 6683 1261 3 20 083 040 N05 BALLAGHADERREEN 1270 4251 2127 4 24 063 040
N07 BALLYBRITTAS 500 10826 0524 1 10 040 039 N06 TYRRELLSPASS 376 6707 1407 1 06 053 038
N11 ENNISCORTHY 7655 7570 1269 6 34 016 038 N04 SLIGO 17964 15138 3821 31 29 035 038
N24 TIPPERARY 4963 11547 2213 12 26 048 038 N26 SWINFORD 1216 1928 1963 2 29 033 037
N07 BIRDHILL 500 9770 0702 2 16 080 036
N07 KILDARE 4196 14907 2763 14 19 067 035 N20 MALLOW 7521 10164 2681 13 26 035 035
N05 STROKESTOWN 568 2809 2371 2 16 070 034 N10 KNOCKTOPHER 500 2734 0841 1 24 040 034
N17 TUAM 5540 10723 305 13 22 047 034 N04 EDGEWORTHSTOWN 801 5520 2094 3 14 075 033
N04 BALLYSADARE 500 8617 0996 2 13 080 033 N10 STONYFORD 500 3401 0717 1 22 040 032
A3
Evaluation of Traffic Calming Schemes Implemented 1997 ndash 2002
Route Town Village Population AADT Length Colls
over 5 yrs
Collisions per 10 million vehkm
Collisions per year per 1000
Population
+Combined Collision
Rate
N21 CASTLEISLAND 2207 5467 1873 4 21 036 030
N07 PORTLAOISE 8360 12097 501 19 17 045 029 N09 THOMASTOWN 2512 3261 2244 3 22 024 028
N05 TULSK 500 2220 1432 1 17 040 027 N25 SWEEP 500 4274 0755 1 17 040 027
N06 GALWAY 60000 24461 5106 50 22 017 026 N03 DROLCHEAD NUA 11778 5345 04 1 26 002 026
N03 BELTURBET 1223 3316 1868 2 18 033 026 N08 DURROW 721 7244 1338 2 11 055 025
N05 WESTPORT 3688 12879 1194 5 18 027 025 N19 SHANNON 7920 14965 05 3 22 008 024
N21 ADARE 500 3348 1288 1 13 040 023
N07 ROSCREA 4231 7718 3502 7 14 033 022 N17 KNOCK 440 3958 1251 1 11 045 022
N10 KILKENNY 17669 7149 3379 8 18 009 020 N13 STRANORLAR 2972 7141 0925 2 17 013 020
N20 LIMERICK 75000 20672 6595 42 17 011 020 N24 CLONMEL 15562 7270 5907 12 15 015 019
N13 BRIDGE END 500 8153 075 1 09 040 019 N05 CASTLEBAR 7648 7442 3988 7 13 018 018
N17 CLAREMORRIS 1907 5058 1868 2 12 021 017 N24 OOLA 474 4864 1937 1 06 042 016
N07 LIMERICK 75000 15709 10841 41 13 011 016
N21 TEMPLEGLANTINE 819 6759 0828 1 10 024 016 N17 GALWAY 60000 27843 3176 20 12 007 014
N05 LONGFORD 6824 6874 4021 5 10 015 014 N07 DUBLIN 500000 47272 2387 22 11 001 011
N04 BOYLE 2197 3199 2036 1 08 009 011 N11 DUBLIN 500000 40055 13999 95 09 004 010
N04 DUBLIN 500000 29736 9209 42 08 002 009 N18 LIMERICK 75000 27171 5095 17 07 005 008
N09 WATERFORD 75000 14883 1693 3 07 001 007 N50 DUBLIN 600000 18676 124 10 02 000 002
N24 LIMERICK 75436 10740 3098 1 02 000 002
N08 CORK 136000 32213 414 2 01 000 001 N22 CORK 136000 25429 3556 1 01 000 001
N09 BALLYHALE 500 3858 0867 0 00 000 000 N17 BALLYNACARROW 500 3807 0798 0 00 000 000
N04 BALLYNALACK 500 5465 0748 0 00 000 000 N03 BALLYSHANNON 2838 3088 0899 0 00 000 000
N05 CARRACASTLE 500 2956 1215 0 00 000 000 N04 CASTLEBALDWIN 500 3199 0252 0 00 000 000
N18 CLARINBRIDGE 500 9565 1417 0 00 000 000 N20 CORK 136000 15947 4267 0 00 000 000
N27 CORK 136000 13277 3778 0 00 000 000
N01 DUBLIN 500000 28975 4298 0 00 000 000 N02 DUBLIN 500000 11524 6397 0 00 000 000
N03 DUBLIN 500000 21436 4357 0 00 000 000 N06 HORSELEAP 500 6769 0735 0 00 000 000
N06 KILBEGGAN 617 6707 1286 0 00 000 000 N14 LETTERKENNY 10726 15411 093 0 00 000 000
N17 MILLTOWN 500 5467 0869 0 00 000 000 N21 PATRICKSWELL 1019 3348 0274 0 00 000 000
A4
Evaluation of Traffic Calming Schemes Implemented 1997 ndash 2002
Route Town Village Population AADT Length Colls
over 5 yrs
Collisions per 10 million vehkm
Collisions per year per 1000
Population
+Combined Collision
Rate
N09 PAULSTOWN 234 6653 0721 0 00 000 000
N04 ROOSKY 249 3827 0696 0 00 000 000 N28 SHANBALLY 500 5098 0506 0 00 000 000
N05 TERMONBARRY 500 3366 098 0 00 000 000 N25 WATERFORD 41853 10668 8427 0 00 000 000
N25 BALLINABOOLA N25 BARNTOWN
N07 DALYS CROSS N18 GORT RD ENNIS
N20 NEWTWOPOTHOUSE N08 RINGASKIDDY
+ Combined Collision Rate [Coll Rate 10mvehkmyr5 + Coll Rate 1000popyr2]2 These towns and villages were not assessed as funding was already committed
A5
Evaluation of Traffic Calming Schemes Implemented 1997 ndash 2002Evaluation of Traffic Calming Schemes Implemented 1997 ndash 2002
Evaluation of Traffic Calming Schemes Implemented 1997 ndash 2002
51
Appendix B Evaluation of Traffic Calming Schemes Implemented 1997 ndash 2002
APPENDIX B Scheme Details for All Sites
Scheme Local Authority Rte Both or Half Spd Lim Type Colls 4 yrs before raw
Colls 4 yrs after raw
Drop in Ann Colls Adj for
All Nats Area Evaluated Year
Finished Year
Started Year
Bypassed Year
Changed Total Cost in 2002 Prices
Carrickarnon Louth 1 both 60 F 15 10 079 Gate - Gate 2001 2007 109400
Greengates Louth 1 both 40 B 8 2 130 Gate - Gate 1997 2002 489900 KilsaranCastlebellingham Louth 1 both 30 A 23 10 260 Gate - Gate 1997 1997 2002 255600
Julianstown Meath 1 both 30 C 13 10 024 Gate - Gate 1999 1999 2003 767700 Emyvale Monaghan 2 both 30 F 5 7 -065 Gate - Gate 2001 46500
Castleblaney (N) Monaghan 2 2nd half 40 A 3 5 -073 Gate - Bend 2000 2000 2007 132300
Carrickmacross (N) Monaghan 2 half 40 A 7 4 008 Gate - Bend 1998 1998 2005 92500 Ardee (S) Louth 2 half 30 A 4 9 -152 Gate - R170 Jcn 1997 1997 238300
Collon Louth 2 both 30 E 6 7 -038 Gate - Gate 1997 1996 251600 Slane Meath 2 both 30 A 8 5 048 Gate - Gate 2002 2001 534500
Kells Meath 3 both 30 A 8 8 -024 Gate - Gate 2001 730900 Castlebaldwin Sligo 4 both 30 A 5 2 062 Gate - Gate 1999 1998 547500
Dromod Leitrim 4 both 30 B 1 3 -052 Gate - Gate 2000 1999 2008 418300 Roosky (E) Leitrim 4 half 30 B 1 -025 Gate - Centre 1998 1997 2008 123300
Newtownforbes (E) Longford 4 1st half 30 F 1 2 -028 Gate - Bend 2001 2003 73800 Rathowen Westmeath 4 both 30 A 1 1 -002 Gate - Gate 1999 1999 369400
Clonard (E) Meath 4 half 40 B 1 1 -000 Gate - Centre 1997 2006 53200
Enfield Meath 4 both 30 C 8 2 114 Gate - Gate 1999 1998 2002 73900 CharlestownBellahy (WN) Mayo 5 half 30 A 7 132 Gates - Centre 1999 1998 2008 523400
Frenchpark Roscommon 5 both 30 F 5 3 032 Gate - Gate 2001 133600 Craughwell Galway 6 both 40 F 6 6 -015 Gate - Gate 2000 1999 30600
Rochfordbridge Westmeath 6 both 30 A 7 5 037 Gate - Gate 1998 1998 2006 199600 Miltownpass Westmeath 6 both 40 F 1 1 -002 Gate - Gate 2000 2000 2006 2005 248000
B1
Appendix B Evaluation of Traffic Calming Schemes Implemented 1997 ndash 2002
Scheme Local Authority Rte Both or Half Spd Lim Type Colls 4 yrs before raw
Colls 4 yrs after raw
Drop in Ann Colls Adj for
All Nats Area Evaluated Year
Finished Year
Started Year
Bypassed Year
Changed Total Cost in 2002 Prices
Moneygall Offaly 7 both 30 C 2 4 -056 Gate - Gate 2001 1997 2002 410900 Ballybrittas Laois 7 both 40 A 5 3 025 Gate - Gate 2002 2005 197900
Monasterevin (W) Kildare 7 half 30 G 4 1 064 Gate - Bridge 1998 1998 2005 29900
Cullahill Laois 8 both 40 A 1 2 -027 Gate - Gate 2000 1999 134200 Abbeyleix (S) Laois 8 half 30 A 1 4 -077 Gate - Centre 2000 2000 330700
Mullinavat (N) Kilkenny 9 half 30 G 6 3 057 Gate - Centre 2001 96600 Dungarvan Kilkenny 9 both 40 G 1 2 -028 Gate - Gate 2001 212700
Paulstown Kilkenny 9 both 30 A 2 046 Gate - Gate 1999 1998 184700 Kilkenny (E) Kilkenny 10 single entry 30 B 10 3 133 Gate - Centre 2001 195200
Claragh Kilkenny 10 both 60 F 2 2 -016 Gate - Gate 1999 206500 Camolin Wexford 11 both 30 A 5 1 073 Gate - Gate 2002 581000
Ashford Wicklow 11 both 30 E 16 7 160 Gate - Gate 1999 1998 2004 92300 Lifford (N amp W) Donegal 14 both 30 A 10 5 095 Gate - Gate 2001 70400
Castlefinn Donegal 15 both 30 A 4 1 063 Gate - Gate 2001 127500
Killygordon Donegal 15 both 30 H 2 2 -004 Gate - Gate 2002 113300 Ballybofey (S) Donegal 15 half 40 A 9 6 029 Gate - Centre 2002 246400
Ballyshannon (S) Donegal 15 2nd half 40 G 7 6 -006 Gate - Bridge 1997 1996 2006 159700 Bundoran Donegal 15 both 40 H 9 15 -163 Gate - Gate 1997 2006 41900
Cliffony Sligo 15 both 30 A 2 1 019 Gate - Gate 2001 143800 Grange Sligo 15 both 30 A 9 2 149 Gate - Gate 2000 1999 172500
Drumcliffe Sligo 15 both 30 F 7 5 033 Gate - Gate 2000 1999 259100 Ballindine Mayo 17 both 30 E 3 6 -091 Gate - Gate 1997 1997 106500
Claregalway Galway 17 both 30 A 3 7 -116 Gate - Gate 1998 1997 328300 Kilcolgan Galway 18 both 40 E 8 8 -042 Gate - Gate 1999 1999 2003 46200
Ardrahan Galway 18 both 30 J 6 1 096 Gate - Gate 1999 1999 46200
Crusheen (N) Clare 18 half 30 E 1 -025 Gate - Bend 1998 1997 2003 251400 Barefield (N) Clare 18 half 40 G 2 1 021 Gate - Centre 1998 1997 2007 251400
B2
Appendix B Evaluation of Traffic Calming Schemes Implemented 1997 ndash 2002
Scheme Local Authority Rte Both or Half Spd Lim Type Colls 4 yrs before raw
Colls 4 yrs after raw
Drop in Ann Colls Adj for
All Nats Area Evaluated Year
Finished Year
Started Year
Bypassed Year
Changed Total Cost in 2002 Prices
Charleville (S) Cork 20 1st half 30 A 2 2 -006 Gate - Ped X 2001 2004 165400
Ballyhea Cork 20 both 40 A 1 -025 Gate - Gate 1999 1999 784900
Newtwopothouse Cork 20 both 40 A 4 084 Gate - Gate 2001 165400
Cork (N) Cork 20 single entry 40 I 1 2 -030 Gate - Ped X 2002 239700
Farranfore Kerry 22 both 30 F 4 5 -032 Gate - Gate 1998 1998 2003 20000
Killarney (E) Kerry 22 single entry 40 D 8 3 085 Gate - Rbt 1998 1998 59900
Ballyvourney Cork 22 both 30 E 3 6 -090 Gate - Gate 2002 2001 570300
Lissarda Cork 22 both 40 A 4 4 -022 Gate - Gate 2002 333900
Ballincollig (W) Cork 22 half 30 B 10 8 041 Gate - Rbt 1997 1997 2004 496300
Cork (W) Cork 22 single entry 30 A 000 Gate - Vic X 1999 2004 193900
Monard South Tipperary 24 both 30 I 1 -025 Gate - Gate 1998 1998 39300
Bansha South Tipperary 24 both 30 I 2 2 -004 Gate - Gate 2001 138400
Kilsheelan South Tipperary 24 both 30 A 2 043 Gate - Gate 1999 1997 2007 194500
Carrick-on-Suir (W) South Tipperary 24 2nd half 30 A 3 066 Gate - Mini Rbt 2001 211900
Mooncoin Kilkenny 24 both 30 F 5 8 -088 Gate - Gate 1998 1998 140000
Lemybrien Waterford 25 both 40 A 1 1 -002 Gate - Gate 1998 1997 165700
Waterford (E) Kilkenny 25 single entry 30 A 5 1 084 Gate - Rbt 1997 1997 63900
Ballinaboola Wexford 25 both 30 A 3 3 -024 Gate - Gate 1999 1999 554100
Barntown Wexford 25 both 40 A 1 2 -037 Gate - Gate 1997 1997 639000
Kilrane (W) Wexford 25 half 30 A 4 4 -025 Gate - Speed Lim 1999 1998 2004 300400
Rosslare Harbour (W) Wexford 25 single entry 15 E 000 Gate - Harbour 2001 2004 16000
Foxford Mayo 26 both 30 I 6 1 083 Gate - Gate 2001 33300
B3
Appendix B Evaluation of Traffic Calming Schemes Implemented 1997 ndash 2002
Scheme Local Authority Rte Both or Half Spd Lim Type Colls 4 yrs before raw
Colls 4 yrs after raw
Drop in Ann Colls Adj for
All Nats Area Evaluated Year
Finished Year
Started Year
Bypassed Year
Changed Total Cost in 2002 Prices
Clonroche Wexford 30 both 30 F 4 2 035 Gate - Gate 2001 20400
New Ross (N) Wexford 30 both 30 A 2 4 -060 Gate - Gate 2002 47500
Smithborough (W) Monaghan 54 half 30 A 2 1 019 Gate - Centre 2001 56900
Carrickboy Longford 55 both 40 H 2 3 -037 Gate - Gate 2002 57100
Gortahork Donegal 56 both 30 I 1 5 -105 Gate - Gate 2002 45500
Dromore West Sligo 59 both 30 A 4 084 Gate - Gate 2000 156200
Ballisodare Sligo 59 both 30 A 000 Gate - Speed Lim 2002 1997 142700
Hodson Bay Roscommon 61 both 40 A 5 112 Gate - Gate 2001 432500
Birr Offaly 62 both 30 C 15 9 087 Gate - Gate 2001 94700
Loughrea (W) Galway 66 single entry 30 I 1 3 -052 Gate - N6 Jcn 1999 1999 55400
Ballylickey Cork 71 both 40 I 1 2 -037 Gate - Gate 1997 228500
Bantry (N) Cork 71 half 30 E 5 5 -027 Gate - Centre 2002 115600
Clonakilty Cork 71 both 30 C 4 1 059 Gate - Gate 1999 331600
Grangemockler South Tipperary 76 both 30 I 2 042 Gate - Gate 1998 1998 2003 51900
Kilkenny (N) Kilkenny 77 single entry 30 E 6 8 -068 Gate - Centre 2001 195200
Newtown Laois 78 both 40 A 5 1 073 Gate - Gate 2002 181400
Killeigh Offaly 80 both 30 B 000 Gate - Gate 1999 1999 97400
Kilmaine (N) Mayo 84 half 30 B 1 019 Gate - R332 Jcn 1998 99800
Swanlinbar (S) Cavan 87 half 30 E 1 1 -005 Gate - Centre 2002 39900
B4
Appendix C
Evaluation of Traffic Calming Schemes Implemented 1997 ndash 2002 APPENDIX C Collision Data Cost Data and First Year Rate of Return for All Sites
Location Rte Yr Construction Cost
4 Years Before 4 Years After Drop in Annual Collisions adjusted Cost Saving from Drop in Collision
Yearly Rate of Return
F S M Tot F S M Tot F S M Tot F S M Tot
Carrickarnon 1 01 109400 3 1 11 15 1 1 8 10 046 -009 042 079 1047600 -27300 12600 1032900 944
Greengates 1 97 489900 2 1 5 8 0 0 2 2 043 013 074 130 969700 40900 22200 1032800 211
KilsaranCastlebellingham 1 97 255600 1 5 17 23 1 0 9 10 -004 067 197 260 -85200 204700 59000 178500 70
Julianstown 1 99 767700 0 3 10 13 1 1 8 10 -025 017 032 024 -570000 53300 9500 -507200 -66
Emyvale 2 01 46500 0 0 5 5 0 2 5 7 000 -050 -015 -065 0 -152300 -4500 -156800 -337
Castleblaney (N) 2 00 132300 0 2 1 3 0 2 3 5 000 -021 -052 -073 0 -62800 -15600 -78400 -59
Carrickmacross (N) 2 98 92500 0 5 2 7 0 0 4 4 000 062 -054 008 0 188700 -16100 172600 187
Ardee (S) 2 97 238300 1 2 1 4 1 4 4 9 -004 -073 -075 -152 -85200 -222700 -22600 -330500 -139
Collon 2 97 251600 0 1 5 6 0 3 4 7 000 -062 024 -038 0 -187500 7200 -180300 -72
Slane 2 02 534500 3 2 3 8 0 0 5 5 077 036 -065 048 1761000 109400 -19400 1851000 346
Kells 3 01 730900 0 0 8 8 1 1 6 8 -025 -025 026 -024 -570000 -76200 7800 -638400 -87
Castlebaldwin 4 99 547500 1 0 4 5 0 0 2 2 020 000 043 062 451800 0 12800 464600 85
Dromod 4 00 418300 0 0 1 1 0 2 1 3 000 -050 -002 -052 0 -152300 -600 -152900 -37
Roosky (E) 4 98 123300 0 0 0 0 0 0 1 1 000 000 -025 -025 0 0 -7500 -7500 -6
Newtownforbes (E) 4 01 73800 0 0 1 1 0 0 2 2 000 000 -028 -028 0 0 -8400 -8400 -11
Rathowen 4 99 369400 0 0 1 1 0 1 0 1 000 -025 023 -002 0 -76200 6900 -69300 -19
Clonard (E) 4 97 53200 0 0 1 1 0 0 1 1 000 000 -000 -000 0 0 -100 -100 -0
Enfield 4 99 73900 1 2 5 8 0 0 2 2 020 028 066 114 451800 86300 19700 557800 755
CharlestownBellahy (WN) 5 99 523400 1 3 3 7 0 0 0 0 020 042 069 132 451800 129400 20800 602000 115
Frenchpark 5 01 133600 2 1 2 5 0 1 2 3 047 -009 -006 032 1078400 -27300 -1800 1049300 785
Craughwell 6 00 30600 1 0 5 6 0 0 6 6 020 000 -035 -015 454600 0 -10400 444200 1452
Rochfordbridge 6 98 199600 0 0 7 7 0 0 5 5 000 000 037 037 0 0 11200 11200 6
Miltownpass 6 00 248000 0 0 1 1 0 0 1 1 000 000 -002 -002 0 0 -600 -600 -0
Moneygall 7 01 410900 0 0 2 2 0 2 2 4 000 -050 -006 -056 0 -152300 -1800 -154100 -38
C1
Appendix C Evaluation of Traffic Calming Schemes Implemented 1997 ndash 2002
Location Rte Yr Construction Cost
4 Years Before 4 Years After Drop in Annual Collisions adjusted Cost Saving from Drop in Collision
Yearly Rate of Return
F S M Tot F S M Tot F S M Tot F S M Tot
Ballybrittas 7 02 197900 0 0 5 5 0 0 3 3 000 000 025 025 0 0 7600 7600 4
Monasterevin (W) 7 98 29900 1 0 3 4 0 0 1 1 019 000 045 064 434000 0 13400 447400 1496
Cullahill 8 00 134200 0 0 1 1 1 0 1 2 -025 000 -002 -027 -570000 0 -600 -570600 -425
Abbeyleix (S) 8 00 330700 0 0 1 1 0 1 3 4 000 -025 -052 -077 0 -76200 -15600 -91800 -28
Mullinavat (N) 9 01 96600 0 0 6 6 0 0 3 3 000 000 057 057 0 0 17100 17100 18
Dungarvan 9 01 212700 0 0 1 1 0 0 2 2 000 000 -028 -028 0 0 -8400 -8400 -4
Paulstown 9 99 184700 0 0 2 2 0 0 0 0 000 000 046 046 0 0 13900 13900 8
Kilkenny (E) 10 01 195200 0 2 8 10 0 1 2 3 000 007 126 133 0 21600 37800 59400 30
Claragh 10 99 206500 1 1 0 2 0 0 2 2 020 014 -050 -016 451800 43100 -15000 479900 232
Camolin 11 02 581000 0 1 4 5 0 0 1 1 000 018 055 073 0 54700 16600 71300 12
Ashford 11 99 92300 0 4 12 16 0 1 6 7 000 032 128 160 0 96400 38400 134800 146
Lifford (N amp W) 14 01 70400 0 0 10 10 0 0 5 5 000 000 095 095 0 0 28500 28500 40
Castlefinn 15 01 127500 0 0 4 4 0 0 1 1 000 000 063 063 0 0 18900 18900 15
Killygordon 15 02 113300 1 0 1 2 0 0 2 2 026 000 -030 -004 587000 0 -9000 578000 510
Ballybofey (S) 15 02 246400 0 1 8 9 0 1 5 6 000 -007 036 029 0 -21500 10700 -10800 -4
Ballyshannon (S) 15 97 159700 2 2 3 7 0 1 5 6 043 002 -051 -006 969700 5700 -15200 960200 601
Bundoran 15 97 41900 0 1 8 9 0 4 11 15 000 -087 -077 -163 0 -263700 -23000 -286700 -684
Cliffony 15 01 143800 0 0 2 2 0 1 0 1 000 -025 044 019 0 -76200 13200 -63000 -44
Grange 15 00 172500 0 1 8 9 1 0 1 2 -025 015 159 149 -570000 44800 47800 -477400 -277
Drumcliffe 15 00 259100 1 0 6 7 1 1 3 5 -005 -025 063 033 -115400 -76200 19000 -172600 -67
Ballindine 17 97 106500 1 1 1 3 0 2 4 6 021 -037 -075 -091 484800 -111400 -22600 350800 329
Claregalway 17 98 328300 0 1 2 3 0 2 5 7 000 -038 -079 -116 0 -114600 -23600 -138200 -42
Kilcolgan 18 99 46200 0 3 5 8 0 1 7 8 000 017 -059 -042 0 53300 -17800 35500 77
Ardrahan 18 99 46200 0 2 4 6 0 0 1 1 000 028 068 096 0 86300 20300 106600 231
Crusheen (N) 18 98 251400 0 0 0 0 0 1 0 1 000 -025 000 -025 0 -76200 0 -76200 -30
Barefield (N) 18 98 251400 0 0 2 2 0 1 0 1 000 -025 046 021 0 -76200 13900 -62300 -25
Charleville (S) 20 01 165400 0 0 2 2 0 1 1 2 000 -025 019 -006 0 -76200 5700 -70500 -43
C2
Appendix C Evaluation of Traffic Calming Schemes Implemented 1997 ndash 2002
Location Rte Yr Construction Cost
4 Years Before 4 Years After Drop in Annual Collisions adjusted Cost Saving from Drop in Collision
Yearly Rate of Return
F S M Tot F S M Tot F S M Tot F S M Tot
Ballyhea 20 99 784900 0 0 0 0 0 0 1 1 000 000 -025 -025 0 0 -7500 -7500 -1
Newtwopothouse 20 01 165400 1 1 2 4 0 0 0 0 024 016 044 084 539200 48900 13200 601300 364
Cork (N) 20 02 239700 0 0 1 1 0 0 2 2 000 000 -030 -030 0 0 -9000 -9000 -4
Farranfore 22 98 20000 0 0 4 4 0 0 5 5 000 000 -032 -032 0 0 -9700 -9700 -49
Killarney (E) 22 98 59900 1 2 5 8 1 0 2 3 -006 025 066 085 -136000 75500 19800 -40700 -68
Ballyvourney 22 02 570300 0 0 3 3 2 0 4 6 -050 000 -040 -090 -1140000 0 -11900 -1151900 -202
Lissarda 22 02 333900 0 1 3 4 0 1 3 4 000 -007 -015 -022 0 -21500 -4400 -25900 -8
Ballincollig (W) 22 97 496300 2 0 8 10 1 0 7 8 018 000 023 041 399700 0 7000 406700 82
Cork (W) 22 99 193900 0 0 0 0 0 0 0 0 000 000 000 000 0 0 0 0 0
Monard 24 98 39300 0 0 0 0 0 0 1 1 000 000 -025 -025 0 0 -7500 -7500 -19
Bansha 24 01 138400 1 0 1 2 0 1 1 2 024 -025 -003 -004 539200 -76200 -900 462100 334
Kilsheelan 24 99 194500 1 0 1 2 0 0 0 0 020 000 023 043 451800 0 6900 458700 236
Carrick-on-Suir (W) 24 01 211900 0 0 3 3 0 0 0 0 000 000 066 066 0 0 19800 19800 9
Mooncoin 24 98 140000 1 0 4 5 1 1 6 8 -006 -025 -057 -088 -136000 -76200 -17200 -229400 -164
Lemybrien 25 98 165700 0 0 1 1 0 1 0 1 000 -025 023 -002 0 -76200 7000 -69200 -42
Waterford (E) 25 97 63900 1 1 3 5 0 0 1 1 021 013 049 084 484800 40900 14800 540500 846
Ballinaboola 25 99 554100 0 2 1 3 0 1 2 3 000 003 -027 -024 0 10100 -8100 2000 0
Barntown 25 97 639000 0 1 0 1 0 0 2 2 000 013 -050 -037 0 40900 -15000 25900 4
Kilrane (W) 25 99 300400 0 2 2 4 0 2 2 4 000 -022 -004 -025 0 -66000 -1100 -67100 -22
Rosslare Harbour (W) 25 01 16000 0 0 0 0 0 0 0 0 000 000 000 000 0 0 0 0 0
Foxford 26 01 33300 0 4 2 6 0 0 1 1 000 064 019 083 0 195400 5700 201100 604
Clonroche 30 01 20400 2 1 1 4 1 0 1 2 022 016 -003 035 508400 48900 -900 556400 2727
New Ross (N) 30 02 47500 0 0 2 2 0 1 3 4 000 -025 -035 -060 0 -76200 -10500 -86700 -183
Smithborough (W) 54 01 56900 0 0 2 2 0 0 1 1 000 000 019 019 0 0 5700 5700 10
Carrickboy 55 02 57100 0 1 1 2 0 1 2 3 000 -007 -030 -037 0 -21500 -9000 -30500 -53
Gortahork 56 02 45500 0 0 1 1 1 0 4 5 -025 000 -080 -105 -570000 0 -24000 -594000 -1305
Dromore West 59 00 156200 0 1 3 4 0 0 0 0 000 015 069 084 0 44800 20700 65500 42
C3
Appendix C Evaluation of Traffic Calming Schemes Implemented 1997 ndash 2002
Location Rte Yr Construction Cost
4 Years Before 4 Years After Drop in Annual Collisions adjusted Cost Saving from Drop in Collision
Yearly Rate of Return
F S M Tot F S M Tot F S M Tot F S M Tot
Ballisodare 59 02 142700 0 0 0 0 0 0 0 0 000 000 000 000 0 0 0 0 0
Hodson Bay 61 01 432500 1 0 4 5 0 0 0 0 024 000 088 112 539200 0 26400 565600 131
Birr 62 01 94700 0 3 12 15 0 1 8 9 000 023 064 087 0 70400 19200 89600 95
Loughrea (W) 66 99 55400 0 0 1 1 0 1 2 3 000 -025 -027 -052 0 -76200 -8100 -84300 -152
Ballylickey 71 97 228500 0 1 0 1 0 1 1 2 000 -012 -025 -037 0 -35200 -7500 -42700 -19
Bantry (N) 71 02 115600 0 1 4 5 0 0 5 5 000 018 -045 -027 0 54700 -13400 41300 36
Clonakilty 71 99 331600 0 1 3 4 0 0 1 1 000 014 044 059 0 43100 13300 56400 17
Grangemockler 76 98 51900 1 0 1 2 0 0 0 0 019 000 023 042 434000 0 7000 441000 850
Kilkenny (N) 77 01 195200 0 0 6 6 0 0 8 8 000 000 -068 -068 0 0 -20400 -20400 -10
Newtown 78 02 181400 0 1 4 5 0 1 0 1 000 -007 080 073 0 -21500 24100 2600 1
Killeigh 80 99 97400 0 0 0 0 0 0 0 0 000 000 000 000 0 0 0 0 0
Kilmaine (N) 84 98 99800 1 0 0 1 0 0 0 0 019 000 000 019 434000 0 0 434000 435
Swanlinbar (S) 87 02 39900 0 0 1 1 0 0 1 1 000 000 -005 -005 0 0 -1500 -1500 -4
19457200 36 72 300 408 15 52 235 302 411 -249 920 1082 9376400 -759100 276100 8892000 46
C4
9
Evaluation of Traffic Calming Schemes Implemented 1997 ndash 2002Appendix B