trade performance and competitiveness: selected issues relevant for asian developing economies
TRANSCRIPT

8/11/2019 Trade performance and competitiveness: Selected issues relevant for Asian developing economies
http://slidepdf.com/reader/full/trade-performance-and-competitiveness-selected-issues-relevant-for-asian-developing 1/215
ARTNeT
TRADE PERFORMANCE AND COMPETITIVENESS:SELECTED ISSUES RELEVANT FOR
ASIAN DEVELOPING ECONOMIES
A study by the Asia-Pacific Research and Training Network on Trade

8/11/2019 Trade performance and competitiveness: Selected issues relevant for Asian developing economies
http://slidepdf.com/reader/full/trade-performance-and-competitiveness-selected-issues-relevant-for-asian-developing 2/215
The secretariat of the ESCAP is the regional development arm of the United Nations and
serves as the main economic and social development centre of the United Nations in Asia
and the Pacific. Its mandate is to foster cooperation between its 53 members and
9 associate members. It provides the strategic link between global and country-level
programmes and issues. It supports governments of countries in the region in consolidatingregional positions and advocates regional approaches to meeting the region’s unique
socio-economic challenges in a globalizing world. The ESCAP secretariat is located in
Bangkok, Thailand. Please visit the ESCAP website at www.unescap.org for further
information.
Asia-Pacific Research and Training Network on Trade (ARTNeT) is an open regional
network of research and academic institutions specializing in international trade policy and
facilitation issues. Network members currently include over 40 leading national trade
research and academic institutions from 23 developing countries from East, South, and
Southeast Asia and the Pacific. IDRC, UNCTAD, UNDP, ESCAP and the WTO, as core
network partners, provide substantive and/or financial support to the network. The Trade
and Investment Division of ESCAP, the regional branch of the United Nations for Asia andthe Pacific, provides the Secretariat of the network and a direct regional link to trade
policymakers and other international organizations. For more information, please contact
the ARTNeT Secretariat at [email protected] or visit artnet.unescap.org.
The shaded areas of the map are ESCAP members and associate members.
ARTNeT

8/11/2019 Trade performance and competitiveness: Selected issues relevant for Asian developing economies
http://slidepdf.com/reader/full/trade-performance-and-competitiveness-selected-issues-relevant-for-asian-developing 3/215
ARTNeT
Trade performance andcompetitiveness: Selected
issues relevant for Asian
developing economies

8/11/2019 Trade performance and competitiveness: Selected issues relevant for Asian developing economies
http://slidepdf.com/reader/full/trade-performance-and-competitiveness-selected-issues-relevant-for-asian-developing 4/215
TRADE PERFORMANCE AND COMPETITIVENESS:
SELECTED ISSUES RELEVANT FOR ASIAN DEVELOPING
ECONOMIES
A STUDY OF THE ASIA-PACIFIC RESEARCH AND TRAINING NETWORK ON TRADE
United Nations publication
Sales No. E.14.II.F.3
Copyright @ United Nations 2013
All rights reserved
Manufactured in Thailand
ISBN: 978-92-1-120673-9
eISBN: 978-92-1-056600-1
ST/ESCAP/2686
Reference to dollars ($) are to United Stated dollars unless otherwise stated.
Disclaimer
The designations employed and the presentation of the material in this publication do notimply the expression of any opinion whatsoever on the part if the Secretariat of the United
Nations concerning the legal status of any country, territory, city or area of its authorities, or
concerning the delimitation of its frontiers or boundaries.
The opinions, figures and estimates set forth in this publication are the responsibility of the
authors and should not necessarily be considered as reflecting the views or carrying the
endorsement of the United Nations.
Mention of firm names and commercial products does not imply the endorsement of the
United Nations.
All material in this publication may be freely quoted or reprinted, but acknowledgment is
required, together with a copy of the publication containing the quotation or reprint.
The use of this publication for any commercial purpose, including resale, is prohibited
unless permission is first obtained from the secretary of the Publication Board, United
Nations, New York.
Request for permission should state the purpose and the extent of the reproduction.
This publication has been issued without formal editing.

8/11/2019 Trade performance and competitiveness: Selected issues relevant for Asian developing economies
http://slidepdf.com/reader/full/trade-performance-and-competitiveness-selected-issues-relevant-for-asian-developing 5/215
iii
Foreword
This volume comprises four selected research essays on different aspects of trade
and industry issues in the Asian region.1 They are written by researchers in Asian
countries, brought together by the Asia-Pacific Research and Training Network on Trade(ARTNeT) which from April 2011 until September 2013 has implemented its Phase III under
the topic of “Drivers of Competitiveness and Strategies for Economic Diversification for
Developing Countries – Building Policy Making Capacity in Asia and the Pacific”. The latest
phase of ARTNeT reflects the diversity and breadth of research interests, as well as the
depth of research talent, available in the region and harnesses these assets in addressing
the major development policy issues facing developing Asian countries. Since its
establishment ARTNeT has focused the efforts of the network on ensuring that research
institutions of the Asia-Pacific region, particularly those in least developed countries,
provide more relevant and higher-quality applied research and policy recommendations topolicymakers. ARTNeT and its members and associates have endeavored to produce high
quality and relevant studies on trade issues on the basis of a demand-driven research
programme, to improve the communication and dissemination of research study results of
research institutions to policymakers; and to increase the capacity of research institutions in
the region, especially in the least developed countries. All of this has been done with the
aim of making trade and investment related research more useful and accessible to
policymakers who are thus better informed and able to design and prepare for
implementation of coherent trade and investment related policies for inclusive development.
With the success of the previous phases ARTNeT has evolved to be one of the
leading networks of researchers, analysts and policymakers in the region. Its acceptance
as an active and unique network seems fully justified when viewed from its membership
which is cohesive, professionally credible and mutually supportive. The growth and
extensive outputs of the network in itself speaks volumes about the relevance of the
network and the demand for its quality outputs. The interest in the capacity building and
training conducted by ARTNeT has grown at a similar pace and it testifies to the strong
need for organizations like ARTNeT to continue addressing gaps in capacity within the
Asia-Pacific.
The studies in this volume and other research produced under the ARTNeT
Phase III Research programme (available through ARTNeT’s website) are produced with
the aim of addressing these explicit and implicit demands of the Asia-Pacific countries and
to fill in the gaps in capacity and knowledge. The studies are of significance and interest to
researchers and policy analysts alongside policymakers. This is primarily because they
look at previously unexplored issues using new and innovative analytical and
methodological approaches, which can be drawn on to conduct similar studies in the
region. We hope that these will stimulate further work on these important issues.
1 The volume carries only several of the studies that were conducted under this programme phase reflecting
the efforts towards reducing the volume of printed publications and a gradual shift to online release only. The
other studies undertaken under this phase are available in electronic copies.

8/11/2019 Trade performance and competitiveness: Selected issues relevant for Asian developing economies
http://slidepdf.com/reader/full/trade-performance-and-competitiveness-selected-issues-relevant-for-asian-developing 6/215
iv
Acknowledgments
The authors of the studies and the ARTNeT secretariat received invaluable
research guidance, constructive comments and suggestions from advisor to this project
Professor Sisira Jayasuriya, Monash University, Australia, and other experts whom theauthors have acknowledged for specific studies. The project was coordinated by Dr. Mia
Mikic, Chief, Trade Policy and Analysis Section, ESCAP under the general guidance of
Dr. Ravi Ratnayake, Director, Trade and Investment Division, ESCAP. The authors have
also had the opportunity to discuss their methodology and preliminary findings during the
ARTNeT conference on “Empirical and policy issues of integration in Asia and the Pacific”
on 1 to 2 November 2012 held in Colombo, Sri Lanka, in which the discussants, Mr. Denis
Hew, Mr. Jason Lao, Mr. Sarath Rajapatirana, Dr. Nagesh Kumar and other participants
provided very useful comments and suggestions. Notwithstanding this, any remaining
errors and omissions in this publication should be attributed to the authors only and not tothe advisors and benevolent commentators. There are many other people that needed to
be thanked, without implicating them in the views expressed in this volume, for assisting
through the process, since the design of ARTNeT Phase III until preparation of these
selected studies for the publication. These include Ms. Melanie Ramjoue who contributed
to the formulation of the Phase III programme and Mr. Adam Heal who has coordinated the
preparation of the book for print. The studies in the book were edited by Ms. Nicole Colmar
and other research under the programme by Mr. Robert Oliver both of whom should
be thanked for more uniform style of the material presented but should not be blamed
for the content remaining. Ms. Panjai Limchupong, Ms. Tavitra Ruyaphorn andMs. Chaveemon Sukpaibool have all contributed in different but important ways towards
the fruition of the project. Mr. Teemu Alexander Puutio has provided technical support to the
ARTNeT Secretariat and also, with Yisi Chen, the idea for the cover page of the book. The
International Development Research Centre’s support since the establishment of ARTNeT
and during this phase is gratefully acknowledged. This support proved to have been the
factor that made an important difference in the effectiveness of research capacity-building
in the trade and trade-related areas under ARTNeT since 2004. This, combined with
a significant substantive contribution from the ESCAP secretariat as well as a technical
support in the implementation of the projects, have been instrumental in the growingpresence of ARTNeT in the region.

8/11/2019 Trade performance and competitiveness: Selected issues relevant for Asian developing economies
http://slidepdf.com/reader/full/trade-performance-and-competitiveness-selected-issues-relevant-for-asian-developing 7/215
v
Contents
Page
Foreword ................................................................................................................ iii
Acknowledgments ................................................................................................ iv
List of contributors ............................................................................................... xi
Acronyms and Abbreviations .............................................................................. xiii
Overview ................................................................................................................ xv
I. Structural transformation and trade policy: Case of Nepal .................... 1
Paras Kharel
A. Review of literature on structural transformation .................................... 2
B. Nepal’s economic and export performance: A preliminary analysis ....... 9
C. Structural change and productivity growth in Nepal’s economy ............. 19
D. Nepal’s trade and industrial policies in the context of structural
transformation ........................................................................................ 24
E. Methodology for assessing structural transformation through the
“export” lens ........................................................................................... 30
F. Analysis of export baskets and identified products ................................ 34
G. Analysis of targeted products ................................................................. 45
H. Discussion .............................................................................................. 57
Conclusion ..................................................................................................... 66
References .................................................................................................... 69
Appendix ....................................................................................................... 73
II. Logistics performance and trade: An analysis of India’s trade inintermediates with Bangladesh and Thailand .......................................... 91
Prabir De and Amrita Saha
A. Logistics services and production networks: Literature review .............. 92
B. Data and methodology ........................................................................... 95
C. India’s trade with Bangladesh and Thailand........................................... 97
D. Measuring logistics performance ........................................................... 103
E. Does improvement in logistical services lead to higher trade inintermediate goods? ............................................................................... 106
Summary and implications ............................................................................ 112

8/11/2019 Trade performance and competitiveness: Selected issues relevant for Asian developing economies
http://slidepdf.com/reader/full/trade-performance-and-competitiveness-selected-issues-relevant-for-asian-developing 8/215
vi
References .................................................................................................... 114
Appendix ....................................................................................................... 117
III. An analysis of export performance of manufacturing and service
sector enterprises in Sri Lanka .................................................................. 131
JeevikaWeerahewa, Sarath S. Kodithuwakku and Rifana Buhary
A. A model to assess determinants of export performance ........................ 132
B. Data description ..................................................................................... 133
C. Characterization of exporting firms versus non exporting firms ............. 134
D. Results of the estimation of Heckman model ......................................... 139
Conclusions and policy implications .............................................................. 142
References .................................................................................................... 143
Appendix ....................................................................................................... 145
IV. Evaluation of business association membership on small and
medium enterprises’ growth performance: Evidence from enterprisesurvey of Cambodia .................................................................................... 147
Vathana Roth
A. Literature review and theoretical aspects ............................................... 149
B. Econometric specifications and variables measurement ....................... 152
C. Data source and descriptive statistics .................................................... 156
D. Regression results and discussion ......................................................... 158
E. Limitations .............................................................................................. 162
Conclusion and areas for future research ..................................................... 162
Annex ............................................................................................................ 164
References .................................................................................................... 188
Contents (continued)
Page
8/11/2019 Trade performance and competitiveness: Selected issues relevant for Asian developing economies
http://slidepdf.com/reader/full/trade-performance-and-competitiveness-selected-issues-relevant-for-asian-developing 9/215
vii
List of Tables
Chapter I
Table 1. Nepal in comparative perspective: Trade performance .......................... 13
Table 2. Decomposition of Nepal’s labour productivity growth during 1999-2008 20
Table 3. Sectoral employment, value added shares and their change, and
productivity level and growth (Nepal) ..................................................... 22
Table 4. Products identified in Trade Policy 2009 ................................................ 25
Table 5. Priority export potential products/sectors identified by Nepal TradeIntegration Strategy 2010 ....................................................................... 26
Table 6. Features of export basket in 2010.......................................................... 40
Table 7. Top 10 nearby products, ordered by Strategic Value ............................. 41
Table 8. Top 10 middle-distance products, ordered by Strategic Value ............... 42
Table 9. Top 10 faraway products, ordered by Strategic Value............................ 43
Table 10. Products in Open Forest according to Leamer classification ................. 44
Table 11. Summary features of NTIS-identified products ...................................... 46
Table 12. Summary statistics of PRODY, Path and Strategic Value of across
groups .................................................................................................... 48
Table 13. NTIS products that lie in the Open Forest .............................................. 49
Table 14. Comparison of NTIS products with export basket and Open Forest ...... 50
Table 15. Summary statistics of Trade Policy identified products .......................... 51
Table 16. Summary features of Trade Policy identified products ........................... 51
Table 17. Distribution of Trade Policy identified products across path terciles ...... 53
Table 18. Number of products exceeding median values of comparator groups ... 54
Table 19. Trade Policy products that lie in the Open Forest .................................. 55
Table 20. Features of “other” NTIS products ......................................................... 56
Table 21. Processed vs. non-processed agricultural products .............................. 63
Chapter II
Table 1. India’s imports of ACE from Thailand and export of yarn toBangladesh: 2000-2010 ......................................................................... 98
Table 2. Intra-Industry trade index (2007): Common set of products at 6-digit HS 100
Contents (continued)
Page

8/11/2019 Trade performance and competitiveness: Selected issues relevant for Asian developing economies
http://slidepdf.com/reader/full/trade-performance-and-competitiveness-selected-issues-relevant-for-asian-developing 10/215
viii
Table 3. IIT in textile and clothing sector, 2010 (Exporter – India, Importer –
Bangladesh) ........................................................................................... 100
Table 4. IIT in air conditioning equipment (Importer – India, Exporter – Thailand) 101
Table 5. Vertical trade potential between India and Bangladesh ......................... 102
Table 6. Vertical trade potential between India and Thailand .............................. 103
Table 7. LPI scores and ranks ............................................................................. 104
Table 8. Baseline regression (OLS): Fixed effect model ...................................... 106
Table 9. Arellano-Bover dynamic panel-data estimation (System GMM) ............ 108
Table 10. Im, Pesaran and Shin (IPS) panel unit root test (Period: 2000-2010) .... 109
Table 11(a). India’s exports of yarn to Bangladesh: Westerlund panel
co-integration test (Period: 2000-2010) ............................................. 110
Table 11(b). India’s exports of yarn to Bangladesh: Westerlund panel
co-integration test (Period: 2000-2010) ............................................. 111
Table 12. Panel Granger causality test between trade and LPI ............................. 112
Chapter III
Table 1. Heterogeneity of firms by size ................................................................ 136
Table 2. Heterogeneity of firms by industry .......................................................... 136
Table 3. Export propensity, intensity by industry and province ............................ 137
Table 4. Descriptive statistics of variables used in the Heckman estimation ....... 139
Table 5. Results of the Heckman Model estimation ............................................. 141
Chapter IV
Table 1. Classification of enterprises in Cambodia .............................................. 164
Table 2. Distribution of participating and non-participating groups by firm size
and sub-sector ....................................................................................... 164
Table 3. Number of establishments as exporter .................................................. 165
Table 4. Membership in business association or chamber of commerce by
firm’s characteristics ............................................................................... 166
Table 5. Firm’s characteristics and performance ................................................. 168
Table 6. Perceived important services members expect from BA or CoC ........... 171
Table 7. Firm’s years of experience since establishment and performance ........ 171
Contents (continued)
Page

8/11/2019 Trade performance and competitiveness: Selected issues relevant for Asian developing economies
http://slidepdf.com/reader/full/trade-performance-and-competitiveness-selected-issues-relevant-for-asian-developing 11/215
ix
Table 8. Descriptive statistics of main outcome and indicator variables for all
firms ....................................................................................................... 172
Table 9. Descriptive statistics of main outcome and indicator variables for SMEs 174
Table 10. Logit regression to estimate propensity score of membership
participation conditional on observed and selected coveriates .............. 176
Table 11. PSM estimation results of memberships in business associations or
chambers of commerce (pooled) ........................................................... 181
Table 12. PSM estimation results of memberships in business associations or
chambers of commerce (SMEs) ............................................................. 182Table 13. OLS estimation results of memberships in business associations or
chambers of commerce .......................................................................... 183
Table 14. PSM & OLS estimation results of memberships in business
associations or chambers of commerce................................................. 184
List of Figures
Chapter I
Figure 1. The product space ............................................................................... 4
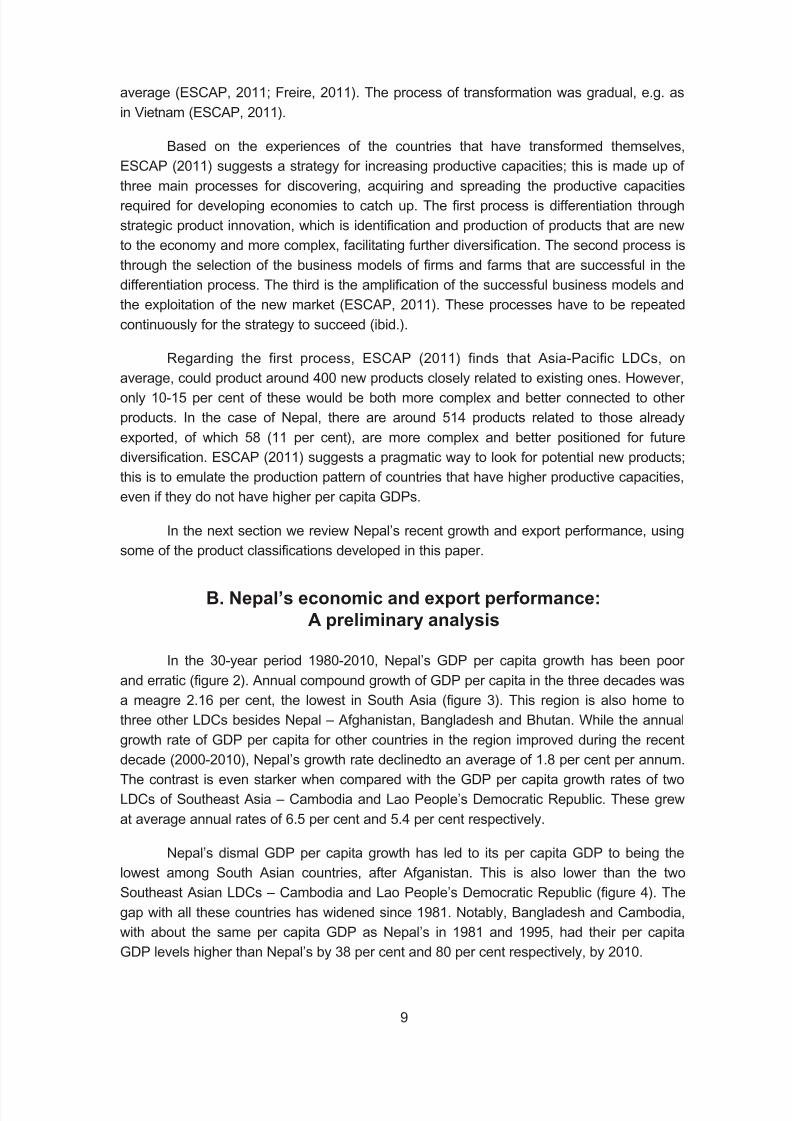
Figure 2. Nepal per capita GDP growth performance ......................................... 10
Figure 3. Nepal in comparative perspective: Growth of GDP per capita............. 10
Figure 4. Nepal in comparative perspective: Manufacturing, value added
(per cent of GDP), 2009 ....................................................................... 11
Figure 5. Share of manufacturing in Nepal’s GDP over time .............................. 12
Figure 6. Nepal’s trade performance................................................................... 12
Figure 7. Nepal’s exports of goods and services ................................................ 13
Figure 8. Nepal’s export composition (in terms SITC 1-digit categories) ............ 14
Figure 9. Nepal’s export composition in terms of Leamer categories ................. 15
Figure 10. Comparative export composition – Leamer categories 2010 .............. 17
Figure 11. Major exports ....................................................................................... 17
Figure 12. Nepal’s export composition – Lall classification ................................... 18
Figure 13. Nepal in comparative perspective: Export composition – Lall
classification, 2010 .............................................................................. 19
Contents (continued)
Page

8/11/2019 Trade performance and competitiveness: Selected issues relevant for Asian developing economies
http://slidepdf.com/reader/full/trade-performance-and-competitiveness-selected-issues-relevant-for-asian-developing 12/215
x
Figure 14. Correlation between sectoral productivity and change in employment
shares in Nepal (1999-2008) ............................................................... 21
Figure 15. Evolution of EXPY ............................................................................... 35
Figure 16. Nepal in comparative perspective: Export sophistication 2010 ........... 36
Figure 17. Nepal’s export sophistication ............................................................... 37
Figure 18. Nepal in comparative perspective: Export sophistication 2010 ........... 37
Figure 19. Strategic Value against density of unexploited products, 2010............ 44
Figure 20. Sophistication and connectivity of NTIS-identified products ................ 47
Figure 21. Sophistication and connectivity of Trade Policy products .................... 53
Chapter II
Figure 1. Production blocks and logistics service links ....................................... 94
Figure 2. Trends in trade shares: India’s export of yarn to Bangladesh and
import of ACE from Thailand ................................................................ 98
Chapter III
Figure 1(a). Exporters vs non-exporters by size ..................................................... 135
Figure 1(b). Exporters vs non-exporters by province .............................................. 135
Figure 1(c). Exporters vs non-exporters by industry ............................................... 135
Figure 2(a).Kernal density of log sale ..................................................................... 135
Figure 2(b). Kernal density of log labour productivity .............................................. 135
Figure 2(c). Kernal density of log wage .................................................................. 135
Figure 3. Export concentration by value of exports and total sales .................... 138
Contents (continued)
Page

8/11/2019 Trade performance and competitiveness: Selected issues relevant for Asian developing economies
http://slidepdf.com/reader/full/trade-performance-and-competitiveness-selected-issues-relevant-for-asian-developing 13/215
xi
List of contributors
Rifana Buhary is staff at the Department of Agricultural Economics and Business
Management, Faculty of Agriculture, University of Peradeniya, Sri Lanka.
Prabir De is a Senior Fellow at the Research and Information System for Developing
Countries (RIS). De works in the field of international economics and has research interests
in international trade and development. He was a visiting research scholar of the Asian
Development Bank Institute (ADBI), Tokyo; Korea Institute of International Economic Policy
(KIEP), Seoul; and United Nations Economic and Social Commission for Asia and the
Pacific (ESCAP), Bangkok. He is also a visiting faculty member of the Institute of Foreign
Policy Studies (IFPS), Calcutta University, Kolkata, where he has been teaching trade and
regional cooperation. He has been conducting policy research for the Government of India
and several international organizations. De has a Ph.D. in Economics from the Jadavpur University, Calcutta. He has contributed several research papers in international journals
and written books on trade and development. He is the managing editor of South Asia
Economic Journal, published by Sage, and edits a policy brief series, called Mekong –
Ganga Policy Brief. e-mail: [email protected]
Sisira Jayasuriya is a Professor of Economics in the Department of Economics, Monash
University, Melbourne, Australia and an Adjunct Professor at the Arndt-Corden Department
of Economics at the Australian National University, Canberra, Australia. He has held
previous appointments at the Australian National University, La Trobe University, University
of Melbourne and the International Rice Research Institute, Philippines. Hisresearch
interests are in policy-oriented development economics, and he has published extensively
on trade, macroeconomics, resource and environmental issues of developing countries,
with a primary focus on Asia. He has been a consultant to World Bank, Asian Development
Bank, International Food Policy Research Institute, Food and Agriculture Organization
(FAO) and several other UN agencies), and to government agencies in both Australia and
overseas. e-mail: [email protected]
Paras Kharel is a trade economist. His research interests include trade costs, trade
facilitation including transit issues, competitiveness, aid for trade, trade and climate change
linkages, trade and transit issues related to least developed countries (LDCs) and
landlocked developing countries (LLDCs) and services trade. He has worked as
programme officer and senior programme officer at South Asia Watch on Trade, Economics
& Environment (SAWTEE) since 2007. e-mail: [email protected]
Sarath S. Kodithuwakku has obtained his BS in agriculture with specialization in
agricultural economics from the University of Peradeniya, Sri Lanka in 1990. He obtained
his Masters of Business Administration in Marketing and Ph.D. in entrepreneurship from the
University of Stirling, United Kingdom in 1993 and 1997, respectively. He currently servesas a Professor in the University of Peradeniya. He founded the MBA programme offered by
the University of Peradeniya and he has been the Coordinator of the programme since its
inception in 1998, in addition to serving as the Chairman of the Board of Study in Business
8/11/2019 Trade performance and competitiveness: Selected issues relevant for Asian developing economies
http://slidepdf.com/reader/full/trade-performance-and-competitiveness-selected-issues-relevant-for-asian-developing 14/215
xii
Administration, PGIA since its inception in 2002. He was also the Director of the
Agribusiness Centre, the outreach arm of the Faculty of Agriculture, since its inception until
September 2011. At national level, he has been serving as the Senior Vice President of the
Sri Lanka Institute of Management, the premier professional body for Sri Lankan
management professionals since 2003 and as a member of Board of Study of the Sri LankaInstitute of Marketing, the premier professional body for Sri Lankan marketing professionals
since 2002. e-mail: [email protected]
Amrita Saha is a Ph.D. student working on issues in international trade and trade policy.
Her research is funded by the Commonwealth Scholarship Commission, United Kingdom.
Prior to joining the research programme at Sussex, she has worked with the Foreign Trade
Division at Ministry of Commerce, India. She has also pursued several research projects in
India, under the MacArthur fellowship at the Indian Council for Research in International
Economic Relations (ICRIER) New Delhi, the Sir Ratan Tata Fellowship at the Institute for
Social and Economic Change (ISEC) Bangalore, at the Reserve Bank of India (RBI)
Bangalore and the National Council for Applied Economic Research (NCAER) New Delhi.
She has completed Bachelors (Honours) in Economics from Delhi University, India and
Master Degree in Economics from the University of Hyderabad, India.
Jeevika Weerahewa is a Professor at the Department of Agricultural Economics and
Business Management, Faculty of Agriculture, University of Peradeniya, Sri Lanka. She
has a B.Sc. and M.Phil. in Agriculture from the University of Peradeniya and a Ph.D. in
Agricultural Economics from the University of Guleph, Canada. She has been teaching
fundamental and applied courses in Economics with a special focus placed on agricultureand allied fields at the University of Peradeniya since 1987. Her primary research area is
Quantitative Policy Analysis and applications are extended to analysis of various economic
and distributional impacts of trade, agricultural production and marketing policies. She is
a Collaborator of the International Food Policy Research Institute (IFPRI), a Hewlett Fellow
of the International Agricultural Trade Research Consortium (IATRC), a Fellow of the
Canadian Agricultural Trade Policy Research Network (CATPRN) and a Focal Point of the
Asia-Pacific Research and Training Network on Trade (ARTNeT). e-mail: jeevikaw@
gmail.com
Vathana Roth is a research associate at Cambodia Development Resource Institute
working on issues such as economic growth, poverty, inequality and private sector
development. He is also a lecturer of economics at the Department of International Studies,
Institute of Foreign Languages. He previously served as Assistant to Deputy Country
Director (Programme) of the United Nations Development Programme, Cambodia. e-mail:

8/11/2019 Trade performance and competitiveness: Selected issues relevant for Asian developing economies
http://slidepdf.com/reader/full/trade-performance-and-competitiveness-selected-issues-relevant-for-asian-developing 15/215
xiii
Acronyms and Abbreviations
AB Arellano-Bond
ACE Air-Conditioning Equipment
ADB Asian Development Bank ADF Augmented Dickey-fuller
ARTNeT Asia-Pacific Research and Training Network on Trade
ASEAN Association of Southeast Asian Nations
ATE Average Treatment Effects
BAs Business Associations
BEC Broad Economic Categories
CAGR Compound Annual Growth Rate
CES Constant Elasticity of Substitution
CoC Chamber of CommerceDCS Department of Census and Statistics of Sri Lanka
DID difference-in-differences
EHS Early Head Start
ERIA Economic Research Institute for ASEAN and East Asia
ESCAP Economic and Social Commission for Asia and the Pacific
EXPY export basket of a country
FEM Finite Element Method
FTAs Free Trade Agreements
GDP Gross domestic productHS Harmonized System
CIC Industry and Commerce
ICT Information and Communication Technology
IDE-JETRO Institute of Developing Economies-Japan External Trade Organization
IIT Intra-Industry Trade
IoO Index of Opportunities
ISIC International Standard Industrial Classification of All Economic Activities
IT Information technology
ITC International Trade CentreLDCs Least Developed Countries
LPI Logistics Performance Index
MNEs Multinational Entities
MSMEs Micro, small, and medium Enterprises
NAFTA North America Free Trade Agreement
NBER National Bureau of Economic Research
NIC National Industrial Classification
NTIS Nepal Trade Integration Strategy
OLS Ordinary Least SquaresPCA Principal Component Analysis
Pce per capita consumption of electricity
PSM Propensity score matching

8/11/2019 Trade performance and competitiveness: Selected issues relevant for Asian developing economies
http://slidepdf.com/reader/full/trade-performance-and-competitiveness-selected-issues-relevant-for-asian-developing 16/215
xiv
RCA Revealed comparative advantage
SAFTA South Asian Free Trade Area
SEZ Special Economic Zone
SITC Standard International Trade Classification
SMEs Small and Medium EnterprisesSSCs Supply-side constraints
SV Strategic Value
UNCTAD United Nations Conference on Trade and Development
USDA United States Department of Agriculture
WDI World Development Indicators
WITS World Integrated Trade Solution
WTO World Trade Organization

8/11/2019 Trade performance and competitiveness: Selected issues relevant for Asian developing economies
http://slidepdf.com/reader/full/trade-performance-and-competitiveness-selected-issues-relevant-for-asian-developing 17/215
xv
Overview
The first essay on “Structural transformation and trade policy: The Case of Nepal”
by Paras Kharel reviews recent trade and industry policy initiatives in Nepal. This is in the
context of recent literature pioneered by Dani Rodrik, Ricardo Hausmann and colleagues,suggesting that some patterns of production and trade may be more conducive to structural
transformation and industrialization. The essay provides an excellent overview of this new
literature, which is starting to have an important influence in both academic and policy
circles. It also provides an application of some of the approaches using network analysis to
develop a graphical representation of the product space in Nepal. Based on a very detailed
and comprehensive analysis, Kharel draws important implications for trade and industry
policy. He argues that there is scope for better targeting of Nepalese trade and industry
promotion policies.
Kharel’s discussion raises some of the unresolved and difficult issues in targeted
government interventions of this type. These issues have a long history; from the time
when import substitution industrialization (ISI) policies held sway in much of the developing
world, and that continue today to have relevance for policy debates. This is not only in
Nepal, but also for many other countries grappling with the challenges of sustaining
industrialization and development over the longer term. The long history of ISI policies
provides plenty of examples where government interventions to guide the industrialization
process through targeted support has resulted in costly misallocation of resources, which
often trap economies in “infant industries that never grow up”. While making a case for governments to pay attention to the potential benefits of well-directed industry promotion,
Kharel also points to the potential tension between assisting industries with the highest
potential for export earnings and employment and, on the other hand, assistance for
upgrading the industrial and export structures, and capabilities to be able to produce and
export (or expand) the production and export of, more sophisticated products requiring
a greater number of capabilities. For a country like Nepal, traditional labour-intensive
industries (such as garments) may offer the best potential in terms of maximising export
earnings and employment. However, it may not be most helpful for industry upgrading and
a progressive shift into more sophisticated manufactured products.
In the second essay, “Logistics performance, trade and production fragmentation:
An analysis of India’s trade with Bangladesh and Thailand”, Prabir De and Amrita Saha
investigate the important issue of logistical services for successful industrialization and
export growth. They analyse the link between logistical performance and trade in parts and
components in the manufacturing industries. This is central to the growth of international
production linkages and networks associated with the phenomenon of international
production fragmentation. They focus specifically on trade in two commodities – India’s
export of yarn to Bangladesh and India’s import of air-conditioning equipment from
Thailand, in the context of the broader regional trading context.
Logistics involves a multiplicity of services including various forms of transport,
communications and quality of human resources. They develop a logistical services index

8/11/2019 Trade performance and competitiveness: Selected issues relevant for Asian developing economies
http://slidepdf.com/reader/full/trade-performance-and-competitiveness-selected-issues-relevant-for-asian-developing 18/215
xvi
for 20 Asia-Pacific countries based on data on a wide range of such services. This is to
quantify the link between logistic services and trade. They demonstrate not only that
improved logistical services have a positive impact on trade, but also that there is a two-
way relationship between trade and logistical services in that increased trade, in turn, tends
to enhance the quality of logistical services. Although the precise mechanism throughwhich this occurs is not explored in the paper, it is likely that expanded trade in turn may
induce market and government policy responses. The wide differences observed in quality
of logistical service among the countries studied indicate that there is a large potential for
improvement in logistics. In turn, this contributes to beneficial expansion of trade and
fosters closer and deeper regional production linkages.
The pace and impact of progress in trade and industrialization in the region
ultimately depends on the extent to which firms can address the challenges of competing
and succeeding in markets where policy liberalization and the resulting pressures from
globalization intensify competitive pressures, even as they open up broader opportunities.
The importance of firm level differences in critically influencing outcomes when economies
are opened up to international competition has been highlighted in recent literature on
international trade following Melitz (2003). The next two essays explore firm level issues
related to competing in globalized markets.
In the third essay, “An analysis of export performance of manufacturing and service
sector enterprises in Sri Lanka”, Jeevika Weerahewa, Sarath S. Kodithuwakku and Rifana
Buhary investigate the different characteristics of exporting and non-exporting firms in two
key industries using a rice data set from a recent (2011) World Bank “Enterprise Survey” of over 800 firms. The researchers chose econometric techniques and a modelling approach
that avoids the common problem of “selection bias” in studies of this type. They show that
several firm-level characteristics, in particular size and geographical location, as well as the
managers’ perceptions regarding the overall business environment, influence whether firms
become exporters or not. Indeed, a few large exporters, many with foreign linkages,
account for the bulk of exports. The results of this study raise several issues that merit
future investigation in more detail, including the reasons for different managerial
perceptions regarding the business climate. The overall impression conveyed by the results
of this analysis is that Sri Lanka faces formidable challenges if it were to succeed infostering a broad based export culture among the small and medium sized firms who
comprise the majority.
The final essay, “Evaluation of business association membership on small and
medium enterprises’ growth performance: Evidence from enterprise survey of Cambodia” is
by Vathana Roth. It addresses issues relating to the major policy challenge of how to assist
small and medium enterprises operating in a developing country setting of imperfect factor
and information markets, and how to overcome scale and market access constraints. It
examines factors that impact on performance among small and medium firms, with a focuson whether business associations can contribute to increasing their competitiveness and
overall performance. The study uses data from the 2007 World Bank Enterprise Surveys of
Cambodia to examine the impact of belonging to a business association on Small and

8/11/2019 Trade performance and competitiveness: Selected issues relevant for Asian developing economies
http://slidepdf.com/reader/full/trade-performance-and-competitiveness-selected-issues-relevant-for-asian-developing 19/215
xvii
Medium Enterprises (SMEs) from four sectors – manufacturing, tourism, trade, and others.
The analytical approach involved propensity score matching (PSM) as well as PSM with
ordinary least squares (OLS) regression. The study finds that firms belonging to business
associations tend to have higher turnover and production, and tend to spend more on
production and other related costs. However, it did not find membership to have anysignificant impact on firms’ labour productivity and labour cost per worker. This may be due
to business associations in Cambodia having limited capacity to enhance productivity of
members through provision of appropriate services. In any case, the results ought to be
treated with some caution, not only because of data limitations but also as participation in
such associations is a relatively new experience for many firms.

8/11/2019 Trade performance and competitiveness: Selected issues relevant for Asian developing economies
http://slidepdf.com/reader/full/trade-performance-and-competitiveness-selected-issues-relevant-for-asian-developing 20/215

8/11/2019 Trade performance and competitiveness: Selected issues relevant for Asian developing economies
http://slidepdf.com/reader/full/trade-performance-and-competitiveness-selected-issues-relevant-for-asian-developing 21/215
1
I. Structural transformation and trade policy:Case of Nepal
By Paras Kharel
Introduction
High and sustained economic growth entails structural transformation. This involves
the shift of productive factors from low-productivity and low-wage activities to
high-productivity and high-wage activities. The aim is to move the output structure into
higher-productivity activities, and production of more complex and sophisticated products.
In the past, structural transformation was generally seen as a consequence of growth anddevelopment. However, recent advance in literature has produced powerful analysis
methods for appreciating the role of structural transformation in inducing growth and
development. It also provides evidence that product potential varies in effecting structural
transformation. In particular, what a country exports now influences the type of goods it will
export in future, thus influencing its future economic growth rate. In this context, the
literature suggests that governments may have a more direct and important role to play,
particularly in economies with low economic complexity.
These findings are particularly relevant for Nepal. Asa least developed economystarting to rebuild its economy after a period of political conflict, it is now attempting to
embark on a sustainable economic development path. The country has formulated
a range of policies, including Trade Policy 2009 and Nepal Trade Integration Strategy
(NTIS) 2010, for active government intervention in stimulating export growth and
industrialization. It has also selected products to be given high-priority status for
government support. This paper analyses the nature and extent of structural change in the
Nepali economy by studying trends, patterns and composition of productivity growth. It also
assesses Nepal’s export performance, including the sophistication and diversification of its
exports, and the extent government high-priority products have in assisting Nepal’sstructural transformation and future growth.
The rest of the paper is organized as follows. Section 2 reviews the literature on
structural transformation, including recent methodological advances. Section 3 discusses
Nepal’s economic and export performance. Section 4 discusses sectoral productivity
growth and whether structural change has been growth-enhancing or growth-reducing in
Nepal over a recent decadal period. Section 5 reviews Nepal’s trade policy, plans and
strategies, with focus on products identified for export promotion. Section 6 discusses the
methods and data used for analysing the nature, pattern and prospects of structural
transformation from the export dimension. Section 7 analyses the evolution of Nepal’s
export basket in terms of export sophistication and diversification. It also assesses the
prospects for structural transformation offered by products identified/targeted by Trade
Policy 2009 and NTIS 2010. Section 8 concludes.
8/11/2019 Trade performance and competitiveness: Selected issues relevant for Asian developing economies
http://slidepdf.com/reader/full/trade-performance-and-competitiveness-selected-issues-relevant-for-asian-developing 22/215
2
A. Review of literature on structural transformation
High and sustained economic growth entails structural transformation – a shift of
productive factors from low-productivity and low-wage activities to high-productivity
and high-wage activities. This is such that the output structure progressively shifts intohigher-productivity activities, including increased production of more complex and
sophisticated products. Countries should be able to produce not just more of the same
products, but also new ones. Also, the products chosen for specialization will have different
consequences for development.
Founders of development economics emphasize the importance of industrialization
for the externalities it generates, leading to accelerated growth (Rosenstein-Rodan, 1943;
Hirschman, 1958; Kaldor, 1967). Experiences of industrialized economies, as well as those
of the newly industrialized East Asia, suggests the importance of structural transformation
(see, for example, Chang, 2002). However, lacking formal models, mainstream economic
theory has made little use of these ideas (Hidalgo and Hausmann, 2008:5).
Dominant neo-classical trade and growth theories state that the type of products
a country produces and exports have little or no bearing on long-term growth and
development. The Heckscher-Ohlin model suggests that, in an open economy, countries
specialize on the production of goods that intensively use the productive factors that they
are endowed with, such as physical capital, labour, land, human capital, infrastructure and
institutions. The specialization pattern changes with the accumulation speed of specific
factors. Therefore, controlling for initial factor endowments, the particular productsa country produces and exports do not matter for its future economic performance
(including export).
Similarly, the Ricardian model argues that technological differences across
countries determine comparative advantage. Also two other dominant theories – the
varieties model of Romer (1990), and the quality ladders model of Aghion and Howitt
(1992) and Grossman and Helpman (1991) – explain productivity differences as “assume
a degree of homogeneity across products that eliminates the possibility to capture the
impact of initial specialization” (Hausmann and Klinger, 2007:1). New trade theory(Helpman and Krugman, 1985; Krugman, 1979) explains intra-industry specialization
(which Ricardian and Hecksher-Ohlin models cannot) through economies of scale and
product differentiation. The so-called “new-new” trade theory – the Melitz model (Melitz,
2003) – takes into account heterogeneity among firms, explaining which firms would find it
advantageous to export and which firms would sell only in the domestic market. However,
neither explains the path-dependent process of specialization. Thus, dominant mainstream
economic theories does not consider the structure of the product space (the universe of
goods and services that a country may produce) to be important for future growth, ignoring
the path-dependent nature of growth and development.
Recent advances in the literature challenge this view with more explicit recognition
of externalities and path dependence. Hausmann et al. (2006) finds that countries that
export goods associated with higher productivity levels grew more rapidly, even after
8/11/2019 Trade performance and competitiveness: Selected issues relevant for Asian developing economies
http://slidepdf.com/reader/full/trade-performance-and-competitiveness-selected-issues-relevant-for-asian-developing 23/215
3
controlling for initial income per head, human capital levels, and time-invariant country
characteristics. This is through measures of the productivity or income potential of
a product (PRODY and EXPY). Their findings also reveal that countries with initial high
levels of export sophistication subsequently experienced higher growth in exports.
Hausmann et al. (2006) argues that “countries become what they produce”. This appeals tothe mechanism of “cost discovery” (Hausmann and Rodrik, 2003), under which the range of
goods that an economy ends up producing and exporting is determined not just by the
usual fundamentals, but also by the number of entrepreneurs who can be stimulated to
discover the cost of production in modern sectors of the economy. Such cost discovery
generates considerable positive externalities for other entrepreneurs.
Hausmann and Klinger (2006, 2007) show that changes in the revealed
comparative advantage of nations are governed by the pattern of relatedness of products at
the global level. As countries change their export mix, there is a strong tendency to move
towards “related goods” (goods that are, somewhat, more sophisticated but fairly similar),
rather than to goods that are farther away. They introduced an outcome-based measure of
relatedness, called proximity, between pairs of products using cross-country export data.
Formally, the proximity between products i and j is the minimum of the pair-wise conditional
probabilities of a country exporting a good, given that it exports another. Their findings
show that the pattern of relatedness of products is only very partially explained by similarity
in broad factor or technological intensity classifications, as in Leamer (1984) or Lall (2000).
This suggests that the relevant determinants are much more product-specific. Countries
that specialize in a dense part of the product space (where there are a lot of products in
close proximity to one another) find it easier to change their revealed comparative
advantage than countries that specialize in more disconnected products.
In general, rich (poor) countries tend to specialize in dense (sparse) parts of the
product space, although there is significant variation in this relationship. Controlling for the
level of income, countries like China, India, Indonesia, Turkey and Poland, specialize in
a very dense part of the product space, while countries that specialize in natural resources
(particularly oil) have export baskets in disconnected parts of the space (Hausmann and
Klinger, 2007:16). Hausmann and Klinger (2007) find that the speed at which countries can
transform their productive structure and upgrade their exports depends on having a path of nearby goods that are of increasingly higher value. In their model, they argue that the
assets and capabilities2 needed to produce one good are imperfect substitutes for those
needed to produce another good. However, this degree of asset specificity varies,
determining product interrelatedness. As a result, the process of structural transformation
tends to favour nearby goods in the product space, making the pattern of structural
transformation path-dependent.
2 The model focuses on human capital but is applicable to other specific non-tradable assets like
knowledge, labour training requirements, infrastructure needs, property rights, regulatory requirements or other
public goods (Hausmann and Klinger (2006, 2007).
8/11/2019 Trade performance and competitiveness: Selected issues relevant for Asian developing economies
http://slidepdf.com/reader/full/trade-performance-and-competitiveness-selected-issues-relevant-for-asian-developing 24/215
4
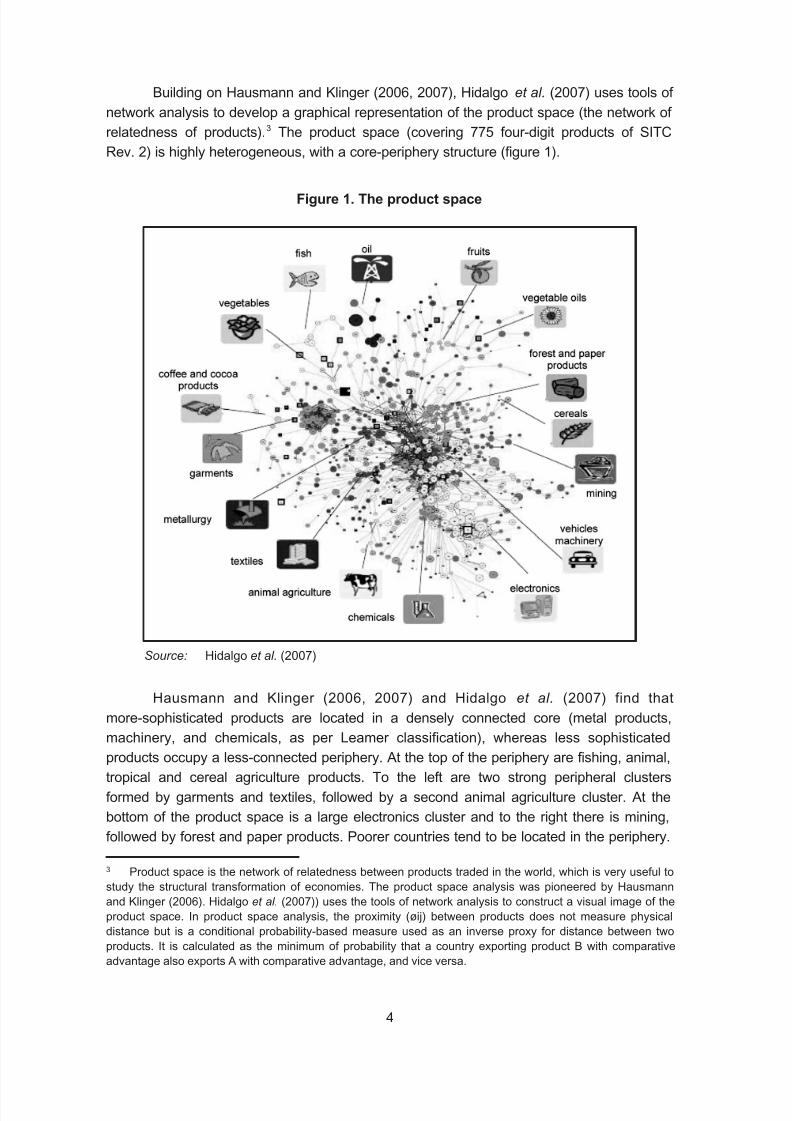
Building on Hausmann and Klinger (2006, 2007), Hidalgo et al. (2007) uses tools of
network analysis to develop a graphical representation of the product space (the network of
relatedness of products).3 The product space (covering 775 four-digit products of SITC
Rev. 2) is highly heterogeneous, with a core-periphery structure (figure 1).
Figure 1. The product space
Source: Hidalgo et al. (2007)
3 Product space is the network of relatedness between products traded in the world, which is very useful to
study the structural transformation of economies. The product space analysis was pioneered by Hausmannand Klinger (2006). Hidalgo et al. (2007)) uses the tools of network analysis to construct a visual image of the
product space. In product space analysis, the proximity (øij) between products does not measure physical
distance but is a conditional probability-based measure used as an inverse proxy for distance between two
products. It is calculated as the minimum of probability that a country exporting product B with comparative
advantage also exports A with comparative advantage, and vice versa.
Hausmann and Klinger (2006, 2007) and Hidalgo et al. (2007) find that
more-sophisticated products are located in a densely connected core (metal products,
machinery, and chemicals, as per Leamer classification), whereas less sophisticated
products occupy a less-connected periphery. At the top of the periphery are fishing, animal,
tropical and cereal agriculture products. To the left are two strong peripheral clusters
formed by garments and textiles, followed by a second animal agriculture cluster. At the
bottom of the product space is a large electronics cluster and to the right there is mining,
followed by forest and paper products. Poorer countries tend to be located in the periphery.

8/11/2019 Trade performance and competitiveness: Selected issues relevant for Asian developing economies
http://slidepdf.com/reader/full/trade-performance-and-competitiveness-selected-issues-relevant-for-asian-developing 25/215
5
The empirical findings indicate that countries move through the product space by
developing goods close to those they currently produce, and that many countries will meet
considerable difficulty in reaching the core. An important implication of these findings is that
even with similar levels of production and export sophistication, countries face different
prospects for structural transformation. This would depend on the proximity of moresophisticated products to their respective current productive capacities (proxied by the
products that a country exports with revealed comparative advantage).
Felipe et al. (2010a) develops an “Index of Opportunities” (IoO) for 130 countries
based on their capabilities to undergo structural transformation. The four dimensions of IoO
are related to the characteristics of a country’s export basket: sophistication, diversification,
standardness, and possibilities to export other products with comparative advantage. The
rationale behind IoO is that in the long run a country’s income is determined by the
sophistication and variety of products it makes and exports, reflecting its capabilities. In the
IoO rankings, Nepal ranks 33rd among 96 non-high income countries, putting it in the
second quintile. Among the four South Asian countries (for which data is available), Nepal’s
capabilities to undergo structural transformation are better than Bangladesh, Pakistan and
Sri Lanka and second only to India.
Felipe et al. (2010b) argues that becoming a rich country requires the ability to
produce and export goods that embody certain characteristics. In classifying 779 exported
goods (SITC Rev. 2, 4-digit), two dimensions are accorded – sophistication (measured by
PRODY) and connectivity to other products (measured by PATH). As a result, 352 “good”
products and 427 “bad” products are identified.
Researchers then categorized 154 countries into four groups according to these two
characteristics, with Nepal being among the “low core” 75 countries in the “low product”
trap. This group also includes Pakistan, Sri Lanka and Bangladesh from South Asia. The
share of core products in the number of products Nepal exports with comparative
advantage is 18.8 per cent. The exports of the countries in this group are concentrated in
products with low sophistication and little or average linkages with other products. Felipe
et al. (2010b) suggests that to escape this situation, these countries need to implement
policies that would help them accumulate the capabilities needed to manufacture andexport more sophisticated and better connected products. This would involve human capital
acquiring skills, technology and knowledge; a higher drive to diversify and to increase
sophistication by embracing a realistic industrial vision; and improvement in organizational
abilities e.g. firm-level organization (Felipe et al., 2010b: p. 30).
Felipe et al. (2010c) argue that the key factor underlying China’s fast development
during the last 50 years is its “ability to master and accumulate new and more complex
capabilities”, citing the increase in diversification and sophistication of its export basket.
Furthermore, they say China’s accumulation of new capabilities is policy induced and not
the result of the market, beginning before economic liberalization started. Analysis of
China’s current export opportunity set shows that the country is “exceptionally well
positioned” to continue learning and gaining revealed comparative advantage in the export
of more sophisticated products.

8/11/2019 Trade performance and competitiveness: Selected issues relevant for Asian developing economies
http://slidepdf.com/reader/full/trade-performance-and-competitiveness-selected-issues-relevant-for-asian-developing 26/215
6
Abdon and Felipe (2011) find that in contrast the majority of Sub-Saharan African
countries are trapped in the export of unsophisticated, highly-standard products that are
poorly connected in the product space. This makes the region’s process of structural
transformation particularly difficult. As the products that are “nearby” to those they already
export have the same characteristics, Abdon and Felipe (2011) conclude that shifting tothese products will do little to improve the region’s growth prospects. As a means for
jump-starting and sustaining growth, they recommend implementation of policies and
provision of public inputs that encourage the private sector to invest in new and more
sophisticated activities.
Hidalgo and Hausmann (2009) use the techniques of network science to develop
a method to characterize the structure of bipartite networks connecting countries to the
products they export. Labeled Method of Reflections, it creates measures to count the
relative number of capabilities present in a country without making any assumptions about
the nature of capabilities. This is done by iteratively combining information on diversity of
countries (number of products a country exports) and ubiquity of products (number of
countries that export a product) using trade data. The number of capabilities present in
a country forms the country’s economic complexity. The complexity measures developed
through the Method of Reflections do not include information on income.4 This method of
measuring complexity of product and economy addresses criticism of PRODY and EXPY
(measures using income information), which makes the tautological observation that rich
countries export rich country goods.
Hidalgo and Hausmann (2009) find that a) the complexity of a country’s economy iscorrelated with per capita income. Deviations from this relationship are predictive of future
growth, suggesting that countries tend to approach the level of income associated with the
available capability set. B) The level of complexity of a country’s economy predicts the type
of products that a country will be able to develop in the future. This suggests that the new
products that a country develops depend substantially on the capabilities already available
in that country. Hidalgo and Hausmann (2009) argue that changes in a country’s
productive structure can be understood as a combination of two processes a) that by which
“countries find new products as yet unexplored combinations of the capabilities they
already have”, and b) that by which “countries accumulate new capabilities and combinethem with other previously available capabilities to develop yet more products” (Hidalgo
and Hausmann, 2009:10575).
Ranking of products and countries according to the measures of complexity
(developed by Hidalgo and Hausmann (2009); Abdon et al. (2010)) finds that the most
complex products are in machinery, chemicals and metals, while the least complex
products are raw materials and commodities, wood, textiles, and agricultural products.
More so, the most complex economies in the world are Japan, Germany, and Sweden, and
the least complex, Cambodia, Papua New Guinea, and Nigeria; the major exporters of the
4 However, there is a strong correspondence between PRODY and EXPY with their network counterparts,
“suggesting that most of the information contained in PRODY and EXPY comes from the structure of the
network connecting countries to the products they export, rather than from income” [Hidalgo 2009: p. 7].

8/11/2019 Trade performance and competitiveness: Selected issues relevant for Asian developing economies
http://slidepdf.com/reader/full/trade-performance-and-competitiveness-selected-issues-relevant-for-asian-developing 27/215
7
more complex products are the high-income countries, while the major exporters of the less
complex products are the low-income countries; and export shares of the more complex
products increase with income, while export shares of the less complex products decrease
with income. Among the South Asian economies with available data, Nepal is ranked 89 th
out of 124 countries in terms of economic complexity. This is higher than Bangladesh, SriLanka and Pakistan but below India. Despite this, Nepal’s export basket is positively
skewed towards less complex products.
Using the measures of complexity (diversification and ubiquity) developed in 2009,
Hausmann and Hidalgo, in 2010, construct a simple model that assumes that each product
requires a potentially large number of non-tradable inputs (capabilities). More so, that
a country can only make the products for which it has all the requisite capabilities. Within
the model, products differ in the number and specific nature of the capabilities they require,
while countries differ in the number and nature of capabilities they have. Therefore,
products that require more capabilities will be less ubiquitous, while countries that have
more capabilities will be more diversified. Mathematically, this proves that: i) the level of
diversification of a country increases on average with the number of capabilities it has;
ii) the ubiquity of a product decreases, on average, with the number of capabilities it
requires; iii) the average ubiquity of products exported by a country decreases with that
country’s level of diversification; iv) the average level of diversification of products exported
decreases with the ubiquity of that product.
The model also implies that the return (in terms of diversification) to the
accumulation of new capabilities increases exponentially with the number of capabilitiesalready available in a country. This gives rise to the “quiescence trap” or a “trap of
economic stasis”, meaning countries with few capabilities will have negligible or no return to
the accumulation of more capabilities, while countries with many capabilities will experience
large returns to the accumulation of additional capabilities. The model opens up two options
to the quiescence trap – increase in the average complexity of products, or increase in the
total number of capabilities that exist in the world. The trap calls for solving the coordination
problem between the accumulation of additional capabilities and the demand for those
capabilities.
Particular within Hausmann and Hidalgo (2010)’s empirically validated model,
calibration suggests that the world exists in a regime with a strong quiescence trap. More
so, when this model is combined with the results of Hausmann and Klinger (2006, 2007)
and Hidalgo et al. (2007), a more refined insight into the process of structural
transformation is revealed. This is “the ability to add a product to the production set of
a country depends not only on how close a given product is to an already existing one, but
also on how many other capabilities are present in the country and used in other, potentially
more distant, products” (Hausmann and Hidalgo, 2010: p. 27).
Furthering economic complexity analysis, Hidalgo (2009) finds that during the
42-year period 1963-2005 (while the product space remains relatively stable) only a few
highly dynamic economies have been able to considerably transform their productive
structures. Products, such as vehicles and machinery, populated the more densely

8/11/2019 Trade performance and competitiveness: Selected issues relevant for Asian developing economies
http://slidepdf.com/reader/full/trade-performance-and-competitiveness-selected-issues-relevant-for-asian-developing 28/215
8
connected part of the network, while oil and some of its derivate products are always
located in a weakly connected periphery of the network. This demonstrates that oil requires
specific capabilities that do not foster development, despite generating large revenues.
Agricultural products and raw materials are also consistently located in the periphery of the
space. The countries that have transformed their productive structures most dramaticallyare Brazil, Indonesia, Turkey, Malaysia, Thailand, Republic of Korea, Singapore and China.
They have followed different trajectories. While the economic complexity of Republic of
Korea, Singapore and China were relatively high at the beginning of the observation period,
Brazil, Indonesia and Turkey started from a primitive production structure. Hidalgo (2009)
argues that in complex economies good governance and institutions may be all that is
required to stimulate capability building and economic growth. In turn, governments of
countries with low economic complexity should actively help catalyze market activities and
solve coordination problems associated with attempts to accumulate capabilities.
Freire (2011) creates an index of productive capacity of an economy using a variant
of the Methods of Reflections. This shows that it is very difficult for countries to improve
their productive capacities when they start from lower levels. Focusing on the period
1984-2009, he also finds that while there has been convergence in productive capacity
among countries that were initially above the average (relative to the world), those that had
below average productive capacity two decades ago have lagged further behind. This
suggests increasing overall divergence. The countries that have transformed the most in
the 25-year period are China, India and the United Arab Emirates. In the Asia-Pacific
region, Turkey, the Republic of Korea and Thailand are among the top 10 countries which
increased their productive capacity in relation to the average in that period (Freire, 2011).
With the exception of Bangladesh, all other least developed countries (LDCs) in the region
have ended the period further away from the world’s average in 2009 when compared with
their position in 1984 (Freire, 2011). LDCs of the region have productive capacity way
below the world average. Nepal’s productivity capacity, relative to the world average in
2009, was only marginally worse than in 1984. It is greater than that of all Asia-Pacific
LDCs, except Bangladesh, but lower than that of the developing countries in South Asia,
namely India, Pakistan and Sri Lanka. Regionally, it is average for Latin America and the
Asia-Pacific.
Using methods developed by Freire (2011) in a related research, ESCAP (2011)
finds that the countries that export the greatest number of categories of products and those
which have more products at different prices within those categories tend to have higher
levels of GDP. Findings also show that diversifications within and between categories of
products are not mutually exclusive. Richer countries continue to diversify, with the
dominant form of diversification being the expansion of production of different varieties
within the same category, as product categories rise. With average diversification of
countries increasing, but product mix becoming more standard, countries that do not
diversify are likely to fall behind (ESCAP, 2011).
Notably, only four countries – Estonia, Latvia, Lithuania and Vietnam – have
succeeded in transforming themselves during 1984-2009. The group began with
productivity capacities similar to those of the LDCs, and then raised it to above the world
8/11/2019 Trade performance and competitiveness: Selected issues relevant for Asian developing economies
http://slidepdf.com/reader/full/trade-performance-and-competitiveness-selected-issues-relevant-for-asian-developing 29/215
9
average (ESCAP, 2011; Freire, 2011). The process of transformation was gradual, e.g. as
in Vietnam (ESCAP, 2011).
Based on the experiences of the countries that have transformed themselves,
ESCAP (2011) suggests a strategy for increasing productive capacities; this is made up of
three main processes for discovering, acquiring and spreading the productive capacities
required for developing economies to catch up. The first process is differentiation through
strategic product innovation, which is identification and production of products that are new
to the economy and more complex, facilitating further diversification. The second process is
through the selection of the business models of firms and farms that are successful in the
differentiation process. The third is the amplification of the successful business models and
the exploitation of the new market (ESCAP, 2011). These processes have to be repeated
continuously for the strategy to succeed (ibid.).
Regarding the first process, ESCAP (2011) finds that Asia-Pacific LDCs, onaverage, could product around 400 new products closely related to existing ones. However,
only 10-15 per cent of these would be both more complex and better connected to other
products. In the case of Nepal, there are around 514 products related to those already
exported, of which 58 (11 per cent), are more complex and better positioned for future
diversification. ESCAP (2011) suggests a pragmatic way to look for potential new products;
this is to emulate the production pattern of countries that have higher productive capacities,
even if they do not have higher per capita GDPs.
In the next section we review Nepal’s recent growth and export performance, usingsome of the product classifications developed in this paper.
B. Nepal’s economic and export performance:A preliminary analysis
In the 30-year period 1980-2010, Nepal’s GDP per capita growth has been poor
and erratic (figure 2). Annual compound growth of GDP per capita in the three decades was
a meagre 2.16 per cent, the lowest in South Asia (figure 3). This region is also home to
three other LDCs besides Nepal – Afghanistan, Bangladesh and Bhutan. While the annual
growth rate of GDP per capita for other countries in the region improved during the recent
decade (2000-2010), Nepal’s growth rate declinedto an average of 1.8 per cent per annum.
The contrast is even starker when compared with the GDP per capita growth rates of two
LDCs of Southeast Asia – Cambodia and Lao People’s Democratic Republic. These grew
at average annual rates of 6.5 per cent and 5.4 per cent respectively.
Nepal’s dismal GDP per capita growth has led to its per capita GDP to being the
lowest among South Asian countries, after Afganistan. This is also lower than the two
Southeast Asian LDCs – Cambodia and Lao People’s Democratic Republic (figure 4). Thegap with all these countries has widened since 1981. Notably, Bangladesh and Cambodia,
with about the same per capita GDP as Nepal’s in 1981 and 1995, had their per capita
GDP levels higher than Nepal’s by 38 per cent and 80 per cent respectively, by 2010.
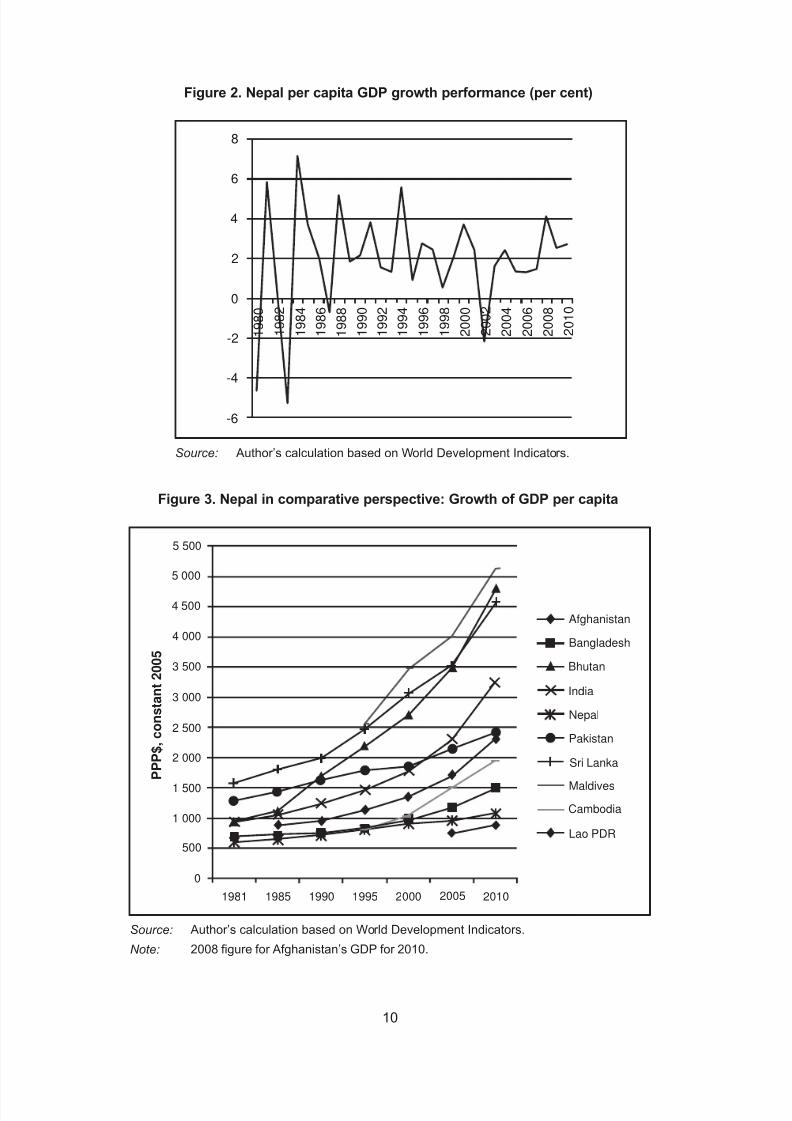
8/11/2019 Trade performance and competitiveness: Selected issues relevant for Asian developing economies
http://slidepdf.com/reader/full/trade-performance-and-competitiveness-selected-issues-relevant-for-asian-developing 30/215
10
5 500
5 000
4 500
4 000
3 500
3 000
2 500
2 000
1 500
1 000
500
0
1981 1985 1990 1995 2000 2005 2010
Afghanistan
Bangladesh
Bhutan
India
Nepal
Pakistan
Sri Lanka
Maldives
Cambodia
Lao PDR
P P P $ , c o n s
t a n t 2 0 0 5
Figure 2. Nepal per capita GDP growth performance (per cent)
Figure 3. Nepal in comparative perspective: Growth of GDP per capita
Source: Author’s calculation based on World Development Indicators.
Note: 2008 figure for Afghanistan’s GDP for 2010.
Source: Author’s calculation based on World Development Indicators.
8
6
4
2
0
-2
-4
-6
1 9 8 8
1 9 9 0
1 9 9 2
1 9 9 4
1 9 9 6
1 9 9 8
2 0 0 0
2 0 0 4
2 0 0 6
2 0 0 8
2 0 1 0
1 9 8 0
1 9 8 2
1 9 8 4
1 9 8 6
2 0 0 2
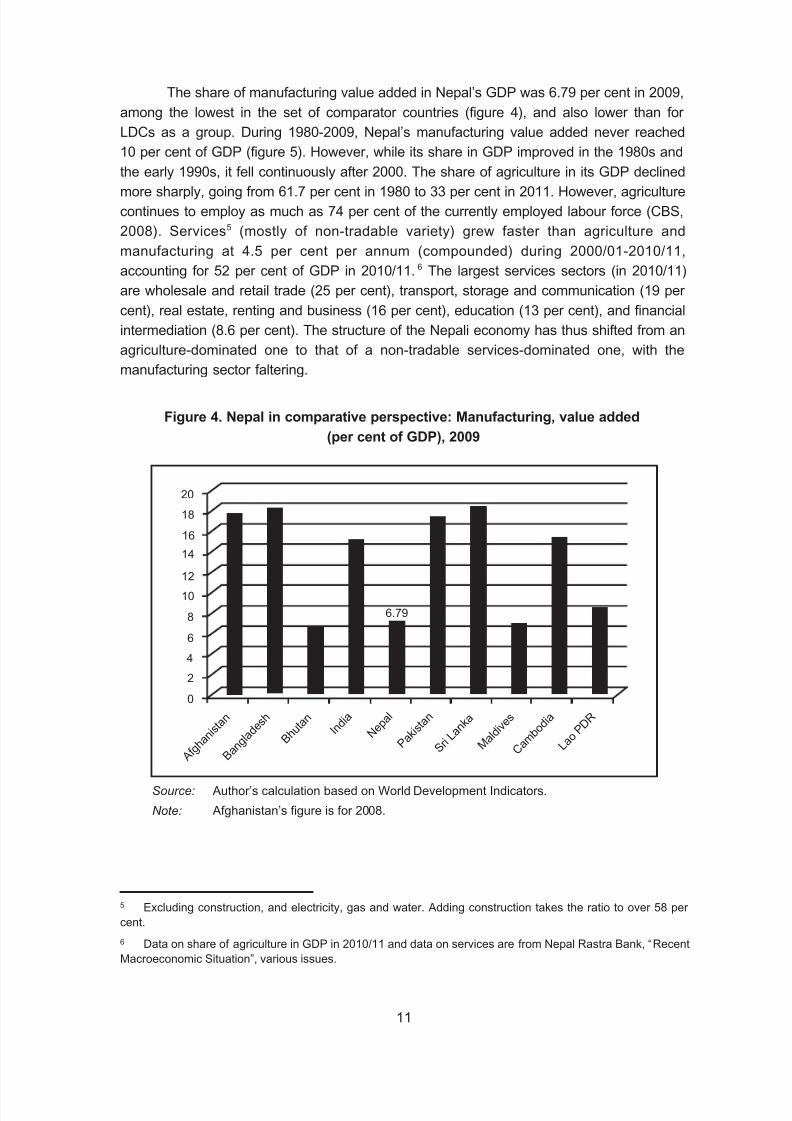
8/11/2019 Trade performance and competitiveness: Selected issues relevant for Asian developing economies
http://slidepdf.com/reader/full/trade-performance-and-competitiveness-selected-issues-relevant-for-asian-developing 31/215
11
Figure 4. Nepal in comparative perspective: Manufacturing, value added
(per cent of GDP), 2009
Source: Author’s calculation based on World Development Indicators.
Note: Afghanistan’s figure is for 2008.
5 Excluding construction, and electricity, gas and water. Adding construction takes the ratio to over 58 per
cent.
6 Data on share of agriculture in GDP in 2010/11 and data on services are from Nepal Rastra Bank, “Recent
Macroeconomic Situation”, various issues.
The share of manufacturing value added in Nepal’s GDP was 6.79 per cent in 2009,
among the lowest in the set of comparator countries (figure 4), and also lower than for
LDCs as a group. During 1980-2009, Nepal’s manufacturing value added never reached
10 per cent of GDP (figure 5). However, while its share in GDP improved in the 1980s and
the early 1990s, it fell continuously after 2000. The share of agriculture in its GDP declinedmore sharply, going from 61.7 per cent in 1980 to 33 per cent in 2011. However, agriculture
continues to employ as much as 74 per cent of the currently employed labour force (CBS,
2008). Services5 (mostly of non-tradable variety) grew faster than agriculture and
manufacturing at 4.5 per cent per annum (compounded) during 2000/01-2010/11,
accounting for 52 per cent of GDP in 2010/11.6 The largest services sectors (in 2010/11)
are wholesale and retail trade (25 per cent), transport, storage and communication (19 per
cent), real estate, renting and business (16 per cent), education (13 per cent), and financial
intermediation (8.6 per cent). The structure of the Nepali economy has thus shifted from an
agriculture-dominated one to that of a non-tradable services-dominated one, with themanufacturing sector faltering.
20
18
16
14
12
10
8
6
4
2
0
A f g h a
n i s t a n
B a n g l a d
e s h
B h u t
a n I n
d i a
C a m b o
d i a
S r i L a
n k a
M a l d
i v e s
P a k i s
t a n N e
p a l
L a o P D
R
6.79
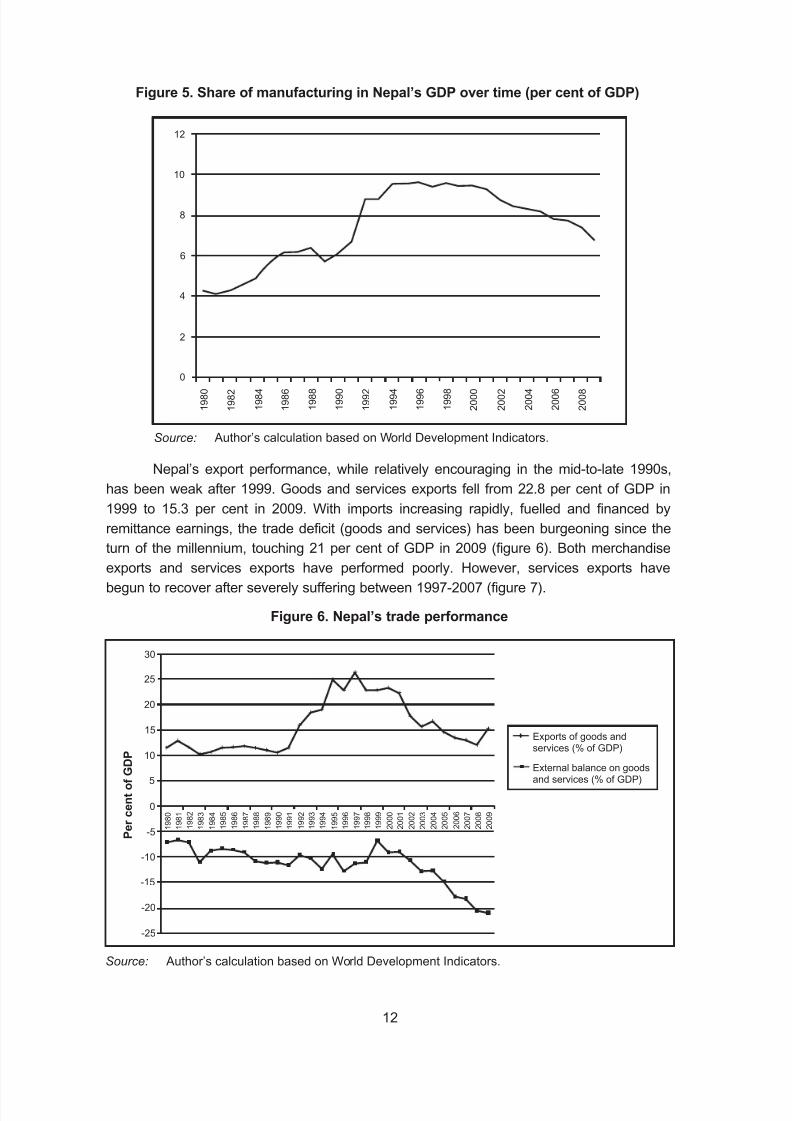
8/11/2019 Trade performance and competitiveness: Selected issues relevant for Asian developing economies
http://slidepdf.com/reader/full/trade-performance-and-competitiveness-selected-issues-relevant-for-asian-developing 32/215
12
Figure 5. Share of manufacturing in Nepal’s GDP over time (per cent of GDP)
Source: Author’s calculation based on World Development Indicators.
Nepal’s export performance, while relatively encouraging in the mid-to-late 1990s,
has been weak after 1999. Goods and services exports fell from 22.8 per cent of GDP in
1999 to 15.3 per cent in 2009. With imports increasing rapidly, fuelled and financed by
remittance earnings, the trade deficit (goods and services) has been burgeoning since theturn of the millennium, touching 21 per cent of GDP in 2009 (figure 6). Both merchandise
exports and services exports have performed poorly. However, services exports have
begun to recover after severely suffering between 1997-2007 (figure 7).
Figure 6. Nepal’s trade performance
Source: Author’s calculation based on World Development Indicators.
12
10
8
6
4
2
0
1 9 8 0
1 9 8 2
1 9 8 4
1 9 8 6
1 9 8 8
1 9 9 0
1 9 9 2
1 9 9 4
1 9 9 6
1 9 9 8
2 0 0 0
2 0 0 2
2 0 0 4
2 0 0 6
2 0 0 8
1 9 8 0
1 9 8 1
1 9 8 2
1 9 8 3
1 9 8 4
1 9 8 5
1 9 8 6
1 9 8 7
1 9 8 8
1 9 8 9
1 9 9 0
1 9 9 1
1 9 9 2
1 9 9 3
1 9 9 4
1 9 9 5
1 9 9 6
1 9 9 7
1 9 9 8
1 9 9 9
2 0 0 0
2 0 0 1
2 0 0 2
2 0 0 3
2 0 0 4
2 0 0 5
2 0 0 6
2 0 0 7
2 0 0 8
2 0 0 9
30
25
20
15
10
5
0
-5
-10
-15
-20
-25
Exports of goods andservices (% of GDP)
External balance on goodsand services (% of GDP)
P e r c e n t o f G D P

8/11/2019 Trade performance and competitiveness: Selected issues relevant for Asian developing economies
http://slidepdf.com/reader/full/trade-performance-and-competitiveness-selected-issues-relevant-for-asian-developing 33/215
13
Figure 7. Nepal’s exports of goods and services
Source: Author’s calculation based on World Development Indicators.
Nepal’s exports-to-GDP ratio for 2009 is the lowest among the set of comparator
countries after Pakistan. Its trade balance-to-GDP ratio is among the worst (table 1).
Table 1. Nepal in comparative perspective: Trade performance
Exports of goods and services External balance on goods
(per cent of GDP), 2009 and services (per cent of GDP),
2009
Afghanistan 15.57 -32.1
Bangladesh 19.43 -7.1
Bhutan 58.55 9.8India 19.58 -4.4
Nepal 15.26 -21.1
Pakistan 12.84 -7.5
Sri Lanka 21.32 -6.5
Maldives 62.84 -23.4
Cambodia 59.61 -3.0
Lao PDR 28.94 -12.9
Source: Author’s calculation based on World Development Indicators.
Note: 2008 figures for Afghanistan.
1980 1982 1984 1986 1988 1990 1992 1994 1996 1998 2000 2002 2004 2006 2008 2010
Service exports(BoP, current USD million)
Goods exports(BoP, current USD million)
1 200
1 000
800
600
400
200
0
U S D m i l l i o n

8/11/2019 Trade performance and competitiveness: Selected issues relevant for Asian developing economies
http://slidepdf.com/reader/full/trade-performance-and-competitiveness-selected-issues-relevant-for-asian-developing 34/215
14
Not only has Nepal’s export performance been poor (in terms of value and growth),
its merchandise export basket remains low in technological sophistication and it is poorly
diversified with almost no change during the past decade.7 In 2010, Nepal exported 118
products with export value of more than $100, 000 (out of 277 possible products at 3-digit
level of SITC Rev. 3). In comparison, Bangladesh exported 213 and Cambodia 137.
8
Thetop 20 products made up 72 per cent of Nepal’s total merchandise exports.9
Figure 8 shows the evolution of the export basket since 1974/75 in terms of the
shares of nine SITC 1-digit categories. While manufacture products account for almost
70 per cent of exports in 2009/10, the share of food and live animals, and crude materials
and inedibles has increased in recent years. Although, this is still below levels reached in
Figure 8. Nepal’s export composition (in terms SITC 1-digit categories)
Source: Author’s calculation based on data from Ministry of Finance, Government of Nepal, Economic Survey, various issues.
7 Based on data from UNCTADstat.
8 Data from UNCTADstat.
9 Data from UNCOMTRADE.
2009/10
2008/09
2007/08
2006/07
2005/06
2004/05
1999/00
1994/95
1989/90
1984/85
1979/80
1974/75
Y e a r
0 20 40 60 80 100
Food & Live Animals
Tobacco & Beverage
Crude Materials & Inedibles
Mineral Fuels & Lubricants
Animals & Vegetable Oil & Fats
Chemicals & Drugs
Manufactured goods classifiedmainly by materials
Machinery and transportequipment
Miscellaneous manufacturedarticles
Commodity and transaction notclassified according to kind
Per cent

8/11/2019 Trade performance and competitiveness: Selected issues relevant for Asian developing economies
http://slidepdf.com/reader/full/trade-performance-and-competitiveness-selected-issues-relevant-for-asian-developing 35/215
15
the mid-1980s. Animal and vegetable oils and fats, as high as 6.4 per cent in 1999/2000,
have a negligible share in 2009/10.10
Figure 9 shows the evolution of Nepal’s export basket in terms of the shares of
factor-intensity-based Leamer (1984) groups formed by aggregating SITC 2-digit
categories. The share of labour-intensive manufacturing has declined notably after 2003,
while the shares of capital-intensive manufacturing and tropical agriculture have increased.
Capital-intensive manufacturing made up almost half of total exports in 2010, while tropical
agriculture exports exceeded labour-intensive manufacturing exports. The sharp fall in
apparel exports since 2003 largely explains the declining share of labour-intensive
manufacture exports.11
10 The major destination of Nepal’s vegetable ghee was India. From 2002, India imposed quantitative
restrictions and non-tariff barriers on Nepal’s vegetable ghee exports. In subsequent years, India reduced and
eliminated ad valorem duty on imports of palm oil, the basic raw material used in the production of vegetable
ghee, eroding the competitiveness of Nepali exports, which was largely derived from the difference in the tariff
on the raw material.
11 Exports in HS Chapters 61 and 62 declined by almost 69 per cent during 2003-2010. The share of these
products in Nepal’s total exports declined from 34 per cent to 8 per cent in the same period (Based on author’s
calculation using UNCOMTRADE data). See Belbase and Kharel (2009) for the impact of expiry of the
Agreement on Textiles and Clothing on Nepali readymade garments export sector.
Figure 9. Nepal’s export composition in terms of Leamer categories
Source: Author’s calculation based on UN Comtrade, SITC Rev. 2.
2009
Y e a r
Petroleum
2003
2000
1995
1992
1988
1985
1982
0 20 40 60 80 100
Raw Materials
Forest Products
Tropical Agriculture
Animal Products
Cereals, etc.
Labour Intensive
Capital Intensive
Machinery
Chemical
2010
Per cent

8/11/2019 Trade performance and competitiveness: Selected issues relevant for Asian developing economies
http://slidepdf.com/reader/full/trade-performance-and-competitiveness-selected-issues-relevant-for-asian-developing 36/215
16
The growth of iron and steel (SITC 67) and articles of metals, mostly of iron and
steel (SITC 69), contributed to the increase in the share of capital-intensive goods. Their
shares increased from 5 per cent and 2 per cent, respectively, in 2003 to 14 per cent and
3 per cent in 2010. Also contributing are textiles exports, whose share rose to 31 per cent
during this period.
12
The top 10 capital-intensive products (SITC Rev. 2, 4-digit) in 2010, interms of export value, accounted for 44 per cent of total exports and 89 per cent of total
capital-intensive goods exports. Besides iron and steel, these products included carpets,
synthetic yarn and fabric, jute twine, cordage and rope, among others. While carpet exports
fell, other textile exports increased in both quantum and share.
However, the high share of capital-intensive goods in Nepal’s export basket should
be interpreted with caution. In the Nepali context, some goods, classified with the Leamer
(1984) classification, are in practice relatively labour-intensive. For example, carpet exports
are mostly of the hand-knotted variety, and hand-knitting as well as use of hand-looms and
hand-and-footdriven machines, are still prevalent in production of other woolen goods. On
the other hand, while iron and steel products do represent capital-intensive modes of
production, it should be noted that domestic value addition (as a share of industry output) is
limited. This is due to complete dependence on imports for manufactured steel, and limited
transformation domestically (to be discussed later).
The share of raw materials has also increased substantially in the new millennium.
Data for 2010 shows that Nepal’s export basket has the highest capital-intensive
manufacture share and the lowest labour-intensive manufacture share among the export
baskets of the comparator countries, excluding Afghanistan, Bhutan and the Maldives(figure 10). In terms of importance of tropical agriculture, Nepal is second only to Sri Lanka.
Figure 11 shows the shifts in major export items between 2003 and 2010. Note the
declining share of apparel, and the rising shares of iron and steel and textiles.
Looking at changes in the composition of Nepal’s exports, in the decade from 1985
to 1995 the shares of primary products and resource-based manufactured products
decreased substantially. Meanwhile the share of low-technology products, comprising of
textile, garment and footwear (LT1), increased significantly (to over 85 per cent). This is
based on Lall (2000) classification of technological sophistication13 (figure 12). The shares
of other low-technology products (LT2) and medium and high-technology products were
negligible. However, by 2009 and 2010, the share of primary products and agro-based
manufactures had more than doubled. Also, the share of LT1 products dipped to 35 per
cent, the share of LT2 increased to 19 per cent, and the share of process-related medium-
technology (MT2) products increased to 13 per cent.
12 Iron and steel exports were negligible in 1995.
13 The Lall (2000) classification does not cover all SITC (Rev. 2) 3-digit codes. Specifically, it does not cover
animals, live, n.e.s., including zoo-anima, cinematograph film, exposed-develop, coin (other than gold) not
being leg, electric current, gold, non-monetary, printed matter, works of art, collectors pieces & an. Cambodia’s
export composition, in terms of Lall (2000) classification as shown in Figure 13, should be interpreted
cautiously because of the 32 per cent share of “unclassified” products.
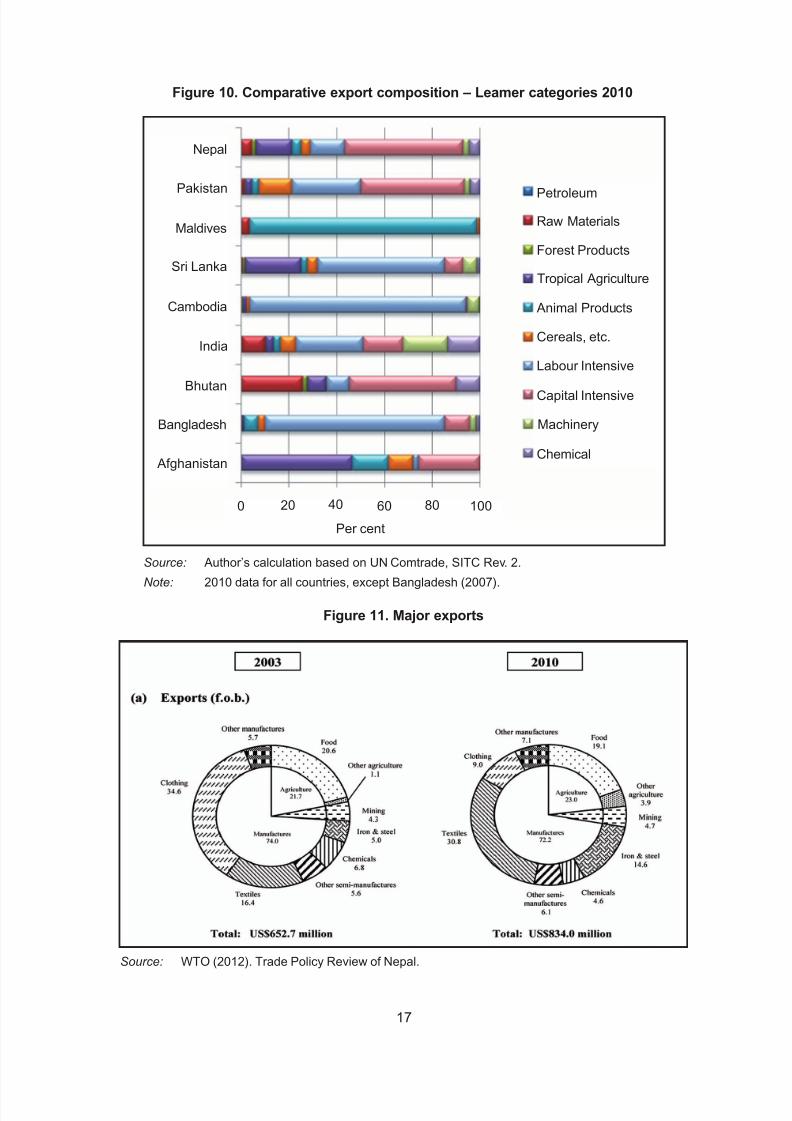
8/11/2019 Trade performance and competitiveness: Selected issues relevant for Asian developing economies
http://slidepdf.com/reader/full/trade-performance-and-competitiveness-selected-issues-relevant-for-asian-developing 37/215
17
Nepal
Pakistan
Maldives
Sri Lanka
Cambodia
India
Bhutan
Bangladesh
Afghanistan
0 20 40 60 80 100
Petroleum
Raw Materials
Forest Products
Tropical Agriculture
Animal Products
Cereals, etc.
Labour Intensive
Capital Intensive
Machinery
Chemical
Per cent
Figure 10. Comparative export composition – Leamer categories 2010
Source: Author’s calculation based on UN Comtrade, SITC Rev. 2.
Note: 2010 data for all countries, except Bangladesh (2007).
Figure 11. Major exports
Source: WTO (2012). Trade Policy Review of Nepal.

8/11/2019 Trade performance and competitiveness: Selected issues relevant for Asian developing economies
http://slidepdf.com/reader/full/trade-performance-and-competitiveness-selected-issues-relevant-for-asian-developing 38/215
18
100
Primary Products (PP)
90
80
70
60
50
40
30
20
10
0
1985 1995 2000 2009 2010
RB 2: Other
LT 2: Other Products
MT 2: Process
HT 1: Electronic and Electrical
Unclassified
RB 1: Agro-Based
LT 1: Textile, Garment and Footwear
MT 1: Automotive
MT 3: Engineering
HT 2: Other
Per cent
Figure 12. Nepal’s export composition – Lall classification
Source: Author’s calculation based on UN Comtrade, SITC Rev. 2, 3-digit level, and usingthe classification of Lall (2000).
The major LT2 products are iron and steel, which are heavily dependent onimported
intermediate goods (as noted above). Meanwhile, the shares of engineering-related
medium-technology products and high-technology products are negligible. The increase in
the share of primary products (to 22 per cent in 2010) corresponds to the decrease in the
share of manufacturing in GDP in the new millennium. Data for 2010 shows that Nepal’s
export basket has the highest LT2 and MT2 shares and the lowest LT1 share among the
export baskets of the comparator countries (figure 13), excluding Afghanistan, Bhutan and
the Maldives. In terms of importance of primary products, Nepal is second only to Sri
Lanka. In a sign of increasing commodity dependence, while the share of primary products
more than doubled during the decade, the share of resource-based manufactures declined,
albeit slightly.

8/11/2019 Trade performance and competitiveness: Selected issues relevant for Asian developing economies
http://slidepdf.com/reader/full/trade-performance-and-competitiveness-selected-issues-relevant-for-asian-developing 39/215
19
C. Structural change and productivity growthin Nepal’s economy
When economic development and structural transformation takes place, overall
productivity growth occurs from within sectors (sectoral productivity growth), as well as from
shift in resources from low-productivity sectors to high-productivity sectors. In the case of
labour productivity, this implies that there are two components to productivity growth; this is
sectoral labour productivity growth and productivity growth resulting from reallocation of
labour across sectors, that is, changes in employment shares across sectors (McMillan and
Rodrik 2011). When employment share changes are positively correlated with productivitylevels, structural change contributes positively to productivity growth ( ibid.). In this section,
the McMillan and Rodrik (2011) approach is followed. Nepal’s labour productivity growth is
decomposed into these two components using sectoral value added and employment data.
Figure 13. Nepal in comparative perspective: Export composition
– Lall classification, 2010
Source: Author’s calculation based on UN Comtrade, SITC Rev. 2, 3-digit level, and usingthe classification of Lall (2000).
100
Per cent
90
80
70
60
50
40
30
20
10
0
A f g h a
n i s t a
n
B a n g l a d
e s h
B h u t
a n I n
d i a
C a m b o
d i a
S r i L a
n k a
M a l d
i v e s
P a k i s
t a n
N e p a
l
Primary Products (PP)
RB 2: Other
LT 2: Other Products
MT 2: Process
HT 1: Electronic and Electrical
Unclassified
RB 1: Agro-Based
LT 1: Textile, Garment and Footwear
MT 1: Automotive
MT 3: Engineering
HT 2: Other

8/11/2019 Trade performance and competitiveness: Selected issues relevant for Asian developing economies
http://slidepdf.com/reader/full/trade-performance-and-competitiveness-selected-issues-relevant-for-asian-developing 40/215
20
This is to assess the nature and direction of structural transformation in the economy as
a whole.14
In the nine-year period of 1999-2008, labour productivity grew by a compound
annual growth rate of 1.44 per cent. The contribution of the “within” component (productivity
growth within sectors) was 0.88 percentage point (61 per cent). This is while the
contribution of the structural change component (the productivity growth resulting from
reallocations of labour across sectors) was 0.57 percentage point (39 per cent) (table 2).
That the contribution of structural change is positive is in line with McMillan and Rodrik
(2011)’s finding – that the aggregate structural change has been growth-enhancing in Asia.
However, in Africa and Latin America it has been growth-reducing, although the period
considered is longer – 1990-2005.15
Table 2. Decomposition of Nepal’s labour productivity growth during1999-2008 (average annual compounded growth rate)
per cent
Labour productivity growth 1.44
Within component 0.88
Structural change component 0.57
Source: Author’s calculations.
The positive contribution of the structural change component is also reflected in the
positive correlation between the log of the ratio of sectoral productivity to total productivity
at the end of the period in consideration (2008), as well as the change in sectoral
employment shares during the period (1999-2008), as depicted in figure 14.
14 Labour productivity is real value added divided by people employed in the sector. The decomposition is
done with the formula used by McMillan and Rodrik (2011):
∆Y t =Σ θ
i, t – k ∆ y
i, t +Σ y
i, t ∆θ
i, t
where Y t amd y
i, t refer to economy-wide and sectoral labour productivity levels at time t, θ
i, tis the share of
employment in sector i in time t, and the ∆ operator denotes change in productivity or employment shares
between time t-k and t.
The choice of the period of analysis is 1999-2008, which is determined by the availability of reliable
employment data disaggregated by major sectors. The chosen period corresponds to two points in time (fiscal
years 1998/99 and 2007/08) when labour force surveys were conducted in Nepal (CBS 1999 and 2008).
Employment is that of “currently employed” labour force, comprising people aged 15 years and above (CBS
1999 and 2008). Nine sectors are considered (See Table 3).
Data on value added by sectors are drawn from the Economic Survey , Ministry of Finance, Government of
Nepal, various issues. As the real value added data for 1998/99 are available at 1994/95 prices, the real valueadded data for 2007/08 are available at 2000/01 prices. The latter are rebased to 1994/95 prices by deriving
the ratio between the price deflators for the two base years for each sector from the ratio of real value added
data for 2001/02, at 1994/95 and 2000/01 prices.
15 They do not include Nepal in their sample.
i = n i = n
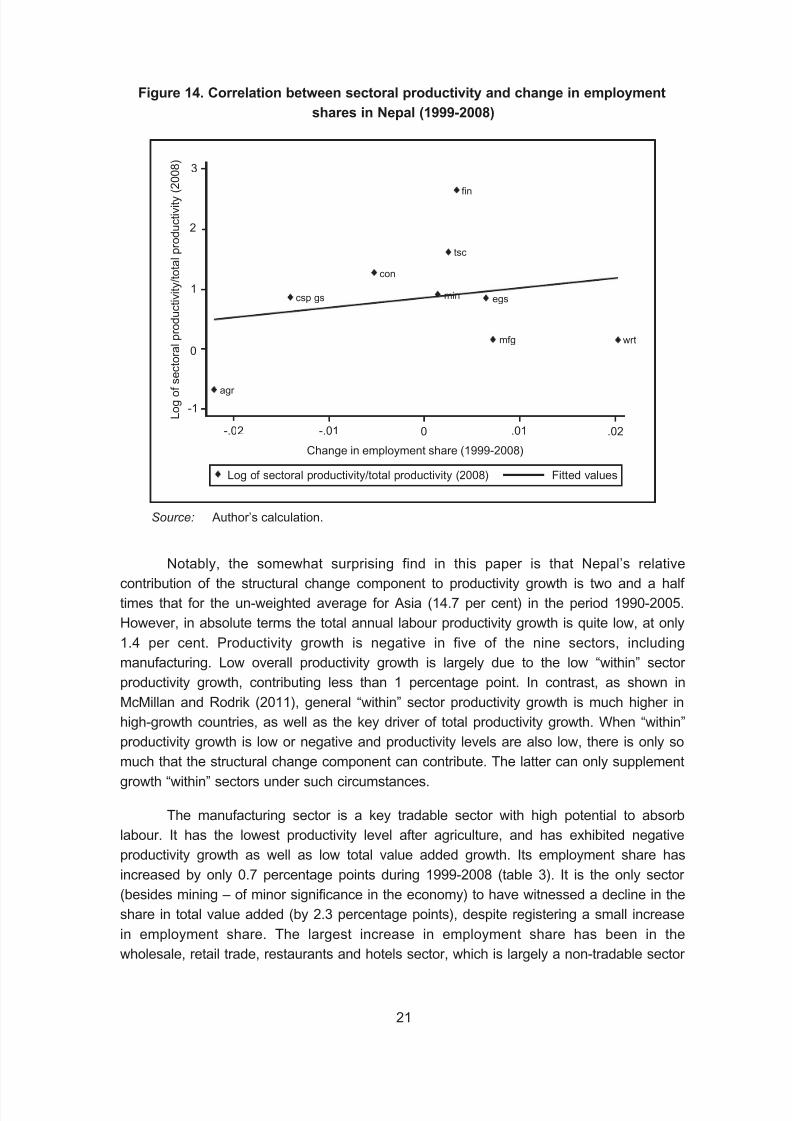
8/11/2019 Trade performance and competitiveness: Selected issues relevant for Asian developing economies
http://slidepdf.com/reader/full/trade-performance-and-competitiveness-selected-issues-relevant-for-asian-developing 41/215
21
Notably, the somewhat surprising find in this paper is that Nepal’s relative
contribution of the structural change component to productivity growth is two and a half
times that for the un-weighted average for Asia (14.7 per cent) in the period 1990-2005.
However, in absolute terms the total annual labour productivity growth is quite low, at only
1.4 per cent. Productivity growth is negative in five of the nine sectors, including
manufacturing. Low overall productivity growth is largely due to the low “within” sector
productivity growth, contributing less than 1 percentage point. In contrast, as shown in
McMillan and Rodrik (2011), general “within” sector productivity growth is much higher in
high-growth countries, as well as the key driver of total productivity growth. When “within”
productivity growth is low or negative and productivity levels are also low, there is only so
much that the structural change component can contribute. The latter can only supplement
growth “within” sectors under such circumstances.
The manufacturing sector is a key tradable sector with high potential to absorb
labour. It has the lowest productivity level after agriculture, and has exhibited negative
productivity growth as well as low total value added growth. Its employment share has
increased by only 0.7 percentage points during 1999-2008 (table 3). It is the only sector
(besides mining – of minor significance in the economy) to have witnessed a decline in the
share in total value added (by 2.3 percentage points), despite registering a small increase
in employment share. The largest increase in employment share has been in the
wholesale, retail trade, restaurants and hotels sector, which is largely a non-tradable sector
Figure 14. Correlation between sectoral productivity and change in employment
shares in Nepal (1999-2008)
Source: Author’s calculation.
Change in employment share (1999-2008)
Log of sectoral productivity/total productivity (2008) Fitted values
-.02 -.01 0 .01 .02
-1
0
1
2
3
L o g o f s e c t o r
a l p r o d u c t i v i t y / t o t a l p r o d u c t i v i t y ( 2 0 0 8 )
agr
csp gs
con
tsc
fin
egs
mfg
min
wrt

8/11/2019 Trade performance and competitiveness: Selected issues relevant for Asian developing economies
http://slidepdf.com/reader/full/trade-performance-and-competitiveness-selected-issues-relevant-for-asian-developing 42/215
22
(except for its tourism component).16 The community, personal, social and government
services sector – another non-tradable services sector – has recorded the highest
productivity growth rate. Agriculture, despite being the least productive sector, still employs
about 74 per cent of the labour force. The employment share of agriculture fell by only
2.2 percentage points.
Table 3. Sectoral employment, value added shares and their change, and
productivity level and growth (Nepal)
Employment Value Productivity Change in Change in Productivity
share added 2008 employment value growth (%,
2008 share (NPR, share added compound
2008 constant (1999- share annual,
1994/95 2008) (1999- 1999-
prices) 2008) 2008)
Agriculture, 0.74 0.37 15,231.19 -0.02 -0.01 1.47
forestry, fishing
Mining and 0.00 0.01 73,969.93 0.00 0.00 -9.24
quarrying
Manufacturing 0.07 0.08 35,018.69 0.01 -0.02 -2.74
Electricity, gas 0.01 0.02 69,840.27 0.01 0.01 -7.09
and water
Construction 0.03 0.11 106,421.83 -0.01 0.00 2.71
Wholesale, 0.08 0.09 35,137.95 0.02 -0.03 -4.99
retail trade, hotels
and restaurants
Transportation, 0.02 0.08 151,632.23 0.00 0.01 1.22
communication,
storage
Finance and 0.01 0.12 422,924.29 0.00 0.02 -1.94
real estate
Community, 0.05 0.12 71,379.13 -0.01 0.03 7.13
social, personal
and government
services
All sectors 30,270.74 1.44
Source: Author’s calculations.
Note: Zero values in shares and changes in shares denote extremely small values.
16 Sub-sectoral data on value added in this sector are not available for 1998/99. But they are available for
2007/08. In that year, wholesale and retail trade value added was 7.6 times higher than restaurants and hotels
value added.
8/11/2019 Trade performance and competitiveness: Selected issues relevant for Asian developing economies
http://slidepdf.com/reader/full/trade-performance-and-competitiveness-selected-issues-relevant-for-asian-developing 43/215
23
There is a massive under-utilization of labour. Conservative estimates puts the
labour under-utilization rate at 30 per cent in 2008, although the official unemployment rate
is just 2.1 per cent (CBS, 2008).17 Furthermore, the above analysis of labour reallocation
across sectors within the domestic economy, is based on the active labour force, hence
excludes Nepali nationals working abroad. Lack of productive employment opportunities inthe country is driving people to migrate abroad for work in increasing numbers. There has
been an annual outflow of over 200,000 people to destinations other than India in recent
years (or about 50 per cent of the annual addition to the labour force). The total number of
migrants abroad is at least 2 million, with a quarter of the adult male population working
abroad.18 Therefore, although reallocation of employed labour in the aggregate has been
from low-productivity to high-productivity sectors in the last decade, faster transfer of labour
from agriculture to more productive sectors within the economy is constrained by a weak
manufacturing sector. This sector is experiencing declining productivity, and whose
productivity level relative to total productivity is lower than for the world on average.
19
Here, the emphasis on manufacturing should not be interpreted as ignoring the
potential of the modern services sector, such as tourism. The emphasis is because:
i) manufacturing constitutes a tradable sector and global experience shows that it combines
relatively high productivity with the potential to absorb low-skilled labour from agriculture;
ii) there is empirical evidence that, unlike economies as a whole, manufacturing industries
exhibit unconditional convergence in labour productivity across economies (see Rodrik
2011a, 2011b); iii) development of tradable sectors is critical for reducing Nepal’s excessive
reliance on remittances for foreign exchange; iv) while tourism is a key tradable service
sector with high potential for employment generation and it should no doubt be developed,
arguably a sustainable growth strategy for a small open economy calls for robust expansion
of bothtradable services and manufacturing sectors; v) the poor performance of Nepal’s
manufacturing sector absolutely calls for urgent attention. Notably, it is relative to other
sectors of the Nepali economy, as well as relative to other countries/groups/regions (e.g.
South Asia, East Asia, LDCs). Productivity in manufacturing is even lower than that of the
community, social, personal and government services sector, which is the least productive
sector in the world (see McMillan and Rodrik, 2011). This low productivity and extremely
slow expansion of manufacturing suggests that constraints to growth have been especially
severe for the sector. The poor performance of the manufacturing sector is also reflected in
the poor performance of merchandise exports, in terms of both earnings and export basket
composition.
17 Comparable under-utilization data is not available for 1999.
18 Stock and flow employment data compiled from CBS (2008), CBS (2011); CBS (2012), Economic Survey ,Government of Nepal, Ministry of Finance, various issues and “Nepal Migration Survey”. Preliminary findings
are presented by the World Bank, August 2011.
19 The comparison is with the average global figures for manufacturing productivity and total productivity for
2005 presented by McMillan and Rodrik (2011).
8/11/2019 Trade performance and competitiveness: Selected issues relevant for Asian developing economies
http://slidepdf.com/reader/full/trade-performance-and-competitiveness-selected-issues-relevant-for-asian-developing 44/215
24
D. Nepal’s trade and industrial policies in the contextof structural transformation
Nepal introduced a new Trade Policy in 2009, replacing the Trade Policy 1992. The
main objective of Trade Policy 2009 is to support economic development and povertyalleviation initiatives through “the enhanced contribution of trade sector to the national
economy” (GoN, 2009). Its specific objectives are:
• To create a conducive environment for the promotion of trade and business in
order to make it competitive at the international level
• To minimize the trade deficit by increasing exports of value-added products
through linkages between import and export trade
• To increase income and employment opportuni ties by increasing
competitiveness of trade in goods and services, and using that as a means of
poverty alleviation
• To clearly establish the interrelationship between internal and foreign trade,
and develop them as complementary and supplementary to each other
Promoting exports, in order to facilitate structural transformation of the economy, is
not an explicit aim of the trade policy. The emphasis on exports of “value-added” products
is motivated more by the need to reduce the trade deficit. However, fostering of backward-
forward linkages, product diversification, and domestic value addition and processing do
feature in strategies, and specific and working policies. This includes those at the sectoral/
product level.
Trade Policy 2009 aims to promote the exports of both goods and services.
However, it discusses goods trade elaborately, envisaging the promotion and development
of select goods, and classifying them into “Special Focus Area” and “Special Thrust Area”.
Whereas, Trade Policy 1992 did not target any products, as such. In the first group are the
labour-intensive goods already established in export markets, such as readymade
garments, woolen carpets and handicraft goods. The second group includes “highly
potential export items” (GoN, 2009: p. 29), mostly agricultural and forest-based products.The rationale for promoting exports of agricultural and forest-based products is based on
the Agricultural Perspective Plan and Periodic Plan accepting agriculture as a priority sector
of the economy. Recognition of the important role of agricultural development in poverty
reduction is also part of this rationale. Table 4 lists the identified goods. The “Special Focus
Area” has four goods, while the “Special Thrust Area” has 15 goods. There is some overlap
between the Special Focus Area and the Special Thrust Area.
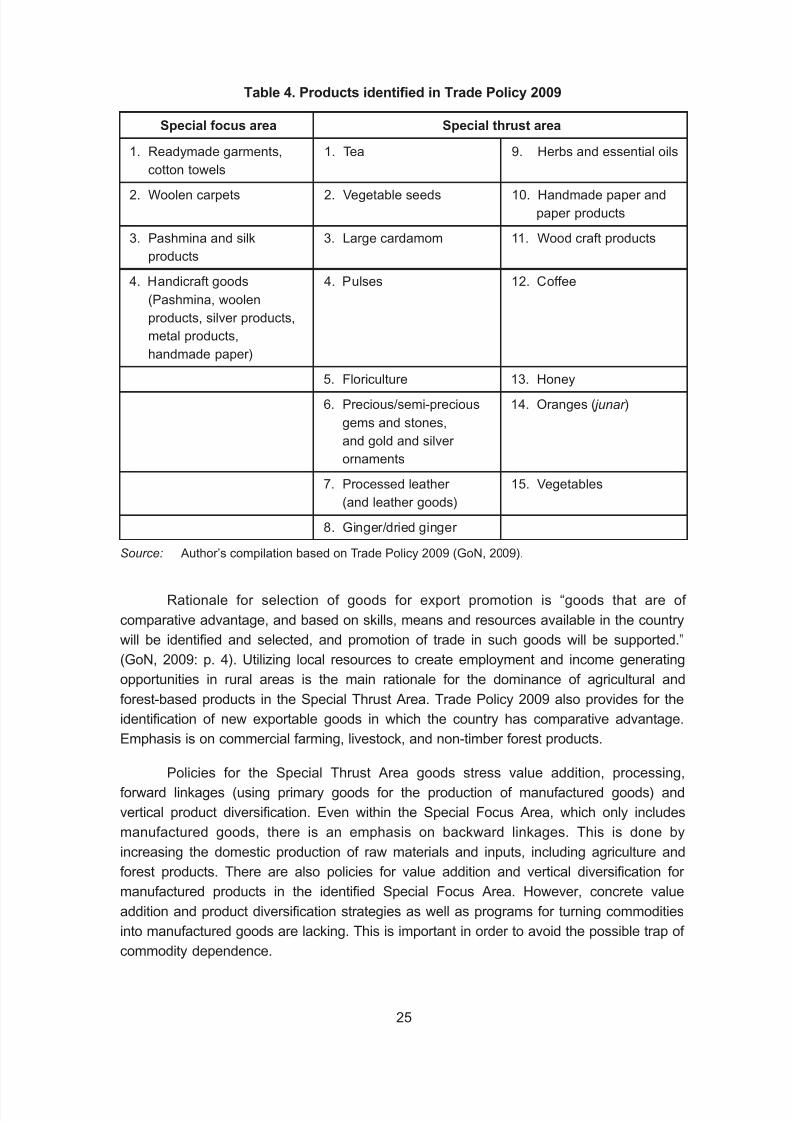
8/11/2019 Trade performance and competitiveness: Selected issues relevant for Asian developing economies
http://slidepdf.com/reader/full/trade-performance-and-competitiveness-selected-issues-relevant-for-asian-developing 45/215
25
Rationale for selection of goods for export promotion is “goods that are of
comparative advantage, and based on skills, means and resources available in the country
will be identified and selected, and promotion of trade in such goods will be supported.”
(GoN, 2009: p. 4). Utilizing local resources to create employment and income generating
opportunities in rural areas is the main rationale for the dominance of agricultural and
forest-based products in the Special Thrust Area. Trade Policy 2009 also provides for the
identification of new exportable goods in which the country has comparative advantage.
Emphasis is on commercial farming, livestock, and non-timber forest products.
Policies for the Special Thrust Area goods stress value addition, processing,
forward linkages (using primary goods for the production of manufactured goods) and
vertical product diversification. Even within the Special Focus Area, which only includes
manufactured goods, there is an emphasis on backward linkages. This is done by
increasing the domestic production of raw materials and inputs, including agriculture and
forest products. There are also policies for value addition and vertical diversification for
manufactured products in the identified Special Focus Area. However, concrete valueaddition and product diversification strategies as well as programs for turning commodities
into manufactured goods are lacking. This is important in order to avoid the possible trap of
commodity dependence.
Table 4. Products identified in Trade Policy 2009
Special focus area Special thrust area
1. Readymade garments, 1. Tea 9. Herbs and essential oils
cotton towels
2. Woolen carpets 2. Vegetable seeds 10. Handmade paper and
paper products
3. Pashmina and silk 3. Large cardamom 11. Wood craft products
products
4. Handicraft goods 4. Pulses 12. Coffee
(Pashmina, woolen
products, silver products,
metal products,
handmade paper)
5. Floriculture 13. Honey
6. Precious/semi-precious 14. Oranges ( junar )
gems and stones,
and gold and silver
ornaments
7. Processed leather 15. Vegetables
(and leather goods)
8. Ginger/dried ginger Source: Author’s compilation based on Trade Policy 2009 (GoN, 2009).
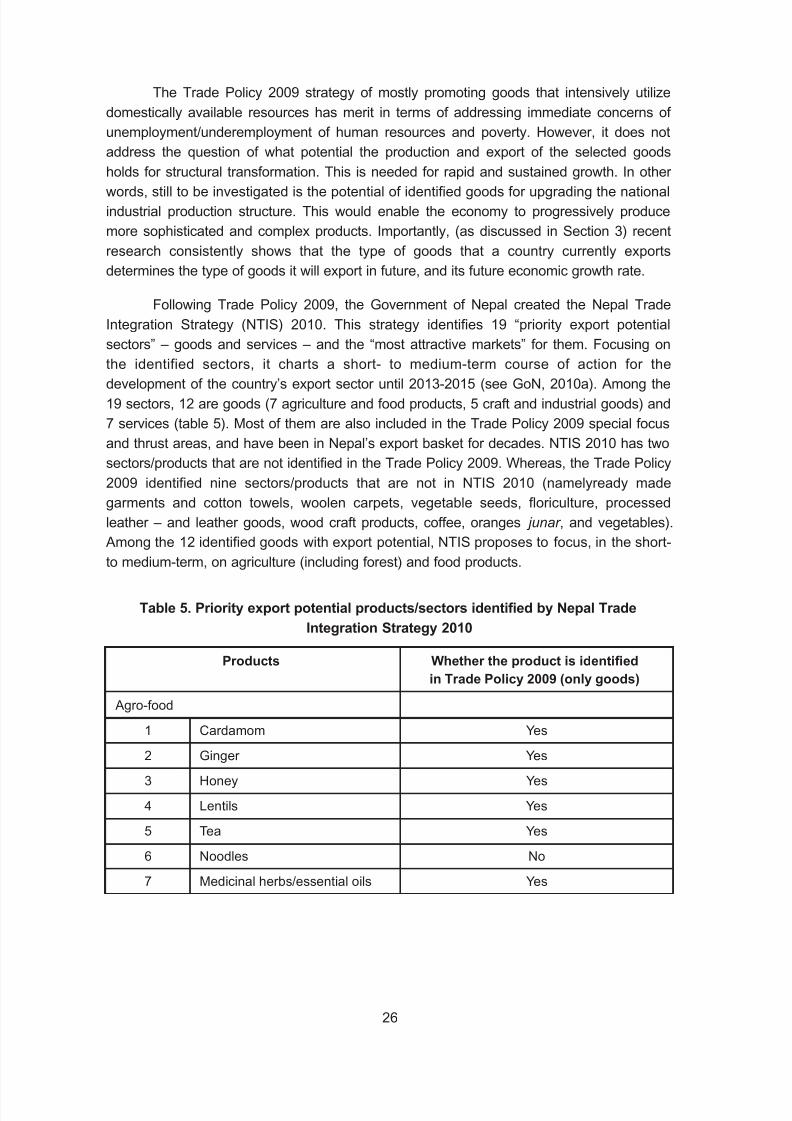
8/11/2019 Trade performance and competitiveness: Selected issues relevant for Asian developing economies
http://slidepdf.com/reader/full/trade-performance-and-competitiveness-selected-issues-relevant-for-asian-developing 46/215
26
The Trade Policy 2009 strategy of mostly promoting goods that intensively utilize
domestically available resources has merit in terms of addressing immediate concerns of
unemployment/underemployment of human resources and poverty. However, it does not
address the question of what potential the production and export of the selected goods
holds for structural transformation. This is needed for rapid and sustained growth. In other words, still to be investigated is the potential of identified goods for upgrading the national
industrial production structure. This would enable the economy to progressively produce
more sophisticated and complex products. Importantly, (as discussed in Section 3) recent
research consistently shows that the type of goods that a country currently exports
determines the type of goods it will export in future, and its future economic growth rate.
Following Trade Policy 2009, the Government of Nepal created the Nepal Trade
Integration Strategy (NTIS) 2010. This strategy identifies 19 “priority export potential
sectors” – goods and services – and the “most attractive markets” for them. Focusing on
the identified sectors, it charts a short- to medium-term course of action for the
development of the country’s export sector until 2013-2015 (see GoN, 2010a). Among the
19 sectors, 12 are goods (7 agriculture and food products, 5 craft and industrial goods) and
7 services (table 5). Most of them are also included in the Trade Policy 2009 special focus
and thrust areas, and have been in Nepal’s export basket for decades. NTIS 2010 has two
sectors/products that are not identified in the Trade Policy 2009. Whereas, the Trade Policy
2009 identified nine sectors/products that are not in NTIS 2010 (namelyready made
garments and cotton towels, woolen carpets, vegetable seeds, floriculture, processed
leather – and leather goods, wood craft products, coffee, oranges junar , and vegetables).
Among the 12 identified goods with export potential, NTIS proposes to focus, in the short-
to medium-term, on agriculture (including forest) and food products.
Table 5. Priority export potential products/sectors identified by Nepal Trade
Integration Strategy 2010
Products Whether the product is identified
in Trade Policy 2009 (only goods)
Agro-food1 Cardamom Yes
2 Ginger Yes
3 Honey Yes
4 Lentils Yes
5 Tea Yes
6 Noodles No
7 Medicinal herbs/essential oils Yes

8/11/2019 Trade performance and competitiveness: Selected issues relevant for Asian developing economies
http://slidepdf.com/reader/full/trade-performance-and-competitiveness-selected-issues-relevant-for-asian-developing 47/215
27
The 19 goods and services sectors are identified based on an initial assessment of
export performance and some extensive discussions with Nepalese business community
and government officials. The sectors’ aim is diversifying exports product-wise and
destination-wise, moving up the value chain and ensuring that exports have a robust,
positive impact on inclusive growth (GoN, 2010a: p. 10). Most of the selected sectors are
identified as having medium or high export potential, or medium or high socio-economic
impact, or both (GoN, 2010a).
However, it must be noted that the assessment (using a number of indexes) of the
export potential of the 19 goods was done ex post , i.e. after they were identified. Thus, theexport potential of the identified goods or services is to be interpreted regarding one
another, not with respect to all goods or services. The factors, considered in the
construction of the export potential index used in NTIS 2010, are the current export
Craft and industrial goods
8 Handmade paper Yes
9 Silver jewelry Yes
10 Iron and steel No
11 Pashmina Yes
12 Wool products Yes
Services
13 Tourism
14 Labour services
15 IT and BPO services
16 Health services
17 Education
18 Engineering
19 Hydro-electricity
Other potential export sectors
20 Transit trade services
21 Sugar No
22 Cement No
23 Dairy products No
24 Transformers No
Source: Author’s compilation based on GoN (2009) and GoN (2010a).
Table 5. (continued)
Products Whether the product is identified
in Trade Policy 2009 (only goods)

8/11/2019 Trade performance and competitiveness: Selected issues relevant for Asian developing economies
http://slidepdf.com/reader/full/trade-performance-and-competitiveness-selected-issues-relevant-for-asian-developing 48/215
28
performance of Nepal in a given product, current world demand and market access
conditions for the product, as well as domestic supply capacity. This last factor includes
quality of products, the productivity and cost of production factors, and the efficiency of
supporting domestic industries.
Likewise, the potential socio-economic impact is measured by a socio-economic
impact index. This is a composite indicator of full-time equivalent employment, participation
of women in the sector, impact on poor regions, and impact on skill development. The
resource intensity (defined as dependence on electricity and water) of most of these
sectors was found to be medium to low. This implies that the promotion of these sectors will
not be constrained by two current critical resource bottlenecks (GoN, 2010a). Together, the
19 sectors cover about 30 per cent of goods exports in 2008, and the vast majority of
service exports – broadly defined to include exports of labour services (GoN, 2010a). NTIS
2010 also identifies five “other” sectors (four goods and one service) with export potential
(table 5).
NTIS 2010 shows some recognition of the need for enhancing value addition,
processing and diversification of the identified products, including agro-food products that
are accorded high-priority. However, the methodology employed for product/sector
identification does not explicitly take into account the possibilities the selected products
hold (or do not hold) for future product diversification and enhanced export sophistication.
Trade is identified as one of the six pillars of development strategy for the
realization of the goals (poverty reduction) and objectives of the Government of Nepal’sThree-Year Development Plan 2010/11-2012/13 (GoN, 2011). This is the first period
development plan to focus on mainstreaming trade in order to achieve development
objectives. Export trade is one of the priority sectors in the Plan. Guided by the Trade
Policy, the Plan envisages reducing trade deficits by developing exportable goods and
services to having comparative advantage, as well as how best to utilize the opportunities
created by the bilateral, regional and multilateral trading systems. The objectives of the
Plan, with respect to trade, are to enhance income and employment opportunities by
promoting domestic and international trade; to derive maximum benefits from goods and
services trade by identifying comparatively new beneficial goods and services. This, withthe participation of the private sector and the government, is to make price and quality
more competitive in internal and external markets; to alleviate poverty by promoting exports
of goods using local raw materials, resources and skills; more so, to expand the benefits
from trade to rural areas (GoN, 2011).
One of its working policies is identification, development, promotion, marketing, and
establishment of value chains of new exportable goods and services. Another working
policy is to implement the NTIS 2010. The strategies include developing trade as an
important pillar of the national economy. This means increasing value addition in exportable
products, value chain development and identification, and promotion of new export
potential goods (both horizontal and vertical diversification). Also, in the strategies is the
mobilization of foreign aid to increase export competitiveness, and provide incentives,
facilities and concessions for exportable products. At the programme level, the Plan
8/11/2019 Trade performance and competitiveness: Selected issues relevant for Asian developing economies
http://slidepdf.com/reader/full/trade-performance-and-competitiveness-selected-issues-relevant-for-asian-developing 49/215
29
emphasizes the development of exportable agriculture and forest-based products. Given
that the Plan is guided by the Trade Policy and intends to implement NTIS, the products
identified in the policy and the strategy is expected to be targeted during the Plan’s
implementation.
The Government introduced a new industrial policy in 2010. This is in response to
the poor performance of the industrial sector following the unsatisfactory implementation of
the Industrial Policy 1992. It is also due to new opportunities and challenges on the
industrial front (GoN, 2010b: 1-3). The long-term goal of the Industrial Policy 2010 is to
contribute to poverty alleviation through sustainable and broad-based industrial
development. A major objective is to increase the national income and employment. This
includes increasing exports of industrial goods through expansion of quality and
competitive industrial production, and rise in industrial productivity. The policy also aims to
increase the contribution of the industrial sector to national and regional development
through the mobilization of local resources, raw materials and skills. Its strategies, with
respect to the industrial export sector, emphasizes increasing domestic value addition in
exportable goods, fostering domestic forward and backward linkages, and development of
industries (including agro-based) utilizing domestically available raw materials .
The Industrial Policy 2010 provides facilities and concessions (including in taxes) to
export-oriented industries, among others. It also provides for additional facilities and
concessions, (including in taxes) to export-oriented industries located in special economic
zones – these are yet to be established. The Industrial Policy 2010 declares 10 industries
as priority industries entitled to additional facilities and incentives. The list covers a varietyof goods and services (e.g. particular tourism-related sectors, computer software), as well
as non-good/service-specific industries (e.g. export-oriented industry and traditional cottage
industry). Notably, the agriculture and forestry-based industry (listed as a priority industry)
includes both farming/cultivation (agriculture) and processing/manufacturing. The inclusion
of agriculture as an industry may be due to the critical importance of its production in
raw material requirements of agriculture and forestry-based industries.20 Relatively
sophisticated (non-services)21 priority industries include clinker and cement production
based on domestic limestone; pulp and paper production; chemical fertilizer production
(other than simple mixing); powder milk production; pharmaceutical production; productionof fuel-saving equipment; production of pollution-reducing equipment; production of
equipment and gadgets used by the physically challenged; production of agriculture tools
and equipment and industrial machinery; and production of electric vehicles. Among these,
only three products (in broad terms) feature in the trade policy and/or NTIS. Paper has
been identified for export promotion in both the trade policy and NTIS, and cement and
dairy products (which included powder milk) are among the “other” potential export sectors
in NTIS. Changes to the Industrial Enterprises Act are needed to incorporate some of the
provisions in Industrial Policy 2010.
20 A related issue is that the definition of “industry” by the policy is very broad as such, encompassing even
real estate business.
21 We consider energy production and distribution, including hydropower production and distribution, as
a service industry.

8/11/2019 Trade performance and competitiveness: Selected issues relevant for Asian developing economies
http://slidepdf.com/reader/full/trade-performance-and-competitiveness-selected-issues-relevant-for-asian-developing 50/215
30
As noted in the previous section, there is a close link between the sophistication,
complexity and diversity of products produced by an economy, the structural transformation
and growth paths of the economy. Sophistication, complexity and diversity of an economy
are reflected in its export basket. The degree of export-orientation varies across industries,
as demand and competition conditions for different products differ in the domestic marketand foreign markets. The relatively sophisticated manufacturing products accorded priority
by the Industrial Policy may not be targeted for exports in the immediate future. But the fact
that they are accorded priority may reflect an aim to create and/or enhance the capabilities
of the economy to produce such products, at least for the domestic market. An economy’s
ability to produce more and more diverse and complex/sophisticated products is likely to
produce a similar effect in its export basket. Equally, increasing the diversity and
complexity/sophistication of exports is also likely to help make the industrial structure of the
economy more diverse and complex/sophisticated, as the exportable products are
produced within the economy. The potential synergy between the industrial policy and thetrade policy/NTIS for industrial upgrading and structural transformation remains to be
investigated.
Neither Trade Policy 2009 nor NTIS 2010 take into account the fact that all products
do not hold the same prospects for structural transformation and economic growth. In which
part of a product space a country’s exportable products are concentrated and what
products (upscale or downscale) the country exports also matter for future rates of income
growth. Given that the Government of Nepal has taken trade as an engine of growth in its
Plan document, it is important that this structural transformation dimension is brought into
trade policy making and implementation.
E. Methodology for assessing structural transformationthrough the “export” lens
1. Methods, tools and measures
Methods, tools and measures developed in the empirical literature discussion on
structural transformation, are employed to describe the pattern of evolution of Nepal’smerchandise exports. These will then assess the structural transformation-effecting
potential of the goods identified for export promotion in Nepal’s Trade Policy 2009 and the
NTIS 2010 (Hausmann et al., 2006, Hidalgo et al., 2007; Hausmann and Klinger, 2006,
2007; Felipe et al., 2010c; and Abdon and Felipe, 2011).
Measures for analysis of the following three variables are the level of productivity/
sophistication associated with a particular product; the level of sophistication of the export
basket of a country (or a set of products exported/targeted for exports by a country); the
inter-relatedness between and among products (or how close a product is to other products).
We use the measure of productivity associated with a product (PRODY) developed
by Hausmann et al. (2006). PRODY is a weighted average of the GDP per capita of the

8/11/2019 Trade performance and competitiveness: Selected issues relevant for Asian developing economies
http://slidepdf.com/reader/full/trade-performance-and-competitiveness-selected-issues-relevant-for-asian-developing 51/215
31
countries that export the product. The weights are taken as the ratio of the revealed
comparative advantage (RCA) of each country in the product to the sum of the RCAs of the
all countries in the product:22
PRODYi = Σ j Yj , where xij is exports of country j of product i, Xj is total exports of
country j, and Yj is GDP per capita (PPP$) of country j.
We use the measure of sophistication of export basket of a country (EXPY),
developed by Hausmann et al. (2006). EXPY is the weighted average of the PRODY of
products exported by a country, with the weights being the share of the product in the
country’s total exports:
EXPYj =Σ ( ) PRODYi
We use PRODY and EXPY to measure the sophistication/complexity of products/
export basket/economy. These are used instead of the better measures of complexity
based on the Methods of Reflection developed by Hidalgo and Hausmann (2009), that only
considers network information and does not use income information. This is because
PRODY and EXPY are easier to construct and, more importantly, there is a strong
correspondence between PRODY and EXPY with their network counterparts as discovered
by Hidalgo (2009). This suggests that “most of the information contained in PRODY and
EXPY comes from the structure of the network connecting countries to the products they
export, rather than from income” (Hidalgo, 2009: p. 7). Thus, the power of PRODY andEXPY in explaining growth and structural transformation (e.g. Hausmann et al., 2006)
“comes from the information on the diversification of countries and on the ubiquity of
products” (Hidalgo, 2009: p. 8).
We use the outcome-based measure of proximity between two products (øij)
developed by Hausmann and Klinger (2006, 2007) and Hidalgo et al. (2007).
Mathematically, the proximity between two products i and j is defined as:
Øij = min {P (RCAi|RCAj), P (RCAj|RCAi)}.
Proximity between the two products i and j is, therefore, the minimum conditional
probabilities that a country exporting one good with comparative advantage (RCA>1) also
exports the other with comparative advantage.
These three basic measures are used to calculate four other measures: Path,
Density, Open Forest and Strategic Value.
xij / xj
Σ j xij / xj
i
xi
Xi
22 The RCA measure used by Hausmann et al. (2006) is different from the more popular RCA index of
Balassa (1965).
8/11/2019 Trade performance and competitiveness: Selected issues relevant for Asian developing economies
http://slidepdf.com/reader/full/trade-performance-and-competitiveness-selected-issues-relevant-for-asian-developing 52/215
32
The Path associated with a product (i) is the measure of the inter-connectedness of
that product with all other products. It is calculated as: Path i = Σ j Øij (Hausmann and
Klinger, 2006). It indicates the potential for future export diversification associated with
product i.
Density associated with a product (i), developed by Hausmann and Klinger (2006,
2007), is a measure of the ease with which a country can deploy its existing capabilities to
produce it, that is, proximity of the product to the current export basket of the country.
Density measures the degree to which a country’s current exports “surround” the particular
product under consideration. It is the sum of all proximities between the product and all
products in which the country is present (has comparative advantage), scaled by the sum
of all proximities leading to the product. It varies from 0 to 1, with higher values indicating
that the country is more likely to effectively export that product in the future.
Mathematically, densityi = where xik = 1 if the country is present in the product,0 otherwise.
Open Forest represents the “option value” of a country’s unexploited opportunities,
an option set for future structural transformation (Hausmann and Klinger, 2006 and 2007). It
is the distance-weighted value of all the products a country could potentially produce,
where the distance is the relative distance of each product not currently effectively exported
to the current export basket. This is calculated as:
open forest =
Σ j (1 – xj ) PRODYj where Øij is proximity and
x i , x j = { 0 }; is the density
The Strategic Value of a product is a proxy for the spillovers derived from acquiring
comparative advantage in that product (Felipe et al., 2010c). It is the increase in the Open
Forest assuming that the country gains comparative advantage in that product (ibid.). The
Strategic Value of a product j is calculated as:
Vj = Σi (1 – xi ) PRODYi , for all i, i≠ j, xi=1 if RCA>1
Strictly speaking, the concept of Strategic Value pertains to products in the Open
Forest only, that is, those products not currently exported with comparative advantage.
However, we calculate Strategic Values of all identified products, even if they happen to not
be in the Open Forest (i.e. they are already being exported with comparative advantage in
the RCA>1 sense). The reason is provided later in the paper. In such calculations too, the
formula remains the same.
We also use the classification of products employed by Abdon and Felipe (2011), in
terms of distance from the current export basket. Abdon and Felipe (2011) describe
products as “nearby” if the distance (density) is less than 0.5 standard deviations from the
Σk øik xik Σk øik
Σi øij xi
Σ øij
if RCA > 11
otherwise
Σi øij xi
Σ øij
øij
Σ j øij
8/11/2019 Trade performance and competitiveness: Selected issues relevant for Asian developing economies
http://slidepdf.com/reader/full/trade-performance-and-competitiveness-selected-issues-relevant-for-asian-developing 53/215
33
mean distance, “middle” if the distance is within ± .5 standard deviations from the mean
distance, and “far away” if the distance is more than 0.5 standard deviations from the mean
distance.
We also use the classification of products as high-path/PRODY, mid-path/PRODY
or low-path/PRODY depending on whether they belong to the first, second or third tercile of
path/PRODY, as used by Felipe et al. (2010c).
Using these methods, tools and measures, we first describe the evolution of Nepal’s
exports in the product space during the 15-year period 1995-2010. Three points in time are
considered – 1995, 2003 and 2010. Also described is how the sophistication of the
country’s export basket and the Open Forest associated with its export basket (indicating
the prospects for structural transformation) has evolved over the period. This sets the
context forassessing the potential held by the products identified by Trade Policy 2009 and
NTIS 2010 for future structural transformation.
2. Data
We use the values of PRODY and proximity (Øij) calculated by Hidalgo et al.
(2007). They are the two basic measures required for analysis, as well as being the basis
for calculation of EXPY, Open Forest, Paths and Density. The level of disaggregation of
products is the four-digit Standard International Trade Classification (SITC) Revision 2.
Their dataset covers 775 products. Proximity values are missing for about 5 per cent of the
possible product pairs. We consider them to be zero, that is, the products are unrelated.
The fact that the PRODY used by Hidalgo et al. (2007) is in constant 2000 PPP$
will not affect the study’s analysis when we compare values between cross-sectional units
(countries), or over time for a cross-sectional unit, or between cross-sectional units over
time. The proximity calculated by Hidalgo et al. (2007) is an average of the proximity for the
three years 1998-2000. The relatively dated data of proximity (and also PRODY) will not
substantially alter our results because Hidalgo (2009) finds that during the 42-year period
1963-2005 the structure of the product space (connectivity among products) remained
relatively stable. Also, the level of product sophistication remained relatively stable during
the 20-year period 1985-2005.
Although some papers have calculated PRODY and proximity values with more
recent data, and/or using a greater level of product disaggregation (for example, Felipe
et al., 2010a, 2010b, Abdon et al., 2010 and Hidalgo, 2011), we use the values calculated
by Hidalgo et al. (2007) because they are publicly available, while others are not.
The products identified in NTIS have been specified in Harmonized System (2002)
codes at the six-digit level. We convert them into SITC Rev. 2 4-digit classification. The
relevant SITC codes are allocated for the products identified in Trade Policy 2009 as theyare not specified in terms of international classification. Use of SITC classification instead
of HS classification entails a loss in product diversity. However, this is unavoidable given
the availability of PRODY and proximity values only at the SITC 4-digit level. Code

8/11/2019 Trade performance and competitiveness: Selected issues relevant for Asian developing economies
http://slidepdf.com/reader/full/trade-performance-and-competitiveness-selected-issues-relevant-for-asian-developing 54/215
34
conversion is done using the concordance table available at World Integrated Trade
Solution (WITS).
Export data is taken from UNCOMTRADE, via WITS. Direct export data for Nepal
are available for every year in the period 1982-2000, after which data is only available for
2003, 2009 and 2010. The number of SITC 4-digit products exported by Nepal fluctuates
sharply during 1982-1995, with apparently inexplicable spikes every three years or so. We
take 1995 as the initial year when analysing the evolution of the export basket in detail.
3. Limitations
Our method and approach suffer from a number of limitations. The PRODY and
EXPY measures, based on gross trade flow data, do not fully take into account the type of
production activities that occur in the exporting country. In the presence of international
production fragmentation and intermediate good trade, a country’s exports does notnecessarily reflect the embodied technology and relative endowments that have gone into
the country’s domestic production activities (Aashe and Gangnes, 2007). Further, these
measures only consider across-product sophistication. It does not consider “within-product”
sophistication or product quality (see Xu, 2010).
The approach is based on exports, and does not consider production and industrial
capabilities not associated with exports, but which are nonetheless important. Only
merchandise exports are considered. Service exports, which are globally faster growing
than goods exports (and which are important for Nepal), are not considered because dataconstraints do not make services amenable to product space analysis.
In our discussion, we acknowledge these and other limitations. We emphasize,
where relevant, the need to interpret and analyse the results carefully, taking into account
the country-specific peculiarities and needs.
F. Analysis of export baskets and identified products
1. Analysis of export baskets over time
Using the PRODY values (2000 PPP$) calculated by Hidalgo et al. (2007), for
products under SITC Rev. 2 at the 4-digit level, we calculate and compare the
sophistication of Nepal’s export basket and that of the comparator countries.23
23 PRODY values calculated by Hidalgo et al. (2007) are missing for some products exported by the
countries under consideration. Products with missing PRODY account for less than 1.2 per cent of exports of
Pakistan, about 2 per cent of exports of Sri Lanka, about 5.4 per cent of exports of Cambodia, and negligible
percentage of the exports of other countries. While calculating EXPY, the weights are taken as in the originalformula (shares of products in total exports). This approach does not change EXPY values drastically, although
EXPY for Cambodia it is 10,317.64 instead of 9,675.14 when the exports of products with missing PRODY are
deducted from the total export figures while calculating the weight shares. But while calculating the distribution
across PRODY groups and across countries (Figure 16), a separate group for products with missing PRODY is
also created.
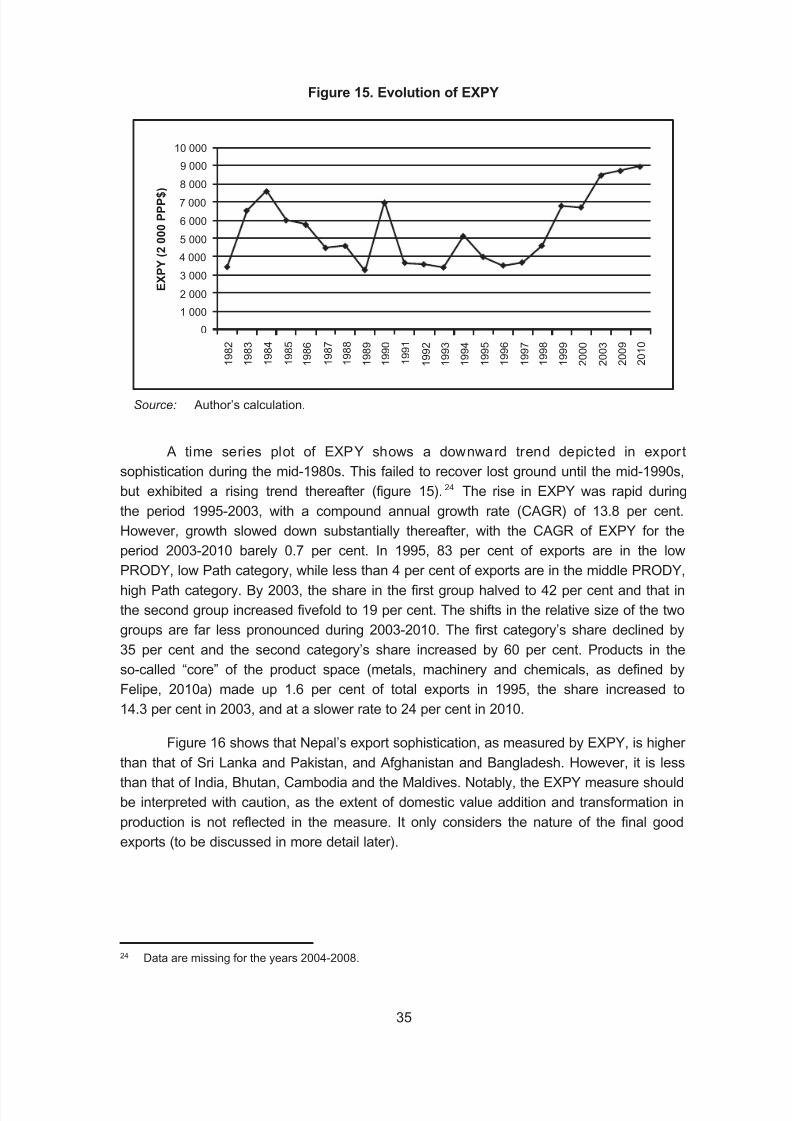
8/11/2019 Trade performance and competitiveness: Selected issues relevant for Asian developing economies
http://slidepdf.com/reader/full/trade-performance-and-competitiveness-selected-issues-relevant-for-asian-developing 55/215
35
A time series plot of EXPY shows a downward trend depicted in export
sophistication during the mid-1980s. This failed to recover lost ground until the mid-1990s,
but exhibited a rising trend thereafter (figure 15).24 The rise in EXPY was rapid during
the period 1995-2003, with a compound annual growth rate (CAGR) of 13.8 per cent.
However, growth slowed down substantially thereafter, with the CAGR of EXPY for theperiod 2003-2010 barely 0.7 per cent. In 1995, 83 per cent of exports are in the low
PRODY, low Path category, while less than 4 per cent of exports are in the middle PRODY,
high Path category. By 2003, the share in the first group halved to 42 per cent and that in
the second group increased fivefold to 19 per cent. The shifts in the relative size of the two
groups are far less pronounced during 2003-2010. The first category’s share declined by
35 per cent and the second category’s share increased by 60 per cent. Products in the
so-called “core” of the product space (metals, machinery and chemicals, as defined by
Felipe, 2010a) made up 1.6 per cent of total exports in 1995, the share increased to
14.3 per cent in 2003, and at a slower rate to 24 per cent in 2010.
Figure 16 shows that Nepal’s export sophistication, as measured by EXPY, is higher
than that of Sri Lanka and Pakistan, and Afghanistan and Bangladesh. However, it is less
than that of India, Bhutan, Cambodia and the Maldives. Notably, the EXPY measure should
be interpreted with caution, as the extent of domestic value addition and transformation in
production is not reflected in the measure. It only considers the nature of the final good
exports (to be discussed in more detail later).
Figure 15. Evolution of EXPY
Source: Author’s calculation.
24 Data are missing for the years 2004-2008.
10 000
9 000
8 000
7 000
6 000
5 000
4 000
3 000
2 000
1 000
0
1 9 8 2
1 9 8 3
1 9
8 4
1 9
8 5
1 9 8 6
1 9
8 7
1 9
8 8
1 9 8 9
1 9 9 0
1 9
9 1
1 9 9 2
1 9 9 3
1 9 9 4
1 9 9 5
1 9 9 6
1 9 9 7
1 9 9 8
1 9 9 9
2 0 0 0
2 0 0 3
2 0 0 9
2 0
1 0
E X P Y ( 2 0 0 0 P P P $ )
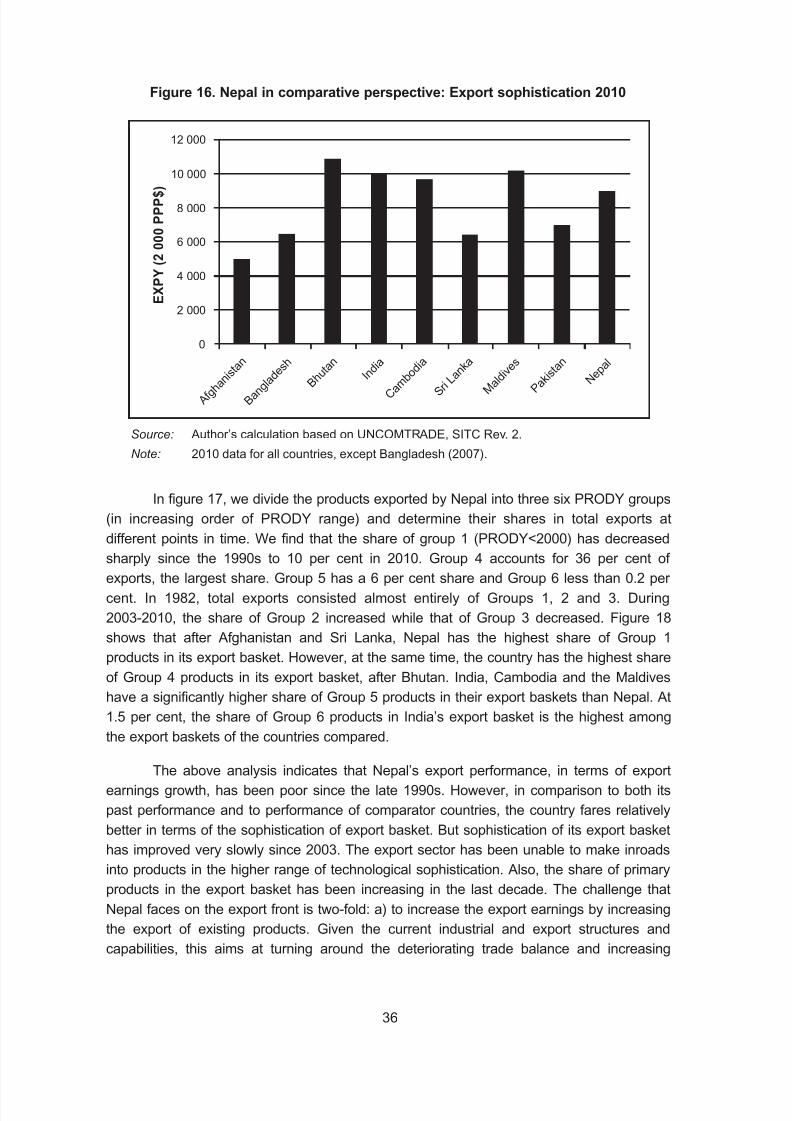
8/11/2019 Trade performance and competitiveness: Selected issues relevant for Asian developing economies
http://slidepdf.com/reader/full/trade-performance-and-competitiveness-selected-issues-relevant-for-asian-developing 56/215
36
Figure 16. Nepal in comparative perspective: Export sophistication 2010
Source: Author’s calculation based on UNCOMTRADE, SITC Rev. 2.
Note: 2010 data for all countries, except Bangladesh (2007).
In figure 17, we divide the products exported by Nepal into three six PRODY groups
(in increasing order of PRODY range) and determine their shares in total exports at
different points in time. We find that the share of group 1 (PRODY<2000) has decreased
sharply since the 1990s to 10 per cent in 2010. Group 4 accounts for 36 per cent of
exports, the largest share. Group 5 has a 6 per cent share and Group 6 less than 0.2 per
cent. In 1982, total exports consisted almost entirely of Groups 1, 2 and 3. During
2003-2010, the share of Group 2 increased while that of Group 3 decreased. Figure 18
shows that after Afghanistan and Sri Lanka, Nepal has the highest share of Group 1
products in its export basket. However, at the same time, the country has the highest share
of Group 4 products in its export basket, after Bhutan. India, Cambodia and the Maldives
have a significantly higher share of Group 5 products in their export baskets than Nepal. At
1.5 per cent, the share of Group 6 products in India’s export basket is the highest among
the export baskets of the countries compared.
The above analysis indicates that Nepal’s export performance, in terms of export
earnings growth, has been poor since the late 1990s. However, in comparison to both its
past performance and to performance of comparator countries, the country fares relatively
better in terms of the sophistication of export basket. But sophistication of its export basket
has improved very slowly since 2003. The export sector has been unable to make inroads
into products in the higher range of technological sophistication. Also, the share of primary
products in the export basket has been increasing in the last decade. The challenge thatNepal faces on the export front is two-fold: a) to increase the export earnings by increasing
the export of existing products. Given the current industrial and export structures and
capabilities, this aims at turning around the deteriorating trade balance and increasing
12 000
10 000
8 000
6 000
4 000
2 000
0
A f g h a
n i s t a n
B a n g l a d
e s h
B h u t
a n I n
d i a
C a m b o
d i a
S r i L a
n k a
M a l d
i v e s
P a k i s
t a n
N e p a l
E X P Y
( 2
0 0 0
P P P $ )
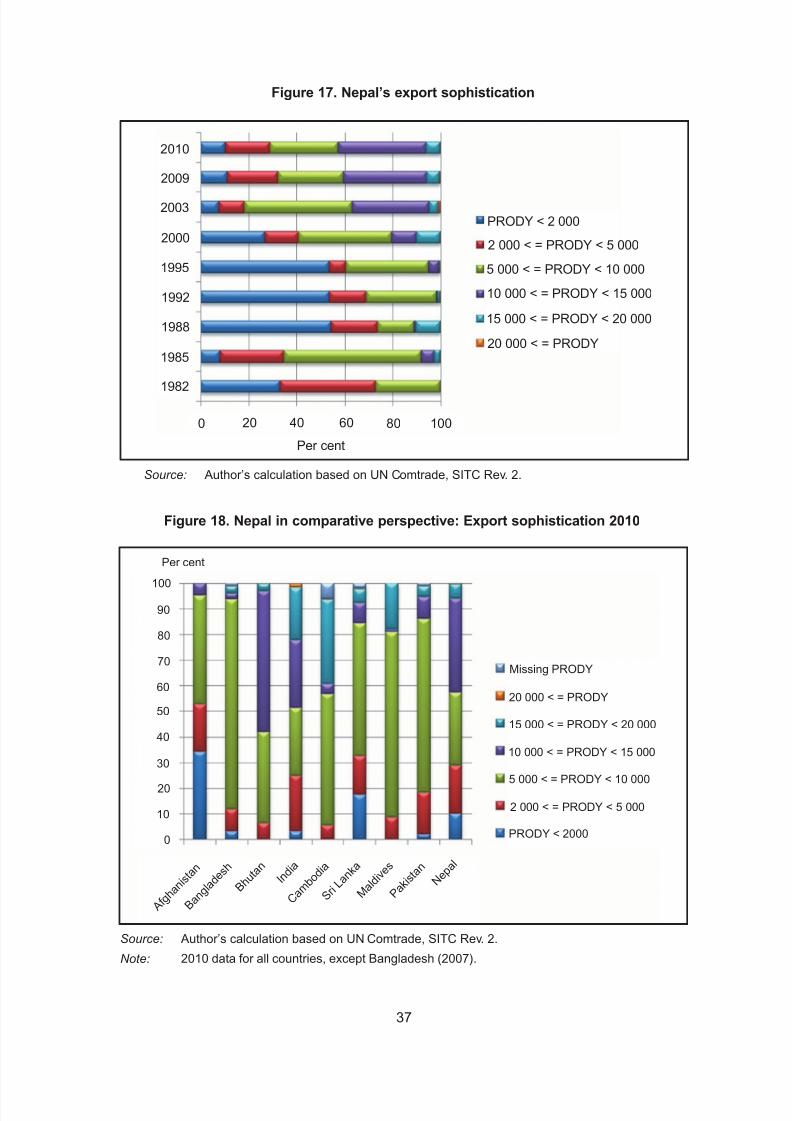
8/11/2019 Trade performance and competitiveness: Selected issues relevant for Asian developing economies
http://slidepdf.com/reader/full/trade-performance-and-competitiveness-selected-issues-relevant-for-asian-developing 57/215
37
100
Per cent
90
80
70
60
50
40
30
20
10
0PRODY < 2000
2 000 < = PRODY < 5 000
5 000 < = PRODY < 10 000
10 000 < = PRODY < 15 000
15 000 < = PRODY < 20 000
20 000 < = PRODY
Missing PRODY
A f g h a n
i s t a n
B a n g l a
d e s h
B h u
t a n
I n d i a
C a m b o
d i a
S r i L a
n k a
M a l d i
v e s
P a k i s
t a n
N e p a
l
Figure 18. Nepal in comparative perspective: Export sophistication 2010
Source: Author’s calculation based on UN Comtrade, SITC Rev. 2.
Note: 2010 data for all countries, except Bangladesh (2007).
Figure 17. Nepal’s export sophistication
Source: Author’s calculation based on UN Comtrade, SITC Rev. 2.
2010
2009
2003
2000
1995
1992
1988
1985
1982
0 20 40 60 80 100
PRODY < 2 000
2 000 < = PRODY < 5 000
5 000 < = PRODY < 10 000
10 000 < = PRODY < 15 000
15 000 < = PRODY < 20 000
20 000 < = PRODY
Per cent
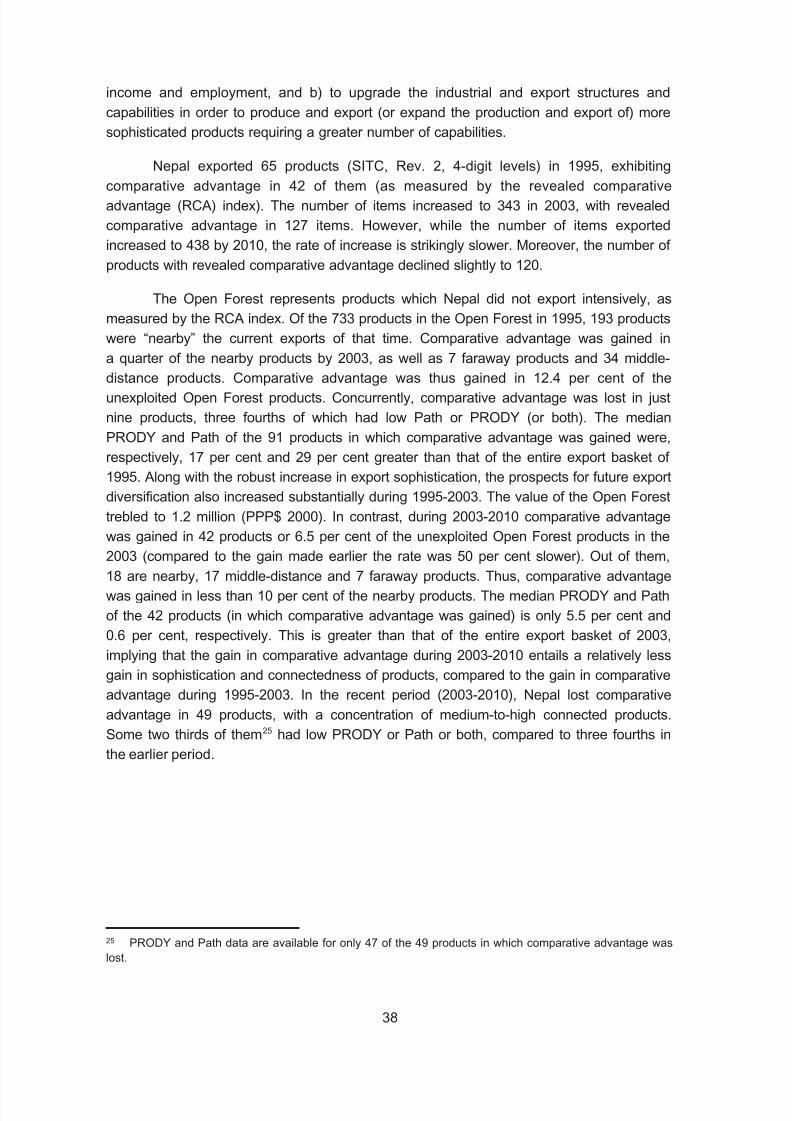
8/11/2019 Trade performance and competitiveness: Selected issues relevant for Asian developing economies
http://slidepdf.com/reader/full/trade-performance-and-competitiveness-selected-issues-relevant-for-asian-developing 58/215
38
income and employment, and b) to upgrade the industrial and export structures and
capabilities in order to produce and export (or expand the production and export of) more
sophisticated products requiring a greater number of capabilities.
Nepal exported 65 products (SITC, Rev. 2, 4-digit levels) in 1995, exhibiting
comparative advantage in 42 of them (as measured by the revealed comparative
advantage (RCA) index). The number of items increased to 343 in 2003, with revealed
comparative advantage in 127 items. However, while the number of items exported
increased to 438 by 2010, the rate of increase is strikingly slower. Moreover, the number of
products with revealed comparative advantage declined slightly to 120.
The Open Forest represents products which Nepal did not export intensively, as
measured by the RCA index. Of the 733 products in the Open Forest in 1995, 193 products
were “nearby” the current exports of that time. Comparative advantage was gained in
a quarter of the nearby products by 2003, as well as 7 faraway products and 34 middle-distance products. Comparative advantage was thus gained in 12.4 per cent of the
unexploited Open Forest products. Concurrently, comparative advantage was lost in just
nine products, three fourths of which had low Path or PRODY (or both). The median
PRODY and Path of the 91 products in which comparative advantage was gained were,
respectively, 17 per cent and 29 per cent greater than that of the entire export basket of
1995. Along with the robust increase in export sophistication, the prospects for future export
diversification also increased substantially during 1995-2003. The value of the Open Forest
trebled to 1.2 million (PPP$ 2000). In contrast, during 2003-2010 comparative advantage
was gained in 42 products or 6.5 per cent of the unexploited Open Forest products in the2003 (compared to the gain made earlier the rate was 50 per cent slower). Out of them,
18 are nearby, 17 middle-distance and 7 faraway products. Thus, comparative advantage
was gained in less than 10 per cent of the nearby products. The median PRODY and Path
of the 42 products (in which comparative advantage was gained) is only 5.5 per cent and
0.6 per cent, respectively. This is greater than that of the entire export basket of 2003,
implying that the gain in comparative advantage during 2003-2010 entails a relatively less
gain in sophistication and connectedness of products, compared to the gain in comparative
advantage during 1995-2003. In the recent period (2003-2010), Nepal lost comparative
advantage in 49 products, with a concentration of medium-to-high connected products.Some two thirds of them25 had low PRODY or Path or both, compared to three fourths in
the earlier period.
25 PRODY and Path data are available for only 47 of the 49 products in which comparative advantage was
lost.
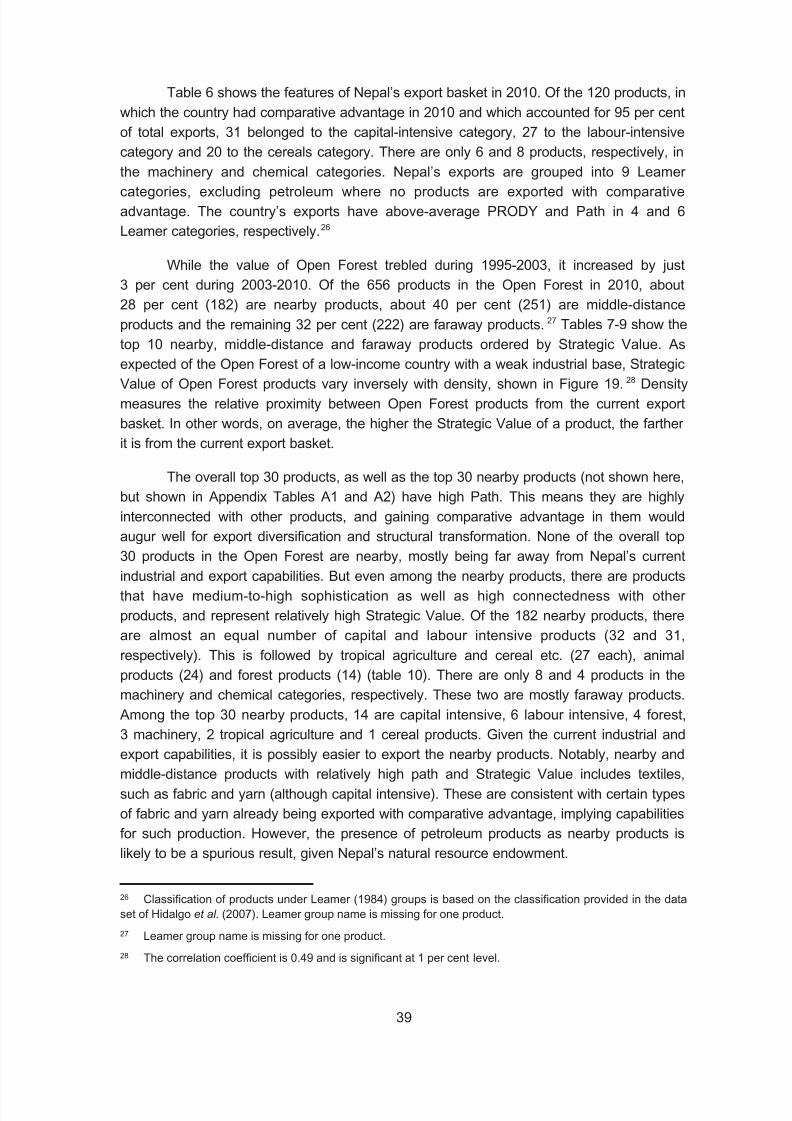
8/11/2019 Trade performance and competitiveness: Selected issues relevant for Asian developing economies
http://slidepdf.com/reader/full/trade-performance-and-competitiveness-selected-issues-relevant-for-asian-developing 59/215
39
Table 6 shows the features of Nepal’s export basket in 2010. Of the 120 products, in
which the country had comparative advantage in 2010 and which accounted for 95 per cent
of total exports, 31 belonged to the capital-intensive category, 27 to the labour-intensive
category and 20 to the cereals category. There are only 6 and 8 products, respectively, in
the machinery and chemical categories. Nepal’s exports are grouped into 9 Leamer categories, excluding petroleum where no products are exported with comparative
advantage. The country’s exports have above-average PRODY and Path in 4 and 6
Leamer categories, respectively.26
While the value of Open Forest trebled during 1995-2003, it increased by just
3 per cent during 2003-2010. Of the 656 products in the Open Forest in 2010, about
28 per cent (182) are nearby products, about 40 per cent (251) are middle-distance
products and the remaining 32 per cent (222) are faraway products.27 Tables 7-9 show the
top 10 nearby, middle-distance and faraway products ordered by Strategic Value. As
expected of the Open Forest of a low-income country with a weak industrial base, Strategic
Value of Open Forest products vary inversely with density, shown in Figure 19.28 Density
measures the relative proximity between Open Forest products from the current export
basket. In other words, on average, the higher the Strategic Value of a product, the farther
it is from the current export basket.
The overall top 30 products, as well as the top 30 nearby products (not shown here,
but shown in Appendix Tables A1 and A2) have high Path. This means they are highly
interconnected with other products, and gaining comparative advantage in them would
augur well for export diversification and structural transformation. None of the overall top30 products in the Open Forest are nearby, mostly being far away from Nepal’s current
industrial and export capabilities. But even among the nearby products, there are products
that have medium-to-high sophistication as well as high connectedness with other
products, and represent relatively high Strategic Value. Of the 182 nearby products, there
are almost an equal number of capital and labour intensive products (32 and 31,
respectively). This is followed by tropical agriculture and cereal etc. (27 each), animal
products (24) and forest products (14) (table 10). There are only 8 and 4 products in the
machinery and chemical categories, respectively. These two are mostly faraway products.
Among the top 30 nearby products, 14 are capital intensive, 6 labour intensive, 4 forest,3 machinery, 2 tropical agriculture and 1 cereal products. Given the current industrial and
export capabilities, it is possibly easier to export the nearby products. Notably, nearby and
middle-distance products with relatively high path and Strategic Value includes textiles,
such as fabric and yarn (although capital intensive). These are consistent with certain types
of fabric and yarn already being exported with comparative advantage, implying capabilities
for such production. However, the presence of petroleum products as nearby products is
likely to be a spurious result, given Nepal’s natural resource endowment.
26 Classification of products under Leamer (1984) groups is based on the classification provided in the data
set of Hidalgo et al. (2007). Leamer group name is missing for one product.
27 Leamer group name is missing for one product.
28 The correlation coefficient is 0.49 and is significant at 1 per cent level.

8/11/2019 Trade performance and competitiveness: Selected issues relevant for Asian developing economies
http://slidepdf.com/reader/full/trade-performance-and-competitiveness-selected-issues-relevant-for-asian-developing 60/215
40
Table6.Featuresofexportbasketin2010
Leamergroup
No.of
No.of
Exports,
No.of
Sharein
Average
Average
Average
Average
products
tota
l
2010
produc
ts
exports
PRODY
Path
PRODY
Path
exported
produ
cts
(’000$)
with
(All,
(All,
RCA>1
Leamer)
Leamer)
Petroleum
1
10
0.40
0
0.00
11,437.13
142.19
9,554.66
111.96
Rawmaterials
19
62
39,389.06
5
4.73
9,018.40
128.27
10,060.59
105.34
Forestproducts
25
38
13,750.14
8
1.65
13,559.48
148.99
13,134.52
135.58
Tropicalagriculture
33
46
125,323.20
8
15.05
7,884.47
125.69
7,553.05
115.01
Animalprodu
cts
31
53
32,078.28
7
3.85
10,326.37
123.78
10,813.78
119.38
Cereals,etc.
45
81
32,878.50
20
3.95
9,248.02
109.89
9,008.84
102.38
labourintens
ive
74
96
118,530.48
27
14.23
10,661.69
132.38
11,333.09
135.67
Capitalintensive
79
115
412,895.66
31
49.58
11,199.42
149.34
11,471.45
150.74
Machinery
93
179
21,251.32
6
2.55
16,141.82
140.72
16,054.66
136.10
Chemical
38
94
36,664.20
8
4.40
14,931.70
149.49
15,274.56
142.16
Total
438
774
832,761.21
120
S o u r c e :
Auth
or’scalculation.

8/11/2019 Trade performance and competitiveness: Selected issues relevant for Asian developing economies
http://slidepdf.com/reader/full/trade-performance-and-competitiveness-selected-issues-relevant-for-asian-developing 61/215
41
Table7.Top10nearbyproducts,orderedbyStrategicValue
SITC
Product
Leamer
Path
PRODY
PRODY
Path
Contribution
Strategic
code
group
tercile
tercile
toOpen
Value
Forest(PRODY*
density)
8932
Sanitaryortoiletart.
labour
195.22
13,541.54
medium
high
2,289.36
15,076.17
ofmaterialsofdiv.58
intensive
6421
Boxes,bags&oth.packing
Forest
182.21
14,854.13
medium
high
2,576.47
14,184.04
containers,ofpaper/papbd
products
6924
Casks,drums,boxesof
Capital
183.55
12,609.02
medium
high
2,187.44
14,059.19
iron/steelforpackinggoods
intensive
6417
Paper&paperboard,
Forest
183.28
10,462.18
medium
high
1,814.01
13,886.84
corrugated,creped,
products
crinkledetc.
6794
Castingsorironorsteel,
Capital
185.55
11,749.49
medium
high
2,065.54
13,790.18
intheroughstate
intensive
8212
Furnitureformedical,surgical,
Labour
176.70
13,331.69
medium
high
2,296.04
13,489.34
dentaletc.practice
intensive
6975
Sanitarywareforindooruse,
Capital
173.04
15,926.95
high
high
2,716.29
13,319.42
andparts
intensive
6973
Domestic-type,non-electric
Capital
179.19
12,795.86
medium
high
2,324.09
13,104.04
heating,cookingappar.
intensive
6517
Yarnofregeneratedfibres,
Capital
178.03
9,639.35
low
high
1,804.43
13,042.27
notforretailsale
intensive
6560
Tulle,lace,embroidery,
Capital
171.36
12,836.79
medium
high
2,497.21
12,899.75
ribbons,&othersmallware
s
intensive
S o u r c e :
Auth
or’scalculation.

8/11/2019 Trade performance and competitiveness: Selected issues relevant for Asian developing economies
http://slidepdf.com/reader/full/trade-performance-and-competitiveness-selected-issues-relevant-for-asian-developing 62/215
42
Table8.Top10middle-distancepr
oducts,orderedbyStrateg
icValue
SITC
Product
Leamer
Path
PRODY
PRODY
Path
Contribution
Strategic
code
group
tercile
tercile
toOpen
Value
Forest(PRODY*
density)
6996
Miscellaneousarticlesof
Capital
207.69
15,704.52
high
high
2,418.90
17,006.43
basemetal
intensive
6785
Tube&pipefittings(joints,
Capital
207.19
15,323.85
high
high
2,385.44
16,929.91
elbows)ofiron/steel
intensive
7449
Partsofthemachinery
Machinery
199.53
16,022.39
high
high
2,239.96
16,886.23
of744.2-
7139
Partsofint.comb.piston
Machinery
194.09
16,920.96
high
high
2,314.52
16,883.36
enginesof713.2-/3-/8-
8935
Art.ofelectriclightingof
Labour
198.18
15,538.38
high
high
2,341.37
16,768.43
materialsofdiv.58
intensive
6210
Materialsofrubber
Capital
198.81
15,040.43
high
high
2,219.33
16,665.21
(e.g.pastes,plates,sheets,etc.)
intensive
6953
Othertoolsforuseintheha
nd
Capital
189.71
14,733.62
medium
high
2,200.75
16,174.98
intensive
6991
Locksmithswares,safes,
Capital
189.13
16,414.08
high
high
2,416.89
16,155.87
strongroomsofbasemetal
intensive
7919
Rail&tramwaytrackfixture
s&
Machinery
191.91
14,949.81
high
high
2,077.53
16,139.35
fittings,signall.equi.
6424
Paperandpaperboard,
Forest
190.87
15,599.70
high
high
2,222.51
16,131.59
cuttosizeorshape,n.e.s.
products
S o u r c e :
Auth
or’scalculation.
8/11/2019 Trade performance and competitiveness: Selected issues relevant for Asian developing economies
http://slidepdf.com/reader/full/trade-performance-and-competitiveness-selected-issues-relevant-for-asian-developing 63/215
43
Tab
le9.Top10farawayprodu
cts,orderedbyStrategicV
alue
SITC
Product
Leamer
Path
PRODY
PRODY
Path
Contribution
Strategic
code
group
tercile
tercile
toOpen
Value
Forest(PRODY*
density)
5335
Colour.preptnsofakindus
ed
Chemical
196.55
18,099.09
high
high
2,307.83
17,717.46
inceramic,enamelli.
6632
Naturalorartificialabrasive
Labour
194.49
18,839.34
high
high
2,423.08
17,615.70
powderorgrain
intensive
7267
Otherprintingmach.
Machinery
174.30
21,054.27
high
high
2,200.40
17,527.86
forusesancillarytoprinting
7492
Taps,cocks,valvesetc.
Machinery
189.17
17,626.42
high
high
2,209.09
17,306.65
forpipes,tanks,vatsetc.
7269
Partsofthemachines
Machinery
176.80
20,564.04
high
high
2,337.46
17,207.22
of726.31,726.4-,726.7-
6418
Paper&paperboard,
Forest
189.02
19,418.90
high
high
2,430.43
17,197.90
impregnat.coat.
products
surface-coloured
7849
Otherparts&accessories
Machinery
193.79
17,158.54
high
high
2,166.88
17,185.51
ofmotorvehicles
7429
Partsofthepumps&liq.
Machinery
176.21
18,779.22
high
high
2,127.31
17,088.95
elevatorsof742–
7439
Partsofthemachines
Machinery
181.99
16,500.97
high
high
1,975.90
17,027.87
of743.5-,743.6-
7493
Transmissionshafts,cranks
,
Machinery
171.15
17,263.96
high
high
1,855.28
16,647.64
bearinghousingsetc.
S o u r c e :
Auth
or’scalculation.

8/11/2019 Trade performance and competitiveness: Selected issues relevant for Asian developing economies
http://slidepdf.com/reader/full/trade-performance-and-competitiveness-selected-issues-relevant-for-asian-developing 64/215
44
Figure 19. Strategic Value against density of unexploited products, 2010
Source: Author’s calculation.
Table 10. Products in Open Forest according to Leamer classification
All products Nearby products
in Open Forest
Petroleum 10 5
Raw materials 57 12
Forest products 30 12
Tropical agriculture 38 27 Animal products 46 24
Cereals, etc. 61 27
Labour intensive 69 32
Capital intensive 85 31
Machinery 173 8
Chemical 86 4
Total 655 182
Source: Author’s calculation.
20 000
15 000
10 000
5 000
0
.05 .1 .15 .2 .25 .3
Density
S t r a t e g i c_ v a l u e

8/11/2019 Trade performance and competitiveness: Selected issues relevant for Asian developing economies
http://slidepdf.com/reader/full/trade-performance-and-competitiveness-selected-issues-relevant-for-asian-developing 65/215
45
G. Analysis of targeted products
Two groups of targeted products are comparatively analysed: a) NTIS-identified
products, which include some products identified in the Trade Policy, b) products exclusive
to Trade Policy (not in NTIS). The approach is to first assess export implications of diversification and structural transformation in promoting the products identified by
NTIS – which is the trade strategy of the Government of Nepal until at least 2015. The
NTIS-identified products are then compared with products identified by Trade Policy.
Researchers compare the identified products with the existing export basket, as well as the
Open Forest. The “other” export potential products of NTIS are also briefly assessed.
1. NTIS products
There are 131 NTIS-identified products in terms of HS (2002) 6-digit codes and 61
in terms of SITC (Rev. 2) 4-digit codes. Although, less product diversity is captured by SITC
codes than HS codes, the former is still employed as the PRODY and Path data available
are based on SITC classification. Almost all of iron and steel products are manufactured,
capital-intensive, numbering at 38 of the 61 identified, followed by wool products with 11.
Accorded special priority in NTIS, agro-food products number 7.29 Forty-seven of the 61
identified products are exported in 2010, accounting for 37 per cent of Nepal’s merchandise
exports. All the 14 products identified, though not exported in 2010, are iron and steel
products. Twenty-four products are exported with comparative advantage in 2010. Notably,
natural honey, silver jewelry and handmade paper are not exported with comparative
advantage. Twenty-two of the 61 products are also listed in the Trade Policy 2009. Instant
noodle and all iron and steel products are exclusive to NTIS. Table 11 summarizes the
features of NTIS-identified products.
Of the 61 identified products, 36 have PRODY greater than EXPY (measuring
overall sophistication of the export basket) for 2010. Twenty-four products have PRODY
and Path greater than the average for their respective Leamer groups. However, these are
disproportionately concentrated in the iron and steel products category.
As expected, basic agricultural products, such as lentils, cardamom, ginger, tea,medicinal herbs and honey, have low PRODY. This points to it being less than EXPY, and/
or belonging to the lowest PRODY tercile (table 11 and figure 20). Notably, while PRODY
represents the sophistication of a product by taking into account the income levels of
countries effectively exporting it, Path shows how connected a product is with other
products. A higher Path indicates greater potential for industrial and export diversification.
The highest Paths are depicted by, on average, handmade paper, iron and steel products,
natural honey and pashmina products (figure 21). Outside of iron and steel products, only
handmade paper makes it to the top (first) Path tercile. Among agro-food products, natural
29 Essential oils are classified as chemical products under Leamer classification, but NTIS considers them
agriculture products. They are derived from plants and the WTO’s Agreement on Agriculture lists them as
agriculture goods. Another incongruity is that medicinal plants are placed under animal products by Leamer.
But these do not affect the analysis in any significant way.

8/11/2019 Trade performance and competitiveness: Selected issues relevant for Asian developing economies
http://slidepdf.com/reader/full/trade-performance-and-competitiveness-selected-issues-relevant-for-asian-developing 66/215
46
T
able11.Summaryfeatures
ofNTIS-identifiedproducts
NTIS
Leamergroup
No.of
No.of
Products
Exports
Sharein
PRO
DY>
RCA>1
Path
PRODY
group
identified
products
exported
2010
NTIS
EX
PY
tercile
andpath>
products
alsoin
($’000)
exports
Average
TradePolicy
Leamer
Lentils
Tropicalagriculture
1
1
1
51,394.18
16.72
0
1
low
0
Cardamom/
Tropicalagriculture
1
1
1
22,929.11
7.46
0
1
low
0
ginger
Tea
Tropicalagriculture
1
1
1
16,356.39
5.32
0
1
low
0
Medicinalherb
s
Animalproducts
1
1
1
6,020.03
1.96
0
1
low
0
Instantnoodle
Cereals,etc.
1
0
1
5,967.00
1.94
1
1
low
0
Essentialoils
Chemical
1
1
1
504.29
0.16
0
1
medium
0
Naturalhoney
Tropicalagriculture
1
1
1
3.14
0.00
1
0
medium
1
Ironandsteel
Capital
38
0
24
146,624.80
47.70
3
1
7
High(27)
,
22
products
intensive(37),
medium(10)
,
rawmaterials(1)
low(1)
Woolproducts
Labourintensive
11
11
11
34,233.23
11.14
1
9
Medium(6)
,
0
low(5)
Pashmina
Capital
2
2
2
19,882.70
6.47
0
2
Medium
0
products
intensive(1),
labour
intensive(1)
Silverjewelry
Labourintensive
2
2
2
2,986.02
0.97
1
0
Low
0
Handmade
Forestproducts
1
1
1
513.00
0.17
1
0
High
1
paper
Total
61
22
47
307,413.89
100.00
3
6
24
24
S o u r c e :
Auth
or’scalculation.

8/11/2019 Trade performance and competitiveness: Selected issues relevant for Asian developing economies
http://slidepdf.com/reader/full/trade-performance-and-competitiveness-selected-issues-relevant-for-asian-developing 67/215
47
Figure 20. Sophistication and connectivity of NTIS-identified products
Source: Author’s calculation.
Note: The dashed lines demarcate high, medium and low PRODY/Path groups.
honey and essential oils stand out for belonging to the medium (second) Path tercile, the
rest have low Path. This is despite all identified agro-food products having low PRODY.
Appendix Table A3 provides detailed data on NTIS-identified products.
The NTIS-identified products are compared with the export basket of 2010, which
comprises of all products that are exported regardless of comparative advantage
(table 12). In terms of sophistication (PRODY) and connectedness with other products
(Path), this reveals that, on average, the identified products fare better than the export
basket (all exported products or products exported with comparative advantage). However,
this is overwhelmingly driven by the presence of iron and steel products among the
identified products. Excluding iron and steel products, the identified products, on average,
mostly lag behind the export basket on the same parameters. Apart from most iron and
steel products, handmade paper, pashmina products and three wool products have Path
greater than the export basket average.
Of the 61 identified products, 37 are not exported with comparative advantage,
meaning that they are strictly in the Open Forest. The median Path and Strategic Value of
the 37 products (31 of which are iron and steel products) are higher than those of the entireOpen Forest. This is driven by the presence of a high number of iron and steel products
(table 13). Handmade paper also has Path and Strategic Value greater than the median of
the Open Forest, and greater than the majority of iron and steel products. Natural honey,
20 000
15 000
10 000
5 000
0
50 100 150 200Path
P R O D Y
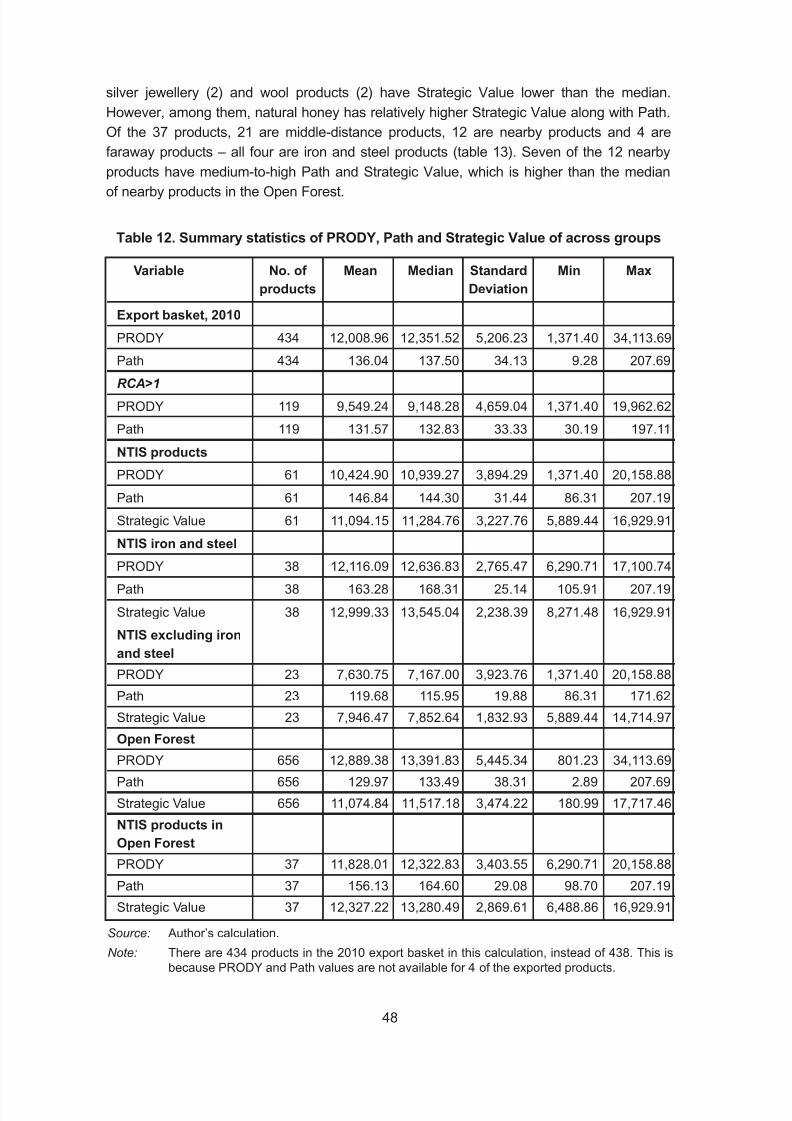
8/11/2019 Trade performance and competitiveness: Selected issues relevant for Asian developing economies
http://slidepdf.com/reader/full/trade-performance-and-competitiveness-selected-issues-relevant-for-asian-developing 68/215
48
Table 12. Summary statistics of PRODY, Path and Strategic Value of across groups
Variable No. of Mean Median Standard Min Max
products Deviation
Export basket, 2010
PRODY 434 12,008.96 12,351.52 5,206.23 1,371.40 34,113.69
Path 434 136.04 137.50 34.13 9.28 207.69
RCA>1
PRODY 119 9,549.24 9,148.28 4,659.04 1,371.40 19,962.62
Path 119 131.57 132.83 33.33 30.19 197.11
NTIS products
PRODY 61 10,424.90 10,939.27 3,894.29 1,371.40 20,158.88
Path 61 146.84 144.30 31.44 86.31 207.19
Strategic Value 61 11,094.15 11,284.76 3,227.76 5,889.44 16,929.91
NTIS iron and steel
PRODY 38 12,116.09 12,636.83 2,765.47 6,290.71 17,100.74
Path 38 163.28 168.31 25.14 105.91 207.19
Strategic Value 38 12,999.33 13,545.04 2,238.39 8,271.48 16,929.91
NTIS excluding iron
and steel
PRODY 23 7,630.75 7,167.00 3,923.76 1,371.40 20,158.88
Path 23 119.68 115.95 19.88 86.31 171.62
Strategic Value 23 7,946.47 7,852.64 1,832.93 5,889.44 14,714.97
Open Forest
PRODY 656 12,889.38 13,391.83 5,445.34 801.23 34,113.69
Path 656 129.97 133.49 38.31 2.89 207.69
Strategic Value 656 11,074.84 11,517.18 3,474.22 180.99 17,717.46
NTIS products in
Open Forest
PRODY 37 11,828.01 12,322.83 3,403.55 6,290.71 20,158.88
Path 37 156.13 164.60 29.08 98.70 207.19Strategic Value 37 12,327.22 13,280.49 2,869.61 6,488.86 16,929.91
Source: Author’s calculation.
Note: There are 434 products in the 2010 export basket in this calculation, instead of 438. This isbecause PRODY and Path values are not available for 4 of the exported products.
silver jewellery (2) and wool products (2) have Strategic Value lower than the median.
However, among them, natural honey has relatively higher Strategic Value along with Path.
Of the 37 products, 21 are middle-distance products, 12 are nearby products and 4 are
faraway products – all four are iron and steel products (table 13). Seven of the 12 nearby
products have medium-to-high Path and Strategic Value, which is higher than the medianof nearby products in the Open Forest.
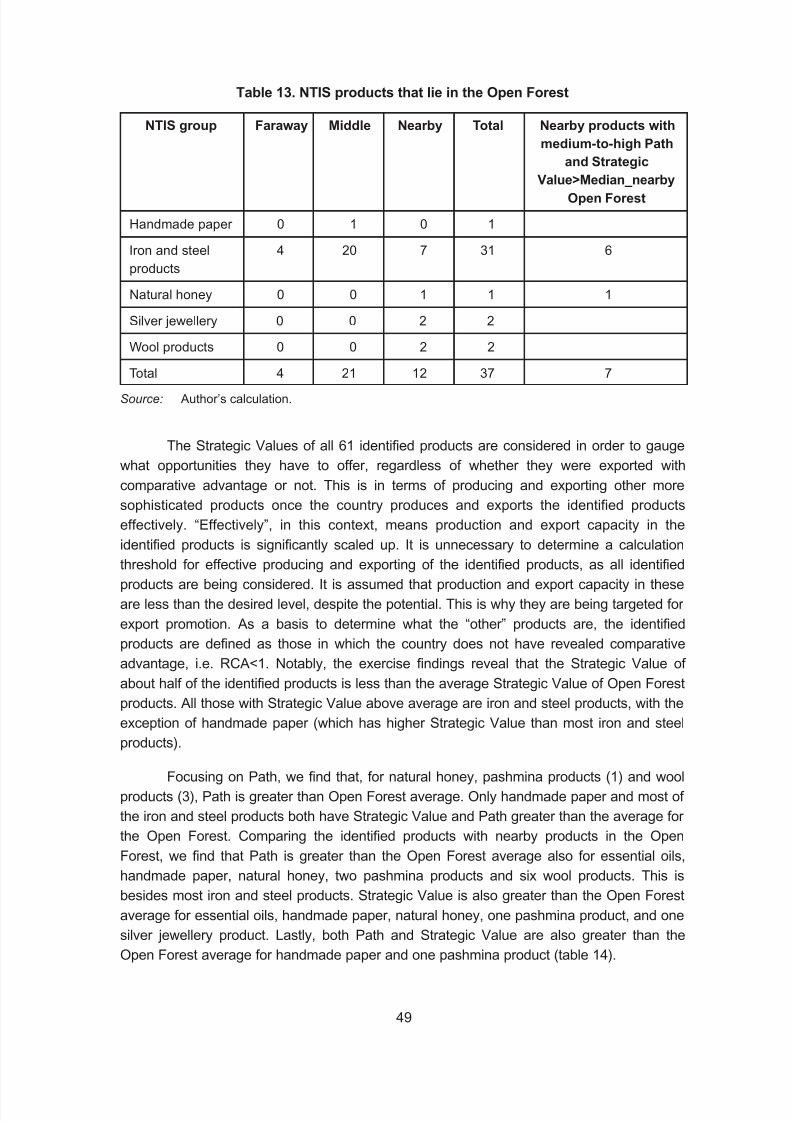
8/11/2019 Trade performance and competitiveness: Selected issues relevant for Asian developing economies
http://slidepdf.com/reader/full/trade-performance-and-competitiveness-selected-issues-relevant-for-asian-developing 69/215
49
The Strategic Values of all 61 identified products are considered in order to gauge
what opportunities they have to offer, regardless of whether they were exported with
comparative advantage or not. This is in terms of producing and exporting other more
sophisticated products once the country produces and exports the identified products
effectively. “Effectively”, in this context, means production and export capacity in the
identified products is significantly scaled up. It is unnecessary to determine a calculation
threshold for effective producing and exporting of the identified products, as all identified
products are being considered. It is assumed that production and export capacity in these
are less than the desired level, despite the potential. This is why they are being targeted for
export promotion. As a basis to determine what the “other” products are, the identified
products are defined as those in which the country does not have revealed comparative
advantage, i.e. RCA<1. Notably, the exercise findings reveal that the Strategic Value of
about half of the identified products is less than the average Strategic Value of Open Forest
products. All those with Strategic Value above average are iron and steel products, with the
exception of handmade paper (which has higher Strategic Value than most iron and steel
products).
Focusing on Path, we find that, for natural honey, pashmina products (1) and wool
products (3), Path is greater than Open Forest average. Only handmade paper and most of
the iron and steel products both have Strategic Value and Path greater than the average for
the Open Forest. Comparing the identified products with nearby products in the Open
Forest, we find that Path is greater than the Open Forest average also for essential oils,
handmade paper, natural honey, two pashmina products and six wool products. This is
besides most iron and steel products. Strategic Value is also greater than the Open Forest
average for essential oils, handmade paper, natural honey, one pashmina product, and one
silver jewellery product. Lastly, both Path and Strategic Value are also greater than the
Open Forest average for handmade paper and one pashmina product (table 14).
Table 13. NTIS products that lie in the Open Forest
NTIS group Faraway Middle Nearby Total Nearby products with
medium-to-high Path
and Strategic
Value>Median_nearbyOpen Forest
Handmade paper 0 1 0 1
Iron and steel 4 20 7 31 6
products
Natural honey 0 0 1 1 1
Silver jewellery 0 0 2 2
Wool products 0 0 2 2
Total 4 21 12 37 7
Source: Author’s calculation.

8/11/2019 Trade performance and competitiveness: Selected issues relevant for Asian developing economies
http://slidepdf.com/reader/full/trade-performance-and-competitiveness-selected-issues-relevant-for-asian-developing 70/215
50
2. Identified in the 2009 Trade Policy
Products exclusive to the Trade Policy 2009 are analysed here. Trade Policy 2009
identifies products broadly, and not in terms of a standard classification system. Therefore,338 products are identified at HS (2002) 6-digit level, corresponding to the broad categories
identified in Trade Policy. This is based on HS 6-digit products exported in 2010 and HS
6-digit products under the same or similar categories considered in the International Trade
Centre’s Nepal Export Potential Assessment (ITC, 2007).
When converted to SITC (Rev. 2) 4-digit levels, the number reduces to 54. The
PRODY, Path and Strategic Value of these 54 Trade Policy-identified products are, on
average, less than the NTIS products. They are higher if compared to the NTIS product set,
excluding iron and steel products (table 15).30
The PRODY and Path of the Trade Policyproducts are, on average, also less tan those of the 2010 export basket.
Table 14. Comparison of NTIS products with export basket and Open Forest
NTIS group Path> Path> SV>Median_ Path &
Median_ Median_ Open Forest SV>Median_
export basket Open Forest Open Forest
Handmade paper 1 1 1 1
Iron and steel products 30 32 28 28
Natural honey 1
Pashmina products 1 1
Wool products 3 3
Total 35 38 29 29
NTIS group Path>Median_ SV>Median_ Path & SV>Median_nearby
nearby Open nearby Open Open Forest
Forest Forest
Essential oils 1 1
Handmade paper 1 1 1
Iron and steel products 37 34 30
Natural honey 1 1
Pashmina products 2 1 1
Wool products 6
Silver jewellery 1
Total 48 39 32
Source: Author’s calculation.
30 Appendix Table A4 provides details of the TP products.
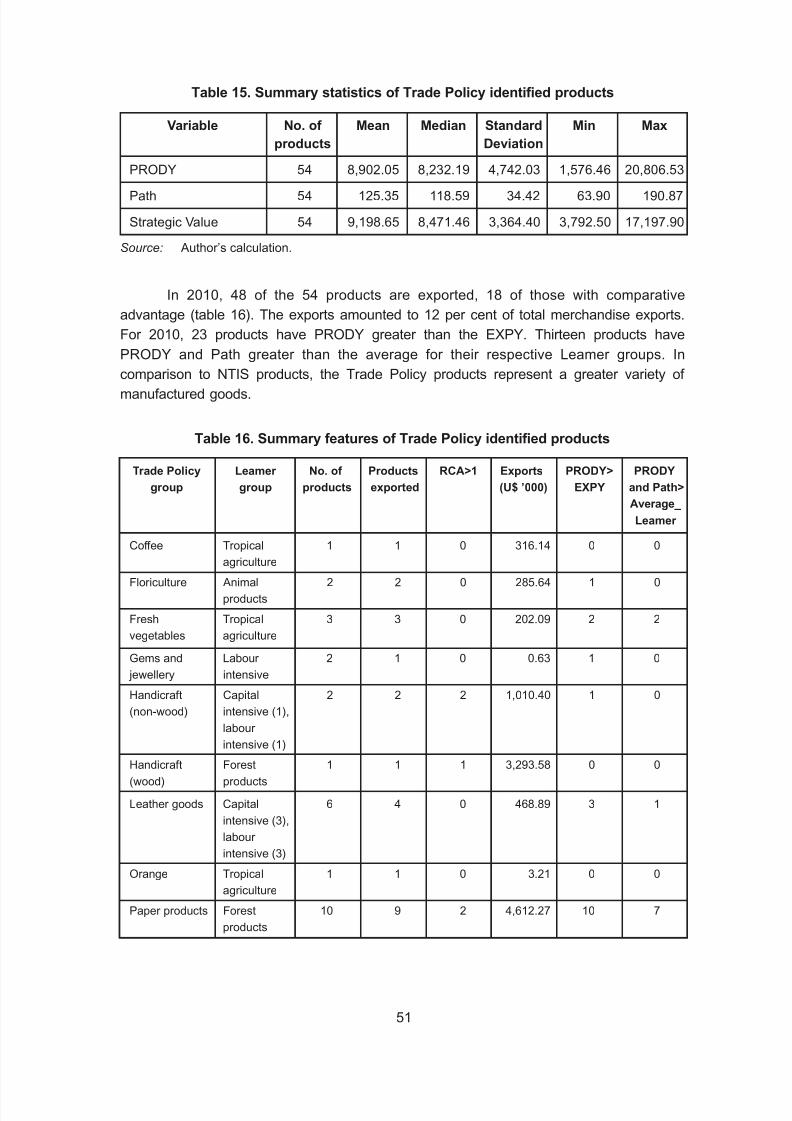
8/11/2019 Trade performance and competitiveness: Selected issues relevant for Asian developing economies
http://slidepdf.com/reader/full/trade-performance-and-competitiveness-selected-issues-relevant-for-asian-developing 71/215
51
In 2010, 48 of the 54 products are exported, 18 of those with comparative
advantage (table 16). The exports amounted to 12 per cent of total merchandise exports.
For 2010, 23 products have PRODY greater than the EXPY. Thirteen products have
PRODY and Path greater than the average for their respective Leamer groups. Incomparison to NTIS products, the Trade Policy products represent a greater variety of
manufactured goods.
Table 15. Summary statistics of Trade Policy identified products
Variable No. of Mean Median Standard Min Max
products Deviation
PRODY 54 8,902.05 8,232.19 4,742.03 1,576.46 20,806.53
Path 54 125.35 118.59 34.42 63.90 190.87
Strategic Value 54 9,198.65 8,471.46 3,364.40 3,792.50 17,197.90
Source: Author’s calculation.
Table 16. Summary features of Trade Policy identified products
Trade Policy Leamer No. of Products RCA>1 Exports PRODY> PRODY
group group products exported (U$ ’000) EXPY and Path>
Average_
Leamer
Coffee Tropical 1 1 0 316.14 0 0
agriculture
Floriculture Animal 2 2 0 285.64 1 0
products
Fresh Tropical 3 3 0 202.09 2 2
vegetables agriculture
Gems and Labour 2 1 0 0.63 1 0
jewellery intensive
Handicraft Capital 2 2 2 1,010.40 1 0
(non-wood) intensive (1),labour
intensive (1)
Handicraft Forest 1 1 1 3,293.58 0 0
(wood) products
Leather goods Capital 6 4 0 468.89 3 1
intensive (3),
labour
intensive (3)
Orange Tropical 1 1 0 3.21 0 0
agriculture
Paper products Forest 10 9 2 4,612.27 10 7
products

8/11/2019 Trade performance and competitiveness: Selected issues relevant for Asian developing economies
http://slidepdf.com/reader/full/trade-performance-and-competitiveness-selected-issues-relevant-for-asian-developing 72/215
52
Of the 54 Trade Policy products, 12 have high Path and 17 medium Path (table 17).Three of the eight agricultural products have medium Path. All 11 RMG products have low
PRODY, but five of them have medium Path. A total of 18 products – including leather
goods, paper products, processed leather, vegetable seeds, towel and non-wood handicraft
– have medium-to-high PRODY and Path (figure 22).
There are 16 products with Path above the median Path of the 2010 export basket.
There are 13 products with Path and/or Strategic Value exceeding the median of NTIS
products. However, 29 products have Path and/or Strategic Value exceeding the median of
the NTIS product set, excluding iron and steel (table 18). While 21 products have Path
greater than the Open Forest median, 12 have Strategic Value greater than the Open
Forest median. The latter number increases to 27 or half of the Trade Policy products, if
comparison is made with the median of nearby products in the Open Forest. In particular,
leather goods, processed leather, paper products and towels exhibit higher-than-average
Path and Strategic Value consistently across all comparator groups. In contrast, products
such as coffee, floriculture, wooden handicraft, orange, silk products and woolen carpet
have below-average Path and Strategic Value across all comparator groups. Most RMG
products have lower-than-average Path and Strategic Value across most comparator
groups. However, compared to the NTIS product set (excluding iron and steel), five RMG
products exhibit higher-than-average Path and two higher-than-average Strategic Value.
This means that although they are low-tech labour-intensive manufactured goods, RMG
products hold greater potential for industrial and export diversification than many of the
NTIS products, excluding iron and steel.
Processed Capital 5 3 2 8,041.43 1 0
leather intensive
RMG Labour 11 11 7 21,336.80 0 0
intensive
Silk products Capital 3 3 1 9.09 0 0
intensive (1),
cereals,
etc.* (1)
Towel Capital 5 5 2 2,058.14 3 2
intensive
Vegetable Animal 1 1 0 37.38 1 1
seeds products
Woolen Capital 1 1 1 59,675.00 0 0
carpet intensive
Total 54 48 18 101,350.68 23 13
Source: Author’s calculation.
Table 16. (conitued)
Trade Policy Leamer No. of Products RCA>1 Exports PRODY> PRODY
group group products exported (U$ ’000) EXPY and Path>
Average_
Leamer

8/11/2019 Trade performance and competitiveness: Selected issues relevant for Asian developing economies
http://slidepdf.com/reader/full/trade-performance-and-competitiveness-selected-issues-relevant-for-asian-developing 73/215
53
Figure 21. Sophistication and connectivity of Trade Policy products
Source: Author’s calculation.
Note: The dashed lines demarcate high, medium and low PRODY/Path groups.
Table 17. Distribution of Trade Policy identified products across path terciles
Trade Policy group High Medium Low Total
Coffee 0 0 1 1
Floriculture 0 0 2 2Fresh vegetables 0 2 1 3
Gems and jewellery 0 0 2 2
Handicraft (non-wood) 0 1 1 2
Handicraft (wood) 0 0 1 1
Leather goods 2 2 2 6
Orange 0 0 1 1
Paper products 8 1 1 10
Processed leather 0 3 2 5
RMG 0 5 6 11
Silk products 0 0 3 3
Towel 2 2 1 5
Vegetable seeds 0 1 0 1
Woolen carpet 0 0 1 1
Total 12 17 25 54
Source: Author’s calculation.
20 000
15 000
10 000
5 000
0
P R O D Y_ T
P
50 100 150 200
Path_TP

8/11/2019 Trade performance and competitiveness: Selected issues relevant for Asian developing economies
http://slidepdf.com/reader/full/trade-performance-and-competitiveness-selected-issues-relevant-for-asian-developing 74/215
54
Notably, clothing has been the launching pad of industrialization and export
diversification in many developing countries. Even among agricultural products, freshvegetables and vegetable seeds have above-average Path and Strategic Value when
compared to the NTIS product set, excluding iron and steel. After pressure from the
Garment Association of Nepal, in September 2012 the government decided to include RMG
in the NTIS list of priority products. However, strategies specific to that sector are yet to be
formulated.31
Finally, in combining NTIS products and Trade Policy products (excluding iron and
steel, which yields 77 products), findings show that among the top 20 products in terms of
Strategic Value, 19 products are exclusive to Trade Policy, while one product is common toboth. In sum, quite a few of the products identified by Trade Policy hold greater potential for
export diversification and structural transformation than many NTIS products, particularly
when excluding iron and steel.
In 2010, 36 of the Trade Policy products were not exported with comparative
advantage, hence strictly belong to the Open Forest (table 19). Three fourths of them are
nearby products, including manufactured products such as leather goods, paper products
and towel. These have relatively high sophistication, connectedness and/or Strategic Value.
About a dozen of the Trade Policy-identified nearby products have medium-to-high Path
and Strategic Value. This is greater than the average of nearby products in the Open Forest
Table 18. Number of products exceeding median values of comparator groups
Trade Policy group Path> Path> SV> Path> SV> Path> SV> SV>
Export NTIS NTIS NTIS- NTIS- Open open Nearby_
basket iron, iron, Forest forest open
steel steel forest
Fresh vegetables 0 0 0 2 2 2 0 2
Gems and jewellery 0 0 0 0 1 0 0 1
Handicraft (non-wood) 0 0 0 1 2 1 0 1
Leather goods 2 2 2 4 4 3 2 4
Paper products 9 8 8 9 10 9 8 10
Processed leather 1 0 1 3 3 1 0 3
RMG 1 0 0 5 2 2 0 1
Towel 3 3 2 4 4 3 2 4
Vegetable seeds 0 0 0 1 1 0 0 1
Total 16 13 13 29 29 21 12 27
Source: Author’s calculation.
31 “Govt to include garment in NTIS,” Republica, 8 September 2012, http://www.myrepublica.com/portal/
index.php?action=news_details&news_id=41317

8/11/2019 Trade performance and competitiveness: Selected issues relevant for Asian developing economies
http://slidepdf.com/reader/full/trade-performance-and-competitiveness-selected-issues-relevant-for-asian-developing 75/215

8/11/2019 Trade performance and competitiveness: Selected issues relevant for Asian developing economies
http://slidepdf.com/reader/full/trade-performance-and-competitiveness-selected-issues-relevant-for-asian-developing 76/215
56
Table20.Featuresof
“other”NTISproducts
SITC
Product
Leamer
PRODY
Path
Strategic
P
RODY
Path
Distancefrom
code
group
value
tercile
tercile
current
exp
ortbasket
223
Milk&cream,fresh,
Animal
15,617.02
156.01
12,934.60
high
high
middle
no
tconcentratedorsweetened
products
224
Milk&cream,preserved,
Animal
15,704.30
131.91
10,443.87
high
medium
middle
co
ncentratedorsweetened
products
230
Butter
Animal
18,586.19
143.02
12,161.97
high
medium
products
240
Cheeseandcurd
Animal
18,067.83
167.50
13,253.28
high
high
middle
products
611
Sugars,beetandcane,
Tropical
6,461.67
74.16
4,554.49
low
low
nearby
ra
w,solid
agriculture
612
Refinedsugarsand
Tropical
5,718.05
138.51
9,740.18
low
medium
nearby
otherprod.ofref.beet/cane
agriculture
6612
Portlandcement,ciment
Labour
9,491.74
140.98
9,391.88
low
medium
Error!
Bookmark
fondu,slagcementetc.
intensive
notde
fined.
7711
Tr
ansformers,electrical
Machinery
12,421.36
151.66
10,603.38
medium
high
S o u r c e :
Auth
or’scalculation.

8/11/2019 Trade performance and competitiveness: Selected issues relevant for Asian developing economies
http://slidepdf.com/reader/full/trade-performance-and-competitiveness-selected-issues-relevant-for-asian-developing 77/215
57
products. Interestingly, whereas agricultural products generally depict lower-than-average
PRODY, Path and Strategic Value, the four dairy products surpass the majority of the main
NTIS products on these attributes. Note that powder milk33 production is a priority industry
as per Industrial Policy. This can also be said of cement production, which despite having
low PRODY, has medium Path, greater than the average main NTIS product. Except rawsugar, all “other” NTIS products have medium-to-high Path. Two (butter and transformer) of
the 8 products were exported with comparative advantage in 2010. The remaining six
belong to the Open Forest – 3 middle-distance from and 3 nearby the current export basket
(containing goods exported with comparative advantage).
H. Discussion
With regard to its export sector, the challenges facing Nepal can be broadly
grouped under two clusters. The first challenge is to increase the quantum (volume andvalue) of exports so as to stop the burgeoning trade deficit. More importantly, to create
employment and generate income for an expanding labour force, raise economic growth
and alleviate poverty. This first challenge is more pressing and has to be addressed
immediately. The second challenge is to diversify and increase the sophistication and
complexity of the export basket, that is, to produce and export a wider range of new and
increasingly sophisticated and complex products.
Addressing the second challenge takes a longer period of time than the first, as it
pertains to structural transformation of an economy. Also, it may not immediately addressthe first challenge. Given resource constraints (among other things), at times policymakers
could face a trade-off between according priority to tackling the two challenges. However,
addressing the second challenge is critical for ensuring sustained per capita income growth
over the long run, as mounting evidence shows. This is discussed in Section 3.
Policymakers should explore ways to increase the sophistication of exports when
strategizing and directing resources to develop the sector. This would enable meeting the
urgent objectives of immediate income and employment generation, as well as poverty
alleviation.
Considerations of export potential and socio-economic impact underlie the choice of
products for priority development and promotion in policy, notably Trade Policy 2009 and
NTIS 2010. Export potential points to mainly demand, market access and competitiveness
conditions, and supply-side capacities, while socio-economic impact is mainly employment
and income generation, poverty reduction, and backward linkages.
Attention to socio-economic impact is guided by national development goals and
objectives. Attention to export potential reflects realism. Products to be targeted for export
promotion must have favourable demand and market access conditions. They must be
fairly competitive, and there must exist (or there must be a strong potential for the
emergence of) a domestic supply capacity associated with these products. In view of the
33 It is not captured individually under SITC 4-digit classification.

8/11/2019 Trade performance and competitiveness: Selected issues relevant for Asian developing economies
http://slidepdf.com/reader/full/trade-performance-and-competitiveness-selected-issues-relevant-for-asian-developing 78/215
58
power crisis (which could act as a critical supply-side constraint), NTIS takes into account
the electricity intensity in production. All, but iron and steel products, have low-to-medium
electricity intensity.
While Trade Policy 2009 provides the overall trade-related policy direction, it is
NTIS 2010 that is to guide the Government’s trade-related priorities until 2015. The
Government has allocated budget specifically for NTIS implementation. Hence, the
products identified in NTIS (some of which are also in Trade Policy) would take precedence
over other Trade Policy products, in terms of priority accorded for development and
promotion. NTIS products differ in their sophistication and potential for structural
transformation. However, overall they are below-average on these parameters.
Iron and steel products have mostly high-to-medium sophistication and
connectedness, as well as above-average Strategic Value. Also, most of it lies in the “core”
of the product space. Agriculture products, such as tea, lentil, ginger, cardamom andmedicinal herbs are at the low end. Handmade paper, some pashmina and wool products,
honey and essential oils offer better prospects. Trade Policy products (products exclusive
to Trade Policy) are also overall below-average, but fare better than some NTIS products.
This is particularly when iron and steel products are excluded from the NTIS product set.
Leather goods, paper products, processed leather, vegetable seeds, towel and non-wood
handicraft hold prospects that are above average. These also surpass quite a few NTIS
products. Note that paper production has been listed as a priority industry in Industrial
Policy 2010. RMG and woolen carpets, still among the major exportable goods of the
country, are notably excluded from NTIS, although, they are on the Trade Policy list. Whilewoolen carpets (here captured by a single SITC code) are well below average, in terms of
sophistication and potential for structural transformation, a few RMG product categories
fare better than the average NTIS product. Thus, there is some scope to better the
prospects of achieving greater export sophistication and diversification by drawing in some
of the products identified by Trade Policy, but excluded from NTIS. Also to be noted is that
Trade Policy, while representing a greater range of manufactured products than NTIS, has
fewer capital-intensive products. Also, some of the “capital-intensive” products in Trade
Policy are, in practice, relatively labour-intensive in the Nepali context (e.g. carpet, silk
products, leather and leather products).
Of course, the choice of products for targeting is limited by the concentration of
Nepal’s effective exportable products (here defined as those with RCA>1) in the periphery
of the product space. In turn, this is responsible for nearby products in the option set of
unexploited opportunities (the Open Forest) being relatively low in sophistication and
Strategic Value. And nearby products are those that can be relatively easy to produce and
export effectively, given the economy’s current capabilities. The question is whether the
possibilities (however limited) for export diversification and structural transformation offered
by nearby products in the Open Forest are being optimally captured while targetingproducts.
Quite a few of the targeted products (39 per cent of NTIS products and 33 per cent
of Trade Policy products) are exported with comparative advantage, and hence do not

8/11/2019 Trade performance and competitiveness: Selected issues relevant for Asian developing economies
http://slidepdf.com/reader/full/trade-performance-and-competitiveness-selected-issues-relevant-for-asian-developing 79/215
59
belong to the Open Forest in a strict sense. A dogmatic argument would be that such
products should not be targeted at all, as they do not lie in the Open Forest. But in practice,
it may not be sensible when targeting products to only include those not exported with
comparative advantage, thereby excluding all products exported with comparative
advantage. This is even if the basis for targeting is purely the potential for structuraltransformation (which is rarely the case). As the rationale for targeting, a product may be
exported with comparative advantage in a technical sense (defined as RCA>1). However,
there may be considerable need and scope to enhance the capabilities associated with its
production and exportation. This is especially with regard to increasing production and
exports.
Our approach, therefore, has been to regard all identified products as not being
effectively exported and then assess their sophistication, connectedness and Strategic
Value. The majority of NTIS and Trade Policy products have Strategic Value less than the
median of Open Forest products, while the opposite is true when the comparison is made
with only the median of Open Forest nearby products. However, in the latter case the
above-average products are mostly iron and steel. Furthermore, among the 39 NTIS and
Trade Policy products that lie strictly in the nearby area of the Open Forest, about half have
medium-to-high Path and Strategic Value greater than the median of all the nearby Open
Forest products.
However, it is notable that five NTIS products (out of 12 that are in the nearby area
of Open Forest) are among the top 25 nearby Open Forest products in terms of Strategic
Value. These are also only iron and steel products, and only four Trade Policy products (outof 27). Similarly, only 4 NTIS products are among the top 25 middle-distance Open Forest
products in terms of Strategic Value. Again, all iron and steel (out of 21 that are in the
middle-distance area of the Open Forest), and 2 Trade Policy products (out of 5). Likewise,
none of the NTIS products (out of four that are in the faraway area of the Open Forest) and
only 1 Trade Policy product (out of 4) is among the top 25 faraway Open Forest products in
terms of Strategic Value. Overall, out of the identified 73 products that lie in the Open
Forest (37 NTIS and 36 Trade Policy), only 2 products (one Trade Policy and one NTIS) are
among the top 25 products in the Open Forest in terms of Strategic Value.
Therefore, there are some unexploited products with relatively high potential for
further export diversification that should be considered while targeting products. This is, of
course, subject to the condition that certain minimum demand, supply-side and
competitiveness conditions are met. Attention must be paid to the fact that some nearby to
middle-distance products in the Open Forest with relatively high Strategic Value and
interconnectedness are textiles. Most are not featured on either NTIS 2010 or Trade Policy
2010. That these are close to Nepal’s current industrial and export capabilities is consistent
with the fact that exports of non-carpet textiles, like yarn and fabrics, have nearly trebled in
value during 2003-2011. This nearly offsets the sharp decrease in clothing exports, andmakes up about a quarter of merchandise exports in 2011. Even if it involves capital-
intensive production (as per Leamer classification) and depends largely on imported raw
materials, its capital-intensiveness and import dependence is unlikely to be higher than that
of iron and steel. These were targeted by NTIS 2010. Additionally, some of the “other”

8/11/2019 Trade performance and competitiveness: Selected issues relevant for Asian developing economies
http://slidepdf.com/reader/full/trade-performance-and-competitiveness-selected-issues-relevant-for-asian-developing 80/215
60
export potential products identified by NTIS have greater connectedness and Strategic
Value than most of the “main” NTIS products, excluding iron and steel. These “other” export
potential products, such as dairy products and cement, are not accorded priority.
The challenge in targeting lies in striking a balance between achieving short-term
efficiency and realization of urgent socio-economic goals, and the long-term imperative of
structural transformation. While these short-term goals aim to follow the signals of
comparative advantage, reliance on comparative advantage alone will not generate
structural transformation.
Given current capabilities, it is neither feasible nor desirable to attempt to “jump” to
the so-called “core” of the product space (mainly machinery and chemicals). Nepal’s
position at the “core” is sparse, except for iron and steel. That would be taking the
comparative advantage-defying industrialization strategy to the extreme (see Lin and
Chang 2009 for a debate on industrialization strategy). The success of such a strategy isfraught with high uncertainty, even as scarce resources are diverted away from sectors –
i) that exhibit comparative advantage or in which the acquisition of comparative advantage
will not exact high short-term costs; ii) that have high potential to realize urgent socio-
economic goals of, for example, employment generation and poverty reduction; iii) that
offer moderate prospects for further industrialization and export sophistication and
diversification, albeit not on the grand scale presented by “core” products.
Moreover, in the presence of production fragmentation and rising intermediate good
trade, outward sophistication or complexity of a final product does not tell the actual extent(or nature) of value addition and manufacturing that takes place in a particular country.
Products falling under SITC (Rev. 2) 2-digit codes 67 (iron and steel) and 69 (manufactures
of metals, nes) are among the so-called “core” products. The former accounted for about
15 per cent of Nepal’s merchandise exports in 2010, and all are targeted in NTIS. These
products augur well for structural transformation, having well-above-average PRODY, Path
and Strategic Value and leading the NTIS products on these parameters. But the industry is
totally dependent on imported raw materials, with little prospects for backward linkages,
and value added is roughly 20 per cent of total cost (GoN, 2010c).
Major exports include cold rolled steel sheets, galvanized color-coated steel sheets,
black galvanized steel pipes and black galvanized wires. But production is based on
imports of hot-rolled coil, sheets, steel wires, MS billets, sponge iron, and zinc (GoN,
2010c). Imports are mostly from India, and exports are destined mostly for India. To keep
abreast of international development, many companies invest in the latest technology in
most of the product lines on a regular basis. The companies also increase productivity and
quality and kept operating costs relatively competitive (GoN, 2010c). However, most of the
products are low-technology products, despite falling into the “core” of the product space.
The import dependence should not be held too much against the industry, particularly if
export volume is huge and growing, and given the relatively high sophistication and
connectedness of the products. But neither should the import dependence aspect be
dismissed when assessing the relative merits of targeting products. With scant domestic
raw material base, enhancing labour productivity and continuous technological up-

8/11/2019 Trade performance and competitiveness: Selected issues relevant for Asian developing economies
http://slidepdf.com/reader/full/trade-performance-and-competitiveness-selected-issues-relevant-for-asian-developing 81/215
61
gradation for vertical product diversification and quality upgrading34 will be vital to making
exports of this sector sustainable.
The heavy industry should gear its development towards the domestic market to
create a foundation for breaking into export markets, if possible at all. Nepal’s iron and steel
industry, for one, predominantly caters to the domestic market and its first units were
established in the 1980s. Exports of iron and steel products have been notable only in the
last decade or so, and they are concentrated in the Indian market. Without the experience
of catering to the domestic market, breaking into the Indian market is likely to be difficult. It
follows that if effective exports of machinery (another “core” product) are to be aimed at,
then first the machinery industry for the domestic market should be developed, for example
agriculture tools and equipment, and industrial machinery. The machinery industry is listed
as a priority industry by the Industrial Policy 2010.
The method of product space analysis to assess structural transformationpossibilities is based on exports. It fails to capture the possibilities associated with import-
substituting sectors. For example, Nepal’s pharmaceutical industry caters significantly to
the domestic market in certain generic drugs (albeit in limited segments, mostly therapeutic
drugs of oral dosage forms – production of formulations from imported pharmaceutical
starting material).35 However, it has not been able to significantly break into export markets,
although industrialists say export potential exists.36 Preparations are underway by several
producers to export some pharmaceutical products.37 Note that pharmaceutical products
have quite high sophistication, connectivity with other products and Strategic Value, with
relatively high potential contribution to structural transformation. The product spaceanalysis does not recognize the country as possessing capabilities in pharmaceutical
production, as production is almost exclusively for the domestic market. For this reason,
they appear middle-distance or faraway from the current capabilities in the Open Forest.
This is neither an argument for or against targeting pharmaceuticals (although the Industrial
Policy lists them as a priority industry, and given Nepal’s endowment of medicinal plants
and heritage of traditional medicine, Ayurveda medicines may be a niche area in which
Nepal can develop competitive advantage). The point is that a comprehensive view of
structural transformation must also take into account the import-competing sectors. These
are important in their own right as tradable sectors and also for holding some possibilitiesfor exports.
As noted in the limitations section earlier, the methods employed in this paper do
not capture within-product sophistication, or quality of a product. While greater horizontal
34 This cannot be adequately captured by analysis at the SITC (Rev. 2) 4-digit level.
35 See Ministry of Health and Population/Government of Nepal and World Health Organization, Nepal
pharmaceutical country profile, September 2011; Budhathoki, Sushila, “Drug drive: The rising business of
pharmaceutical companies in Nepal”, Cover story, New Business Age, August 2012.
36 Umesh Lal Shrestha, President, Nepal Association of Pharmaceutical Producers and Managing Director,
Quest Pharmaceuticals Pvt Ltd, in an interview to Karobar national business daily (“Nepali pharmaceuticals are
of good quality yet low-priced”, 8 February 2011, p.12).
37 Oli, Sujan. “Four firms preparing to export pharmaceuticals within six months”, Arthik Abhiyan,
18 September 2012, p.1.

8/11/2019 Trade performance and competitiveness: Selected issues relevant for Asian developing economies
http://slidepdf.com/reader/full/trade-performance-and-competitiveness-selected-issues-relevant-for-asian-developing 82/215
62
diversification and across-product sophistication are important, vertical diversification and
quality upgrading of existing exports are equally important. Within apparel, for instance,
“products exported by rich countries (or processes undertaken by them) – are likely to be
more skill and technology intensive, and yield higher wages and margins, than
standardized products exported by poor countries” (Lall et al., 2005). The case for verticalproduct diversification and quality upgrading is also critical for targeted products. NTIS
gives top priority to agro-food products, which are mostly unsophisticated products with
little connectedness with other products (see product space analysis above). However,
there is a window of opportunity for leveraging agro-food production for industrialization
purpose in the NTIS product-specific action matrix. It recognizes the need to achieve
horizontal and vertical product diversification, value addition and processing with regard to
the identified agro-food commodities. For example, in the case of cardamom, it strategizes
exploring avenues for product diversification, catering to spice, essential oil, cardamom
paper, incense, and color extraction industries. It saw high potential for diversification intoginger-based products (jam, jelly, candy, sauce, oleoresin). At present, even simple drying
of ginger is not generally done in Nepal. In the case of herbs and essential oils, NTIS
identifies the need to initiate R&D efforts towards processed products, such as perfumes,
food flavoring elements, and fragrances. It also sees the need to introduce a policy to
intensify the use of raw herbs in the production of essential oils and herbal products.
Product diversification opportunities in the tea sector are to be explored, based on taste
and quality preferences.
Through value addition, processing and vertical product diversification, there is
scope for not just increasing exporting earnings, but also producing more complex products
based on agro-forestry resources. This holds true for both NTIS and Trade Policy products,
as well as other agriculture and forest products that may be identified in future. Not all
products are the same, in that both medicinal plants and essential oils are targeted by
NTIS. However, essential oils (based on medicinal plants) are far more interconnected with
other products than medicinal plants.
On average, processed agro/forestry/food products are more sophisticated and
carry greater potential for structural transformation than do primary commodities. Focusing
on such products that are relatively nearby, Nepal current’s export basket could offer a feasible path to structural transformation without compromising the objectives of mass
employment creation and poverty alleviation. Table 21 compares summary statistics of
PRODY, Path and Strategic Value of processed agro products not currently exported by
Nepal with comparative advantage. However, the products lie at a near-to-medium distance
from Nepal’s current export basket (RCA>1) with those of non-processed agro products,
whether exported by Nepal or not.
To enhance industrialization in the long term, capabilities must be increased to
competitively produce more sophisticated manufactured products, using domestic primaryagro-forest resources. These are highly connected with other products (e.g. perfumery
instead of just essential oils from aromatic plants, Ayurveda medicine from medicinal
plants/herbs, dye from cardamom, diverse paper products based on handmade paper
made of local plants).
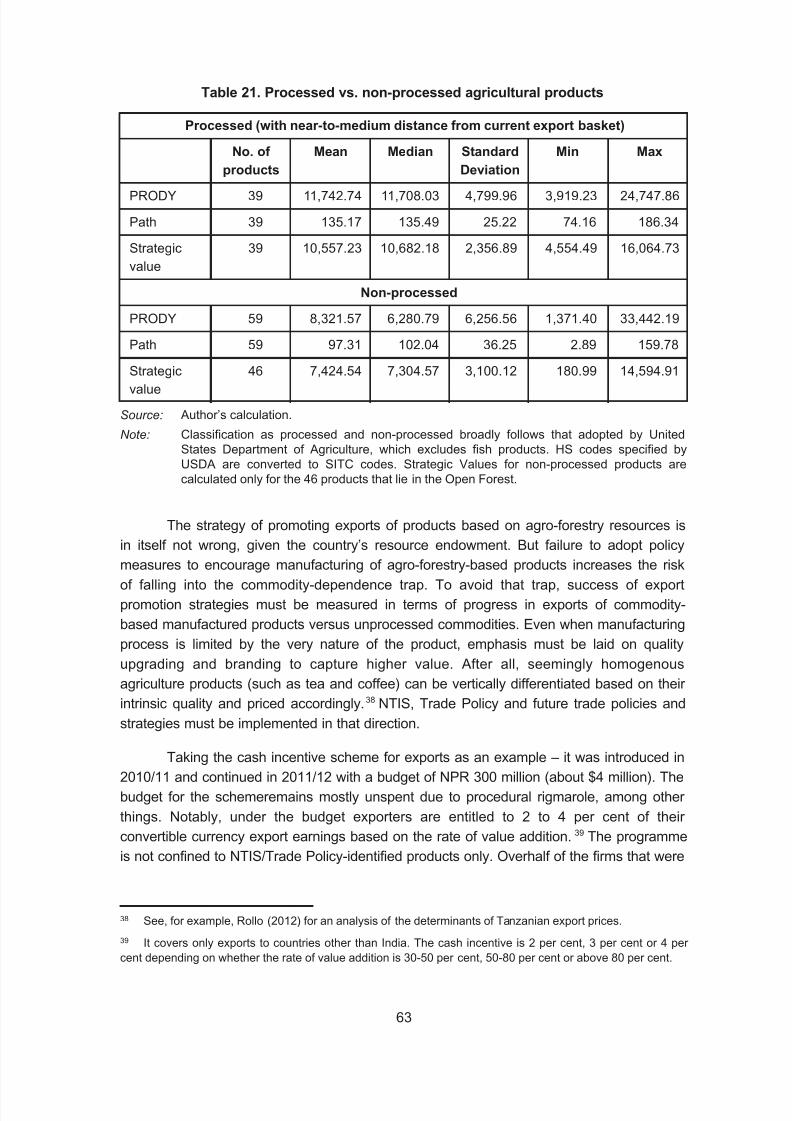
8/11/2019 Trade performance and competitiveness: Selected issues relevant for Asian developing economies
http://slidepdf.com/reader/full/trade-performance-and-competitiveness-selected-issues-relevant-for-asian-developing 83/215
63
The strategy of promoting exports of products based on agro-forestry resources is
in itself not wrong, given the country’s resource endowment. But failure to adopt policy
measures to encourage manufacturing of agro-forestry-based products increases the risk
of falling into the commodity-dependence trap. To avoid that trap, success of export
promotion strategies must be measured in terms of progress in exports of commodity-
based manufactured products versus unprocessed commodities. Even when manufacturing
process is limited by the very nature of the product, emphasis must be laid on quality
upgrading and branding to capture higher value. After all, seemingly homogenous
agriculture products (such as tea and coffee) can be vertically differentiated based on their
intrinsic quality and priced accordingly.38 NTIS, Trade Policy and future trade policies and
strategies must be implemented in that direction.
Taking the cash incentive scheme for exports as an example – it was introduced in
2010/11 and continued in 2011/12 with a budget of NPR 300 million (about $4 million). The
budget for the schemeremains mostly unspent due to procedural rigmarole, among other
things. Notably, under the budget exporters are entitled to 2 to 4 per cent of their
convertible currency export earnings based on the rate of value addition.39 The programme
is not confined to NTIS/Trade Policy-identified products only. Overhalf of the firms that were
Table 21. Processed vs. non-processed agricultural products
Processed (with near-to-medium distance from current export basket)
No. of Mean Median Standard Min Max
products Deviation
PRODY 39 11,742.74 11,708.03 4,799.96 3,919.23 24,747.86
Path 39 135.17 135.49 25.22 74.16 186.34
Strategic 39 10,557.23 10,682.18 2,356.89 4,554.49 16,064.73
value
Non-processed
PRODY 59 8,321.57 6,280.79 6,256.56 1,371.40 33,442.19
Path 59 97.31 102.04 36.25 2.89 159.78
Strategic 46 7,424.54 7,304.57 3,100.12 180.99 14,594.91
value
Source: Author’s calculation.
Note: Classification as processed and non-processed broadly follows that adopted by UnitedStates Department of Agriculture, which excludes fish products. HS codes specified byUSDA are converted to SITC codes. Strategic Values for non-processed products arecalculated only for the 46 products that lie in the Open Forest.
38 See, for example, Rollo (2012) for an analysis of the determinants of Tanzanian export prices.
39 It covers only exports to countries other than India. The cash incentive is 2 per cent, 3 per cent or 4 per
cent depending on whether the rate of value addition is 30-50 per cent, 50-80 per cent or above 80 per cent.

8/11/2019 Trade performance and competitiveness: Selected issues relevant for Asian developing economies
http://slidepdf.com/reader/full/trade-performance-and-competitiveness-selected-issues-relevant-for-asian-developing 84/215
64
awarded the incentive (in 2011/12)40 are agro-food exporters. This is most likely because
domestic value addition should be naturally high for agro-food products, including
unprocessed ones (Kharel, 2012). Simplifying the procedures for granting the cash
incentive could increase the utilization of the scheme and many exporters demanded a flat
rate of incentive irrespective of value addition. However, procedural problems had to bebalanced against the need to encourage as much domestic value addition as possible. The
Ministry of Commerce and Supplies suggested providing cash incentive at a flat rate,
irrespective of value addition, or product-specific rates.41
But apart from procedural issues, it is not clear whether provision of the incentive
will actually induce the exporters concerned to export more (ibid.). Addressing critical
domestic supply-side constraints to exports requires provision of facilities in the nature of
public good or service (e.g. strengthened laboratories, quality inputs, research and
extension). Using cash incentive scheme budget to alleviate these constraints in a targeted
manner is an option worth exploring, as exporters/producers are unable to overcome the
constraints individually (ibid.).
Additionally, policymakers should also be mindful of the possibility the scheme may
create a bias against production and export of processed agro-forest products, including
agro-forest-based industrial products (ibid.). This is since exports of agriculture and forest
products in raw form are likely to qualify for 4 per cent cash incentive by virtue of them
being produced/naturally growing within the country.
Another issue related to the incentive regime is the proposed Special EconomicZone (SEZ), where enterprises are entitled to a range of tax and non-tax incentives and
facilities. While the construction of two SEZs is progressing, and the GoN has announced
its plan to develop six more, the SEZ Bill is still pending in parliament. Interestingly, NTIS
2010 calls for the removal (in the draft SEZ Bill) of the 75 per cent export requirement for
enterprises based in the zone. As the primary purpose of establishing SEZs is to promote
exports (as mentioned in Industrial Policy 2010), the proposal to remove the 75 per cent
export requirement could detract from the potential of using SEZs as an instrument to
increase exports. This is in the context of an extremely poor export performance of Nepal.
Furthermore, as the facilities and concessions granted to firms located in the zones entailcost to the government and represent scarce resources to be utilized most judiciously
(Kharel, 2012).
A dedicated special export zone or a special export zone located within an SEZ can
address this issue, but this is not being considered. NTIS 2010 also recommends that
a positive list be replaced with a negative list specifying the types of industries that SEZs
cannot host. However, if exports are to be sustainable and broad-based conferring greater
benefits on the economy, the SEZs should be used as an instrument of encouraging higher
(genuine) sophistication and domestic content of exports (not just increasing the quantum
40 Rijal, Krishna. 2012. “Cash incentives to 57 export-oriented firms,” Arthik Abhiyan, 2 August, p.1 and 5.
41 “Flat rate or commodity-based rate recommended for export incentives”, Republica (online), 11 November
2012.
8/11/2019 Trade performance and competitiveness: Selected issues relevant for Asian developing economies
http://slidepdf.com/reader/full/trade-performance-and-competitiveness-selected-issues-relevant-for-asian-developing 85/215
65
of exports), and the facilities provided therein should be aimed at encouraging the
acquisition of the required production and export capabilities. This would call for some
judicious discriminationon grounds of tradability of goods and services, backward
integration, value addition and degree of transformation in the production process, despite
the associated administrative difficulties.
Technology is a major factor behind export sophistication and, by implication, export
location. Other major economic factors are marketing, logistics and proximity, fragment
ability, information and familiarity, natural resources, infrastructure, and value chain
organization (Lall et al., 2005). Policy factors – such as trade and industrial policies, trading
blocs and trade preferences – also play a role in determining patterns of specialization and
export sophistication, and location (ibid.).
Supply-side constraints (SSCs) affect both the quantum of exports and the type of
goods exported. Critical SSCs traditionally facing Nepal include inadequate infrastructure,low human capital and inadequacy of trade facilitation measures (including the cost of
being landlocked) (see Adhikari, 2011). These should be distinguished from deteriorating
industrial relations, frequent strikes and shutdowns. As well as deteriorating security
situation that have vitiated the overall business/investment climate and brutalized the
manufacturing sector since 2006.
The growth diagnostics framework for identifying the binding constraints to growth,
considers low export sophistication, low export diversification and very limited export
sophistication possibilities (low Open Forest) as “symptoms” of coordination failure andself-discovery externalities (Hausmann et al., 2005 and 2008). However, in the context of
Nepal, these also appear to be symptoms of other constraints – notably those concerning
infrastructure, human capital and finance. This acts to keep possibilities of export
sophistication and diversification at low levels. For example, a producer’s reluctance or
inability to upgrade his capabilities to produce more sophisticated goods – say, moving
from simple processing of aromatic plants to extracting essential oils from them, to
manufacturing perfumery – could be due to lack of resources to purchase the required
machinery or lack of knowledge of such possibilities. This is rather than, say, the concern
that competitors will also follow suit after seeing his success.
Finally, the manufacturing export sector is a part of the national manufacturing
sector, that is characterized by low productivity and whose performance in the recent
decade has been alarmingly poor. As seen in Section 4, despite structural change in the
Nepali economy being growth-enhancing in the recent decade, overall productivity growth
has been low. Productivity growth in manufacturing has been negative. Due to weak
manufacturing performance and the limited capacity of other sectors to absorb surplus
labour, the shift in labour from agriculture to more productive sectors has been slow. Policy
measures aimed at expediting structural transformation of the economy must foremost be
directed at shoring up the ailing manufacturing sector.

8/11/2019 Trade performance and competitiveness: Selected issues relevant for Asian developing economies
http://slidepdf.com/reader/full/trade-performance-and-competitiveness-selected-issues-relevant-for-asian-developing 86/215
66
Conclusion
This paper reports on the investigation into the nature of recent economic growth in
Nepal. It uses some of the analytical tools and insights from recent literature on the
importance of structural transformation as a facilitator of long-term growth. In particular, itexamines the extent Nepal’s recent trade policy initiatives take into account the long-term
potential to assist economic growth. This is through the encouragement of production and
export of goods and services, which could facilitate the shift of economic activities towards
more complex and sophisticated products. In turn, it has the potential to set the economy
on a sustainable long-term growth trajectory.
The analysis shows that while economy-wide structural change – reallocation of
labour across sectors – has contributed positively to productivity growth in Nepal in a recent
decade, overall productivity growth has been low. More so, productivity growth in
manufacturing has been negative, and due to weak manufacturing performance and the
limited capacity of other sectors to absorb surplus labour, the shift in labour from agriculture
to more productive sectors has been slow. To address the root causes of these problems,
attention should be drawn to symptoms of de-industrialization and demand appropriate
policy measures. This would also further expedite structural transformation of Nepal’s
economy.
Although, trade has been recognized as an engine of growth at the policy level,
export performance has been weak, particularly so in the past decade. This is despite
policy measures, over the last two decades, to integrate the Nepali economy into the globaleconomy, mainly through economic liberalization. Nepal’s export performance has been
moribund, in terms of value and growth. More so, its merchandise export basket remains
low in technological sophistication and poorly diversified. Structural transformation, as
measured by the rate of increase in the sophistication of the export basket, has slowed
sharply in the last decade. Further, opportunities for producing and exporting new and more
sophisticated goods (as represented by the export basket) are limited. The expansion of
such opportunities has slowed down significantly. The challenge that Nepal faces on the
export front is two-fold – a) to increase the export earnings and employment by increasing
the export of existing products, given the current industrial and export structures andcapabilities. This is so as to reduce the ever-widening trade imbalance and increase
income and employment levels, and b) to upgrade the industrial and export structures, and
capabilities to be able to produce and export (or expand) the production and export of more
sophisticated products requiring a greater number of capabilities.
Considerations of export potential, socio-economic impact and utilization of
domestic agro-forestry resources underlie the choice of products for priority development
and promotion in the Government of Nepal’s policy documents, notably Trade Policy (TP)
2009 and Nepal Trade Integration Strategy (2010). While Trade Policy 2009 provides theoverall trade-related policy direction, it is NTIS 2010 that is to guide the government’s
trade-related priorities until 2015. NTIS accords top priority to agro-food products. Our
analysis shows that NTIS products differ in their sophistication and potential for structural
8/11/2019 Trade performance and competitiveness: Selected issues relevant for Asian developing economies
http://slidepdf.com/reader/full/trade-performance-and-competitiveness-selected-issues-relevant-for-asian-developing 87/215
67
transformation, but overall they are below-average on these parameters. Iron and steel
products have mostly high-to-medium sophistication and connectedness and above-
average Strategic Value, and most of them lie in the “core” of the product space. However,
agriculture products like tea, lentils, ginger, cardamom and medicinal herbs are at the low
end. Handmade paper, some pashmina and wool products, honey and essential oils offer better prospects. Trade Policy products (that is, products that are exclusive to Trade Policy)
are also overall below-average, but fare better than some NTIS products, particularly when
iron and steel products are excluded from the NTIS product set. Leather goods, paper
products, processed leather, vegetable seeds, towel and non-wood handicraft hold
prospects that are above average, as well as surpassing quite a few NTIS products. There
is some scope to better the prospects of achieving greater export sophistication and
diversification by drawing in some of the products identified by Trade Policy, but excluded
from NTIS.
The choice of products for targeting is limited by the concentration of Nepal’s
effective exportable products in the periphery of the product space, with low sophistication
and low connectedness. In turn, this is responsible for most of the unexploited “nearby”
products being relatively low in sophistication, connectedness and Strategic Value. This
would involve producing and exporting the “nearby” products, which requires capabilities
similar to the existing capabilities. However, there exist some unexploited nearby products
with relatively high potential for further export diversification, which should be considered
while targeting products. Of course, this is subject to the condition that certain minimum
demand, supply-side and competitiveness conditions are met. In addition, some of the
“other” export potential products identified by NTIS, but not accorded priority (such as dairy
products and cement) carry greater potential for structural transformation than the “main”
NTIS products, excluding iron and steel. In future, it is necessary that the structural
transformation dimension also inform trade policymaking and implementation.
Given Nepal’s resource endowment, the strategy of promoting exports of products
based on agro-forestry resources is justified. But unless this is accompanied by policy
measures to encourage manufacturing of agro-forestry-based products, in the long-term
such a strategy increases the risk of falling into the commodity-dependence trap. To avoid
that trap, success of export promotion strategies must be measured in terms of theprogress made in increasing the share of commodity-based manufactured productsover
time. This is due to processed agro/forestry/food products generally being more
sophisticated, and having greater potential for structural transformation than primary
commodities. NTIS, Trade Policy and future trade policies and strategies must be oriented
towards that direction. This ought to be so not only for NTIS products, but also Trade Policy
products and other agriculture and forest products that may be identified in future. Focusing
on such products that are relatively nearby, Nepal current’s export basket could offer a
feasible path to structural transformation without compromising the immediate objectives of
mass employment creation and poverty alleviation. From a long-term perspective, in order to enhance industrialization, capabilities must be increased to competitively produce more
sophisticated manufactured products, using domestic primary agro-forest resources. These
are highly connected with other products (e.g. perfumery instead of just essential oils from

8/11/2019 Trade performance and competitiveness: Selected issues relevant for Asian developing economies
http://slidepdf.com/reader/full/trade-performance-and-competitiveness-selected-issues-relevant-for-asian-developing 88/215
68
aromatic plants; Ayurveda medicine from medicinal plants/herbs; dye from cardamom;
diverse paper products based on handmade paper made from local plants).
Supply-side constraints affect both the quantum (value and volume) and
sophistication of exports. The Government’s latest trade strategy identifies sector-specific
and cross-cutting constraints to exports. It then charts out a course of actions to alleviate
them. In making the effort to alleviate, attention must be paid to product sophistication and
diversification constraints, not just production and exportation of the same type of goods.
Notwithstanding the importance of producing and exporting more sophisticated
products, policymakers must not lose sight of the actual extent (or nature) of value addition
and manufacturing that takes place inside the economy. Sophistication of a final product
alone may shed little light on these aspects. Vertical production diversification and quality
upgrading of existing exports are also important. Furthermore, it must be noted that the
method of product space analysis to assess structural transformation possibilities is basedon exports. It fails to capture the possibilities associated with import-substituting sectors. A
comprehensive view of structural transformation, therefore, must also take into account the
import-competing sectors. These are important as tradable sectors, and full of possibilities
for future exports.
8/11/2019 Trade performance and competitiveness: Selected issues relevant for Asian developing economies
http://slidepdf.com/reader/full/trade-performance-and-competitiveness-selected-issues-relevant-for-asian-developing 89/215
8/11/2019 Trade performance and competitiveness: Selected issues relevant for Asian developing economies
http://slidepdf.com/reader/full/trade-performance-and-competitiveness-selected-issues-relevant-for-asian-developing 90/215
70
Felipe, J., U. Kumar, N. Usui, and A. Abdon. (2010c). “Why Has China Succeeded? And
Why it Will Continue to Do So.” Working Paper No. 611, Levy Economics Institute.
Government of Nepal (GoN). (2009). Trade Policy 2009. Kathmandu: GoN/Ministry of
Commerce and Supplies.
Government of Nepal (GoN). (2010a). Nepal Trade Integration Strategy 2010: Executive
Summary and Action Matrix. Kathmandu: GoN/Ministry of Commerce and Supplies.
Government of Nepal (GoN). (2010b). Industrial Policy 2010. Kathmandu: GoN/Ministry of
Industry.
Government of Nepal (GoN). (2010c). Nepal Trade Integration Strategy 2010: Background
Report. Kathmandu: GoN/Ministry of Commerce and Supplies.
Government of Nepal (GoN). (2011). Three-Year Plan 2010/11-2012/13. Kathmandu: GoN/
National Planning Commission.
Grossman, G.M., and E. Helpman. (1991). “Quality ladders in the theory of growth.” Review
of Economic Studies 58(1): 43-61.
Hausmann, R., and B. Klinger. 2006. “Structural transformation and patterns of comparative
advantage in the product space.” Harvard University Center for International
Development Working Paper No. 128, available at http://www.hks.harvard.edu/
centers/cid/publications/faculty-working-papers/cid-working-paper-no.-128
Hausmann, R., J. Hwang and D. Rodrik. (2007). “What you export matters.” Journal of
Economic Growth 12(1): 1-25.
Hausmann, R., and D. Rodrik. (2003). “Economic development as self-discovery.” Journal
of Development Economics. 72: 603-633.
Hausmann, R., and B. Klinger. (2007). “The structure of the product space and the
evolution of comparative advantage.” Harvard University Center for International
Development Working Paper No. 146 (extended and revised version of No. 128).
Hausmann, R., and C.A. Hidalgo. (2010). “Country diversification, product ubiquity and
economic divergence.” Harvard University Center for International Development
Working Paper No. 201, October.Hausmann, R., B. Klinger and R. Wagner. (2008). “Doing growth diagnostics in practice: A
‘mindbook’. Harvard University Center for International Development Working Paper
No. 177, September.
Hausmann, R., D. Rodrik and A. Velasco. (2005). “Growth diagnostics.” Manuscript, Inter-
American Development Bank.
Helpman, E., and P.R. Krugmann. (1985). Market structure and foreign trade.Cambridge,
MA: MIT Press.
Hidalgo, C.A., and R. Hausmann. (2009). “The building blocks of economic complexity”.PNAS 106(26), 30 June: 10570-10575.
Hidalgo, C.A., and R. Hausmann. (2008). “A network view of economic development.”
Developing Alternatives 12(1): 5-10.

8/11/2019 Trade performance and competitiveness: Selected issues relevant for Asian developing economies
http://slidepdf.com/reader/full/trade-performance-and-competitiveness-selected-issues-relevant-for-asian-developing 91/215
71
Hidalgo, C.A., B. Klinger, A.L. Barabasi and R. Hausmann. (2007). “Product space
conditions the development of nations.” Science 317: 482-487.
Hidalgo, C.A., (2009). “The dynamics of economic complexity and the product space over
a 42 year period.” Harvard University Center for International Development Working
Paper No. 189, December.
Hidalgo, C.A., (2011). Discovering Southern and East Africa’s industrial opportunities.
Economics Policy Paper Series 2011. Washington, D.C.: The German Marshall
Fund of the United States.
Hirschman, A.O., (1958). The strategy of economic development . New Haven, Conn.: Yale
University Press.
ITC. (2007). “Export Potential Assessment in Nepal.” Report prepared by International
Trade Centre, Geneva and Trade and Export Promotion Centre, Kathmandu.
Kaldor, N., (1967). Strategic factors in economic development . Ithaca, NY: New York State
School of Industrial and Labour Relations, Cornell University.
Kharel, P., (2012). Role of commodities in socio-economic development of Nepal. Paper
submitted to United Nations Conference on Trade and Development (UNCTAD),
Geneva, April.
Krugman, P.R., (1979). “Increasing returns, monopolistic competition, and international
trade.” Journal of International Economics 9: 469-479.
Lall, S., (2000). “The technological structure and performance of developing country
manufactured exports, 1995-1998.” Oxford Development Studies, 28(3): 337-369.
Lall, S., J. Weiss and J. Zhang. (2005). “The ‘sophistication’ of exports: A new measure of
product characteristics”. QEH Working Paper Series – QEHWPS 123, January.
Leamer, E., (1984). Sources of international comparative advantage: Theory and evidence.
Cambridge, MA: MIT Press.
Lin, J., and H.J. Chang. (2009). “Should industrial policy in developing countries conform to
comparative advantage or defy it? A debate between Justin Lin and Ha-Joon
Chang.” Development Policy Review 27(5).McMillan, M., and D. Rodrik. 2011. “Globalization, structural change and productivity
growth.” NBER Working Paper Series, w17143, available at www.nber.org
Melitz, M.J., (2003). “The impact of trade on intra-industry reallocations and aggregate
industry productivity.” Econometrica, 71: 1695-1725.
Nepal Rastra Bank, “Recent Macroeconomic Situation”, various issues.
Rodrik, D., (2011a). “The future of economic convergence.” NBER Working Paper 17400,
September, available at www.nber.org/papers/w17400
Rodrik, D., (2011b). “Unconditional convergence.” Centre for Economic Policy Research
Discussion Paper No. 8631, November.

8/11/2019 Trade performance and competitiveness: Selected issues relevant for Asian developing economies
http://slidepdf.com/reader/full/trade-performance-and-competitiveness-selected-issues-relevant-for-asian-developing 92/215
72
Rollo, V., (2012). “Determinants of Tanzanian export prices.” World Bank Policy Research
Working Paper 6225, October.
Romer, P.M., (1990). “Endogenous technological change”. Journal of Political Economy 98
(5, II): 71-102.
Rosenstein-Rodan, P., (1943). “Problems of industrialization of Eastern and South Eastern
Europe.” Economic Journal 53 (June-September): 202-211.
World Trade Organization (WTO). (2012). Trade Policy Review [of Nepal]: Report by the
Secretariat, Geneva.
Xu, B., (2010). “The sophistication of exports: Is China special?” China Economic Review
21: 482-493.
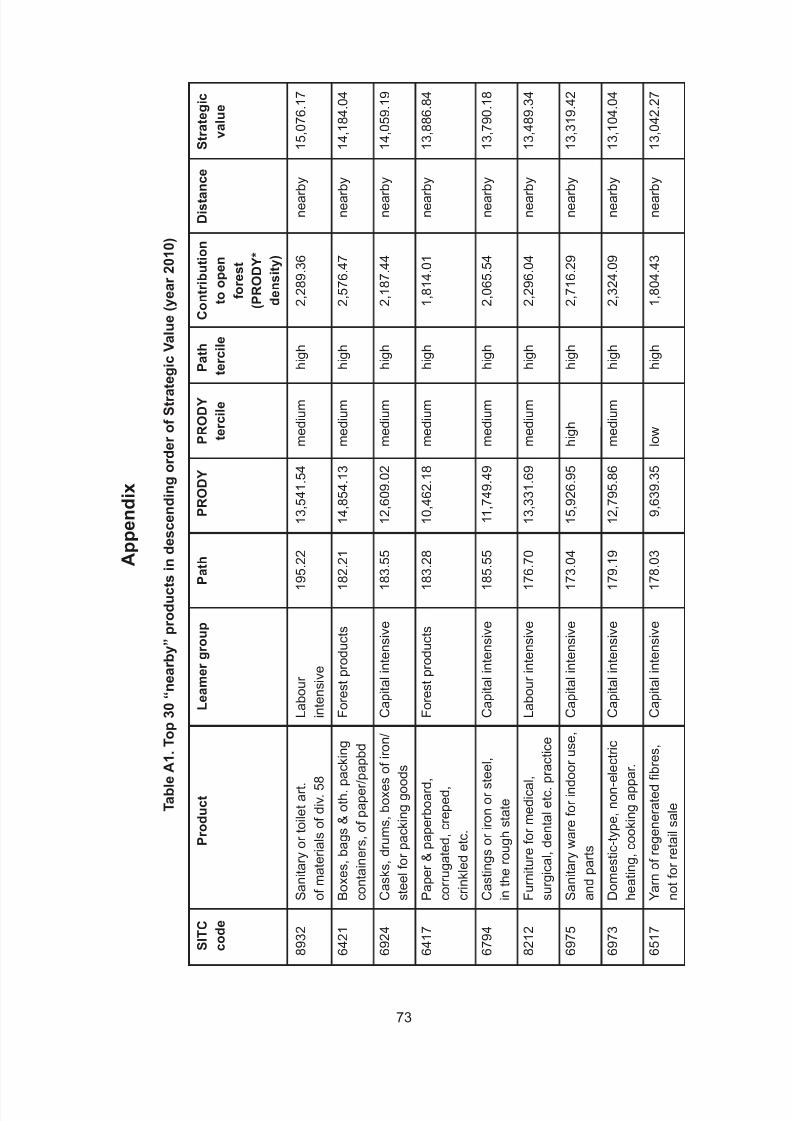
8/11/2019 Trade performance and competitiveness: Selected issues relevant for Asian developing economies
http://slidepdf.com/reader/full/trade-performance-and-competitiveness-selected-issues-relevant-for-asian-developing 93/215
73
Appendix
TableA1.Top30
“nearby”productsindescendingorderofStrategicValue(year2010)
SITC
Product
L
eamergroup
Path
PRODY
PRODY
Pat
h
Contribution
Distance
Strategic
code
tercile
terc
ile
toopen
value
forest
(PRODY*
density)
8932
Sanitaryortoiletart.
La
bour
195.22
13,541.54
medium
high
2,289.36
nearby
15,076.17
ofmaterialsofdiv.58
intensive
6421
Boxes,bags&oth.packing
Fo
restproducts
182.21
14,854.13
medium
high
2,576.47
nearby
14,184.04
con
tainers,ofpaper/papbd
6924
Casks,drums,boxesofiron/Capitalintensive
183.55
12,609.02
medium
high
2,187.44
nearby
14,059.19
steelforpackinggoods
6417
Paper&paperboard,
Fo
restproducts
183.28
10,462.18
medium
high
1,814.01
nearby
13,886.84
cor
rugated,creped,
crin
kledetc.
6794
Castingsorironorsteel,
Capitalintensive
185.55
11,749.49
medium
high
2,065.54
nearby
13,790.18
intheroughstate
8212
Furnitureformedical,
La
bourintensive
176.70
13,331.69
medium
high
2,296.04
nearby
13,489.34
sur
gical,dentaletc.practice
6975
Sanitarywareforindooruse,Capitalintensive
173.04
15,926.95
high
high
2,716.29
nearby
13,319.42
andparts
6973
Domestic-type,non-electric
Capitalintensive
179.19
12,795.86
medium
high
2,324.09
nearby
13,104.04
heating,cookingappar.
6517
Yarnofregeneratedfibres,
Capitalintensive
178.03
9,639.35
low
high
1,804.43
nearby
13,042.27
notforretailsale

8/11/2019 Trade performance and competitiveness: Selected issues relevant for Asian developing economies
http://slidepdf.com/reader/full/trade-performance-and-competitiveness-selected-issues-relevant-for-asian-developing 94/215
74
TableA1.
( c o n t i n u e d )
SITC
Product
L
eamergroup
Path
PRODY
PRODY
Pat
h
Contribution
Distance
Strategic
code
tercile
terc
ile
toopen
value
forest
(PRODY*
density)
6560
Tulle,lace,embroidery,
Capitalintensive
171.36
12,836.79
medium
high
2,497.21
nearby
12,899.75
ribbons,&othersmallwares
484
Bakeryproducts(e.g.bread,Cereals,etc.
170.66
14,416.13
medium
high
2,619.15
nearby
12,820.16
bis
cuits,cakes)etc.
7758
Ele
ctro-thermicappliances,
Machinery
167.83
14,429.25
medium
high
2,637.38
nearby
12,548.79
n.e
.s.
620
Sugarconfectioneryand
Tr
opical
165.64
10,445.02
medium
high
1,773.48
nearby
12,542.11
oth
ersugarpreparations
ag
riculture
8124
Lig
htingfixturesandfittings
Capitalintensive
165.62
14,004.12
medium
high
2,567.28
nearby
12,400.53
andparts
6512
Yarnofwooloranimalhair
Capitalintensive
162.09
12,826.38
medium
high
2,278.88
nearby
12,360.81
(includingwooltops)
6536
Fabrics,wovencontain.
Capitalintensive
163.92
10,978.14
medium
high
2,110.75
nearby
12,254.98
85
percentofdiscont.
reg
ener.fibr.
7752
Ho
useholdtype
Machinery
166.96
13,599.29
medium
high
2,490.03
nearby
12,210.56
refrigerators&foodfreezers
8211
Ch
airsandotherseats
La
bourintensive
172.04
10,686.91
medium
high
2,105.14
nearby
12,161.61
andparts
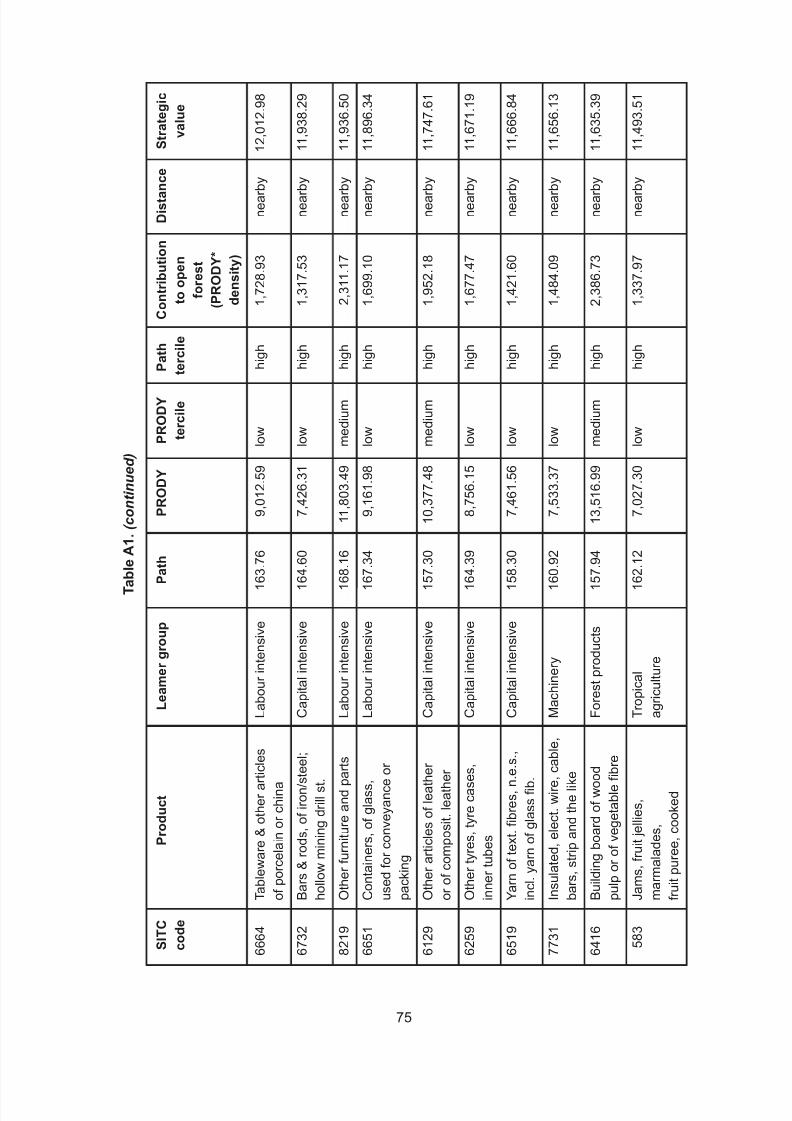
8/11/2019 Trade performance and competitiveness: Selected issues relevant for Asian developing economies
http://slidepdf.com/reader/full/trade-performance-and-competitiveness-selected-issues-relevant-for-asian-developing 95/215
75
TableA1.
( c o n t i n u e d )
SITC
Product
L
eamergroup
Path
PRODY
PRODY
Pat
h
Contribution
Distance
Strategic
code
tercile
terc
ile
toopen
value
forest
(PRODY*
density)
6664
Tab
leware&otherarticles
La
bourintensive
163.76
9,012.59
low
high
1,728.93
nearby
12,012.98
ofporcelainorchina
6732
Bars&rods,ofiron/steel;
Capitalintensive
164.60
7,426.31
low
high
1,317.53
nearby
11,938.29
hollowminingdrillst.
8219
Oth
erfurnitureandparts
La
bourintensive
168.16
11,803.49
medium
high
2,311.17
nearby
11,936.50
6651
Containers,ofglass,
La
bourintensive
167.34
9,161.98
low
high
1,699.10
nearby
11,896.34
use
dforconveyanceor
packing
6129
Oth
erarticlesofleather
Capitalintensive
157.30
10,377.48
medium
high
1,952.18
nearby
11,747.61
orofcomposit.leather
6259
Oth
ertyres,tyrecases,
Capitalintensive
164.39
8,756.15
low
high
1,677.47
nearby
11,671.19
innertubes
6519
Yarnoftext.fibres,n.e.s.,
Capitalintensive
158.30
7,461.56
low
high
1,421.60
nearby
11,666.84
incl.yarnofglassfib.
7731
Insulated,elect.wire,cable,
Machinery
160.92
7,533.37
low
high
1,484.09
nearby
11,656.13
bars,stripandthelike
6416
Buildingboardofwood
Fo
restproducts
157.94
13,516.99
medium
high
2,386.73
nearby
11,635.39
pulporofvegetablefibre
583
Jam
s,fruitjellies,
Tropical
162.12
7,027.30
low
high
1,337.97
nearby
11,493.51
ma
rmalades,
ag
riculture
fruitpuree,cooked

8/11/2019 Trade performance and competitiveness: Selected issues relevant for Asian developing economies
http://slidepdf.com/reader/full/trade-performance-and-competitiveness-selected-issues-relevant-for-asian-developing 96/215
76
TableA1.
( c o n t i n u e d )
SITC
Product
L
eamergroup
Path
PRODY
PRODY
Pat
h
Contribution
Distance
Strategic
code
tercile
terc
ile
toopen
value
forest
(PRODY*
density)
6130
Furskins,tanned/dressed,
Ca
pitalintensive
158.88
16,585.08
high
high
3,271.88
nearby
11,422.45
pieces/cuttingsoffurskin
6349
Wo
od,simplyshaped,n.e.s.Fo
restproducts
152.35
9,271.73
low
high
1,592.64
nearby
11,330.38
S o u r c e :
Auth
or’scalculation,seetext.

8/11/2019 Trade performance and competitiveness: Selected issues relevant for Asian developing economies
http://slidepdf.com/reader/full/trade-performance-and-competitiveness-selected-issues-relevant-for-asian-developing 97/215
77
TableA2.Top30productsindescend
ingorderofStrategicValue(year2010)
SITC
Product
L
eamergroup
Path
PRODY
PRODY
Pat
h
Contribution
Distance
Strategic
code
tercile
tercile
toOpen
Value
Forest
(PRODY*
density)
5335
Colour.preptnsofakind
Chemical
196.55
18,099.09
high
high
2,307.83
faraway
17,717.46
usedinceramic,enamelli.
6632
Naturalorartificialabrasive
La
bourintensive
194.49
18,839.34
high
high
2,423.08
faraway
17,615.70
powderorgrain
7267
Otherprintingmach.
Machinery
174.30
21,054.27
high
high
2,200.40
faraway
17,527.86
for
usesancillarytoprinting
7492
Taps,cocks,valvesetc.
Machinery
189.17
17,626.42
high
high
2,209.09
faraway
17,306.65
for
pipes,tanks,vatsetc.
7269
Partsofthemachines
Machinery
176.80
20,564.04
high
high
2,337.46
faraway
17,207.22
of726.31,726.4-,726.7-
6418
Paper&paperboard,
Fo
restproducts
189.02
19,418.90
high
high
2,430.43
faraway
17,197.90
impregnat.coat.
surface-coloured
7849
Otherparts&accessories
Machinery
193.79
17,158.54
high
high
2,166.88
faraway
17,185.51
ofmotorvehicles
7429
Partsofthepumps&
Machinery
176.21
18,779.22
high
high
2,127.31
faraway
17,088.95
liq.
elevatorsof742—
7439
Partsofthemachines
Machinery
181.99
16,500.97
high
high
1,975.90
faraway
17,027.87
of743.5-,743.6-
6996
Miscellaneousarticles
Capitalintensive
207.69
15,704.52
high
high
2,418.90
middle
17,006.43
ofbasemetal
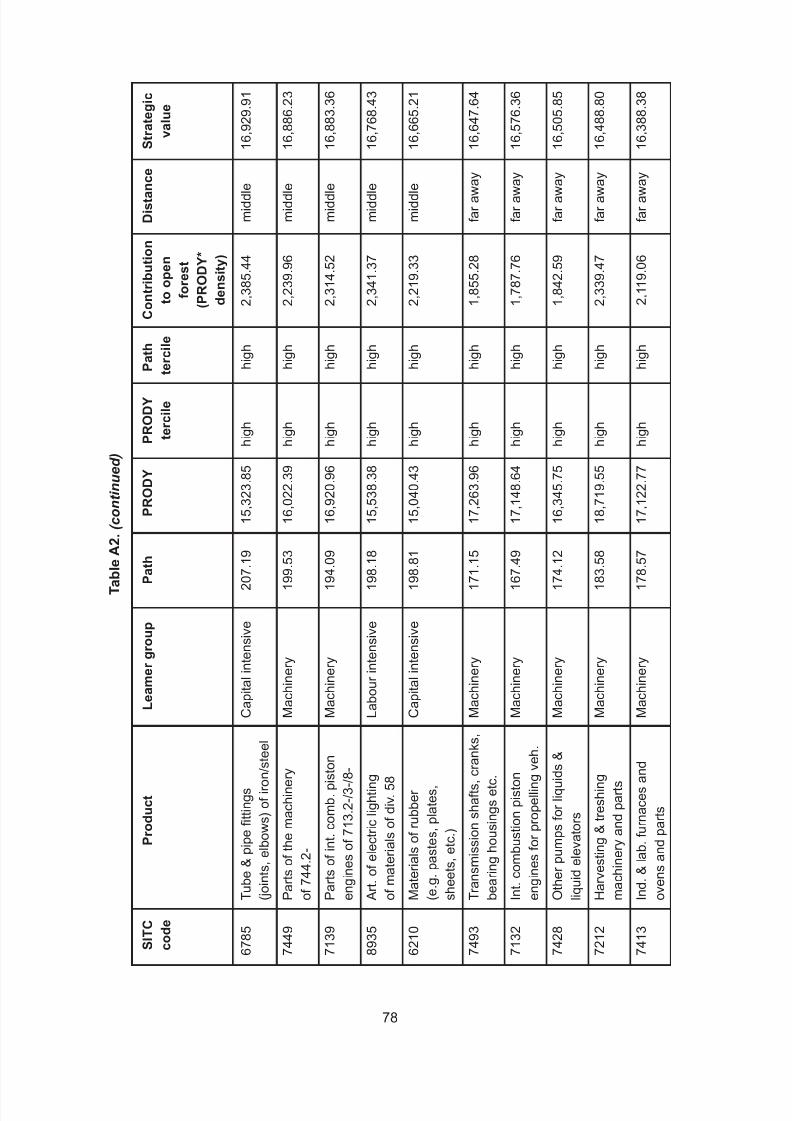
8/11/2019 Trade performance and competitiveness: Selected issues relevant for Asian developing economies
http://slidepdf.com/reader/full/trade-performance-and-competitiveness-selected-issues-relevant-for-asian-developing 98/215
78
TableA2.
( c o n t i n u e d )
SITC
Product
L
eamergroup
Path
PRODY
PRODY
Pat
h
Contribution
Distance
Strategic
code
tercile
terc
ile
toopen
value
forest
(PRODY*
density)
6785
Tube&pipefittings
Capitalintensive
207.19
15,323.85
high
high
2,385.44
middle
16,929.91
(joints,elbows)ofiron/steel
7449
Partsofthemachinery
Machinery
199.53
16,022.39
high
high
2,239.96
middle
16,886.23
of744.2-
7139
Partsofint.comb.piston
Machinery
194.09
16,920.96
high
high
2,314.52
middle
16,883.36
enginesof713.2-/3-/8-
8935
Art.ofelectriclighting
La
bourintensive
198.18
15,538.38
high
high
2,341.37
middle
16,768.43
ofmaterialsofdiv.58
6210
Ma
terialsofrubber
Capitalintensive
198.81
15,040.43
high
high
2,219.33
middle
16,665.21
(e.g.pastes,plates,
she
ets,etc.)
7493
Tra
nsmissionshafts,cranks,Machinery
171.15
17,263.96
high
high
1,855.28
faraway
16,647.64
bearinghousingsetc.
7132
Int.combustionpiston
Machinery
167.49
17,148.64
high
high
1,787.76
faraway
16,576.36
enginesforpropellingveh.
7428
Oth
erpumpsforliquids&
Machinery
174.12
16,345.75
high
high
1,842.59
faraway
16,505.85
liqu
idelevators
7212
Harvesting&treshing
Machinery
183.58
18,719.55
high
high
2,339.47
faraway
16,488.80
ma
chineryandparts
7413
Ind
.&lab.furnacesand
Machinery
178.57
17,122.77
high
high
2,119.06
faraway
16,388.38
ove
nsandparts

8/11/2019 Trade performance and competitiveness: Selected issues relevant for Asian developing economies
http://slidepdf.com/reader/full/trade-performance-and-competitiveness-selected-issues-relevant-for-asian-developing 99/215
79
TableA2.
( c o n t i n u e d )
SITC
Product
L
eamergroup
Path
PRODY
PRODY
Pat
h
Contribution
Distance
Strategic
code
tercile
terc
ile
toopen
value
forest
(PRODY*
density)
7234
Constructionandmining
Machinery
171.63
14,324.30
medium
high
1,632.89
faraway
16,386.08
ma
chinery,n.e.s.
7188
Engines&motors,n.e.s.
Machinery
186.10
17,844.67
high
high
2,358.53
faraway
16,367.01
suc
haswaterturbinesetc.
7368
Wo
rkholders,self-opening
Machinery
172.69
18,167.42
high
high
2,001.33
faraway
16,365.09
dieheads&toolholders
7442
Lifting,handling,loading
Machinery
181.05
17,010.07
high
high
2,138.61
faraway
16,332.11
ma
ch.conveyors
7219
Agric.mach.&appliances,
Machinery
179.47
20,207.11
high
high
2,559.10
faraway
16,322.78
n.e
.s.andparts
7783
Ele
ctr.equip.forinternal
Machinery
170.56
15,925.70
high
high
1,846.94
faraway
16,299.60
com
bustionengines,parts
7436
Filtering&purifyingmach.
Machinery
175.48
17,104.32
high
high
2,080.48
faraway
16,283.89
for
liquids&gases
2331
Synth.rubb.lat.;synth.
Tropical
175.08
9,595.75
low
high
1,130.67
faraway
16,266.49
rub
b.facticederiv.fromoils
ag
riculture
6953
Oth
ertoolsforusein
Ca
pitalintensive
189.71
14,733.62
medium
high
2,200.75
middle
16,174.98
the
hand
6991
Loc
ksmithswares,safes,
Ca
pitalintensive
189.13
16,414.08
high
high
2,416.89
middle
16,155.87
stro
ngroomsofbasemetal
S o u r c e :
Auth
or’scalculation,seetext.
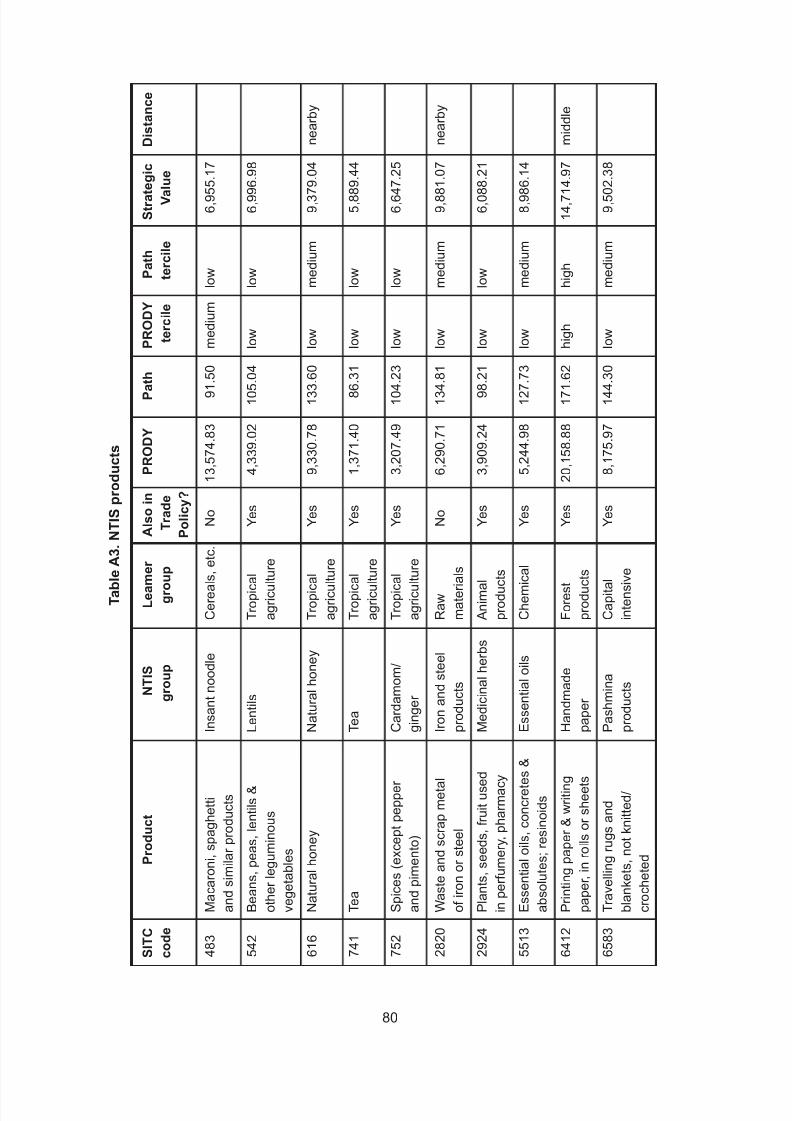
8/11/2019 Trade performance and competitiveness: Selected issues relevant for Asian developing economies
http://slidepdf.com/reader/full/trade-performance-and-competitiveness-selected-issues-relevant-for-asian-developing 100/215
80
TableA3.NTISproducts
SITC
Product
NTIS
Leamer
A
lsoin
PRODY
Path
PRODY
Path
Strategic
Distance
code
group
group
Trade
tercile
tercile
Value
Policy?
483
Maca
roni,spaghetti
Insantnoodle
Cereals,etc.
No
13,574.83
91.50
medium
low
6,955.17
ands
imilarproducts
542
Bean
s,peas,lentils&
Lentils
Tropical
Yes
4,339.02
105.04
low
low
6,996.98
other
leguminous
agriculture
vegetables
616
Naturalhoney
Natu
ralhoney
Tropical
Yes
9,330.78
133.60
low
medium
9,379.04
nearby
agriculture
741
Tea
Tea
Tropical
Yes
1,371.40
86.31
low
low
5,889.44
agriculture
752
Spice
s(exceptpepper
Card
amom/
Tropical
Yes
3,207.49
104.23
low
low
6,647.25
andp
imento)
ginger
agriculture
2820
Wasteandscrapmetal
Ironandsteel
Raw
No
6,290.71
134.81
low
medium
9,881.07
nearby
ofironorsteel
products
materials
2924
Plants,seeds,fruitused
Medicinalherbs
Animal
Yes
3,909.24
98.21
low
low
6,088.21
inperfumery,pharmacy
products
5513
Essentialoils,concretes&
Esse
ntialoils
Chemical
Yes
5,244.98
127.73
low
medium
8,986.14
absolutes;resinoids
6412
Printingpaper&writing
Handmade
Forest
Yes
20,158.88
171.62
high
high
14,714.97
middle
paper,inrollsorsheets
pape
r
products
6583
Trave
llingrugsand
Pash
mina
Capital
Yes
8,175.97
144.30
low
medium
9,502.38
blank
ets,notknitted/
products
intensive
croch
eted

8/11/2019 Trade performance and competitiveness: Selected issues relevant for Asian developing economies
http://slidepdf.com/reader/full/trade-performance-and-competitiveness-selected-issues-relevant-for-asian-developing 101/215
81
6712
Pigiron,castironand
Irona
ndsteel
Capital
No
6,647.54
117.97
low
medium
8,769.1
0
middle
spiegeleisen,inpigs,blocks
produ
cts
intensive
6713
Irono
rsteelpowders,
Irona
ndsteel
Capital
No
10,002.32
105.91
medium
low
8,844.9
8
faraway
shoto
rsponge
produ
cts
intensive
6716
Ferro-alloys
Irona
ndsteel
Capital
No
13,126.03
121.97
medium
medium
8,271.4
8
nearby
produ
cts
intensive
6724
Puddledbarsandpilings;
Irona
ndsteel
Capital
No
11,361.39
135.62
medium
medium
10,881.8
6
middle
ingots
,blocks,lumpsetc.
produ
cts
intensive
6725
Bloom
s,billets,slabs&
Irona
ndsteel
Capital
No
6,710.47
132.79
low
medium
9,731.9
6
middle
sheet
barsofironorsteel
produ
cts
intensive
6727
Irono
rsteelcoilsfor
Irona
ndsteel
Capital
No
8,405.86
145.82
low
medium
11,284.7
6
middle
re-rolling
produ
cts
intensive
6731
Wirerodofironorsteel
Irona
ndsteel
Capital
No
8,747.24
170.97
low
high
13,280.4
9
middle
produ
cts
intensive
6732
Bars&rods,ofiron/steel;
Irona
ndsteel
Capital
No
7,426.31
164.60
low
high
11,938.2
9
nearby
hollow
miningdrillst.
produ
cts
intensive
6733
Angle
s,shapes&
Irona
ndsteel
Capital
No
12,322.83
182.66
medium
high
14,331.1
9
middle
sectio
ns&sheetpiling,
produ
cts
intensive
ofiron/st.
6744
Sheets&plates,
Irona
ndsteel
Capital
No
10,024.73
179.40
medium
high
13,791.2
7
middle
rolled
>4.75mmofiron/steelprodu
cts
intensive
TableA3. (
c o n t i n u e d )
SITC
Product
NTIS
Leamer
Alsoin
PRODY
Path
PRODY
Path
Strategic
Distance
code
group
group
T
rade
tercile
tercile
Value
Po
licy?
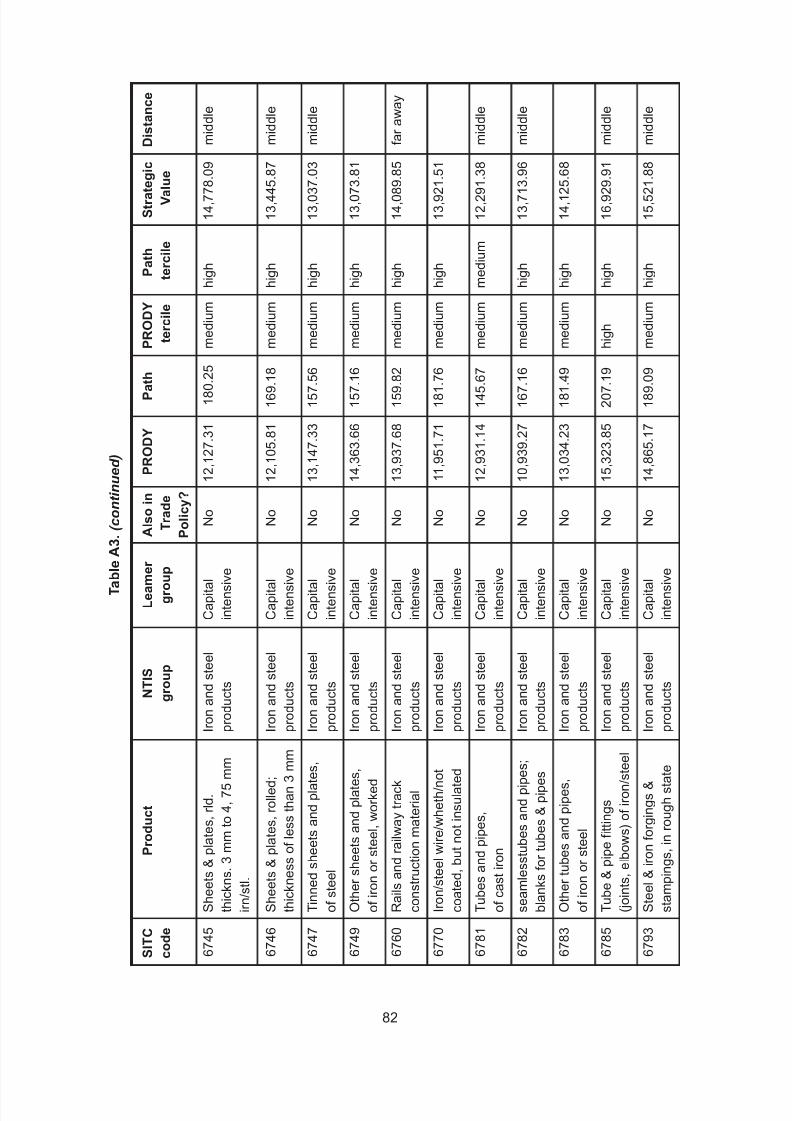
8/11/2019 Trade performance and competitiveness: Selected issues relevant for Asian developing economies
http://slidepdf.com/reader/full/trade-performance-and-competitiveness-selected-issues-relevant-for-asian-developing 102/215
82
6745
Shee
ts&plates,rld.
Ironandsteel
Capital
No
12,127.31
180.25
medium
high
14,778.09
middle
thickns.3mmto4,75mm
products
intensive
irn/stl.
6746
Shee
ts&plates,rolled;
Ironandsteel
Capital
No
12,105.81
169.18
medium
high
13,445.87
middle
thicknessoflessthan3mm
products
intensive
6747
Tinne
dsheetsandplates,
Ironandsteel
Capital
No
13,147.33
157.56
medium
high
13,037.03
middle
ofste
el
products
intensive
6749
Othersheetsandplates,
Ironandsteel
Capital
No
14,363.66
157.16
medium
high
13,073.81
ofironorsteel,worked
products
intensive
6760
Rails
andrail waytrack
Ironandsteel
Capital
No
13,937.68
159.82
medium
high
14,089.85
faraway
constructionmaterial
products
intensive
6770
Iron/steelwire/wheth/not
Ironandsteel
Capital
No
11,951.71
181.76
medium
high
13,921.51
coate
d,butnotinsulated
products
intensive
6781
Tubesandpipes,
Ironandsteel
Capital
No
12,931.14
145.67
medium
medium
12,291.38
middle
ofcastiron
products
intensive
6782
seam
lesstubesandpipes;
Ironandsteel
Capital
No
10,939.27
167.16
medium
high
13,713.96
middle
blank
sfortubes&pipes
products
intensive
6783
Othertubesandpipes,
Ironandsteel
Capital
No
13,034.23
181.49
medium
high
14,125.68
ofironorsteel
products
intensive
6785
Tube
&pipefittings
Ironandsteel
Capital
No
15,323.85
207.19
high
high
16,929.91
middle
(joints,elbows)ofiron/steel
products
intensive
6793
Steel&ironforgings&
Ironandsteel
Capital
No
14,865.17
189.09
medium
high
15,521.88
middle
stampings,inroughstate
products
intensive
TableA3.
( c o n t i n u e d )
SITC
Product
NTIS
Leamer
A
lsoin
PRODY
Path
PRODY
Path
Strateg
ic
Distance
code
group
group
Trade
tercile
tercile
Value
Policy?

8/11/2019 Trade performance and competitiveness: Selected issues relevant for Asian developing economies
http://slidepdf.com/reader/full/trade-performance-and-competitiveness-selected-issues-relevant-for-asian-developing 103/215
83
6794
Castingsorironorsteel,
Ironandsteel
Capital
No
11,749.49
185.55
medium
high
13,790.1
8
nearby
inthe
roughstate
products
intensive
6911
Struc
tures&partsof
Ironandsteel
Capital
No
13,657.89
193.44
medium
high
14,782.3
4
struc.;iron/steel;plates
products
intensive
6921
Rese
rvoirs,tanks,
Ironandsteel
Capital
No
13,472.55
203.59
medium
high
15,887.4
6
middle
vatsandsimilarcontainers
products
intensive
6924
Casks,drums,boxesof
Ironandsteel
Capital
No
12,609.02
183.55
medium
high
14,059.1
9
nearby
iron/s
teelforpackinggoods
products
intensive
6931
Stran
dedwire,cables,
Ironandsteel
Capital
No
11,323.75
171.04
medium
high
12,745.5
2
corda
gesandthelike
products
intensive
6932
Wire,twistedhoopfor
Ironandsteel
Capital
No
8,837.42
124.40
low
medium
9,590.9
7
middle
fencingofironorsteel
products
intensive
6935
Gauz
e,cloth,grillofiron
Ironandsteel
Capital
No
12,741.14
167.43
medium
high
13,644.2
1
steel
orcopper
products
intensive
6940
Nails,screws,nuts,
Ironandsteel
Capital
No
15,655.73
165.65
high
high
15,288.8
9
faraway
bolts
etc.ofiron,steel,
products
intensive
copper
6973
Domestic-type,non-electric
Ironandsteel
Capital
No
12,795.86
179.19
medium
high
13,104.0
4
nearby
heating,cookingappar.
products
intensive
6974
Art.c
ommonlyusedfordom.Ironandsteel
Capital
No
10,507.25
123.06
medium
medium
8,657.6
0
purpo
ses,potscourers
products
intensive
TableA3.
( c o n t i n u e d )
SITC
Product
NTIS
Leamer
A
lsoin
PRODY
Path
PRODY
Path
Strateg
ic
Distance
code
group
group
Trade
tercile
tercile
Value
Policy?

8/11/2019 Trade performance and competitiveness: Selected issues relevant for Asian developing economies
http://slidepdf.com/reader/full/trade-performance-and-competitiveness-selected-issues-relevant-for-asian-developing 104/215
84
6975
Sanitarywareforindoor
Ironandsteel
Capital
No
15,926.95
173.04
high
high
13,319.42
nearby
use,andparts
products
intensive
6992
Chainandpartsthereof,
Ironandsteel
Capital
No
14,492.18
182.00
medium
high
15,367.24
middle
ofironorsteel
products
intensive
6993
Pins&needles,fittings,
Ironandsteel
Capital
No
12,664.65
154.09
medium
high
14,002.18
middle
base
metalbeads,etc.
products
intensive
6994
Sprin
gs&leavesfor
Ironandsteel
Capital
No
16,376.32
141.15
high
medium
13,215.29
faraway
springs,ofiron/steel/copper
products
intensive
6997
Articlesofironorsteel,
Ironandsteel
Capital
No
14,708.04
187.79
medium
high
15,607.88
middle
n.e.s.
products
intensive
8121
Boilers&radiatorsfor
Ironandsteel
Capital
No
17,100.74
180.83
high
high
14,976.54
middle
centralheating
products
intensive
8421
Overcoatsandother
Woolproducts
Labour
Yes
6,894.52
137.94
low
medium
8,584.60
coats
,men,s
intensive
8424
Jackets,blazersoftextile
Woolproducts
Labour
Yes
8,109.45
128.03
low
medium
8,033.28
fabric
s
intensive
8431
Coatsandjacketsof
Woolproducts
Labour
Yes
7,420.63
132.83
low
medium
8,168.26
textilefabrics
intensive
8432
Suits
&costumes,
Woolproducts
Labour
Yes
7,141.74
139.00
low
medium
8,683.87
women’s,oftextilefabrics
intensive
8435
Blousesoftextilefabrics
Woolproducts
Labour
Yes
6,388.06
115.49
low
low
6,757.63
intensive
TableA3.
( c o n t i n u e d )
SITC
Product
NTIS
Leamer
A
lsoin
PRODY
Path
PRODY
Path
Strateg
ic
Distance
code
group
group
Trade
tercile
tercile
Value
Policy?

8/11/2019 Trade performance and competitiveness: Selected issues relevant for Asian developing economies
http://slidepdf.com/reader/full/trade-performance-and-competitiveness-selected-issues-relevant-for-asian-developing 105/215
85
TableA3.
( c o n t i n u e d )
SITC
Product
NTIS
Leamer
A
lsoin
PRODY
Path
PRODY
Path
Strateg
ic
Distance
code
group
group
Trade
tercile
tercile
Value
Policy?
8439
Otheroutergarmentsof
Woolproducts
Labour
Yes
6,398.12
115.05
low
low
6,890.7
0
nearby
textile
fabrics
intensive
8451
Jerse
ys,pull-overs,
Woolproducts
Labour
Yes
7,176.82
112.53
low
low
6,643.6
1
nearby
twinsets,cardigans,knitted
intensive
8452
Dresses,skirts,suitsetc.,
Woolproducts
Labour
Yes
9,148.28
126.88
low
medium
7,852.6
4
knitte
dorcrocheted
intensive
8459
Otheroutergarments&
Woolproducts
Labour
Yes
7,563.43
111.61
low
low
6,709.4
6
clothing,knitted
intensive
8471
Clothingaccessories
Pash
mina
Labour
Yes
4,814.31
118.11
low
medium
7,869.4
0
oftex
tilefabrics
products
intensive
8472
Clothingaccessories,
Wool
Labour
Yes
6,232.33
137.57
low
medium
8,800.1
0
knitte
dorcrochetem,
products
intensive
n.e.s.
8484
Head
gearandfittings
Woolproducts
Labour
Yes
7,167.00
100.35
low
low
7,160.6
2
thereof,n.e.s.
intensive
8972
Imitationjewellery
Silve
rjewellery
Labour
Yes
13,733.01
115.95
medium
low
8,966.1
7
nearby
intensive
8973
Jewelleryofgold,silver
Silve
rjewellery
Labour
Yes
8,006.96
98.70
low
low
6,488.8
6
nearby
orpla
tinum
intensive
S o u r c e :
Auth
or’scalculation,seetext.
N o t e :
Blan
k“distance”cellsmeanthattheproductisnotintheOpenForest.
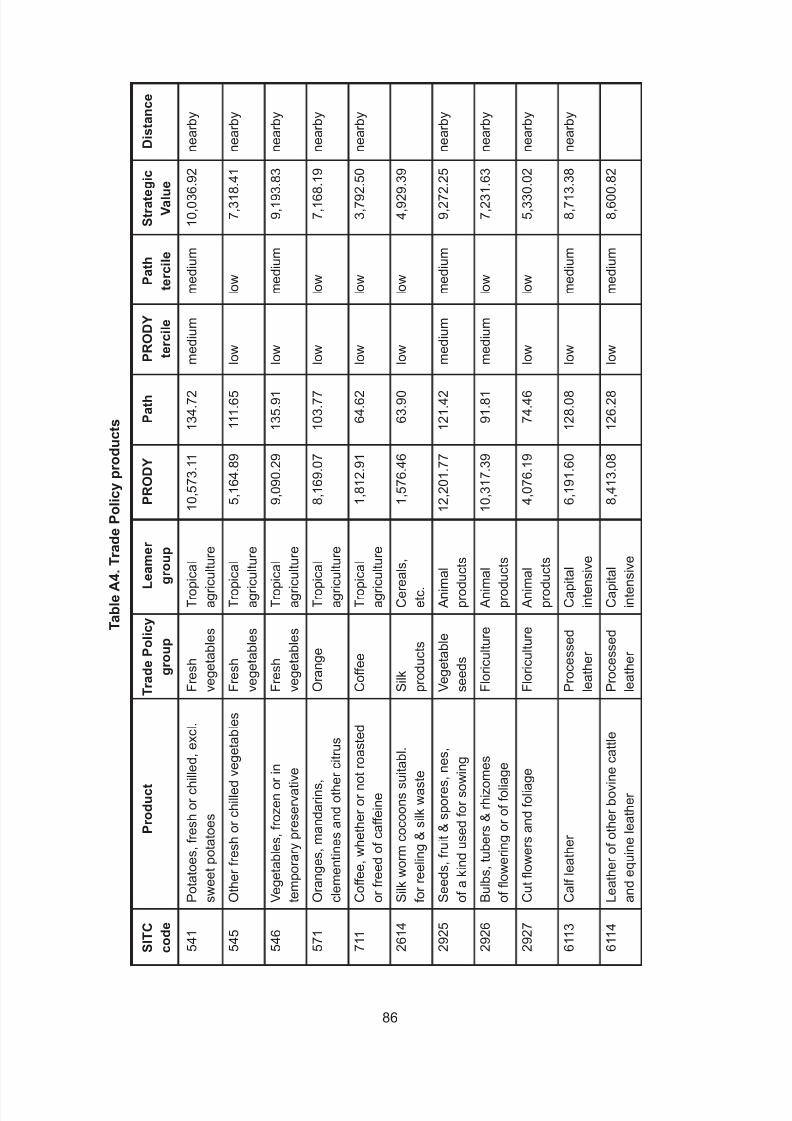
8/11/2019 Trade performance and competitiveness: Selected issues relevant for Asian developing economies
http://slidepdf.com/reader/full/trade-performance-and-competitiveness-selected-issues-relevant-for-asian-developing 106/215
86
TableA4.Trade
Policyproducts
SITC
Product
TradePolicy
Leamer
PRODY
Path
PRODY
Path
Strategic
Distance
code
group
group
tercile
tercile
Value
541
Potatoes,freshorchilled,excl.
Fresh
Tropical
10,573.11
134.72
medium
medium
10,036.92
nearby
swe
etpotatoes
vegetables
agriculture
545
Oth
erfreshorchilledvegetables
Fresh
Tropical
5,164.89
111.65
low
low
7,318.41
nearby
vegetables
agriculture
546
Veg
etables,frozenorin
Fresh
Tropical
9,090.29
135.91
low
medium
9,193.83
nearby
tem
porarypreservative
vegetables
agriculture
571
Ora
nges,mandarins,
Orange
Tropical
8,169.07
103.77
low
low
7,168.19
nearby
clementinesandothercitrus
agriculture
711
Coffee,whetherornotroasted
Coffee
Tropical
1,812.91
64.62
low
low
3,792.50
nearby
orfreedofcaffeine
agriculture
2614
Silk
wormcocoonssuitabl.
Silk
Cereals,
1,576.46
63.90
low
low
4,929.39
forreeling&silkwaste
products
etc.
2925
See
ds,fruit&spores,nes,
Vegetable
Animal
12,201.77
121.42
medium
medium
9,272.25
nearby
ofa
kindusedforsowing
seeds
products
2926
Bulbs,tubers&rhizomes
Floriculture
Animal
10,317.39
91.81
medium
low
7,231.63
nearby
offloweringoroffoliage
products
2927
Cutflowersandfoliage
Floriculture
Animal
4,076.19
74.46
low
low
5,330.02
nearby
products
6113
Calfleather
Processed
Capital
6,191.60
128.08
low
medium
8,713.38
nearby
leather
intensive
6114
Lea
therofotherbovinecattle
Processed
Capital
8,413.08
126.28
low
medium
8,600.82
and
equineleather
leather
intensive
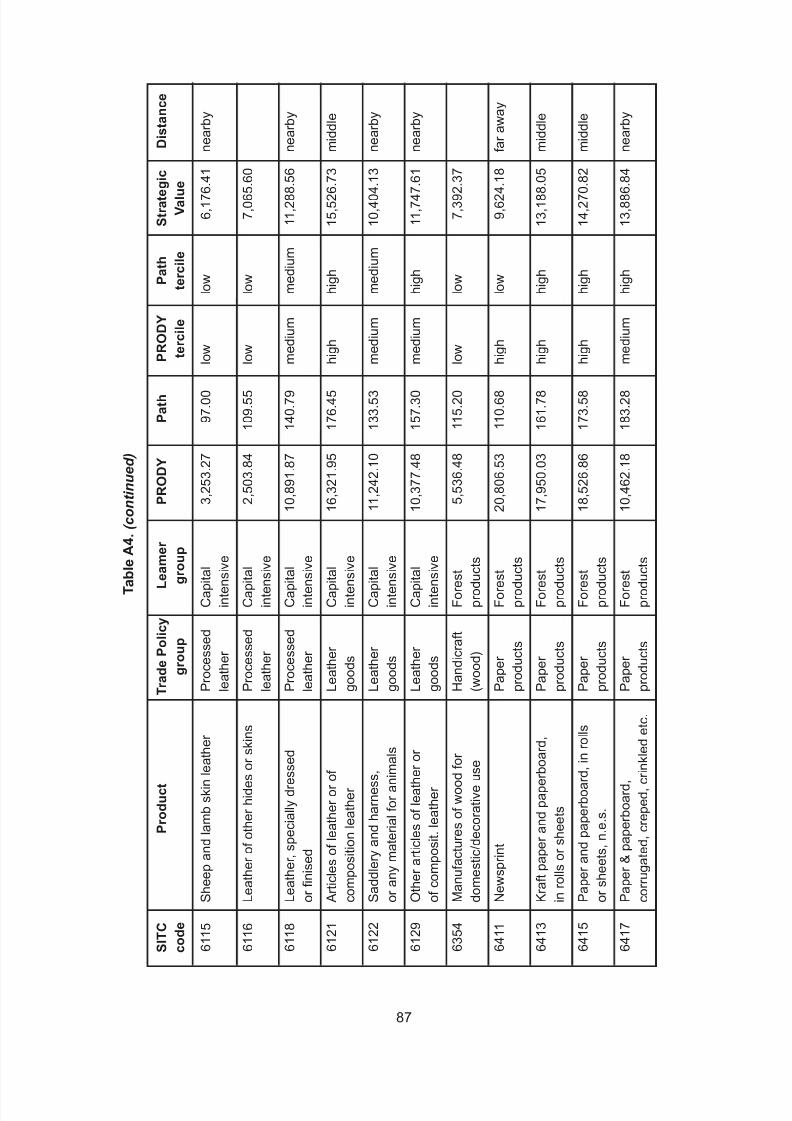
8/11/2019 Trade performance and competitiveness: Selected issues relevant for Asian developing economies
http://slidepdf.com/reader/full/trade-performance-and-competitiveness-selected-issues-relevant-for-asian-developing 107/215
87
TableA4.
( c o n t i n u e d )
SITC
Product
TradePolicy
Leamer
PRODY
Path
PRODY
Path
Strategic
Distance
code
group
group
tercile
tercile
Value
6115
She
epandlambskinleather
Processed
Capital
3,253.27
97.00
low
low
6,176.41
nearby
leather
intensive
6116
Lea
therofotherhidesorskins
Processed
Capital
2,503.84
109.55
low
low
7,065.60
leather
intensive
6118
Lea
ther,speciallydressed
Processed
Capital
10,891.87
140.79
medium
medium
11,288.56
nearby
orfinised
leather
intensive
6121
Articlesofleatherorof
Leather
Capital
16,321.95
176.45
high
high
15,526.73
middle
com
positionleather
goods
intensive
6122
Sad
dleryandharness,
Leather
Capital
11,242.10
133.53
medium
medium
10,404.13
nearby
ora
nymaterialforanimals
goods
intensive
6129
Oth
erarticlesofleatheror
Leather
Capital
10,377.48
157.30
medium
high
11,747.61
nearby
ofc
omposit.leather
goods
intensive
6354
Manufacturesofwoodfor
Handicraft
Forest
5,536.48
115.20
low
low
7,392.37
dom
estic/decorativeuse
(wood)
products
6411
Newsprint
Paper
Forest
20,806.53
110.68
hig
h
low
9,624.18
faraway
products
products
6413
Kra
ftpaperandpaperboard,
Paper
Forest
17,950.03
161.78
high
high
13,188.05
middle
inrollsorsheets
products
products
6415
Pap
erandpaperboard,inrolls
Paper
Forest
18,526.86
173.58
high
high
14,270.82
middle
ors
heets,n.e.s.
products
products
6417
Pap
er&paperboard,
Paper
Forest
10,462.18
183.28
medium
high
13,886.84
nearby
corrugated,creped,crinkledetc.
products
products

8/11/2019 Trade performance and competitiveness: Selected issues relevant for Asian developing economies
http://slidepdf.com/reader/full/trade-performance-and-competitiveness-selected-issues-relevant-for-asian-developing 108/215
88
TableA4.
( c o n t i n u e d )
SITC
Product
TradePolicy
Leamer
PRODY
Path
PRODY
Path
Strategic
Distance
code
group
group
tercile
tercile
Value
6418
Pap
er&paperboard,
Paper
Forest
19,418.90
189.02
hig
h
high
17,197.90
faraway
imp
regnat.coat.surface-coloured
products
products
6421
Box
es,bags&oth.packing
Paper
Forest
14,854.13
182.21
medium
high
14,184.04
nearby
con
tainers,ofpaper/papbd
products
products
6422
Writingblocks,envelopes,
Paper
Forest
15,115.28
183.81
hig
h
high
14,852.15
etc.correspondencecards
products
products
6423
Registers,exercisebooks,
Paper
Forest
10,073.57
141.56
medium
medium
10,518.95
notebooks,etc.
products
products
6424
Pap
erandpaperboard,cutto
Paper
Forest
15,599.70
190.87
hig
h
high
16,131.59
middle
size
orshape,n.e.s.
products
products
6428
Art.ofpaperpulp,paper,
Paper
Forest
14,071.13
181.26
medium
high
14,596.65
middle
pap
erboard,cellu.wadding
products
products
6511
Silk
yarn&yarnspunfrom
Silk
Capital
8,838.03
89.21
low
low
7,088.16
nearby
noil/othersilkwaste
products
intensive
6521
Cottonfabrics,woven,
Towel
Capital
3,658.41
116.84
low
medium
7,289.40
nearby
unb
leached,notmercerized
intensive
6522
Cottonfabrics,woven,bleach.
Towel
Capital
8,295.30
144.96
low
medium
9,896.62
merceriz.dyed,printed
intensive
6541
Fab
rics,woven,ofsilk,ofnoil
Silk
Capital
8,087.67
82.29
low
low
6,733.89
nearby
oro
therwastesilk
products
intensive
6549
Fab
rics,woven,n.e.s.
Towel
Capital
10,757.39
114.32
medium
low
9,014.21
intensive
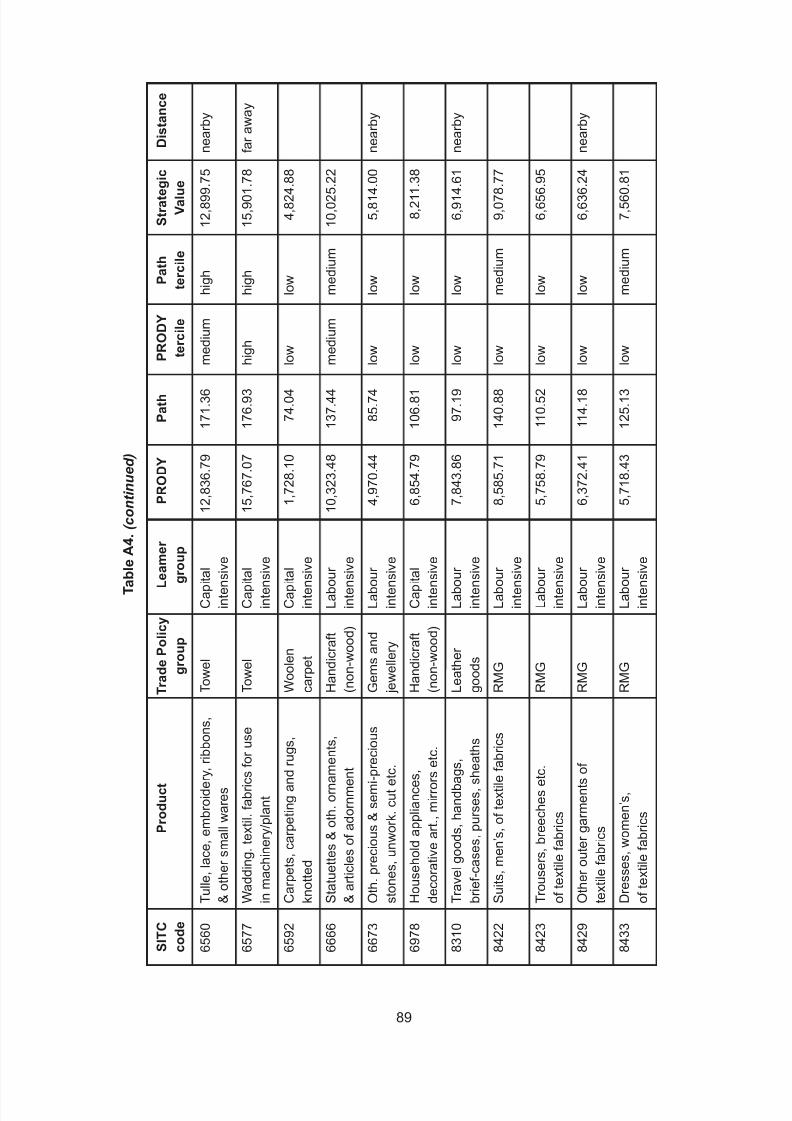
8/11/2019 Trade performance and competitiveness: Selected issues relevant for Asian developing economies
http://slidepdf.com/reader/full/trade-performance-and-competitiveness-selected-issues-relevant-for-asian-developing 109/215
89
TableA4.
( c o n t i n u e d )
SITC
Product
TradePolicy
Leamer
PRODY
Path
PRODY
Path
Strategic
Distance
code
group
group
tercile
tercile
Value
6560
Tulle,lace,embroidery,ribbons,
Towel
Capital
12,836.79
171.36
me
dium
high
12,899.75
nearby
&othersmallwares
intensive
6577
Wadding.textil.fabricsforuse
Towel
Capital
15,767.07
176.93
hig
h
high
15,901.78
faraway
inm
achinery/plant
intensive
6592
Car
pets,carpetingandrugs,
Woolen
Capital
1,728.10
74.04
low
low
4,824.88
kno
tted
carpet
intensive
6666
Statuettes&oth.ornaments,
Handicraft
Labour
10,323.48
137.44
me
dium
medium
10,025.22
&articlesofadornment
(non-wood)
intensive
6673
Oth
.precious&semi-precious
Gemsand
Labour
4,970.44
85.74
low
low
5,814.00
nearby
stones,unwork.cutetc.
jewellery
intensive
6978
Hou
seholdappliances,
Handicraft
Capital
6,854.79
106.81
low
low
8,211.38
dec
orativeart.,mirrorsetc.
(non-wood)
intensive
8310
Travelgoods,handbags,
Leather
Labour
7,843.86
97.19
low
low
6,914.61
nearby
brie
f-cases,purses,sheaths
goods
intensive
8422
Suits,men’s,oftextilefabrics
RMG
Labour
8,585.71
140.88
low
medium
9,078.77
intensive
8423
Trousers,breechesetc.
RMG
Labour
5,758.79
110.52
low
low
6,656.95
oftextilefabrics
intensive
8429
Oth
eroutergarmentsof
RMG
Labour
6,372.41
114.18
low
low
6,636.24
nearby
textilefabrics
intensive
8433
Dre
sses,women’s,
RMG
Labour
5,718.43
125.13
low
medium
7,560.81
oftextilefabrics
intensive

8/11/2019 Trade performance and competitiveness: Selected issues relevant for Asian developing economies
http://slidepdf.com/reader/full/trade-performance-and-competitiveness-selected-issues-relevant-for-asian-developing 110/215
90
TableA4.
( c o n t i n u e d )
SITC
Product
TradePolicy
Leamer
PRODY
Path
PRODY
Path
Strategic
Distance
code
group
group
tercile
tercile
Value
8434
Skirts,women’s,oftextilefabrics
RMG
Labour
6,825.56
136.04
low
medium
8,342.09
intensive
8441
Shirts,men’s,oftextilefabrics
RMG
Labour
5,337.75
112.22
low
low
6,669.40
intensive
8442
Und
ergarments,excl.shirts,
RMG
Labour
4,889.04
104.95
low
low
6,126.59
oftextilefabrics
intensive
8443
Und
ergarments,women,s,
RMG
Labour
5,518.67
91.12
low
low
5,258.91
oftextilefabrics
intensive
8462
Und
ergarments,knittedofcotton
RMG
Labour
5,315.72
108.39
low
low
6,340.14
nearby
intensive
8463
Und
ergarments,knitted,
RMG
Labour
4,862.42
118.33
low
medium
7,132.28
nearby
ofs
yntheticfibres
intensive
8465
Cor
sets,brassieres,
RMG
Labour
6,992.34
118.85
low
medium
7,469.71
nearby
suspendresandthelike
intensive
8481
Art.
ofapparel&clothing
Leather
Labour
5,032.63
129.12
low
medium
8,946.49
nearby
accessories,ofleather
goods
intensive
8974
Oth
erarticlesofpreciousmetal
Gemsand
Labour
9,461.95
104.98
low
low
10,904.11
faraway
jewellery
intensive
8999
Manufacturedgoods,n.e.s.
Leather
Labour
5,485.91
72.81
low
low
5,350.79
nearby
goods
intensive
S o u r c e :
Auth
or’scalculation,seetext.
N o t e :
Blan
k“distance”cellsmeanthattheproductisnotintheOpenForest.

8/11/2019 Trade performance and competitiveness: Selected issues relevant for Asian developing economies
http://slidepdf.com/reader/full/trade-performance-and-competitiveness-selected-issues-relevant-for-asian-developing 111/215
91
II. Logistics performance and trade: An analysisof India’s trade in intermediates with
Bangladesh and Thailand
By Prabir De and Amrita Saha
Introduction
Logistics is an important determinant in sustaining a country’s (or a region’s)
competitive advantage.42 Its contribution to growth, economic integration and poverty
reduction is well known. Improvements in logistical services help countries produce more
sophisticated products and encourage a more dynamic export (import) diversificationprocess. In turn, this contributes to improvements in an economy’s growth and
development. During the past decade there have been noticeable developments in logistic
services due to technology. However, there is evidence of a rising gap between the Least
Developing Countries (LDC) and the developing economies. This is in terms of quality of
services in Asia and the Pacific region.43
Logistic services involve the process of planning, implementing and controlling
efficient and cost-effective flow, storage of raw materials, in-process inventory, finished
goods and related information, from a point of origin to the point of consumption(destination) to meet customer requirements.44 Production processes and tasks are
becoming increasingly fragmented across national borders. As a result, time-sensitive
logistic services, along with information and communication technology (ICT), are the key in
facilitating production networks spanning borders.45 In other words, logistic services play
a catalytic role by ensuring just-in-time delivery of goods and services, either as inputs to
production process or as final output networks. Efficiency in logistical services contributes
42 Refer to for example, World Bank (2012), Planning Commission (2011), to mention a few.
43 Based on a worldwide survey of operators on the ground – such as global freight forwarders and expresscarriers – the Logistics Performance Index (LPI) of the World Bank measures the logistics “friendliness” of
155 countries. It helps countries identify the challenges and opportunities they face in their trade logistics
performance and what they can do to improve. For example refer to World Bank (2012). Appendix 1 presents
the global ranks of selected Asia-Pacific countries for the year 2012. The contrast is, while Singapore and
Hong Kong, China occupy the first and second global rank in LPI, countries like Mongolia, Myanmar,
Cambodia, and Lao People’s Democratic Republic fall in the bottom group in LPI. This shows wide intra-
regional variations in logistics performance.
44 There is no clear consensus on definition of logistics. In literature, it overlaps in many cases with
transportation, even though there is a clear difference between the two. In most ASEAN and South Asian
countries, there is still a lack of understanding of what makes up logistics and how a logistics policy should be
developed. Logistics development policy frequently becomes just a transport investment infrastructure plan, but
logistics is much more than just transport infrastructure. Developing a national logistics policy requires a holistic
approach that encompasses traders, service providers, infrastructure, and rules and regulations. Refer, for
example, Hollweg and Wong (2009), Sourdin and Pomfret (2012).
45 This is what Baldwin termed as “the 2nd unbundling”. The 2nd unbundling is the international division of
labour in terms of production processes and tasks. Refer to Baldwin (2011)

8/11/2019 Trade performance and competitiveness: Selected issues relevant for Asian developing economies
http://slidepdf.com/reader/full/trade-performance-and-competitiveness-selected-issues-relevant-for-asian-developing 112/215
92
to the expansion of trade and production networks within or across countries, as well as
building their productive capacities in networked countries (Ando and Kimura, 2009; Jones
and Kierzkowski, 2001; Kimura, 2012). Efficiency in logistic services is also dependent, to
a large extent, on ‘Behind the Border’ measures of government policy and regulation, which
are driven by efficiency and equity concerns. It is therefore important to have a regionallogistics sector policy to facilitate the trade and production linkages across Asia’s borders.46
In this study, our objective is to empirically explore the role of logistics in enhancing
production linkages through trade in intermediate products. Two case studies of trade in
intermediate goods are undertaken: (i) India’s export of textile yarn to Bangladesh; and
(ii) India’s import of air conditioning equipment from Thailand. Here, yarn and air
conditioning equipment are selected owing to a steady rise in trade of these two products,
which are facilitated by regional and bilateral FTAs.47 Bangladesh buys yarn from India, and
India buys air conditioning equipment from Thailand. These can facilitate the development
of integrated production networks.
The remaining part of the study is organized as follows. Section 2 undertakes
a review of the existing literature and identifies the gaps. Section 3 presents the data and
methodology. Section 4 discusses some stylized facts about India’s trade with Bangladesh
and Thailand in yarn and air conditioning equipment. Also discussed are the overall trends
in intra-industry trade between them. Section 5 undertakes an assessment of logistics in
Asia-Pacific countries including Bangladesh, India and Thailand. Section 6 presents the
major analytical findings, and Section 7 concludes the paper.
A. Logistics services and production networks:Literature review
Manufactured goods are the largest and most rapidly growing portion of world trade.
Studies show that a country’s global competitiveness is improved by more efficient supply
chains and better access to logistics services. More so, it creates the conditions for
mutually beneficial production linkages across borders.48 As production is increasingly
shared across borders, simplification of trade processes and procedures would helpimprove the time and costs associated with logistics, thereby improving export
competitiveness.49
On the other hand, higher trade costs and service inefficiency may discourage
fragmentation of production. While reduction in transaction costs through efficient logistics
46 This is also not to deny that framing a regional logistics sector policy has been slow in South and
Southeast Asia, compared to national logistics sector policies adopted by several developing countries in
recent years, Refer, for example, to Findlay (2009), Sourdin and Pomfret (2009).
47 Preferential tariff reductions are given under, for example, SAFTA in case of India – Bangladesh trade, and
ASEAN-India FTA and India-Thailand FTA in case of India – Thailand trade.
48 Refer to, for example, Arnold (2010)
49 See, for example, Duval and Utoktham (2011), ESCAP (2011), to mention a few.

8/11/2019 Trade performance and competitiveness: Selected issues relevant for Asian developing economies
http://slidepdf.com/reader/full/trade-performance-and-competitiveness-selected-issues-relevant-for-asian-developing 113/215
93
services, liberalization of trade in services and investment policy assists cross-border
production linkages. Here, liberalization of trade in services is defined as the demand of
any services that arises directly from trade itself (in this context international trade), and
some examples of trade in services are transportation, communication, insurance, banking
etc. According to Deardorff (2001), this liberalization permits rationalization of serviceactivities along the lines of comparative advantage. He cites the case of US-Mexico
cross-border transportation services as an example. Before the North American Free Trade
Agreement (NAFTA), Mexican truckers were not allowed to enter US territory and vice
versa. Thus, if goods are to be shipped from Mexico to the US, then Mexican trucks would
carry the goods up to Mexico-US border checkpoint, unloaded from Mexican registered
truck, reloaded on to a US registered truck and carried to the destination. As a result, the
consignment faced a number of transaction costs in the form of time, customs delay, and
regulatory costs and so on. After NAFTA, liberalization of such transportation services has
allowed a consignment to be shipped in a Mexican truck up from its origin in Mexico to itsUS destination. This method has reduced transport costs and time, as well as helping to
reduce the final price of goods. Hummels (2007) also elaborates on this in relation to sea
and air transportation.
Logistical services constitute an essential part of international trade that usually
involves progression in communication, transportation, logistics, finance, etc.
Communication and transport are not only vital intermediate inputs to international trade,
but can also be final exports. The competitiveness of the manufacturing firms in open
economies is determined in part by access to low-cost and high-quality producer services
(Francois and Hoekman, 2010). Efficiency in logistic services can thereby generate benefits
for merchandise trade flows by directly reducing the associated transaction costs, and
indirectly improving competitiveness of firms (Mattoo et al., 2001; Deardoff, 2001). Hesse
and Rodrigue (2004) discuss improvement in logistics as including four core elements;
traditional transport costs, organization of the supply chain, transactional and physical
environments in which freight distribution evolves. This enables private firms to expand
their opportunities more efficiently. Within this, a product (or its component) inputs cross
international borders several times during the process of its production, in accordance with
related economic incentives. In such a scenario, service link costs can have a multiplicative
effect on the total cost of producing a final product (Hiratsuka, 2008; Kimura and
Kobayashi, 2009).
Owing to diversity in the range of logistical services facilitating trade, efficient
regulation of logistic services is sector specific. In telecommunications this may refer to pro-
competitive regulation, while in the financial service sector it will concern prudential
regulation (Mattoo, Rathindran and Subramanian, 2001). In transport, these may be
reflected in lower freight, documentation and administrative costs in customs procedures.
As supply chains become more complex, and expand over a larger space, logistical
requirements become more sophisticated and demanding, increasing pressure onunderlying infrastructure (Brooks, 2008; 2010).

8/11/2019 Trade performance and competitiveness: Selected issues relevant for Asian developing economies
http://slidepdf.com/reader/full/trade-performance-and-competitiveness-selected-issues-relevant-for-asian-developing 114/215
94
As noted in Kimura and Kobayashi (2009), the key to attracting fragmented
production blocs is to (i) improve locational advantages by, for example, developing special
economic zones (SEZs). This with at least an improved local level investment climate, and
(ii) reduce the cost of service links that connect remotely located production blocs by
improving trade and transport facilitation. Figure 1 presents graphical links betweenproduction blocks and service links. In fragmentation of production, an efficient and
improved service link is important for expansion of production networks across a region.
Figure 1. Production blocks and logistics service links
Source: Kimura and Kobayashi (2009).
East Asia has recorded high intra-regional trade shares owing, in particular, to
rapidly expanding intra-regional trade in parts and components. This is particularly so for Association of Southeast Asian Nations (ASEAN), where production network exports is
over 60 per cent of total manufacturing exports in the last decade (Athukorala, 2010). Their
progress in recent decades is attributed, at least in part, to technological changes in service
industries, where there has been more rapid and effective transportation and
communication. The ICT revolution and time-sensitive logistics infrastructure is considered
to have played a major role in the “2nd unbundling” of manufacturing production in Asia,
which began in the 1980s (Kimura, 2012).50 For example, a positive relationship has
developed between competition and privatization in telecom sectors for 12 developing East
Asian countries. Mishra et al. (2011) suggests that increasing sophistication in serviceexports carries important implications for countries in Asia. Particularly so for countries
50 The term “2nd unbundling” describes international division of labour in terms of production processes and
tasks was coined by Baldwin (2011).
Before fragmentation
After fragmentation
Large integrated factory
PB : Production blocks
SL : Service links
SL
SL
SL
SL
SL
PB
PB
PB
PB
PB
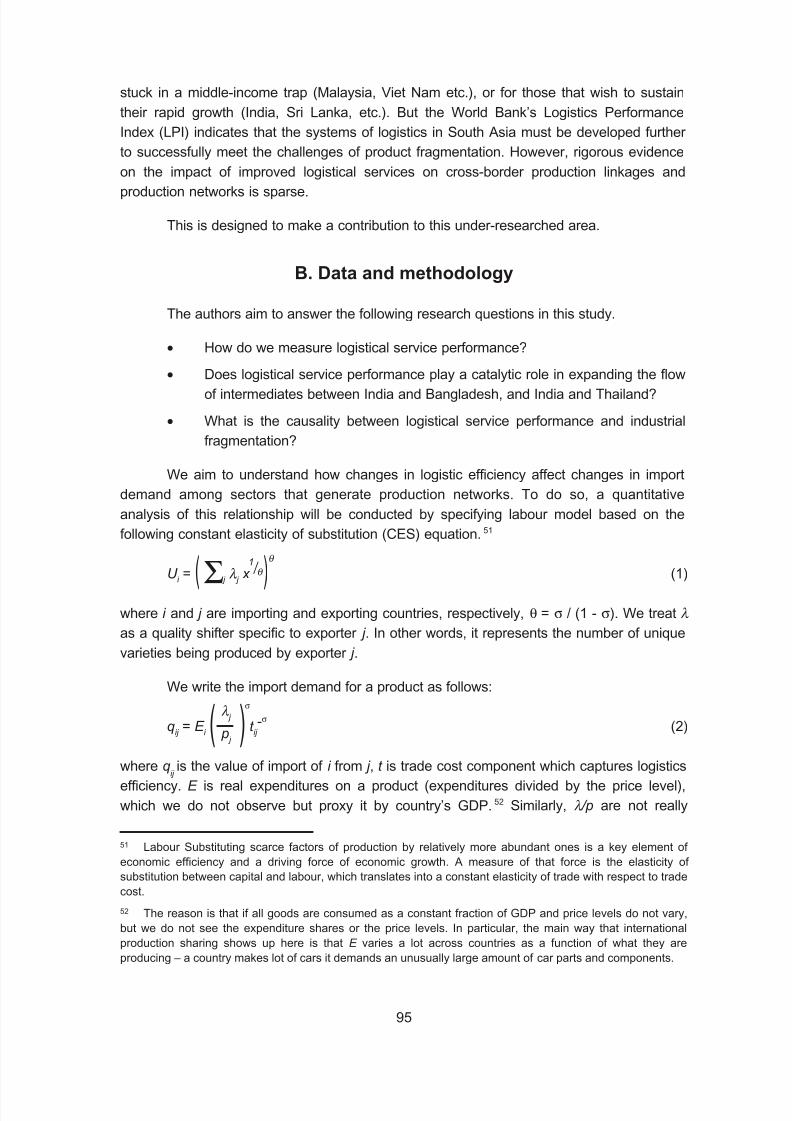
8/11/2019 Trade performance and competitiveness: Selected issues relevant for Asian developing economies
http://slidepdf.com/reader/full/trade-performance-and-competitiveness-selected-issues-relevant-for-asian-developing 115/215
95
stuck in a middle-income trap (Malaysia, Viet Nam etc.), or for those that wish to sustain
their rapid growth (India, Sri Lanka, etc.). But the World Bank’s Logistics Performance
Index (LPI) indicates that the systems of logistics in South Asia must be developed further
to successfully meet the challenges of product fragmentation. However, rigorous evidence
on the impact of improved logistical services on cross-border production linkages andproduction networks is sparse.
This is designed to make a contribution to this under-researched area.
B. Data and methodology
The authors aim to answer the following research questions in this study.
• How do we measure logistical service performance?
• Does logistical service performance play a catalytic role in expanding the flow
of intermediates between India and Bangladesh, and India and Thailand?
• What is the causality between logistical service performance and industrial
fragmentation?
We aim to understand how changes in logistic efficiency affect changes in import
demand among sectors that generate production networks. To do so, a quantitative
analysis of this relationship will be conducted by specifying labour model based on the
following constant elasticity of substitution (CES) equation.51
U i = ( Σ j
λ j x
) (1)
where i and j are importing and exporting countries, respectively, θ = σ / (1 - σ). We treat λ
as a quality shifter specific to exporter j . In other words, it represents the number of unique
varieties being produced by exporter j .
We write the import demand for a product as follows:
qij = E
i ( ) t ij -
σ(2)
where qijis the value of import of i from j , t is trade cost component which captures logistics
efficiency. E is real expenditures on a product (expenditures divided by the price level),
which we do not observe but proxy it by country’s GDP.52 Similarly, λ /p are not really
51 Labour Substituting scarce factors of production by relatively more abundant ones is a key element of
economic efficiency and a driving force of economic growth. A measure of that force is the elasticity of
substitution between capital and labour, which translates into a constant elasticity of trade with respect to trade
cost.
52 The reason is that if all goods are consumed as a constant fraction of GDP and price levels do not vary,
but we do not see the expenditure shares or the price levels. In particular, the main way that international
production sharing shows up here is that E varies a lot across countries as a function of what they are
producing – a country makes lot of cars it demands an unusually large amount of car parts and components.
1 / θ
θ
σ
p j
λ j
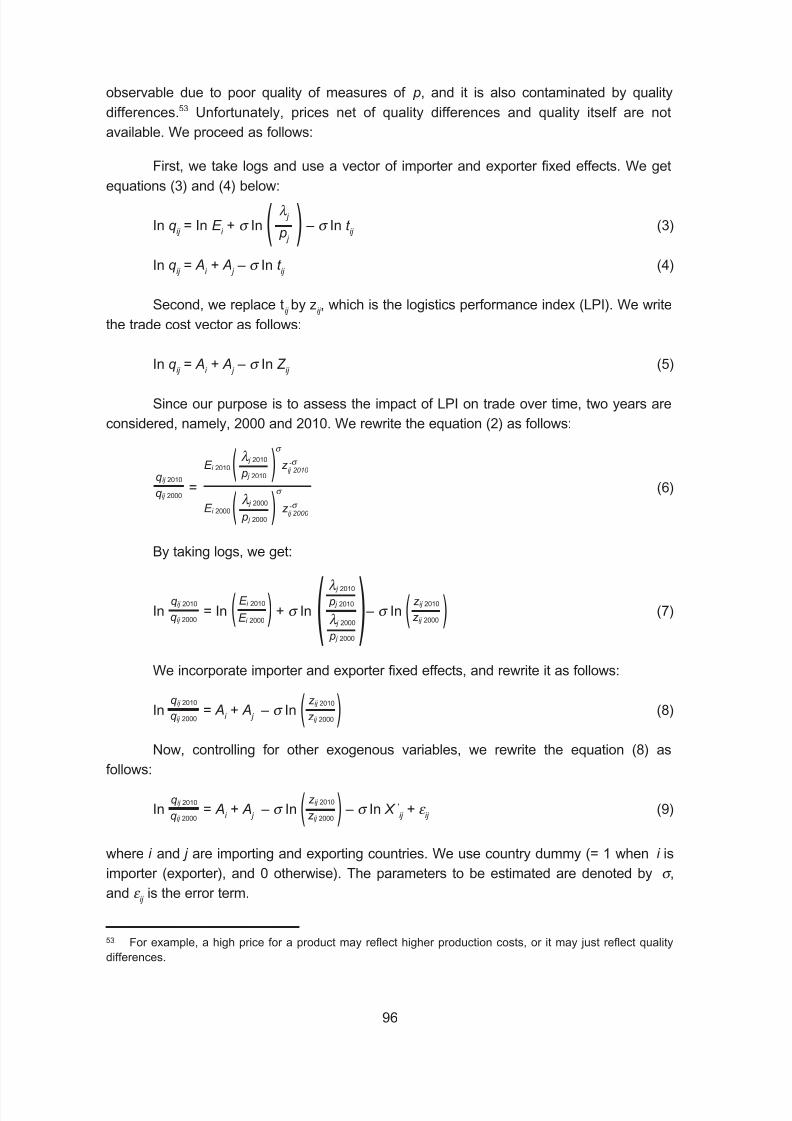
8/11/2019 Trade performance and competitiveness: Selected issues relevant for Asian developing economies
http://slidepdf.com/reader/full/trade-performance-and-competitiveness-selected-issues-relevant-for-asian-developing 116/215
96
observable due to poor quality of measures of p, and it is also contaminated by quality
differences.53 Unfortunately, prices net of quality differences and quality itself are not
available. We proceed as follows:
First, we take logs and use a vector of importer and exporter fixed effects. We get
equations (3) and (4) below:
In qij = In E
i + σ In ( ) – σ In t
ij (3)
In qij = A
i + A
j – σ In t
ij (4)
Second, we replace tijby z
ij , which is the logistics performance index (LPI). We write
the trade cost vector as follows:
In qij = A
i + A
j – σ In Z
ij (5)
Since our purpose is to assess the impact of LPI on trade over time, two years are
considered, namely, 2000 and 2010. We rewrite the equation (2) as follows:
= (6)
By taking logs, we get:
In = In ( ) + σ In – σ In ( ) (7)
We incorporate importer and exporter fixed effects, and rewrite it as follows:
In = Ai + A j – σ In ( ) (8)
Now, controlling for other exogenous variables, we rewrite the equation (8) as
follows:
In = Ai + A
j – σ In ( ) – σ In X '
ij + ε
ij (9)
where i and j are importing and exporting countries. We use country dummy (= 1 when i is
importer (exporter), and 0 otherwise). The parameters to be estimated are denoted by σ ,
and ε ij is the error term.
53 For example, a high price for a product may reflect higher production costs, or it may just reflect quality
differences.
qij 2000
qij 2010 ( )E i 2010
( )E i 2000
z ij 2010 -σ
σ
p j 2010
λ j 2010
p j 2000
λ j 2000
σ
z ij 2000 -σ
qij 2000
qij 2010 E i 2010
E i 2000 ( ) p j 2000
λ j 2000
p j 2010
λ j 2010
qij 2000
qij 2010
z ij 2010
z ij 2000
z ij 2010
z ij 2000
qij 2000
qij 2010 z ij 2010
z ij 2000
p j
λ j

8/11/2019 Trade performance and competitiveness: Selected issues relevant for Asian developing economies
http://slidepdf.com/reader/full/trade-performance-and-competitiveness-selected-issues-relevant-for-asian-developing 117/215
97
Whether the trade between two or more economies will rise and be facilitated
towards fragmentation will depend on the potential of intra-industry trade between them.
Following Mikic and Gilbert (2007), we attempt to assess the magnitude and emerging
trend of the intensity of intra-industry trade (IIT). Here, data is sourced from COMTRADE.
We measure logistic services across countries by generating an index based on
a selected set of indicators. This uses multi-dimensional factor analysis (principal
component analysis). Data is sourced from WDI.
To understand the relationship between logistic service efficiency and trade in
intermediates, a panel data regression is carried out with equation (9) as the baseline.
Co-integration technique is also used to assess the direction of causality between logistics
performance and trade.
We use 2000 and 2010 data to empirically estimate this relationship for Bangladesh’s import of yarn from India, and import of air conditioning equipment by India
from Thailand. We consider only the stage of yarn supply to Bangladesh’s ready-made
garment producers and India’s import of air conditioning equipment from Thailand. We do
not go further to explore in detail other characteristics of the supply chain, such as whether
they comprise a specific production network as discussed in recent literature.54
C. India’s trade with Bangladesh and Thailand
India’s trade with Bangladesh and Thailand is influenced by its Free Trade
Agreements (FTAs), such as SAFTA in the case of Bangladesh, and the India-Thai
FTA – ASEAN FTA, in the case of Thailand.55 India’s yarn exports to Bangladesh and
air-conditioning equipment (ACE) imports from Thailand are major components of their
bilateral trade (Table 1).
India’s imports of ACE from Thailand grew substantially during the last decade,
comprising 12.35 per cent of India’s total imports from Thailand in 2010. ACEs are part of
India-Thailand EHS, where India has offered tariff concessions and reduced the customs
duty to zero. India’s export of yarn to Bangladesh accounted for about 35 per cent of India’stotal exports to Bangladesh.
We now study these trade flows disaggregated in terms of intermediates, capital
and consumption goods, using the Broad Economic Categories (BEC) classification.56 In
2010, India’s total imports of “Transport Equipment and Parts and Accessories thereof”
54 The usual caveat is that one needs to link the supplier of inputs with users of the product in a backward
linkage framework.
55 SAFTA was implemented among eight South Asian countries on 1 July 2006, whereas India – Thai EHS
was implemented on 1 March 2004, and India – ASEAN FTA came in force on 1 January 2010.
56 Refer Appendix 2 for the BEC Codes and corresponding BEC-HS correspondences. Details on this
methodology can be accessed at: http://www.icrier.org/pdf/amrita_saha.pdf. A limitation of this consists of the
fact that a single intermediate maybe an input for several final goods. It only traces the evidence of possibilities
of production networks. This can be useful when supported by surveys with firms involved in these networks.

8/11/2019 Trade performance and competitiveness: Selected issues relevant for Asian developing economies
http://slidepdf.com/reader/full/trade-performance-and-competitiveness-selected-issues-relevant-for-asian-developing 118/215
98
Table 1. India’s imports of ACE from Thailand and export of yarn to Bangladesh:
2000-2010
Year India’s Import India’s Total India’s Export India’s Total
of ACE from Import from of Yarn to Export to
Thailand Thailand Bangladesh Bangladesh
(Million USD)
2000 5.42 335.38 209.12 860.33
2001 22.71 404.38 201.36 1,000.63
2002 42.50 390.02 183.00 1,132.54
2003 45.11 551.54 208.34 1,599.55
2004 35.31 777.38 292.38 1,624.82
2005 112.00 1,125.16 308.49 1,656.05
2006 161.30 1,612.10 358.13 1,636.98
2007 214.17 2,162.16 346.59 2,594.56
2008 251.67 2,567.24 805.60 2,574.66
2009 257.12 2,683.95 469.66 2,181.10
2010 470.61 3,810.14 1,070.86 3,021.79
CAGR (%) 56.25 27.51 17.74 13.39
Source: Based on COMTRADE. For corresponding HS codes, please refer Appendix 2.
Figure 2. Trends in trade shares: India’s export of yarn to Bangladesh
and import of ACE from Thailand
1.62
5.61
8.18
12.35
24.31
20.12
16.16
13.03
18.63
21.88
13.36
31.29
21.53
35.44
9.589.809.9110.01
9.95
4.54
10.90
17.99
0
5
10
15
20
25
30
35
40
2 0 0 0
2 0 0 1
2 0 0 2
2 0 0 3
2 0 0 4
2 0 0 5
2 0 0 6
2 0 0 7
2 0 0 8
2 0 0 9
2 0 1 0
P e r c e n t
Import share Export share

8/11/2019 Trade performance and competitiveness: Selected issues relevant for Asian developing economies
http://slidepdf.com/reader/full/trade-performance-and-competitiveness-selected-issues-relevant-for-asian-developing 119/215
99
from Thailand amount to $482 million. Matched with the corresponding HS codes for ACE,
it is noted that more than 97 per cent of total transport equipment imported from Thailand in
2010 comprised of ACEs. In terms of the BEC, these can be classified under intermediate
goods used in manufacturing capital or consumption goods. These may be used in
producing several consumption goods classified under BEC-522 i.e. the non-industrialtransport equipment and capital goods under BEC-521, as well as industrial transport
equipment.
In the same year, India exported globally $2.2 billion worth of industrial transport
equipment and $0.8 billion worth of non-industrial transport equipment. It is also noted that
India’s imports of ACE from Thailand seem to be primarily driven by Japanese MNEs.
These may indicate early stages of production networks involving Japan, Thailand and
India. However, this has not been investigated in detail.
Similarly, while some Indian firms involved in yarn manufacture appear to be alsoinvolved in spinning, weaving and finishing of textiles, we do not have adequate data to
confirm the existence of strong production networks. Yarn (cotton and polyester), as well as
fabric (mainly denim), are almost exclusively exported by India to Bangladesh through road
transport (by trucks).57 This suggests that logistical performance may have a major impact
on cross-border production linkages work involving India and Bangladesh.
1. Intra-industry trade (IIT) and vertical fragmentation of production
The IIT index measures the degree of overlap between imports and exports in thesame commodity category, with a value of 1 indicating pure intra-industry trade and a value
of 0 indicating pure inter-industry trade.58
Table 2 presents the common set of traded goods between India and Bangladesh,
for which relatively high IIT index scores are observed.59 The estimated scores indicate that
IIT index levels are higher in manufactured products than in primary products, reflecting the
greater role of economies of scale in the production of those products.
The IIT scores suggest that there may be production-sharing opportunities, in
a static sense, in 11 products with varying potential (table 3). This potential varies from thetextile and clothing sector (most concentration) to iron and steel (least concentration).
Whereas, electrical machinery and equipment, and mechanical appliances occupy the
middle portion (medium concentration) of the value chain. The index scores also indicate
that there are only two sectors in which intra-industry trade accounts for a moderate share
between India and Bangladesh. This is namely textile and clothing, and electrical
57 There are some shipments from India’s western part to Bangladesh by ocean.
58 Before calculating IIT, data coordinates at HS nomenclature H2 were matched for both the countries. The
traditional way to measure the degree of intra-industry trade is the Grubel-Lloyd Index (G-L Index). For further
details of IIT, please refer to Mikic and Gilbert (2007, p. 76).
59 Appendix 3 presents the calculated IIT scores.
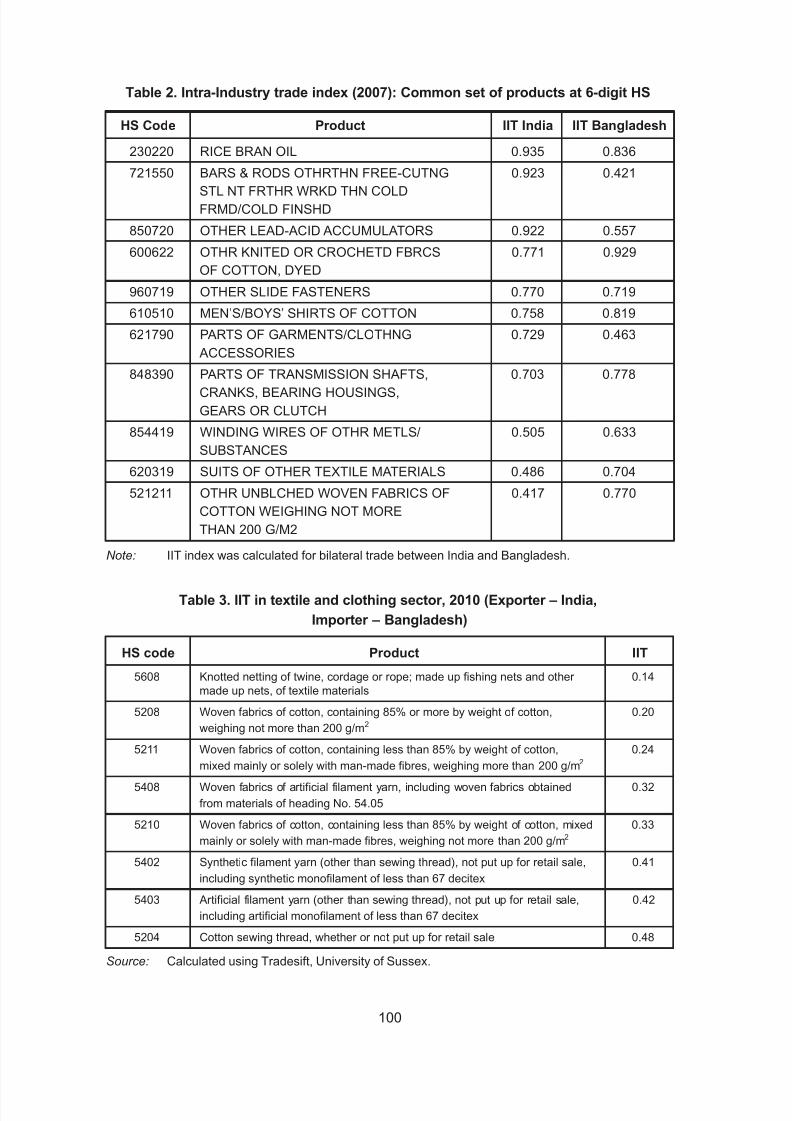
8/11/2019 Trade performance and competitiveness: Selected issues relevant for Asian developing economies
http://slidepdf.com/reader/full/trade-performance-and-competitiveness-selected-issues-relevant-for-asian-developing 120/215
100
Table 2. Intra-Industry trade index (2007): Common set of products at 6-digit HS
HS Code Product IIT India IIT Bangladesh
230220 RICE BRAN OIL 0.935 0.836
721550 BARS & RODS OTHRTHN FREE-CUTNG 0.923 0.421STL NT FRTHR WRKD THN COLD
FRMD/COLD FINSHD
850720 OTHER LEAD-ACID ACCUMULATORS 0.922 0.557
600622 OTHR KNITED OR CROCHETD FBRCS 0.771 0.929
OF COTTON, DYED
960719 OTHER SLIDE FASTENERS 0.770 0.719
610510 MEN’S/BOYS’ SHIRTS OF COTTON 0.758 0.819
621790 PARTS OF GARMENTS/CLOTHNG 0.729 0.463
ACCESSORIES848390 PARTS OF TRANSMISSION SHAFTS, 0.703 0.778
CRANKS, BEARING HOUSINGS,
GEARS OR CLUTCH
854419 WINDING WIRES OF OTHR METLS/ 0.505 0.633
SUBSTANCES
620319 SUITS OF OTHER TEXTILE MATERIALS 0.486 0.704
521211 OTHR UNBLCHED WOVEN FABRICS OF 0.417 0.770
COTTON WEIGHING NOT MORE
THAN 200 G/M2Note: IIT index was calculated for bilateral trade between India and Bangladesh.
Table 3. IIT in textile and clothing sector, 2010 (Exporter – India,
Importer – Bangladesh)
HS code Product IIT
5608 Knotted netting of twine, cordage or rope; made up fishing nets and other 0.14made up nets, of textile materials
5208 Woven fabrics of cotton, containing 85% or more by weight of cotton, 0.20weighing not more than 200 g/m2
5211 Woven fabrics of cotton, containing less than 85% by weight of cotton, 0.24
mixed mainly or solely with man-made fibres, weighing more than 200 g/m2
5408 Woven fabrics of artificial filament yarn, including woven fabrics obtained 0.32
from materials of heading No. 54.05
5210 Woven fabrics of cotton, containing less than 85% by weight of cotton, mixed 0.33
mainly or solely with man-made fibres, weighing not more than 200 g/m2
5402 Synthetic filament yarn (other than sewing thread), not put up for retail sale, 0.41
including synthetic monofilament of less than 67 decitex
5403 Artificial filament yarn (other than sewing thread), not put up for retail sale, 0.42
including artificial monofilament of less than 67 decitex
5204 Cotton sewing thread, whether or not put up for retail sale 0.48
Source: Calculated using Tradesift, University of Sussex.

8/11/2019 Trade performance and competitiveness: Selected issues relevant for Asian developing economies
http://slidepdf.com/reader/full/trade-performance-and-competitiveness-selected-issues-relevant-for-asian-developing 121/215
101
machinery and mechanical appliances sectors at the 6-digit HS level. In the category of
textile and clothing – cotton sewing thread (HS 5204), artificial filament yarn (HS 5403) and
synthetic filament yarn (HS 5402) have relatively higher IIT scores. In other sectors, intra-
industry trade is small or negligible.
In the case of India’s import of ACE from Thailand, we find relatively higher and
rising IIT index score in air, vacuum pumps, compressors, ventilating fans, etc. (HS 8414).
This increased from 0.344 in 2000 to 0.409 in 2010 with a peak of 0.590 in 2007 (Table 4).
In sharp contrast, IIT index scores of air conditioning equipment, machinery (HS 8415) and
compression-ignition engines (diesel, etc.) (HS 8408) are very low.
Table 4. IIT in air conditioning equipment (Importer – India, Exporter – Thailand)
Compression-ignition Air, vacuum pumps, Air conditioning
engines (diesel, etc.), compressors, equipment, machinery
(HS 8408) ventilating fans, etc. (HS 8415)
(HS 8414)
2000 0.548 0.344 0.031
2001 0.007 0.214 0.013
2002 0.017 0.145 0.020
2003 0.044 0.247 0.031
2004 0.173 0.061 0.051
2005 0.019 0.205 0.064
2006 0.002 0.276 0.013
2007 0.008 0.590 0.003
2008 0.029 0.563 0.003
2009 0.036 0.448 0.001
2010 0.023 0.409 0.008
Source: Calculated using Tradesift, University of Sussex.
To identify the vertical IIT, the indices at a high disaggregated level (HS 6) are
compared with those at a low disaggregated level (HS 2). IIT indices that are low at HS 6
and high at HS 2 are a necessary (although not sufficient) condition for the existence of
vertical trade. This is because they suggest that the countries trade different products in the
same sector. The usual caveat is that when the IIT index is observed to be low at HS 6 but
high at HS 2, one should check on case-by-case basis whether the different products are
differentiated as final products or as parts and components. This is against final products to
minimise aggregation bias. Tables 5 and 6 present the vertical IIT trade potential between
India and Bangladesh, and between India and Thailand, respectively. The textile and
clothing sector appears to offer significant vertical trade opportunities. This is most
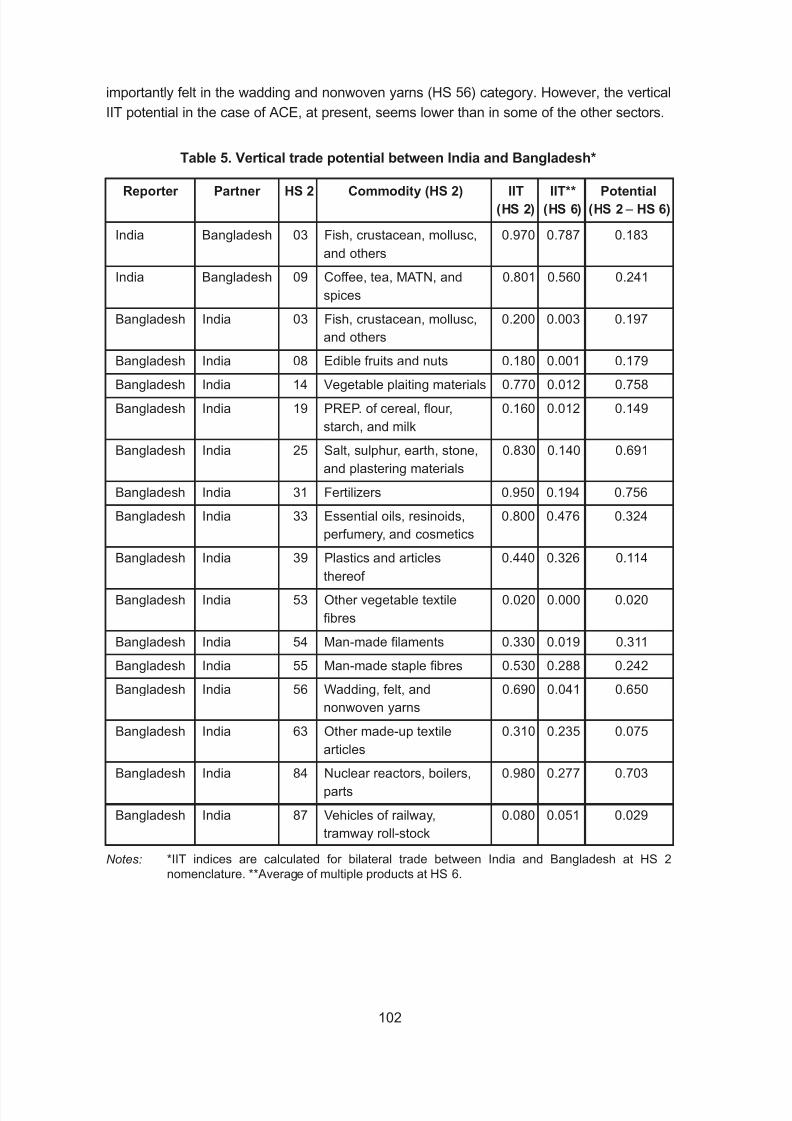
8/11/2019 Trade performance and competitiveness: Selected issues relevant for Asian developing economies
http://slidepdf.com/reader/full/trade-performance-and-competitiveness-selected-issues-relevant-for-asian-developing 122/215
102
Table 5. Vertical trade potential between India and Bangladesh*
Reporter Partner HS 2 Commodity (HS 2) IIT IIT** Potential
(HS 2) (HS 6) (HS 2 – HS 6)
India Bangladesh 03 Fish, crustacean, mollusc, 0.970 0.787 0.183
and others
India Bangladesh 09 Coffee, tea, MATN, and 0.801 0.560 0.241
spices
Bangladesh India 03 Fish, crustacean, mollusc, 0.200 0.003 0.197
and others
Bangladesh India 08 Edible fruits and nuts 0.180 0.001 0.179
Bangladesh India 14 Vegetable plaiting materials 0.770 0.012 0.758
Bangladesh India 19 PREP. of cereal, flour, 0.160 0.012 0.149
starch, and milk
Bangladesh India 25 Salt, sulphur, earth, stone, 0.830 0.140 0.691
and plastering materials
Bangladesh India 31 Fertilizers 0.950 0.194 0.756
Bangladesh India 33 Essential oils, resinoids, 0.800 0.476 0.324
perfumery, and cosmetics
Bangladesh India 39 Plastics and articles 0.440 0.326 0.114
thereof
Bangladesh India 53 Other vegetable textile 0.020 0.000 0.020
fibres
Bangladesh India 54 Man-made filaments 0.330 0.019 0.311
Bangladesh India 55 Man-made staple fibres 0.530 0.288 0.242
Bangladesh India 56 Wadding, felt, and 0.690 0.041 0.650
nonwoven yarnsBangladesh India 63 Other made-up textile 0.310 0.235 0.075
articles
Bangladesh India 84 Nuclear reactors, boilers, 0.980 0.277 0.703
parts
Bangladesh India 87 Vehicles of railway, 0.080 0.051 0.029
tramway roll-stock
Notes: *IIT indices are calculated for bilateral trade between India and Bangladesh at HS 2nomenclature. **Average of multiple products at HS 6.
importantly felt in the wadding and nonwoven yarns (HS 56) category. However, the vertical
IIT potential in the case of ACE, at present, seems lower than in some of the other sectors.

8/11/2019 Trade performance and competitiveness: Selected issues relevant for Asian developing economies
http://slidepdf.com/reader/full/trade-performance-and-competitiveness-selected-issues-relevant-for-asian-developing 123/215
103
D. Measuring logistics performance
In this section we briefly summarize the methodology and data sources for
constructing a logistics performance index (LPI) covering 20 Asia-Pacific countries, and the
results.
There are several aspects of logistics which complement each other, such as
telecommunication, transport, financial infrastructure and human resource quality. While
these indicators correlate among themselves in some cases, none of them adequately
capture the overall logistics performance. A country may have a very good network of roads
but poor telecommunication infrastructure, for example. Therefore, the statistical techniqueof principal component analysis (PCA) is helpful in constructing a unique single index
based on information across different variables that reflect different aspects of
infrastructure.
PCA finds linear combinations of the original variables to construct the principal
components (or factors) with a variance greater than any single original variable.
LPI it = Σ W
jt X
jit (10)
where LPIit = Logistics Performance Index of the i-th country (20 countries) in t-th time
(namely, 2000 to 2010), W jt = weight of the j-th aspect of logistics in t-th time, and X
jit = value
of the j-th aspect of logistics for the i-th country in t-th time point.
Table 6. Vertical trade potential between India and Thailand*
Reporter Partner HS 2 Commodity (HS 2) IIT IIT** Potential
(HS 2) (HS 6) (HS 2 – HS 6)
India Thailand 84 Nuclear reactors, boilers, 0.33 0.20 0.13
machinery, etc.
India Thailand 48 Paper & paperboard, 0.99 0.13 0.86
articles of pulp, paper etc.
India Thailand 15 Animal, vegetable fats 0.98 0.11 0.87
and oils, cleavage
products etc.
India Thailand 64 Footwear, gaiters and 0.97 0.11 0.86
the like, parts thereof
India Thailand 51 Wool, animal hair, 0.97 0.05 0.92horsehair yarn and fabric
etc.
India Thailand 87 Vehicles other than 0.97 0.21 0.76
railway, tramway
Notes: *IIT indices are calculated for bilateral trade between India and Thailand at HS 2nomenclature. **Average of multiple products at HS 6.
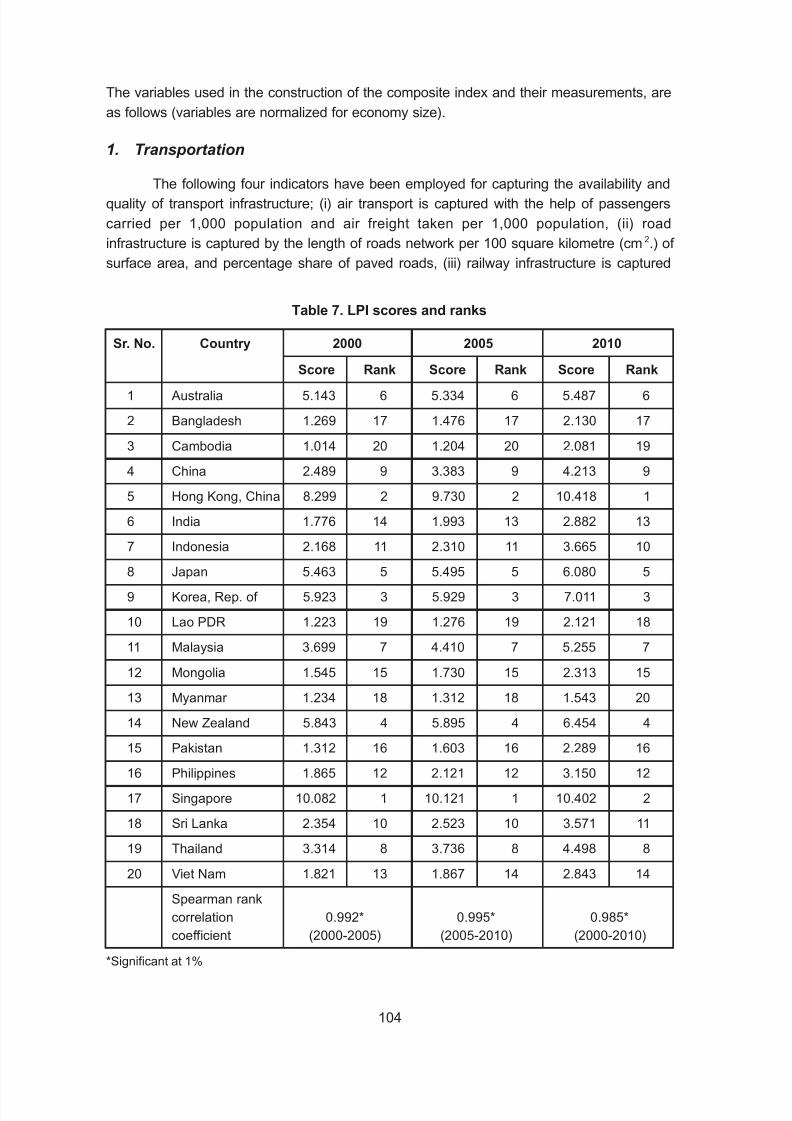
8/11/2019 Trade performance and competitiveness: Selected issues relevant for Asian developing economies
http://slidepdf.com/reader/full/trade-performance-and-competitiveness-selected-issues-relevant-for-asian-developing 124/215
104
The variables used in the construction of the composite index and their measurements, are
as follows (variables are normalized for economy size).
1. Transportation
The following four indicators have been employed for capturing the availability and
quality of transport infrastructure; (i) air transport is captured with the help of passengers
carried per 1,000 population and air freight taken per 1,000 population, (ii) road
infrastructure is captured by the length of roads network per 100 square kilometre (cm2.) of
surface area, and percentage share of paved roads, (iii) railway infrastructure is captured
Table 7. LPI scores and ranks
Sr. No. Country 2000 2005 2010
Score Rank Score Rank Score Rank
1 Australia 5.143 6 5.334 6 5.487 6
2 Bangladesh 1.269 17 1.476 17 2.130 17
3 Cambodia 1.014 20 1.204 20 2.081 19
4 China 2.489 9 3.383 9 4.213 9
5 Hong Kong, China 8.299 2 9.730 2 10.418 1
6 India 1.776 14 1.993 13 2.882 13
7 Indonesia 2.168 11 2.310 11 3.665 10
8 Japan 5.463 5 5.495 5 6.080 5
9 Korea, Rep. of 5.923 3 5.929 3 7.011 3
10 Lao PDR 1.223 19 1.276 19 2.121 18
11 Malaysia 3.699 7 4.410 7 5.255 7
12 Mongolia 1.545 15 1.730 15 2.313 15
13 Myanmar 1.234 18 1.312 18 1.543 20
14 New Zealand 5.843 4 5.895 4 6.454 4
15 Pakistan 1.312 16 1.603 16 2.289 16
16 Philippines 1.865 12 2.121 12 3.150 12
17 Singapore 10.082 1 10.121 1 10.402 2
18 Sri Lanka 2.354 10 2.523 10 3.571 11
19 Thailand 3.314 8 3.736 8 4.498 8
20 Viet Nam 1.821 13 1.867 14 2.843 14
Spearman rank
correlation 0.992* 0.995* 0.985*
coefficient (2000-2005) (2005-2010) (2000-2010)
*Significant at 1%
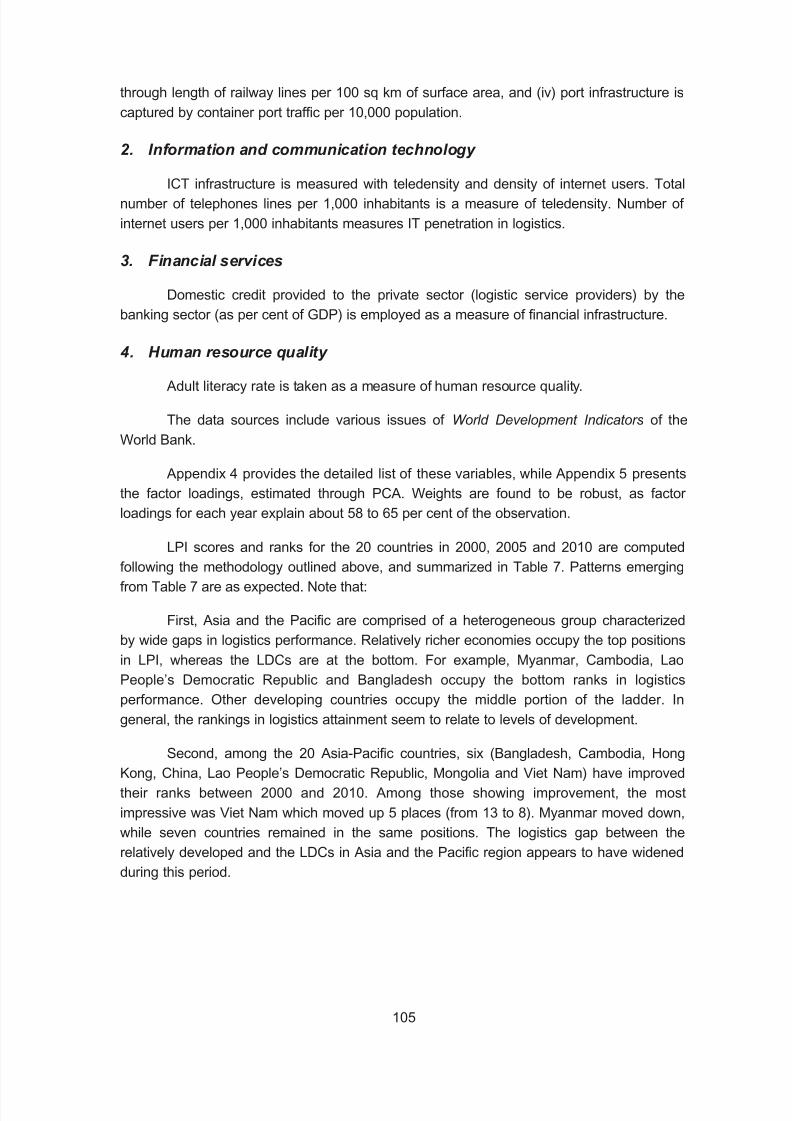
8/11/2019 Trade performance and competitiveness: Selected issues relevant for Asian developing economies
http://slidepdf.com/reader/full/trade-performance-and-competitiveness-selected-issues-relevant-for-asian-developing 125/215
105
through length of railway lines per 100 sq km of surface area, and (iv) port infrastructure is
captured by container port traffic per 10,000 population.
2. Information and communication technology
ICT infrastructure is measured with teledensity and density of internet users. Total
number of telephones lines per 1,000 inhabitants is a measure of teledensity. Number of
internet users per 1,000 inhabitants measures IT penetration in logistics.
3. Financial services
Domestic credit provided to the private sector (logistic service providers) by the
banking sector (as per cent of GDP) is employed as a measure of financial infrastructure.
4. Human resource quality
Adult literacy rate is taken as a measure of human resource quality.
The data sources include various issues of World Development Indicators of the
World Bank.
Appendix 4 provides the detailed list of these variables, while Appendix 5 presents
the factor loadings, estimated through PCA. Weights are found to be robust, as factor
loadings for each year explain about 58 to 65 per cent of the observation.
LPI scores and ranks for the 20 countries in 2000, 2005 and 2010 are computed
following the methodology outlined above, and summarized in Table 7. Patterns emerging
from Table 7 are as expected. Note that:
First, Asia and the Pacific are comprised of a heterogeneous group characterized
by wide gaps in logistics performance. Relatively richer economies occupy the top positions
in LPI, whereas the LDCs are at the bottom. For example, Myanmar, Cambodia, Lao
People’s Democratic Republic and Bangladesh occupy the bottom ranks in logistics
performance. Other developing countries occupy the middle portion of the ladder. In
general, the rankings in logistics attainment seem to relate to levels of development.
Second, among the 20 Asia-Pacific countries, six (Bangladesh, Cambodia, Hong
Kong, China, Lao People’s Democratic Republic, Mongolia and Viet Nam) have improved
their ranks between 2000 and 2010. Among those showing improvement, the most
impressive was Viet Nam which moved up 5 places (from 13 to 8). Myanmar moved down,
while seven countries remained in the same positions. The logistics gap between the
relatively developed and the LDCs in Asia and the Pacific region appears to have widened
during this period.

8/11/2019 Trade performance and competitiveness: Selected issues relevant for Asian developing economies
http://slidepdf.com/reader/full/trade-performance-and-competitiveness-selected-issues-relevant-for-asian-developing 126/215
106
E. Does Improvement in Logistical Services Lead to Higher Trade in Intermediate Goods?
Equation (9) was estimated for both India’s export of yarn and imports of ACE as
the dependent variable, to represent external and internal factors that influence trade in
production-networked goods across borders. This estimation is with LPI, for both partner
and reporter countries, and a set of control variables, the exchange rate (er), population
(pop), manufacturing value added (mva), GDP and per capita consumption of electricity
(pce).The panel data model considers a set of 19 Asia-Pacific countries.60 Data was
sourced from WDI.
As there is a strong correlation between GDP and trade, there will a definite
problem if both of these variables are taken together. Hence, the regression models reflects
attempt to avoid the obvious multi-collinearity problem. Also, the data structure shows
non-linearity so that double log regressions give better results than non-transformedvariable-based regressions. Variables being in natural logarithms, estimated coefficients
show CES elasticity. The elasticity is useful as an indicator of the effect of trade barriers on
trade volumes. The estimated baseline results are presented in table 8.
Table 8. Baseline regression (OLS): Fixed effect model
Traditional FEM Traditional FEM
Variable India’s Export of Yarn India’s Import of ACE
ln_export ln_export ln_import ln_import
ln_lpi_r 1.130* 0.266* -2.634*** 0.146*
(0.632) (0.213) (0.993) (0.151)
ln_lpi_p -1.079 0.778* 2.260*** 0.860*
(0.936) (0.661) (0.682) (0.668)
ln_er -0.321*** -1.191 -0.00188 -1.715
(0.0756) (1.904) (0.0719) (2.17)
ln_pce -1.612*** -0.217* -0.933*** -0.145
(0.277) (1.412) (0.219) (1.172)ln_mva 0.194 1.918 6.942*** 2.542
(0.225) (1.689) (0.274) (2.982)
ln_gdp 1.442*** 0.215 0.859*** 0.226
(0.136) (1.327) (0.113) (0.915)
Observations 209 209 209 209
R-squared 0.358 0.952 0.844 0.937
Country effect No Yes No Yes
Year effect No Yes No YesNotes: Robust standard errors in parentheses
*** p <0.01, ** p <0.05, * p <0.1
60 We took all the countries listed in table 7, except Brunei Darussalam. This is due to data limitation.

8/11/2019 Trade performance and competitiveness: Selected issues relevant for Asian developing economies
http://slidepdf.com/reader/full/trade-performance-and-competitiveness-selected-issues-relevant-for-asian-developing 127/215
107
Most variables have expected signs, and adjusted R-squared values range from
0.36 to 0.96.
Note that in all regressions the classical linear regression is dominated by fixed-
effect model. Hence, the ordinary regression results reported in table 8 are not statistically
tenable, particularly in the case of India’s export of yarn.61 Robustness is improved in the
case of fixed-effect model, explaining about 95 per cent of the variations in observation for
export of yarn and 94 per cent for import of ACE.
Baseline regressions suggest that logistical performance and trade in the selected
intermediate goods are positively associated. With these being equal, the improvement of
logistics would lead to an increase in trade. Coefficients of LPI have positive signs in FEM
for both reporting country as well as partner country.
Controlling for country fixed-effects, the estimated elasticity indicates that a 10 per cent improvement in logistical performance in India increases its export of yarn to
Bangladesh by about 3 per cent. Whereas, improvement of logistics, to the same extent, in
Bangladesh increases India’s export of yarn to Bangladesh by almost 8 per cent.
In the case of India’s import of ACE from Thailand, estimated elasticity indicates that
10 per cent improvement in India’s logistics may increase India’s imports by 9 per cent.
Whereas, a 10 per cent improvement in logistics in Thailand may increase its exports of
ACE to India by about 1.5 per cent.
1. Robustness checks
The relationships described above cannot be interpreted as causal until the
possibility of endogeneity has been ruled out in the baseline regressions. To address this
issue, a dynamic GMM estimator (system-GMM) – also known as Arellano-Bover/Blundell-
Bond linear dynamic panel-data estimation – was used to analyse changes across
countries and over time.62 The estimator also effectively deals with reverse causality by
including lagged dependent variables to account for the persistence of the inequality and/or
trade openness indicators.63
61 Selection of model, whether a random-effect or a fixed-effect regression, was done based on Hausmann
test.
62 First introduced by Arellano and Bond (1991).
63 Following Arellano and Bover (1995), and Blundell and Bond (1998), a system-GMM was taken in place of
a difference-GMM. Arellano and Bover (1995) and Blundell and Bond (1998) revealed a potential weakness of
the difference-GMM estimator. They showed that lagged levels can be poor instruments for first-differenced
variables, particularly if the variables are persistent. In their modification of the estimator, they suggested the
inclusion of lagged levels along lagged differences. In contrast to the original difference-GMM, they termed this
the expanded estimator system-GMM.

8/11/2019 Trade performance and competitiveness: Selected issues relevant for Asian developing economies
http://slidepdf.com/reader/full/trade-performance-and-competitiveness-selected-issues-relevant-for-asian-developing 128/215
108
One of the main advantages of the system-GMM estimator is that it does not
require any external instruments other than the variables already included in the dataset. It
uses lagged levels and differences between two periods as instruments for current valuesof the endogenous variable, together with external instruments. More importantly, the
estimator does not use lagged levels or differences by itself for the estimation. Instead, it
employs them as instruments to explain variations in infrastructure development. This
approach ensures that all information will be used efficiently, and that focus is placed on the
impact of regressors (such as trade) on logistics, and not vice versa.
Also, the Arellano-Bond estimates, presented in table 9, remove the weak
instrumental variables and poor efficiency problems, as they utilize more moment
conditions. Table 9 provides system-GMM estimates when the dependent variable is Indianexport of yarn and India’s import of ACE interchangeably. The Wald chi2 statistics indicate
the estimated results are robust and statistically significant. To test the appropriateness of
the instruments used, the Sargan J-statistics of over-identifying restrictions in table 9 is
used. The Sragan J-statistics show that the applied instruments are valid. The Arellano-
Table 9. Arellano-Bover dynamic panel-data estimation (System GMM)
DV = ln_export Coefficient SE DV = ln_import Coefficient SE
ln_export L1 0.239* 0.069 ln_import L1 0.107* 0.030
ln_export L2 0.044 0.083 Ln_import L2 0.015 0.060
ln_lpi_p 0.980*** 0.346 ln_lpi_r 0.584** 0.357
ln_lpi_r 0.654** 0.264 ln_lpi_p 0.168 0.021
ln_er -0.257 0.242 ln_er -0.109 0.118
ln_pce -1.044** 0.434 ln_pce 0.500 0.758
ln_mva 0.095 0.601 ln_mva 0.836 0.846
ln_gdp 1.533*** 0.173 ln_gdp 1.812** 0.395
Wald chi2 2,112.95 2,956.59
(Prob > chi2) (0.00) (0.00)
Sargan test, 2.71 1.63
chi2 (Prob > chi2) (0.342) (0.265)
Arellano-Bond test 1, 0.004 0.003
Prob > z
Arellano-Bond test 2, 0.893 0.675
Prob > z
Instruments 60 60
Observations 171 171
Notes: Dynamic panel counts White period instrument weighting matrix, White period standarderrors and co-variance (d.f. corrected). The estimation uses orthogonal deviation. L1 and L2equal lags 1 and 2, respectively. SE stands for standard errors. *** p <0.01, ** p <0.05,* p <0.1

8/11/2019 Trade performance and competitiveness: Selected issues relevant for Asian developing economies
http://slidepdf.com/reader/full/trade-performance-and-competitiveness-selected-issues-relevant-for-asian-developing 129/215
109
Bond tests for serial correlation support the model specification. If the model is well
specified, we expect to reject the null of no autocorrelation of the first order (AB1), and
accept the hypothesis of no autocorrelation of the second order (AB2). It is apparent that
past exports determine, to some extent, the present level of exports (first period lagged
export is statistically significant). However, logistical performance has a strong influence onthe export of yarn or import of ACE over time. In support of the previous findings (table 8),
system-GMM estimates suggest persistence of export (import), since the initial level of
export (import) appears to be an important instrument in the evolution of production-
networked trade over space and time. Thus, the results of system-GMM support the static
panel result.
Therefore, we conclude that improvements in logistical services are associated with
increased trade in yarn between India and Bangladesh, and in ACE between India and
Thailand. However, to ascertain the causation between logistical performance and trade,
we need to look at the causality.
2. Co-integration and causality
Table 10 presents the results of the Im, Pesaran and Shin (IPS) panel unit root test
at level. IPS test is usually applied for heterogeneous panel to test the series for the
presence of a unit root.64 We found that the null hypothesis of having panel unit root is
generally rejected in all but two variables at level form and various lag lengths. Only two of
the variables are non-stationary on the basis of the IPS test. The results of the panel unit
root tests confirm that the two variables are non-stationary at level. Table 10 also presentsthe results of the tests at first difference for IPS test. It is observed that for all the series the
null hypothesis of unit root test is now rejected at 95 per cent critical value (1 per cent
level). Hence, based on IPS test, there is strong evidence that all the series are integrated
of order one, denoted I (1).
Table 10. Im, Pesaran and Shin (IPS) panel unit root test
(Period: 2000-2010)
Variable Level 1st
Difference
Export of yarn 4.3469
Import of ace 4.1241
lpi_p -0.878 -8.3574
lpi_r -1.2862
gdp 11.1182
mva 0.1723 -8.3376
pce 1.7857
er 3.1842
64 Appendix 6 presents the basic equations of IPS.

8/11/2019 Trade performance and competitiveness: Selected issues relevant for Asian developing economies
http://slidepdf.com/reader/full/trade-performance-and-competitiveness-selected-issues-relevant-for-asian-developing 130/215
110
Next, we tested for co-integration using the four panel co-integration tests
developed by Westerlund (2007).65 The underlying idea is to test for the absence of co-
integration by determining whether the individual panel members are error correcting. This
is to investigate whether long-run steady state or co-integration exist among the variables.
Since the variables are found to be integrated in the same order I (1), we continue with thepanel co-integration tests carried out for constant plus time trend. The postulated
relationship between the variables allows for a linear time trend. The results are in
tables 11(a) and table 11(b). Results strongly reject the hypothesis that the series are not
co-integrated, thereby showing existence of a long-run relationship among the relevant
variables.
Table 11(a). India’s exports of yarn to Bangladesh:
Westerlund panel co-integration test
(Period: 2000-2010)
Statistic Value z-value p-value
gdp (partner)
Gt -4.963 -14.149 0
Ga -21.352 -6.195 0
Pt -18.876 -11.259 0
Pa -85.544 -55.89 0
mva (1st diff)
Gt -11.421 -49.2 0
Ga -23.013 -7.284 0
Pt -33.568 -28.372 0
Pa -34.816 -18.872 0
er
Gt -6.299 -21.399 0
Ga -13.448 -1.016 0
Pt 25.939 40.94 0
Pa 5.263 10.374 0 lpi_p (1st diff)
Gt -12.438 -54.722 0
Ga -21.123 -6.045 0
Pt -0.59 10.039 0
Pa -2.456 4.741 0
lpi _r
Gt -4.587 -12.108 0
Ga -26.657 -9.671 0
Pt -8.86 0.407 0
Pa 19.693 -7.837 0
65 Appendix 7 presents the basic equations of Westerlund.
8/11/2019 Trade performance and competitiveness: Selected issues relevant for Asian developing economies
http://slidepdf.com/reader/full/trade-performance-and-competitiveness-selected-issues-relevant-for-asian-developing 131/215
111
Table 11(b). India’s exports of yarn to Bangladesh:
Westerlund panel co-integration test
(Period: 2000-2010)
Statistic Value z-value p-value
gdp (partner )
Gt -6.076 -20.189 0
Ga -24.845 -8.484 0
Pt -20.045 -12.621 0
Pa -24.635 -11.443 0
mva (1st diff)
Gt -2.128 1.235 0.892
Ga 280.156 191.38 1
Pt -9.967 -0.882 0.189
Pa -28.718 14.423 0
er
Gt -4.728 12.872 0
Ga 1.556 8.816 1
Pt -13.451 -4.94 0
Pa -20.965 -8.765 0
lpi_p (1st diff)
Gt -2.477 -0.656 0.256Ga -118.824 -70.068 0
Pt -8.297 1.063 0.856
Pa -15.949 -5.105 0
lpi_r
Gt -5.87 -19.071 0
Ga -130.242 -77.55 0
Pt -11.751 -2.961 0
Pa -23.23 -10.42 0

8/11/2019 Trade performance and competitiveness: Selected issues relevant for Asian developing economies
http://slidepdf.com/reader/full/trade-performance-and-competitiveness-selected-issues-relevant-for-asian-developing 132/215
112
Finally, we test for causality based on the Granger causality framework.66 By
estimating an equation in which Y is regressed on lagged values of Y and lagged values of
an additional variable X, we can evaluate the null hypothesis that X does not Granger
cause Y. If one or more of the lagged values of X is significant, we are able to reject the null
hypothesis that X does not Granger cause Y. The test results presented in table 12 indicate
a two-way causality between LPI and trade. This, in combination with previous results,
indicates that improvement in logistics in either trading partner would increase trade and
vice versa. This is despite the magnitudes of the effects being different between the trading
partners.
Summary and implications
This is a study of the impact of improved logistic services on India’ trade in two
important intermediate goods – yarn exports to Bangladesh and ACE imports from
Thailand.
Both Bangladesh and Thailand are India’s FTA partners, and trade in yarn and air-
conditioning equipment has been growing rapidly. India’s yarn exports to Bangladesh and
India’s imports of ACE from Thailand have been studied from the point of view of intra-
industry trade (IIT) potential. The computed IIT scores indicate that intra-industry trade
accounted for a moderate share of total trade between India and Bangladesh in the textile
and clothing sector. India’s export of cotton sewing thread (HS 5204), artificial filament yarn
(HS 5403) and synthetic filament yarn (HS 5402) to Bangladesh had relatively high IIT
scores. According to the index scores, the textile and clothing sector offers substantial
Table 12. Panel Granger causality test between trade and LPI
F-Test Null Hypothesis Result
Variables A (X causes Y) B (Y causes X)A (X B (Y Granger
causes Y) causes X) Causality
F-Statistic F-Critical F-Statistic F-Critical F-Critical
Export of yarn 0.759 0.09 0.782 0.08 Reject Reject Bidirectional
and lpi_p
Export of yarn 0.970 0 0.961 0 Reject Reject Bidirectional
and lpi_r
Import of ace 0 62.2 0 52.6 Do Not Do Not No
and lpi_p Reject Reject Causality
Import of ace 0.772 0.08 0.605 0.27 Reject Reject Bidirectional
and lpi_r
66 The usual caveat is that we intentionally ignore running any further panel regression at this point. Ideally,
one may carry a panel regression (e.g. FMOLS), as the variables in questions are co-integrated. Since our
interest is to investigate the causal direction, we concentrated only on Granger causality. Refer Appendix 8 for
a briefed note on Granger causality model.
8/11/2019 Trade performance and competitiveness: Selected issues relevant for Asian developing economies
http://slidepdf.com/reader/full/trade-performance-and-competitiveness-selected-issues-relevant-for-asian-developing 133/215
113
vertical IIT trade opportunities between the two countries. This is most importantly felt in the
Wadding and nonwoven yarns (HS 56), suggesting potential for further intra-industry trade
between the two countries. On the other hand, in the case of India’s import of ACE from
Thailand, IIT index score was relatively high and rising. This is in air, vacuum pumps,
compressors, ventilating fans etc. (HS 8414). However, at present the vertical IIT potentialin ACE does not appear to be very high.
We then explored the likely impact of improved logistical services on a country’s
trade in these two product categories (yarn and ACE), by first developing an index of
logistical performance (LPI). The estimated LPI scores in this study indicate that Asia and
the Pacific region are comprised of a heterogeneous group, which is characterized by wide
gaps in logistics performance. Relatively richer economies occupy the top positions in LPI,
whereas the bottom positions are occupied by the LDCs. For example, Myanmar,
Cambodia, Lao People’s Democratic Republic and Bangladesh occupy the bottom
positions in logistics performance. Other developing countries occupy the middle portion of
the ladder. The logistics gap between the relatively developed and the LDCs in Asia and
the Pacific region appears to have widened more than between 2000 and 2010.
We then proceeded to econometrically estimate the relationship between logistical
performance and trade in the selected products, using both panel regressions and system-
GMM. The result of system-GMM does not reject the static panel data modeling results.
This has enabled us to conclude that improvement in logistic services is associated with
significant increases in trade. We then tested for causality, and found that it runs in both
directions – while better logistics increases trade, more trade tends to also have a positiveimpact on logistical performance.
In terms of policy, this study suggests that efficient performance in logistics
contributes positively to trade in these two products (yarn and ACE), which are important
intermediate goods in manufacturing. This also has the potential to enhance greater
cross-border production linkages, including integrated production networks. Thus, the
improvement in logistics implies that there are mutual gains for countries in the region.
More so, there is room for cooperation to reduce the high logistics gaps, with
implementation of regional logistics sector policy.
8/11/2019 Trade performance and competitiveness: Selected issues relevant for Asian developing economies
http://slidepdf.com/reader/full/trade-performance-and-competitiveness-selected-issues-relevant-for-asian-developing 134/215
114
References
Anderson, J.E., and E. van Wincoop (2004). Trade costs, Journal of Economic Literature,
Vol. XLII, No. 3; pp. 691-751.
Ando, M., and F. Kimura (2009). Fragmentation in East Asia: Further Evidence, ERIADiscussion Paper Series No. 2009-20, ERIA, Jakarta.
Arellano, M., and O. Bover (1995). Another look at the instrumental variable estimation of
error component models, Journal of Econometrics, Vol. 68, No. 1; pp. 29-51.
Arellano, M., and S. Bond (1991). Some tests of specification for panel data: Monte Carlo
evidence and an application to employment equations, Review of Economics
Studies, Vol. 58, No. 2; pp. 277-297.
Arnold, J., (2010). Connectivity and Logistics for the North East and Beyond, in Brunner
(2010), Sage, New Delhi.
Athukorala, P., (2010). Production Networks and Trade Patterns in East Asia:
Regionalization or Globalization?, ADB Working Paper Series on Regional
Economic Integration, No. 56, Asian Development Bank, Manila.
Baldwin, R., (2011). 21st Century Regionalism: Filling the Gap between 21st Century Trade
and 20th Century Trade Rules, Centre for Economic Policy Research Policy Insight
No. 56, London.
Blundell, R., and S. Bond (1998). Initial conditions and moment restrictions in dynamic
panel data models. Journal of Econometrics, Vol. 87, No. 1; pp. 115-143.
Brooks, D.H., (2008). Linking Asia’s Trade, Logistics, and Infrastructure, ADB Institute
Working Paper No. 128, Asian Development Bank Institute (ADBI), Tokyo.
Brooks, D.H., and D. Hummels (eds.). (2009). Infrastructure’s Role in Reducing Asia’s
Trade Costs: Building for Trade, Edward Elgar, Cheltenham.
Brunner, H.P., ed. (2010). North East India: Local Economic Development and Global
Markets, Sage, New Delhi.
De, P., (2009). Empirical estimates of transportation costs: Options for enhancing Asia’strade in Brooks, D.H. and D. Hummels (eds.) Infrastructure’s Role in Lowering
Asia’s Trade Costs: Building for Trade, Edward Elgar, Cheltenham, UK.
De, P., (2011). Why is Trade at Border a Costly Affair in South Asia? An Empirical
Investigation, Contemporary South Asia, Vol. 11, No. 4.
Deardorff, A.V., (2001). International Provision of Trade Services, Trade and Fragmentation,
Policy Research Paper 2548, World Bank, Washington, D.C.
Duval, Y., and C. Utoktham (2011). Trade Facilitation in Asia and the Pacific: Which Policies
and Measures Affect Trade Costs the Most?, Working Paper Series, No. 94, ARTNeT, UNESCAP, Bangkok.
Feenstra, R.C., (2004). Advanced International Trade: Theory and Evidence, Princeton
University Press, Princeton.

8/11/2019 Trade performance and competitiveness: Selected issues relevant for Asian developing economies
http://slidepdf.com/reader/full/trade-performance-and-competitiveness-selected-issues-relevant-for-asian-developing 135/215
115
Findlay, C., (2009). Trade Facilitation in the ASEAN Economic Community, PB-2009-06,
ERIA, Jakarta.
Francois, J., and B. Hoekman. (2010). Services Trade and Policy, Journal of Economic
Literature, September 2010; pp. 642-692.
Granger, C.W.J., (1969). Investigating Causal Relations by Econometric Models and Cross-
spectral Methods, Econometrica, Vol. 37, No. 3; pp. 424-438.
Greenaway, D., R. Hine and C. Milner (1995). Vertical and Horizontal Intra-Industry Trade:
A Cross Industry Analysis for the United Kingdom, The Economic Journal , Vol. 105;
pp. 1505-18.
Hesse, M., and J.P. Rodrigue (2004). The Transport Geography of Freight Distribution and
Logistics, Journal of Transport Geography Vol. 12, No. 3; pp. 171-184.
Hiratsuka, D., and Y. Uchida (eds.) (2008).Vertical Specialization and Economic Integration
in East Asia, IDE-JETRO, Chiba.
Hummels, D., (2007), Transportation Costs and International Trade in the Second Era of
Globalization, Journal of Economic Perspectives, Vol. 21, No. 3; pp. 131-154.
Hollweg, C., and M.H. Wong (2009). Measuring Regulatory Restrictions in Logistics
Services, ERIA Discussion Paper Series, No. 2009-14, Economic Research
Institute for ASEAN and East Asia (ERIA), Jakarta.
Jones, R.W., and H. Kierzkowski (2001). A Framework for Fragmentation, in S. Arndt and
H. Kierzkowski (eds.) Fragmentation, Oxford University Press (OUP), Oxford.
Kimura, F., and A. Mitsuyo (2005). Two-dimensional fragmentation in East Asia: Conceptual
framework and empirics, International Review of Economics & Finance, Vol. 14,
No. 3; pp. 317-348.
Kimura, F., and A. Obashi (2007) International Production Networks in Machinery: Structure
and Its Evolution, ERIA Discussion Paper 2010-09, Economic Research Institute for
ASEAN and East Asia (ERIA), Jakarta.
Kimura, F., and I. Kobayashi (2009). Why is the East Asia Industrial Corridor Needed?,
ERIA Policy Brief No. 2009-01, Economic Research Institute for ASEAN and East Asia (ERIA), Jakarta.
Kimura, F., (2012). Japan’s Mission on Constructing a New International Economic Order,
Japan’s Economic Currents Policy Brief No. 81, Keizai Koho Center, Tokyo.
Kuroiwa, I., (2005). Formation of Inter-country Production Networks in East Asia:
Application of International Input-Output Analysis, paper presented at the 15th
International Input-Output Conference, Beijing, China, 27 June – 1 July.
Mikic, M., and J. Gilbert (2007). Trade Statistics in Policymaking - A Handbook of
Commonly Used Trade Indices and Indicators, United Nations Economic and SocialCommission for Asia and the Pacific (UNESCAP), Bangkok.

8/11/2019 Trade performance and competitiveness: Selected issues relevant for Asian developing economies
http://slidepdf.com/reader/full/trade-performance-and-competitiveness-selected-issues-relevant-for-asian-developing 136/215
116
Planning Commission (2011). Report of the Working Group on Logistics, New Delhi Sims,
C (1972) “Money, Income, and Causality”, The American Economic Review , Vol. 62,
No. 4, pp. 540-552.
Sourdin, P., and R. Pomfret (2012). Trade Facilitation: Defining, Measuring, Explaining, and
Reducing the Cost of International Trade, Edward Elgar, Cheltenham.
Urata, S., and K. Kiyota (2003). Services Trade in East Asia, NBER East Asia Seminar on
Economics (EASE), Volume 11, NBER.
World Bank (2012). Connecting to Compete: Trade Logistics in the Global Economy ,
Washington, D.C.

8/11/2019 Trade performance and competitiveness: Selected issues relevant for Asian developing economies
http://slidepdf.com/reader/full/trade-performance-and-competitiveness-selected-issues-relevant-for-asian-developing 137/215
117
Appendix 1
World Bank LPI, 2012
Country LPI LPI Customs Infras- International Logistics Tracking Time-
Rank Score tructure shipments com- & tracing lines
petence
Australia 18 3.73 3.60 3.83 3.40 3.75 3.79 4.05
Bangladesh * * * * * * * *
Cambodia 101 2.56 2.30 2.20 2.61 2.50 2.77 2.95
China 26 3.52 3.25 3.61 3.46 3.47 3.52 3.80
Hong Kong, 2 4.12 3.97 4.12 4.18 4.08 4.09 4.28
China
Japan 8 3.93 3.72 4.11 3.61 3.97 4.03 4.21
India 46 3.08 2.77 2.87 2.98 3.14 3.09 3.58
Indonesia 59 2.94 2.53 2.54 2.97 2.85 3.12 3.61
Korea, Rep. of 21 3.70 3.42 3.74 3.67 3.65 3.68 4.02
Lao PDR 109 2.50 2.38 2.40 2.40 2.49 2.49 2.82
Malaysia 29 3.49 3.28 3.43 3.40 3.45 3.54 3.86
Mongolia 140 2.25 1.98 2.22 2.13 1.88 2.29 2.99
Myanmar 129 2.37 2.24 2.10 2.47 2.42 2.34 2.59
New Zealand 31 3.42 3.47 3.42 3.27 3.25 3.58 3.55
Pakistan 71 2.83 2.85 2.69 2.86 2.77 2.61 3.14
Philippines 52 3.02 2.62 2.80 2.97 3.14 3.30 3.30
Singapore 1 4.13 4.10 4.15 3.99 4.07 4.07 4.39
Thailand 38 3.18 2.96 3.08 3.21 2.98 3.18 3.63
Viet Nam 53 3.00 2.65 2.68 3.14 2.68 3.16 3.64
Sri Lanka 81 2.75 2.58 2.50 3.00 2.80 2.65 2.90
Note: * Data not available.
Source: The World Bank, Washington, D.C.
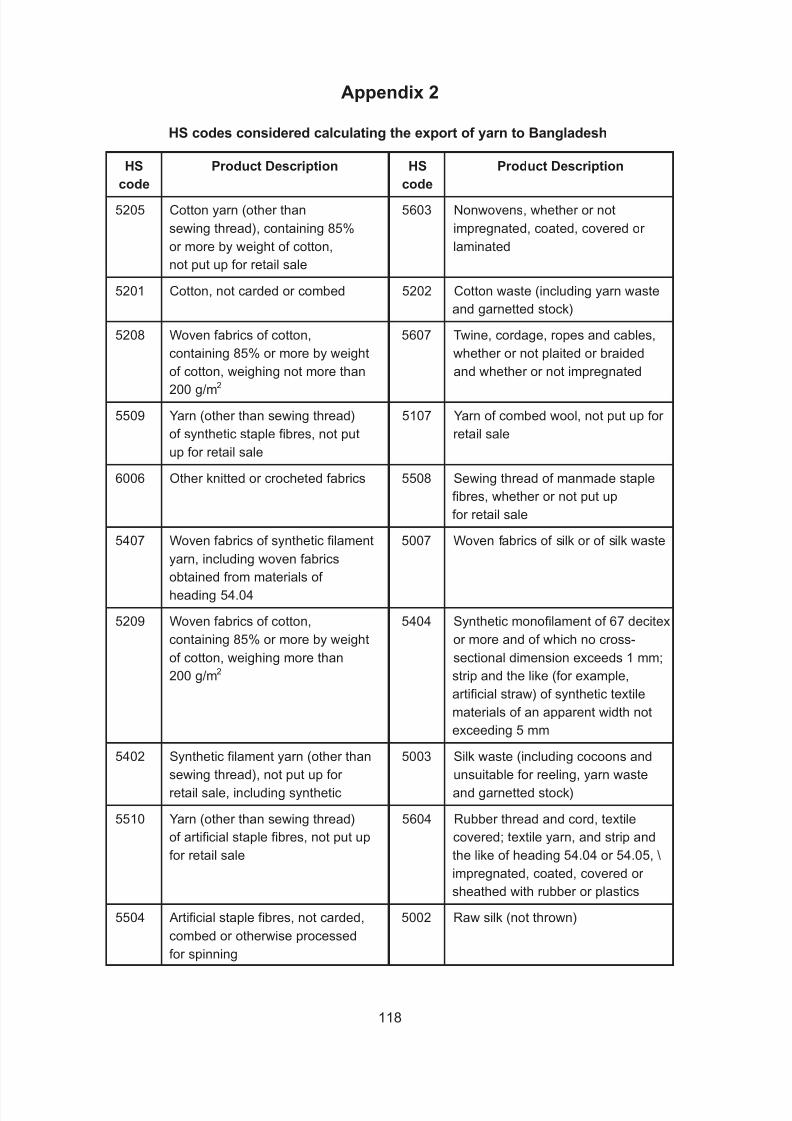
8/11/2019 Trade performance and competitiveness: Selected issues relevant for Asian developing economies
http://slidepdf.com/reader/full/trade-performance-and-competitiveness-selected-issues-relevant-for-asian-developing 138/215
118
Appendix 2
HS codes considered calculating the export of yarn to Bangladesh
HS Product Description HS Product Description
code code
5205 Cotton yarn (other than 5603 Nonwovens, whether or not
sewing thread), containing 85% impregnated, coated, covered or
or more by weight of cotton, laminated
not put up for retail sale
5201 Cotton, not carded or combed 5202 Cotton waste (including yarn waste
and garnetted stock)
5208 Woven fabrics of cotton, 5607 Twine, cordage, ropes and cables,
containing 85% or more by weight whether or not plaited or braidedof cotton, weighing not more than and whether or not impregnated
200 g/m2
5509 Yarn (other than sewing thread) 5107 Yarn of combed wool, not put up for
of synthetic staple fibres, not put retail sale
up for retail sale
6006 Other knitted or crocheted fabrics 5508 Sewing thread of manmade staple
fibres, whether or not put up
for retail sale
5407 Woven fabrics of synthetic filament 5007 Woven fabrics of silk or of silk waste
yarn, including woven fabrics
obtained from materials of
heading 54.04
5209 Woven fabrics of cotton, 5404 Synthetic monofilament of 67 decitex
containing 85% or more by weight or more and of which no cross-
of cotton, weighing more than sectional dimension exceeds 1 mm;
200 g/m2 strip and the like (for example,
artificial straw) of synthetic textile
materials of an apparent width notexceeding 5 mm
5402 Synthetic filament yarn (other than 5003 Silk waste (including cocoons and
sewing thread), not put up for unsuitable for reeling, yarn waste
retail sale, including synthetic and garnetted stock)
5510 Yarn (other than sewing thread) 5604 Rubber thread and cord, textile
of artificial staple fibres, not put up covered; textile yarn, and strip and
for retail sale the like of heading 54.04 or 54.05, \
impregnated, coated, covered or
sheathed with rubber or plastics
5504 Artificial staple fibres, not carded, 5002 Raw silk (not thrown)
combed or otherwise processed
for spinning

8/11/2019 Trade performance and competitiveness: Selected issues relevant for Asian developing economies
http://slidepdf.com/reader/full/trade-performance-and-competitiveness-selected-issues-relevant-for-asian-developing 139/215
119
6001 Pile fabrics, including “long pile” 5403 Artificial filament yarn (other than
fabrics and terry fabrics, knitted sewing thread), not put up for retail
or crocheted sale, including artificial monofilament
of less than 67 decitex
5512 Woven fabrics of synthetic staple 5505 Waste, noils, garnetted stock of fibres, containing 85% or more manmade fibers
by weight of synthetic staple fibres
5212 Other woven fabrics of cotton 5606 Gimped yarn, and strip and the like
of heading 54.04 or 54.05, gimped
(other than those of heading 56.05
and gimped horsehair yarn);
chenille yarn (including flock chenille
yarn); loop wale-yarn
5515 Other woven fabrics of synthetic 5601 Wadding of textile materials andstaple fibres articles thereof; textile fibres, not
exceeding 5 mm in length (flock),
textile dust and mill neps
5206 Cotton yarn (other than sewing 5406 Man-made filament yarn (other than
thread), containing less than 85% sewing thread), put up for retail sale
by weight of cotton, not put up
for retail sale
5408 Woven fabrics of artificial filament 5609 Articles of yarn, strip or the like of
yarn, including woven fabrics heading 54.04 or 54.05, twine,obtained from materials of cordage, rope or cables, not
heading 54.05 elsewhere specified or included
5503 Synthetic staple fibres, not carded, 5516 Woven fabrics of artificial staple
combed or otherwise processed fibers
for spinning
5112 Woven fabrics of combed wool or 5608 Knotted netting of twine, cordage
of combed fine animal hair or rope; made up fishing nets and
other made up nets, of textile
materials
5513 Woven fabrics of synthetic staple 5305 Coconut, abaca (Manila hemp or
fibres, containing less than 85% Musa textilis Nee), ramie and other
by weight of such fibres, mixed vegetable textile fibres, not
mainly or solely with cotton, elsewhere specified or included,
of a weight not exceeding 170 g/m2 raw or processed but not spun;
tow, noils and waste of these fibres
(including yarn waste and garnetted
stock)

8/11/2019 Trade performance and competitiveness: Selected issues relevant for Asian developing economies
http://slidepdf.com/reader/full/trade-performance-and-competitiveness-selected-issues-relevant-for-asian-developing 140/215
120
5211 Woven fabrics of cotton, containing 5514 Woven fabrics of synthetic staple
less than 85% by weight of cotton, fibres, containing less than 85%
mixed mainly or solely with by weight of such fibres, mixed
manmade fibres, weighing more mainly or solely with cotton,
than 200 g/m2 of a weight exceeding 170 g/m2
5605 Metallised yarn, whether or not 5602 Felt, whether or not impregnated,
gimped, being textile yarn, or strip coated, covered or laminated
or the like of heading 54.04 or 54.05,
combined with metal in the form
of thread, strip or powder or
covered with metal
5903 Textile fabrics impregnated, coated, 5306 Flax yarn
covered or laminated with plastics,
other than those of heading 59.025210 Woven fabrics of cotton, containing 5005 Yarn spun from silk waste, not put
less than 85% by weight of cotton, up for retail sale
mixed mainly or solely with
manmade fibres, weighing not
more than 200 g/m2
5806 Narrow woven fabrics, other than 5109 Yarn of wool or of fine animal hair
goods of heading 58.07; narrow
fabrics consisting of warp without
weft assembled by means of anadhesive (bolducs)
5401 Sewing thread of manmade 5308 Yarn of other vegetable textile fibres;
filaments, whether or not put up paper yarn
for retail sale
5309 Woven fabrics of flax 5111 Woven fabrics of carded wool or of
carded fine animal hair
5501 Synthetic filament tow 5507 Artificial staple fibres, carded,
combed or otherwise processed for
spinning
5207 Cotton yarn (other than sewing 5103 Waste of wool or of fine or coarse
thread) put up for retail sale animal hair, including yarn waste but
excluding garnetted stock
5204 Cotton sewing thread, whether 5502 Artificial filament tow
or not put up for retail sale
5203 Cotton, carded or combed
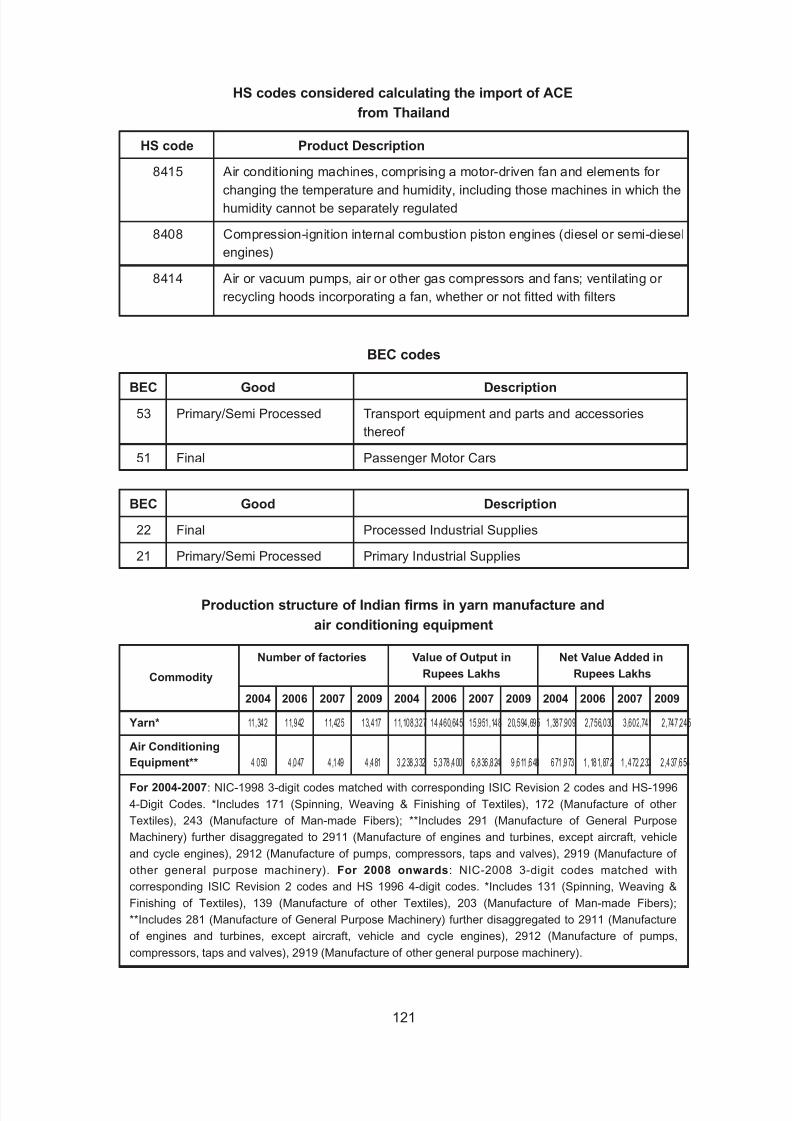
8/11/2019 Trade performance and competitiveness: Selected issues relevant for Asian developing economies
http://slidepdf.com/reader/full/trade-performance-and-competitiveness-selected-issues-relevant-for-asian-developing 141/215
121
HS codes considered calculating the import of ACE
from Thailand
HS code Product Description
8415 Air conditioning machines, comprising a motor-driven fan and elements for changing the temperature and humidity, including those machines in which the
humidity cannot be separately regulated
8408 Compression-ignition internal combustion piston engines (diesel or semi-diesel
engines)
8414 Air or vacuum pumps, air or other gas compressors and fans; ventilating or
recycling hoods incorporating a fan, whether or not fitted with filters
BEC codes
BEC Good Description
53 Primary/Semi Processed Transport equipment and parts and accessories
thereof
51 Final Passenger Motor Cars
BEC Good Description
22 Final Processed Industrial Supplies
21 Primary/Semi Processed Primary Industrial Supplies
Production structure of Indian firms in yarn manufacture and
air conditioning equipment
Number of factories Value of Output in Net Value Added in
Commodity Rupees Lakhs Rupees Lakhs
2004 2006 2007 2009 2004 2006 2007 2009 2004 2006 2007 2009
Yarn* 11,342 11,942 11,425 13,417 11,108,327 14,460,645 15,951,148 20,594,695 1,387,909 2,756,030 3,602,741 2,747,245
Air Conditioning
Equipment** 4 ,050 4 ,047 4 ,149 4 ,481 3 ,238,332 5 ,378,400 6 ,836,824 9 ,611,648 671,973 1 ,181,872 1 , 472,233 2 ,437,654
For 2004-2007: NIC-1998 3-digit codes matched with corresponding ISIC Revision 2 codes and HS-1996
4-Digit Codes. *Includes 171 (Spinning, Weaving & Finishing of Textiles), 172 (Manufacture of other
Textiles), 243 (Manufacture of Man-made Fibers); **Includes 291 (Manufacture of General Purpose
Machinery) further disaggregated to 2911 (Manufacture of engines and turbines, except aircraft, vehicle
and cycle engines), 2912 (Manufacture of pumps, compressors, taps and valves), 2919 (Manufacture of
other general purpose machinery). For 2008 onwards: NIC-2008 3-digit codes matched with
corresponding ISIC Revision 2 codes and HS 1996 4-digit codes. *Includes 131 (Spinning, Weaving &Finishing of Textiles), 139 (Manufacture of other Textiles), 203 (Manufacture of Man-made Fibers);
**Includes 281 (Manufacture of General Purpose Machinery) further disaggregated to 2911 (Manufacture
of engines and turbines, except aircraft, vehicle and cycle engines), 2912 (Manufacture of pumps,
compressors, taps and valves), 2919 (Manufacture of other general purpose machinery).
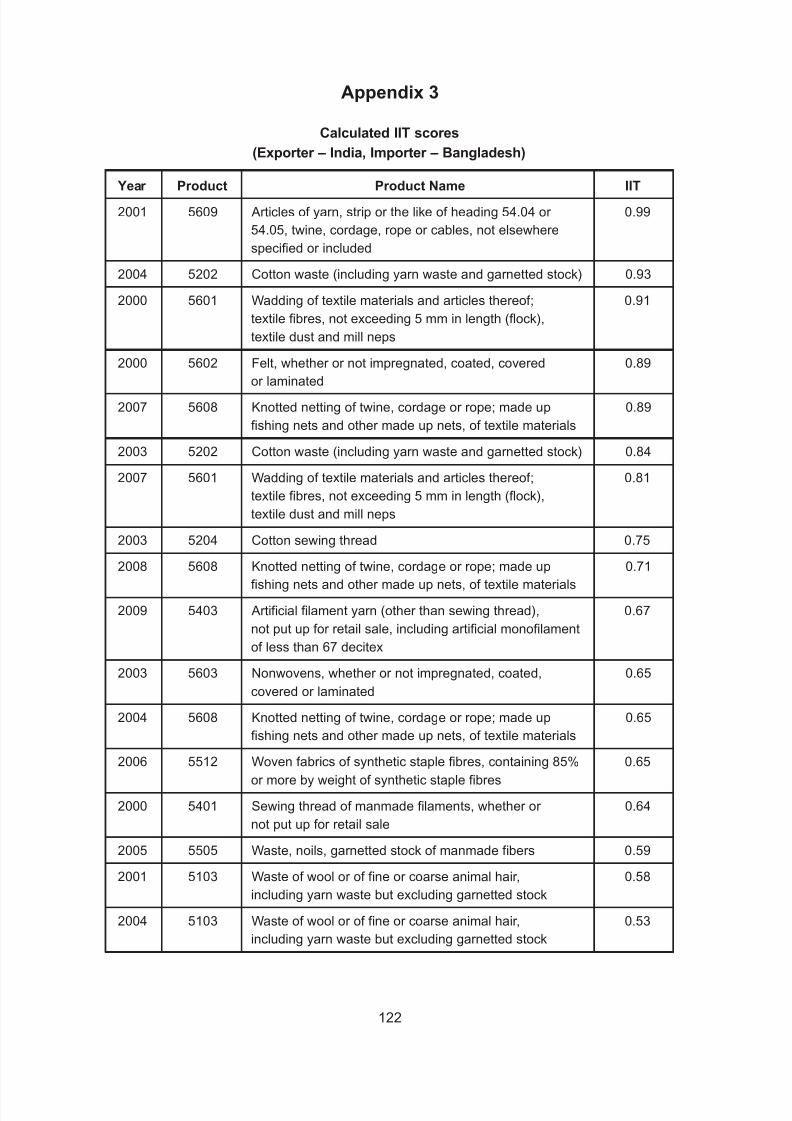
8/11/2019 Trade performance and competitiveness: Selected issues relevant for Asian developing economies
http://slidepdf.com/reader/full/trade-performance-and-competitiveness-selected-issues-relevant-for-asian-developing 142/215
122
Appendix 3
Calculated IIT scores
(Exporter – India, Importer – Bangladesh)
Year Product Product Name IIT
2001 5609 Articles of yarn, strip or the like of heading 54.04 or 0.99
54.05, twine, cordage, rope or cables, not elsewhere
specified or included
2004 5202 Cotton waste (including yarn waste and garnetted stock) 0.93
2000 5601 Wadding of textile materials and articles thereof; 0.91
textile fibres, not exceeding 5 mm in length (flock),
textile dust and mill neps
2000 5602 Felt, whether or not impregnated, coated, covered 0.89
or laminated
2007 5608 Knotted netting of twine, cordage or rope; made up 0.89
fishing nets and other made up nets, of textile materials
2003 5202 Cotton waste (including yarn waste and garnetted stock) 0.84
2007 5601 Wadding of textile materials and articles thereof; 0.81
textile fibres, not exceeding 5 mm in length (flock),
textile dust and mill neps
2003 5204 Cotton sewing thread 0.75
2008 5608 Knotted netting of twine, cordage or rope; made up 0.71
fishing nets and other made up nets, of textile materials
2009 5403 Artificial filament yarn (other than sewing thread), 0.67
not put up for retail sale, including artificial monofilament
of less than 67 decitex
2003 5603 Nonwovens, whether or not impregnated, coated, 0.65
covered or laminated
2004 5608 Knotted netting of twine, cordage or rope; made up 0.65
fishing nets and other made up nets, of textile materials
2006 5512 Woven fabrics of synthetic staple fibres, containing 85% 0.65
or more by weight of synthetic staple fibres
2000 5401 Sewing thread of manmade filaments, whether or 0.64
not put up for retail sale
2005 5505 Waste, noils, garnetted stock of manmade fibers 0.59
2001 5103 Waste of wool or of fine or coarse animal hair, 0.58
including yarn waste but excluding garnetted stock
2004 5103 Waste of wool or of fine or coarse animal hair, 0.53
including yarn waste but excluding garnetted stock

8/11/2019 Trade performance and competitiveness: Selected issues relevant for Asian developing economies
http://slidepdf.com/reader/full/trade-performance-and-competitiveness-selected-issues-relevant-for-asian-developing 143/215
123
2007 5007 Woven fabrics of silk or of silk waste 0.51
2009 5404 Synthetic monofilament of 67 decitex or more and 0.49
of which no cross-sectional dimension exceeds 1 mm;
strip and the like (for example, artificial straw) of
synthetic textile materials of an apparent width notexceeding 5 mm
2010 5204 Cotton sewing thread 0.48
2006 5606 Gimped yarn, and strip and the like of heading 54.04 0.45
or 54.05, gimped (other than those of heading 56.05
and gimped horsehair yarn); chenille yarn
(including flock chenille yarn); loop wale-yarn
2001 5608 Knotted netting of twine, cordage or rope; made up 0.45
fishing nets and other made up nets, of textile materials
2004 5505 Waste, noils, garnetted stock of manmade fibers 0.45
2005 5602 Felt, whether or not impregnated, coated, 0.44
covered or laminated
2005 6001 Pile fabrics, including “long pile” fabrics and terry fabrics, 0.43
knitted or crocheted
2010 5403 Artificial filament yarn (other than sewing thread), 0.42
not put up for retail sale, including artificial monofilament
of less than 67 decitex
2007 5210 Woven fabrics of cotton, containing less than 85% 0.41
by weight of cotton, mixed mainly or solely with
manmade fibres, weighing not more than 200 g/m2
2010 5402 Synthetic filament yarn (other than sewing thread), 0.41
not put up for retail sale, including synthetic
2008 5202 Cotton waste (including yarn waste and garnetted stock) 0.41
2007 5202 Cotton waste (including yarn waste and garnetted stock) 0.41
2007 5208 Woven fabrics of cotton, containing 85% or more by 0.40weight of cotton, weighing not more than 200 g/m2
2008 5210 Woven fabrics of cotton, containing less than 85% 0.38
by weight of cotton, mixed mainly or solely with
manmade fibres, weighing not more than 200 g/m2
2008 5007 Woven fabric of silk or of silk waste 0.37
2002 5407 Woven fabrics of synthetic filament yarn, including 0.36
woven fabrics obtained from materials of heading 54.04.
2003 5607 Twine, cordage, rope and cable 0.34
2006 5601 Wadding of textile materials and articles thereof; 0.33
textile fibres, not exceeding 5 mm in length (flock),
textile dust and mill neps

8/11/2019 Trade performance and competitiveness: Selected issues relevant for Asian developing economies
http://slidepdf.com/reader/full/trade-performance-and-competitiveness-selected-issues-relevant-for-asian-developing 144/215
124
2010 5210 Woven fabrics of cotton, containing less than 85% 0.33
by weight of cotton, mixed mainly or solely with
manmade fibres, weighing not more than 200 g/m2
2010 5408 Woven fabrics of artificial filament yarn, including 0.32
woven fabrics obtained from materials of headin
2009 5609 Articles of yarn, strip or the like of heading 54.04 or 0.31
54.05, twine, cordage, rope or cables, not elsewhere
specified or included
2003 5309 Woven fibers of flax 0.30
2005 5103 Waste of wool or of fine or coarse animal hair, 0.30
including yarn waste but excluding garnetted stock
2006 5406 Manmade filament yarn (other than sewing thread), 0.28
put up for retail sale
2009 5204 Cotton sewing thread, whether or not put up for retail sale 0.27
2007 5512 Woven fabrics of synthetic staple fibres, containing 85% 0.24
or more by weight of synthetic staple fibres
2010 5211 Woven fabrics of cotton, containing less than 85% 0.24
by weight of cotton, mixed mainly or solely with
manmade fibres, weighing more than 200 g/m2
2002 5201 Cotton, not carded or combed 0.22
2008 5602 Felt, whether or not impregnated, coated, covered or 0.20
laminated
2010 5208 Woven fabrics of cotton, containing 85% or more 0.20
by weight of cotton, weighing not more than 200 g/m2
2009 5608 Knotted netting of twine, cordage or rope; made up 0.20
fishing nets and other made up nets, of textile materials
2006 5007 Woven fabric of silk or of silk waste 0.18
2004 5513 Woven fabrics of synthetic staple fibres, containing less 0.18
than 85% by weight of such fibres, mixed mainly or
solely with cotton, of a weight not exceeding 170 g/m2
2008 5204 Cotton sewing thread 0.17
2007 5513 Woven fabrics of synthetic staple fibres, containing less 0.16
than 85% by weight of such fibres, mixed mainly or
solely with cotton, of a weight not exceeding 170 g/m2
2005 5202 Cotton waste (including yarn waste and garnetted stock) 0.15
2008 5607 Twine, cordage, rope and cable 0.14
2005 5003 Silk waste (including cocoons and unsuitable for 0.14
reeling, yarn waste and garnetted stock)

8/11/2019 Trade performance and competitiveness: Selected issues relevant for Asian developing economies
http://slidepdf.com/reader/full/trade-performance-and-competitiveness-selected-issues-relevant-for-asian-developing 145/215
125
2008 5601 Wadding of textile materials and articles thereof; 0.14
textile fibres, not exceeding 5 mm in length (flock),
textile dust and mill neps
2010 5608 Knotted netting of twine, cordage or rope; made up 0.14
fishing nets and other made up nets, of textile materials
2009 5601 Wadding of textile materials and articles thereof; 0.11
textile fibres, not exceeding 5 mm in length (flock),
textile dust and mill neps
2009 5607 Twine, cordage, rope and cable 0.11
2003 5408 Knotted netting of twine, cordage or rope; 0.11
made up fishing nets and other made up nets,
of textile materials
2005 5211 Woven fabrics of cotton, containing less than 85% 0.11by weight of cotton, mixed mainly or solely with
manmade fibres, weighing more than 200 g/m2
2009 5806 Narrow woven fabrics, other than goods of heading 0.11
58.07; narrow fabrics consisting of warp without weft
assembled by means of an adhesive (bolducs)
2008 5512 Woven fabrics of synthetic staple fibres, containing 85% 0.10
or more by weight of synthetic staple fibres
2008 5505 Waste, noils, garnetted stock of manmade fibers 0.10
2009 5402 Synthetic filament yarn (other than sewing thread), 0.10
not put up for retail sale, including synthetic

8/11/2019 Trade performance and competitiveness: Selected issues relevant for Asian developing economies
http://slidepdf.com/reader/full/trade-performance-and-competitiveness-selected-issues-relevant-for-asian-developing 146/215
126
Appendix 4
List of logistics performance indicators
Sr. No. Category Indicator Data Source
1 Transport Air transport, freight (million ton-km),
services taken per 1,000 population
2 Air transport, passengers carried,
taken per 1,000 population
3 Container port traffic (TEU: 20 foot
equivalent units), taken per 1,000
population
4 Rail lines (total route-km), taken
per 100 sq km of area
5 Roads, paved, taken as % of total roads
6 Roads, total network (km), taken
per 100 sq km of area
7 ICT services Internet users, taken per 100 population
8 Mobile cellular subscriptions, taken
per 100 population
9 Telephone lines, taken per 100 population10 Financial Domestic credit to private sector,
services taken as % of GDP
11 Human Literacy rate, adult total (% of people
resource quality ages 15 and above)
WorldDevelopment
Indicators (WDI),
World Bank
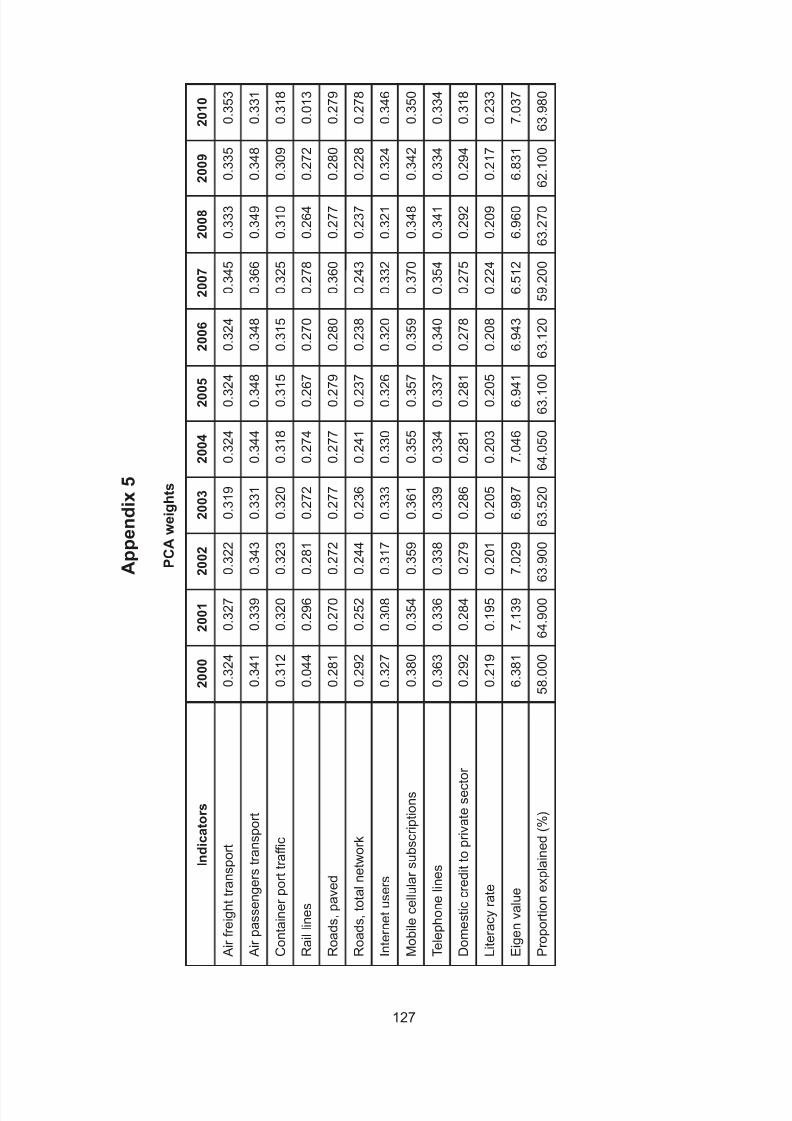
8/11/2019 Trade performance and competitiveness: Selected issues relevant for Asian developing economies
http://slidepdf.com/reader/full/trade-performance-and-competitiveness-selected-issues-relevant-for-asian-developing 147/215
127
Appendix5
PCAw
eights
Indicators
2000
2001
2002
2003
2004
2005
2006
2007
2008
2009
2010
Airfreighttra
nsport
0.324
0.327
0.322
0.319
0.324
0.324
0.324
0.345
0.333
0
.335
0.353
Airpassenge
rstransport
0.341
0.339
0.343
0.331
0.344
0.348
0.348
0.366
0.349
0
.348
0.331
Containerpo
rttraffic
0.312
0.320
0.323
0.320
0.318
0.315
0.315
0.325
0.310
0
.309
0.318
Raillines
0.044
0.296
0.281
0.272
0.274
0.267
0.270
0.278
0.264
0
.272
0.013
Roads,pave
d
0.281
0.270
0.272
0.277
0.277
0.279
0.280
0.360
0.277
0
.280
0.279
Roads,total
network
0.292
0.252
0.244
0.236
0.241
0.237
0.238
0.243
0.237
0
.228
0.278
Internetuser
s
0.327
0.308
0.317
0.333
0.330
0.326
0.320
0.332
0.321
0
.324
0.346
Mobilecellularsubscriptions
0.380
0.354
0.359
0.361
0.355
0.357
0.359
0.370
0.348
0
.342
0.350
Telephonelines
0.363
0.336
0.338
0.339
0.334
0.337
0.340
0.354
0.341
0
.334
0.334
Domesticcre
dittoprivatesector
0.292
0.284
0.279
0.286
0.281
0.281
0.278
0.275
0.292
0
.294
0.318
Literacyrate
0.219
0.195
0.201
0.205
0.203
0.205
0.208
0.224
0.209
0
.217
0.233
Eigenvalue
6.381
7.139
7.029
6.987
7.046
6.941
6.943
6.512
6.960
6
.831
7.037
Proportionexplained(%)
58.000
64.900
63.900
63.520
64.050
63.10063.120
59.200
63.270
62
.100
63.980

8/11/2019 Trade performance and competitiveness: Selected issues relevant for Asian developing economies
http://slidepdf.com/reader/full/trade-performance-and-competitiveness-selected-issues-relevant-for-asian-developing 148/215
128
Appendix 6
Im, Pesarn, and Shin (IPS) Unit Root Test
Im, Pesaran and Shin (IPS) proposes a test for the presence of unit roots in panels,
and begin by specifying a separate ADF regression for each cross-section with individual
effects and no time trend:
∆yit = αi + ρ
i yi, t 1 + Σ βij ∆yi, t j + ε
it
Where i = 1, . . ., N and t = 1, . . ., T
IPS uses separate unit root tests for the N cross-section units. Their test is based
on the Augmented Dickey-fuller (ADF) statistics averaged across groups. After estimating
the separate ADF regressions, the average of the t -statistics for p1 from the individual ADFregressions, tiTi
( pi):
tNT = ΣtiT (pi βi)
The t -bar is then standardized and it is shown that the standardized t-bar statistic
converges to the standard normal distribution as N and T →∞. IPS (1997) shows that t-bar
test has better performance when N and T are small.
pi
j = 1
1N i = 1
N

8/11/2019 Trade performance and competitiveness: Selected issues relevant for Asian developing economies
http://slidepdf.com/reader/full/trade-performance-and-competitiveness-selected-issues-relevant-for-asian-developing 149/215
129
Appendix 7
Cointegration test of Westerlund
The underlying idea in Westerlund (2007) is to test for the absence of co-integration
by determining whether the individual panel members are error correcting. Consider the
following error-correction model:
D.y_it = c_i + a_i1*D.y_it-1 + a_i2*D.y_it-2 + ... + a_ip*D.y_it-p
+ b_i0*D.x_it + b_i1*D.x_it-1 + ... + b_ip*D.x_it-p
+ a_i (y_it-1 – b_i*x_it-1) + u_it
Where, a_i provides an estimate of the speed of error-correction towards the long run
equilibrium y_it = - (b_i/a_i) * x_it for that series i. The Ga and Gt test statistics test H0: a_i
= 0 for all i versus H1: a_i < 0 for at least one i. These statistics start from a weighted
average of the individually estimated a_i’s and their t-ratio’s, respectively. The Pa and Pt
test statistics pool information over all the cross-sectional units to test H0: a_i = 0 for all i
versus H1: a_i < 0 for all i. Rejection of H0 should therefore be taken as rejection of
co-integration for the panel as a whole.
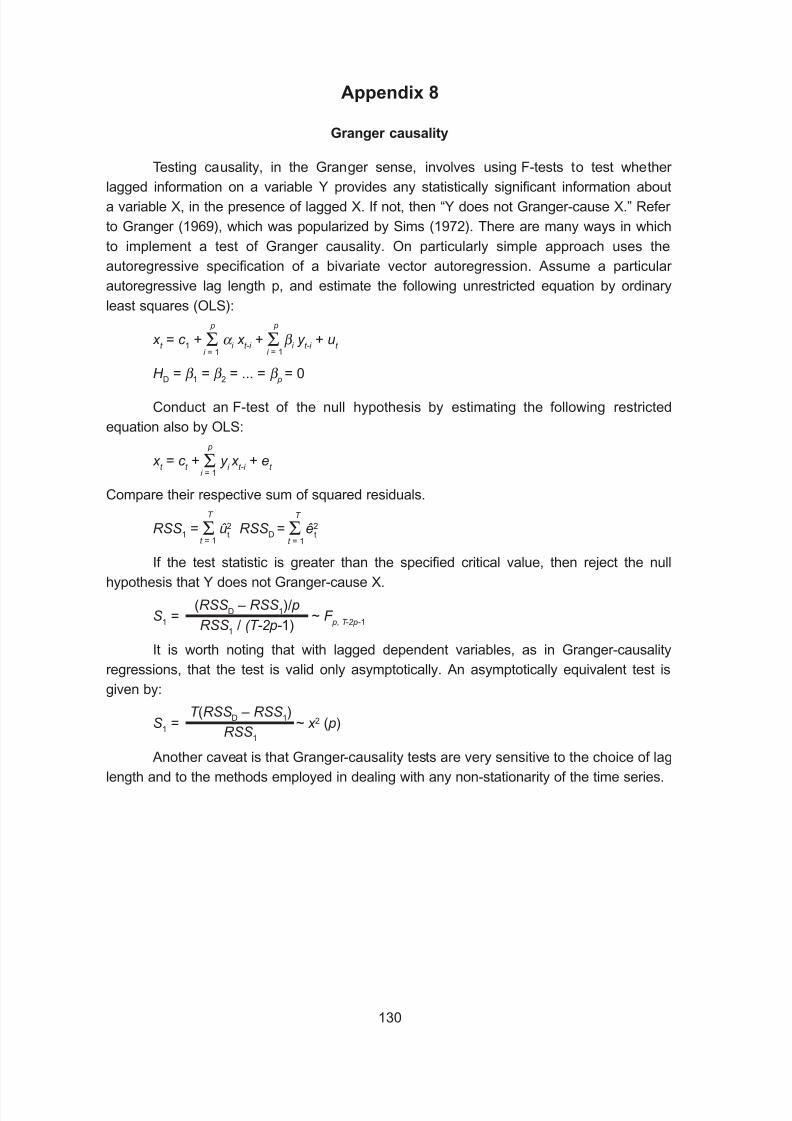
8/11/2019 Trade performance and competitiveness: Selected issues relevant for Asian developing economies
http://slidepdf.com/reader/full/trade-performance-and-competitiveness-selected-issues-relevant-for-asian-developing 150/215
130
Appendix 8
Granger causality
Testing causality, in the Granger sense, involves using F-tests to test whether
lagged information on a variable Y provides any statistically significant information about
a variable X, in the presence of lagged X. If not, then “Y does not Granger-cause X.” Refer
to Granger (1969), which was popularized by Sims (1972). There are many ways in which
to implement a test of Granger causality. On particularly simple approach uses the
autoregressive specification of a bivariate vector autoregression. Assume a particular
autoregressive lag length p, and estimate the following unrestricted equation by ordinary
least squares (OLS):
x t = c
1 + Σ α i x
t-i + Σ β
i y
t-i + u
t
H D = β 1 = β 2 = ... = β p = 0
Conduct an F-test of the null hypothesis by estimating the following restricted
equation also by OLS:
x t = c
t + Σ y
i x
t-i + e
t
Compare their respective sum of squared residuals.
RSS1 = Σ û2
RSSD = Σ ê2
If the test statistic is greater than the specified critical value, then reject the null
hypothesis that Y does not Granger-cause X.
S1 = ~ F
p, T-2p-1
It is worth noting that with lagged dependent variables, as in Granger-causality
regressions, that the test is valid only asymptotically. An asymptotically equivalent test is
given by:
S1 = ~ x 2 ( p)
Another caveat is that Granger-causality tests are very sensitive to the choice of lag
length and to the methods employed in dealing with any non-stationarity of the time series.
(RSSD – RSS
1)/ p
RSS1 / (T-2p-1)
T (RSSD – RSS1)RSS
1
t = 1
T
t = 1
T
tt
i = 1
p
i = 1
p
i = 1
p

8/11/2019 Trade performance and competitiveness: Selected issues relevant for Asian developing economies
http://slidepdf.com/reader/full/trade-performance-and-competitiveness-selected-issues-relevant-for-asian-developing 151/215
131
III. An analysis of export performance of manufacturingand service sector enterprises in Sri Lanka
By JeevikaWeerahewa, Sarath S. Kodithuwakku and Rifana Buhary
Introduction
Recent theoretical and empirical literature on international trade places renewed
emphasis on the importance of firm level factors as determinants of firms’ export behaviour.
This followed the highly influential Melitz (2003) trade model that highlighted the importance
of firm heterogeneity in determining industry-level trade responses to various shocks.
A large body of empirical evidence indicates that exporting firms are typically larger,
have higher productivity, survive longer, and pay higher wages than non-exporters. Pöschl
et al. (2009) found that size and performance premia (labour productivity and wage) of
exporting firms are significantly higher than those of non-exporters in Austria. Aw et al.
(1999), from a study conducted in Chinese Taipei, revealed that firms with higher
productivity, ex-ante, show a higher tendency to enter into the export market, whereas
exporters with low productivity show a higher tendency to exit from the export market. From
a study of Korean firms, they also found that the differences in productivity do not affect the
entry into or exit from export markets. Salomon and Shaver (2005) revealed that domesticand export sales are interdependent and the factors that influence them are also different.
This was found using estimates of a two-stage least square model for firms in the
manufacturing sector of Spain, covering Spanish-owned firms and foreign-owned firms
during 1990-1997. Salomon and Shaver (2005) discovered that domestic and export sales
complement each other (that is domestic sales positively affect export sales), as Spanish-
owned firms and export sales appear to be driven by pre-existing strengths in the domestic
market. However, for foreign-owned firms, domestic and export sales appear to be
substitutes (that is, domestic sales negatively affect export sales). It appears that foreign-
owned firms, when managing their domestic sales in the larger context of the multinationalnetwork, make trade offs between sales in domestic and foreign markets.
Exporting itself appears to have a positive influence on subsequent firm productivity.
It is argued that this may be due to exporting firms gaining access to technical expertise
from their buyers in terms of new product designs and production methods (Grossman and
Helpman, 1991; World Bank, 1993).
Export performance is influenced by managerial influences (i.e. firm characteristics,
competencies and strategy) and the nature of the external environment (see Cavusgil and
Zou, 1994). Yoshino (2008) provides a good assessment on how domestic supplyconstraints and other firm characteristics explain the geographical orientation of firms’
exports as well as the overall market diversification of African manufacturing exports.
Comprehensive reviews on the determinants of export performance are found in Aaby and

8/11/2019 Trade performance and competitiveness: Selected issues relevant for Asian developing economies
http://slidepdf.com/reader/full/trade-performance-and-competitiveness-selected-issues-relevant-for-asian-developing 152/215
132
Slater (1989), Bilkey (1978), Cheety and Hamilton (1993), Madsen (1987) and Zou and
Stan (1998).
Athukorala and Jayasuriya (1988) and Athukorala et al. (1995) studied the export
performance of Sri Lankan manufacturing firms in mid 1980s and 1990s. However, despite
the major changes in both internal and external environments, as far as the authors’ are
aware, there are no recent studies of the export behaviour of Sri Lankan firms. The
objectives of this study are to address this gap in the literature. Also, the study aims to
(i) characterize exporting and non-exporting firms in the manufacturing and services
sectors of Sri Lanka and (ii) assess the extent to which different firm characteristics and the
external environment within which the firms operate, (i.e. various domestic supply
constraints) explain export performance of the firms (whether the firm sells products directly
or indirectly in the export market).
The rest of the paper is organized as follows. The next section presents the modelused to assess determinants of export performance. In the following section, data used for
the estimation are described. In Section 4 exporting versus non-exporting firms are
characterized. Section 5 presents the results of the estimation, and the final section
presents conclusions and policy implications.
A. A model to assess determinants of export performance
1. Measurement of export performance
Shoham (1996) defines export performance as the result of a firm’s actions in the
export markets. Export performance of a firm is commonly measured by (a) export
propensity, (b) export sales and (c) export intensity. Export propensity is generally defined
as the likelihood of a firm becoming an exporter (Estrin et al., 2008). It is calculated as the
proportion of exporting firms within the total number of firms. Zou and Stan (1998) identified
export sales as the most frequently used measure of export performance. Exporting firms
have two basic options as export channels – direct exports and indirect exports. Exporting
firms often choose indirect exports to minimize transaction costs (Peng and York, 2001).
Hence, the sum of direct and indirect sales in the export market is counted as total export
sales. Export intensity is measured as the share of export sales in total sales (Estrin et al.,
2008; Salomon and Shaver, 2005; Pöschl et al., 2009).
2. Determinants of export performance: An estimation model
The degree of export performance of a firm is determined by both internal and
external factors. Internal determinants of export performance are justified by the resource-
based theory, which conceives a firm as a unique bundle of tangible and intangible
resources (assets, capabilities, processes, managerial attributes, information andknowledge). These unique resources are controlled by the firm, enabling it to conceive and
implement strategies aimed at improving its efficiency and effectiveness (Barney, 1991;
Daft, 1983; Wernefelt, 1984). External determinants of export performance are also justified

8/11/2019 Trade performance and competitiveness: Selected issues relevant for Asian developing economies
http://slidepdf.com/reader/full/trade-performance-and-competitiveness-selected-issues-relevant-for-asian-developing 153/215
133
by the industrial organization theory, which argues that the external factors determine the
firm’s strategy, in turn determines economic performance (Scherer and Ross, 1990). The
logic is that the external environment imposes pressures to which a firm must adapt in
order to survive and prosper (Collis, 1991).
We chose the two-stage Heckman estimation procedure for our econometric
analysis to avoid the potential selection bias, a common problem in studies of export
behaviour of firms. This is because the selected sample firms include those that have
already made the decision to export. The procedure involves a probit model in the first
stage (selection stage) and an OLS in the second stage (outcome stage). The presence of
the selection bias of variables is recognized in the probit model, and correction is done in
the second stage by inserting the calculated correction factor (i.e. inverse Mills ratio) in the
OLS as an instrument.
The Heckman two-step method used in this study is presented below, whereequation 1 is the selection equation and 2 is the outcome equation.
Equation 1: The decision to export (i.e. export propensity) is modeled as a dichotomous
choice.
P ( X i > 0) = 1 if ξ
i > 0;
0 otherwise
ξ i = α + β 1 ∗ BP
i + β 2 ∗ FC
i + β 3 ∗ MC + β 4 ∗ S
i + β 5 ∗ Y + β 6 ∗ Z + β 7 ∗ BC
i + ε
i
Equation 2: The decision of value of export sales or export intensity as an OLS
X i = α + β
1 ∗ BP
i + β
2 ∗ FC
i + β
3 ∗ MC + β
4 ∗ S
i + β
5 ∗ Y + β
6 ∗ Z + β
7 ∗ BC
i + ε
i
The first stage explains the probability that firm i exports, where the dependent
variable is a dummy that is equal to one if a firm exports, zero otherwise. The dependent
variable at the second stage is exports, X i . Two equations were estimated, using two
specifications for X i , the logarithmic value of export value and export intensity of the firm.
BP i is a vector of variables of business performance. The other independent variablesinclude firm characteristics (FC
i ), management characteristics (MC ), size dummies (S
i ),
industry dummies (Y ), provincial dummies (Z ) and behind the border constraint dummies
(BC i ). ε
iis an error term assumed to be independently and identically distributed.
B. Data description
1. Enterprise survey of the World Bank: Coverage
The World Bank’s Enterprise Surveys provide a unique source of information that
can be used to analyse the degree of export performance and its determinants. The most
recent survey was conducted in 2011 and it covered 836 enterprises in the manufacturing
and service sectors from all the nine provinces of Sri Lanka. The sample was selected
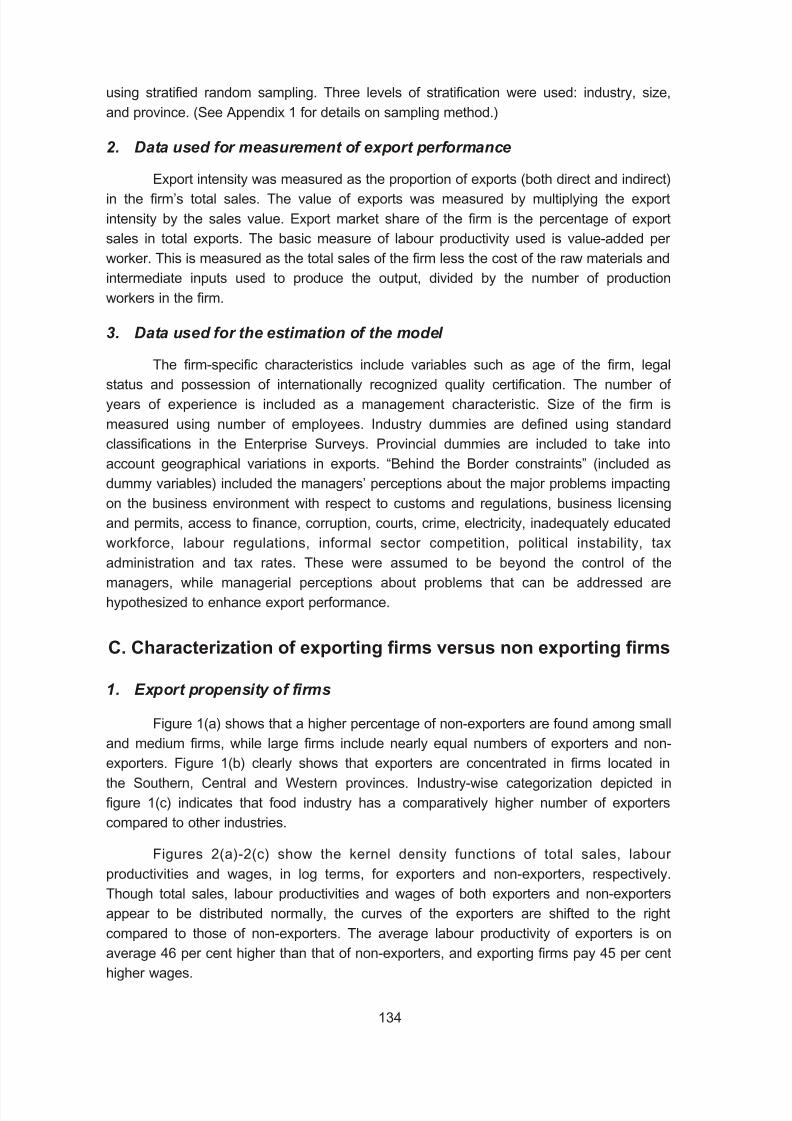
8/11/2019 Trade performance and competitiveness: Selected issues relevant for Asian developing economies
http://slidepdf.com/reader/full/trade-performance-and-competitiveness-selected-issues-relevant-for-asian-developing 154/215
134
using stratified random sampling. Three levels of stratification were used: industry, size,
and province. (See Appendix 1 for details on sampling method.)
2. Data used for measurement of export performance
Export intensity was measured as the proportion of exports (both direct and indirect)in the firm’s total sales. The value of exports was measured by multiplying the export
intensity by the sales value. Export market share of the firm is the percentage of export
sales in total exports. The basic measure of labour productivity used is value-added per
worker. This is measured as the total sales of the firm less the cost of the raw materials and
intermediate inputs used to produce the output, divided by the number of production
workers in the firm.
3. Data used for the estimation of the model
The firm-specific characteristics include variables such as age of the firm, legal
status and possession of internationally recognized quality certification. The number of
years of experience is included as a management characteristic. Size of the firm is
measured using number of employees. Industry dummies are defined using standard
classifications in the Enterprise Surveys. Provincial dummies are included to take into
account geographical variations in exports. “Behind the Border constraints” (included as
dummy variables) included the managers’ perceptions about the major problems impacting
on the business environment with respect to customs and regulations, business licensing
and permits, access to finance, corruption, courts, crime, electricity, inadequately educated
workforce, labour regulations, informal sector competition, political instability, tax
administration and tax rates. These were assumed to be beyond the control of the
managers, while managerial perceptions about problems that can be addressed are
hypothesized to enhance export performance.
C. Characterization of exporting firms versus non exporting firms
1. Export propensity of firms
Figure 1(a) shows that a higher percentage of non-exporters are found among small
and medium firms, while large firms include nearly equal numbers of exporters and non-
exporters. Figure 1(b) clearly shows that exporters are concentrated in firms located in
the Southern, Central and Western provinces. Industry-wise categorization depicted in
figure 1(c) indicates that food industry has a comparatively higher number of exporters
compared to other industries.
Figures 2(a)-2(c) show the kernel density functions of total sales, labour
productivities and wages, in log terms, for exporters and non-exporters, respectively.
Though total sales, labour productivities and wages of both exporters and non-exportersappear to be distributed normally, the curves of the exporters are shifted to the right
compared to those of non-exporters. The average labour productivity of exporters is on
average 46 per cent higher than that of non-exporters, and exporting firms pay 45 per cent
higher wages.
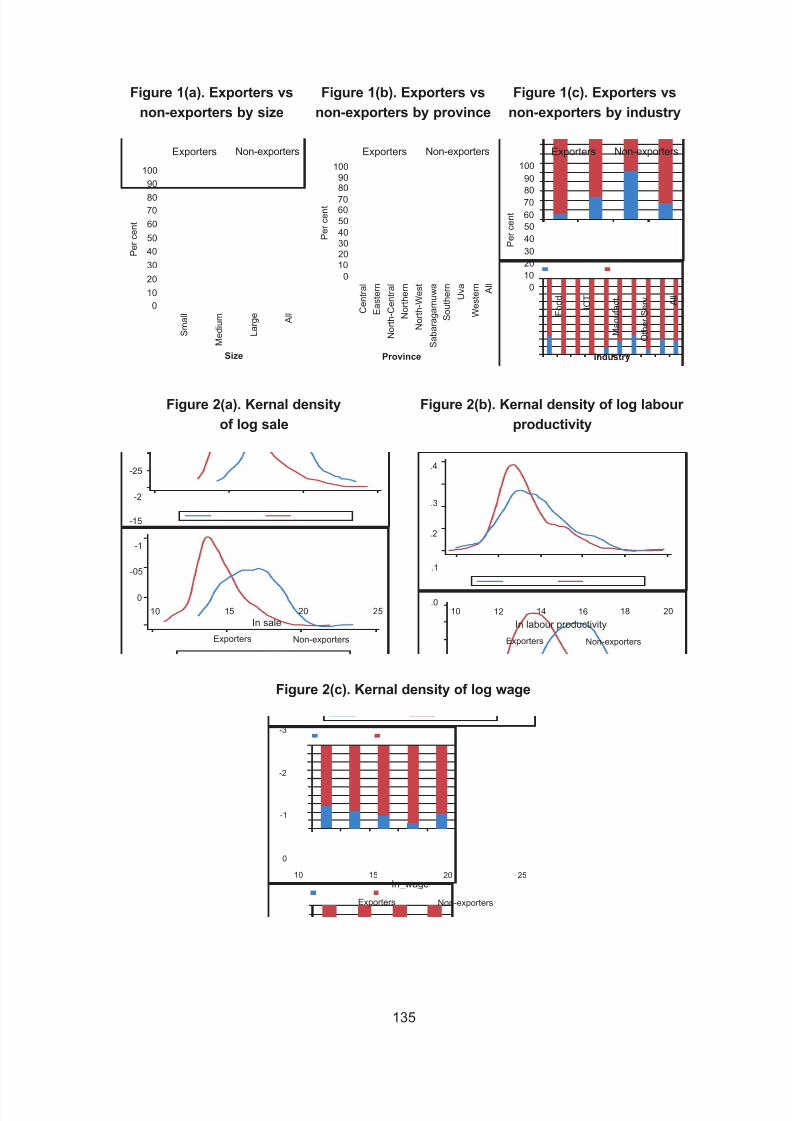
8/11/2019 Trade performance and competitiveness: Selected issues relevant for Asian developing economies
http://slidepdf.com/reader/full/trade-performance-and-competitiveness-selected-issues-relevant-for-asian-developing 155/215
135
In_wage
-3
-2
-1
0
10 15 20 25
Exporters Non-exporters
Exporters Non-exporters
100
90
80
70
60
50
40
30
20
10
0
P e r c e n t
S m a l l
M e d i u m
L a r g e
A l l
Size Province Industry
C e n t r a l
E a s t e r n
N o r t h - C e n t r a l
N o r t h e r n
N o r t h - W e s t
S a b a r a g a m u w a
S o u t h e r n
U v a
W e s t e r n A
l l
F o o d
I C T
M a n u f a c t .
O t h e r S e r v .
A l l
100
9080
7060
50
40
3020
10
0
P e r c e n t
100
9080
70
60
50
40
30
20
10
0
P e r c e n t
Exporters Non-exporters Exporters Non-exporters
Figure 1(a). Exporters vs
non-exporters by size
Figure 1(c). Exporters vs
non-exporters by industry
Figure 1(b). Exporters vs
non-exporters by province
Figure 2(a). Kernal density
of log sale
Figure 2(b). Kernal density of log labour
productivity
Figure 2(c). Kernal density of log wage
Exporters Non-exporters
10 15 20 25
-25
-2
-15
-1
-05
0
In sale
.4
.3
.2
.1
.010 12 14 16 18 20
In labour productivity
Exporters Non-exporters

8/11/2019 Trade performance and competitiveness: Selected issues relevant for Asian developing economies
http://slidepdf.com/reader/full/trade-performance-and-competitiveness-selected-issues-relevant-for-asian-developing 156/215
136
2. Characteristics of exporting firms
Exporting firms constitute only 10.65 per cent of the sample, indicating that only
a small proportion of firms in Sri Lanka are exporters. Of the exporters, 40 per cent are
large firms, 44 per cent are medium and 16 per cent are small firms (table 1) and the
proportion of export firms in total firms of large, medium and small firms export are 30 per
cent, 14 per cent and 3 per cent respectively. Table 2 provides details of firm heterogeneity
by industry. Of the exporting firms, 36 per cent are in manufacturing, 34 per cent are in
food, 24 per cent are in information communication technology (ICT) related industries and
7 per cent are in other service industries.
Table 1. Heterogeneity of firms by size
Size Number of Share of Number of Export Share of
Firms Firms Export propensity Export Firms
Firms (Share of out of Total
Export Firms Export Firms
out of Total
Firms)
Large 119 14.23 36 30.25 40.45
Medium 278 33.25 39 14.03 43.82
Small 439 52.51 14 3.19 15.73
Total 836 100.00 89 10.65 100.00
Small > = 5 and < = 19 workers; Medium > = 20 and < = 99; Large > = 100 workers
Table 2. Heterogeneity of firms by industry
Industry Number of Share of Number of Export Share of
Firms Firms Export propensity Export Firms
Firms (Share of out of Total
Export Firms Export Firms
out of Total
Firms)
Food 121 14.47 30 24.79 33.71
Health 124 14.83 0
ICT 120 14.35 21 17.50 23.60
Manufacturing 231 27.63 32 13.85 35.96
Other services 116 13.88 6 5.17 6.74
Tourism 124 14.83 0
Total 836 100.00 89 10.65 100.00
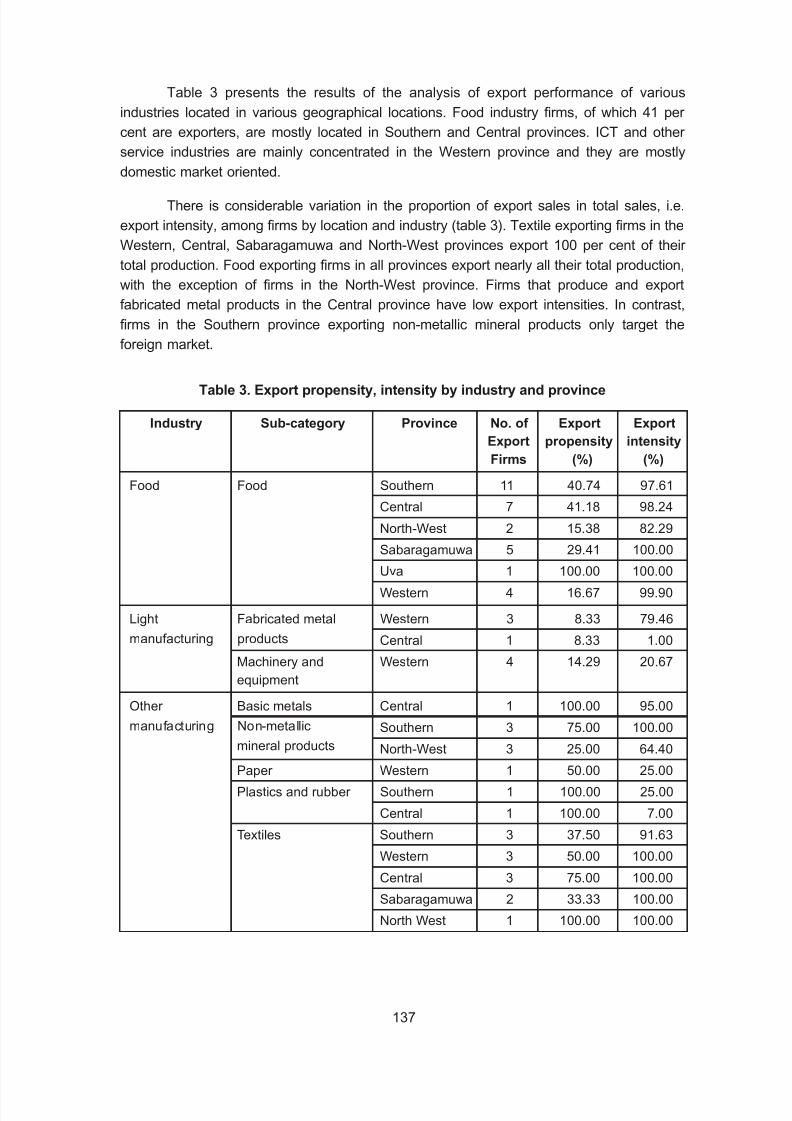
8/11/2019 Trade performance and competitiveness: Selected issues relevant for Asian developing economies
http://slidepdf.com/reader/full/trade-performance-and-competitiveness-selected-issues-relevant-for-asian-developing 157/215
137
Table 3 presents the results of the analysis of export performance of various
industries located in various geographical locations. Food industry firms, of which 41 per
cent are exporters, are mostly located in Southern and Central provinces. ICT and other
service industries are mainly concentrated in the Western province and they are mostly
domestic market oriented.
There is considerable variation in the proportion of export sales in total sales, i.e.
export intensity, among firms by location and industry (table 3). Textile exporting firms in the
Western, Central, Sabaragamuwa and North-West provinces export 100 per cent of their
total production. Food exporting firms in all provinces export nearly all their total production,
with the exception of firms in the North-West province. Firms that produce and export
fabricated metal products in the Central province have low export intensities. In contrast,
firms in the Southern province exporting non-metallic mineral products only target the
foreign market.
Table 3. Export propensity, intensity by industry and province
Industry Sub-category Province No. of Export Export
Export propensity intensity
Firms (%) (%)
Food Food Southern 11 40.74 97.61
Central 7 41.18 98.24
North-West 2 15.38 82.29Sabaragamuwa 5 29.41 100.00
Uva 1 100.00 100.00
Western 4 16.67 99.90
Light Fabricated metal Western 3 8.33 79.46
manufacturing products Central 1 8.33 1.00
Machinery and Western 4 14.29 20.67
equipment
Other Basic metals Central 1 100.00 95.00manufacturing Non-metallic Southern 3 75.00 100.00
mineral products North-West 3 25.00 64.40
Paper Western 1 50.00 25.00
Plastics and rubber Southern 1 100.00 25.00
Central 1 100.00 7.00
Textiles Southern 3 37.50 91.63
Western 3 50.00 100.00
Central 3 75.00 100.00
Sabaragamuwa 2 33.33 100.00
North West 1 100.00 100.00

8/11/2019 Trade performance and competitiveness: Selected issues relevant for Asian developing economies
http://slidepdf.com/reader/full/trade-performance-and-competitiveness-selected-issues-relevant-for-asian-developing 158/215
138
Export ConcentrationPer cent of exports
100
90
80
70
60
50
40
30
20
10
0
0 10 20 30 40 50 60 70 80 90 100
Per cent of Firms
Ranked by total sales Ranked by export sales
The data on export performance by ownership and size class revealed that of 43
firms with some foreign ownership, 10 are exporters and they account for 27 per cent of
total exports. Interestingly, the top 10 per cent of the exporters are responsible for more
than 80 per cent of aggregate exports. In other words, a few firms – “superstar exporters” –
are responsible for the bulk of exports.
The concentration of exports across export oriented firms is shown in Figure 3 usingLorenz curves. The figure depicts that the contribution by small firms to the total export
value is insignificant. The two curves, i.e. total sales and total exports almost coincide,
indicating the strong correlation of exports and overall size of the firms.
Tobacco Sabaragamuwa 1 33.33 80.00
Wood Western 1 33.33 25.00
ICT IT Western 15 21.43 33.41
Electronics Western 6 16.22 10.60
Other services Wholesale Western 1 20.00 79.00
Retail Western 1 11.11 25.00
Central 1 12.50 100.00
Transport Western 2 66.67 91.67
Construction Western 1 50.00 10.00
Table 3. (continued)
Industry Sub-category Province No. of Export Export
Export propensity intensity
Firms (%) (%)
Figure 3. Export concentration by value of exports and total sales
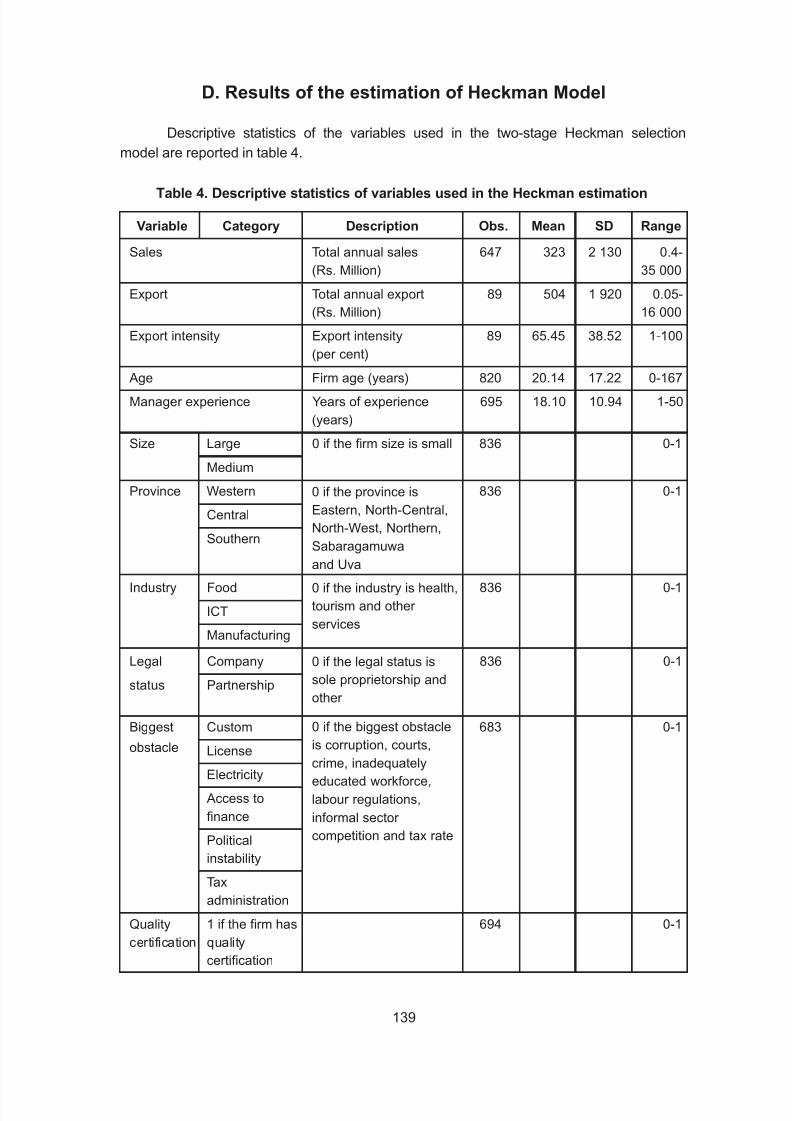
8/11/2019 Trade performance and competitiveness: Selected issues relevant for Asian developing economies
http://slidepdf.com/reader/full/trade-performance-and-competitiveness-selected-issues-relevant-for-asian-developing 159/215
139
D. Results of the estimation of Heckman Model
Descriptive statistics of the variables used in the two-stage Heckman selection
model are reported in table 4.
Table 4. Descriptive statistics of variables used in the Heckman estimation
Variable Category Description Obs. Mean SD Range
Sales Total annual sales 647 323 2 130 0.4-
(Rs. Million) 35 000
Export Total annual export 89 504 1 920 0.05-
(Rs. Million) 16 000
Export intensity Export intensity 89 65.45 38.52 1-100
(per cent) Age Firm age (years) 820 20.14 17.22 0-167
Manager experience Years of experience 695 18.10 10.94 1-50
(years)
Size Large 0 if the firm size is small 836 0-1
Medium
Province Western 836 0-1
Central
Southern
Industry Food 836 0-1
ICT
Manufacturing
Legal Company 836 0-1
status Partnership
Biggest Custom 683 0-1
obstacle License
Electricity
Access to
finance
Political
instability
Tax
administration
Quality 1 if the firm has 694 0-1
certification quality
certification
0 if the province is
Eastern, North-Central,
North-West, Northern,Sabaragamuwa
and Uva
0 if the industry is health,
tourism and other
services
0 if the legal status is
sole proprietorship and
other
0 if the biggest obstacle
is corruption, courts,
crime, inadequately
educated workforce,
labour regulations,
informal sector
competition and tax rate

8/11/2019 Trade performance and competitiveness: Selected issues relevant for Asian developing economies
http://slidepdf.com/reader/full/trade-performance-and-competitiveness-selected-issues-relevant-for-asian-developing 160/215
140
The estimation results are summarized in table 5. As indicated earlier, two sets of
models are estimated with different specifications for the dependent variable in the
outcome equation, while the selection equation is the same in both models. The same set
of independent variables is used in both selection and outcome equations in the two
models.
In general, the results of the estimation of the first stage of the Heckman Model
(selection model) indicate that (a) large and medium firms (in terms of total sales and
number of workers) have a higher export propensity, (b) food, manufacturing and ICT
industries have a higher tendency to become exporters, (c) firms in Southern and Central
provinces predominate in exporting, (d) the legal status as a company and partnership are
associated with the decision to export, and (e) the young firms have a higher likelihood of
being exporters (i.e. new firms tend to be more likely to export than older firms).
The estimation results of the second stage of the Heckman Model indicate that thevalue of exports is significantly influenced by the size of the firm, as measured by sales and
type of the industry. Furthermore, results show that a 1 per cent increase in total sales is
associated with more than 0.75 per cent increase in exports. According to model 1, the
value of exports of firms which possess an internationally recognized quality certification
are higher.
Managers’ perceptions of the external business environment, such as their views
about the degree of political instability, difficulty in obtaining business licences and permits
etc., have significant negative effects on the value of exports and export intensity. However,the results indicate such perceptions do not have a statistically significant effect on export
market participation.
There is no statistically significant difference on export participation between the
firms that perceived access to finance as a major obstacle and the other firms. However, it
is very interesting that those firms who decided to engage in exporting despite seeing
access to finance as a barrier, demonstrated better performance, in terms of both value and
intensity of exports. This may be due to such firms being more proactive in searching for
and capitalizing upon export growth opportunities that would eventually ease their financing
constraints, however we cannot investigate this issue further with the available data.
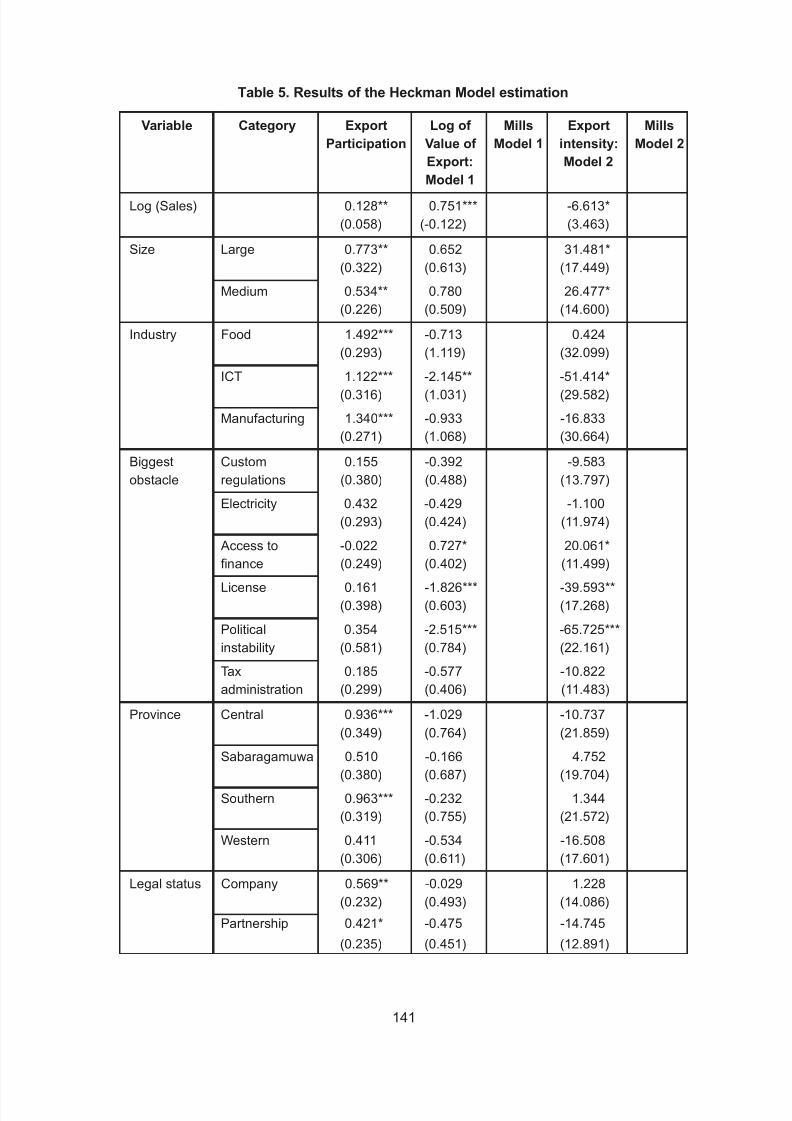
8/11/2019 Trade performance and competitiveness: Selected issues relevant for Asian developing economies
http://slidepdf.com/reader/full/trade-performance-and-competitiveness-selected-issues-relevant-for-asian-developing 161/215
141
Table 5. Results of the Heckman Model estimation
Variable Category Export Log of Mills Export Mills
Participation Value of Model 1 intensity: Model 2
Export: Model 2
Model 1
Log (Sales) 0.128** 0.751*** -6.613*
(0.058) (-0.122) (3.463)
Size Large 0.773** 0.652 31.481*
(0.322) (0.613) (17.449)
Medium 0.534** 0.780 26.477*
(0.226) (0.509) (14.600)
Industry Food 1.492*** -0.713 0.424
(0.293) (1.119) (32.099)ICT 1.122*** -2.145** -51.414*
(0.316) (1.031) (29.582)
Manufacturing 1.340*** -0.933 -16.833
(0.271) (1.068) (30.664)
Biggest Custom 0.155 -0.392 -9.583
obstacle regulations (0.380) (0.488) (13.797)
Electricity 0.432 -0.429 -1.100
(0.293) (0.424) (11.974)
Access to -0.022 0.727* 20.061*
finance (0.249) (0.402) (11.499)
License 0.161 -1.826*** -39.593**
(0.398) (0.603) (17.268)
Political 0.354 -2.515*** -65.725***
instability (0.581) (0.784) (22.161)
Tax 0.185 -0.577 -10.822
administration (0.299) (0.406) (11.483)
Province Central 0.936*** -1.029 -10.737(0.349) (0.764) (21.859)
Sabaragamuwa 0.510 -0.166 4.752
(0.380) (0.687) (19.704)
Southern 0.963*** -0.232 1.344
(0.319) (0.755) (21.572)
Western 0.411 -0.534 -16.508
(0.306) (0.611) (17.601)
Legal status Company 0.569** -0.029 1.228(0.232) (0.493) (14.086)
Partnership 0.421* -0.475 -14.745
(0.235) (0.451) (12.891)
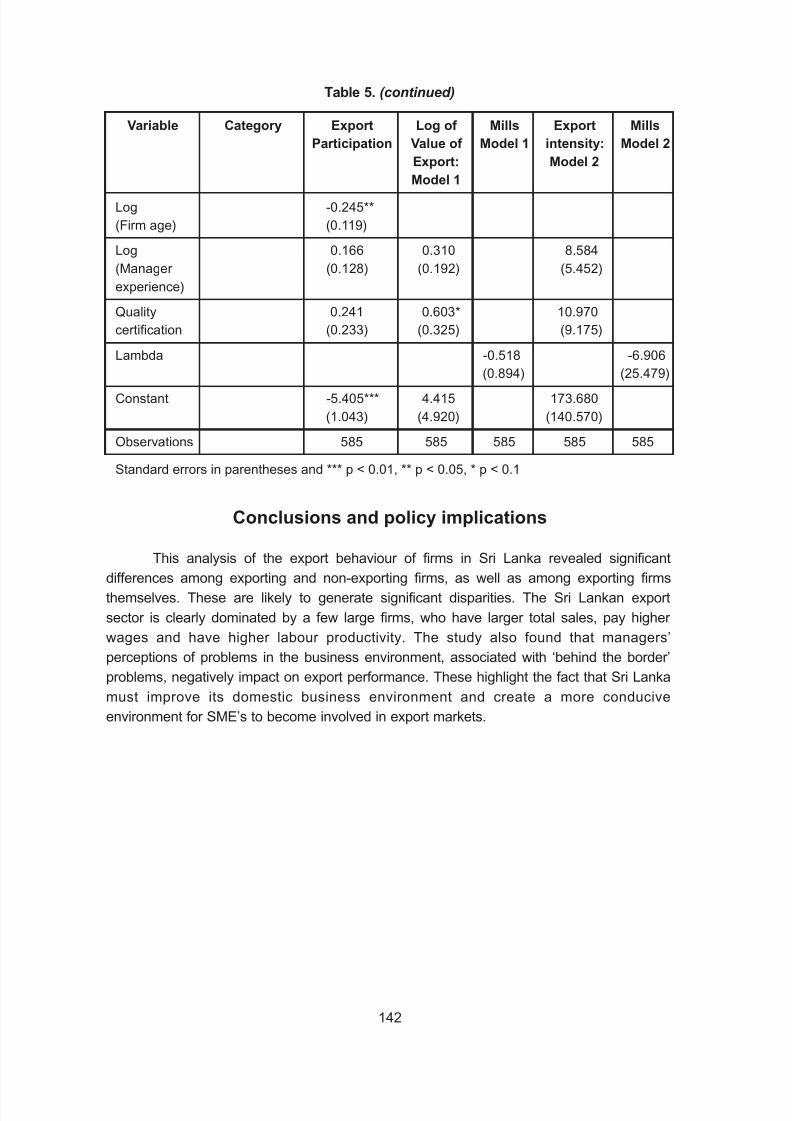
8/11/2019 Trade performance and competitiveness: Selected issues relevant for Asian developing economies
http://slidepdf.com/reader/full/trade-performance-and-competitiveness-selected-issues-relevant-for-asian-developing 162/215
142
Conclusions and policy implications
This analysis of the export behaviour of firms in Sri Lanka revealed significant
differences among exporting and non-exporting firms, as well as among exporting firms
themselves. These are likely to generate significant disparities. The Sri Lankan export
sector is clearly dominated by a few large firms, who have larger total sales, pay higher
wages and have higher labour productivity. The study also found that managers’
perceptions of problems in the business environment, associated with ‘behind the border’
problems, negatively impact on export performance. These highlight the fact that Sri Lanka
must improve its domestic business environment and create a more conducive
environment for SME’s to become involved in export markets.
Log -0.245**
(Firm age) (0.119)
Log 0.166 0.310 8.584
(Manager (0.128) (0.192) (5.452)
experience)
Quality 0.241 0.603* 10.970
certification (0.233) (0.325) (9.175)
Lambda -0.518 -6.906(0.894) (25.479)
Constant -5.405*** 4.415 173.680
(1.043) (4.920) (140.570)
Observations 585 585 585 585 585
Standard errors in parentheses and *** p < 0.01, ** p < 0.05, * p < 0.1
Table 5. (continued)
Variable Category Export Log of Mills Export Mills
Participation Value of Model 1 intensity: Model 2
Export: Model 2
Model 1

8/11/2019 Trade performance and competitiveness: Selected issues relevant for Asian developing economies
http://slidepdf.com/reader/full/trade-performance-and-competitiveness-selected-issues-relevant-for-asian-developing 163/215
143
References
Athukorala, P., S. Jayasuriya and E. Oczkowsk (1995). Multinational Firms and Export
Performance in Developing Countries: Some Analytical Issues and New Empirical
Evidence. The Journal of Development Economics. 46: 109-122. Athukorala, P., and S. Jayasuriya (1988). Parentage and Factor Proportions: A Comparative
Study of Third-World Multi Nationals in Sri Lankan Manufacturing, Oxford Bulletin of
Economics and Statistics, Vol. 50, No. 4, November 1988: 409-423.
Aw, B.Y., S. Chung, and M.J. Roberts (1999). Productivity and Turnover in the Export
Market: Micro-level Evidence from the Republic of Korea and Taiwan (China), The
World Bank Economic Review , Vol. 14 No. 1; pp. 65-90.
Aaby, N.E., and S.F. Slater (1989). Management Influences on Export Performance: A
Review of the Empirical Literature 1978-88, International Marketing Review , Vol. 6No. 4; pp. 7-26.
Barney, J., (1991). Firm Resources and Sustained Competitive Advantage, Journal of
Management. Vol. 17; pp. 99-120.
Bilkey, W.J., (1978). An Attempted Integration of the Literature on the Export Behavior of
Firms, Journal of International Business Studies, Vol. 9, Spring/Summer; pp. 33-46.
Cavusgil, S.T. S., and Zou. (1994). Marketing Strategy-Performance Relationship: An
Investigation of the Empirical Link in Export Market Ventures, Journal of Marketing ,
Vol. 58; pp. 1-21.
Chetty, S.K., and R.T. Hamilton (1993). Firm-level Determinants of Export Performance:
A Meta-analysis, International Marketing Review , Vol. 10 No. 3; pp. 26-34.
Collis, D.J., (1991). A Resource-based Analysis of Global Competition: The Case of the
Bearings. Industry, Strategic Management Journal , Vol. 12; pp. 49-68.
Daft, R., (1983). Organization Theory and Design, West Publishing, New York.
Estrin, S., K.E. Meyer, M. Wright, and F. Foliano, F. (2008). Export Propensity and Intensity
of Subsidiaries in Emerging Economies, International Business Review , Vol. 17;
pp. 574-586.
Grossman G., and E. Helpman (1991). Innovation and Growth in the Global Economy, MIT
Press, Cambridge MA.
Madsen, T.K., (1987). Empirical Export Performance Studies: A Review of
Conceptualizations and Findings, in Cavusgil, S.T. and Axinn, C. (Eds.), Advances
in International Marketing, JAI Press, Greenwich, CT, Vol. 2; pp. 177-98.
Melitz, M., (2003). The Impact of Trade in Intra-industry Reallocations and Aggregate
Industry Productivity. Econometrica 71(6), 1695-1725.
Peng, M.W., and A.S. York (2001). Behind Intermediary Performance in Export Trade:
Transactions, Agents, and Resources, Journal of International Business Studies,
Vol. 32, No. 2; pp. 327-346.
8/11/2019 Trade performance and competitiveness: Selected issues relevant for Asian developing economies
http://slidepdf.com/reader/full/trade-performance-and-competitiveness-selected-issues-relevant-for-asian-developing 164/215
144
Pöschl, J., R. Stehrer and R. Stöllinge (2009). Characteristics of Exporting and Non-
exporting Firms in Austria, FIW Research Reports 2009/10.
Salomon, R., and J.M. Shaver (2005). Export and Domestic Sales: Their Interrelationship
and Determinants. Strategic Management Journal , Vol. 26; pp. 855-871.
Scherer, F.M., and D. Ross (1990). Industrial Market Structure and Economic Performance,
Rand McNally, Chicago, IL.
Shoham, A., (1996). Marketing-mix Standardization: Determinants of Export Performance,
Journal of Global Marketing , Vol. 10 No. 2; pp.3-73.
Wernerfelt, B., (1984). A Resource-based View of the Firm, Strategic Management Journal ,
Vol. 5, No. 2; pp. 171-80.
World Bank (1993). The East Asian Miracle: Economic Growth and Public Policy, Oxford:
Oxford University Press for the World Bank.
Yoshino, Y., (2008). Domestic Constraints, Firm Characteristics and Geographical
Diversification of Firm-Level Manufacturing Exports in Africa. Policy Research
Working Paper 4575, World Bank.
Zou, S., and Stan, S. (1998). The Determinants of Export Performance: A Review of the
Empirical Literature between 1987 and 1997. International Marketing Review ,
Vol. 15, No. 5; pp. 333-356.

8/11/2019 Trade performance and competitiveness: Selected issues relevant for Asian developing economies
http://slidepdf.com/reader/full/trade-performance-and-competitiveness-selected-issues-relevant-for-asian-developing 165/215
145
Appendix 1
Method of sampling used in the enterprise survey
The sample for Sri Lanka is selected using stratified random sampling. Three
levels of stratification are used in this country: industry, establishment size, and region.
Industry stratification is designed as follows. The universe is stratified into 2
manufacturing industries, 1 services industry (retail), and 2 residual sectors as defined in
the sampling manual. Each manufacturing industry had a target of 120 interviews. The
services industry and the 2 residual sectors had a target of 120 interviews.
Size stratification is defined following the standardized definition for the rollout;
small (5 to 19 employees), medium (20 to 99 employees), and large (more than 99
employees). For stratification purposes, the number of employees is defined on thebasis of reported permanent full-time workers. This seems to be an appropriate
definition of the labour force since seasonal/casual/part-time employment is not
a common practice, except in the sectors of construction and agriculture.
Regional stratification is defined in nine regions: Eastern, Western, Southern,
Central, Northern, North-Central, North-West, Uva, Sabaragamuwa.
One frame is used for the Enterprise Survey in Sri Lanka. The sample frame
containing fresh contacts used in the Sri Lanka is obtained from the Department of
Census and Statistics of Sri Lanka (DCS) 2003.
The enumerated establishments are then used as the frame for the selection of
a sample with the aim of obtaining interviews at 600 establishments with five or more
employees.
The quality of the frame is assessed at the onset of the project through calls to
a random subset of firms and local contractor knowledge. The sample frame is not
immune from the typical problems found in establishment surveys: positive rates of
non-eligibility, repetition, non-existent units, etc. Due to response rate and ineligibilityissues, additional sample had to be extracted by DCS and the World Bank in order to
obtain enough eligible contacts and meet the sample targets.
Given the impact that non-eligible units included in the sample universe may
have on the results, adjustments may be needed when computing the appropriate
weights for individual observations. The percentage of confirmed non-eligible units as
a proportion of the total number of sampled establishments contacted for the survey is
50 per cent (900 out of 1806 establishments).
Source: World Bank

8/11/2019 Trade performance and competitiveness: Selected issues relevant for Asian developing economies
http://slidepdf.com/reader/full/trade-performance-and-competitiveness-selected-issues-relevant-for-asian-developing 166/215
8/11/2019 Trade performance and competitiveness: Selected issues relevant for Asian developing economies
http://slidepdf.com/reader/full/trade-performance-and-competitiveness-selected-issues-relevant-for-asian-developing 167/215
147
IV. Evaluation of business association membershipon small and medium enterprises’ growth performance:
Evidence from enterprise survey of Cambodia
By Vathana Roth
Introduction
There is growing attention on small and medium enterprises (SMEs) within
academic circles and policy discussions. It is widely argued that SMEs play a vital role in
enhancing economic growth and competitiveness, helping to reduce poverty in both
developing and industrialized economies. The effects are particularly profound indeveloping countries, where SMEs contribute a large portion of domestic production and
employment (Ayyagari et al., 2011).
However, SMEs face a number of constraints to growth. This has to do with their
small size, relatively low bargaining power, difficulty obtaining investment loans,
vulnerability to idiosyncratic risks (resultant of vertical and horizontal competing forces),
high costs of administrative compliance and weak legal enforcement (e.g. Sukiassyan and
Nugent, 2008; Beck et al., 2008; Stephanou and Rodriguez, 2008; Aterido et al., 2009). To
cope with these problems, SMEs need specific direct and indirect assistance to improvesurvival rate by becoming more competitive. Under a SME-tailored policy, there are support
programmes, including training, advice, subsidies, for SME owner-managers to take
advantage of (Wren & Storey, 2002; Batra and Mahmood, 2003; Bennett, 2008; Zecchini
and Ventura, 2009; Han and Benson, 2010; Czarnitzki and Hottenrott, 2011; World Bank,
2010; Chheang et al., 2011). Along with programmes designed to fit the needs of individual
SMEs, there are more concentrated and associative programmes to address common
constraints. This has been implemented to mobilise collective efforts and pooled resources.
Examples of associative networks include business and trade associations, professional
and employer associations, federations, networks and clusters.
There are a number of associative organisations, which vary greatly in dynamism
and diversity. Spanning regional, national, local and sectoral levels, the enterprise
networks’ work is through advocacy and representation of members’ interests to external
parties. The aim is to help members be more competitive and be involved in overall
business activities. There is substantial literature that argues that business associations
(BAs) provide more benefits to SMEs rather than to large firms. A larger firm’s economy of
scale and scope enables them to overcome size constraints and stay competitive even
without assistance (Bennett, 1998; Bennett and Ramsden, 2007; Perry, 2007).However,
there are theoretical and empirical challenges to this claim.
8/11/2019 Trade performance and competitiveness: Selected issues relevant for Asian developing economies
http://slidepdf.com/reader/full/trade-performance-and-competitiveness-selected-issues-relevant-for-asian-developing 168/215
148
In Cambodia, SMEs have contributed significantly to overall macroeconomic
growth, job creation, and, to a lesser extent, innovation and technology adoption. The
policy agenda and support programmes are similar to those commonly observed in other
economies. SMEs, particularly manufacturing establishments, are important to economic
growth and business competitiveness. Cambodian manufacturing SMEs have graduallygrown in number, with 33,195 manufacturing establishments in 2007, making up 98.3 per
cent of total number of SMEs. Large enterprises (LEs) account for just 1.7 per cent (NIS
2008). Preliminary results of the 2011 economic census reports that MSMEs account for
502,372 (99.9 per cent) of the total 503,008 establishments across the country. Most of
these firms are concentrated in Phnom Penh and in major economically active provinces,
such as Kampong Cham, Siem Reap, Battambang, Kandal and Takeo (NIS, 2011).
The number of SMEs has risen at an annual rate of about 3.5 per cent since 1998,
reaching 32,619 establishments in 2007 (NIS, 2008). Of the total establishments in 2007,
SMEs involved in food, beverages and tobacco made up the largest proportion (80.9 per
cent). This is followed by those dealing in fabricated metal products and textiles (8.8 per
cent), wearing apparel and leather goods (4.5 per cent). In the same year, the number of
SME employees increased by 9.0 per cent compared to a year earlier, from 87,072 workers
to 94,835. This represents an 18.9 per cent share of total employment (NIS, 2008). The
total volume of production generated by SMEs also constantly climbed at an annual growth
rate of 30.2 per cent between 1998 and 2007, reaching $636.2 million in 2007. Food,
beverages, and tobacco continued to comprise the biggest proportion of total generated
value (NIS, 2008).
Cambodian SMEs, however, are still in initial stages of development. This is despite
the completion of the first five-year SME Development Framework (2005-2010). Initiatives
in the previous plan were designed to address issues and challenges SMEs face. However,
rigorous implementation was lacking and unsatisfactory, and progress was slow.
Additionally, Cambodia lacks systematically study and evaluation on whether the proposed
SME policies, and other related interventions, are having positive impacts on SMEs’
operation and competitiveness.
There are a number of public sponsored or privately financed Business Associations (BAs), as well as growing effort from both government and development
partners to enhance inter-firm collaboration. But there are no systematic studies on whether
this has, or will have, positive impact on participating firms. Therefore, this study aims to
examine the potential impacts that SME membership in BAs or CoC would have on a firm’s
medium and long-term outcomes. The study contributes to the limited, but growing, body of
literature67 on SME development in Cambodia. It also serves stakeholders decision-making
by utilising evidence-based impact evaluation.
67 Some of the qualitative and quantitative studies on Cambodian SMEs are: Harner, 2003; Meas, 2006;
Baily, 2007; Shariff and Chea, 2008; Harvie et al., 2010; Chheang et al., 2011.

8/11/2019 Trade performance and competitiveness: Selected issues relevant for Asian developing economies
http://slidepdf.com/reader/full/trade-performance-and-competitiveness-selected-issues-relevant-for-asian-developing 169/215
149
The rest of the paper is organised as follows. Section 2 reviews and discusses
academic studies on the roles of BAs and the benefits they might provide to participating
firms. It also highlights theoretical and analytical bases for empirical analysis. Section 3
specifies econometric models and variables measurement to estimate ATE of BA
membership on intermediate outcomes and long-term growth performance of SMEs andfirms in general. Section 4 provides data source and a brief descriptive analysis. Section 5
discusses main findings and highlights sensitivity analysis. Section 6 outlines study’s
limitations, and Section 7 concludes the paper and recommends areas for further research.
A. Literature review and theoretical aspects
Moore and Hamalai (1993) defines BAs as a collection of formal membership
organizations of individual business people or firms. Managerial modalities of BAs are
diverse and encompass a huge variation of strategic services and activities. BAs can be bigor small; local, provincial, national, regional or global. They can encompass all firms or just
be sector-specific; publicly or privately owned; independent, government-sponsored; have
voluntary or obligatory memberships; are of discriminatory membership or are open to all
establishments. BAs can offer professional services tailored to the needs of individual
members, which demand more investment in human resources, or provide more services
for collective purposes, which may give room for members to free-ride (e.g., Moore and
Hamalai, 1993).
Potential services of BAs include (but are not limited to) dissemination of marketinformation, government lobby, information on import and export markets, access to
finance, updates on laws and regulations, collective procurement and sales. Services could
also include experience sharing in management practices, production methods, financial
reporting, and short-term vocational and technical training. The majority of associations
undertake advocacy work. The availability of various services to members is as significant
as the effectiveness of service delivery. This is due to members having higher demands on
services deemed more essential.
Two theoretical perspectives can be used to examine and explain the applicability of
BAs or other kinds of collective bodies. Its existence is believed to either contribute to
members’ growth performance or jeopardise socially optimal benefits. These two theory are
pluralism and the public choice (see, for example, Becker, 1985; Moore and Hamalai, 1993;
Goldsmith, 2000: 40-41). The pluralist theory of interest groups gives importance to BAs,
and other formally organized groups, where members can collectively increase political and
economic bargaining power and influence public policy to improve the overall business
environment. Public choice theorists see such associations as counter-productive and
discriminatory due to their rent-seeking behaviour which benefits special interest groups at
the expense of the majority.
The pluralists argue that in order to create a business climate conducive to firms’
growth, government-private sector collaboration is inevitable. This is to reduce transaction
costs of acquiring information on updates and progress of public policies, as well as to

8/11/2019 Trade performance and competitiveness: Selected issues relevant for Asian developing economies
http://slidepdf.com/reader/full/trade-performance-and-competitiveness-selected-issues-relevant-for-asian-developing 170/215
150
ensure a more symmetric flow of information on rules and regulations. Furthermore,
pluralists point to the inability and ineffectiveness of individual firms in influencing
government policy. This claim is much more relevant to micro firms and those SMEs whose
small size may not give them sufficient voice when they are acting alone. According to
pluralists, another benefit of BAs or associative organizations is the expansion and depth of social capital that can be achieved through inter-firm collaboration and networks.
On the other hand, public choice theorists criticize special interest groups and
lobbyists, citing their rent-seeking behaviour as having potential to generate socially-not-
optimal results. Organized special interest groups can benefit from additional economic
rents68 resulting from policy lobby to favour their specific agendas. Thus, in the view of
public choice theorists, BAs and other collective organizations obstruct fair and just
business competition. They say that the representative role of BAs draws government to
fulfil certain business needs, which are more likely to favour members than society at large.
The rent-seeking behaviour may also leave room for bribery and corruption.
In this respect, cautious must be observed when allowing the establishment of
associations or special interest groups. However, the enormous number of BAs and other
associative organizations – labour unions, industrial clusters, and federations – in both
developing and developed economies supports the pluralists’ claim that such organizations
tend to provide more advantages to members than disadvantages. Even if BAs might
generate negative effects under specific circumstances, the impact on overall business
activity might not be completely socially disruptive. Also, BAs members have a wide variety
of strategic services and activities at their disposal, not just policy lobbying.
Empirically, the benefits of BA membership have been well documented.
Considerable literature argues that intended services of BAs are necessary to help member
firms resolve collective or individual problems (Levitsky, 1992; Bennett, 1995, 1998; Nadvi,
1999; Doner and Schneider, 2000, 1999; Luna and Tirado, 2008; Goldsmith, 2000). Political
and economic benefits of BAs have also been documented in the United States, where BAs
are comparatively small, unorganized and fragmented (McCormick et al ., 2008). Benefits of
BAs are even more profound for the smallest firms and SMEs (Wilts and Meyer, 2005).
Levitsky (1992) proposes that the roles of BAs should be enhanced in developing
countries. More so, government, private sector and international organizations should
provide further assistance for BAs. Doner and Schneider (1999) argues that, rather than
impeding market competition and economic growth resulting from collective bargaining
power, BAs could provide a wide range of services. This could be from lowering information
and transaction costs to upgrading skills and technology of member firms. The collective
actions of BAs can be more beneficial for SMEs than for large firms, who can exploit
economies of scale (Wilts and Meyer, 2005; Bennett, 1998).
68 Goldsmith (2000) defined economic rents as “policy-induced gains that would not exist in a competitive
market.”

8/11/2019 Trade performance and competitiveness: Selected issues relevant for Asian developing economies
http://slidepdf.com/reader/full/trade-performance-and-competitiveness-selected-issues-relevant-for-asian-developing 171/215
151
However, there is continuing debate about BAs in terms of service quality, size,
efficacy and effectiveness, institutional arrangements, forms of and motives for membership
(Bennett and Ramsden 2007). The theory of associative organizations has differentiated
two forces that have the potential to drive association membership – “the logic of collective
influence” and “the logic of services” (Olson, 1965; Bennett, 1998, 2000; Perry, 2007). Theformer stresses collective activity in favour of all, or the majority of, members with third
parties (such as government agencies) that can impact on members’ interests. The latter
emphasises service provision to meet specific needs where a BA’s secretariat responds to
members’ requests and enquiries. This allows the BA to assist members in raising and
enhancing competitiveness in “niche” markets in which members specialise (Bennett,
1998).
The distinctive features of institutional arrangement of BAs are resources, size,
effectiveness, service coverage, quality, membership and membership fees. These
differences have implications on the scope and coverage of BAs’ services, social, political
and economic powers and resources. Levitsky (1992) claims that publicly financed and
centralised institutions (staffed and managed by “government appointees”) are less
effective in providing intended services and training to SMEs. He points out that these
institutions often lack human resource capacity and require budgetary resources to properly
fulfil their mandates. He proposes that in developing countries, attention and examination
should be given to those private sector organizations that can more effectively address the
needs of SMEs.
Membership in most CoCs or BAs are often voluntary, however this varies acrosscountries. Germany, France, Austria, the Netherlands and Italy, for instance, require
businesses to register with the CoC (Bennett 1995). In Germany, the Chamber of Industry
and Commerce and the Chamber of Crafts represent business operators in specific local
areas, providing a wide range of services from technical services to government lobbying
(Germany Trade and Invest, 2012: 34). These associative organizations are supported by
public law status and are publicly financed. Japan uses a mixed structure of voluntary and
compulsory membership. However, given strong social ties and pressure, almost all SMEs
(95 per cent) are members of associations (Levitsky, 1992). Most associative organizations
in the US and UK are privately operated with voluntary memberships. Voluntary or statutorymembership could have implications for BAs’ service provision and financing sources.
Bennett (1995) shows that, given voluntary membership, the UK CoC tends to provide
specific services demanded by members, rather than collective services that other
members might use. The logic of services is more relevant when membership in BAs is
voluntary. This is to guard against free-riding among both members and non-members.
However, BAs might face financial constraints as a result of this voluntary membership, as
they mainly rely on membership fees.
It is clear that the issues facing the existence and operation of BAs are multifaceted.These issues need to be continually addressed to create a business environment that is
more inclusive and fostering fair competitive opportunities for all. As an initial step, this
study will attempt to quantify the benefits of private BA membership on firms’ outcome

8/11/2019 Trade performance and competitiveness: Selected issues relevant for Asian developing economies
http://slidepdf.com/reader/full/trade-performance-and-competitiveness-selected-issues-relevant-for-asian-developing 172/215
152
indicators in the Cambodian context. The institutional and financial arrangements of BAs
are to be left for subsequent studies.
B. Econometric specifications and variables measurement
1. Econometric specifications
This study adopts a non-experimental approach, using a variety of econometric
methods to measure average treatment effects of membership in BAs or CoCs on
a number of firms’ intermediate and long-term outcomes. This includes propensity score
matching (PSM) and PSM with ordinary least squares (OLS) regression. The purpose of
using different, but interrelated, approaches to estimation is in order to address
inconsistency and bias of coefficients. These might arise from the use of non-experimental
data and self-selection or programme placement attributes. It is also necessary todistinguish between before-and-after study and with-or-without enquiry. This study uses the
latter.
Propensity score matching has been for the last decade commonly used to estimate
the impacts of policy and programme interventions (see, for example, Rosenbaum and
Rubin, 1983; Motohashi, 2002; Aert and Czarnitzki, 2004; Criscuolo et al., 2007; Caliendo
and Kopeining, 2008; Mole et al., 2008). Consider the outcome equation below:
y i
= β o
+
Σπ
k
X ik
+ γ BAM i
+ ε i
(1)
i = 1, 2, 3, ...., n; k = 1, 2, 3, ..., m
where y i is a set of outcome variables of firms i ; X
t is a set of observed firm characteristics
influencing their medium and long term growth performance; BAM i represents dummy
membership of firms in BAs; ε i is the randomly distributed error term indicating
the unobservable factors affecting the outcome variables, with zero conditional mean
E (ε i | X
i , M
i ) = 0; π
k and γ are parameters to be estimated.
PSM estimates average treatment effects (ATE) of policy or programme impactsbetween matched treatment and control groups in the region of common support. This is
done by using matching methods such as nearest neighbour (NN) and others69. Treatment
and control groups are matched based on the probability of participation or propensity
score of participation estimated from their observed covariates (Khandker et al. 2010;
Gertler et al. 2011b). Thus, if the independence assumption holds or E (ε i | X
i , BAM
i ) = 0 and
if there is a significant overlap of participants and non-participants in the region of common
support, the average treatment effects can be written as70:
69 Other matching methods include caliper, or radius matching, stratification or interval matching, and kernel
and local linear matching (Khandker et al., 2010).
70 The formula was adapted from Khandker et al., 2010: 57.
k
8/11/2019 Trade performance and competitiveness: Selected issues relevant for Asian developing economies
http://slidepdf.com/reader/full/trade-performance-and-competitiveness-selected-issues-relevant-for-asian-developing 173/215
153
ATE PSM
= [Σ yM –Σ ϕ (i, j ) y N ] (2)
where N m is the number of firms i participating in BAs and ϕ (i, j ) is the weight used to
aggregate outcomes for the matched non-participating firms. However, if zero conditional
mean error assumption is violated or E (ε i | X i , BAM i ) ≠ 0 and the overlapping region of common support is significantly small, PSM would produce inconsistent and biased
coefficients (Caliendo and Kopeining, 2008; Khandker et al., 2010; Gertler et al., 2011a).
We use kernel and nearest neighbour matching methods to estimate the impacts of BA
membership on firms’ performance (Oh et al., 2009).
To obtain reliable, consistent, and unbiased coefficients using PSM, the following
assumptions must be met: (1) the un-confoundedness assumption or the conditional
independence assumption (CIA), where potential outcomes are independent of treatment
assignment given observed covariate x i ; and (2) significant overlapping assumption of common support between participants and non-participants. While the violation of the latter
is less severe; that of the former, so-called selection or programme placement bias, would
be problematic and is technically and practically difficult to address.
Estimation results are more likely to have upward or downward biases due to
administrative and self-selection reasons. If a business association administratively selects
large and already well-established firms as members, assessment results tend to overstate
the benefits received. When small and low productive firms are selected members the
benefits are understated. The study assumes that there is no administrative selection, asalmost all business association membership in almost all business associations in
Cambodia is voluntary.
There is the option of firms choosing to participate in BAs. What encourages
a firm’s participation in BAs is unknown. There could be unobserved characteristics,
affecting outcome variables, which are likely to encourage participation. Some of these
attributes (which may not have available data) are productivity growth, firm owner-manager
ability and advance firms, in terms of managerial, administrative and financial structure.
Results from this are likely to overstate the benefits of business association participation.
The opposite is when participating firms are those with low productivity or low owner-
managers’ ability. This would understate the benefits of BA membership. Our descriptive
statistics (Annex tables 3, 4 and 5) provides some relevant information on this issue. Large
firms, exporting firms, firms with term loans from financial institutions, 100% foreign-owned
and joint venture firms, manufacturing establishments, and firms who know about Special
Economic Zone (SEZ) have higher per centages of being BA members than their
counterparts. Almost all of these firms have higher performance indicators, except labour
productivity and labour cost per worker (Annex table 5).
To tackle selectivity or programme placement or biases of ex-post characteristics,other approaches can be used. This could be difference-in-differences (DID) or
instrumental variables. DID would produce consistent and unbiased coefficients of impacts
only if we control for observable characteristics of firms and the randomly distributed error
1
N M
i ∈M i ∈M i j

8/11/2019 Trade performance and competitiveness: Selected issues relevant for Asian developing economies
http://slidepdf.com/reader/full/trade-performance-and-competitiveness-selected-issues-relevant-for-asian-developing 174/215
154
terms that are not dependent on unobservable attributes. The validity of DID holds if, and
only if unobservable attributes affecting outcome variables are assumed to be constant
over time, However, in practice, this might change. If the error term in DID equation is
time-variant, estimated coefficients would still be biased and inconsistent. To address
selection bias resulting from time-variant observable attributes, the “Instrumental Variables”technique or the two-stage procedure described by Heckman (1979) can be employed.
However, finding good instrumental variable(s) is challenging.
Therefore, PSM is used given the quality of the existing data set. The use of
matching is mainly to balance characteristics of participating and non-participating firms,
rather than to completely eliminate selection bias. Additionally, in constructing a comparison
group for matching, some factors have to be taken into account. First, data on outcome
variables of comparison group, matched with those of treatment group, should be from the
same set of questions (Caliendo and Kopeining, 2008). This condition is met by using the
same set of questions to collect information on participating and non-participating.
Second consideration is the issue of sample size – the total sample size and the
ratio of treatment-to-comparison observations. Basically, matching can be done in two ways
– with and without replacement. The latter approach would require the comparison group to
have a large sample size since one observation of the comparison group can only be
matched one time. Whereas, the former approach would demand a relatively smaller
sample size. The total sample size in our data is 502, and the ratio of participating-to-non-
participating firms is 1:2.6. Since we use matching with replacement (which is common in
matching literature) sample size is not a major issue. Lastly, Lee (2006) pinpoints that CIAwould imply that covariates x
i , needs to be chosen in a way that it is correlated with the
decision to participate and firms’ outcome variables. This is when programme placement is
voluntary. So, observable characteristics that meet the third requirement need to be found.
This can be done by using economic theory or empirical studies.
2. Variables measurement
The choice of variables to be included in subsequent equations is based on
economic theory and previous empirical works. Where there is no economic theory tosupport variable choice, formal statistical tests are used to justify its validity (see, for
example, Heckman et al., 1998; Black and Smith, 2004; Caliendo and Kopeining, 2008).
One of the survey questions is “Is your establishment/firm a member of a business
association or chamber of commerce?” The study uses this as the main binary explanatory
variable, with “1” representing membership and “0” otherwise. Logarithmic form is applied
to the final continuous outcome variables and some indicator variables to make
distributions approximately normal (For example see Roper and Hewitt-Dundas, 2001;
World Bank, 2010; Mole et al., 2008; Motohashi, 2002; Harvie et al., 2010). The definition
of firms is based on the government’s definition. The firm categories are based on the
number of regular employees of the firm in 2006 fiscal year (Annex table 1).

8/11/2019 Trade performance and competitiveness: Selected issues relevant for Asian developing economies
http://slidepdf.com/reader/full/trade-performance-and-competitiveness-selected-issues-relevant-for-asian-developing 175/215
155
The firm’s age is taken from the start of operations in the country to April 2006.
Previous studies argue that firm age is positively related to firms’ high participation
probability in some kind of associative cooperation or production network. This is due to
older firms would have more experience in production, therefore understanding the benefits
they can take from this kind of collective bargaining. Whereas, younger firms may still bedoubtful about the benefits. The study hypothesises that firm age is statistically positively
correlated with high probability of participation. We also introduce square of firm age to
allow for diminishing returns from participation over time.
Firm size is found to be positively related to the decision to participate in BAs.
However, there are arguments about whether small firms are more likely to rely on
intermediary support than larger ones (Salisbury, 1984; World Bank, 2010). Salisbury
(1984: 74) argues that a sector with small firms is more likely to be attracted to associative
bodies where individual small firms can take greater advantage of collective services. This
is because small firms, for example, cannot bear the full costs of private consultancy or
professional services, by themselves. He also states that large firms, that can take
advantage of economies of scale, are more likely to be able to afford private
representations and specialised services. Mitchell (1990: 627-628) shows that large firms
tend to have direct contact with government rather than rely on business or professional
associations for representation. Bennett (1999: 256) also argues that large firms are more
likely to influence government decisions directly rather than rely on the representation of
associative bodies. Bennett (1995: 261) shows that the smallest firms are more likely to
become CoC members than larger ones. Bennett (2000) partly proves Salisbury’s (1984)
argument that the demand for collective services is greater for small firms. Alternatively,
while analysing the impacts of government-supported training programmes in Chile,
Mexico, Colombia and Peru, the World Bank (2010) shows that, common across the
countries, larger firms are more likely to be attracted to support programmes compared to
smaller ones. These different arguments lead us to empirically test the relationship between
firm size and participation probability. This study hypothesises that small firms are more
likely to be attracted to BAs or CoC.
The World Bank (2010) also indicates that more manufacturing SMEs tend to
participate in programmes compared to services and trade sector SMEs. Bennett (1995:269) shows that manufacturing firms are between four or eight times likely to be CoC
members than non-manufacturing firms. In this study, the surveyed firms are categorised
into four sectors – manufacturing, trade, tourism and other (construction, transport, IT and
other). The hypothesis is that manufacturing firms, in general, and SMEs, in particular,
would be more likely to participate in BAs or CoC. The study also hypothesizes that fully
foreign-owned and joint-venture firms and SMEs have a high probability of BA membership
than fully domestically-owned firms. This is because foreign-owned firms may have more
understanding of the benefits they can obtain from the collective services of BAs. Previous
studies have found significant positive relations between exporting firms and SMEs and thedecision to participate in production networks or other kinds of associative bodies. This
study hypothesize that a firm’s decision to become a BA member is higher among exporting
firms and SMEs compared to their non-exporting counterparts.

8/11/2019 Trade performance and competitiveness: Selected issues relevant for Asian developing economies
http://slidepdf.com/reader/full/trade-performance-and-competitiveness-selected-issues-relevant-for-asian-developing 176/215
156
Earlier studies also argue that firms, in general, and SMEs, in particular (with better
access to finance), are more likely to participate in BAs or production networks (Harvie et
al., 2010). Possible credit rationing by financial institutions, resulting from information
imperfections in credit market, can prevent SMEs from accessing term loans or credit line
(Stiglitz and Weiss, 1981). Harvie et al. (2010) indicates that easier access to finance or high financial leverage increases the probability of SMEs’ participation in production
networks. However, this study hypothesize that SMEs are more likely to participate in BAs
so that they can use membership as some sort of guarantee when they approach banks for
term loans or credit line. This is so for SMEs that finds it difficult to access finance due to
size constraint and inability to provide required collateral to banks. The study also includes
other variables that may have an influence on participation in the selection equation.
C. Data source and descriptive statistics
1. Data source
The study uses the 2007 World Bank Enterprise Surveys of Cambodia. A simple
random sample from a combined sampling frame (World Bank, 2007) was employed to
select the required observations from each strata defined by four sectors (manufacturing,
tourism, trade, and others), as well as three firm sizes. With the elimination of surveyed
firms that had less than five regular employees in April 2006, the total sample size was 502,
204 of which have between 5 and 19 workers, 146 have between 20 and 99 workers, and
152 have more than 99 workers. Based on firm categories defined by the government andthe number of regular employees in 2006 fiscal year (Annex table 1), there were 361
MSMEs (72 per cent of the total sampled firms) while 141 large enterprises accounted for
the remaining 28 per cent.
The survey covered firms that started operating before April 2006 in a number of
sub-sectors ranging from textiles, garments, wholesale (including export services) to hotels
and restaurants. Surveyed firms are categorised into four sectors – manufacturing, trade,
tourism and other (including construction, transport and IT). The survey considers only
private-for-profit firms, not government-owned or community-owned establishments. Also,firms who did not keep their own accounts were eliminated. The survey took place in four
main areas – Battambang, Siem Reap, Phnom Penh and Kampong Cham. Most surveyed
firms (401 or 80 per cent of total sample firms) were located in Phnom Penh and its
outskirts in the Kandal province. The remaining firms are in Battambang (9 or 2 per cent),
Siem Reap (66 or 13 per cent), Kampong Cham (6 or 1 per cent) and “others” (20 or 4 per
cent).
2. Descriptive statistics
Of the total sampled firms, 139 (27.7 per cent) were members of a BA or CoC, while
the remaining 363 firms were not. Of the 363 MSMEs, only 47 were members of a BA while
the other 314 were not. There were 92 large firms that reported membership, while the
other 49 did not. Only 33.8 per cent of MSMEs are members of a BA or CoC compared with
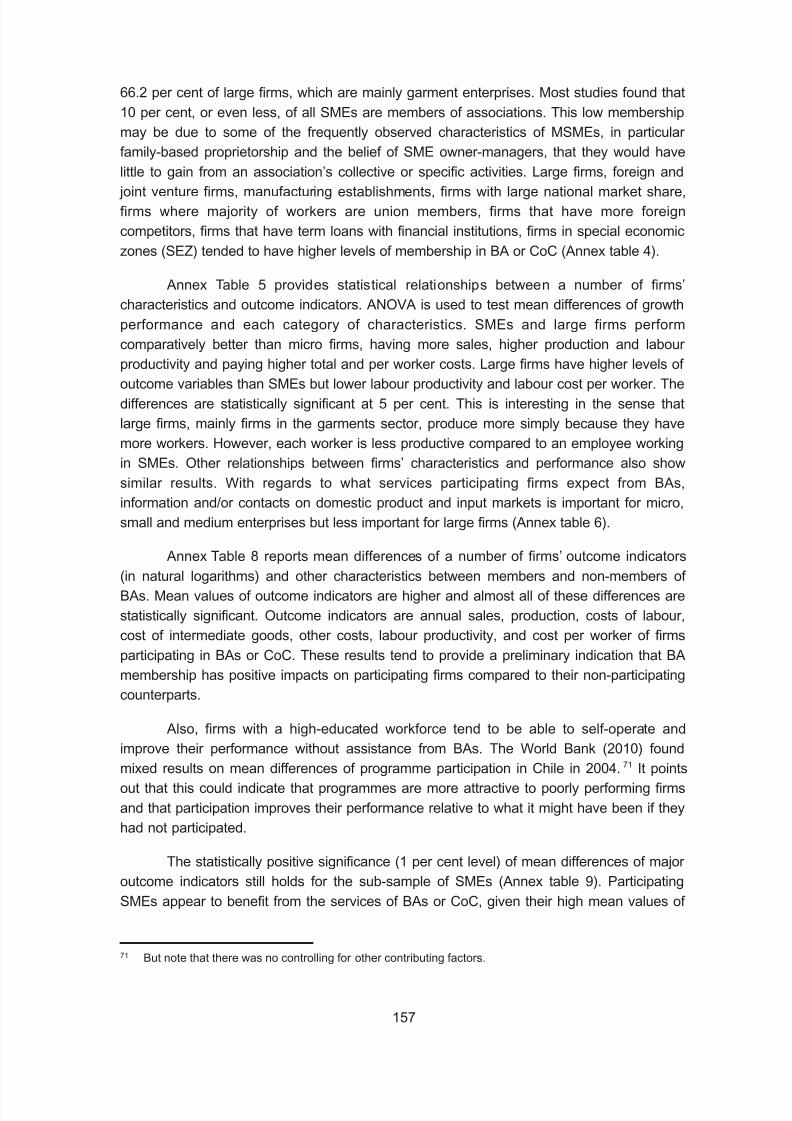
8/11/2019 Trade performance and competitiveness: Selected issues relevant for Asian developing economies
http://slidepdf.com/reader/full/trade-performance-and-competitiveness-selected-issues-relevant-for-asian-developing 177/215
157
66.2 per cent of large firms, which are mainly garment enterprises. Most studies found that
10 per cent, or even less, of all SMEs are members of associations. This low membership
may be due to some of the frequently observed characteristics of MSMEs, in particular
family-based proprietorship and the belief of SME owner-managers, that they would have
little to gain from an association’s collective or specific activities. Large firms, foreign and joint venture firms, manufacturing establishments, firms with large national market share,
firms where majority of workers are union members, firms that have more foreign
competitors, firms that have term loans with financial institutions, firms in special economic
zones (SEZ) tended to have higher levels of membership in BA or CoC (Annex table 4).
Annex Table 5 provides statistical relationships between a number of firms’
characteristics and outcome indicators. ANOVA is used to test mean differences of growth
performance and each category of characteristics. SMEs and large firms perform
comparatively better than micro firms, having more sales, higher production and labour
productivity and paying higher total and per worker costs. Large firms have higher levels of
outcome variables than SMEs but lower labour productivity and labour cost per worker. The
differences are statistically significant at 5 per cent. This is interesting in the sense that
large firms, mainly firms in the garments sector, produce more simply because they have
more workers. However, each worker is less productive compared to an employee working
in SMEs. Other relationships between firms’ characteristics and performance also show
similar results. With regards to what services participating firms expect from BAs,
information and/or contacts on domestic product and input markets is important for micro,
small and medium enterprises but less important for large firms (Annex table 6).
Annex Table 8 reports mean differences of a number of firms’ outcome indicators
(in natural logarithms) and other characteristics between members and non-members of
BAs. Mean values of outcome indicators are higher and almost all of these differences are
statistically significant. Outcome indicators are annual sales, production, costs of labour,
cost of intermediate goods, other costs, labour productivity, and cost per worker of firms
participating in BAs or CoC. These results tend to provide a preliminary indication that BA
membership has positive impacts on participating firms compared to their non-participating
counterparts.
Also, firms with a high-educated workforce tend to be able to self-operate and
improve their performance without assistance from BAs. The World Bank (2010) found
mixed results on mean differences of programme participation in Chile in 2004.71 It points
out that this could indicate that programmes are more attractive to poorly performing firms
and that participation improves their performance relative to what it might have been if they
had not participated.
The statistically positive significance (1 per cent level) of mean differences of major
outcome indicators still holds for the sub-sample of SMEs (Annex table 9). Participating
SMEs appear to benefit from the services of BAs or CoC, given their high mean values of
71 But note that there was no controlling for other contributing factors.

8/11/2019 Trade performance and competitiveness: Selected issues relevant for Asian developing economies
http://slidepdf.com/reader/full/trade-performance-and-competitiveness-selected-issues-relevant-for-asian-developing 178/215
158
outcome indicators compared to non-participating SMEs. Approximately 74.85 per cent
of surveyed firms are non-exporters while only 25.15 per cent are exporting firms. The
Chi2-square test of independence between exporters and non-exporters and firms’ decision
to become BA member indicates that 63.5 per cent of exporting firms are members of BAs
or CoC, while 36.5 per cent are not. Of the non-exporters, 15.5 per cent are reportedly BAmembers while 84.5 per cent are not. The difference is statistically significant at 1 per cent
level, signifying that exporting firms have a higher probability of participation in BAs than
non-exporting ones.
More manufacturing firms (62.7 per cent) are members of BAs compared to firms in
the trading sector (7.6 per cent), tourism sector (16.8 per cent) and other sectors (19.3 per
cent). The Chi2 square test of independence between row and column is again statistically
significant at 1 per cent level. A large percentage of firms in Phnom Penh (31.2 per cent)
are members of BAs compared to Siem Reap (16.7 per cent), Kampong Cham (16.7 per
cent) and others (2 per cent). This partly reflects associative organizations being more
concentrated in Phnom Penh. As far as equity stakes of firms are concerned, a high
percentage of firms that are fully foreign-owned (52.1 per cent) and joint venture (52.1 per
cent) are BA members. Only 13.8 per cent of fully domestically-owned firms are members.
D. Regression results and discussion
1. Participation likelihood
Annex table 10 presents results of logistic regression analysis, predicting the
likelihood of firms’ participation in BA or CoC given their observed covariates. Regressions
are run for both the pooled sample (all participating and non-participating firms) and a sub-
sample (participating and non-participating MSMEs). In estimation, six different model
specifications are used, partly to test the robustness of results. Results reveal that most of
the covariates have expected effects (in terms of the sign) on participation probability,
though with varying statistical significance.
For the pooled sample, the variable “years in operation” is positively correlated
statistically with high probability of participation. This indicates that older firms tend to
participate in BA or CoC more than younger ones. Second, large firms are more likely to
register membership than MSMEs. This finding contradicts our prior expectation that
small firms would have higher participation likelihood as they can use membership as
a bargaining tool for business survival and growth. However, the result is consistent with
that of previous studies (World Bank, 2010; Harvie et al., 2010).
Non-exporting firms accounted for 74.8 per cent of the total sample, compared to
25.2 per cent of exporting firms. Yet, exporters, who also tend to be fully foreign-owned or
joint ventures, are more likely to participate than non-exporting ones. This may be because
exporting firms can get business information on foreign markets and advice and support
services from BA or CoC (Spence, 2003). It should be emphasised that more needs to be
done to encourage domestic producers to be exporters. Of fully domestically-owned firms

8/11/2019 Trade performance and competitiveness: Selected issues relevant for Asian developing economies
http://slidepdf.com/reader/full/trade-performance-and-competitiveness-selected-issues-relevant-for-asian-developing 179/215
159
78.4 per cent are non-exporters, and 92.3 per cent of output is sold domestically compared
to 6.2 per cent that are exported directly and 1.5 per cent that are exported indirectly (World
Bank 2007).
The large proportion of non-exporting domestic firms may indicate several possible
constraints to exporting (1) long and complicated administrative compliance, (2) limited
access to information on foreign markets, (3) products are low quality and do not meet
internationally required standards, and (4) limited staff capacity to go international. The
problems reported by exporting firms in the survey five years ago remain today. These are
lengthy and costly export procedures, informal fees, gifts giving to officials and high cost
per export container. Cambodia was ranked 138 out of 183 economies evaluated on ease
of conducting business (World Bank, 2012).
Also, more needs to be done to reduce export regulatory and administrative
compliance costs. Almost all firms in Cambodia are MSMEs, where production capacity isstill low and vulnerable to competition from imports. High costs of doing business also force
MSMEs to stay small and informal, further jeopardising their expansion and productivity.
Business management structure is predominantly conventional, with individual and/or
family as the largest shareholder or owner. Data shows that 49.8 per cent of firms reported
having an individual as the largest shareholder or owner, and 32.4 per cent having family
as the largest shareholder. One of the risks of family-based firms dominating the business
environment is resistance to change in management style, and reluctance to adopt new
technologies.
There is merit in pushing domestic producers to eye foreign markets. Previous
studies have also documented the need for domestic firms to upgrade their production
chain and the potential benefits of exploring opportunities outside home markets. Using
Colombian panel data on manufacturing firms, Isgut (2001) finds that exporters tend to be
larger, more productive, pay higher wages, are more capital intensive, and have higher
labour productivity than non-exporters. Biesebroeck (2003) shows that exporting
manufacturing firms in Sub-Saharan African countries tend to be more productive than
non-exporters. This is due to exporting firms improving their productivity upon entering
foreign markets. He argues that scale economies can be one of the determining factors.Bernard and Jensen (1997) also found that exporting manufacturing firms contributed
significantly to the demand for skilled labour and wage increases in US manufacturing
plants during the 1980s.
Thus, encouraging domestic producers to export means helping them to get out of
their comfort zone and start exploring productivity and profitability opportunities beyond
domestic markets. This is especially relevant to Cambodian producers given the intensity of
regional and global economic integration that Cambodia is currently taking part in. The
effects of the Asian Free Trade Agreement, specifically ASEAN Economic Community,
demand further changes in current production practices, management and innovation
among domestic producers. This is to become competitive and to stay afloat when
domestic markets are opened to an influx of foreign goods and, at a later stage, freer flow
of services. The government’s current commitment to achieve exports of one million tonnes

8/11/2019 Trade performance and competitiveness: Selected issues relevant for Asian developing economies
http://slidepdf.com/reader/full/trade-performance-and-competitiveness-selected-issues-relevant-for-asian-developing 180/215
160
of milled rice by 2015 is a starting point to improve production capacity and productivity of
domestic rice producers (CEFP, 2011). But, entry into exporting by itself is not enough to
enhance productivity, since competitiveness depends on a number of interdependent
factors in the whole value chain. A long-term strategy is needed to improve infrastructure,
logistic systems, information flow and market access, banking systems, governmentregulations and procedures and human capital. Additionally, support and initiatives should
not be confined to the rice sector as sectoral diversification is a major contributing factor to
fast and sustained economic growth.
Manufacturing firms have higher participation probability than firms in trade, tourism
and other sectors. This provides an early indication that further efforts should be extended
to cultivate the idea of forming more concentrated and specialised form of associative
bodies. This could be in the form of industrial clusters among manufacturers in order to
gain greater benefits, rather than business information only. The higher its share of the
national market, the more likely it is that a firm will participate in BA or CoC. This may be an
indication that firms would use membership to better understand market potential and
further expand their market share.
We hypothesize that firms that have difficulties in obtaining term loans from financial
institutions are more likely to participate in BA or CoC. Nonetheless, the study’s logistic
regression estimates of the six specifications reveals that firms with term loans have
a higher likelihood of participating than those who do not, and it is statistically significant at
1 per cent level. This could be due to a number of reasons. First, becoming a member of an
associative organization is not enough in itself to secure term loans from financialinstitutions. In other words, financial institutions need hard and valuable collateral to guard
against risk of default. Second, this can reflect the fact that BA members are
well-established firms that have a large number of employees, a big share of domestic
markets, and high productivity.72
This finding, however, is consistent with that of previous studies (Harvie et al., 2010;
Harner, 2003; Dinh et al., 2010; Ayyagari et al., 2008). Recent literature points to the lack of
access to financial services or insufficient functioning of the banking system as one of the
major constraints to growth of both large and small firms. In the Cambodian context, whereregulatory and law enforcement is weak and overall public trust low, achieving sufficient
access to formal financing has been and will continue to be a challenge.
The data shows that only 21.7 per cent of surveyed firms reported having term
loans (more than 6 months) with financial institutions. This reflects the relatively low
utilization of formal financing. From the demand side, firms request financial institutions to
increase loan amounts, extend maturity date of term loans and importantly reduce interest
rates. From the supply side, banks and other financial institutions usually raise the issue of
protecting depositors by screening and targeting the best borrowers, applying strict
72 This raises the possibility of endogeneity bias in the estimation, though the PSM method can minimize the
problem, given its balancing of treatment and control groups.

8/11/2019 Trade performance and competitiveness: Selected issues relevant for Asian developing economies
http://slidepdf.com/reader/full/trade-performance-and-competitiveness-selected-issues-relevant-for-asian-developing 181/215
161
requirements to fulfil bank procedures. They also raise the issue of the informal nature of
the business undertakings of most MSMEs which do not have appropriate financial
statements or proper accounting systems. Harner (2003) found that although the demand
for medium and long-term loans is high among SMEs in Cambodia, banks are reluctant to
lend because (1) current contract and law enforcement is weak, (2) high interest rates ondeposits, (3) banks’ limited access to long-term capital, (4) unavailability and difficulty
gathering information on borrowers to conduct credit worthiness analysis, (5) high liquidity
ratios required by the National Bank of Cambodia, and (6) limited staff capacity.
Firms where majority of employees are members of a workers union tend to
participate more than firms with fewer employees belonging to the union. This may be
because associations can act collectively to efficiently bargain and meet union demands.
Recently, there have been protests and strikes by union-member workers, especially in the
garment and footwear industries. They were demanding better wage increases, respect for
labour law and good working conditions. But finding solutions has been difficult. Relations
between employers, the union and the Garment Manufacturers Association of Cambodia,
have soured. Although the right to form associative bodies, like a workers’ union, is an
integral part of Cambodia’s law, there are complaints about the large number of unions in
Cambodia. The study also finds that the number of licenses, permits and regulations that
firms are supposed to meet is highly positively correlated with probability of participation.
The study finds that firms who reported knowing about the existence and functioning of
special economic zones (SEZs) are more likely to be members. This may imply that BAs or
CoC should disseminate more information about the benefits members can get from
participating.
For the sub-sample of MSMEs, most estimation results were similar to those from
the pooled sample.
2. Average treatment effects (ATE)
Once the propensity score is estimated using logistic regression, two commonly
used matching methods are employed – nearest neighbour and kernel. This is to estimate
ATE of programme participation. Matching methods use the estimated propensity score of each specification. The nearest neighbour (NN) matching estimates the effects of
membership participation. This compares participating firms in the treatment group with
non-participating firms in the control group that have similar propensity score. NN matching
is often used with small sample size (World Bank, 2010). One of the weaknesses of NN
matching is that matching quality can be affected if many firms in the treatment group have
high propensity scores, while only a few firms in the control group have high propensity
scores. This shortcoming is addressed by using the kernel matching method. It should also
be noted that the comparison was performed on participating and non-participating firms
who fell in the region of common support. All of the study specifications satisfied thebalancing property (Annex table 10). ATE is estimated for the pooled sample of all firms
and the sub-sample of MSMEs.
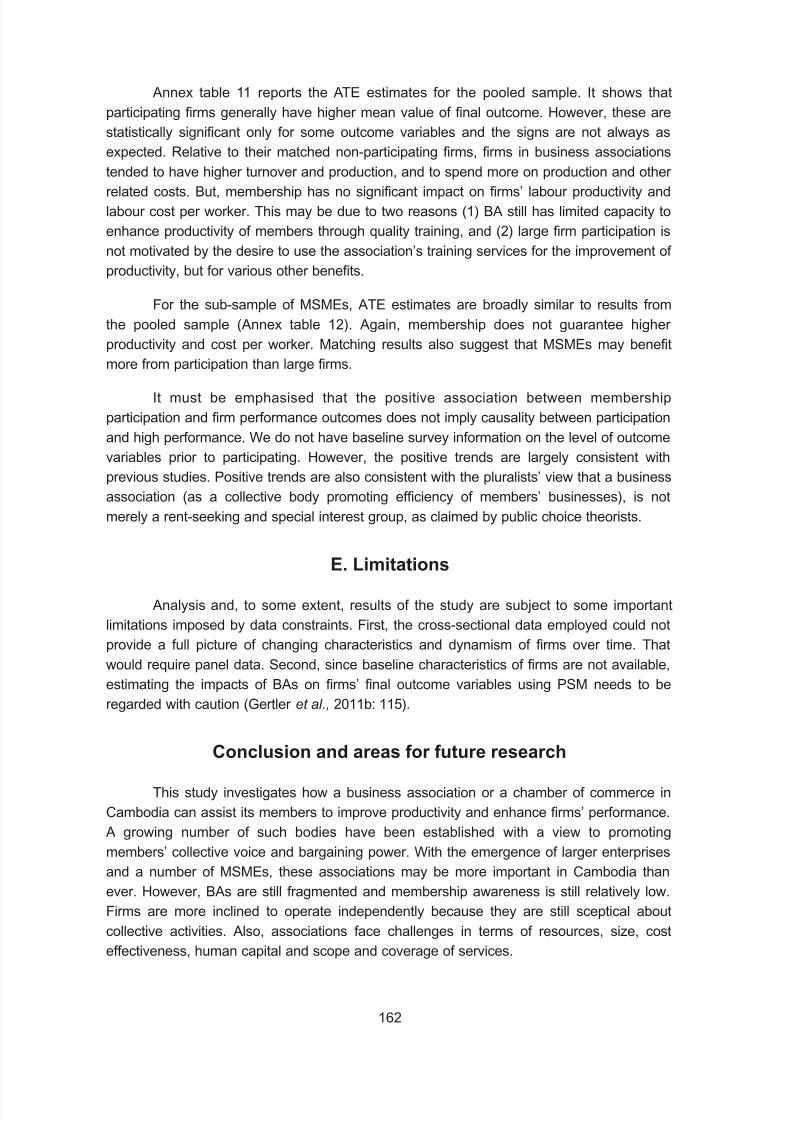
8/11/2019 Trade performance and competitiveness: Selected issues relevant for Asian developing economies
http://slidepdf.com/reader/full/trade-performance-and-competitiveness-selected-issues-relevant-for-asian-developing 182/215
162
Annex table 11 reports the ATE estimates for the pooled sample. It shows that
participating firms generally have higher mean value of final outcome. However, these are
statistically significant only for some outcome variables and the signs are not always as
expected. Relative to their matched non-participating firms, firms in business associations
tended to have higher turnover and production, and to spend more on production and other related costs. But, membership has no significant impact on firms’ labour productivity and
labour cost per worker. This may be due to two reasons (1) BA still has limited capacity to
enhance productivity of members through quality training, and (2) large firm participation is
not motivated by the desire to use the association’s training services for the improvement of
productivity, but for various other benefits.
For the sub-sample of MSMEs, ATE estimates are broadly similar to results from
the pooled sample (Annex table 12). Again, membership does not guarantee higher
productivity and cost per worker. Matching results also suggest that MSMEs may benefit
more from participation than large firms.
It must be emphasised that the positive association between membership
participation and firm performance outcomes does not imply causality between participation
and high performance. We do not have baseline survey information on the level of outcome
variables prior to participating. However, the positive trends are largely consistent with
previous studies. Positive trends are also consistent with the pluralists’ view that a business
association (as a collective body promoting efficiency of members’ businesses), is not
merely a rent-seeking and special interest group, as claimed by public choice theorists.
E. Limitations
Analysis and, to some extent, results of the study are subject to some important
limitations imposed by data constraints. First, the cross-sectional data employed could not
provide a full picture of changing characteristics and dynamism of firms over time. That
would require panel data. Second, since baseline characteristics of firms are not available,
estimating the impacts of BAs on firms’ final outcome variables using PSM needs to be
regarded with caution (Gertler et al., 2011b: 115).
Conclusion and areas for future research
This study investigates how a business association or a chamber of commerce in
Cambodia can assist its members to improve productivity and enhance firms’ performance.
A growing number of such bodies have been established with a view to promoting
members’ collective voice and bargaining power. With the emergence of larger enterprises
and a number of MSMEs, these associations may be more important in Cambodia than
ever. However, BAs are still fragmented and membership awareness is still relatively low.Firms are more inclined to operate independently because they are still sceptical about
collective activities. Also, associations face challenges in terms of resources, size, cost
effectiveness, human capital and scope and coverage of services.

8/11/2019 Trade performance and competitiveness: Selected issues relevant for Asian developing economies
http://slidepdf.com/reader/full/trade-performance-and-competitiveness-selected-issues-relevant-for-asian-developing 183/215
163
The study finds evidence that participation in business association tends to be
positively associated with better performance across several outcome variables. This is
done using propensity score matching, ordinary least squares and a combination of PSM
and OLS methods with firm-level cross-sectional data from 2007. These results are
stronger for micro, small and medium enterprises. This suggests that business associationsmay be more beneficial for smaller firms. However, membership appears to have no
significant positive impact on labour productivity and payment per worker.
The study suggests that firms, particularly micro enterprises and SMEs, do benefit
from collective bodies. These participating firms can take advantage of market information,
knowledge sharing and updates on government administrative and regulatory
requirements. But there needs to be more study to assess the benefits of BAs services.
Also needing more attention, is how these services contribute to further growth and
competitiveness of SMEs. Lastly, consideration must be given to whether membership
should be voluntary or obligatory, or a mixture of both.

8/11/2019 Trade performance and competitiveness: Selected issues relevant for Asian developing economies
http://slidepdf.com/reader/full/trade-performance-and-competitiveness-selected-issues-relevant-for-asian-developing 184/215
164
Table 2. Distribution of participating and non-participating groups
by firm size and sub-sector
Firm Size and BA participation
Sub-sector Micro Small and medium Large
Participant Non- Participant Non- Participant Non-
participant participant participant
Food 0 0 4 5 1 1
(0.0) (0.0) (9.5) (2.7) (1.1) (2.0)
Textiles 0 0 0 1 5 0
(0.0) (0.0) (0.0) (0.5) (5.4) (0.0)
Garments 0 0 1 2 68 21
(0.0) (0.0) (2.3) (1.1) (74.0) (42.8)
Plastics & Rubber 0 1 0 2 2 1
(0.0) (0.7) (0.0) (1.1) (2.2) (2.0)
Basic metals and ... 1 ... 2 ... 0
fabricated metal products (0.7) (1.1) (0.0)
Other manufacturing 1 3 0 8 2 2
(20.0) (2.3) (0.0) (4.5) (2.2) (4.1)Wholesale (including 1 3 6 21 1 2
export services) (20.0) (2.3) (14.3) (11.7) (1.1) (4.1)
Retails ... 44 ... 25 ... 2
(33.1) (13.8) (4.1)
Hotels & Restaurants 1 30 12 62 5 9
(20.0) (22.6) (28.6) (34.2) (5.4) (18.4)
Other services 2 16 4 3 0 0
(travel agencies, tour (40.0) (12.0) (9.5) (1.6) (0.0) (0.0)
operators, etc.)Construction 0 2 2 4 1 0
(0.0) (1.5) (4.8) (2.2) (1.1) (0.0)
Annex
Table 1. Classification of enterprises in Cambodia
Types Employees (persons) Start-up capital (USD)
Micro-enterprises Fewer than 10 Less than 50,000
Small Between 11 and 50 Between 50,000 and 250,000
Medium Between 51 and 100 Between 250,000 and 500,000
Large 100 or more 500,000 or more
Source: RGC (2005: 13)
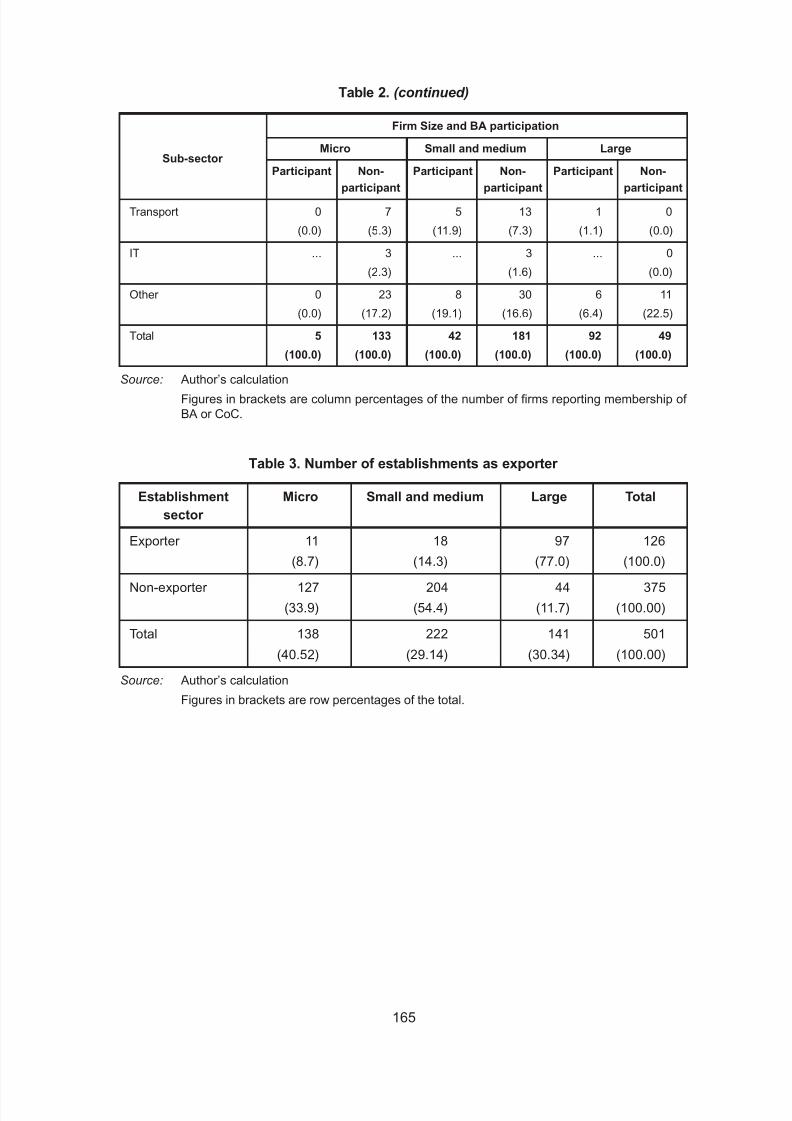
8/11/2019 Trade performance and competitiveness: Selected issues relevant for Asian developing economies
http://slidepdf.com/reader/full/trade-performance-and-competitiveness-selected-issues-relevant-for-asian-developing 185/215
165
Transport 0 7 5 13 1 0
(0.0) (5.3) (11.9) (7.3) (1.1) (0.0)
IT ... 3 ... 3 ... 0
(2.3) (1.6) (0.0)
Other 0 23 8 30 6 11
(0.0) (17.2) (19.1) (16.6) (6.4) (22.5)
Total 5 133 42 181 92 49
(100.0) (100.0) (100.0) (100.0) (100.0) (100.0)
Source: Author’s calculation
Figures in brackets are column percentages of the number of firms reporting membership of BA or CoC.
Table 3. Number of establishments as exporter
Establishment Micro Small and medium Large Total
sector
Exporter 11 18 97 126
(8.7) (14.3) (77.0) (100.0)
Non-exporter 127 204 44 375
(33.9) (54.4) (11.7) (100.00)
Total 138 222 141 501
(40.52) (29.14) (30.34) (100.00)
Source: Author’s calculation
Figures in brackets are row percentages of the total.
Table 2. (continued)
Firm Size and BA participation
Sub-sector Micro Small and medium Large
Participant Non- Participant Non- Participant Non-
participant participant participant

8/11/2019 Trade performance and competitiveness: Selected issues relevant for Asian developing economies
http://slidepdf.com/reader/full/trade-performance-and-competitiveness-selected-issues-relevant-for-asian-developing 186/215
166
Table 4. Membership in business association or chamber of commerce
by firm’s characteristics
Firm’s characteristicsMembership in BA or CoC
Yes No Total obs.Firm size
Micro (employees <10) 5 133 138
(3.6) (36.5) (27.5)
Small and medium 42 181 223
(11< = employees < = 100) (30.2) (49.9) (44.4)
Large (employees >100) 92 49 141
(66.2) (13.6) (28.1)
Exporter
Exporting firm 80 46 126
(58.0) (12.7) (25.2)
Non-exporting firm 58 317 375
(42.0) (87.3) (74.8)
Firm with term loans
Firm having term loans with financial 40 69 109
institutions (28.8) (19.0) (21.7)
Firm having no term loans with financial 99 294 393
institutions (71.2) (81.0) (78.3)
Firm’s equity stake
100% domestically owned 44 275 319
(31.7) (75.8) (63.6)
100% foreign owned 74 68 142
(53.2) (18.7) (28.3)
Joint venture 21 19 40
(15.1) (5.5) (8.1)
Firm typeManufacturing 84 50 134
(60.4) (13.7) (26.7)
Trade 8 97 105
(5.8) (26.7) (20.9)
Tourism 24 120 144
(17.3) (33.1) (28.7)
Other 23 96 119
(16.5) (26.5) (23.7)Geographical location
Battambang 0 9 9
(0.0) (2.5) (1.8)

8/11/2019 Trade performance and competitiveness: Selected issues relevant for Asian developing economies
http://slidepdf.com/reader/full/trade-performance-and-competitiveness-selected-issues-relevant-for-asian-developing 187/215
167
Siem Reap 11 55 66(7.9) (15.2) (13.2)
Phnom Penh 125 276 401
(89.9) (76.0) (79.9)
Kampong Cham 1 5 6
(0.7) (1.3) (1.1)
Other 2 18 20
(1.5) (5.0) (4.0)
Firm age0-4 50 170 220
(36.0) (46.8) (43.7)
5-10 67 120 187
(48.2) (33.1) (37.3)
More than 10 22 73 95
(15.8) (20.1) (19.0)
# of competitors as domestic firms
None 35 16 51(25.8) (4.5) (10.4)
1 2 4 6
(1.5) (1.1) (1.2)
2-5 21 37 58
(15.7) (10.3) (11.7)
>5 77 302 379
(57.0) (84.1) (76.7)
Firm’s information about SEZYes 97 137 234
(70.0) (37.7) (46.6)
No 42 226 268
(30.0) (62.3) (53.4)
Source: Author’s calculation
a) Figures in brackets are column percentages of the number of firms reportingmembership of BA or CoC.
b) Pearson Chi2 was conducted to test column differences of each firm’s characteristic on
the percentage of firms reporting membership of BA or CoC. All tests are significant, atleast, at 5% level.
Table 4. (continued)
Firm’s characteristicsMembership in BA or CoC
Yes No Total obs.
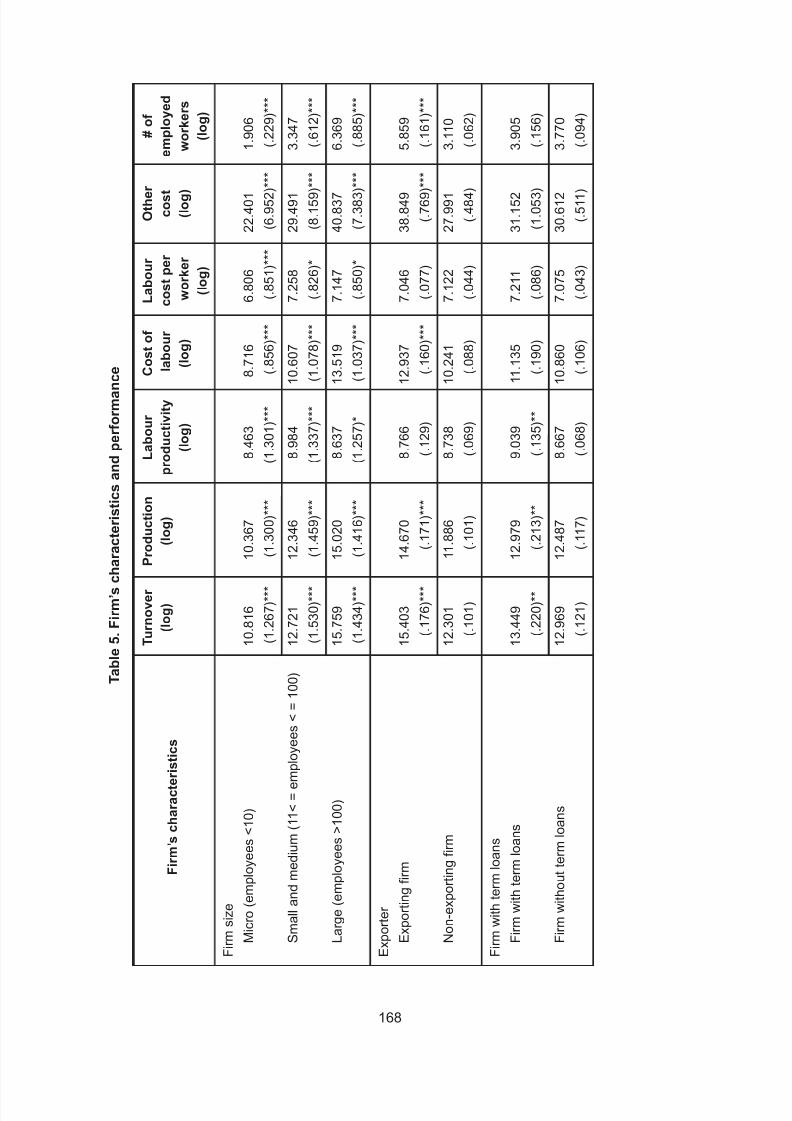
8/11/2019 Trade performance and competitiveness: Selected issues relevant for Asian developing economies
http://slidepdf.com/reader/full/trade-performance-and-competitiveness-selected-issues-relevant-for-asian-developing 188/215
168
Table5.Firm’scharacte
risticsandperformance
Turnover
Produ
ction
Labour
Cos
tof
Labour
Other
#of
(log)
(log)
productivity
labour
costper
cost
employed
Firm’scharacteristics
(log)
(lo
g)
worker
(log)
workers
(log)
(log)
Firmsize
Micro(employees<10)
10.816
10.36
7
8.463
8.716
6.806
22.401
1.906
(1.267)***
(1.30
0)***
(1.301)***
(.856)***
(.851)***
(6.952)***
(.229)***
Smalland
medium(11<=employees<=
100)
12.721
12.34
6
8.984
10.607
7.258
29.491
3.347
(1.530)***
(1.45
9)***
(1.337)***
(1.078)***
(.826)*
(8.159)***
(.612)***
Large(employees>100)
15.759
15.02
0
8.637
13.519
7.147
40.837
6.369
(1.434)***
(1.41
6)***
(1.257)*
(1.037)***
(.850)*
(7.383)***
(.885)***
Exporter
Exportingfirm
15.403
14.67
0
8.766
12.937
7.046
38.849
5.859
(.176)***
(.17
1)***
(.129)
(.160)***
(.077)
(.769)***
(.161)***
Non-exportingfirm
12.301
11.88
6
8.738
10.241
7.122
27.991
3.110
(.101)
(.10
1)
(.069)
(.088)
(.044)
(.484)
(.062)
Firmwithtermloans
Firmwithtermloans
13.449
12.97
9
9.039
11.135
7.211
31.152
3.905
(.220)**
(.21
3)**
(.135)**
(.190)
(.086)
(1.053)
(.156)
Firmwitho
uttermloans
12.969
12.48
7
8.667
10.860
7.075
30.612
3.770
(.121)
(.117)
(.068)
(.106)
(.043)
(.511)
(.094)

8/11/2019 Trade performance and competitiveness: Selected issues relevant for Asian developing economies
http://slidepdf.com/reader/full/trade-performance-and-competitiveness-selected-issues-relevant-for-asian-developing 189/215
169
Table5. (
c o n t i n u e d )
Turnover
Produ
ction
Labour
Cos
tof
Labour
Other
#of
(log)
(log)
productivity
labour
costper
cost
employed
Firm’scharacteristics
(log)
(lo
g)
worker
(log)
workers
(log)
(log)
Firm’sequity
stake
100%dom
esticallyowned
12.019
11.64
3
8.630
9.976
6.989
26.259
2.975
(1.796)***
(1.77
4)***
(1.246)
(1.567)***
(.798)***
(8.313)***
(1.211)***
100%foreign-owned
14.955
14.28
2
8.853
12.653
7.238
39.297
5.382
(2.110)***
(1.99
2)***
(1.433)
(1.859)***
(.954)***
(8.059)***
(1.878)***
Jointventu
re
14.783
14.18
5
9.342
12.407
7.568
36.046
4.759
(1.950)***
(1.96
8)***
(1.353)***
(1.499)***
(.775)***
(10.462)***
(1.577)***
Firmtype
Manufactu
ring
15.183
14.47
6
8.596
12.86
16.961
37.725
5.899
(2.073)***
(1.92
8)***
(1.201)
(1.772)***
(.765)
(10.335)***
(1.638)***
Trade
12.176
11.71
5
9.107
9.704
7.101**
26.396
2.604
(2.044)
(1.99
8)
(1.535)***
(1.309)
(.678)
(8.228)
(.860)
Tourism
12.116
11.72
0
8.518
10.081
6.923
27.926
3.151
(1.659)
(1.68
2)
(.952)
(1.686)
(.863)**
(8.628)
(1.138)
Other
12.630
12.19
7
8.885
10.794
7.495
30.065
3.275
(2.155)
(2.05
3)
(1.547)
(1.804)
(.972)
(9.974)
(1.358)

8/11/2019 Trade performance and competitiveness: Selected issues relevant for Asian developing economies
http://slidepdf.com/reader/full/trade-performance-and-competitiveness-selected-issues-relevant-for-asian-developing 190/215
170
Table5. (
c o n t i n u e d )
Turnover
Produ
ction
Labour
Cos
tof
Labour
Other
#of
(log)
(log)
productivity
labour
costper
cost
employed
Firm’scharacteristics
(log)
(lo
g)
worker
(log)
workers
(log)
(log)
Geographica
llocation
Battamban
g
11.446
11.22
1
8.269
9.230
6.278
21.682
2.951
(1.884)
(1.81
6)
(.963)
(2.261)
(1.218)
(8.290)
(1.465)
SiemReap
12.393
11.97
4
8.530
10.454
7.032
28.272
3.422
(1.636)
(1.71
6)
(1.009)
(1.610)
(.718)
(7.068)
(1.214)
PhnomPe
nh
13.310
12.80
7
8.822
11.111
7.159
31.720
3.930
(2.423)
(2.27
6)
(1.383)
(2.101)
(.873)
(10.528)
(1.909)
KampongCham
12.066
12.19
8
9.319
9.299
6.574
25.171
2.723
(2.778)
(2.71
6)
(1.221)
(2.142)
(.571)
(11.172)
(1.776)
Other
11.723
11.22
1
8.083
9.920
6.782
24.702
3.138
(2.129)
(2.07
2)
(.797)
(1.876)
(.561)
(10.627)
(1.548)
Firm’sinform
ationaboutSEZ
Yes
13.897
13.32
9
9.123
11.451
7.273
33.623
4.171
(.146)***
(.14
3)***
(.096)***
(.130)***
(.056)***
(.653)***
(.123)***
No
12.356
11.95
6
8.422
10.453
6.957
28.202
3.476
(.139)
(.13
6)
(.071)
(.125)
(.051)
(.607)
(.104)
S o u r c e :
Auth
or’scalculation.Figuresinbracketsarestandarddeviationsexceptfiguresforexporterandfirm’sinformationonSEZ,whichare
standarderrors.
***indicates1%significantlevel,**5
%level,*10%level.
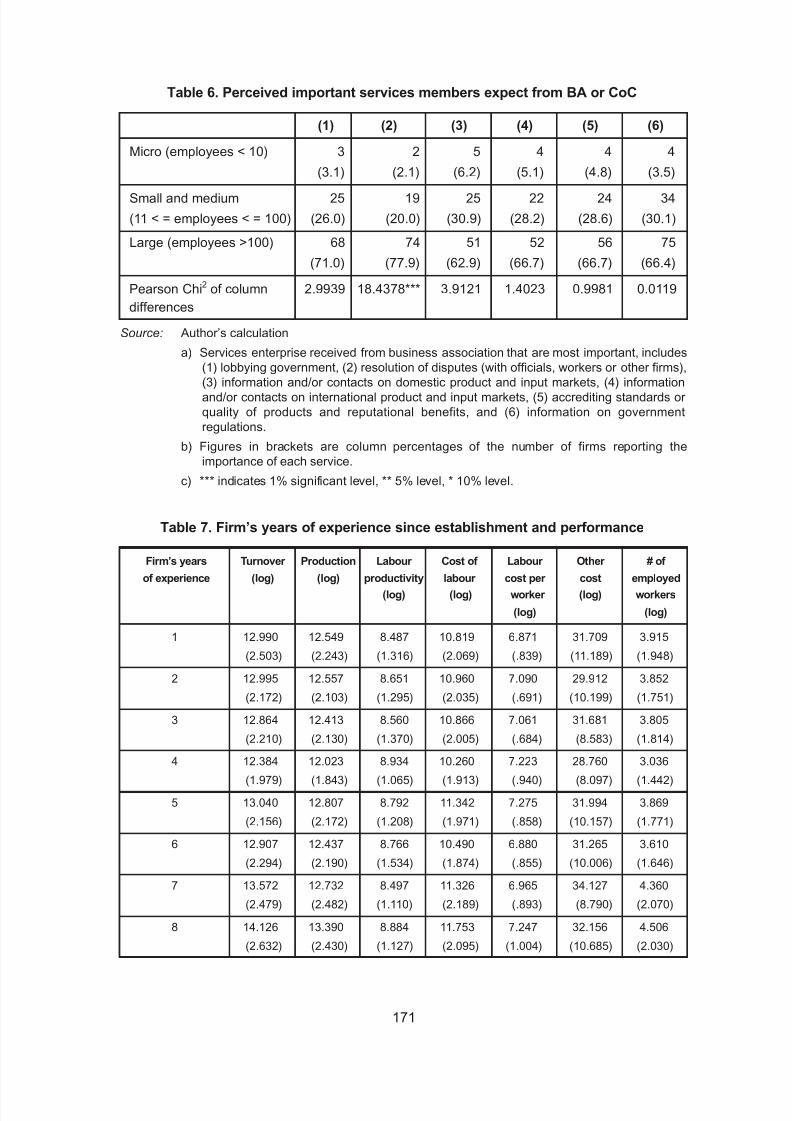
8/11/2019 Trade performance and competitiveness: Selected issues relevant for Asian developing economies
http://slidepdf.com/reader/full/trade-performance-and-competitiveness-selected-issues-relevant-for-asian-developing 191/215
171
Table 6. Perceived important services members expect from BA or CoC
(1) (2) (3) (4) (5) (6)
Micro (employees < 10) 3 2 5 4 4 4
(3.1) (2.1) (6.2) (5.1) (4.8) (3.5)Small and medium 25 19 25 22 24 34
(11 < = employees < = 100) (26.0) (20.0) (30.9) (28.2) (28.6) (30.1)
Large (employees >100) 68 74 51 52 56 75
(71.0) (77.9) (62.9) (66.7) (66.7) (66.4)
Pearson Chi2 of column 2.9939 18.4378*** 3.9121 1.4023 0.9981 0.0119
differences
Source: Author’s calculation
a) Services enterprise received from business association that are most important, includes(1) lobbying government, (2) resolution of disputes (with officials, workers or other firms),(3) information and/or contacts on domestic product and input markets, (4) informationand/or contacts on international product and input markets, (5) accrediting standards or quality of products and reputational benefits, and (6) information on governmentregulations.
b) Figures in brackets are column percentages of the number of firms reporting theimportance of each service.
c) *** indicates 1% significant level, ** 5% level, * 10% level.
Table 7. Firm’s years of experience since establishment and performance
Firm’s years Turnover Production Labour Cost of Labour Other # of
of experience (log) (log) productivity labour cost per cost employed
(log) (log) worker (log) workers
(log) (log)
1 12.990 12.549 8.487 10.819 6.871 31.709 3.915
(2.503) (2.243) (1.316) (2.069) (.839) (11.189) (1.948)
2 12.995 12.557 8.651 10.960 7.090 29.912 3.852
(2.172) (2.103) (1.295) (2.035) (.691) (10.199) (1.751)
3 12.864 12.413 8.560 10.866 7.061 31.681 3.805
(2.210) (2.130) (1.370) (2.005) (.684) (8.583) (1.814)
4 12.384 12.023 8.934 10.260 7.223 28.760 3.036
(1.979) (1.843) (1.065) (1.913) (.940) (8.097) (1.442)
5 13.040 12.807 8.792 11.342 7.275 31.994 3.869
(2.156) (2.172) (1.208) (1.971) (.858) (10.157) (1.771)
6 12.907 12.437 8.766 10.490 6.880 31.265 3.610
(2.294) (2.190) (1.534) (1.874) (.855) (10.006) (1.646)
7 13.572 12.732 8.497 11.326 6.965 34.127 4.360(2.479) (2.482) (1.110) (2.189) (.893) (8.790) (2.070)
8 14.126 13.390 8.884 11.753 7.247 32.156 4.506
(2.632) (2.430) (1.127) (2.095) (1.004) (10.685) (2.030)
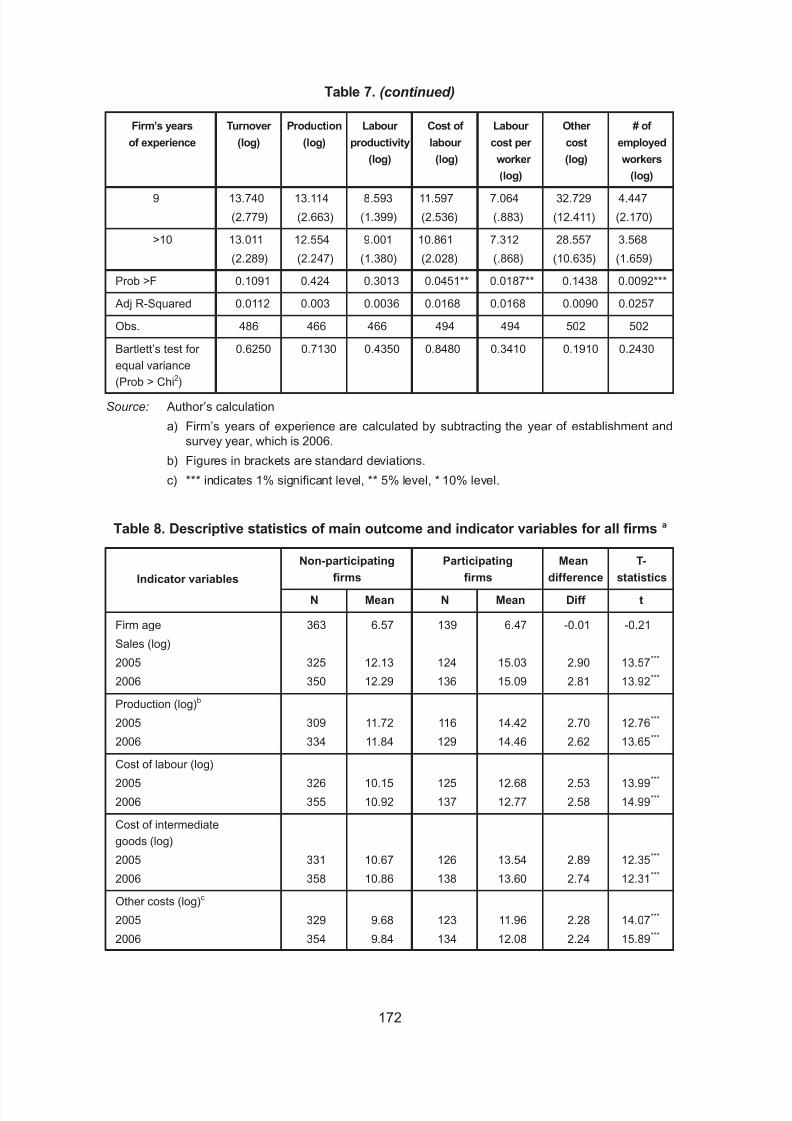
8/11/2019 Trade performance and competitiveness: Selected issues relevant for Asian developing economies
http://slidepdf.com/reader/full/trade-performance-and-competitiveness-selected-issues-relevant-for-asian-developing 192/215
172
9 13.740 13.114 8.593 11.597 7.064 32.729 4.447
(2.779) (2.663) (1.399) (2.536) (.883) (12.411) (2.170)
>10 13.011 12.554 9.001 10.861 7.312 28.557 3.568
(2.289) (2.247) (1.380) (2.028) (.868) (10.635) (1.659)
Prob >F 0.1091 0.424 0.3013 0.0451** 0.0187** 0.1438 0.0092***
Adj R-Squared 0.0112 0.003 0.0036 0.0168 0.0168 0.0090 0.0257
Obs. 486 466 466 494 494 502 502
Bartlett’s test for 0.6250 0.7130 0.4350 0.8480 0.3410 0.1910 0.2430
equal variance
(Prob > Chi2)
Source: Author’s calculation
a) Firm’s years of experience are calculated by subtracting the year of establishment andsurvey year, which is 2006.
b) Figures in brackets are standard deviations.
c) *** indicates 1% significant level, ** 5% level, * 10% level.
Table 7. (continued)
Firm’s years Turnover Production Labour Cost of Labour Other # of
of experience (log) (log) productivity labour cost per cost employed
(log) (log) worker (log) workers
(log) (log)
Table 8. Descriptive statistics of main outcome and indicator variables for all firmsa
Non-participating Participating Mean T-
Indicator variables firms firms difference statistics
N Mean N Mean Diff t
Firm age 363 6.57 139 6.47 -0.01 -0.21
Sales (log)
2005 325 12.13 124 15.03 2.90 13.57***
2006 350 12.29 136 15.09 2.81 13.92***
Production (log)b
2005 309 11.72 116 14.42 2.70 12.76***
2006 334 11.84 129 14.46 2.62 13.65***
Cost of labour (log)
2005 326 10.15 125 12.68 2.53 13.99***
2006 355 10.92 137 12.77 2.58 14.99***
Cost of intermediate
goods (log)
2005 331 10.67 126 13.54 2.89 12.35***
2006 358 10.86 138 13.60 2.74 12.31***
Other costs (log)c
2005 329 9.68 123 11.96 2.28 14.07***
2006 354 9.84 134 12.08 2.24 15.89***

8/11/2019 Trade performance and competitiveness: Selected issues relevant for Asian developing economies
http://slidepdf.com/reader/full/trade-performance-and-competitiveness-selected-issues-relevant-for-asian-developing 193/215
173
Table 8. (continued)
Non-participating Participating Mean T-
Indicator variables firms firms difference statistics
N Mean N Mean Diff t
Productivity (production/labour)
(log)
2005 304 8.59 118 9.11 0.52 3.64***
2006 332 8.66 128 8.91 0.25 1.94***
Labour cost per worker (log)
2005 325 7.11 124 7.22 0.11 1.20
2006 347 7.09 132 7.27 0.17 2.21**
Number of permanent workers
(log)
2005 344 2.97 130 5.39 2.41 14.51***
2006 359 3.09 139 5.52 2.43 15.26***
Total permanent skilled 171 67.48 86 60.34 -7.15 -1.39
employees received
training (%)
Foreign nationals of the total 355 0.75 137 8.71 7.97 7.35***
Number of customers (log) 249 1.77 58 1.89 .12 1.59
Senior management time
(in dealing with government
requirement) (%)
2004 297 8.81 116 12.11 3.29 1.50
2006 359 8.79 139 13.20 4.41 2.18***
Educational levels of
employees
Primary school 346 15.61 139 37.46 21.76 7.27***
(below grade 6) (%)
Up to Lower Secondary 360 25.67 136 21.15 -4.53 -2.13***
(grade 7-9) (%)
Up to Upper Secondary 359 27.42 135 18.77 -8.65 -4.01***
(grade 10-12) (%)Up to Universities & 360 28.053 139 19.316 -8.74 -2.85***
institutions (%)
Source: Author’s calculation
a) Independent t-tests are used to test the mean differences of a number of outcomevariables (in logarithms), other characteristics of member firms in BAs and those of non-member firms. Bartlett’s test of the null hypothesis of equal variance is calculated.
b) Other costs of production include costs of electricity, fuel, water, communication services,transportation, rents, and repairs and maintenance. Mean differences are the differencesbetween outcome indicators of firms who are members of BAs or Chamber of Commerceand those of firms who are non-members.
c) Values of total sales, production and productivity in 2005 are inflated using Consumer Price Index calculate by the National Institute of Statistics, Cambodia. In 2005, annualaverage CPI is 115.20 and 120.63 in 2006. July-December 2000 is based year.
*** indicates that the mean differences are significant at 1% level, ** at 5% level and* 10% level.
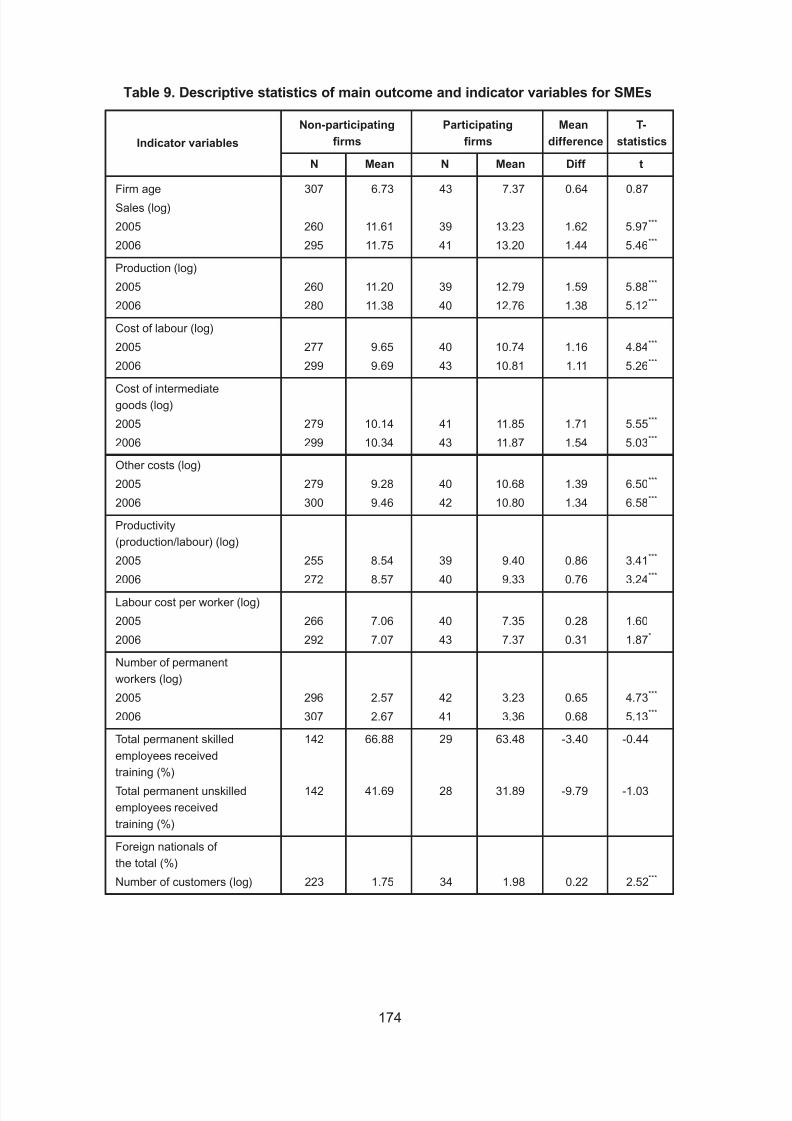
8/11/2019 Trade performance and competitiveness: Selected issues relevant for Asian developing economies
http://slidepdf.com/reader/full/trade-performance-and-competitiveness-selected-issues-relevant-for-asian-developing 194/215
174
Table 9. Descriptive statistics of main outcome and indicator variables for SMEs
Non-participating Participating Mean T-
Indicator variables firms firms difference statistics
N Mean N Mean Diff t
Firm age 307 6.73 43 7.37 0.64 0.87
Sales (log)
2005 260 11.61 39 13.23 1.62 5.97***
2006 295 11.75 41 13.20 1.44 5.46***
Production (log)
2005 260 11.20 39 12.79 1.59 5.88***
2006 280 11.38 40 12.76 1.38 5.12***
Cost of labour (log)
2005 277 9.65 40 10.74 1.16 4.84***
2006 299 9.69 43 10.81 1.11 5.26***
Cost of intermediate
goods (log)
2005 279 10.14 41 11.85 1.71 5.55***
2006 299 10.34 43 11.87 1.54 5.03***
Other costs (log)
2005 279 9.28 40 10.68 1.39 6.50***
2006 300 9.46 42 10.80 1.34 6.58***
Productivity
(production/labour) (log)
2005 255 8.54 39 9.40 0.86 3.41***
2006 272 8.57 40 9.33 0.76 3.24***
Labour cost per worker (log)
2005 266 7.06 40 7.35 0.28 1.60
2006 292 7.07 43 7.37 0.31 1.87*
Number of permanent
workers (log)
2005 296 2.57 42 3.23 0.65 4.73***
2006 307 2.67 41 3.36 0.68 5.13***
Total permanent skilled 142 66.88 29 63.48 -3.40 -0.44
employees received
training (%)
Total permanent unskilled 142 41.69 28 31.89 -9.79 -1.03
employees received
training (%)
Foreign nationals of
the total (%)
Number of customers (log) 223 1.75 34 1.98 0.22 2.52***
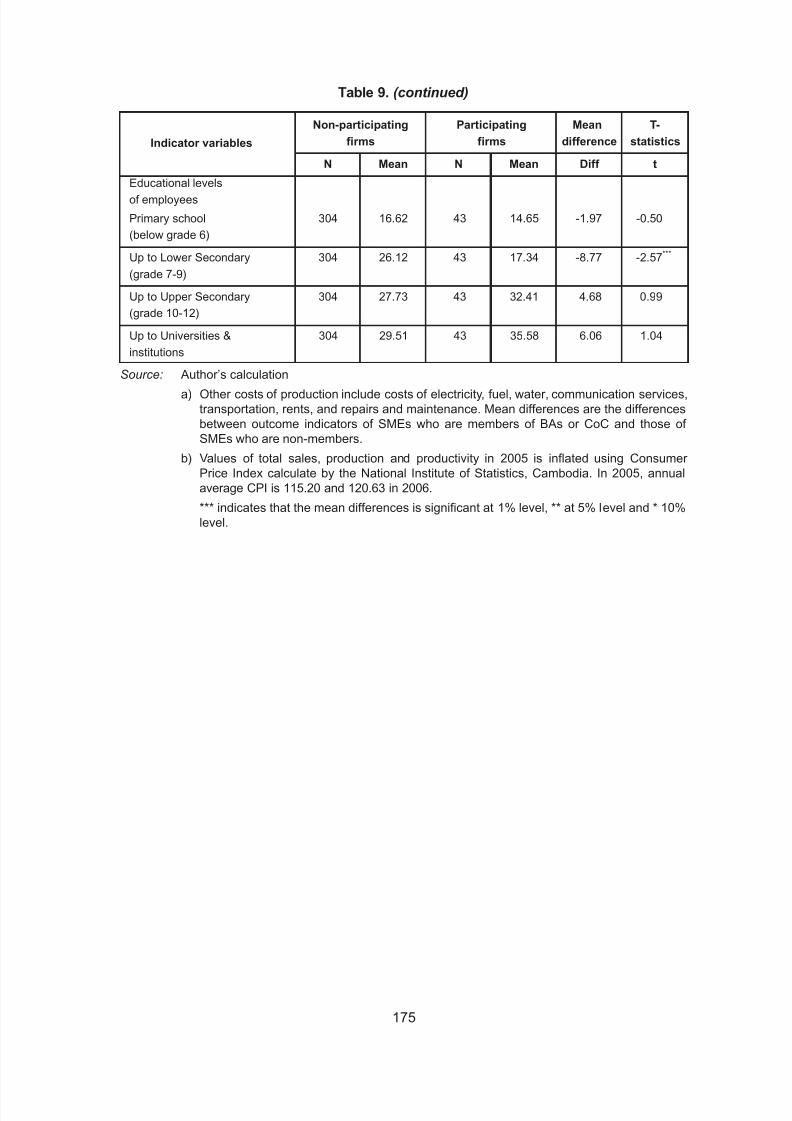
8/11/2019 Trade performance and competitiveness: Selected issues relevant for Asian developing economies
http://slidepdf.com/reader/full/trade-performance-and-competitiveness-selected-issues-relevant-for-asian-developing 195/215
175
Educational levels
of employees
Primary school 304 16.62 43 14.65 -1.97 -0.50
(below grade 6)
Up to Lower Secondary 304 26.12 43 17.34 -8.77 -2.57***
(grade 7-9)
Up to Upper Secondary 304 27.73 43 32.41 4.68 0.99
(grade 10-12)
Up to Universities & 304 29.51 43 35.58 6.06 1.04
institutionsSource: Author’s calculation
a) Other costs of production include costs of electricity, fuel, water, communication services,transportation, rents, and repairs and maintenance. Mean differences are the differencesbetween outcome indicators of SMEs who are members of BAs or CoC and those of SMEs who are non-members.
b) Values of total sales, production and productivity in 2005 is inflated using Consumer Price Index calculate by the National Institute of Statistics, Cambodia. In 2005, annualaverage CPI is 115.20 and 120.63 in 2006.
*** indicates that the mean differences is significant at 1% level, ** at 5% level and * 10%level.
Table 9. (continued)
Non-participating Participating Mean T-
Indicator variables firms firms difference statistics
N Mean N Mean Diff t
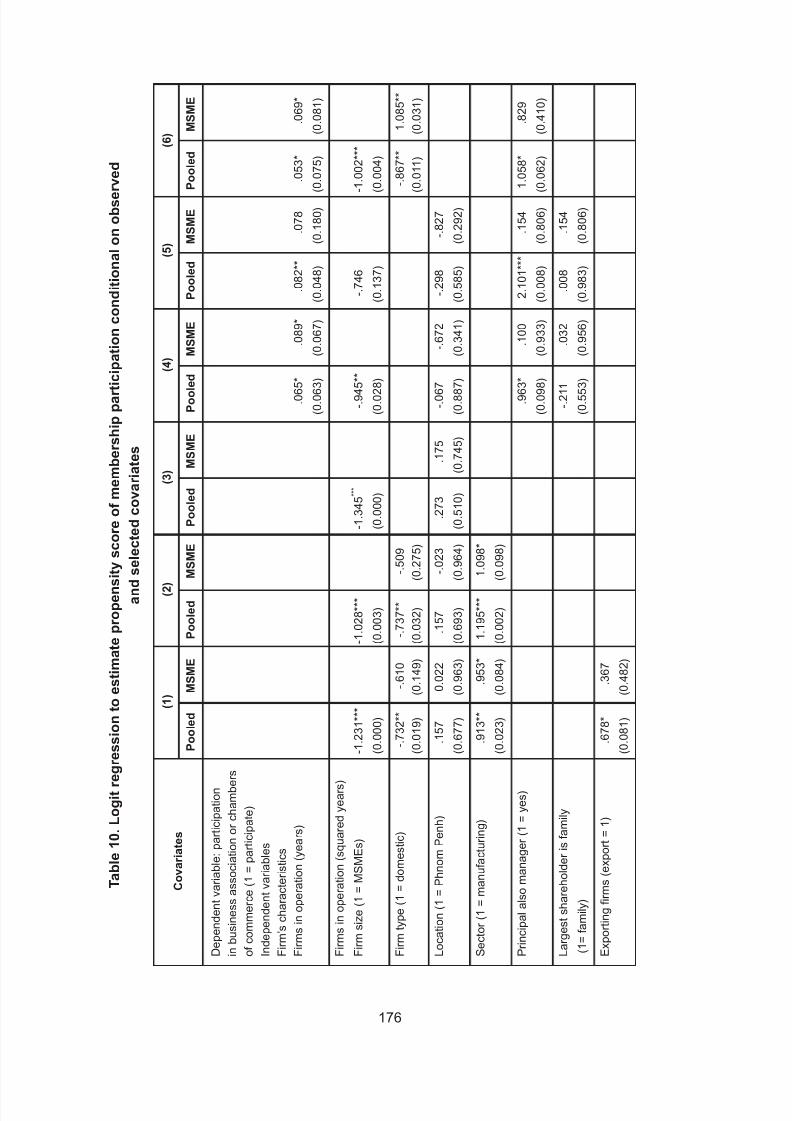
8/11/2019 Trade performance and competitiveness: Selected issues relevant for Asian developing economies
http://slidepdf.com/reader/full/trade-performance-and-competitiveness-selected-issues-relevant-for-asian-developing 196/215
176
T
able10.Logitregressiontoestimatepropensityscor
eofmembershipparticipationconditionalonobserve
d
andselecte
dcovariates
C
ovariates
(1)
(2)
(3)
(4)
(5)
(6)
Pooled
MSME
Pooled
MSME
Pooled
MSME
Pooled
M
SME
Pooled
MSME
Pooled
MSME
Dependentvariable:participation
inbusinessas
sociationorchambers
ofcommerce(
1=participate)
Independentv
ariables
Firm’scharacteristics
Firmsinopera
tion(years)
.065*
.089*
.082**
.078
.0
53*
.069*
(0.063)
(0.067)
(0.048)
(0.180)
(0.0
75)
(0.081)
Firmsinopera
tion(squaredyears)
Firmsize(1=
MSMEs)
-1.231***
-1.028***
-1.345
* * *
-.945**
-.746
-1.0
02***
(0.000)
(0.003)
(0.000)
(0.028)
(0.137)
(0.0
04)
Firmtype(1=
domestic)
-.732**
-.610
-.737**
-.509
-.8
67**
1.085**
(0.019)
(0.149)
(0.032)
(0.275)
(0.0
11)
(0.031)
Location(1=P
hnomPenh)
.157
0.022
.157
-.023
.273
.175
-.067
-.672
-.298
-.827
(0.677)
(0.963)
(0.693)
(0.964)
(0.510)
(0.745)
(0.887)
(0.341)
(0.585)
(0.292)
Sector(1=ma
nufacturing)
.913**
.953*
1.195***
1.098*
(0.023)
(0.084)
(0.002)
(0.098)
Principalalsomanager(1=yes)
.963*
.100
2.101***
.154
1.0
58*
.829
(0.098)
(0.933)
(0.008)
(0.806)
(0.0
62)
(0.410)
Largestshareholderisfamily
-.211
.032
.008
.154
(1=family)
(0.553)
(0.956)
(0.983)
(0.806)
Exportingfirms(export=1)
.678*
.367
(0.081)
(0.482)

8/11/2019 Trade performance and competitiveness: Selected issues relevant for Asian developing economies
http://slidepdf.com/reader/full/trade-performance-and-competitiveness-selected-issues-relevant-for-asian-developing 197/215
177
Table10.
( c o n t i n u e d )
C
ovariates
(1)
(2)
(3)
(4)
(5)
(6)
Pooled
MSME
Pooled
MSME
Pooled
MSME
Pooled
M
SME
Pooled
MSME
Po
oled
MSME
Productassha
reofnational
.030**
.057***
.026*
.048**
.0
26**
.031*
market(%)
(0.025)
(0.007)
(0.103)
(0.050)
(0.0
26)
(0.059)
Totalfemalepermanentworkers(%)
.015**
-.003
.016**
-.005
(0.026)
(0.762)
(0.054)
(0.688)
Productassha
reoflocalmarket(%)
-.035***
-.047**
-.034**
-.045**
.0
31***
-.031
(0.004)
(0.013)
(0.017)
(0.031)
(0.0
03)
(0.039)
Ownorsharegenerator(1=yes)
.634
*
.839
.509
.709
(0.079)
(0.131)
(0.214)
(0.243)
Mobilephoneuseinbusiness
-.826
.265
-.666
1.078
(1=yes)
(0.298)
(0.849)
(0.471)
(0.541)
Workforceuse
computer(%)
.006
.007
.006
.005
(0.242)
(0.369)
(0.307)
(0.546)
E-mailuseinb
usiness(1=yes)
.798
.390
.534
.130
(0.206)
(0.615)
(0.438)
(0.874)
Workforcebelongtounion(%)
.022***
0.037**
.022***
.019
.013*
.031*
.003
.021
0.0
18**
.027*
(0.001)
(0.019)
(0.003)
(0.301)
(0.079)
(0.102)
(0.682)
(0.394)
(0.0
12)
(0.059)
Informationon
firms’competitors,
1.131***
1.643***
1.287***
1.65***
.977**
1.295**
.807
1.316*
.7
88**
.791
uppliersandcustomers
(0.001)
(0.001)
(0.000)
(0.003)
(0.014)
(0.046)
(0.084)
(0.070)
(0.0
16)
(0.114)
#domesticcompetitors
(1=lessthan5)

8/11/2019 Trade performance and competitiveness: Selected issues relevant for Asian developing economies
http://slidepdf.com/reader/full/trade-performance-and-competitiveness-selected-issues-relevant-for-asian-developing 198/215
178
Table10.
( c o n t i n u e d )
Variables
(1)
(2)
(3)
(4)
(5)
(6)
Pooled
MSME
Pooled
MSME
Pooled
MSME
Pooled
M
SME
Pooled
MSME
Pooled
MSME
#foreigncomp
etitors
-.747**
-1.054**
-.987***
-1.20**
-.148
-.296
-.412
-.237
(1=lessthan5)
(0.015)
(0.018)
(0.003)
(0.014)
(0.681)
(0.608)
(0.322)
(0.709)
#domesticsuppliers
-.745**
-1.174***
-.395
-1.10**
-.360
-1.171**
-.345
-1.32**
(1=lessthan5)
(0.019)
(0.006)
(0.227)
(0.016)
(0.348)
(0.039)
(0.433)
(0.033)
#foreignsupp
liers(1=lessthan5)
-.054
-.169
-.068
-.433
(0.898)
(0.788)
(0.889)
(0.517)
#domesticcustomers
-.171
.051
-.413
-.113
(1=lessthan5)
(0.671)
(0.929)
(0.354)
(0.853)
Firms’salessolddomestically(%)
.003
(0.791)
Firms’salesexporteddirectly(%)
.002
-.001
.006
(0.633)
(0.967)
(0.228)
Firms’financia
linformation
Financialstate
mentreviewed
.278
.357
.288
.039
(1=yes)
(0.400)
(0.500)
(0.436)
(0.947)
Firms’termloa
ns(1=yes)
.830***
.955**
1.105***
1.178***
.858***
1.12***
.840**
1.111***
1.171***
1.342**
.7
71**
1.089**
(0.006)
(0.015)
(0.000)
(0.005)
(0.008)
(0.010)
(0.024)
(0.035)
(0.007)
(0.022)
(0.0
23)
(0.022)
Informationan
dperceptions
ongovernmen
tservicesdelivery
andothers
Investmentpro
spects
.282
.611
.555
.602
(1=optimistic)
(0.553)
(0.449)
(0.321)
(0.533)
Legalsystem(1=majorobstacle)
.243
.857
.345
.859
(0.496)
(0.112)
(0.392)
(0.147)
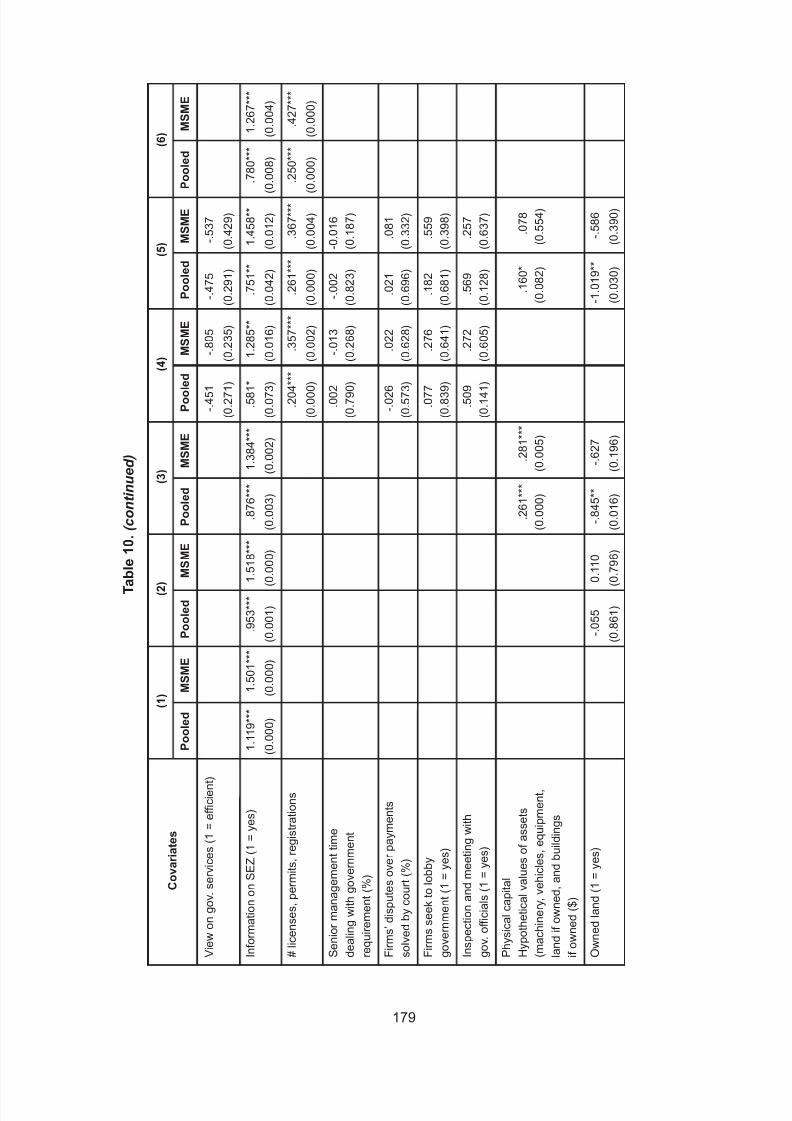
8/11/2019 Trade performance and competitiveness: Selected issues relevant for Asian developing economies
http://slidepdf.com/reader/full/trade-performance-and-competitiveness-selected-issues-relevant-for-asian-developing 199/215
179
Table10.
( c o n t i n u e d )
C
ovariates
(1)
(2)
(3)
(4)
(5)
(6)
Pooled
MSME
Pooled
MSME
Pooled
MSME
Pooled
M
SME
Pooled
MSME
Po
oled
MSME
Viewongov.s
ervices(1=efficient)
-.451
-.805
-.475
-.537
(0.271)
(0.235)
(0.291)
(0.429)
Informationon
SEZ(1=yes)
1.119***
1.501***
.953***
1.518***
.876***
1.384***
.581*
1.285**
.751**
1.458**
.7
80***
1.267***
(0.000)
(0.000)
(0.001)
(0.000)
(0.003)
(0.002)
(0.073)
(0.016)
(0.042)
(0.012)
(0.0
08)
(0.004)
#licenses,per
mits,registrations
.204***
.357***
.261***
.367***
.2
50***
.427***
(0.000)
(0.002)
(0.000)
(0.004)
(0.0
00)
(0.000)
Seniormanagementtime
.002
-.013
-.002
-0.016
dealingwithgo
vernment
(0.790)
(0.268)
(0.823)
(0.187)
requirement(%
)
Firms’disputesoverpayments
-.026
.022
.021
.081
solvedbycour
t(%)
(0.573)
(0.628)
(0.696)
(0.332)
Firmsseektolobby
.077
.276
.182
.559
government(1
=yes)
(0.839)
(0.641)
(0.681)
(0.398)
Inspectionand
meetingwith
.509
.272
.569
.257
gov.officials(1
=yes)
(0.141)
(0.605)
(0.128)
(0.637)
Physicalcapita
l
Hypotheticalvaluesofassets
.261***
.281***
.160*
.078
(machinery,ve
hicles,equipment,
(0.000)
(0.005)
(0.082)
(0.554)
landifowned,
andbuildings
ifowned($)
Ownedland(1
=yes)
-.055
0.110
-.845**
-.627
-1.019**
-.586
(0.861)
(0.796)
(0.016)
(0.196)
(0.030)
(0.390)

8/11/2019 Trade performance and competitiveness: Selected issues relevant for Asian developing economies
http://slidepdf.com/reader/full/trade-performance-and-competitiveness-selected-issues-relevant-for-asian-developing 200/215
180
Table10.
( c o n t i n u e d )
(1)
(2)
(3)
(4)
(5)
(6)
Pooled
MSME
Pooled
MSME
Pooled
MSME
Pooled
M
SME
Pooled
MSME
Pooled
MSME
Education
Firms’formalb
eyond-the-job
.512**
.719**
.614**
.789**
.508*
.959**
.517
1.091
*
training(1=ye
s)
(0.050)
(0.053)
(0.030)
(0.049)
(0.082)
(0.023)
(0.159)
(0.064)
Employeeswit
huniversity/institution
-.009
-.005
levelofeducat
ion(%)
(0.187)
(0.596)
_Cons
-1.573***
-3.159***-1.371***
-2.848***
-4.19***
-6.187***
-4.967***-6.186***-8.119***
-8.56**
-3.2
39***-5.280***
(0.002)
(0.000)
(0.010)
(0.000)
(0.000)
(0.000)
(0.001)
(0.010)
(0.000)
(0.013)
(0.0
00)
(0.000)
LRChi 2
197.870
38.26
218.73
61.34
196.48
61.76
225.20
97.68
224.12
90.43
208.40
81.72
Prob>Chi 2
0.0000
0.0000
0.0000
0.0000
0.0000
0.0000
0.0000
0
.0000
0.0000
0.0000
0.000
0.0000
PseudoR2
0.3340
0.1467
0.3754
0.2395
0.3759
0.2651
0.4347
0
.4141
0.4807
0.4228
0.3
979
0.3385
Obs.
502
350
496
347
448
319
447
315
406
291
453
321
BalancingPropertySatisfied
Yes
Yes
Yes
Yes
Yes
Yes
Yes
Yes
Yes
Yes
Yes
Yes
S o u r c e :
Auth
or’scalculation.Figuresinthebracketsarep-values.***indicatesthatthecoefficientsaresign
ificantat1%level,**at5%leveland*at10%
level.

8/11/2019 Trade performance and competitiveness: Selected issues relevant for Asian developing economies
http://slidepdf.com/reader/full/trade-performance-and-competitiveness-selected-issues-relevant-for-asian-developing 201/215
181
Table11.PSM
estimationres
ultsofmembershipsinbu
sinessassociationsorcha
mbersofcommerce(poole
d)
Outco
mevariables
(1)
(2)
(3)
(4)
(5)
(6)
NN
Kernel
NN
Kernel
NN
Kernel
NN
K
ernel
NN
Kernel
N
N
Kernel
Totalsales(lo
g)
0.25
0.33*
0.32
0.39
0.62
0.39***
0.44
-0.03
0.83
-0.02
0
.13
-0.01
(0.69)
(1.72)
(0.74)
(1.54)
(1.29)
(2.47)
(0.85)(-0.08)
(1.42)
(-0.05)
(0
.28)
(-0.02)
Totalproduction(log)
0.34
0.43*
0.39
0.45***
0.70*
0.42***
0.59
0.03
0.79
0.11
0
.20
0.07
(1.01)
(1.86)
(0.99)
(2.23)
(1.67)
(2.09)
(1.26)
(0.10)
(1.47)
(0.34)
(0
.49)
(0.23)
Labourproductivity(log)
0.07
-0.02
0.14
0.08
0.08
0.07
0.11
-0.05
0.04
0.18
-0
.13
-0.04
(0.31)
(-0.09)
(0.58)
(0.37)
(0.31)
(0.43)
(0.42)(-0.17)
(0.14)
(0.71)
(-0
.51)
(-0.18)
Costoflabour(log)
0.43
0.48***
0.24
0.41***
0.60
0.39*
0.50
0.10
0.70
-0.02
0
.33
0.09
(1.45)
(2.88)
(0.67)
(2.22)
(1.56)
(1.67)
(1.15)
(0.50)
(1.44)
(-0.08)
(0
.89)
(0.40)
Totalnumber
ofworkers(log)
0.32
0.52***
0.28
0.43***
0.63*
0.43*
0.50
0.10
0.76*
-0.06
0
.37
0.14
(1.25)
(3.37)
(0.82)
(2.12)
(1.76)
(1.90)
(1.30)
(0.39)
(1.81)
(-0.27)
(1
.14)
(0.61)
Labourcostp
erworker(log)
0.11
-0.01
-0.03
-0.01
-0.03
-0.03
0.01
0.01
-0.06
0.05
-0
.04
-0.04
(0.79)
(-0.09)
(-0.17)
(-0.05)
(0.20)
(-0.23)
(0.04)
(0.03)
(-0.28)
(0.28)
(-0
.27)
(-0.27)
Othercostof
production(log)
1.44
2.66***
1.79
2.28*
3.48*
1.66*
0.50
-0.69
-0.14
-1.75
0
.22
-0.32
(0.92)
(2.43)
(1.01)
(1.79)
(1.78)
(1.71)
(0.23)(-0.46)
(-0.05)
(-0.87)
(0
.12)
(-0.25)
S o u r c e :
Auth
or’scalculation.Figuresinbrack
etsaret-statistics.***indicatesthatcoefficientsaresignificantat1%level,**at5%leveland*at
10%level.

8/11/2019 Trade performance and competitiveness: Selected issues relevant for Asian developing economies
http://slidepdf.com/reader/full/trade-performance-and-competitiveness-selected-issues-relevant-for-asian-developing 202/215
182
T
able12.PSM
estimationre
sultsofmembershipsinbu
sinessassociationsorchambersofcommerce(SME
s)
Outco
mevariables
(1)
(2)
(3)
(4)
(5)
(6)
NN
Kernel
NN
Kernel
NN
Kernel
NN
K
ernel
NN
Kernel
N
N
Kernel
Totalsales(log
)
0.70***
1.00***
0.97***
1.00***
0.76
0.81***
0.78
1.12***
0.54
0.95***
0.20
0.92**
(2.39)
(4.69)
(2.36)
(2.84)
(1.46)
(2.58)
(1.21)
(
2.93)
(0.96)
(2.63)
(0
.37)
(2.13)
Totalproductio
n(log)
0.46*
0.82***
0.97***
0.87***
0.46
0.73***
0.58
0.89***
0.48
0.79*
0.17
0.78**
(1.73)
(3.24)
(2.59)
(2.66)
(1.32)
(2.60)
(1.08)
(
2.22)
(0.90)
(1.98)
(0
.32)
(2.38)
Labourproduc
tivity(log)
0.22
0.20
0.65***
0.34
0.83***
0.61*
0.20
0.32
0.57*
0.37
0.01
0.20
(1.19)
(0.77)
(2.75)
(1.25)
(2.98)
(1.91)
(0.58)
(
0.79)
(1.85)
(0.96)
(0
.02)
(0.55)
Costoflabour
(log)
0.68***
0.82***
0.43
0.64***
0.09
0.35
0.53
0.47*
-0.32
0.36
0.29
0.63**
(2.70)
(3.09)
(1.21)
(2.68)
(0.21)
(1.16)
(0.97)
(
1.70)
(-0.65)
(1.06)
(0
.64)
(2.36)
Totalnumbero
fworkers(log)
0.42***
0.66***
0.34
0.56***
-0.13
0.17
0.42
0.60***
0.001
0.46**
0.21
0.61**
(2.07)
(3.89)
(1.08)
(2.82)
(-0.33)
(0.88)
(0.93)
(
2.66)
(0.01)
(2.11)
(0.51)
(2.18)
Labourcostpe
rworker(log)
0.21
0.17
0.04
0.11
0.16
0.19
0.06
-
0.13
-0.26
-0.10
0.12
0.02
(1.67)
(1.11)
(0.28)
(0.57)
(0.84)
(1.25)
(0.28)
(-
0.71)
(-1.21)
(-0.49)
(0.62)
(0.10)
Othercostofp
roduction(log)
4.46***
5.27***
1.87
4.46***
-0.11
2.54**
2.52
2.35
0.98
2.99*
0.86
2.49
(3.41)
(5.45)
(1.13)
(2.68)
(-0.05)
(2.14)
(0.96)
(
1.23)
(0.38)
(1.91)
(0
.35)
(1.07)
S o u r c e :
Auth
or’scalculation.Figuresinbrack
etsaret-statistics.***indicatesthatcoefficientsaresignificantat
1%level,**at5%leveland*at
10%level.

8/11/2019 Trade performance and competitiveness: Selected issues relevant for Asian developing economies
http://slidepdf.com/reader/full/trade-performance-and-competitiveness-selected-issues-relevant-for-asian-developing 203/215
183
Table13.OLSestimationresultsofmembershipsi
nbusinessassociationsorchambersofcommerce
Outco
mevariables
(1)
(2)
(3)
(4)
(5)
(6)
Pooled
SME
Pooled
SME
Pooled
SME
Pooled
SME
Pooled
SME
Po
oled
SME
Totalsales(log
)
0.53***
0.91***
0.49***
0.74***
0.46***
0.45*
0.36*
0.49*
0.23
0.29
0.42**
0.65**
(2.83)
(3.43)
(2.59)
(2.70)
(2.40)
(1.67)
(1.83)
(
1.78)
(1.15)
(1.04)
(2.06)
(2.26)
Totalproductio
n(log)
0.54***
0.73***
0.51***
0.64***
0.49***
0.47*
0.31
0.31
0.22
0.19
0.43**
0.58**
(2.82)
(2.70)
(2.62)
(2.31)
(2.53)
(1.72)
(1.55)
(
1.08)
(1.05)
(0.68)
(2.11)
(1.98)
Labourproduc
tivity(log)
0.13
0.16
0.18
0.24
0.14
0.26
0.06
0.12
0.09
0.11
0.09
0.23
(0.82)
(0.72)
(1.08)
(1.03)
(0.40)
(1.08)
(0.33)
(
0.49)
(0.49)
(0.44)
(0.57)
(0.93)
Costoflabour
(log)
0.53***
0.73***
0.40***
0.48**
0.34**
0.24
0.278*
0.09
0.19
-0.04
0.37**
0.39*
(3.54)
(3.39)
(2.64)
(2.21)
(2.15)
(1.08)
(1.72)
(
0.42)
(1.12)
(-0.18)
(2.30)
(1.65)
Totalnumbero
fworkers(log)
0.46***
0.63***
0.37***
0.45***
0.38***
0.25*
0.30***
0.25*
0.18
0.14
0.38***
0.42***
(4.50)
(4.46)
(3.58)
(3.17)
(3.53)
(1.80)
(2.74)
(
1.68)
(1.58)
(1.00)
(3.29)
(2.66)
Labourcostpe
rworker(log)
0.07
0.12
0.05
0.05
-0.04
0.004
-0.02
-
0.15
0.01
-0.18
0.005
-0.02
(0.77)
(0.84)
(0.43)
(0.36)
(-0.32)
(0.03)
(-0.21)
(-
0.98)
(0.12)
(-1.13)
(0.05)
(-0.14)
Othercostofp
roduction(log)
3.32***
4.86***
3.08***
4.28***
2.29***
2.95***
1.91*
1.66
1.00
1.68
2.31**
2.68*
(3.53)
(3.61)
(3.58)
(3.46)
(2.70)
(2.47)
(1.84)
(
1.11)
(1.14)
(1.36)
(2.23)
(1.81)
S o u r c e :
Auth
or’scalculation.Figuresinbrack
etsaret-statistics.***indicatesthatcoefficientsaresignificantat1%level,**at5%leveland*at
10%level.

8/11/2019 Trade performance and competitiveness: Selected issues relevant for Asian developing economies
http://slidepdf.com/reader/full/trade-performance-and-competitiveness-selected-issues-relevant-for-asian-developing 204/215
184
T
able14.PSM
&OLSestimationresultsofmembershipsinbusinessassociation
sorchambersofcommerc
e
Outcomevariables
(1)
(2)
(3)
(4)
(5)
(6)
Pooled
SME
Pooled
SME
Pooled
SME
Pooled
SME
Pooled
SME
Po
oled
SME
Totalsales(log)
0.52***
0.86***
0.48**
0.72***
0.51***
0.43*
0.39**
0.63**
0.30
0.41
0.44**
0.71**
(2.72)
(3.18)
(2.48)
(2.68)
(2.67)
(1.59)
(1.95)
(2.11)
(1.39)
(1.36)
(2.12)
(2.34)
Totalproductio
n(log)
0.51***
0.67**
0.46**
0.60**
0.52
0.45*
0.36*
0.42
0.31
0.39
0.44**
0.65**
(2.64)
(2.45)
(2.42)
(2.26)
(2.62)
(1.63)
(1.83)
(1.42)
(1.40)
(1.29)
(2.16)
(2.15)
Labourproduc
tivity(log)
0.12
0.10
0.17
0.20
0.16
0.23
0.07
0.23
0.12
0.25
0.09
0.21
(0.73)
(0.44)
(0.99)
(0.88)
(0.95)
(0.99)
(0.43)
(0.94)
(0.61)
(0.93)
(0.49)
(0.83)
Costoflabour
(log)
0.56***
0.71***
0.39**
0.46**
0.35**
0.19
0.34**
0.15
0.24
0.09
0.43***
0.52**
(3.70)
(3.30)
(2.54)
(2.10)
(2.16)
(0.85)
(2.18)
(0.57)
(1.33)
(0.03)
(2.71)
(2.17)
Totalnumbero
fworkers(log)
0.45***
0.63***
0.34***
0.45
0.39***
0.24*
0.32***
0.21
0.21*
0.16
0.40***
0.48***
(4.30)
(4.48)
(3.29)
(3.06)
(3.43)
(1.69)
(2.74)
(1.30)
(1.78)
(1.02)
(3.42)
(3.04)
Labourcostpe
rworker(log)
0.13
0.10
0.06
0.03
-0.02
-0.33
0.02
-0.07
0.02
-0.16
0.05
0.04
(1.20)
(0.71)
(0.56)
(0.25)
(-0.23)
(-0.22)
(0.23)
(-0.43)
(0.16)
(-0.82)
(0.39)
(0.21)
Othercostofp
roduction(log)
3.25***
4.94***
2.87***
4.24***
2.19**
2.84**
2.04*
2.03
0.87
1.53
2.19**
2.64*
(3.49)
(3.59)
(3.32)
(3.50)
(2.48)
(2.27)
(1.89)
(1.24)
(0.91)
(1.15)
(2.10)
(1.68)
Regionofcom
monsupport
[0.0329-
[0.0230-
[0.0222-
[0.0131-
[0.0244-
[0.0116-
[0.0609-[0.0251-
[0.0273-
[0.0206-
[0.0425-
[0.0193-
0.9333]
0.5096]
0.9878]
0.9885]
0.9774]
0.9326]
1.0000]
1.000]
1.000]
1.000]
[1.000]
1.000]
S o u r c e :
Auth
or’scalculation.Figuresinbracketsaret-statistics.***indicatesthatcoefficientsaresignificantat1%level,**at5%leveland*at10%level.
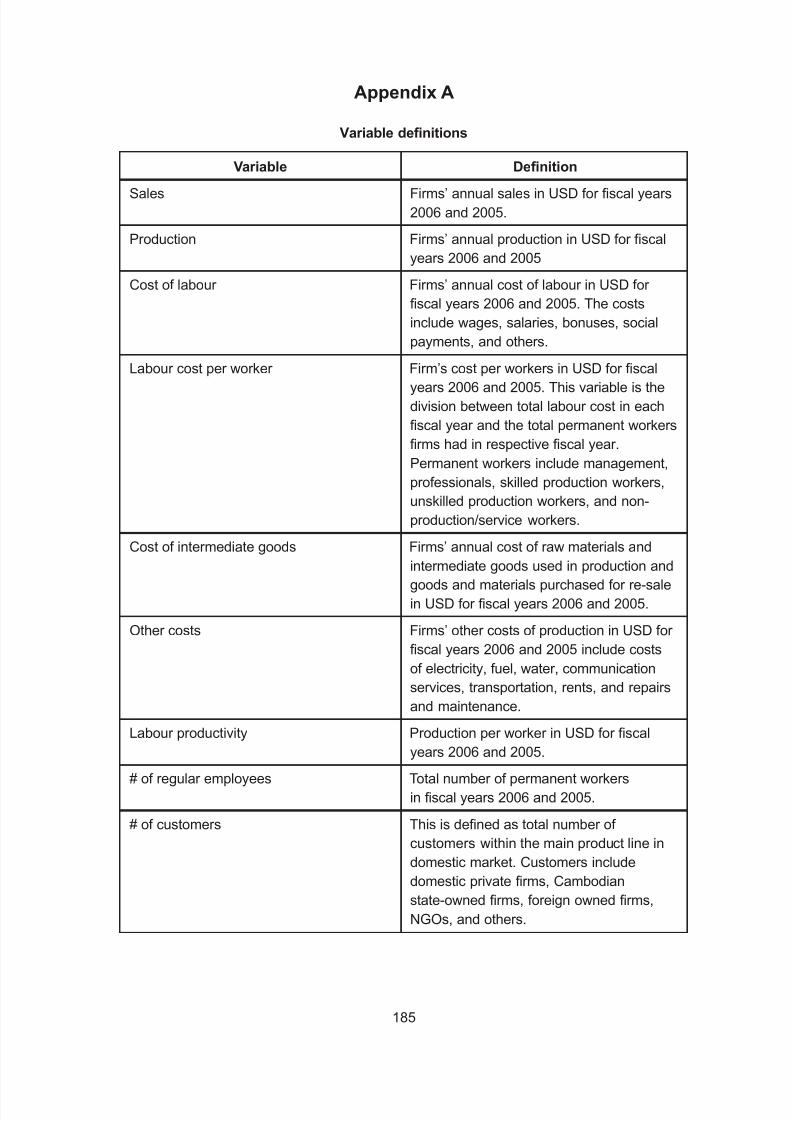
8/11/2019 Trade performance and competitiveness: Selected issues relevant for Asian developing economies
http://slidepdf.com/reader/full/trade-performance-and-competitiveness-selected-issues-relevant-for-asian-developing 205/215
185
Appendix A
Variable definitions
Variable Definition
Sales Firms’ annual sales in USD for fiscal years
2006 and 2005.
Production Firms’ annual production in USD for fiscal
years 2006 and 2005
Cost of labour Firms’ annual cost of labour in USD for
fiscal years 2006 and 2005. The costs
include wages, salaries, bonuses, social
payments, and others.
Labour cost per worker Firm’s cost per workers in USD for fiscal
years 2006 and 2005. This variable is the
division between total labour cost in each
fiscal year and the total permanent workers
firms had in respective fiscal year.
Permanent workers include management,
professionals, skilled production workers,
unskilled production workers, and non-
production/service workers.
Cost of intermediate goods Firms’ annual cost of raw materials and
intermediate goods used in production and
goods and materials purchased for re-sale
in USD for fiscal years 2006 and 2005.
Other costs Firms’ other costs of production in USD for
fiscal years 2006 and 2005 include costs
of electricity, fuel, water, communication
services, transportation, rents, and repairs
and maintenance.Labour productivity Production per worker in USD for fiscal
years 2006 and 2005.
# of regular employees Total number of permanent workers
in fiscal years 2006 and 2005.
# of customers This is defined as total number of
customers within the main product line in
domestic market. Customers include
domestic private firms, Cambodian
state-owned firms, foreign owned firms,
NGOs, and others.

8/11/2019 Trade performance and competitiveness: Selected issues relevant for Asian developing economies
http://slidepdf.com/reader/full/trade-performance-and-competitiveness-selected-issues-relevant-for-asian-developing 206/215
186
Business Association membership A 0/1 dummy variable with “1” representing
firms’ membership in business association
or chamber of commerce and “0” otherwise.
Firm characteristics
Firm age The number of years that firms had been in
operation from establishment to April 2006.
Firms which started operation after April
2006 were terminated.
Investment prospect of firms This was taken from a question “what is
your [firms] prospect for investment in the
next 3 years?” The variable takes the value
of “1” if firms are optimistic and
“0” otherwise”.
Perceptions on legal system A categorical variable having three
or conflict resolution groups: 1 “no obstacle” 2 “minor obstacle”
and 3 “more obstacle”.
Efficiency of government service delivery A categorical variable having three
groups: 1 “Inefficient” 2 “Somewhat
efficient” and 3 “Efficient”.
Senior management time in dealing This is defined, in a typical week, as % of
with government requirements senior management’s time spent in dealing
with government requirements (e.g. taxes,customs, labour regulations, licensing and
registration) which includes dealing with
officials and completing forms.
Government lobby A 0/1 dummy variable that takes value “1” if
firms seek to lobby government or influence
content of laws or regulations affecting firms
and “0” otherwise.
Term loans with financial institution A 0/1 dummy variable taking value “1” if firms has term loan (more than 6 months)
from a bank or financial institution and “0”
otherwise.
Term loans with collateral A 0/1 dummy variable with “1” representing
that the financing requires collateral or a
deposit and 0 otherwise.
Formal training to permanent employees A 0/1 dummy variable having value “1” if
firms offer formal beyond the job training to
permanent employees and “0” otherwise.

8/11/2019 Trade performance and competitiveness: Selected issues relevant for Asian developing economies
http://slidepdf.com/reader/full/trade-performance-and-competitiveness-selected-issues-relevant-for-asian-developing 207/215
187
Permanent skilled employees received This is defined as the percentage of
training permanent skilled staff who received
formal training in 2006.
Permanent unskilled employees This is defined as the percentage of
received training permanent unskilled staff who receivedformal training in 2006.
Number of foreign nationals to Number of skilled workers who were
total employees foreign nationals in 2006.
Information on Special Economic Zones A 0/1 dummy variable taking value “1”
if firms have heard of and “0” otherwise.
Educational levels of employees The overall percentage of the workforce in
the firms who have the following
educational levels: Primary school (belowgrade 6), Up to Lower Secondary (grade
7-9), Up to Upper Secondary (grade
10-12), Up to University and Institutions.
Sector This variable contains four sectors:
Manufacturing (food, textiles, garments,
chemicals, plastics & rubber, basic metals
and fabricated metal products, machinery
and equipment, electronics, and others),
Trade (wholesale including export services,retail), Tourism (hotels and restaurants,
travel agencies, tour operators, etc.), and
Other (construction, transport, IT, etc.).
Firm size This variable defines two groups of firms:
Small and Medium Enterprises and Large
Enterprises. The number of regular
employees firms have in April 2006 and the
definition of firms given by the government
are used to derive these categories. Thisvariable assumes binary value with “1”
representing MSMEs and “0” LEs.
Location Battambang, Siem Reap, Phnom Penh,
and Kampong Cham
Exporting indicators Exporters and non-exporters
Equity stakes of firms Domestically-owned (100%), foreign-owned
(100%), and joint-venture
Source: Author’s preparation
8/11/2019 Trade performance and competitiveness: Selected issues relevant for Asian developing economies
http://slidepdf.com/reader/full/trade-performance-and-competitiveness-selected-issues-relevant-for-asian-developing 208/215
188
Referenc
Aerts, K., and D. Czarnitzki (2004). Using Innovation Survey Data to Evaluate R&D Policy:
The Case of Belgium, Discussion Paper No. 05-55. Centre for European Economic
Research. Mannheim. Aterido, R., M. Hallward-Driemeier and C. Pages (2009). Big Constraints to Small Firms’
Growth? Business Environment and Employment Growth across Firms, World Bank
Policy Research Working Paper 5032. World Bank. Washington D.C.
Ayyagari, M., A. Demirguc-Kunt and V. Maksimovic (2011). Small vs. Young Firms across
the World , World Bank Policy Research Working Paper 5631, World Bank,
Washington, D.C.
Ayyagari, M., A. Demirguc-Kunt and V. Maksimovic (2008). “How Important are Financing
Constraints? The Role of Finance in the Business Environment”, World Bank Economic Review , 22(3), pp. 483-516.
Baily, P., (2007). Cambodian Small and Medium Sized Enterprises: Constraints, Policies
and Proposals for their Development, ERIA Research Report, http://www.eria.org/
research/images/pdf/PDF%20No.5/No,5-1-Cambodian.pdf (accessed October
2011).
Batra, G., and S. Mahmood (2003). Direct Support to Private Firms: Evidence on
Effectiveness, World Bank Policy Research Working Paper 3170, World Bank,
Washington, D.C.
Beck, T., A. Demirguc-Kunt and M.S.M. Peria (2008), Bank Financing for SMEs around the
World: Drivers, Obstacles, Business Models, and Lending Practices, World Bank
Policy Research Working Paper 4785, World Bank, Washington, D.C.
Becker, G.S., (1985). “Public Policies, Pressure Groups, and Dead Weight Costs”, Journal
of Public Economics, 28; pp. 329-347.
Becker, S.O., and A. Ichino (2002). “Estimation of Average Treatment Effects Based on
Propensity Score”, Stata Journal , 2(4); pp. 358-377.
Bennett, R.J., (2008). SME Policy Support in Britain Since the 1990s: What have welearnt? Environment and Planning C: Government and Policy , 26; pp. 375-397.
Bennett, R.J., (2000). “The Logic of Membership of Sectoral Business Associations”,
Review of Social Economy , LVIII(1); pp. 18-42.
Bennett, R.J., (1999); “Business Routes of Influence in Brussels: Exploring the Choice of
Direct Representation”, Political Studies, XLVII; pp. 240-257.
Bennett, R.J., (1998). Business Associations and their Potential Contribution to the
Competitiveness of SMEs, Entrepreneurship & Regional Development , 10;
pp. 243-260.
Bennett, R.J., (1995). The Logic of Local Business Associations: An Analysis of Voluntary
Chambers of Commerce, Journal of Public Policy , 15(3); pp. 251-279.

8/11/2019 Trade performance and competitiveness: Selected issues relevant for Asian developing economies
http://slidepdf.com/reader/full/trade-performance-and-competitiveness-selected-issues-relevant-for-asian-developing 209/215
189
Bennett, R.J., and M. Ramsden (2007). The Contribution of Business Associations to
SMEs: Strategy, Bundling or Reassurance? International Small Business Journal ,
25(1); pp. 49-76.
Bernard, A.B., and J.B. Jensen (1997). “Exporters, Skill Upgrading, and the Wage Gap”,
Journal of International Economics, 42; pp. 3-31.
Biesebroeck, J.V., (2003). Exporting Raises Productivity in Sub-Saharan African
Manufacturing Plants, NBER Working Paper Series, No. 10020, BBER, Cambridge.
Black, D.A., and J.A. Smith (2004). How robust is the evidence on the effects of college
quality? Evidence from matching, Journal of Econometrics, 121; pp. 99-124.
Caliendo, M., and S. Kopeinig (2008). Some Practical Guidance for the Implementation of
Propensity Score Matching, Journal of Economic Surveys, 22(1); pp. 31-72.
Cambodian Federation of Employers and Business Associations (CAMFEBA) (2011). Types
of Membership, http://www.camfeba.com/en/membership/type-of-membership.html
(accessed June 2012).
Committee for Economic and Financial Policy (CEFP) (2011). Review Report on the
Implementation of the Policy Paper on the Promotion of Paddy Production and Rice
Export 2010-2011 (Phnom Penh: CEFP).
Chheang, Vannarith, Oum Sothea and Thearith Leng (2011). Constraints on SMEs in
Cambodia and their Participation in Production Network , http://eria.org/pdf/research/
y2009/no8/CH05_SMEs.pdf (accessed October 2011).
Council for the Development of Cambodia (CDC). (2005). Draft Outline of SME
Development Framework (Phnom Penh: CDC) http://www.mef.gov.kh/documents/
PFM/7cg_document/draft_outline_sme.htm (accessed 2 May 2011).
Criscuolo, C., R. Martin, H. Overman and J.V. Reenen (2007). “The Effects of Industrial
Policy on Corporate Performance: Evidence from Panel Data”, Centre for Economic
Performance, London School of Economics.
Czarnitzki, D., and H. Hottenrott (2011). R&D investment and financing constraint of small
and medium-sized firms, Small Business Economics, 36; pp. 65-83.
Dinh, H.T., A. Mavrids, A. Dimitris and H.B. Nguyen (2010). The Binding Constraint on
Firms’ Growth in Developing Countries, Policy Research Working Paper, No. 5485,
World Bank, Washington, D.C.
Doner, R.F., and B.R. Schneider (2000). Business Associations and Economic
Development: Why Some Associations Contribute More Than Others, Business and
Politics, 2(3); pp.261-288.
Doner, R.F., and B.R. Schneider (1999). Business Associations and Economic
Development , Institute for Policy Research Working Paper WP-99-12, Institute for
Policy Research, North-Western University.

8/11/2019 Trade performance and competitiveness: Selected issues relevant for Asian developing economies
http://slidepdf.com/reader/full/trade-performance-and-competitiveness-selected-issues-relevant-for-asian-developing 210/215
190
The Federation of Association of Small and Medium Enterprises of Cambodia (FASMEC)
(2010). Constitution of the Federation of Association of Small and Medium
Enterprises of Cambodia (Phnom Penh: FASMEC), http://fasmec.com/images/
pictures/FASMEC_Constitution_EN.pdf (accessed 23 November 2011).
Germany Trade & Invest (2012). Investment Guide to Germany , http://www.gtai.de/GTAI/Content/EN/Invest/_SharedDocs/Downloads/GTAI/Brochures/Germany/investment-
guide-to-germany-2012.pdf (accessed July 2012).
Gertler, P.J., S. Martinez, P. Premand, L.B. Rawlings and C.M.J. Vermeersch (2011b).
“Chapter 7: Matching,” in Interactive Textbook on Impact Evaluation in Practice, the
International Bank for Reconstruction and Development; pp.107-116, World Bank,
Washington, D.C.
Goldsmith, A.A., (2000). Business Associations and Better Governance in Africa, Public
Administration and Development , 22; pp. 39-49.Han, L., and A. Benson (2010). The use and usefulness of financial assistance to UK
SMEs, Environment and Planning C: Government and Policy , 28; pp. 552-566.
Harner, S., (2003). Financing SMEs in Cambodia: Why do banks find it so difficult?http://
www.ifc.org/ifcext/mekongpsdf.nsf/AttachmentsByTitle/PSDP+14/$FILE/PSDP-No-
14-EN.pdf (accessed October 2011).
Harvie, C., D. Narjoko and S. Oum (2010). Firm Characteristic Determinants of SME
Participation in Production Network , Discussion Paper Series 11, ERIA, Jakarta.
Heckman, J., (1979). Sample Selection bias as a specification error, Econometrica, 47;
pp. 153-161.
Heckman, J., I. Hidehiko, J. Smith and P. Todd (1998). Characterizing Selection Bias Using
Experimental Data, Econometrica, 66(5); pp. 1017-1098.
Isgut, A.E., (2001). What’s Different about Exporters? Evidence from Colombian
Manufacturing, Journal of Development Studies, 37(5); pp. 57-82.
Khandker, S.R., G.B. Koolwal and H.A. Samad (2010). Chapter 4: Propensity Score
Matching, in Handbook on Impact Evaluation: Quantitative Methods and Practices,
the International Bank for Reconstruction and Development; pp. 53-69, World Bank,
Washington, D.C.
Lee, W.S., (2006). Evaluating the Effects of a Mandatory Government Program using
Matched Groups within a Similar Geographic Location, Melbourne Institute of
Applied Economic and Social Research, the University of Melbourne, Melbourne.
Levitsky, J., (1992). Private sector membership associations and support for SMEs, Small
Enterprises Development , 3(1); pp. 22-34.
Luna, M., and R. Tirado (2008). Business Associations and their contribution to knowledge
networks in Mexico, International Journal of Technology Management and
Sustainable Development , 7(3); pp.251-264.

8/11/2019 Trade performance and competitiveness: Selected issues relevant for Asian developing economies
http://slidepdf.com/reader/full/trade-performance-and-competitiveness-selected-issues-relevant-for-asian-developing 211/215
191
McCormick, L.E., J.D. Hawley and E. Meléndez (2008). The Economic and Workforce
Development Activities of American Business Associations, Economic Development
Quarterly , 22(3); pp. 213-227.
Meas, W.H., (2006). Characteristics of Small and Medium Enterprises in Cambodia: Case
Study of Rice Milling Enterprises, http://www.ncsb2006.se/pdf/Characteristics%20in%20Cambodia.pdf (accessed October 2011).
Mitchell, N.J., (1990). The Decentralization of Business in Britain, Journal of Politics, 52(2);
pp. 622-637.
Mole, K., M. Hart, S. Roper and D. Saal (2008). Differential Gains from Business Link
Support and Advise: A Treatment Effects Approach, EPC: Government and Policy ,
26; pp. 315-334, Pion Publishing, Great Britain.
Moore, M., and L. Hamalai (1993). Economic Liberalization, Political Pluralism, Business
Associations in Developing Countries, World Development , 21(12); pp.1895-1912.
Motohashi, K., (2002). Use of Plant-Level Micro-Data for the Evaluation of SME Innovation
Policy in Japan, Science, Technology and Industry Working Paper 2002/12, OECD,
Paris.
Nadvi, K., (1999). Industrial Clusters and Networks: Case Studies of SME Growth and
Innovation, Small and Medium Enterprise, UNIDO, Vienna.
National Institute of Statistics (NIS) (2011). Preliminary Results of 2011 Economic Census
of Cambodia, MoP, Phnom Penh.
National Institute of Statistics (NIS) (2008). NIS Statistical Yearbook 2008 (Phnom Penh:
MoP).
Oh, Inha, Lee Jeong Dong and Heshmati Almas (2009), Evaluation of credit guarantee
policy using propensity score matching Small Business Economics, 33;
pp. 335-351.
Olson, M., (1965). The Logic of Collective Action, Harvard University Press, Cambridge.
Perry, M., (2007). Trade Associations and Business Associability: Strengthening
contributions to business and economic development, New Zealand Centre for Small and Medium Enterprise Research, Massey University, New Zealand.
Royal Government of Cambodia (RGC) (2005). Small and Medium Enterprise Development
Framework , RGC, Phnom Penh.
Royal Government of Cambodia (RGC) (2004). Rectangular Strategy for Growth,
Employment, Equity and Efficiency in Cambodia, http://www.ilo.org/wcmsp5/groups/
public/—asia/—ro-bangkok/documents/genericdocument/wcms_100515.pdf
(accessed 2 May 2011).
Roper, S., and N. Hewitt-Dundas (2001). Grant Assistance and Small Firm Development inNorthern Ireland and the Republic of Ireland, Scottish Journal of Political Economy ,
48(1); pp. 99-117.
8/11/2019 Trade performance and competitiveness: Selected issues relevant for Asian developing economies
http://slidepdf.com/reader/full/trade-performance-and-competitiveness-selected-issues-relevant-for-asian-developing 212/215
192
Rosenbaum, P.R., and D.B. Rubin (1983). The Central Role of the Propensity Score in
Observational Studies for Causal Effects, Biometrika, 70(1); pp. 41-55.
SME Forum (2010). Minutes of the forum, General Department of Industry, Ministry of
Industry, Mines and Energy, Phnom Penh.
Salisbury, H., (1984). Interest Representation: The Dominance of Institutions, American
Political Science Review , 78(1); pp. 64-76.
Shariff, M.N.M., and C. Peou (2008). The Relationship of Entrepreneurship Values, Firm
Financing and the Management and Growth Performance of Small Medium
Enterprises in Cambodia, Problems and Perspectives in Management , 6(4);
pp. 55-64.
Spence, M.M., (2003). Evaluating Export Promotion Programmes: U.K. Overseas Trade
Missions and Export Performance, Small Business Economics, 20(1); pp. 83-103.
Stephanou, C., and C. Rodriguez (2008). Bank Financing to Small and Medium-Sized
Enterprises (SMEs) in Colombia, World Bank Policy Research Working Paper 4481,
World Bank, Washington, D.C.
Stiglitz, J.E., and A. Weiss (1981). Credit Rationing in Markets with Imperfect Information”,
American Economic Review , 71(3); pp. 393-410.
Sukiassyan, G., and J.B. Nugent. (2008). Associations versus Registration as Alternative
Strategies of Small Firms, Small Business Economics, 31; pp. 147-161.
Wilts, A., and M. Meyer (2005). Small Firm Membership in National Associations, Journal of
Public Affairs, 5(2); pp. 176-185.
World Bank (2012). Doing Business in a More Transparent World , World Bank,
Washington, D.C. http://www.doingbusiness.org/~/media/FPDKM/Doing%
20Business/Documents/Annual-Reports/English/DB12-FullReport.pdf (accessed
July 2012).
World Bank (2010). Evaluating SME Support Programs in Chile, in Gladys Lopez-Acevedo
& Hong W. Tan. (eds.), Impact Evaluation of Small and Medium Enterprise
Programs in Latin America and the Caribbean; pp.33-55, World Bank, Washington,
D.C.
World Bank (2007). World Bank Enterprise Surveys: Cambodia. https://www.enterprise
surveys.org/Portal/elibrary.aspx?libid=14 (accessed 6 June 2011).
World Bank (2007).Sampling Procedure Cambodia, http://microdata.worldbank.org/
index.php/catalog/634 (accessed August 2011).
Wren, C., and D.J. Storey (2002). Evaluating the Effect of Soft Business Support upon
Small and Firm Performance, Oxford Economic Papers, 54; pp. 334-365.
Zecchini, S., and M. Ventura (2009). The Impact of Public Guarantees on Credit to SMEs,
Small Business Economics, 32; pp. 191-206.
Zhao, Z., (2005). Sensitivity of Propensity Score Methods to the Specifications, Discussion
Paper Series No. 1873, IZA, Bonn.
8/11/2019 Trade performance and competitiveness: Selected issues relevant for Asian developing economies
http://slidepdf.com/reader/full/trade-performance-and-competitiveness-selected-issues-relevant-for-asian-developing 213/215
193
ARTNeT publishes a wide range of publications dealing withvarious aspects of trade and investment
Policy Brief Series
Duty-Free, Quota-Free Trade for Asia-Pacific Least Developed Countries: Overview and
Update
Pedro J. Martinez Edo and Adam Heal, Brief No. 36, September 2013
Remittances, Migration and Inclusive Growth: The Case of Nepal
Nephil Matangi Maskay and Shiva Raj Adhikari, Brief No. 35, September 2013
Working Paper Series
Addressing Non-tariff Measures in ASEANGloria O. Pasadilla, ARTNeT Working Paper Series, No. 130, September 2013
Who Profits from Trade Facilitation Initiatives?
Bernard Hoekman and Ben Shepherd, ARTNeT Working Paper Series, No. 129,
September 2013
Books, research reports, briefing papers
A Handbook on Negotiating Preferential Trade Agreements: Services Liberalization
Pierre Sauvé and Simon Lacey
ARTNeT Census Briefing Paper on the European Union’s New Timber Regulations and the
Asia-Pacific
Teemu Alexander Puutio, Issue 1, March 2013
The Gravity Model of International Trade: A User Guide
Ben Shepherd, (ST/ESCAP/2645). 2012
For more information visit us at www.artnetontrade.org
8/11/2019 Trade performance and competitiveness: Selected issues relevant for Asian developing economies
http://slidepdf.com/reader/full/trade-performance-and-competitiveness-selected-issues-relevant-for-asian-developing 214/215
Printed in Bangkok United Nations publication
July 2014 – 200 Sales No. E.14.II.F.3
Copyright © United Nations 2013
ISBN: 978-92-1-120673-9
eISBN: 978-92-1-056600-1
ST/ESCAP/2686

8/11/2019 Trade performance and competitiveness: Selected issues relevant for Asian developing economies
http://slidepdf.com/reader/full/trade-performance-and-competitiveness-selected-issues-relevant-for-asian-developing 215/215