trade partnership w orldwide , llc
TRANSCRIPT

TRADE PARTNERSHIP WORLDWIDE, LLC Estimated Economic Effects of Proposed Import Relief Remedies for Steel
By
Joseph F. Francois, Ph.D.
And
Laura M. Baughman
December 19, 2001
Prepared for
The Consuming Industries Trade Action Coalition (CITAC) www.citac-trade.org
1001 CONNECTICUT AVENUE, NW • WASHINGTON, DC • 20036 202-347-1041 • 202-628-0669 (FAX)
Estimated Economic Effects of Proposed Import Relief Remedies for Steel
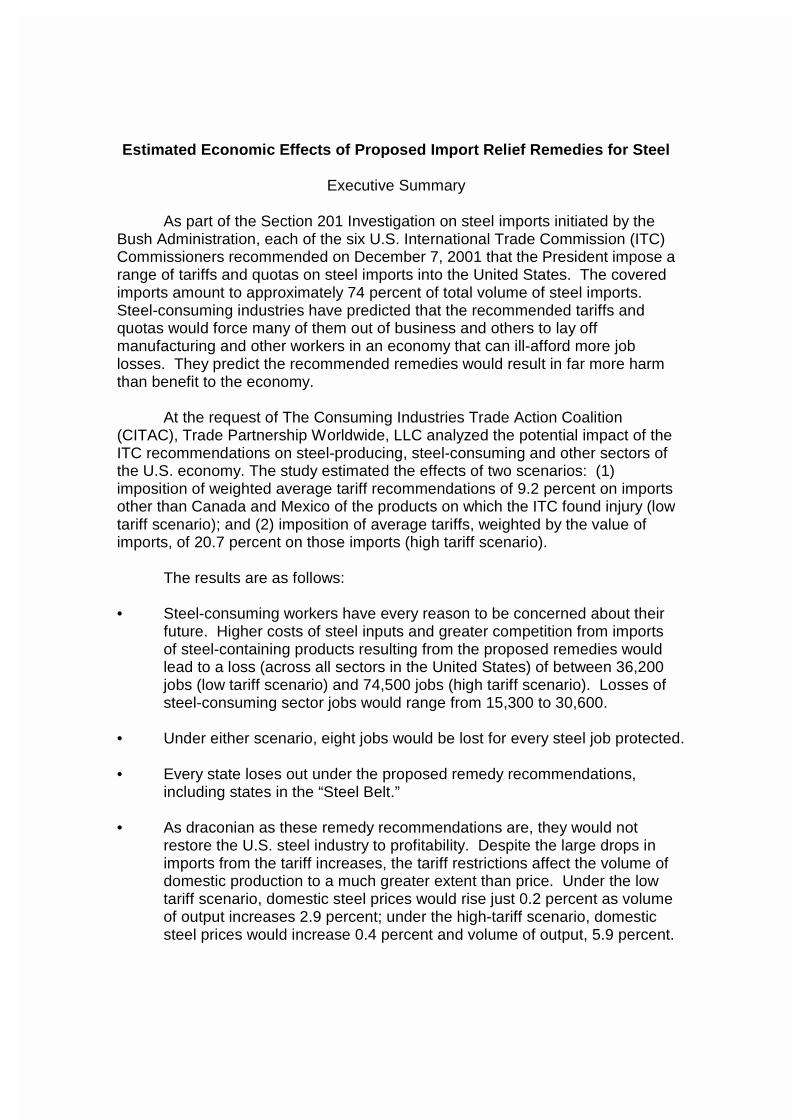
Executive Summary As part of the Section 201 Investigation on steel imports initiated by the Bush Administration, each of the six U.S. International Trade Commission (ITC) Commissioners recommended on December 7, 2001 that the President impose a range of tariffs and quotas on steel imports into the United States. The covered imports amount to approximately 74 percent of total volume of steel imports. Steel-consuming industries have predicted that the recommended tariffs and quotas would force many of them out of business and others to lay off manufacturing and other workers in an economy that can ill-afford more job losses. They predict the recommended remedies would result in far more harm than benefit to the economy.
At the request of The Consuming Industries Trade Action Coalition (CITAC), Trade Partnership Worldwide, LLC analyzed the potential impact of the ITC recommendations on steel-producing, steel-consuming and other sectors of the U.S. economy. The study estimated the effects of two scenarios: (1) imposition of weighted average tariff recommendations of 9.2 percent on imports other than Canada and Mexico of the products on which the ITC found injury (low tariff scenario); and (2) imposition of average tariffs, weighted by the value of imports, of 20.7 percent on those imports (high tariff scenario).
The results are as follows:
• Steel-consuming workers have every reason to be concerned about their future. Higher costs of steel inputs and greater competition from imports of steel-containing products resulting from the proposed remedies would lead to a loss (across all sectors in the United States) of between 36,200 jobs (low tariff scenario) and 74,500 jobs (high tariff scenario). Losses of steel-consuming sector jobs would range from 15,300 to 30,600.
• Under either scenario, eight jobs would be lost for every steel job protected. • Every state loses out under the proposed remedy recommendations,
including states in the “Steel Belt.” • As draconian as these remedy recommendations are, they would not
restore the U.S. steel industry to profitability. Despite the large drops in imports from the tariff increases, the tariff restrictions affect the volume of domestic production to a much greater extent than price. Under the low tariff scenario, domestic steel prices would rise just 0.2 percent as volume of output increases 2.9 percent; under the high-tariff scenario, domestic steel prices would increase 0.4 percent and volume of output, 5.9 percent.

• The remedy recommendations would not help steel workers very much
either. The proposed remedies would protect between 4,375 steel jobs (low tariff scenario) and 8,900 steel jobs (high tariff scenario), at a cost to American consumers every year of $439,485 to $451,509 per steel job protected.
• The proposed remedies would slash imports. Import volumes would
decline by 18.5 percent under the low tariff scenario and by 35.9 percent under the high-tariff scenario. Import prices would increase by 9.1 percent to 20.6 percent, respectively.
• Higher prices and other inefficiencies imposed by the proposed remedies
would force consumers to pay a total of between $1.9 billion and $4.0 billion a year, and decrease U.S. national income by $500 million to $1.4 billion a year at a time when policy makers are looking for every way possible to boost national income growth.
• Steel-consuming industries would face greater competition from foreign
manufacturers, as foreign manufacturers would have access to more competitively-priced steel inputs than U.S. steel users. The high tariffs imposed on steel imports would raise the price of these inputs for U.S. steel-using manufacturers but would not raise prices for foreign manufacturers of steel-containing products. As a result, imports of finished steel products, like electric motors, construction materials, appliances and autos, would increase.

Estimated Economic Effects of Proposed Import Relief Remedies for Steel
About the Authors
Dr. Joseph F. Francois, Managing Director of Trade Partnership Worldwide, LLC, specializes in assessing the economic effects of trade policy. This includes broad-based bilateral, regional, and multilateral trade liberalization, as well as more product specific policies such as the imposition of antidumping or countervailing duty orders, safeguard actions, and the quotas resulting from the rules governing trade in agricultural goods and textiles and clothing of the World Trade Organization (WTO). He co-authored the U.S. International Trade Commission’s COMPAS model during his tenure at the ITC’s Office of Economics, and ran the WTO’s economic modeling team during the Uruguay Round. Francois holds a Ph.D. in economics from the University of Maryland (1988). He can be reached by e-mail at [email protected].
Laura M. Baughman is President of Trade Partnership Worldwide, LLC, a trade policy research firm. She follows closely the impacts, both prospective and actual, of trade policies and programs on the U.S. economy and the trade flows of U.S. trading partners. The firm produces detailed economic assessments of these policies and programs based on traditional economic modeling. It also follows closely the U.S. trade policy formulation process in order to assist clients in providing input to that process. Ms. Baughman holds a Masters Degree in Economics from Columbia University (1978). She can be reached by e-mail at [email protected]

Estimated Economic Effects of Proposed Import Relief Remedies for Steel
I. Introduction
On December 19, the U.S. International Trade Commission (ITC) formally sends to the President several recommendations for restraints on steel imports. Most of the Commissioners will recommend tariffs ranging from 8 to 40 percent, depending on the steel product. One Commissioner will recommend quotas. Under the statute, the President must decide no later than March 6 whether to provide relief and, if so, the amount of the relief.
This study reports the results of a comprehensive analysis of the likely
impact of the imposition of the ITC’s proposed remedies on the U.S. economy generally, as well as the specific impacts on the U.S. steel industry, and U.S. steel-consuming industries. It employs state-of-the-art modeling techniques – the same used by the U.S. Government and international organizations – to measure the impacts on the economy of the imposition of a range of tariffs on steel imports into the United States. Section II summarizes the history of the investigation. Section III presents the results of the modeling exercise. Appendices present summaries of the ITC Commissioners’ votes, and a technical appendix details the model used to obtain the results presented in Section III.

II. How Did We Get Here? It is important to keep the current Section 201 investigation in perspective.
The ITC recommendations are the result of ongoing complaints, extending back to the days of the Reagan administration, from U.S. steel producers about imports, global steel production overcapacity, and, more recently, the heavy burden of costs imposed on them by retiree health and pension obligations (the so-called “legacy costs”). Ever since Reagan-era quotas on imports expired, the industry has been trying (with some success) to get new measures put in place to replace them. In this respect, steel has been continuously protected from import competition over the last 20 years or so by a string of past administrations, through a mix of quotas, countervailing duties and antidumping duties. The current investigation is another link in a long chain of events making up steel import policy. Most recently, the steel producers and the steel union had long sought a formal U.S. Government investigation of whether increased steel imports were a substantial cause of serious injury to U.S. steel producers. Such an investigation, conducted largely by the ITC, is referred to in the United States as a Section 201 investigation, because it is authorized under Section 201 of the Trade Act of 1974 (as amended).1 Section 201 does not address the charge, made long and often by the steel industry, that steel imports are “unfair:”2 it applies to imports from all countries, fairly traded and otherwise.
Once a complaint is formally lodged with the ITC, the ITC’s first task is to
determine whether or not increased imports are a substantial cause of serious injury3 or a threat of future serious injury, to a U.S. industry producing a “like or directly competitive” product. If it so concludes, its second task is to recommend to the President relief that would prevent or remedy the injury and facilitate industry adjustment to import competition. This relief might be tariffs,4 quotas,5
1 The U.S. law implements provisions of the World Trade Organization’s Agreement on Safeguards and Article XIX of the GATT 1994. 2 U.S. antidumping and countervailing duty laws are designed to address “unfair” imports. Such investigations are launched against specific countries (Section 201 investigations must be against all countries), and typically very specific products (the current Section 201 investigation is against virtually all steel products). Antidumping and countervailing duty investigations result in duties equal to the margin of “unfairness” calculated by the Commerce Department. The steel industry has been filing antidumping and countervailing duty cases against a wide variety of steel products imported from most major suppliers for years. In nearly all cases the Commerce Department finds dumping or subsidies; however, in some cases the ITC rules that the requisite “material injury” to U.S. producers has not been established. 3 The threshold for an affirmative finding of injury is higher in a Section 201 investigation than it is in an antidumping or countervailing duty investigation. Imports must be increasing, and they must be a substantial cause of serious injury. “Substantial” is defined as a “cause which is important and not less than any other cause.” Serious injury is defined as a “significant overall impairment in the position of the domestic industry.” 4 Potential tariff increases are capped at 50 percentage points above the ordinary tariff imposed.

tariff-rate quotas (i.e., one tariff level applicable to imports up to a specified quantity, and then a second, higher tariff level applicable to imports over and above that prescribed quantity), trade adjustment assistance, or any combination of these. Relief may be granted for up to four years.6 The Commissioners may suggest different “solutions” for different products. Relief must be phased down over the period proposed. The ITC may also recommend that the President begin international negotiations to address the underlying cause of the increase in imports, or any other action “authorized under law” that would enable the U.S. industry to adjust to import competition. Finally, the ITC will recommend whether imports from Canada or Mexico should be excluded from the remedy on the grounds that they do not account for a substantial share of total imports or do not contribute importantly to the serious injury or threat thereof found by the Commission. Imports from Canada and Mexico may later be added back into the remedy if the ITC and the President conclude that a surge in imports from those countries is undermining the effectiveness of the relief.
The action next shifts to the Executive Branch. The President has 60
days to decide whether or not to impose relief and, if so, what form that relief should take. He also makes the final determination regarding whether to accept or change the ITC’s recommendations about including or excluding imports from Canada and Mexico. The law requires the President to evaluate the national economic interest of taking different actions. This involves evaluating the overall impact of any action on the economy generally and the impact on other sectors than the protected sector.
The steel industry and the steel union had pressured President Clinton for
much of his term to begin such an investigation.7 However, he managed to put them off for the duration of his Presidential term. The industry’s complaints
5 Quota levels must be set at a level that is no lower than the quantity or value of imports entered during the most recent three-year period that the President finds is representative of imports of the product under investigation, unless he finds that a different quantity or value is clearly justified to prevent or remedy serious injury. 6 Relief may be extended one or more times, but the overall period of relief, including extension, may not exceed eight years under any circumstances. 7 The industry and the union had the option of filing its own petition to begin such an investigation. However, they were concerned that if they did so and undertook the heavy legal costs associated with such an investigation, and they prevailed at the ITC, there was a chance that the President would decide to not impose import restraints as a remedy on the grounds that it would be harmful to the national economic interest. But if the President initiated the petition, they believed it increased the likelihood the industry and union would get the desired results: quotas or tariffs. Typically, U.S. companies initiate Section 201 investigations, and it is rare that the President will do so. The law also authorizes the House Committee on Ways and Means and the Senate Committee on Finance to make such requests. Finance prepared its own request for a steel 201 investigation, and the current investigation is a consolidation of the USTR and Senate Finance Committee requests.

reached a crescendo during President Bush’s first months in office. Steel industry supporters in both the House and the Senate nudged the decision along. Representative Peter J. Visclosky (D-IN) and others managed to line up 225 co-sponsors on legislation that would impose quotas on imports and charge a steel sales tax to raise money to pay “legacy costs.”8 Paul Wellstond (D-MN) introduced companion legislation in the Senate. In addition, Senator John Rockefeller (D-WV) pressed the Senate Finance Committee to adopt a resolution instructing the ITC to launch a Section 201 investigation.
On June 22, when U.S. Trade Representative Robert Zoellick sent a letter
to the U.S. International Trade Commission (ITC) requesting it to begin a Section 201 investigation, the process officially began.
The ITC conducts Section 201 investigations based on a strict timetable.
The law and ITC regulations and procedural orders prescribe procedures, from the deadlines for ITC and Presidential actions to the number of minutes private sector witnesses have to testify. Appendix A details the deadlines for various steps of the steel investigation. Because this investigation covered the vast majority of steel products,9 including raw materials like slab, and affected every foreign supplier, including Canada and Mexico, there was no shortage of individuals wishing to present testimony to the ITC.
As noted, the first chore was for the ITC to determine whether imports
were the most important single cause of serious injury or threat thereof to U.S. producers. U.S. Trade Representative Zoellick had suggested the Commissioners focus on four broad categories of steel products (carbon and alloy flat products, carbon and alloy long products, carbon and alloy tubular products, and stainless and tool steel products). The ITC elected to further subdivide these categories into a total of 33 product groupings, leaving individual Commissioners the option to group them into broader categories as they saw fit. After eight days of hearings in late September and early October, and numerous briefs filed by all of the parties, the ITC Commissioners concluded that imports of 12 of the products under investigation were injuring or threatening to injure U.S.
8 The bill, “The Steel Revitalization Act of 2001” (H.R. 808) was introduced DATE and as of December 12, 2001 has 225 co-sponsors. The CITAC Foundation analyzed the likely impact of this legislation on steel-consuming industries and the economy generally in “Costs to American Consuming Industries of Steel Quotas and Taxes,” April 30, 2001. A copy can be found on the CITAC web site, www.citac-trade.org. Paul Wellstone (D-MN) introduced companion legislation, S. 957, in the Senate on May 24. 9 Steel products were generally covered if they were classified in Chapter 72 or 73 of the Harmonized Tariff Schedule of the United States, unless they were specifically excluded. Under the Section 201 statute, products that already face Section 201 remedies may not be included in another case. Certain steel wire rod and smaller diameter line pipe were under Section 201 orders already and therefore were excluded from this case.

producers, and was evenly divided on four other products.10 The ITC made negative determinations (i.e., concluded that imports were not a substantial cause of serious injury) for 17 product categories.11 Appendix B provides a chart summarizing the Commissioners’ votes. The imported products covered by the affirmative determinations and the tie votes accounted for 74 percent of total steel imports in 2000. The details of the reasons for the Commissioners’ decisions on injury will not be know until after the report sent to the President December 19 is released to the public.
Because the Commissioners determined that some imported steel
products were a substantial cause of serious injury to U.S. steel producers, they had to take the next step required by the Section 201 law: determine what remedy would address that injury and allow the industry producing those products the time it needed to adjust to import competition. The ITC held a new round of hearings the week of November 5, interested parties filed still more briefs, and on December 7 the ITC Commissioners announced the outlines of their remedy recommendations to the President. (It formally submits those recommendations to the President on December 19.) Appendix C summarizes the range of remedies. Briefly, the Commissioners suggested tariffs, tariff-rate quotas, and quotas, as well as adjustment assistance and international negotiations. Tariffs ranged from 8 percent to 40 percent. Weighting the proposed tariffs by value of imports potentially affected, the range runs from 9.2 percent to 20.7 percent, excluding Canada and Mexico from the tariffs, or 12.2 percent to 27.9 percent including Canada and Mexico in the tariffs.
Now, the action shifts to the Executive Branch. Through the inter-agency
Trade Policy Staff Committee (TPSC), the Administration will collect comments from the public regarding what impact the suggested remedies are likely to have on the U.S. economy and the affected parties. The TPSC will hold hearings. The statute requires the President to issue a decision by February 17; however, he can request additional information from the ITC, the provision of which would extend that deadline to March 6.
10 In the case of a tie vote, the President decides whether or not the result is a finding of “injury” or “no injury.” In effect, the products subject to a tie vote are still under investigation. 11 Under the North American Free Trade Agreement, the Commissioners who made affirmative determinations are required to decide whether imports from Canada and Mexico account for a substantial share of total imports and contribute importantly to serious injury or threat of serious injury to the domestic industry. If imports from Mexico or Canada are found not to be the cause of injury, they will be excluded from any remedy action.
III. Estimated Impacts of the Proposed Remedies As noted, U.S. law requires the President to take into consideration the
national economic interest before providing any relief to the U.S. steel industry. A key question for the Administration and for other policy makers interested in this investigation therefore is what impact the proposed remedies will have on consumers, producers, employment, and economic output broadly.
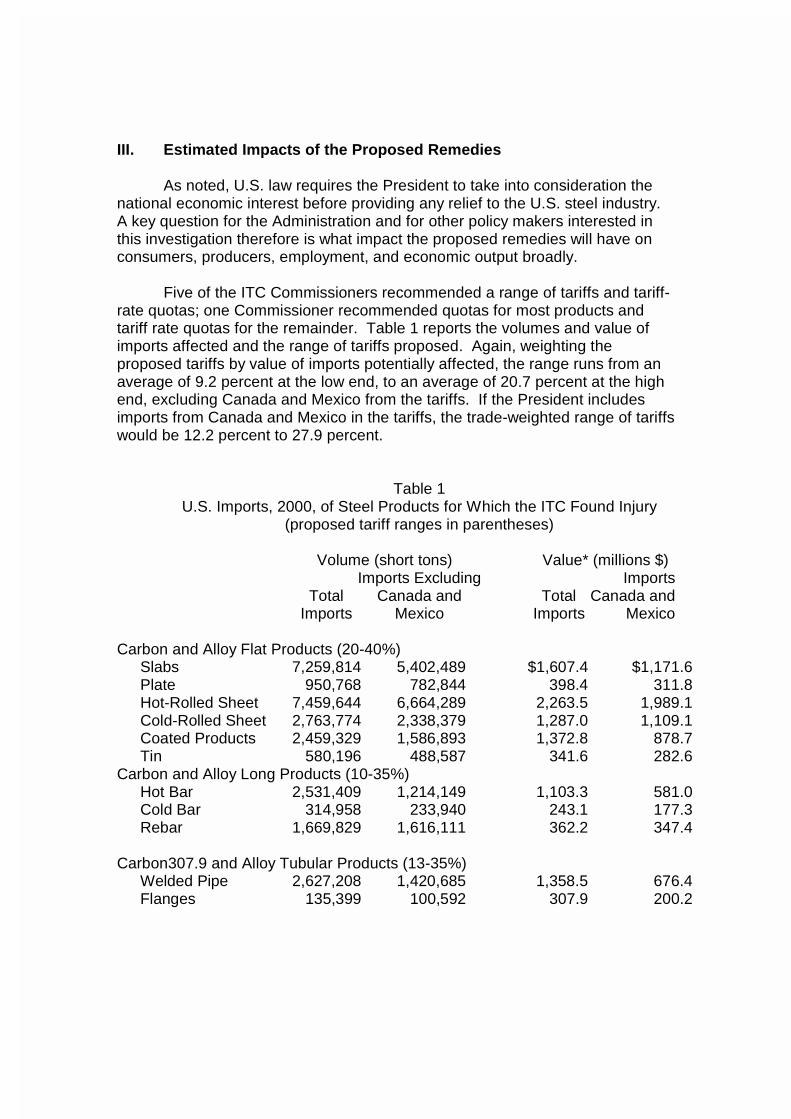
Five of the ITC Commissioners recommended a range of tariffs and tariff-
rate quotas; one Commissioner recommended quotas for most products and tariff rate quotas for the remainder. Table 1 reports the volumes and value of imports affected and the range of tariffs proposed. Again, weighting the proposed tariffs by value of imports potentially affected, the range runs from an average of 9.2 percent at the low end, to an average of 20.7 percent at the high end, excluding Canada and Mexico from the tariffs. If the President includes imports from Canada and Mexico in the tariffs, the trade-weighted range of tariffs would be 12.2 percent to 27.9 percent.
Table 1 U.S. Imports, 2000, of Steel Products for Which the ITC Found Injury
(proposed tariff ranges in parentheses)
Volume (short tons) Value* (millions $) Imports Excluding Imports Total Canada and Total Canada and Imports Mexico Imports Mexico Carbon and Alloy Flat Products (20-40%)
Slabs 7,259,814 5,402,489 $1,607.4 $1,171.6 Plate 950,768 782,844 398.4 311.8 Hot-Rolled Sheet 7,459,644 6,664,289 2,263.5 1,989.1 Cold-Rolled Sheet 2,763,774 2,338,379 1,287.0 1,109.1 Coated Products 2,459,329 1,586,893 1,372.8 878.7 Tin 580,196 488,587 341.6 282.6
Carbon and Alloy Long Products (10-35%) Hot Bar 2,531,409 1,214,149 1,103.3 581.0 Cold Bar 314,958 233,940 243.1 177.3 Rebar 1,669,829 1,616,111 362.2 347.4
Carbon307.9 and Alloy Tubular Products (13-35%)
Welded Pipe 2,627,208 1,420,685 1,358.5 676.4 Flanges 135,399 100,592 307.9 200.2

Table 1, continued U.S. Imports, 2000, of Steel Products for Which the ITC Found Injury
(proposed tariff ranges in parentheses)
Volume (short tons) Value (millions $) Imports Excluding Imports Total Canada and Total Canada and Imports Mexico Imports Mexico Stainless and Tool Steel Products (8-30%)
Bar 150,592 131,184 345.0 302.5 Rod 82,344 82,302 153.6 153.4 Tool Steel 86,550 76,398 177.6 163.3 Wire 31,340 31,028 115.8 114.7 Flanges 31,826 27,513 249.9 185.2
Total Imports 29,134,980 22,197,383 $11.667.6 $8,644.4 * Landed, duty-paid value. NOTE: According to the U.S. International Trade Commission, imports subject to the remedy recommendations account for 74 percent of total steel imports. Source: U.S. International Trade Commission
This chapter presents the results of our rigorous analysis of the likely impacts on the U.S. economy of the imposition of 9.2-20.7 percent tariffs on imports of the subject steel products in the first year of relief.12 To be conservative, we assumed that the President exempts imports from Canada and Mexico from the remedy, meaning that the resulting effects on the U.S. economy would be less than if imports from Mexico and Canada were affected.13 We also assumed a “soft” economy with unemployment, as described in the Technical Appendix (in essence, the economy is “in recession”). The methodology and data used to conduct the analysis are described generally later in this chapter, and in detail in the Technical Appendix.
The results indicate that imposition of tariffs on steel imports would have a
significant negative impact on the economy generally and steel-consuming industries specifically. Simultaneously, they would provide very little benefit to U.S. producers. Table 2 summarizes the results.
12 We did not model the impact of the quotas proposed by one of the Commissioners. 13 We therefore modeled a range of tariffs of 9.2 percent to 20.7 percent.

Table 2 Summary of Results: Estimated Impact of Imposition of Tariffs on U.S.
Steel Imports
Low Tariff High Tariff Scenario Scenario (9.2% Tariffs) (20.7% Tariffs) Impact on Economy Generally(millions annually)
Total Costs to Consumers $1,922.67 $4,019.52 - Net Welfare Costs (impact on GDP)* $501.46 $1,429.25 - Tariff Revenues Raised $1,179.00 $2,093.97
Impact on Steel Imports (percent)
Change in Steel Import Volume -18.5 -35.9 Change in Steel Import Prices +9.1 +20.6
Impact on U.S. Steel Producers and Workers
Benefits to Steel Producers (millions) $242.19 $496.29 Change in Steel Employment (number) +4,375 +8,902 Total Cost per Steel Job Protected (number) $439,485 $451,509 Change in Domestic Steel Prices (percent) +0.2 +0.4 Change in Domestic Steel Production (percent) +2.9 +5.9
Impact on Steel-Consuming Industries Change in Steel-Consuming Industry Jobs (no.) -15,304 -30,592 Change in Imports of Fabricated Metal Products (percent) +0.5 +1.1 Change in Imports of Autos (percent) +0.2 +0.4 Jobs Lost per Job Protected 3.5 3.5
Impact on Other Sectors**
Change in Employment -20,860 -43,910 Total Jobs Lost -36,164 -74,502 Total Jobs Lost per Job Protected 8.3 8.4 * Total consumer costs minus benefits to U.S. producers and tariffs collected. ** This includes jobs in agriculture, retailing, services, banking, transportation, the ports, etc., which lose out when income losses in steel-using sectors feed back through the rest of the economy (e.g., reduced spending on food, clothing and shelter from unemployed steel-using sector workers), and when steel-using industries use fewer service inputs. Source: Trade Partnership Worldwide, LLC, Washington, DC.

In brief, we found: The proposed remedies would drastically cut imports. Under the low
tariff scenario, import volumes would decline by 18.5 percent, and by 35.9 percent under the high-tariff scenario. Import prices would increase by 9.1 percent to 20.6 percent, respectively.
Higher prices, reduced availability and other inefficiencies imposed by the proposed remedies would force consumers to pay between $1.9 billion and $4.0 billion a year, and decrease U.S. national income by $500 million to $1.4 billion a year at a time when policy makers are looking for every way possible to boost national income growth.
Steel consuming industries would face greater import competition from foreign manufacturers of their products as foreign manufacturers have access to more competitively-priced steel inputs that U.S. steel users can no longer purchase except with high tariffs. The volume of fabricated metal products imported into the United States would increase by 0.5 percent (low tariff scenario) to 1.1 percent (high tariff scenario) and the volume of auto imports would increase by 0.2 percent to 0.4 percent, respectively.
Steel producers do not win much. Despite the large drops in imports, the bulk of the impact affects volumes of domestic production, not price. Under the low tariff scenario, domestic steel prices would rise just 0.2 percent as volume of output increases 2.9 percent; under the high-tariff scenario, domestic steel prices would increase 0.4 percent and volume of output, 5.9 percent. Steel producers score between $242.2 million and $496.3 million in windfall gains from higher prices and volume. As draconian as the remedy recommendations are, they would not restore the industry to profitability.
Steel workers would not have much to look forward to, either. The proposed remedies would protect between 4,375 steel jobs (low tariff scenario) to 8,900 steel jobs (high tariff scenario), at a cost to American consumers every year of $439,485 to $451,509 per steel job protected. At employment levels in the steel industry of 218,519 in 2000, tariff remedies would preserve at most 2.0 percent of U.S. steel employment at great cost to the rest of the world.
But steel-consuming workers have every reason to be concerned. Higher costs of steel inputs that they cannot pass on to their customers,14 as well as
14 A recent Wall Street Journal article describes the dilemma facing steel-users who supply the auto industry. Squeezed between rising health care, research, recall and other costs over which they have no control, and consumer refusal to accept price increases, auto makers are demanding that their suppliers of steel, rubber, electronics and other components cut the prices of their goods every year. “According to a recent study by IRN Inc., the annual price cut

greater competition from imports of steel-containing products resulting from the proposed remedies would result in a total loss (across all sectors in the United States) of between 36,200 jobs (low tariff scenario) to 74,500 jobs (high tariff scenario). Losses of steel-consuming sector jobs would range from 15,300 to 30,600. Under either scenario, eight jobs would be lost for every steel job protected.
Table 3
Job Effects of ITC Remedy Recommendations (number of jobs; SIC category in parentheses)
Low Tariffs High Tariffs Total Jobs Protected Steel Works/Blast Furnaces (331) +4,375 +8,902 Total Jobs Lost -36,164 -74,502
Steel-Consuming Jobs -15,304 -30,592 Commercial Construction (15 less 152, 16, 17) -2,514 -5,256 Chemicals & Related Products (28) -792 -1,567 Petroleum Refining (291) -9 -21 Tires & Inner Tubes (301) -40 -60 Fabricated Metals (34) -2,852 -5,688 Industrial Machinery & Equipment (35) -3,100 -6,102 Electric Distribution Equipment (361) -462 -913 Electrical Industrial Apparatus (362) -829 -1,638 Household Appliances (363) -522 -1,030 Electrical Lighting and Wiring Equipment (364) -1,035 -2,045 Transportation Equipment (37) -3,147 -6,252
Other Sectors* -20,860 -43,910 Net Jobs Lost -31,789 -65,600 * Includes jobs in agriculture, retailing, services, banking, etc., which lose out when income losses in steel-using sectors feed back through the rest of the economy (e.g., reduced spending on food, clothing and shelter from unemployed steel-using sector workers). Source: Trade Partnership Worldwide, LLC, Washington, DC
requested by major auto makers and the largest suppliers averaged 3.8 percent in 1997 and 5.4 percent in 2001. But as price pressures have intensified, the ability of many suppliers to comply diminished, and, according to many industry executives, now is virtually gone. [One company] predicts that some of his competitors will be forced to find merger partners or dismember themselves. Many smaller suppliers, unable to cope with price cutting pressures, are just folding.” Norihiko Shirouzu and Jon E. Hilsenrath, “As Debate on Deflation Simmers, Auto Makers Live the Experience,” The Wall Street Journal, November 21, 2001, p. A1.

Every state loses out under the proposed remedy recommendations. Table 4 presents the job gain and loss estimates for each of the 50 states. Some of the biggest net losers are states in the steel-belt themselves: Illinois (job losses of up to 3,810, or five jobs lost for every steel job protected), Indiana (2,230 total jobs lost, or two jobs lost for every one steel job protected), Ohio (4,000 total jobs lost, or almost three jobs lost for every one steel job protected), and Pennsylvania (3,300 total jobs lost, or more than two jobs lost for every one steel job protected).
Table 4 Job Impact Estimates by State
Low Tariffs High Tariffs Steel- Steel- Total Total Consuming Total Total Consuming Gains Losses Losses Gains Losses Losses Alabama 174 -536 -234 353 -1,104 -467 Alaska 0 -41 -7 0 -87 -15 Arizona 12 -546 -194 23 -1,131 -392 Arkansas 98 -359 -177 199 -736 -352 California 137 -3,727 -1,389 278 -7,702 -2,779 Colorado 23 -521 -167 48 -1,083 -338 Connecticut 40 -563 -299 82 -1,151 -596 Delaware 13 -107 -42 26 -221 -83 Florida 30 -1,585 -429 61 -3,299 -865 Georgia 26 -982 -339 53 -2,034 -680 Hawaii 0 -104 -10 0 -219 -21 Idaho 0 -134 -43 0 -278 -87 Illinois 384 -1,859 -908 781 -3,810 -1,809 Indiana 659 -1,095 -650 1,340 -2,230 -1,294 Iowa 27 -470 -237 54 -963 -471 Kansas 13 -406 -195 26 -835 -389 Kentucky 112 -557 -274 227 -1,142 -547 Louisiana 22 -481 -180 45 -996 -362 Maine 0 -147 -47 1 -306 -95 Maryland 0 -549 -146 0 -1,143 -296 Massachusetts 18 -869 -326 37 -1,794 -650 Michigan 236 -1,846 -1,161 480 -3,754 -2,311 Minnesota 22 -733 -302 45 -1,510 -603 Mississippi 25 -379 -198 50 -775 -393 Missouri 49 -832 -397 101 -1,707 -792 Montana 0 -79 -13 0 -165 -27 Nebraska 11 -237 -89 22 -490 -177 Nevada 0 -218 -53 0 -455 -109

Table 4, continued Job Impact Estimates by State
Low Tariffs High Tariffs Steel- Steel- Total Total Consuming Total Total Consuming Gains Losses Losses Gains Losses Losses New Hampshire 0 -184 -83 0 -377 -165 New Jersey 44 -950 -294 90 -1,969 -588 New Mexico 0 -153 -31 0 -321 -63 New York 83 -2,011 -581 169 -4,173 -1,165 North Carolina 32 -1,144 -522 64 -2,352 -1,042 North Dakota 0 -76 -22 0 -157 -45 Ohio 760 -1,965 -1,107 1,546 -4,009 -2,204 Oklahoma 35 -401 -165 71 -826 -329 Oregon 38 -399 -138 77 -825 -278 Pennsylvania 699 -1,599 -697 1,423 -3,290 -1,392 Rhode Island 0 -127 -49 0 -261 -98 South Carolina 55 -563 -269 111 -1,155 -537 South Dakota 0 -98 -36 0 -203 -72 Tennessee 67 -913 -490 137 -1,866 -975 Texas 168 -2,428 -941 341 -5,021 -1,889 Utah 46 -270 -99 93 -558 -200 Vermont 0 -74 -26 0 -153 -51 Virginia 30 -864 -295 60 -1,790 -594 Washington 16 -752 -319 32 -1,550 -639 West Virginia 130 -169 -51 265 -351 -102 Wisconsin 45 -1,011 -571 91 -2,062 -1,135 Wyoming 1 -52 -12 1 -109 -25 TOTAL 4,375 -36,164 -15,304 8,902 -74,502 -30,592 Source: Trade Partnership Worldwide, LLC, Washington, DC. Clearly, in a recessionary economy, import protection that will cause such significant damage to employment is not advisable. Moreover, steel-consuming industries, many of them small-businesses, have been among a very few job-creating industries in the U.S. manufacturing sector, even in recent years. Between 1997 and 2000, steel-consuming sectors added 848,000 jobs, compared to losses in the steel sector of 10,300 over the same period. It makes little sense to hit hard one of the few manufacturing sectors of the economy – steel consuming industries – that are creating jobs to bail out an industry that is going through a much-needed adjustment process. In an effort to protect a few thousand steel jobs, policy makers would further slow economic recovery by reducing national income, and force job losses in manufacturing in the very communities they seek to help.

About the Model
Trade Partnership Worldwide, LLC, employed a state-of-the-art computable general equilibrium (CGE) model to estimate the potential impacts of the proposed remedies on the U.S. economy generally, and the steel industry and steel-consuming industries specifically. CGE models are the tools of choice for assessment of the economic impact of regional and multilateral trade agreements. They allow for assessment of the effects on broad sectors of the economy of protecting one sector, including interactions between sectors that may result.
The model we used reflects the interactions across the entire U.S.
economy, rather than just within the protected industry (i.e. steel) and its immediate customers.15 The linkages between sectors are both direct (like the input of steel in the production of automobiles) and indirect (like the use of mining inputs into steel, which feed indirectly into automobiles, and the use of both energy services and steel in the production of automobiles). The model contains 15 specific sectors: food; other primary goods; mining; steel; non-ferrous metals; fabricated metals; chemicals, rubber and plastics; refineries; automobiles and parts; other transport equipment; electrical equipment; non-electrical equipment; other manufactures; construction; and services. The Trade Partnership benchmarked the model’s data for national income, trade flows and related data to the year 2000.16 In modeling the impact of the proposed remedies, we take into account the current economic climate. Hence, the model includes job creation and destruction (i.e. unemployment) as potential gaps are created between labor earnings and the value of labor output across sectors.17 Throughout, we assume that Canada and Mexico are left off of the remedy list. Total effects across states are based on detailed BLS data on state level employment, combined with estimated effects at the national level.
15 The model therefore is able to capture the details of up- and down-stream impacts of trade protection, as well as the total costs to consumers and benefits to U.S. producers. It captures important linkages between sectors, in terms of both intermediate demands and competition in labor and capital markets. “Partial equilibrium” analysis can only capture the total costs to consumers and the benefits to the protected industries. The model used for this study defines the United States as a “large country,” in other words, one with market power in import and export markets. 16 Basic national income data came from the Global Trade Analysis Project (GTAP) data set, updated to the most recent full year, and supplemented with data from the U.S. Department of Commerce, the Bureau of Labor Statistics, the International Monetary Fund, and the American Iron and Steel Institute. 17 For example, this means we explicitly model the release of worker from the fabricated metals industry as input costs are driven up.

Appendix A
Steel 201 Timelines ITC Receives Letter from USTR Requesting Investigation June 22, 2001 ITC Begins Investigation June 22, 2001 ITC Receives Resolution from Senate Finance Committee Requesting Investigation July 26, 2001 ITC Injury Hearings Sept. 17, 19, 20, 24, 25, 28, Oct. 1, 5, 2001 - Field Hearing in Merrillville, Indiana October 5, 2001 ITC Injury Vote October 22, 2001 ITC Remedy Hearings Week of November 5, 2001 ITC Remedy Recommendations Announced December 7, 2001 ITC Report Submitted to President December 19, 2001 Trade Policy Staff Committee Hearings January 2-5, 2002 Final Presidential Decision February 17, 2002 Final Presidential Decision, extended March 6, 2002

COMMISSIONER’S DETERMINATIONS IN TA-201-73, STEEL, OCTOBER 22, 2001
Commissioner
Carbon & Alloy Flat Products Carbon & Alloy Long Products Carbon & AlloyTubular Products Stainless & Tool Steel Products
Slab
s
Plat
e
Hot
-rolle
d
Col
d-ro
lled
GO
ES
Coa
ted
Tin
Ingo
ts
Hot
bar
/ligh
t sha
pes
Col
d ba
r
Reb
ar
Rai
ls
Wire
Stra
nd
Nai
ls
Hea
vy s
hape
s
Fabr
icat
ed u
nits
Seam
less
Seam
less
OC
TG
Wel
ded
Wel
ded
OC
TG
Flan
ges
Slab
s
Plat
e
Bar/l
ight
sha
pes
Rod
Tool
ste
el
Wire
Clo
th
Rop
e
Seam
less
pip
e
Wel
ded
pipe
Flan
ges
1 2 3 4 5 6 7 8 9 10 11 12 13 14 15 16 17 18 19 20 21 22 23 24 25 26 27 28 29 30 31 32 33
Koplan A A A A N A N N A A A N N N N N N N N A N A N N A A A A N N N N A
Okun A A A A N A N N A A A N N N N N N N N A N A N N A A N N N N N N N
Bragg A A A A A A A A A A A A A A A A N A A A A A A A A A A A N A N N A
Miller A A A A N A A N A A A N N N N N N N N A N A N N A A N N N N N N N
Hillman A A A A N A N N A A A N N N N N N N N A N A N N A A N N N N N N N
Devaney A A A A A A A A A A A A A A A A N A A A A A A A A A A A N A N N A
Commission A A A A N ATIE
N A A A N N N N N N N N A N A N N A ATIE
TIE
N N N NTIE
Canada N N N N N N A A NTIE
A A N N N A
Mexico A A A A A N N N N N A N N N N A
Appendix B
Summary of ITC Injury Votes

1 Imports from Canada, Mexico, Israel, and beneficiary countries under the Caribbean Basin Economic Recovery Act (CBERA) and the Andean TradePreference Act are excluded unless specifically noted in this column. Commissioners Bragg and Devaney also excluded imports from Jordan; the remainingCommissioners did not announce their Jordan findings on this date. 2 Chairman Koplan and Commissioners Miller and Hillman only. 3 Commissioner Bragg only. 4 Commissioner Devaney only.
TA-201-73: SUMMARY OF COMMISSION REMEDY RECOMMENDATIONS, DECEMBER 7, 2001
Product Commissioner/RemedyRecommendation Year 1 Year 2 Year 3 Year 4 Special
Findings1
Carbon andalloy steelslabs
Koplan, Okun, Miller,Hillman
Tariff-rate quota 20% tariff on coveredimports in excess of7,000,000 short tons
17% tariff on coveredimports in excess of7,500,000 short tons
14% tariff on coveredimports in excess of8,000,000 short tons
11% tariff on coveredimports in excess of8,500,000 short tons2
Mexico
Bragg, Devaney Tariff 40% 38% 36% 31% Mexico3
CBERA4
Carbon andalloy steelplate
Koplan, Miller, Hillman Tariff 20% 17% 14% 11% Mexico
Bragg, Devaney Tariff 40% 38% 36% 31% Mexico3
CBERA4
Okun Quota 1,232,260 short tons 1,269,227 short tons 1,307,304 short tons Mexico
Carbon andalloy steel hot-rolled flatproducts
Koplan, Miller, Hillman Tariff 20% 17% 14% 11% Mexico
Bragg, Devaney Tariff 40% 38% 36% 31% Mexico3
CBERA4
Okun Quota 4,928,712 short tons 5,076,573 short tons 5,228,871 short tons Mexico
Carbon andalloy steelcold-rolled flatproducts
Koplan, Miller, Hillman Tariff 20% 17% 14% 11% Mexico
Bragg, Devaney Tariff 40% 38% 36% 31% Mexico3
CBERA4
Okun Quota 2,796,196 short tons 2,880,082 short tons 2,966,485 short tons Mexico
Carbon andalloy steelcoatedproducts
Koplan, Miller, Hillman Tariff 20% 17% 14% 11% Mexico
Bragg, Devaney Tariff 40% 38% 36% 31% Mexico3
CBERA4
Okun Quota 1,683,282 short tons 1,733,781 short tons 1,785,794 short tons Mexico
Appendix C
Summary of ITC Remedy Recommendations

5 Commissioner Bragg only. 6 Commissioner Devaney only. 7 Chairman Koplan and Commissioner Miller only.
Product Commissioner/RemedyRecommendation Year 1 Year 2 Year 3 Year 4 Special
Findings
Carbon andalloy steel tinproducts
Bragg, Devaney Tariff 40% 38% 36% 31% Mexico5
CBERA6
Miller Tariff 20% 17% 14% 11% Canada
Carbon andalloy steel hot-rolled bar
Koplan, Miller, Hillman Tariff 20% 17% 14% 11% CanadaMexico7
Bragg, Devaney Tariff 35% 33% 31% 26% CBERA6
Okun Quota 1,961,648 short tons 2,020,497 short tons 2,081,112 short tons Canada
Carbon andalloy steelcold-finishedbar
Koplan, Miller, Hillman Tariff 20% 17% 14% 11% Canada
Bragg, Devaney Tariff 35% 33% 31% 26% CBERA6
Okun Quota 246,033 short tons 253,414 short tons 261,016 short tons Canada
Carbon andalloy steelrebar
Koplan, Miller, Hillman Tariff 10% 8% 6% 4%
Bragg, Devaney Tariff 35% 33% 31% 26% CBERA6
Okun Quota 1,054,266 short tons 1,085,894 short tons 1,118,470 short tons
Carbon andalloy steelwelded tubularproducts otherthan OCTG
Koplan, Miller Tariff-rate quota 20% tariff on coveredimports in excess of2,600,000 short tons
17% tariff on coveredimports in excess of2,680,000 short tons
14% tariff on coveredimports in excess of2,760,000 short tons
11% tariff on coveredimports in excess of2,840,000 short tons
CanadaMexico
Bragg, Devaney Tariff 30% 28% 26% 21% Canada5
CBERA6
Okun Tariff-rate quota 20% tariff on coveredimports in excess of1,400,443 short tons
17% tariff on coveredimports in excess of1,442,456 short tons
14% tariff on coveredimports in excess of1,485,730 short tons
Hillman Tariff-rate quota 20% tariff on coveredimports in excess of1,400,000 short tons
17% tariff on coveredimports in excess of1,442,000 short tons
14% tariff on coveredimports in excess of1,485,000 short tons
11% tariff on coveredimports in excess of1,530,000 short tons

Product Commissioner/RemedyRecommendation Year 1 Year 2 Year 3 Year 4 Special
Findings
8 Chairman Koplan and Commissioners Miller and Hillman only. 9 Vice Chairman Okun and Commissioners Miller and Hillman only. 10 Chairman Koplan, Vice Chairman Okun, and Commissioner Miller only. 11 Commissioner Bragg only. 12 Commissioner Devaney only.
Carbon andalloy steelfittings andflanges
Koplan, Okun, Miller,Hillman
Tariff 13% 10% 7% 4%8 Canada9
Mexico10
Bragg, Devaney Tariff 30% 28% 26% 21% Canada11
Mexico11
CBERA12
Stainless steelbar
Koplan, Miller, Hillman Tariff 15% 12% 9% 6% Canada
Okun Quota 109,440 short tons 112,724 short tons 116,105 short tons Canada
Bragg Tariff 25% 20% 15%
Devaney Quota and tariff Average quantity ofimports during 1996-98 plus 15%
Average quantity ofimports during 1996-98
Average quantity ofimports during 1996-98
CBERA
Stainless steelrod
Koplan, Miller, Hillman Tariff 20% 17% 14% 11%
Okun Quota 62,573 short tons 64,450 short tons 66,384 short tons
Bragg Tariff 25% 20% 15%
Devaney Quota and tariff Average quantity ofimports during 1996-98 plus 15%
Average quantity ofimports during 1996-98
Average quantity ofimports during 1996-98
Tool steel Koplan Tariff 10% 8% 6% 4%
Bragg Tariff 25% 20% 15%
Devaney Quota and tariff Average quantity ofimports during 1996-98 plus 15%
Average quantity ofimports during 1996-98
Average quantity ofimports during 1996-98

Product Commissioner/RemedyRecommendation Year 1 Year 2 Year 3 Year 4 Special
Findings
Stainless steelwire
Koplan Tariff 8% 7% 6% 5%
Bragg Tariff 15% 10% 5%
Devaney Quota and tariff Average quantity ofimports during 1996-98 plus 15%
Average quantity ofimports during 1996-98
Average quantity ofimports during 1996-98
Stainless steelfittings andflanges
Koplan Tariff 15% 12% 9% 6%
Bragg Tariff 30% 25% 20% CanadaMexico
Devaney Quota Average quantity ofimports during 1996-98
Average quantity ofimports during 1996-98
Average quantity ofimports during 1996-98
Average quantity ofimports during 1996-98
CanadaMexico

Technical Appendix
An Overview of the Computational Model A. Introduction B. General structure C. Taxes and policy variables D. Trade and transport costs E. The production structure F. The composite household and final demand structure G. Labor markets
A. Introduction
This appendix provides an overview of the basic structure of the
computable general equilibrium (CGE) model employed for assessment of U.S. import restraints on steel. While this appendix provides a broad overview of the model, it does not provide a detailed discussion of mathematical structure. Rather, the reader is referred to Hertel (1996: http://www.agecon.purdue.edu/gtap/model/Chap2.pdf)18 for a detailed discussion of the basic algebraic model structure represented by the core of the model’s code. The model is implemented in GEMPACK -- a software package designed for solving large applied general equilibrium models. The model is solved as an explicit non-linear system of equations, through techniques described by Harrison and Pearson (1994). 19 More information can be obtained at the following URL -- http://www.monash.edu.au/policy/gempack.htm. Social accounting data are based on the Global Trade Analysis Project (GTAP) dataset, with updates necessary to benchmark the economic model to the year 2000. (The default GTAP benchmark year is 1997). Updated economic data are taken from public sources provided by the U.S. Department of Labor, the International Monetary Fund, the AISI, and the U.S. Department of Commerce.
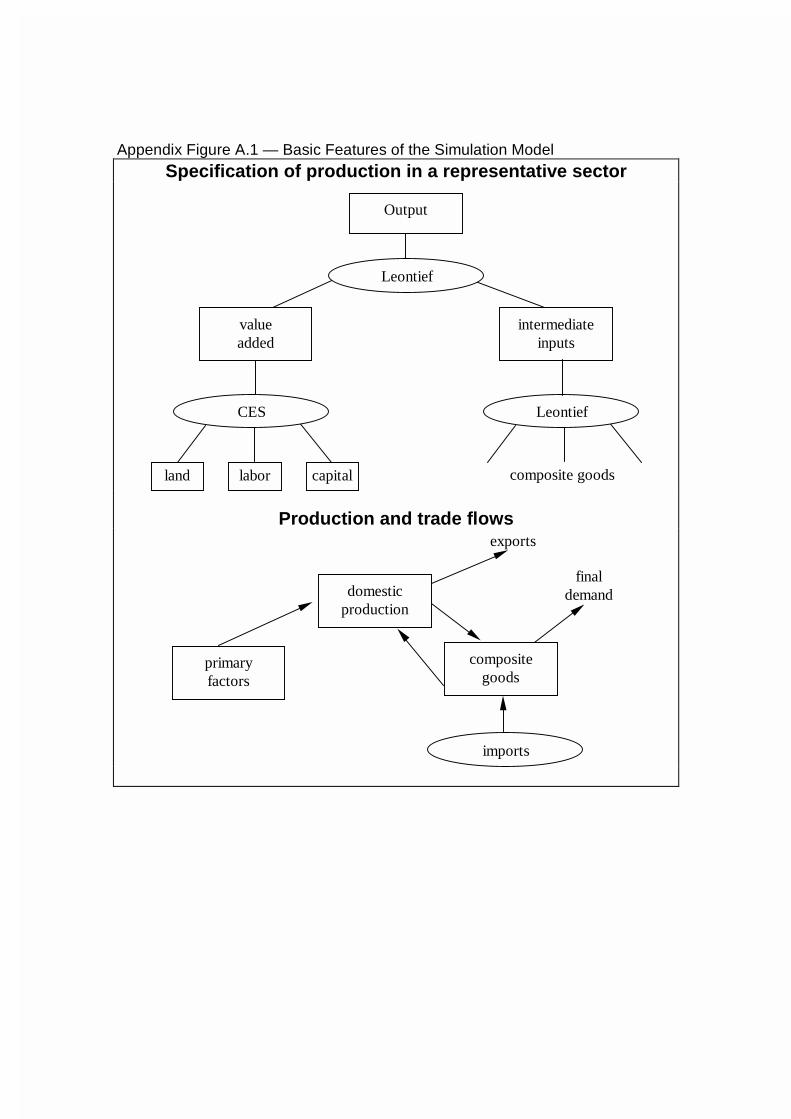
B. General structure
The general conceptual structure of a regional economy in the model is represented in Figure A.1. Within each region (both the U.S. and the rest of world are modeled explicitly as regional economies) firms produce output, employing land, labor, natural resources, and capital, and combining these with intermediate inputs. Firm output is purchased by consumers, government, the investment sector, and by other firms. Firm output can also be sold for export. Land and natural resources are only employed in some sectors, while capital and
18 Hertel, T., ed., (1996), Global Trade Analysis, Cambridge University Press: Cambridge MA. 19 Harrison, W.J. and K.R. Pearson (1994), An Introduction to GEMPACK, Second edition.

labor (both skilled and unskilled) are mobile between all production sectors. Capital is fully mobile within regions. However, capital movements between regions are not modeled, but rather are held fixed in all simulations. Labor mobility and wage setting are discussed below.
All demand sources combine imports with domestic goods to produce a
composite good, as indicated in Appendix Figure A.1. These are called “Armington” composites. Armington composites represent a combination of imported and domestic goods, which serve as imperfect substitutes for each other. The relevant set of trade substitution elasticities are presented in Appendix Table A.1.
The model includes 2 regions (the United States and the rest of world) and
15 sectors. The list of sectors is shown in Appendix Table A.1. A more detailed definition of these sectors is provided in Appendix Table A.2.
C. Taxes and policy variables
Taxes are included in the theory of the model at several levels.
Production taxes are placed on intermediate or primary inputs, or on output. Some trade taxes are modeled at the border. Additional internal taxes are placed on domestic or imported intermediate inputs, and may be applied at differential rates that discriminate against imports. Their actual application in the model reflects underlying social accounting data. Where relevant, taxes are also placed on exports, and on primary factor income. Finally, where relevant (as indicated by social accounting data) taxes are placed on final consumption, and can be applied differentially to consumption of domestic and imported goods.
Trade policy instruments are represented as import or export
taxes/subsidies. This includes applied most-favored nation (MFN) tariffs, antidumping duties, countervailing duties, and other trade restrictions. We model steel import quotas explicitly, with quota rents collected by the exporting country. (This is identical to having an endogenous export tax, whose value is a function of the trade level determined by the export quota).
D. Trade and transportation costs
International trade is modeled as a process that explicitly involves trading
costs, which include both trade and transportation services. These trading costs reflect the transaction costs involved in international trade, as well as the physical activity of transportation itself. Those trading costs related to international movement of goods and related logistic services are met by composite services purchased from a global trade/transportation services sector, where the composite "international trade services" activity is produced as a Cobb-Douglas composite of regional exports of trade and transport service exports. Trade-cost

margins are based on reconciled f.o.b. and c.i.f. trade data, as reported in the underlying GTAP dataset.
E. Production structure
The basic structure of production is depicted in Appendix Figure A.2.
Basically, intermediate inputs are combined into a composite intermediate, and this composite intermediate is in turn combined with value added to yield a final product. For example, in the auto sector, steel is combined with plastics, machinery, and other physical inputs, and through value added activities (involving workers, equipment, and energy) yields automobiles as final output. At all stages this is represented by CES production functions. The value-added substitution elasticities are presented in Appendix Table A.1.
F. The composite household and final demand structure
Final demand is determined by an upper-tier Cobb-Douglas preference function, which allocates income in fixed shares to current consumption, investment, and government services. This yields a fixed savings rate. Government services are produced by a Leontief technology, with household/government transfers being endogenous. The lower-tier nest for current consumption is specified as taking a constant difference elasticity (CDE) functional form. The regional capital markets adjust so that changes in savings match changes in regional investment expenditures. (Note that the Cobb-Douglas demand function is a special case of the CDE demand function employed in the model code. It is implemented through GEMPACK parameter files.)
The basic structure of demand is based on Armington preferences, as illustrated in Appendix Figure 2. Under this approach, goods are differentiated by country of origin, and the similarity of goods from different regions is measured by the elasticity of substitution. Formally, within a particular region, we assume that demand goods from different regions are aggregated into a composite import according to the following CES function:
(1) j
j
R
irijrij
Mrj Mq
ρρα
/1
1,,,,,
= ∑
=
In equation (1), Mj,i,r is the quantity of Mj from region i consumed in region
r. The elasticity of substitution between varieties from different regions is then equal to σM
j , where σMj=1/(1-ρj). Composite imports are combined with the
domestic good qD in a second CES nest, yielding the Armington composite q.
(2) ( ) ( )[ ] jjj DrjrDj
MrjrMjrj qqq
βββ /1
,,,,.., Ω+Ω=

The elasticity of substitution between the domestic good and composite imports is then equal to σD
j, where σDj=1/(1-βj). At the same time, from the first
order conditions, the demand for import Mj,i,r can then be shown to equal
(3) E P ]P
E]P[ ]P/ [ = M
Mr j,
Mr j,
1-r i, j,r i, j,
Mr j,
1-r i, j,
-1r i, j,
R
=1ir i, j,r i, j,r i, j,
Mj
Mj
Mj
Mj
Mj
/ [ =
σσ
σσσ
α
αα ∑
where EM
j,r represents expenditures on imports in region r on the sector j Armington composite.
In practice, because we have a two region model (the U.S. and rest-of-world), the two Armington CES nests are collapsed to a single nest. This implies that the substitution elasticities in equations (1) and (2) are equal. These elasticities are reported in Appendix Table 1.
G. Labor markets Starting from our benchmark equilibirum, we model a recessionary, or “soft” labor market, with an allowance for unemployment. To allow for limited labor market flexibility and unemployment, we employ a labor market specification where wages are held fixed and employment levels adjust. The result is that, as firms experience rising costs, they release workers to compensate.
Appendix Figure A.1 — Basic Features of the Simulation Model Specification of production in a representative sector
Output
Leontief
valueadded
intermediateinputs
land labor capital
CES Leontief
composite goods
Production and trade flows
primaryfactors
compositegoods
imports
exports
domesticproduction
finaldemand

Appendix Figure A.2 — Armington Aggregation Nest
Armingtoncomposite
CES
domesticgood
compositeimports
CES
M1 M2 . . . MR

Appendix Table A.1 – Model parameters
A B trade substitution elasticities
elasticity of substitution in production
1 Food 2.00 0.62 2 Other primary products 3.00 0.21 3 Mining 3.00 0.2 4 Steel 3.00 1.26 5 Non-ferrous metals 3.00 1.26 6 Fabricated metal products 3.00 1.26 7 Chemicals, rubber, and plastics 2.00 1.26 8 Refineries 2.00 1.26 9 Automobiles and parts 5.00 1.26 10 Transport equipment 5.00 1.26 11 Electrical machinery 3.00 1.26 12 Non-electrical machinery and equipment 3.00 1.26 13 Construction 2.00 1.4 14 Other manufactures 3.00 1.26 15 Services 2.00 1.39
source: GTAP database. note: The same trade elasticity of substitution for steel is reported by K.A. Reinert and D.W. Roland-Holst (1992), "Disaggregated Armington Elasticities for the Mining and Manufacturing Sector," Journal of Policy Modeling, 4:5.

Table A.2 Concordance of Model Sectors to ISIC Sectors*
* This concordance is based on the SALTER/GTAP to ISIC concordance provided by the Australian Industry Commission. (p) denotes partial allocation of 4-digit ISIC categories to a particular sector.
Food (p) 1110 Agricultural & livestock production (paddy rice only)
(p) 1120 Agricultural services (servicing paddy rice production only) (p) 1110 Agricultural & livestock production (wheat only)
(p) 1120 Agricultural services (servicing wheat production only) (p) 1110 Agricultural & livestock production (grains except wheat & rice only) (p) 1120 Agricultural services (servicing production of grains, except wheat & rice only)
(p) 1110 Agricultural & livestock production (non-grain crops only) (p) 1120 Agricultural services (servicing non-grain crops production only)
(p) 1110 Agricultural & livestock production (wool only) (p) 1120 Agricultural services (servicing wool production only)
(p) 1110 Agricultural & livestock production (other livestock production only) (p) 1120 Agricultural services (servicing other livestock production only) (p) 3116 Grain mill products (processed rice only) 3111 Slaughtering, preparing and preserving meat 3112 Manufacture of dairy products 3113 Canning and preserving of fruits and vegetables
3114 Canning, preserving & processing of fish, crustaceans and similar foods 3115 Manufacture of vegetable and animal oils & fats (p) 3116 Grain mill products (except processed rice) 3117 Manufacture of bakery products 3118 Sugar factories and refineries 3119 Manufacture of cocoa, chocolate & sugar confectionery 3121 Manufacture of food products n.e.c. 3122 Manufacture of prepared animal feeds 3131 Distilling, rectifying & blending spirits 3132 Wine industries 3133 Malt liquors and malt 3134 Soft drinks & carbonated waters industries 3140 Tobacco manufactures
Other Primary Production
1130 Hunting, trapping & game propagation 1210 Forestry
1220 Logging 1301 Ocean and coastal fishing
1302 Fishing n.e.c. Mining
2100 Coal mining (p) 3540 Manufacture of miscellaneous products of petroleum and coal (briquettes only) **
(p) 2200 Crude petroleum & natural gas production (oil only) (p) 2200 Crude petroleum & natural gas production (gas only)
(p) 3530 Petroleum refineries (LPG only) ** 2301 Iron ore mining
2302 Non-ferrous ore mining 2901 Stone quarrying, clay and pits 2902 Chemical and fertiliser mineral mining 2903 Salt mining 2909 Mining and quarrying n.e.c.
Steel
3710 Iron and steel basic industries

Table A.2 Concordance of Model Sectors to ISIC Sectors*
* This concordance is based on the SALTER/GTAP to ISIC concordance provided by the Australian Industry Commission. (p) denotes partial allocation of 4-digit ISIC categories to a particular sector.
Other Non-ferrous Metals
3720 Non-ferrous metal basic industries
Fabricated Metal Products 3811 Manufacture of cutlery, hand tools and general hardware
3812 Manufacture of furniture and fixtures primarily of metal 3813 Manufacture of structural metal products 3819 Manufacture of fabricated metal products except machinery & equipment n.e.c.
Chemicals, rubber, and plastics
3511 Manufacture of basic industrial chemicals except fertilisers 3512 Manufacture of fertilisers and pesticides 3513 Manufacture of synthetic resins, plastic materials and man-made fibres except glass 3521 Manufacture of paints, varnishes and lacquers 3522 Manufacture of drugs and medicines 3523 Manufacture of soap and cleaning preparations, perfumes and cosmetics 3529 Manufacture of chemical products n.e.c. 3551 Tyre and tube industries 3559 Manufacture of rubber products n.e.c. 3560 Manufacture of plastic products n.e.c.
Refineries
(p) 3530 Petroleum refineries (except LPG) ** (p) 3540 Manufacture of miscellaneous products of petroleum and coal (except briquettes) **
Automobiles and parts
3843 Manufacture of motor vehicles 3844 Manufacture of motorcycles and bicycles
Transportation equipment
3841 Ship building and repairing 3842 Manufacture of railroad equipment
3845 Manufacture of aircraft 3849 Manufacture of transport equipment n.e.c.
3821 Manufacture of engines and turbines
Electrical machinery 3831 Manufacture of electrical industrial machinery and apparatus 3832 Manufacture of radio, television and communication equipment and apparatus 3833 Manufacture of electrical appliances and housewares 3839 Manufacture of electrical apparatus and supplies n.e.c.

Table A.2 Concordance of Model Sectors to ISIC Sectors*
* This concordance is based on the SALTER/GTAP to ISIC concordance provided by the Australian Industry Commission. (p) denotes partial allocation of 4-digit ISIC categories to a particular sector.
Non-electrical machinery and equipment
3822 Manufacture of agricultural machinery and equipment 3823 Manufacture of metal and wood working machinery 3824 Manufacture of special industrial machinery and equipment except metal and wood
working machinery 3825 Manufacture of office, computing and accounting machinery 3829 Machinery and equipment except electrical n.e.c. 3851 Manufacture of professional and scientific,
and measuring and controlling equipment, n.e.c. 3852 Manufacture of photographic and optical goods 3853 Manufacture of watches and clocks
Construction
5000 Construction
Other manufactures n.e.c. 3211 Spinning, weaving & finishing textiles
3212 Manufacture of made-up textile goods excluding wearing apparel 3213 Knitting mills 3214 Manufacture of carpets & rugs 3215 Cordage, rope & twine industries 3219 Manufacture of textiles n.e.c.
3220 Manufacture of wearing apparel, except footwear 3311 Sawmills, planing & other wood mills
3312 Manufacture of wooden & cane containers & small caneware 3319 Manufacture of wood & cork products n.e.c. 3320 Manufacture of furniture & fixtures, except primarily of metal
3411 Manufacture of pulp, paper & paperboard 3412 Manufacture of containers & boxes of paper and paperboard 3419 Manufacture of pulp, paper & paperboard articles n.e.c. 3420 Printing, publishing & allied industries
3231 Tanneries & leather finishing 3232 Fur dressing & dyeing industries 3233 Manufacture of products of leather & leather substitutes, except footwear and wearing apparel
3240 Manufacture of footwear, except vulcanised or moulded rubber or plastic footwear 3610 Manufacture of pottery, china and earthenware
3620 Manufacture of glass and glass products 3691 Manufacture of structural clay compounds 3692 Manufacture of cement, lime and plaster
3699 Manufacture of non-metallic mineral products n.e.c. 3901 Manufacture of jewellery and related articles 3902 Manufacture of musical instruments 3903 Manufacture of sporting and athletic goods
3909 Manufacturing industries n.e.c.
Services 4101 Electric light and power
4102 Gas manufacture and distribution

Table A.2 Concordance of Model Sectors to ISIC Sectors*
* This concordance is based on the SALTER/GTAP to ISIC concordance provided by the Australian Industry Commission. (p) denotes partial allocation of 4-digit ISIC categories to a particular sector.
4103 Steam and hot water supply 4200 Water works and supply
6100 Wholesale trade 6200 Retail trade
6310 Restaurants, cafes, and other eating and drinking places 6320 Hotels, rooming houses, camps and other lodging places 7111 Railway transport
7112 Urban, suburban and inter-urban highway passenger transport 7113 Other passenger land transport 7114 Freight transport by road
7115 Pipeline transport 7116 Supporting services to land transport
7121 Ocean and coastal transport 7122 Inland water transport 7123 Supporting services to water transport 7131 Air transport carriers
7132 Supporting services to air transport 7191 Services incidental to transport 7192 Storage and warehousing 7200 Communication
0 Activities not adequately defined 8101 Monetary institutions 8102 Other financial institutions 8103 Financial services 8200 Insurance 8310 Real estate 8321 Legal services 8322 Accounting, auditing and bookkeeping services 8323 Data processing and tabulating services 8324 Engineering, architectural and technical services 8325 Advertising services 8329 Business services, except machinery and equipment rental and leasing, n.e.c. 8330 Machinery and equipment rental and leasing 9411 Motion picture production 9412 Motion picture distribution and projection 9413 Radio and television broadcasting 9414 Theatrical producers and entertainment services 9415 Authors, music composers and other independent artists n.e.c. 9420 Libraries, museums, botanical and zoological gardens, and other cultural services, n.e.c. 9490 Amusement and recreational services n.e.c. 9511 Repair of footwear and other leather goods 9512 Electrical repair shops 9513 Repair of motor vehicles and motorcycles 9514 Watch, clock and jewellery repair 9519 Other repair shops n.e.c. 9520 Laundries, laundry services, and cleaning and dyeing plants 9530 Domestic services 9591 Barber and beauty shops 9592 Photographic studios, including commercial photography 9599 Personal services n.e.c. 9100 Public administration and defence

Table A.2 Concordance of Model Sectors to ISIC Sectors*
* This concordance is based on the SALTER/GTAP to ISIC concordance provided by the Australian Industry Commission. (p) denotes partial allocation of 4-digit ISIC categories to a particular sector.
9200 Sanitary and similar services 9310 Education services 9320 Research and scientific institutes 9331 Medical, dental and other health services 9332 Veterinary services 9340 Welfare institutions 9350 Business, professional and labour associations 9391 Religious organisations 9399 Social and related community services n.e.c. 9600 International and other extra-territorial bodies